Article

Subseasonal Variation in the Winter ENSO-NAO Relationship and the Modulation of Tropical North Atlantic SST Variability

CIC-FEMD/ILCEC, Key Laboratory of Meteorological Disaster of Ministry of Education (KLME), Nanjing University of Information Science and Technology, Nanjing 210044, China
*
Author to whom correspondence should be addressed.
Climate 2023, 11(2), 47; https://doi.org/10.3390/cli11020047
Submission received: 10 January 2023 / Revised: 9 February 2023 / Accepted: 11 February 2023 / Published: 14 February 2023

Abstract

:
The impact of El Niño–Southern Oscillation (ENSO) on the North Atlantic Oscillation (NAO) has been controversially discussed for several decades, which exhibits prominent seasonality and nonstationarity. During early winter, there appears a positive ENSO-NAO relationship, while this relationship reverses its sign in late winter. Here, we show that this subseasonal variation in the ENSO-NAO relationship could be attributed to the different mechanisms involved in early and late winters. In early winter, the positive linkage between the ENSO and NAO could be simply understood as resulting from the changes in tropical Walker circulation and the associated atmospheric meridional circulation over the North Atlantic. In the following late winter, an opposite NAO-like response appears as the large-scale Pacific–North Atlantic teleconnection pattern fully establishes and evident sea surface temperature anomalies occur over the North Tropical Atlantic (NTA). We further show that the phase shift in NAO during ENSO late winter is largely contributed by the establishment of the ENSO-associated NTA SST anomaly via its excited convection in the subtropical Atlantic. The competing roles of mechanisms explain the subseasonal variation in the ENSO-NAO relationship from early to late winter, providing useful information for seasonal prediction over the North Atlantic–European region.

1. Introduction

The North Atlantic Oscillation (NAO), a prominent atmospheric circulation pattern, characterizes a large-scale seesaw of atmosphere mass between the Azores High and the Icelandic Low, which exerts significant climate impacts over the North Atlantic and European sectors [1,2,3,4]. Due to large internal mid-latitude atmospheric variability, the skillful prediction of the NAO on seasonal to interannual timescales has been a challenging issue for the climate community [5,6,7,8]. As the primary predictability source of the global climate system, the El Niño–Southern Oscillation (ENSO) is suggested to have the capacity in providing the potential seasonal predictability of NAO and, therefore, the associated climate variability in North America and Europe [6,7]. The co-variability of the tropical Pacific signals and the climate anomalies in the extratropical North Atlantic region was first noticed by Sir Gilbert Walker in the 1920s and 1930s [9,10,11]. The Southern Oscillation in boreal winter is found to be accompanied by the meridional alteration in atmospheric mass over the North Atlantic.
Around half a century later, systematic research started on the relationship between ENSO and NAO and the possible mechanisms involved [12,13,14]. While the ENSO impacts on the climate variabilities over the North Pacific–American sector are well established [15,16,17,18], its influence over the North Atlantic and European sector is still under debate [19,20,21,22,23]. During boreal winter, the ENSO signal can be clearly detected over the North Pacific and North American region via the stationary atmospheric Rossby waves, which is referred to as Pacific–North America (PNA) teleconnection [15,24]. The PNA teleconnection extends downstream and reaches the North Atlantic and leads to changes in the local quasi-stationary wave pattern, which could project on the NAO pattern [13,25,26]. Nevertheless, the atmospheric anomalies associated with the ENSO-induced PNA teleconnection over the North Atlantic are usually shifted eastward in comparison with the classical NAO pattern [21]. Additionally, one recent study argued that no dynamical linkage can be found between the NAO and ENSO-related atmospheric anomalies over the North Atlantic [27]. An alternative mechanism that could account for the ENSO-NAO relationship is that ENSO-related SST anomalies in the Northern Tropical Atlantic (NTA) alter the North Atlantic atmospheric circulation and act as a mediator to connect the ENSO and NAO during winter [28,29,30,31,32,33,34]. Prominent SST warming (cooling) is usually observed to lag the Pacific warming (cooling) by a few months [18,35,36,37,38], which is conducive to a negative (positive) NAO-like pattern locally [28,29,32,33,34]. Moreover, stratospheric processes, such as sudden stratospheric warming, have also been proposed to play a part in linking climate variabilities in the tropical Pacific and North Atlantic basins [39,40,41,42,43].
Despite the fact that several mechanisms have been proposed, little consensus has yet been reached on whether a robust ENSO signal can be detected in the North Atlantic–European climate and which physical process is essential for the observed ENSO-NAO linkage. Some studies show that no prominent ENSO signals could be detected over the North Atlantic and adjacent continental European regions [44,45]; however, some other studies suggest that clear climate response to ENSO could be identified in the temperature and precipitation fields [21,40,46,47]. The following studies show that these seemingly contradictory conclusions result from the fact that the ENSO impacts over the North Atlantic regions are associated with highly nonlinear dynamics, which lead to the large uncertainty in the observed relationship between ENSO and NAO [20,21,48]. The ambiguity has also been suggested to be associated with the strong seasonal dependence of the ENSO-NAO relationship [21,43,49]. During early winter, the El Niño events are usually accompanied by a positive NAO response, and La Niña events are usually accompanied by a negative NAO response. In contrast, approximately opposite atmospheric responses could be detected over the North Atlantic sector in the following late winter. The negative relationship between the ENSO and NAO in late winter has been more extensively studied in previous studies, which has been suggested to be related to the delayed stratospheric response to ENSO [40,41,43]. Other studies emphasized the role of the North Atlantic SST variability in the negative ENSO-NAO relationship during late winter [32,34]. So far, the mechanisms underlying the subseasonal variation in the NAO response to ENSO are not clear, which brings considerable difficulties to the seasonal prediction of the NAO and associated climate impacts.
In this study, we demonstrate that the subseasonal variation in the relationship between the ENSO and NAO is closely linked with the constructive or destructive roles of different mechanisms and emphasize the physical process that is dominated in early and late winters, respectively. During El Niño in early winter, the positive NAO response could be understood as the result of changes in the tropical general circulations. In the following late winter, the appearance of warm NTA SST anomalies and the full establishment of PNA teleconnection are both in favor of a negative NAO pattern. Additionally, the anomalous NTA SST is the key factor in the subseasonal phase shift in NAO response to ENSO. Similar mechanisms are also at work during La Niña. The rest of the paper is organized as follows: In Section 2, we show the datasets and methods used in this research. Section 3 presents the observed subseasonal variation in the ENSO-NAO relationship and addresses the possible mechanisms responsible for different NAO responses in early and late winters. Discussions are presented in Section 4, and the conclusion is given in Section 5.

2. Materials and Methods

The monthly SST dataset used in this study is the global sea ice and SST analysis from the Met Office Hadley Centre (HadISST) [50]. The atmospheric circulation, including sea level pressure (SLP) and geopotential height at 500 hPa, were examined based on the National Center for Environmental Prediction (NCEP)/National Center for Atmospheric Research (NCAR) reanalysis-1 data [51]. The ENSO-related precipitation was investigated using the National Oceanic and Atmospheric Administration’s monthly precipitation reconstruction data [52]. The NAO index is based on the normalized SLP of Iceland and Portugal [53]. The PNA index was taken from the Climate Prediction Center (CPC) website. Anomalies for all the variables were measured as the deviation from the monthly climatology in the study period (1960–2020), and all these fields were linearly detrended to exclude potential impacts from global warming. All statistical significance tests were performed using the two-tailed Student’s t-test. The bootstrap resampling method was used for statistical inference by randomly selecting data with replacements 1000 times from the original data and calculating the average at each time [54]. The statistical significance for the bootstrap ensemble mean of the average in each realization was inferred from the bootstrap probability [55]. For example, the bootstrap ensemble mean is significant at the 95% confidence level when 95% of the bootstrap samples are larger/smaller than zero.
According to the definition of the CPC (see https://origin.cpc.ncep.noaa.gov/products/analysis_monitoring/ensostuff/ONI_v5.php, accessed on 8 January 2023), ENSO events are defined based on a threshold of ±0.5 °C of the 3-month running mean Niño3.4 index (SST anomaly averaged in the region of 5° S–5° N, 120°–170° W) for 5 consecutive months. A total of 21 El Niño events (1963, 1965, 1968, 1969, 1972, 1976, 1977, 1979, 1982, 1986, 1987, 1991, 1994, 1997, 2002, 2004, 2006, 2009, 2014, 2015, and 2018) and 21 La Niña events (1964, 1970, 1971, 1973, 1974, 1975, 1983, 1984, 1985, 1988, 1995, 1998, 1999, 2000, 2005, 2007, 2008, 2010, 2011, 2016, and 2017) were identified. The NTA SST index was defined as the SST anomaly averaged in the region of 0°–20° N, 0°–75° W. We defined the standardized SLP difference between the regions of the equatorial eastern Pacific (5° S–5° N, 80° W–180°) and the equatorial Atlantic (5° S–5° N, 80° W–20° E) as the Walker index in this study to focus on the overturning circulation over the Pacific and Atlantic region. The winter was separated into early (November–December) and late (January–February) periods to investigate the subseasonal variation in the ENSO-NAO relationship.

3. Results

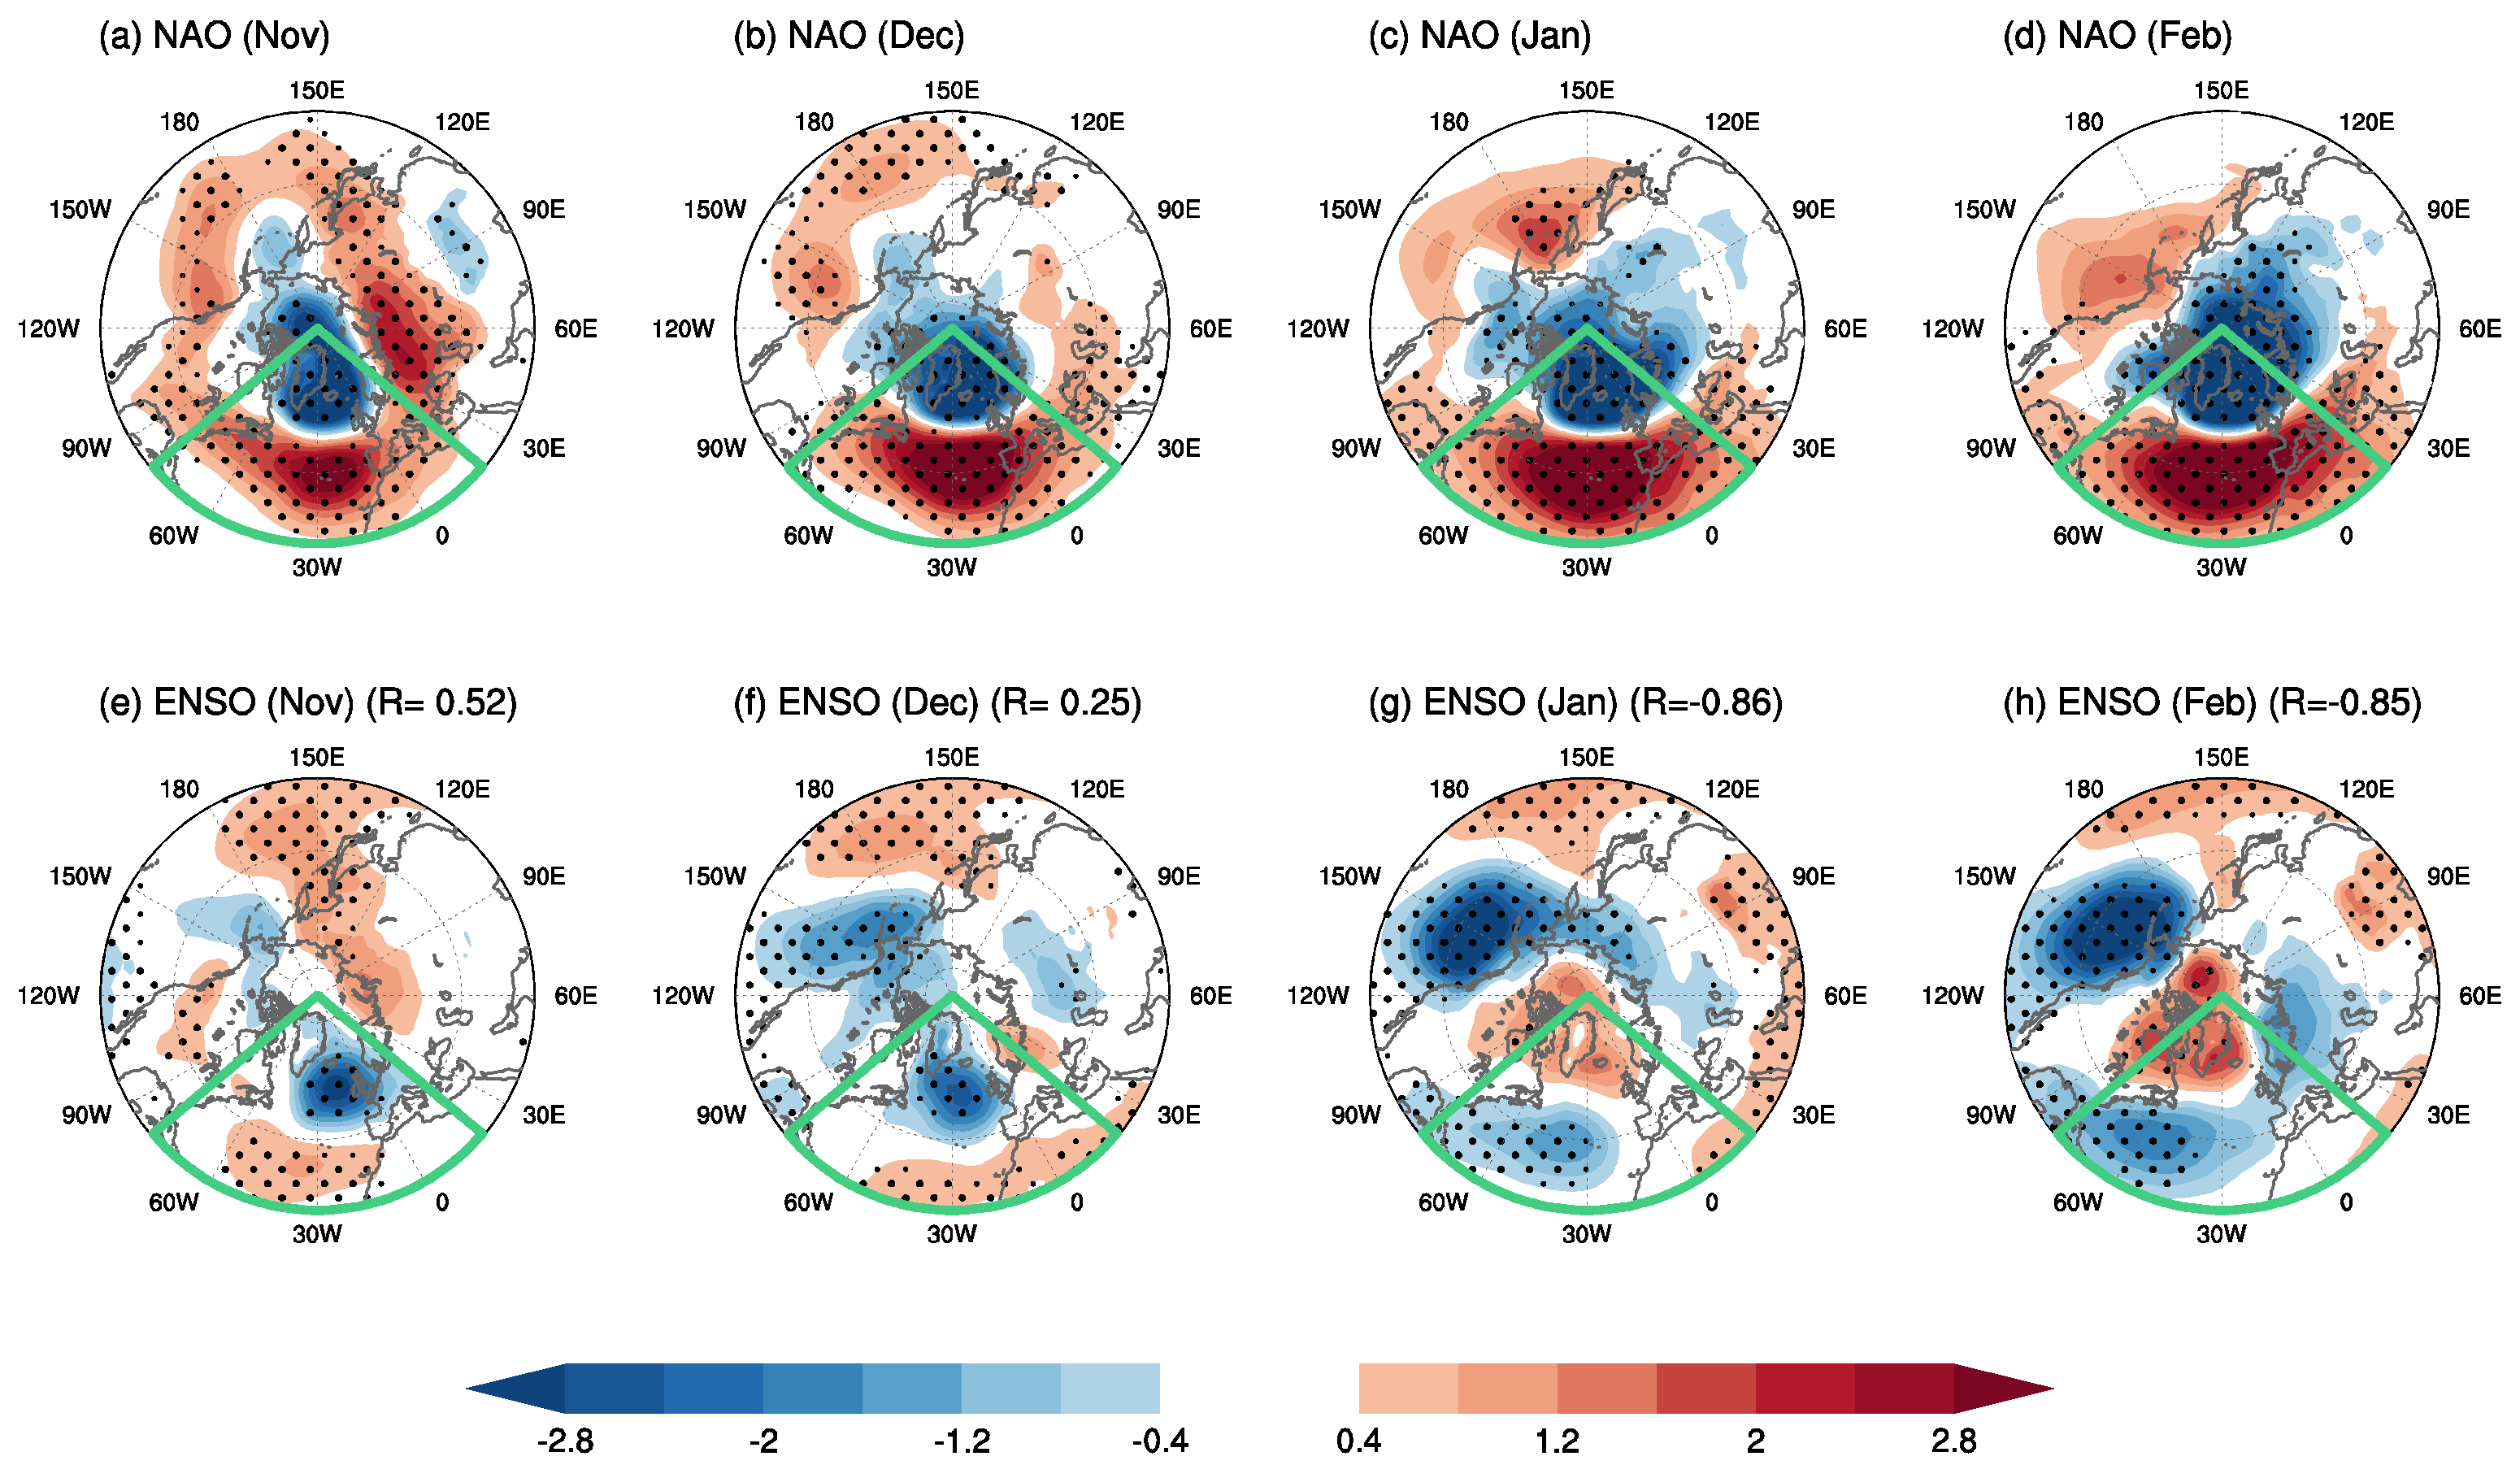
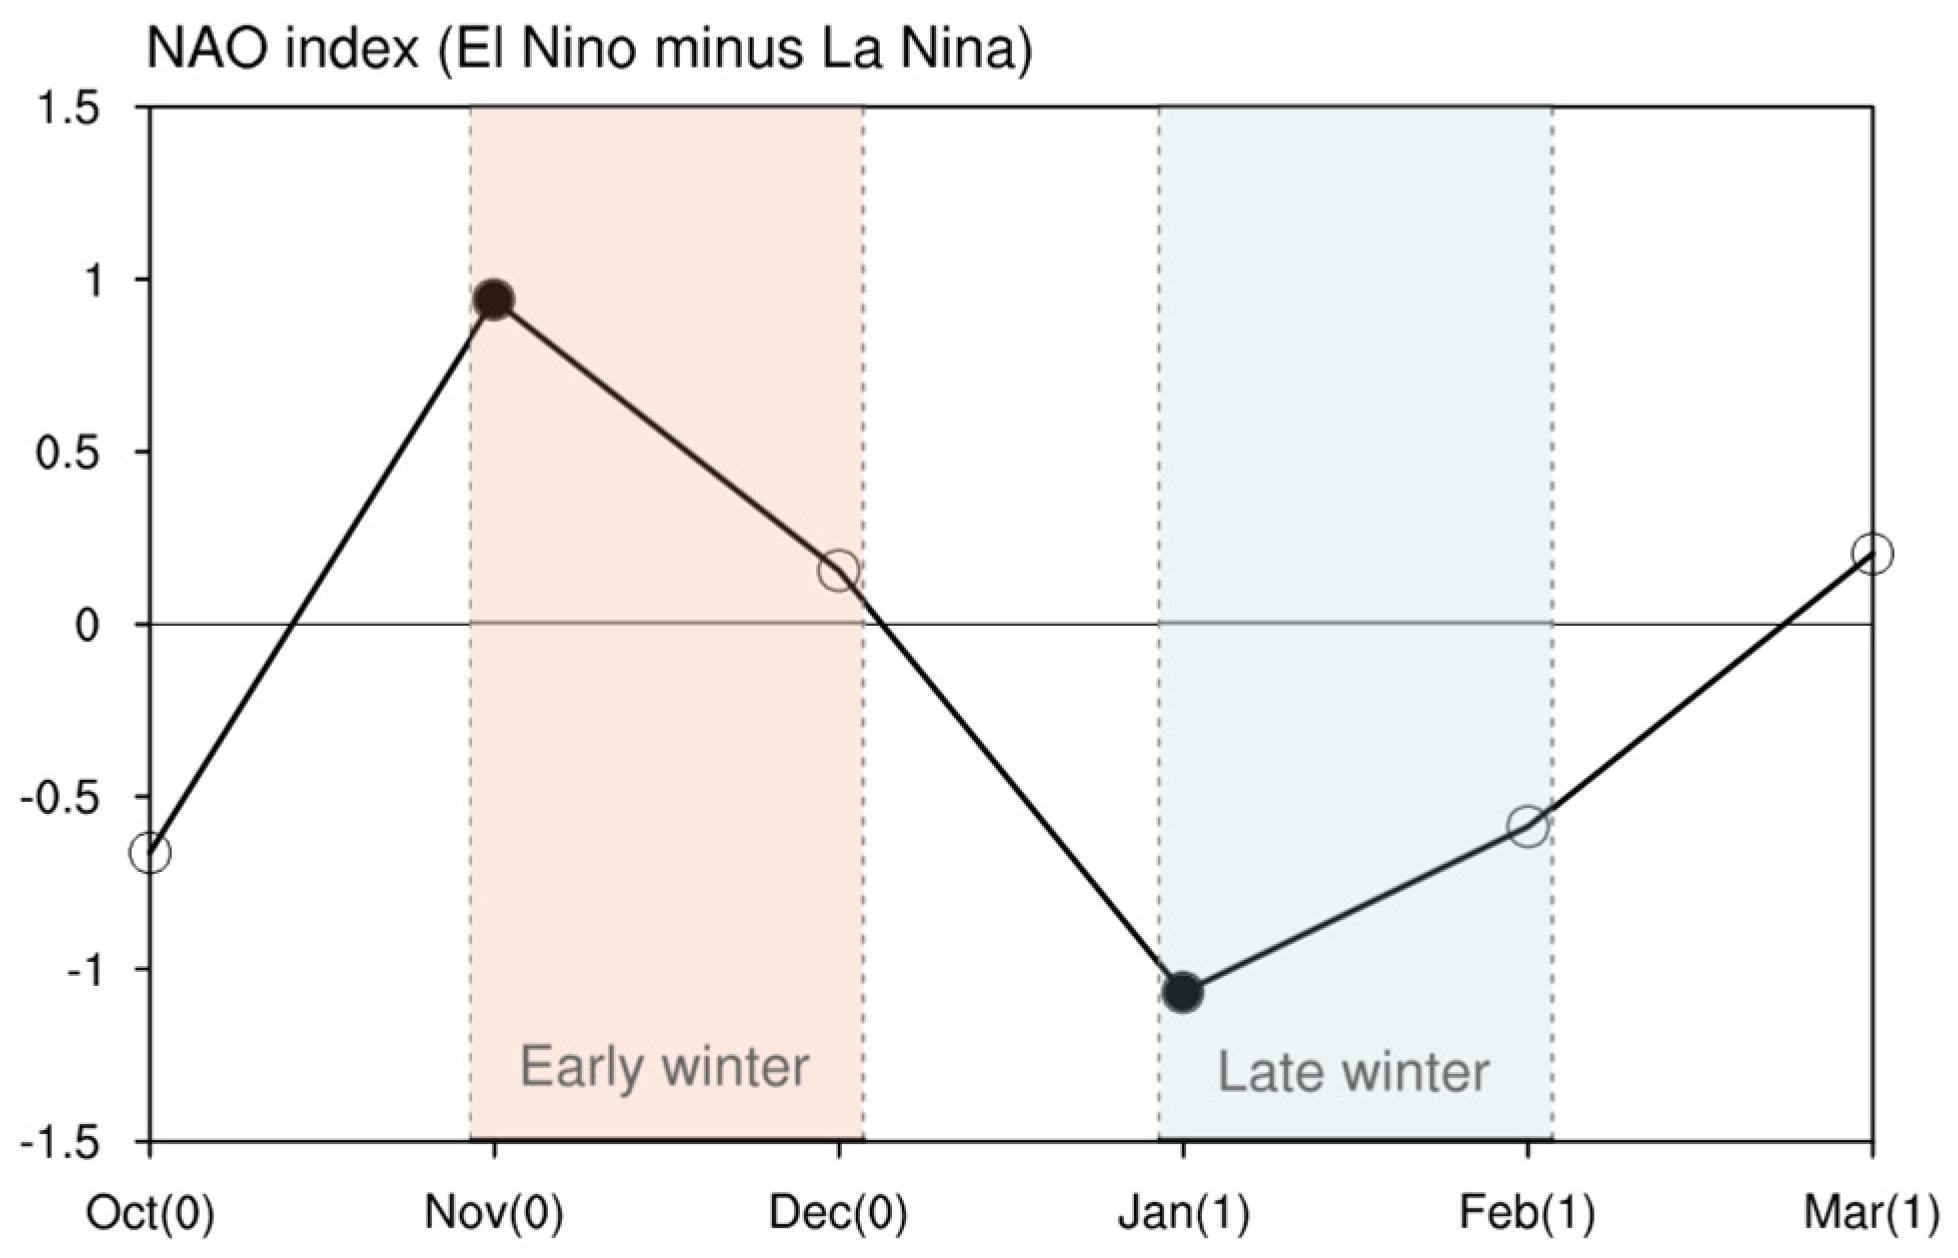
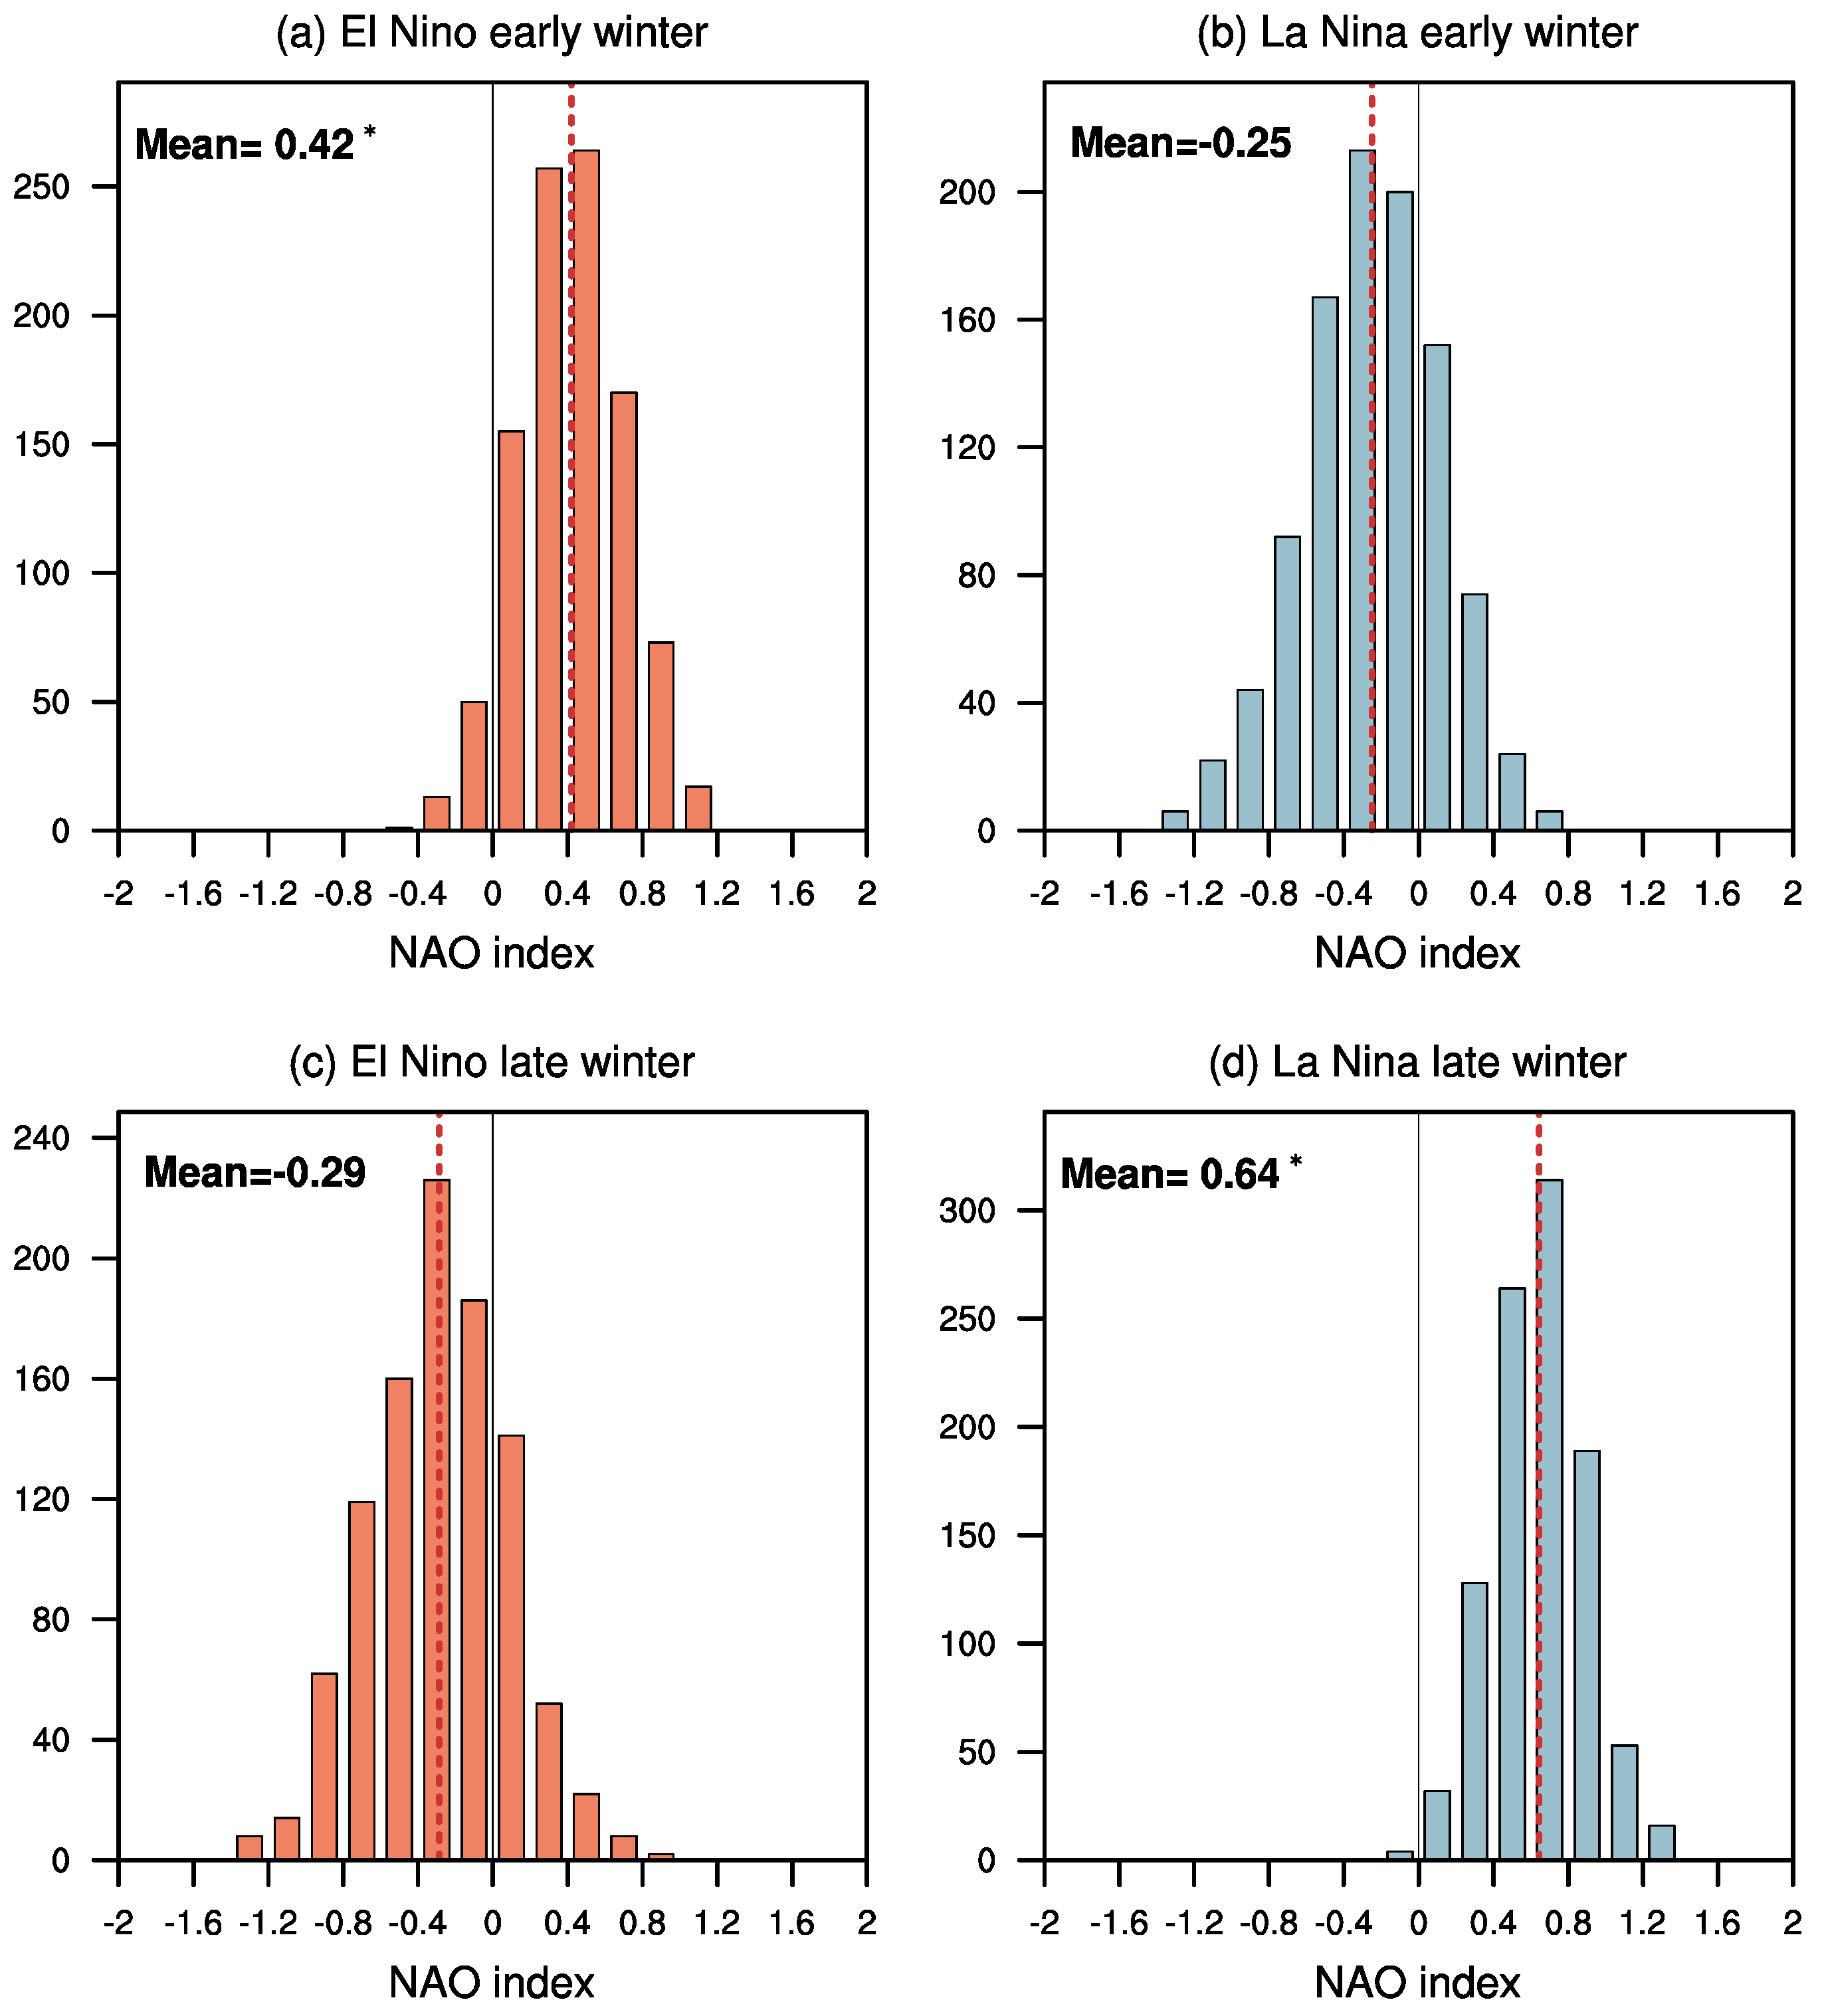
3.1. Subseasonal Variation in the ENSO-NAO Relationship

During the positive phase of NAO, the meridional gradient of atmospheric pressure is strengthened due to the enhanced Icelandic Low and Azores High between the polar and subtropical North Atlantic regions (Figure 1a–d). Most previous studies about the ENSO-NAO relationship focused on the boreal winter season when the ENSO reaches the mature phase and the local air–sea interaction over the North Atlantic is mostly active. However, ENSO impacts on the NAO exhibit a distinctive difference in early and late winters with a prominent subseasonal phase shift in NAO (Figure 1e–h). During November–December of El Niño years, there appear positive SLP anomalies over the subtropical Atlantic and negative SLP anomalies near Iceland, resembling a positive NAO-related atmospheric pattern (Figure 1e,f). In the following January to February, the anomalous atmospheric pattern exhibits a contrasting feature over the North Atlantic when the ENSO-related Aleutian Low is enhanced (Figure 1g,h). An NAO-like atmospheric pattern of the opposite polarity emerges with the spatial correlation between ENSO-related atmospheric pattern and the classical NAO pattern being −0.86 and −0.85 in January and February, respectively. Besides more similarity between the ENSO-related pattern and the classical NAO pattern compared to the early winter, it has also been noted that the active center of the ENSO-related atmospheric response over the North Atlantic in late winter shows an obvious displacement from the east to the west.
To qualitatively measure the subseasonal shift in the ENSO-NAO relationship, we used the commonly adopted NAO index to examine the monthly evolution based on the difference between composite El Niño and La Niña during winter (Figure 2). In El Niño during early winter, the NAO is usually in its positive phase with the strengthened meridional gradient of atmospheric pressure over the North Atlantic. Additionally, in La Niña during early winter, there usually appears a negative NAO-like pattern with a weakened meridional pressure gradient over the North Atlantic. The NAO of the opposite sign could be observed in later winter. The differences between the NAO index of El Niño and La Niña are significant at the 95% significance level in November and January, while large uncertainty exists for other months.
We further used the bootstrap sampling with replacements to generate 1000 realizations of the observed NAO responses during the early and late winters of El Niño and La Niña events, respectively, and show the histograms of the bootstrap samples (Figure 3). The difference in the bootstrapping NAO index in ENSO early and late winter is consistent with the subseasonal phase shift in NAO responses to ENSO, as depicted in Figure 1 and Figure 2. During the El Niño early winter, the bootstrap ensemble mean NAO index is 0.42 (statistically significant at the 95% confidence level), while the ensemble mean NAO index is −0.25 (non-statistically significant at the 95% confidence level) during the following later winter. For La Niña events, the ensemble mean NAO index is −0.29 (non-statistically significant at the 95% confidence level) in early winter and 0.64 (statistically significant at the 95% confidence level) in the late winter. The insignificant values in El Niño late winter and La Niña early winter hint at some asymmetry in the impacts of ENSO on the NAO during both early and late winter.

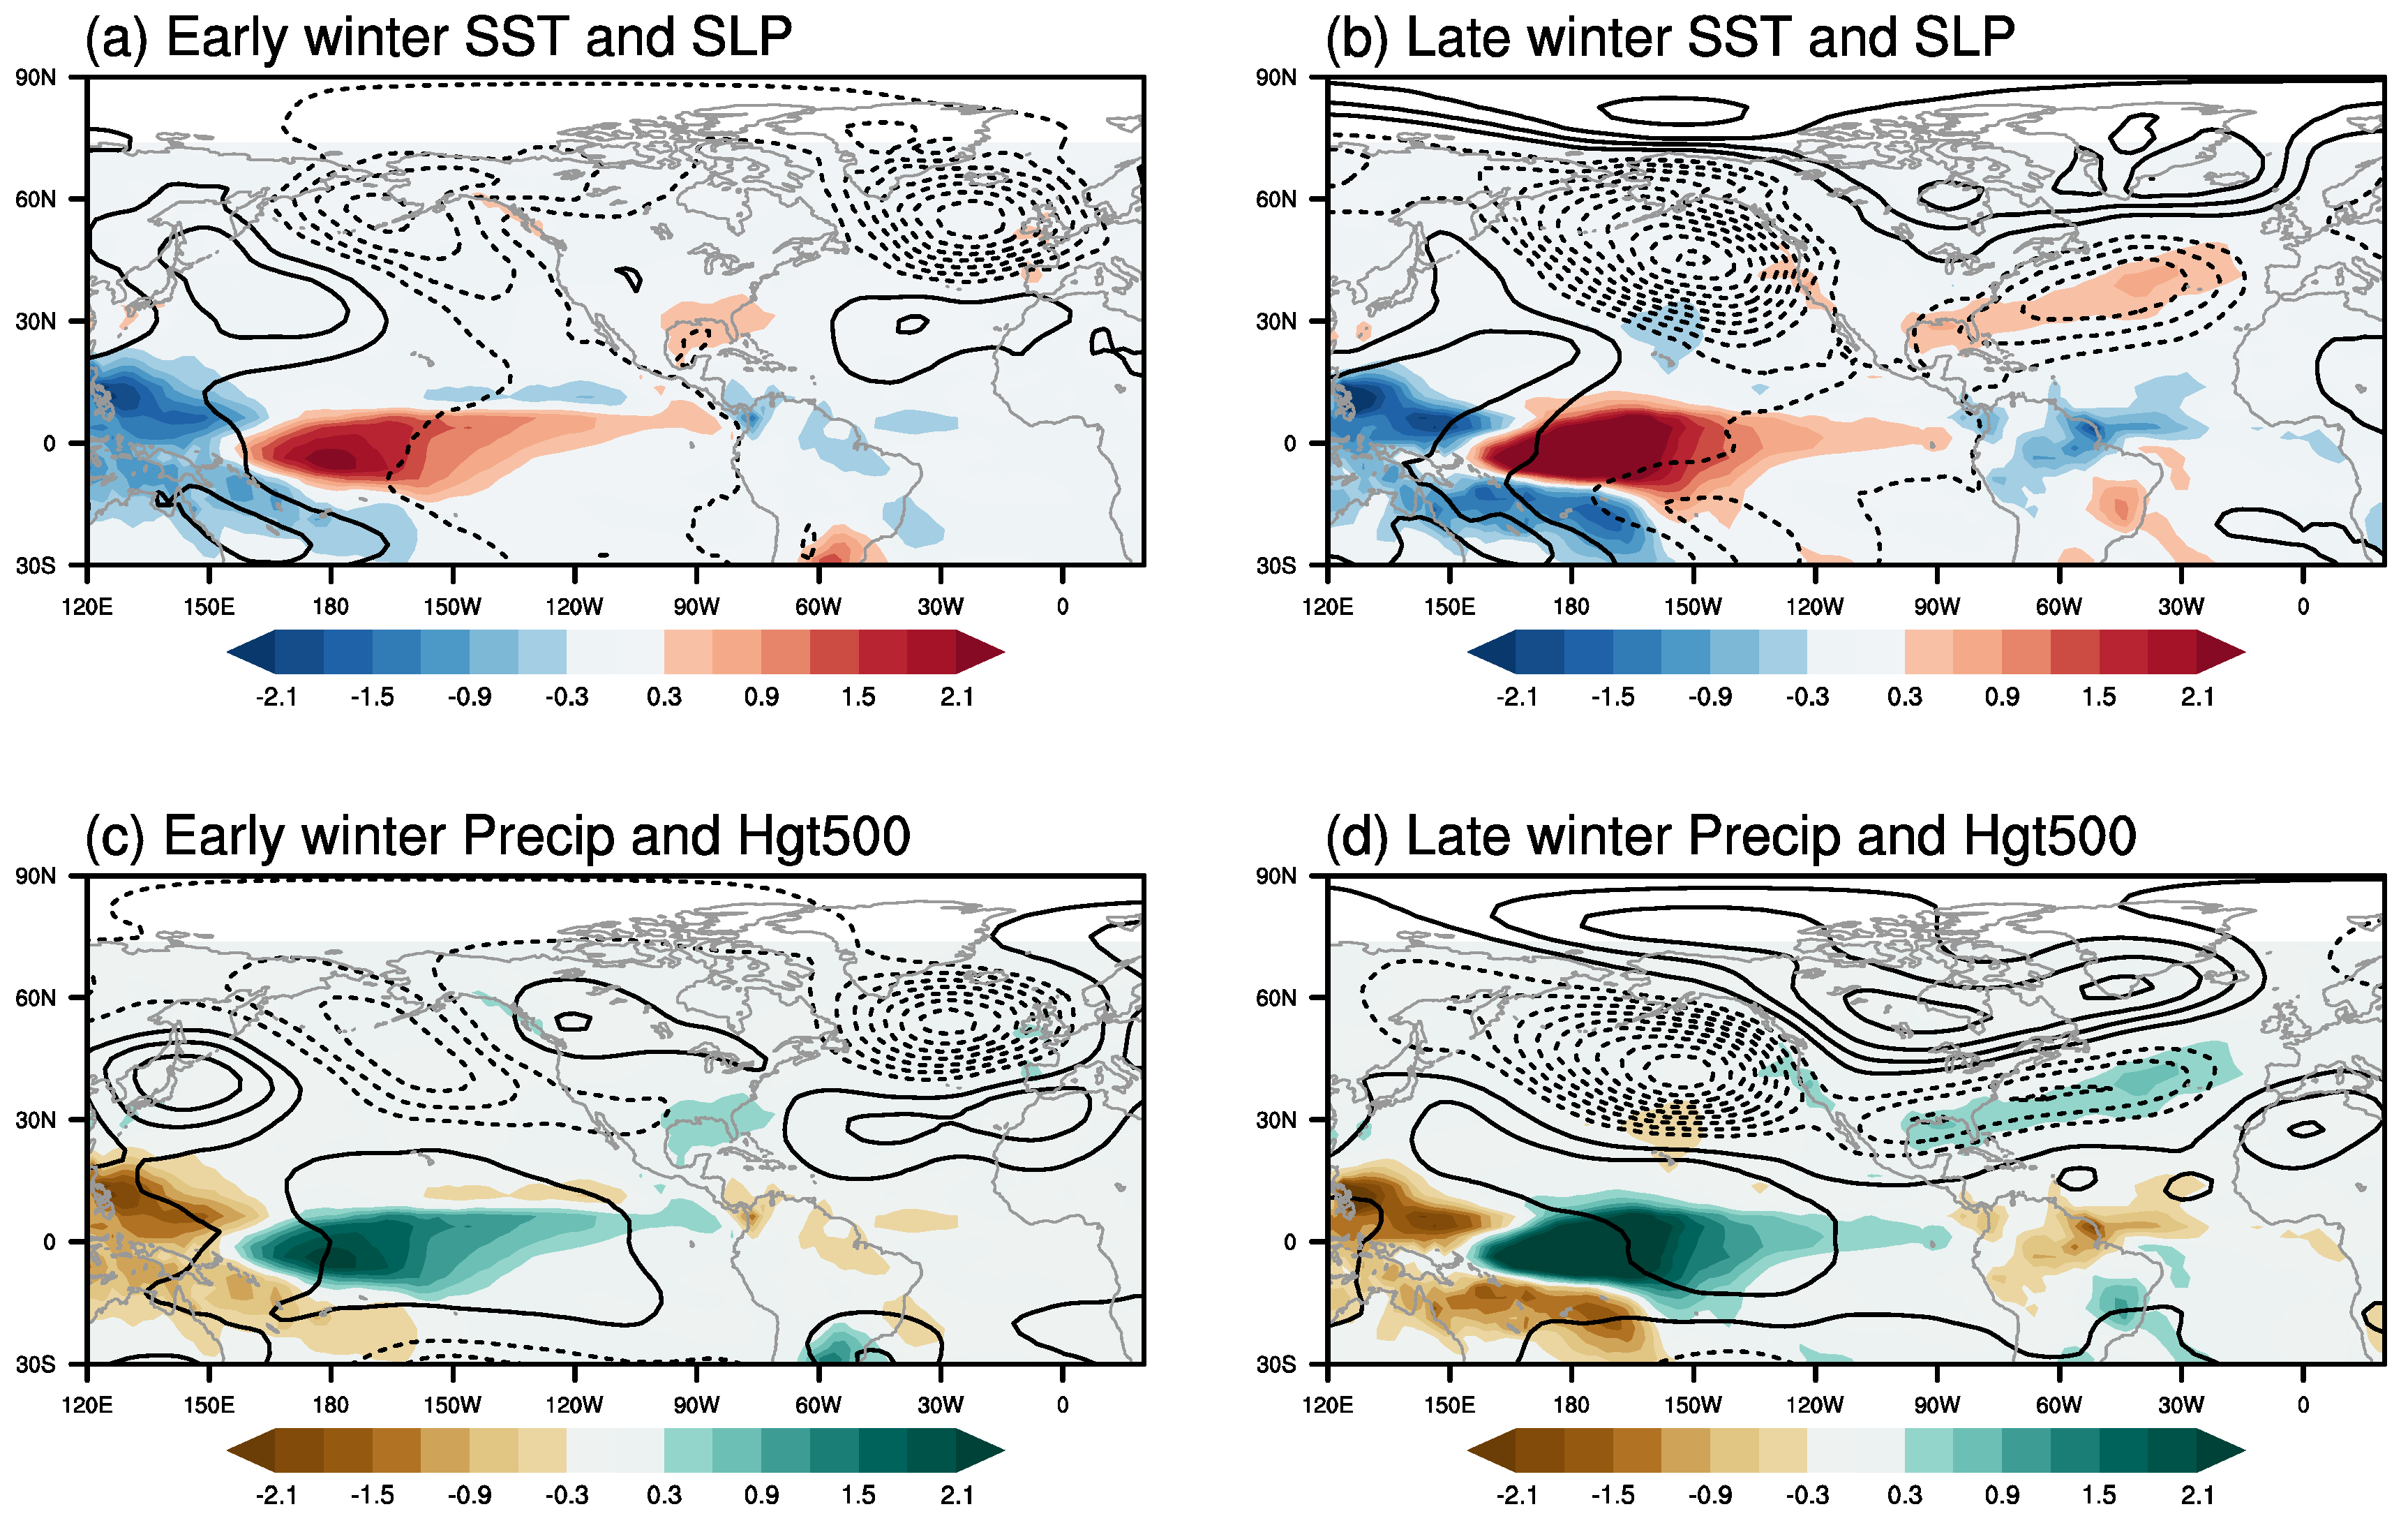
3.2. Possible Mechanisms Responsible for Different NAO Responses in Early and Late Winters

We next investigate the possible physical mechanisms responsible for the NAO phase shift during early and late winters of ENSO years. Figure 4 shows anomalous SST, precipitation, SLP, and geopotential height at 500 hPa regressed on the simultaneous Niño3.4 index in early and late winters. During El Niño in early winter, the tropical Pacific SST anomalies feature a horse-shoe pattern with warm SST anomalies in the central to eastern equatorial Pacific and cold SST anomalies in the western Pacific (Figure 4a). Correspondingly, the precipitation anomalies exhibit a dipolar structure, featuring a positive lobe in the central equatorial Pacific and a negative lobe in the western North Pacific (Figure 4c). While the SST anomaly pattern during late winter is quite similar to that during early winter in the tropical Pacific, the precipitation anomalies are obviously enhanced in the central Pacific (Figure 4b,d), which could result from the nonlinear interaction between the ENSO and warm pool SST annual cycle [56,57,58,59].
Accompanied by the enhancement in the tropical Pacific precipitation anomalies, the atmospheric anomalies of the Aleutian Low are evidently enhanced in late winter (Figure 4b,d). Correspondingly, the two downstream centers of the PNA teleconnection pattern are clearly established over North America. These two downstream centers extend from North America to the central North Atlantic ocean with a southwest-to-northeast tilt, resembling the negative NAO pattern. In contrast, the atmospheric response in the Aleutian Low is weak, and the PNA teleconnection pattern is not fully established in the early winter of ENSO years (Figure 4a,c). In early winter, a prominent atmospheric response can be observed over the North Atlantic with a negative center near 50° N and a positive center near 30° N, zonally elongating from the central North Atlantic Ocean to Western Europe. Compared with early winter, the action center of ENSO-related atmospheric response over the North Atlantic is displaced northwestward in late winter.
One open question to be answered is which mechanism drives the positive ENSO-NAO relationship in early winter. As suggested by a previous study [60], the tropical Walker circulation and the North Atlantic meridional circulation can act as a mediator to link the ENSO and climate variability over the North Atlantic region. Figure 5 shows changes in the tropical Walker circulation and North Atlantic meridional circulation associated with ENSO in early and late winters, respectively. During El Niño early winter, the tropical Walker circulation is weakened with an anomalous ascending branch over the central and eastern Pacific and an anomalous descending branch over the Atlantic (Figure 5a). Concomitantly, the meridional circulation over the North Atlantic can be observed to be significantly altered, showing anomalous air subsidence over the tropical Atlantic and anomalous air ascending at 40°–70° N of the North Atlantic (Figure 5c). As a result, the positive NAO pattern emerges along with the enhancement in both the Azores High and Icelandic Low.
During the following late winter, the anomalous tropical Walker circulation exhibits a similar pattern as that of early winter with an increase in amplitude, in particular over the tropical Atlantic (Figure 5b). However, there appears a very different structure of anomalous meridional circulation over the North Atlantic (Figure 5d). A prominent ascending during late winter can be observed near the region of 20°–40° N, which is of the opposite sign with respect to that during early winter. Accordingly, most regions of the subpolar North Atlantic experience the anomalous subsidence. The atmospheric response over the North Atlantic resembles the negative NAO-like pattern during El Niño in late winter. The distinctive meridional circulation anomalies in late winter could be related to the enhanced precipitation near 30° N in the North Atlantic. These precipitation anomalies seem to be excited by the NTA SST warming (Figure 4b). The important role of the NTA SST in impacting the atmospheric circulation over the North Atlantic has been shown in previous studies, as shown in the introduction. The warm NTA SST anomalies could generate negative NAO-like anomalies based on observational analyses and also numerical modeling experiments. El Niño events are usually accompanied by significant SST warming over the NTA via the tropical and extratropical pathways [61]. The NTA SST response is found to lag the ENSO mature phase by about a few months, possibly due to the local adjustment timescale [18,62]. As shown in Figure 4a,b, the warm NTA SST anomalies during El Niño events are evidently strengthened in late winter compared to early winter, which leads to enhanced precipitation over the subtropical Atlantic and acts to explain the distinct meridional circulation structure in late winter. A similar mechanism operates during La Niña late winter.
The respective role of the above-mentioned processes in contributing to the ENSO-NAO linkage is further shown in Figure 6, in which the monthly SLP anomalies are regressed upon the simultaneous Walker index, PNA index, and NTA index. As shown in Figure 6a, the Walker circulation change in the tropics is linked to the alteration in local meridional circulation over the North Atlantic. Accompanied by the strengthening (weakening) of the tropical Walker circulation, there appears a weakened (strengthened) meridional gradient of atmospheric pressure over the North Atlantic, resembling the negative (positive) NAO pattern. During El Niño years, the Walker circulation is weakened throughout the winter season (Figure 7), which tends to favor a positive NAO-like pattern of atmospheric pressure over the North Atlantic. Due to the role of the Walker circulation change, a positive ENSO-NAO relationship can be observed in early winter. However, the opposite relationship between ENSO and NAO emerges in the following late winter, as the PNA fully establishes, and the NTA SST warms up. It seems that the Walker circulation anomalies play a minor role in modulating the atmospheric circulation over the North Atlantic during the late winter of ENSO years. As shown in Figure 6b, the PNA-related atmospheric pattern displays positive anomalies near Greenland and negative anomalies along the eastern coast of North America. The enhancement in PNA during late winter could contribute to the westward displacement of the NAO-related action center. This existence of the linkage between the PNA and NAO has been discussed in many studies; however, the local manifestation of PNA teleconnection can only explain the western edge of the NAO, which might suggest an absence of dynamical linkage between these two phenomena [27].
Figure 6c shows the SLP anomalies regressed on the NTA SST index. The warm NTA SST anomalies tend to be accompanied by weakened Azores High and Icelandic Low, which closely resemble the classical NAO pattern (their spatial correlation being −0.96). During El Niño in late winter, the NTA SST significantly warms (Figure 7) and alters the local atmospheric pattern, which leads to the prominent negative ENSO-NAO relationship. We further examined the role of NTA SST on the NAO phase during ENSO late winter by categorizing the ENSO events into four groups based on late winter NTA SST conditions that are El Niño with a positive NTA index, El Niño with a negative NTA index, La Niña with a positive NTA index, and La Niña with a negative NTA index (Table 1). The El Niño events with warm NTA SST anomalies show a significant negative NAO pattern (Figure 8a), while the El Niño events with cold NTA SST anomalies exhibit no significant NAO-related atmospheric anomaly pattern (Figure 8b). Similarly, the La Niña events with opposite-signed NTA SST anomalies are characterized by a distinct atmospheric response over the North Atlantic. The La Niña events with negative NTA SST anomalies correspond to a positive NAO pattern. However, the La Niña events with warm NTA SST anomalies are accompanied by a weakened meridional gradient of atmospheric pressure, with the centers being shifted eastward relative to the conventional NAO pattern. Therefore, the negative ENSO-NAO relationship can be detected considering that most ENSO years are concurrent with the same-signed NTA SST anomalies. The above results again support that the winter NTA SST variability during ENSO years plays an important role in leading to a remarkable shift in the North Atlantic atmospheric pattern towards an opposite NAO response in late winter compared to that in early winter.

4. Discussion

Despite the fact that a feasible explanation for the subseasonal variation in the relationship between the ENSO and NAO during winter is provided here, we are still left with considerable levels of uncertainty regarding the impacts of ENSO on NAO in addition to the fact that there is large atmospheric internal variability in the mid–high latitudes [63]. On the one hand, this uncertainty is granted considering that ENSO itself is highly complicated with large inter-event variability in the zonal location and intensity of its associated tropical convection [22,64,65]. On the other hand, the constructive/destructive interference of competing mechanisms operating during different stages of ENSO events could also contribute to the large uncertainty.
At this stage, we cannot determine whether the observed NAO responses to ENSO are simply the superposition of atmospheric patterns associated with different mechanisms or nonlinear interactions between different physical processes are at play. However, even from a linear perspective, the uncertainty of the ENSO-NAO relationship could be partly explained by the time-evolving characteristics of the processes involved. For example, while no significant NTA SST response to ENSO can be detected in early winter, significant positive SST responses appear over the NTA in late winter but with relatively large inter-event variability. We demonstrate that the inter-event difference in NTA SST anomalies during different ENSO events could account for, at least, part of the uncertainty of the ENSO-NAO relationship. Additionally, as noted in a recent study, the ENSO-related precipitation in the Indian Ocean could contribute to the inter-event difference in NAO response during ENSO early winter [66]. Moreover, several studies have argued that stratospheric processes could connect the climate variability between the Pacific and Atlantic basins [43,67]. While the active role of the stratospheric pathway is also emphasized in the ENSO-NAO relationship in late winter, the nonlinearity in the stratospheric response to ENSO largely limits the predictability of the related processes [23,43]. The potential effect of stratospheric processes on the subseasonal variation in the ENSO-NAO relationship is not addressed in this study, which deserves further attention.

5. Conclusions

The present work investigated the different ENSO impacts on the NAO during early and late winter and the possible roles of various mechanisms. Our observational analyses support the finding of the subseasonal variation in the ENSO-NAO linkage and identify the crucial physical processes responsible for the phase shift in NAO during ENSO early and late winters. During El Niño early winter, the North Atlantic experiences a positive NAO-like pattern of atmospheric pressure due to the weakening of the tropical Walker circulation and the associated alteration in the meridional circulation over the North Atlantic. However, the North Atlantic is dominated by a negative NAO-like atmospheric response over the North Atlantic during El Niño late winter. The phase shift in the NAO response to ENSO is closely related to the ENSO-induced NTA SST anomalies in late winter. During El Niño late winter, there appears obvious SST warming over the NTA, which can excite the local convection and thus, generate a negative NAO response. Moreover, the full establishment of the PNA teleconnection in late winter could also make some contribution to the simultaneous negative ENSO-NAO relationship. The strongly enhanced positive PNA teleconnection could partially account for the negative NAO response during El Niño late winter, but its effect is confined to the western edge of the NAO. Similar mechanisms work during La Niña. The understanding of different mechanisms for the subseasonal variation in the ENSO-NAO relationship from early to late winter provides useful information for seasonal prediction over the North Atlantic–European region.

Author Contributions

Conceptualization, W.Z. and F.J.; methodology, W.Z. and F.J.; software, F.J.; validation, F.J.; formal analysis, F.J.; investigation, F.J.; resources, F.J.; data curation, F.J.; writing—original draft preparation, W.Z. and F.J.; writing—review and editing, W.Z.; visualization, F.J.; supervision, W.Z.; project administration, W.Z.; funding acquisition, W.Z. All authors have read and agreed to the published version of the manuscript.

Funding

This research was funded by the National Nature Science Foundation of China (42125501).

Data Availability Statement

Publicly available datasets were analyzed in this study. The datasets are located at https://www.metoffice.gov.uk/hadobs/hadisst/data/download.html (accessed on 10 January 2023), https://psl.noaa.gov/data/gridded/data.ncep.reanalysis.html (accessed on 10 January 2023), https://www.esrl.noaa.gov/psd/data/gridded/data.ncep.reanalysis.html (accessed on 10 January 2023), https://psl.noaa.gov/data/gridded/data.prec.html (accessed on 10 January 2023), https://climatedataguide.ucar.edu/climate-data/hurrell-north-atlantic-oscillation-nao-index-station-based (accessed on 10 January 2023) and https://www.cpc.ncep.noaa.gov/products/precip/CWlink/pna/ (accessed on 10 January 2023).

Conflicts of Interest

The authors declare no conflict of interest. The funders had no role in the design of the study; in the collection, analyses, or interpretation of data; in the writing of the manuscript; or in the decision to publish the results.

References

  1. Hurrell, J.W.; Kushnir, Y.; Ottersen, G.; Visbeck, M. An Overview of the North Atlantic Oscillation. In Geophysical Mono-Graph Series; Hurrell, J.W., Kushnir, Y., Ottersen, G., Visbeck, M., Eds.; American Geophysical Union: Washington, DC, USA, 2003; Volume 134, pp. 1–35. ISBN 978-0-87590-994-3. [Google Scholar]
  2. Visbeck, M.; Chassignet, E.P.; Curry, R.G.; Delworth, T.L.; Dickson, R.R.; Krahmann, G. The Ocean’s Response to North Atlantic Oscillation Variability. In Geophysical Monograph Series; Hurrell, J.W., Kushnir, Y., Ottersen, G., Visbeck, M., Eds.; American Geophysical Union: Washington, DC, USA, 2003; Volume 134, pp. 113–145. ISBN 978-0-87590-994-3. [Google Scholar]
  3. Hurrell, J.W.; Kushnir, Y.; Visbeck, M. The North Atlantic Oscillation. Science 2001, 291, 603–605. [Google Scholar] [CrossRef] [PubMed]
  4. Trigo, R.M.; Pozo-Vázquez, D.; Osborn, T.J.; Castro-Díez, Y.; Gámiz-Fortis, S.; Esteban-Parra, M.J. North Atlantic Oscillation Influence on Precipitation, River Flow and Water Resources in the Iberian Peninsula. Int. J. Climatol. 2004, 24, 925–944. [Google Scholar] [CrossRef]
  5. Wang, L.; Ting, M.; Kushner, P.J. A Robust Empirical Seasonal Prediction of Winter NAO and Surface Climate. Sci. Rep. 2017, 7, 279. [Google Scholar] [CrossRef] [PubMed]
  6. Scaife, A.A.; Arribas, A.; Blockley, E.; Brookshaw, A.; Clark, R.T.; Dunstone, N.; Eade, R.; Fereday, D.; Folland, C.K.; Gordon, M.; et al. Skillful Long-range Prediction of European and North American Winters. Geophys. Res. Lett. 2014, 41, 2514–2519. [Google Scholar] [CrossRef]
  7. Dunstone, N.; Smith, D.; Scaife, A.; Hermanson, L.; Eade, R.; Robinson, N.; Andrews, M.; Knight, J. Skilful Predictions of the Winter North Atlantic Oscillation One Year Ahead. Nat. Geosci. 2016, 9, 809–814. [Google Scholar] [CrossRef]
  8. Johansson, Å. Prediction Skill of the NAO and PNA from Daily to Seasonal Time Scales. J. Clim. 2007, 20, 1957–1975. [Google Scholar] [CrossRef]
  9. Walker, G.T. Correlation in Seasonal Variation of Weather VIII: A Preliminary Study of World Weather. Mem. India Meteorol. Dep. 1923, 24, 75–131. [Google Scholar]
  10. Walker, G.T. Correlation in Seasonal Variation of Weather IX: A Further Study of World Weather. Mem. India Meteorol. Dep. 1924, 24, 225–232. [Google Scholar]
  11. Walker, G.T.; Bliss, E.W. World Weather V. Mem. R. Meteorol. Soc. 1932, 4, 53–84. [Google Scholar] [CrossRef]
  12. Rogers, J.C. The Association between the North Atlantic Oscillation and the Southern Oscillation in the Northern Hemisphere. Mon. Wea. Rev. 1984, 112, 1999–2015. [Google Scholar] [CrossRef]
  13. Huang, J.; Higuchi, K.; Shabbar, A. The Relationship between the North Atlantic Oscillation and El Niño-Southern Oscillation. Geophys. Res. Lett. 1998, 25, 2707–2710. [Google Scholar] [CrossRef]
  14. Giannini, A.; Cane, M.A.; Kushnir, Y. Interdecadal Changes in the ENSO Teleconnection to the Caribbean Region and the North Atlantic Oscillation. J. Clim. 2001, 14, 2867–2879. [Google Scholar] [CrossRef]
  15. Hoskins, B.J.; Karoly, D.J. The Steady Linear Response of a Spherical Atmosphere to Thermal and Orographic Forcing. J. Atmos. Sci. 1981, 38, 1179–1196. [Google Scholar] [CrossRef]
  16. Horel, J.D.; Wallace, J.M. Planetary-Scale Atmospheric Phenomena Associated with the Southern Oscillation. Mon. Wea. Rev. 1981, 109, 813–829. [Google Scholar] [CrossRef]
  17. Trenberth, K.E.; Branstator, G.W.; Karoly, D.; Kumar, A.; Lau, N.-C.; Ropelewski, C. Progress during TOGA in Understanding and Modeling Global Teleconnections Associated with Tropical Sea Surface Temperatures. J. Geophys. Res. 1998, 103, 14291–14324. [Google Scholar] [CrossRef]
  18. Alexander, M.A.; Bladé, I.; Newman, M.; Lanzante, J.R.; Lau, N.-C.; Scott, J.D. The Atmospheric Bridge: The Influence of ENSO Teleconnections on Air–Sea Interaction over the Global Oceans. J. Clim. 2002, 15, 2205–2231. [Google Scholar] [CrossRef]
  19. Pozo-Vázquez, D.; Esteban-Parra, M.J.; Rodrigo, F.S.; Castro-Díez, Y. The Association between ENSO and Winter Atmospheric Circulation and Temperature in the North Atlantic Region. J. Clim. 2001, 14, 3408–3420. [Google Scholar] [CrossRef]
  20. Mathieu, P.-P.; Sutton, R.T.; Dong, B.; Collins, M. Predictability of Winter Climate over the North Atlantic European Region during ENSO Events. J. Clim. 2004, 17, 1953–1974. [Google Scholar] [CrossRef]
  21. Brönnimann, S. Impact of El Niño-Southern Oscillation on European Climate: Enso Impact on Europe. Rev. Geophys. 2007, 45, RG3003. [Google Scholar] [CrossRef]
  22. Toniazzo, T.; Scaife, A.A. The Influence of ENSO on Winter North Atlantic Climate. Geophys. Res. Lett. 2006, 33, L24704. [Google Scholar] [CrossRef]
  23. Garfinkel, C.I.; Hartmann, D.L. Influence of the Quasi-Biennial Oscillation on the North Pacific and El Niño Teleconnections. J. Geophys. Res. 2010, 115, D20116. [Google Scholar] [CrossRef]
  24. Wallace, J.M.; Gutzler, D.S. Teleconnections in the Geopotential Height Field during the Northern Hemisphere Winter. Mon. Wea. Rev. 1981, 109, 784–812. [Google Scholar] [CrossRef]
  25. Pinto, J.G.; Reyers, M.; Ulbrich, U. The Variable Link between PNA and NAO in Observations and in Multi-Century CGCM Simulations. Clim. Dyn. 2011, 36, 337–354. [Google Scholar] [CrossRef]
  26. Pozo-Vázquez, D.; Gámiz-Fortis, S.R.; Tovar-Pescador, J.; Esteban-Parra, M.J.; Castro-DÍez, Y. North Atlantic Winter SLP Anomalies Based on the Autumn ENSO State. J. Clim. 2005, 18, 97–103. [Google Scholar] [CrossRef]
  27. Mezzina, B.; García-Serrano, J.; Bladé, I.; Kucharski, F. Dynamics of the ENSO Teleconnection and NAO Variability in the North Atlantic–European Late Winter. J. Clim. 2020, 33, 907–923. [Google Scholar] [CrossRef]
  28. Watanabe, M.; Kimoto, M. Tropical-Extratropical Connection in the Atlantic Atmosphere-Ocean Variability. Geophys. Res. Lett. 1999, 26, 2247–2250. [Google Scholar] [CrossRef]
  29. Robertson, A.W.; Mechoso, C.R.; Kim, Y.-J. The Influence of Atlantic Sea Surface Temperature Anomalies on the North Atlan-tic Oscillation. J. Clim. 2000, 13, 122–138. [Google Scholar] [CrossRef]
  30. Peng, S.; Robinson, W.A.; Li, S. Mechanisms for the NAO Responses to the North Atlantic SST Tripole. J. Clim. 2003, 16, 1987–2004. [Google Scholar] [CrossRef]
  31. Pan, L.-L. Observed Positive Feedback between the NAO and the North Atlantic SSTA Tripole. Geophys. Res. Lett. 2005, 32, L06707. [Google Scholar] [CrossRef]
  32. Sung, M.-K.; Ham, Y.-G.; Kug, J.-S.; An, S.-I. An Alterative Effect by the Tropical North Atlantic SST in Intraseasonally Varying El Niño Teleconnection over the North Atlantic. Tellus A Dyn. Meteorol. Oceanogr. 2013, 65, 19863. [Google Scholar] [CrossRef]
  33. Buchan, J.; Hirschi, J.J.-M.; Blaker, A.T.; Sinha, B. North Atlantic SST Anomalies and the Cold North European Weather Events of Winter 2009/10 and December 2010. Mon. Weather. Rev. 2014, 142, 922–932. [Google Scholar] [CrossRef]
  34. Ham, Y.-G.; Sung, M.-K.; An, S.-I.; Schubert, S.D.; Kug, J.-S. Role of Tropical Atlantic SST Variability as a Modulator of El Niño Teleconnections. Asia-Pac. J. Atmos. Sci. 2014, 50, 247–261. [Google Scholar] [CrossRef]
  35. Covey, D.L.; Hastenrath, S. The Pacific El Niño Phenomenon and the Atlantic Circulation. Mon. Wea. Rev. 1978, 106, 1280–1287. [Google Scholar] [CrossRef]
  36. Enfield, D.B.; Mayer, D.A. Tropical Atlantic Sea Surface Temperature Variability and Its Relation to El Niño-Southern Oscillaion. J. Geophys. Res. 1997, 102, 929–945. [Google Scholar] [CrossRef]
  37. Nobre, P.; Shukla, J. Variations of Sea Surface Temperature, Wind Stress, and Rainfall over the Tropical Atlantic and South America. J. Clim. 1996, 9, 2464–2479. [Google Scholar] [CrossRef]
  38. Jiang, F.; Zhang, W. Understanding the Complicated Relationship Between ENSO and Wintertime North Tropical Atlantic SST Variability. Geophys. Res. Lett. 2022, 49, e2022GL097889. [Google Scholar] [CrossRef]
  39. Castanheira, J.M.; Graf, H.-F. North Pacific–North Atlantic Relationships under Stratospheric Control? J. Geophys. Res. 2003, 108, 4036. [Google Scholar] [CrossRef]
  40. Ineson, S.; Scaife, A.A. The Role of the Stratosphere in the European Climate Response to El Niño. Nat. Geosci. 2009, 2, 32–36. [Google Scholar] [CrossRef]
  41. Bell, C.J.; Gray, L.J.; Charlton-Perez, A.J.; Joshi, M.M.; Scaife, A.A. Stratospheric Communication of El Niño Teleconnections to European Winter. J. Clim. 2009, 22, 4083–4096. [Google Scholar] [CrossRef]
  42. Butler, A.H.; Polvani, L.M.; Deser, C. Separating the Stratospheric and Tropospheric Pathways of El Niño–Southern Oscillation Teleconnections. Environ. Res. Lett. 2014, 9, 024014. [Google Scholar] [CrossRef]
  43. Jiménez-Esteve, B.; Domeisen, D.I.V. The Tropospheric Pathway of the ENSO–North Atlantic Teleconnection. J. Clim. 2018, 31, 4563–4584. [Google Scholar] [CrossRef]
  44. Ropelewski, C.F.; Halpert, M.S. Global and Regional Scale Precipitation Patterns Associated with the El Niño/Southern Os-cillation. Mon. Wea. Rev. 1987, 115, 1606–1626. [Google Scholar] [CrossRef]
  45. Halpert, M.S.; Ropelewski, C.F. Surface Temperature Patterns Associated with the Southern Oscillation. J. Clim. 1992, 5, 577–593. [Google Scholar] [CrossRef]
  46. Fraedrich, K. An ENSO Impact on Europe? Tellus A 1994, 46, 541–552. [Google Scholar] [CrossRef]
  47. Cassou, C.; Terray, L. Dual Influence of Atlantic and Pacific SST Anomalies on the North Atlantic/Europe Winter Climate. Geophys. Res. Lett. 2001, 28, 3195–3198. [Google Scholar] [CrossRef]
  48. Zhang, W.; Mei, X.; Geng, X.; Turner, A.G.; Jin, F.-F. A Nonstationary ENSO–NAO Relationship Due to AMO Modulation. J. Clim. 2019, 32, 33–43. [Google Scholar] [CrossRef]
  49. Moron, V.; Gouirand, I. Seasonal Modulation of the El Niño-Southern Oscillation Relationship with Sea Level Pressure Anomalies over the North Atlantic in October-March 1873-1996: ENSO North Atlantic Sea Level Pressure Relationship. Int. J. Climatol. 2003, 23, 143–155. [Google Scholar] [CrossRef]
  50. Rayner, N.A. Global Analyses of Sea Surface Temperature, Sea Ice, and Night Marine Air Temperature since the Late Nine-teenth Century. J. Geophys. Res. 2003, 108, 4407. [Google Scholar] [CrossRef]
  51. Kalnay, E.; Kanamitsu, M.; Kistler, R.; Collins, W.; Deaven, D.; Gandin, L.; Iredell, M.; Saha, S.; White, G.; Woollen, J.; et al. The NCEP/NCAR 40-Year Reanalysis Project. Bull. Amer. Meteor. Soc. 1996, 77, 437–471. [Google Scholar] [CrossRef]
  52. Chen, M.; Xie, P.; Janowiak, J.E.; Arkin, P.A. Global Land Precipitation: A 50-Yr Monthly Analysis Based on Gauge Observations. J. Hydrometeorol. 2002, 3, 249–266. [Google Scholar] [CrossRef]
  53. Hurrell, J.W. Decadal Trends in the North Atlantic Oscillation: Regional Temperatures and Precipitation. Science 1995, 269, 676–679. [Google Scholar] [CrossRef]
  54. Efron, B.; Tibshirani, R.J. An Introduction to the Bootstrap; Springer: Boston, MA, USA, 1993; ISBN 978-0-412-04231-7. [Google Scholar]
  55. Yuan, C.; Yamagata, T. Impacts of IOD, ENSO and ENSO Modoki on the Australian Winter Wheat Yields in Recent Decades. Sci. Rep. 2015, 5, 17252. [Google Scholar] [CrossRef] [Green Version]
  56. Stuecker, M.F.; Timmermann, A.; Jin, F.-F.; McGregor, S.; Ren, H.-L. A Combination Mode of the Annual Cycle and the El Niño/Southern Oscillation. Nat. Geosci. 2013, 6, 540–544. [Google Scholar] [CrossRef]
  57. Zhang, W.; Li, H.; Jin, F.-F.; Stuecker, M.F.; Turner, A.G.; Klingaman, N.P. The Annual-Cycle Modulation of Meridional Asymetry in ENSO’s Atmospheric Response and Its Dependence on ENSO Zonal Structure. J. Clim. 2015, 28, 5795–5812. [Google Scholar] [CrossRef]
  58. Zhang, W.; Li, H.; Stuecker, M.F.; Jin, F.-F.; Turner, A.G. A New Understanding of El Niño’s Impact over East Asia: Dominance of the ENSO Combination Mode. J. Clim. 2016, 29, 4347–4359. [Google Scholar] [CrossRef]
  59. Stuecker, M.F.; Jin, F.-F.; Timmermann, A.; McGregor, S. Combination Mode Dynamics of the Anomalous Northwest Pacific Anticyclone. J. Clim. 2015, 28, 1093–1111. [Google Scholar] [CrossRef]
  60. Wang, C. ENSO, Atlantic Climate Variability, and the Walker and Hadley Circulations. In The Hadley Circulation: Present, Past and Future; Diaz, H.F., Bradley, R.S., Eds.; Advances in Global Change Research; Springer Netherlands: Dordrecht, The Netherlands, 2004; Volume 21, pp. 173–202. ISBN 978-90-481-6752-4. [Google Scholar]
  61. García-Serrano, J.; Cassou, C.; Douville, H.; Giannini, A.; Doblas-Reyes, F.J. Revisiting the ENSO Teleconnection to the Trop-ical North Atlantic. J. Clim. 2017, 30, 6945–6957. [Google Scholar] [CrossRef]
  62. Lintner, B.R.; Chiang, J.C.H. Adjustment of the Remote Tropical Climate to El Niño Conditions. J. Clim. 2007, 20, 2544–2557. [Google Scholar] [CrossRef]
  63. Kumar, A.; Hoerling, M.P. Annual Cycle of Pacific–North American Seasonal Predictability Associated with Different Phases of ENSO. J. Clim. 1998, 11, 3295–3308. [Google Scholar] [CrossRef]
  64. Graf, H.-F.; Zanchettin, D. Central Pacific El Niño, the “Subtropical Bridge,” and Eurasian Climate: Two El Niño Types and Eurasian Climate. J. Geophys. Res. 2012, 117, D01102. [Google Scholar] [CrossRef]
  65. Zhang, W.; Wang, Z.; Stuecker, M.F.; Turner, A.G.; Jin, F.-F.; Geng, X. Impact of ENSO Longitudinal Position on Teleconnections to the NAO. Clim. Dyn. 2019, 52, 257–274. [Google Scholar] [CrossRef]
  66. Abid, M.A.; Kucharski, F.; Molteni, F.; Kang, I.-S.; Tompkins, A.M.; Almazroui, M. Separating the Indian and Pacific Ocean Impacts on the Euro-Atlantic Response to ENSO and Its Transition from Early to Late Winter. J. Clim. 2021, 34, 1531–1548. [Google Scholar] [CrossRef]
  67. Garfinkel, C.I.; Hartmann, D.L. Different ENSO Teleconnections and Their Effects on the Stratospheric Polar Vortex. J. Geophys. Res. 2008, 113, D18114. [Google Scholar] [CrossRef] [Green Version]
Figure 1. SLP anomalies (hPa) in (a) November, (b) December, (c) January, and (d) February regressed upon the simultaneous standardized NAO index. (eh) Similar to (ad) but for SLP anomalies regressed on the Niño3.4 index. Large (small) dots indicate regression coefficients that are statistically significant at the 95% (90%) confidence level. The green box indicates the North Atlantic region (20°–90° N, 0°–80° W). The pattern correlation is displayed in (eh), which is calculated based on the NAO-related SLP anomalies and ENSO-related anomalies over the North Atlantic region for each month, respectively.
Climate 11 00047 g001
Figure 2. Monthly evolution of the difference of NAO index between composite El Niño and La Niña from October (0) to March (1). Numerals “0” and “1” denote the years in which ENSO events develop and decay, respectively. Solid circles indicate the composite values that are significant at the 95% confidence level. The orange and blue shadings indicate the early and late winter, respectively.
Climate 11 00047 g002
Figure 3. Histograms of the averaged NAO index after 1000 bootstrap resampling during (a) El Niño early winter, (b) La Niña early winter, (c) El Niño late winter, and (d) La Niña late winter. The bootstrap ensemble mean is displayed for each case with the asterisk denoting the value that is statistically significant at the 95% confidence level (also indicated by the dotted red line).
Climate 11 00047 g003
Figure 4. Anomalous SST (shading: °C) and SLP (contour: hPa) anomalies in (a) early winter and (b) late winter regressed upon the standardized simultaneous Niño3.4 index. Anomalous precipitation (Precip for short; shading, mm/day) and geopotential height at 500 hPa (Hgt500 for short; contour, m) in (c) early winter and (d) late winter regressed upon the standardized simultaneous Niño3.4 index. Solid lines indicate the positive values and dashed lines indicate the negative values of SLP in (a,b) and Hgt500 in (c,d). The contour interval is 0.3 hPa in (a,b) and 0.3 m in (c,d).
Climate 11 00047 g004
Figure 5. Zonal wind and vertical velocity (omega) anomalies (vector; m/s for zonal wind and Pa/s for omega) averaged meridionally over 5° S–5° N in (a) early and (b) late winter regressed upon the simultaneous Niño3.4 index. Meridional wind and vertical velocity anomalies (vector; m/s for meridional wind and Pa/s for omega) averaged zonally over 0°–50° W in (c) early and (d) late winter regressed upon the simultaneous Niño3.4 index. Omega anomalies are multiplied by a factor of −400 in (a,b) and −800 in (c,d) for display and are also shown in shading.
Climate 11 00047 g005
Figure 6. Monthly SLP anomalies (hPa) regressed upon the simultaneous (a) Walker index, (b) PNA index, and (c) NTA index. Dots indicate regression coefficients that are statistically significant at the 95% confidence level. The green box indicates the North Atlantic region (20°–90° N, 0°–80° W).
Climate 11 00047 g006
Figure 7. Monthly evolution of difference of the standardized Walker index (green line), PNA index (orange line), and NTA index (red line) between composite El Niño and La Niña.
Climate 11 00047 g007
Figure 8. Composite SLP anomalies (hPa) for (a) El Niño events concurrent with positive NTA SST anomalies; (b) El Niño events concurrent with negative NTA SST anomalies; (c) La Niña events concurrent with negative NTA SST anomalies; and (d) La Niña events concurrent with positive NTA SST anomalies. Large (small) dots indicate regression coefficients that are statistically significant at the 95% (90%) confidence level. The green box indicates the North Atlantic region (20°–90° N, 0°–80° W).
Climate 11 00047 g008
Table 1. El Niño and La Niña years are classified according to late winter NTA SST anomalies.
CategoriesYear
El Niño with positive NTA anomalies1963, 1965, 1968, 1969, 1977, 1979, 1987, 1997, 2002, 2004, 2006, 2009, 2015
El Niño with negative NTA anomalies1972, 1976, 1982, 1986, 1991, 1994, 2014, 2018
La Niña with positive NTA anomalies1970, 1995, 2005, 2010, 2016
La Niña with negative NTA anomalies1964, 1971, 1973, 1974, 1975, 1983, 1984, 1985, 1988, 1998, 1999, 2000, 2007, 2008, 2011, 2017
Disclaimer/Publisher’s Note: The statements, opinions and data contained in all publications are solely those of the individual author(s) and contributor(s) and not of MDPI and/or the editor(s). MDPI and/or the editor(s) disclaim responsibility for any injury to people or property resulting from any ideas, methods, instructions or products referred to in the content.

