1. Introduction
Tourism is one of the major socio-economic contributors to established and emerging destinations of the world. Approximately, it contributes to 10.4% of global gross domestic product (GDP) and therefore plays a crucial role in providing more than 200 million job opportunities throughout the world [
1,
2]. Similarly, tourism is the economic engine for most countries. According to the census and statistics of the United Nations World Tourism Organization (UNWTO), the global tourist arrivals of 2018 increased by 5% and reached 1.4 billion in revenue compared to the previous years [
3]. Europe owns the largest share among the world’s tourist arrivals (i.e., 51%), followed by Asia and the Pacific (25%), the Americas (15%), Africa (5%), and the Middle East (4%). In addition, the Asia–Pacific region was identified as the owner of the highest growth in tourist arrivals and tourism earnings [
3].
Diverse climate conditions along with natural beauty and cultural–traditional heritage have been identified as the main reasons for tourist attractions in the South Asian region and their nations [
4]. Therefore, while protecting natural beauty and cultural–traditional heritage, the tourism industry has to be more aware and prepared for climatic changes. Tourism has been identified as a major climate-sensitive sector, as it is indirectly influenced by the environmental and socioeconomic changes that contribute to climate change [
5]. Investigations conducted on demand responses of tourists to climate change and decision making for destination choice reveal that certain shifts or reductions are expected in tourist destinations, although some other investigations have shown it depends on the attitudes of the tourists [
1,
5,
6,
7,
8,
9,
10,
11,
12].
Usually, states and changes in the climate system are defined with numerical values that are identified as climate indices. Furthermore, these values can be used to evaluate the present and future climate attractiveness of tourist destinations. The concept of present and future climate attractiveness for tourism was first introduced by Mieczkowski [
13], after combining climate factors significant for the comfort of tourists (i.e., temperature, humidity, precipitation, cloud cover, and wind speed). Scott et al. [
14], and later Rutty et al. [
12], improved Mieczkowski’s [
13] tourist climate indices (
TCI) into a more realistic way of considering both beach and urban destinations, often known as holiday climate indices (
HCI). These are useful for understating future tourist attractions under various climate scenarios defined by the Intergovernmental Panel on Climate Change (IPCC), commonly known as representative concentration pathways (RCPs). In addition. Noome and Fitchett [
15] have stated that the
HCI is a more appropriate update for the
TCI, and thus should be used by many more researchers in the world.
The holiday climate index has been widely used by researchers to observe the impact of climate change on localized tourism industries and then to forecast the future scenario and trends in tourism [
12,
16,
17,
18,
19,
20,
21,
22,
23]. However, comparisons from previous studies revealed that
HCIs from the same climatic zones are different from each other. The study conducted by Rutty et al. [
12], showed that the
HCIs for Caribbean destinations is different from the Borobudur Temple, Indonesia [
24], in a tropical region. Similarly, the studies conducted for temperate climatic zones, China [
22], Europe [
14], and Tbilisi (Georgia) [
25] are also comparatively different. Moreover,
HCIs in subtropical areas, including Sistan and Baluchestan Provinces [
18], Isfahan, Rasht [
19], and Tokyo (Japan) [
23], and the Mediterranean [
1,
17], are also comparatively different as there are micro-climatic zones within the main climatic zones. Therefore, it is important to investigate this by looking into micro-climatic zones for the calculation of
HCIs.
In addition, Velea et al. [
26] investigated the
HCI for both urban and rural tourist destinations in Romania considering 94 destinations. They worked on monthly resolutions to project the suitability of urban and rural tourist destinations. The results showcased that the weather has significantly but similarly influenced tourism in Romania for both urban and rural sectors. Carrillo et al. [
27] used the
HCI to project the impact of climate on tourism in Canary Islands as the tourism industry significantly contributes to the economy of the Canary Islands. They used RCP4.5 and RCP8.5 to project the future impacts on tourism using the
HCI. Mixed, better, and worse impacts were found for different locations in different seasons. Similar studies were carried out by many other researchers in the recent literature, on different countries and locations which are highly vulnerable to climate changes [
28,
29,
30,
31]. In addition to that, Gómez-Martín et al. [
32] stated that beach tourism is significantly vulnerable to climate change. Therefore, island countries’ tourism can be significantly impacted by climate change.
However, the related literature to Sri Lanka on the impact of climate change on tourism is minimal to date. Throughout the 21st century, Sri Lanka was identified as the best country to travel to in 2019 by Lonely Planet [
33] and awarded fifth place from the readers’ choice award for the place to travel to in 2021 (
https://www.cntraveler.com/story/top-countries-in-the-world, accessed on 21 June 2022). Nevertheless, Sri Lanka is facing adverse weather pattern changes due to climate change. However, the impact of these changes on a significant economic contributor such as tourism has never been tested for Sri Lanka. This is identified as one of the major economic gaps in the country. Therefore, research on tourism with climate change is highly important to a country such as Sri Lanka to change its tourism policies and then bring any necessary countermeasures. In addition, some of the tourist attractions of Sri Lanka are affected due to on-going development activities related to underground work. The Uma Oya development project is one such example [
34] and directly impacted the water resources in the Ella area (one of the best attractions due to its landscape and water resources) due to on-going tunneling work. Thus, the tourism in the area was also affected.
The main aim of this study is to investigate the potential present and future climatic attractiveness of a destination choice for tourism using a holiday climate index (HCI), which is an improved version of the tourism climate index (TCI). In addition, the research work investigates the effect of HCI on tourist stays in beaches and urban areas, and arrivals in the country for leisure. Furthermore, it presents the potential future choice of tourist destinations.
This paper is structured as follows. Firstly, the study area and collected data for the analysis are presented. Then, the methodology which was used for the analysis is introduced. Next, an overview of the methodology was presented with the techniques and approaches used to calculate TCI, HCI beach, and HCI urban scores. After that, the results for different climatic scenarios are presented and discussed. Finally, the conclusions are presented in the last section.
2. Study area, Data and Methods
2.1. Study Area
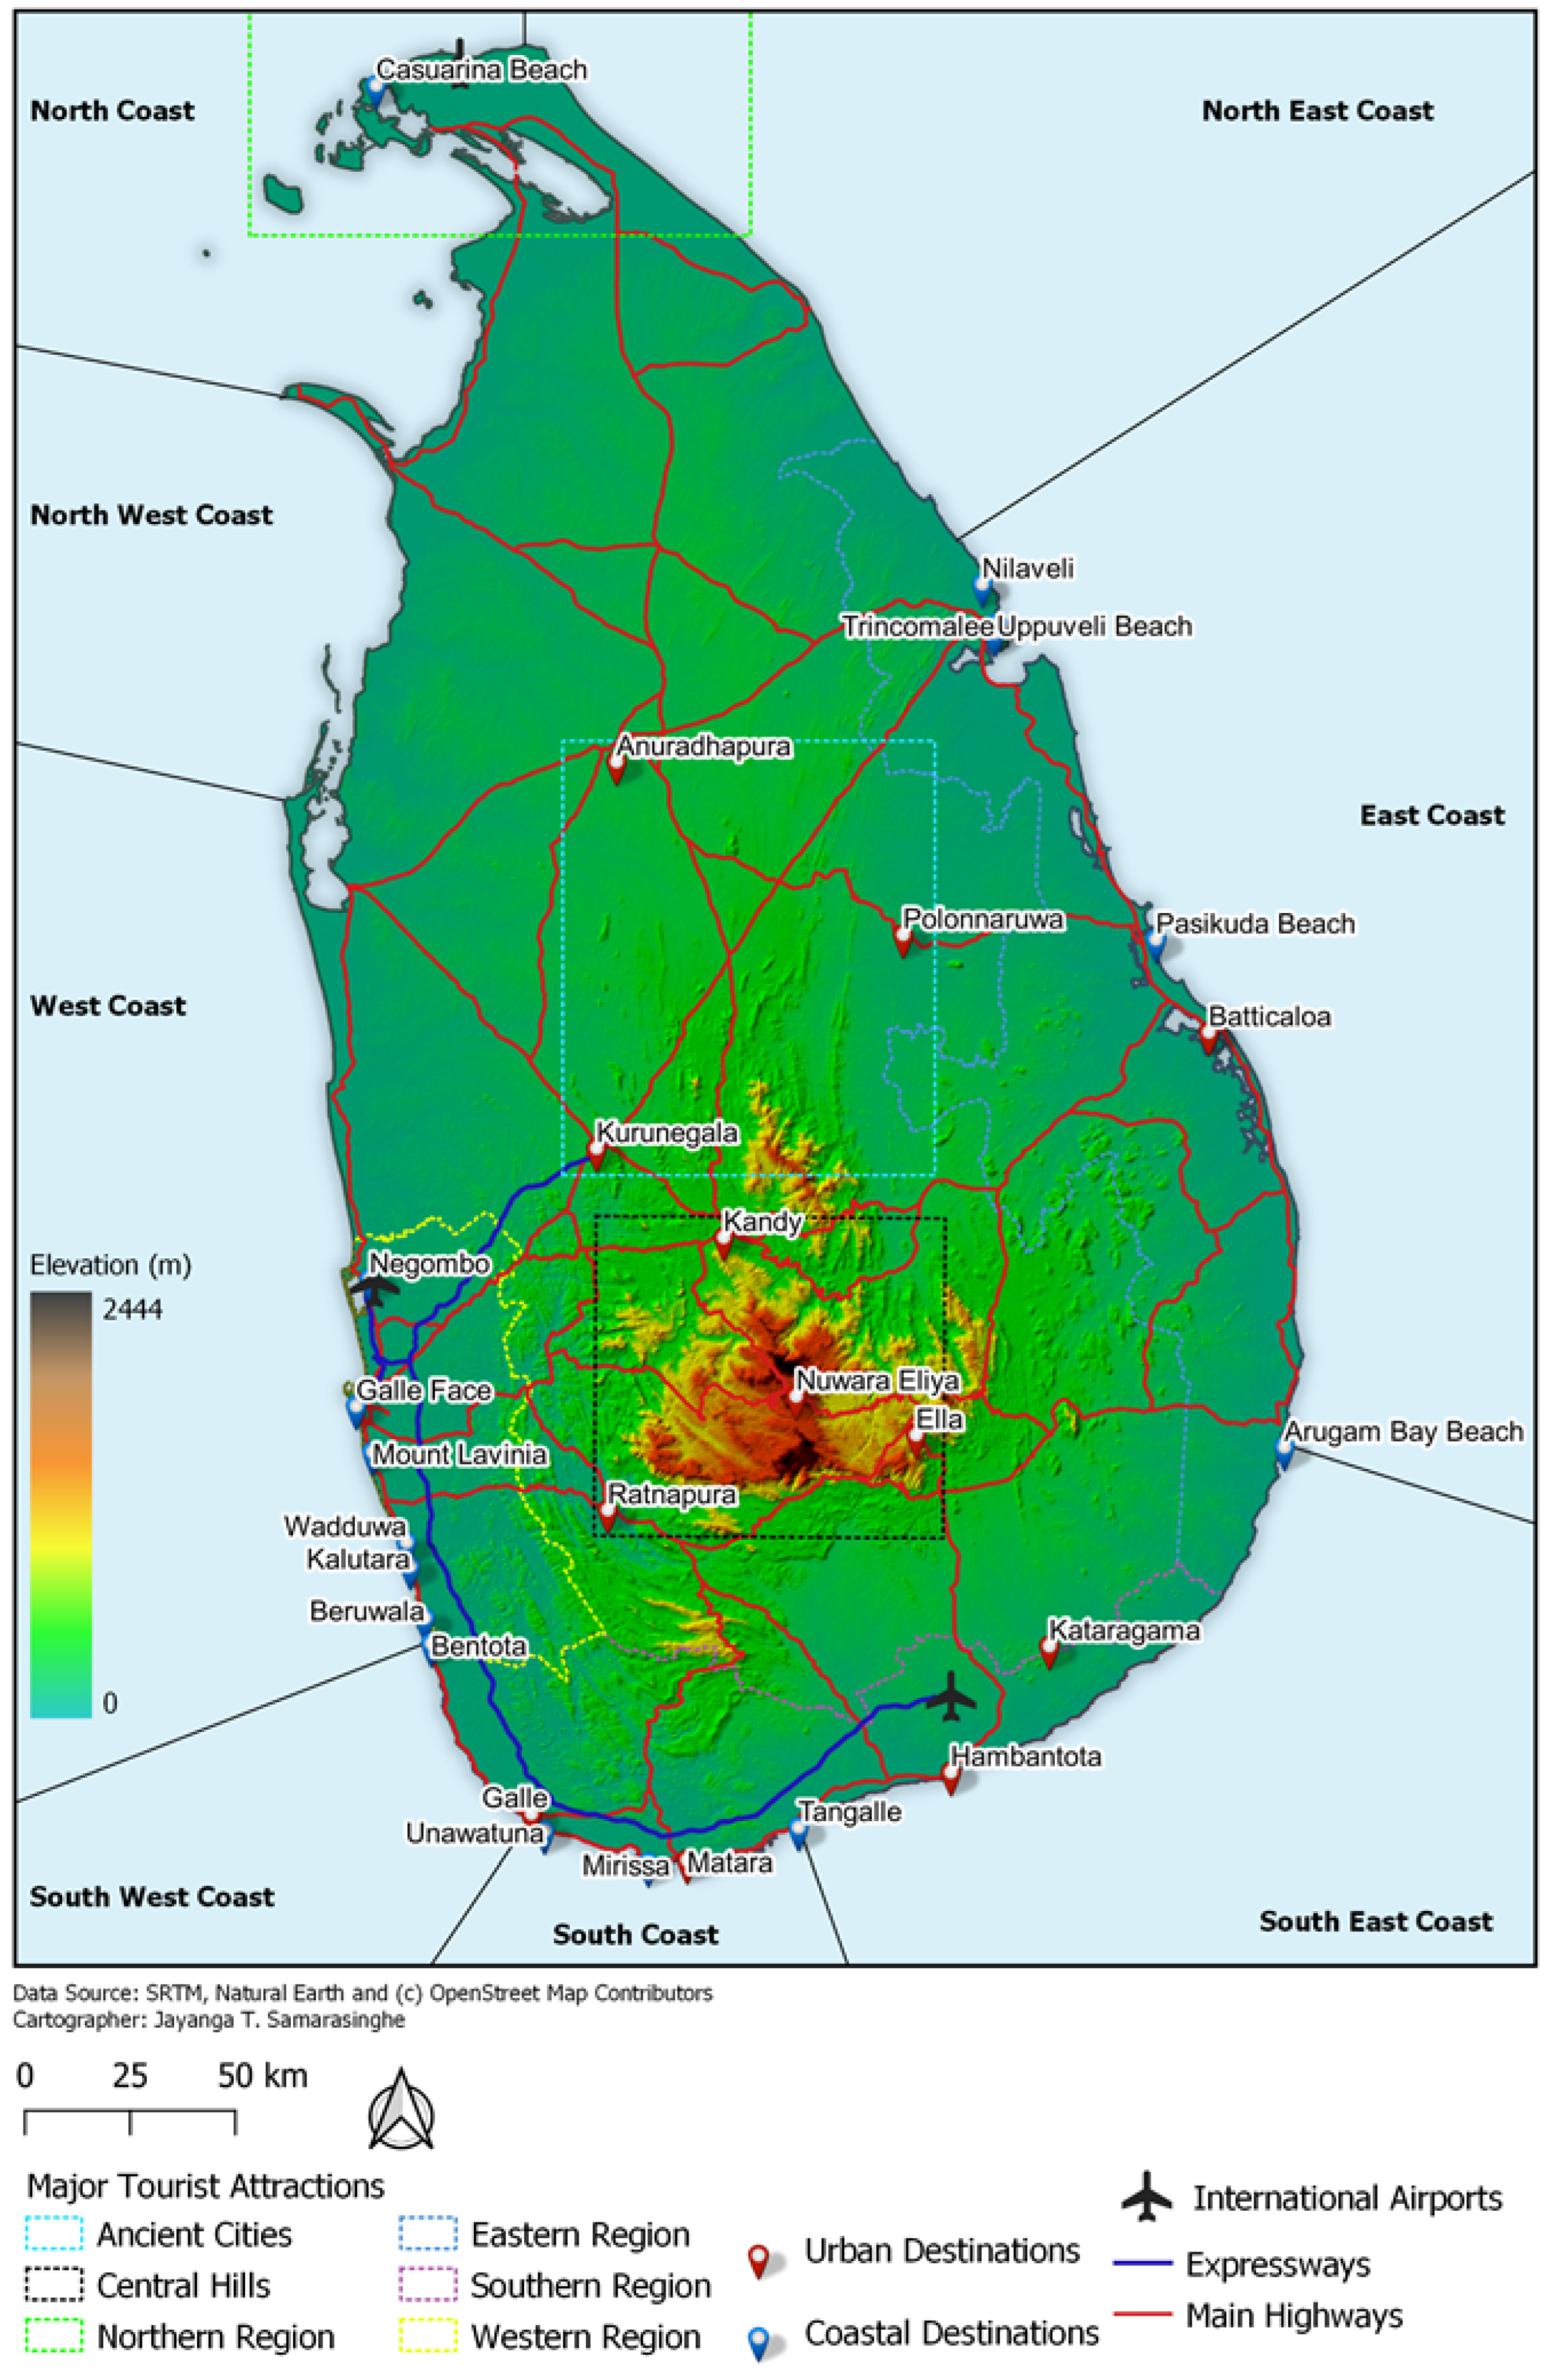
Sri Lanka is a small tropical island in the Indian Ocean, commonly known as the ‘Pearl of the Indian Ocean’, located at the southern tip of the Indian subcontinent, extending from 6° to 10° northern latitudes and 80° to 82° eastern longitudes, with a land area of nearly 65,610 km
2 (refer to
Figure 1). The country has a uniquely diverse landscape due to the mountainous terrain in the country’s southern half, but the flat northern half. Furthermore, the topography distinctly varies from 0 m MSL to 2500 m MSL. The country has nearly 1600 km of palm-fringed beautiful beaches on the southwestern, southern, and southeastern coastal lines. For a long time, Sri Lanka has been considered the hub of world trade due to its strategic location in the heart of the ‘
Maritime Silk Road’ [
35]. As a result of that, Sri Lanka has played a significant role in overseas trade and tourism and still poses as the global logistic hub, by connecting major air and sea routes between Europe and the Far East. Thus, this was the main reason for colonization by three western powers, the Portuguese (1505–1656), the Dutch (1656–1796), and the British (1796–1948) [
36]. In addition to that, Sri Lanka has been very much famous among foreign nations over the years for many reasons: golden sandy beaches, blue skies, natural beauty, temperate climate, exotic and romantic culture, and spices. Due to that, Sri Lanka has been identified by different names by different nations; ‘
Seylan’, ‘
Serendib’, ‘
Ceylon’ and ‘
Taprobane’ are more common [
37].
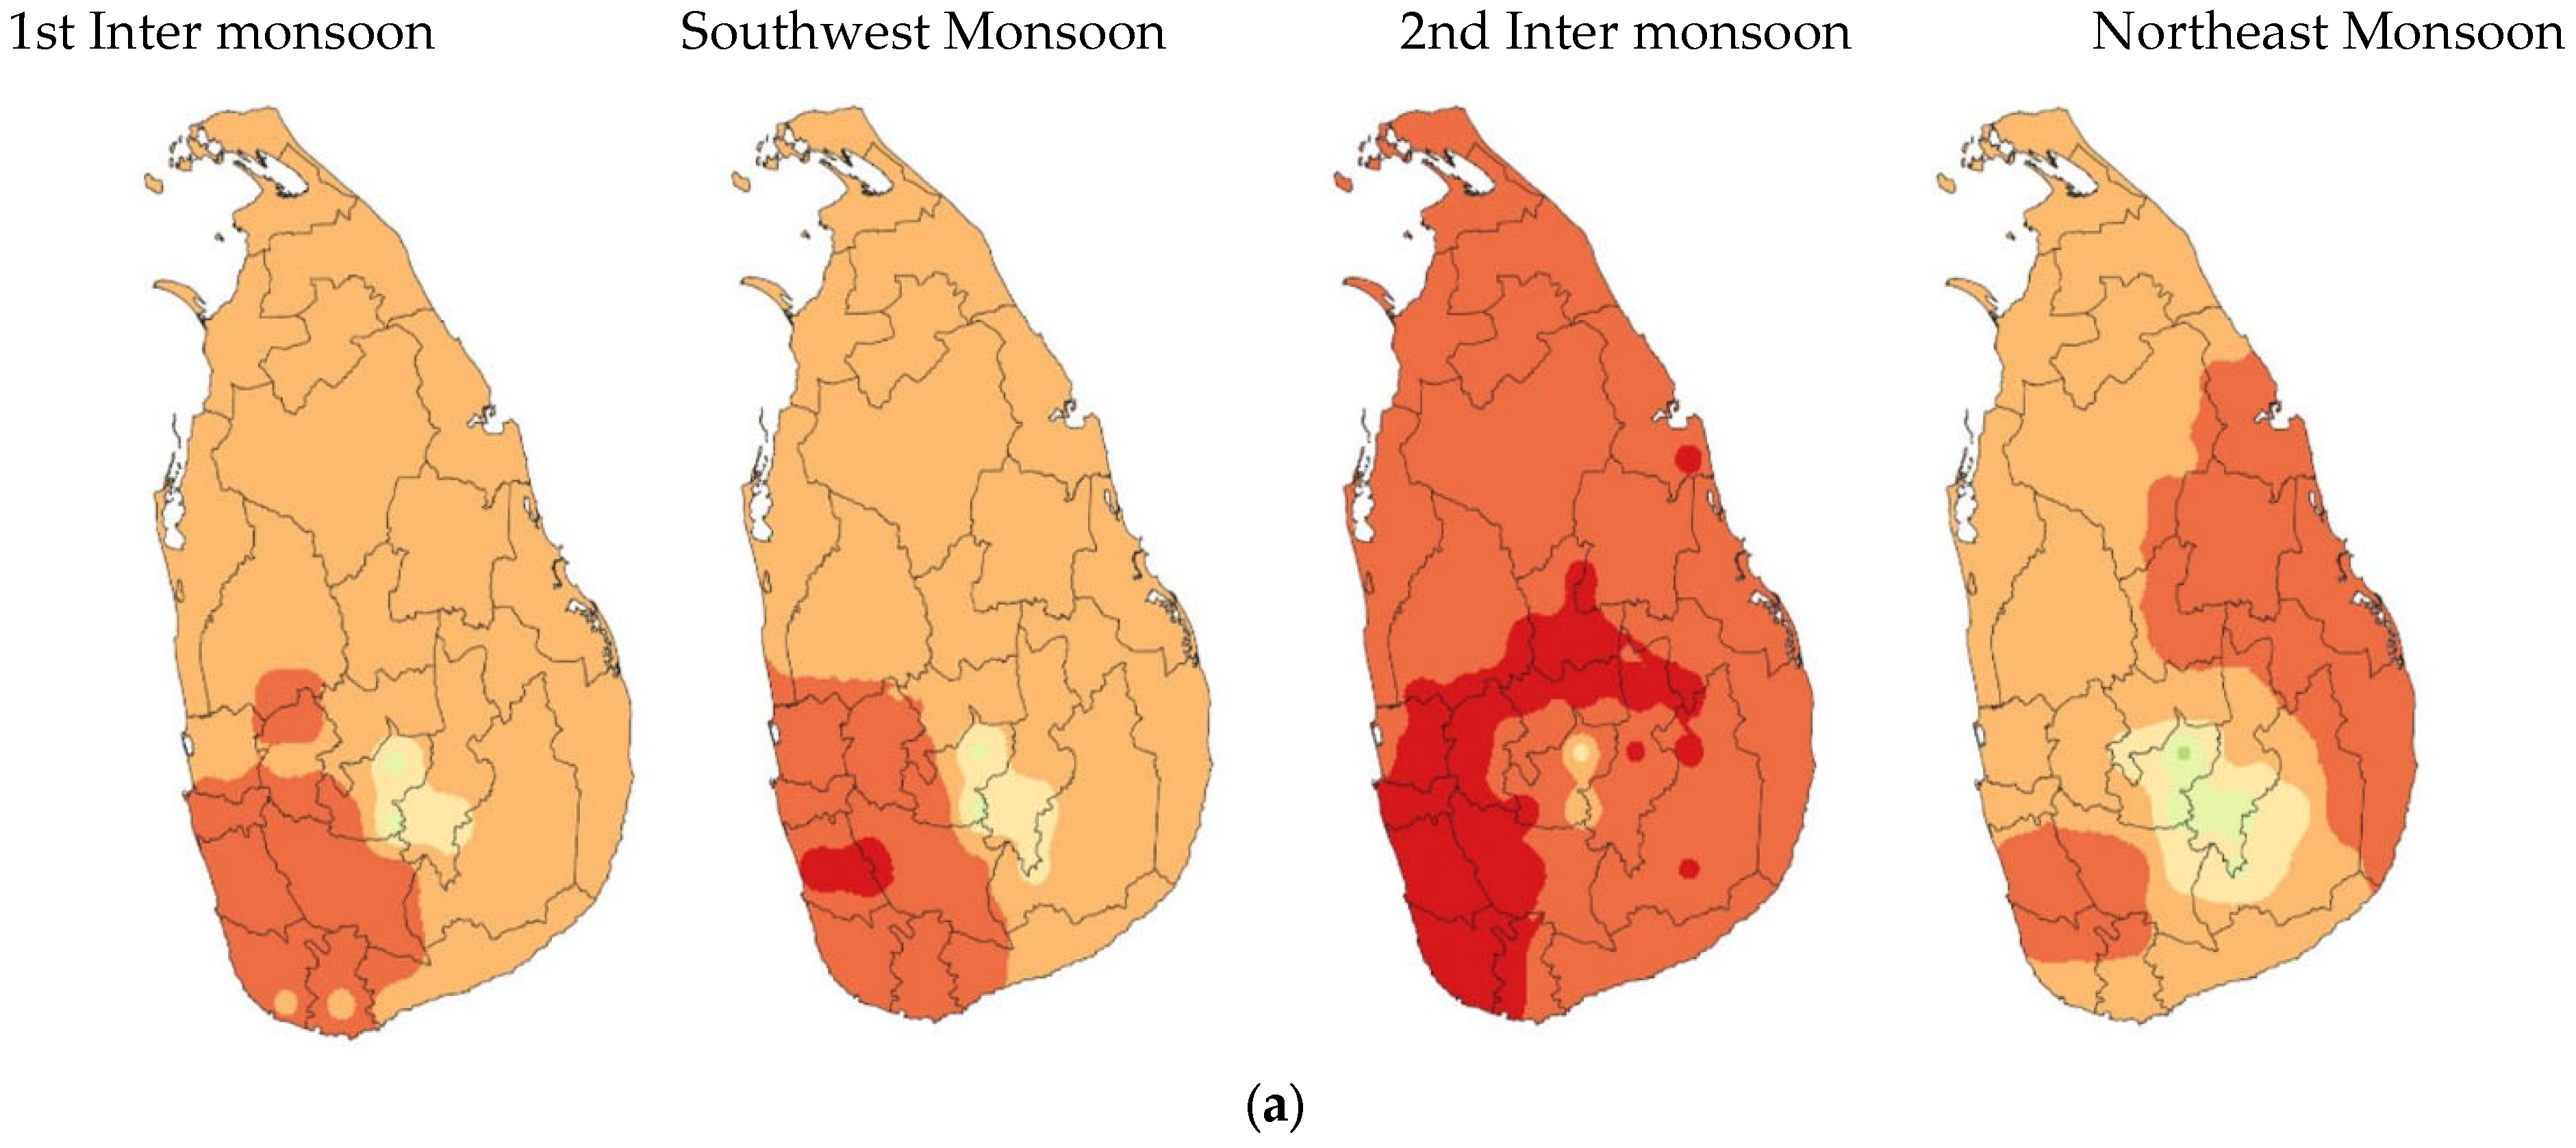
Presently, the tourism of Sri Lanka is mainly governed by its pleasant climate, natural beauty, and culture. The climate of Sri Lanka can be categorized into four monsoon seasons: 1st Inter monsoon (March–April), Southwest monsoon (May–September), 2nd Inter monsoon (October–November), and Northeast monsoon (December–February). The mean annual precipitation varies from 900 mm to 5000 mm, and is at its maximum in the western slope of the central hills. In addition, the temperature usually remains constant throughout the years in coastal regions (around 27 °C), while central hills have shown the lowest temperatures throughout the years (around 16 °C).
With nearly 1600 km of palm-fringed coastline, Sri Lanka is globally considered an ideal tourist destination for its pristine and deep aquamarine waters together with golden sandy beaches. Furthermore, it is one of the most ideal destinations for windsurfing, kayaking, yachting, water skiing, scuba diving, or lazing around for the perfect tan. Among all the beach destinations around Sri Lanka, both the western and southern coast are popular with foreign tourists. The southern coast includes Beruwala, Bentota, Unawatuna, Mirissa, and Tengalle, whereas the west coast includes Kalutara, Wadduwa, Mount Lavinia, Galle Face, and Negombo. Similarly, there are stunning beach destinations on the eastern coast and northern coast yet to be discovered by tourists after the end of the three- decades-long civil war. Uppuveli, Nilaveli, Passekudah (Pasikuda), and Arugam Bay are now the most known among eastern beach destinations and Casuarina Beach is the best known among northern beaches (refer to
Figure 1). Understanding the influences of climate variables on tourism is yet to be discovered in the Sri Lankan context. In addition, the Yala National Park in the Kataragama area is one of the most visited by tourists, coming to the national park to observe Asian elephants (
Elephas maximus maximus), the Sri Lankan leopard (
Panthera pardus ‘kotiya’), bear (
Melursus ursinus inornatus), Sri Lankan axis deer (
Axis axis ceylonensis), and many endemic birds.
Furthermore, Sri Lanka owns an enormous amount of culture and heritage and is home to eight UNESCO world heritage sites [
36]. This includes the Central Hill area comprising the Horton Plains, the Knuckles mountain range, Sinharaja Rainforest near Ratnapura, and Nuwara Eliya. Furthermore, Sri Lanka has more than 2500 years of written history as an agricultural civilization, including ruins of the ancient kingdoms of Anuradhapura, Polonnaruwa, Kurunegala, and Kandy, with Buddhist temples and monasteries (refer to
Figure 1). The western part of Sri Lanka is commercially important and with a higher population density (approximately 10 times larger than the remaining parts of the island). The most luxurious and famous 5-star to 7-star hotels are situated along the western coast line starting from Kalutara to the Negambo lagoon. Additionally, tourists are privileged to receive the Sri Lankan hospitality and to taste the hot and spicy traditional cuisine in each corner of the island. Therefore, considering all the above factors, Sri Lanka is identified as one of the best tourist destinations in the entire world [
33].
2.2. Data Collection
Sri Lanka has a dense rain gauge network (more than 500 rain gauges for a total area of 65,610 km2). However, these rain gauges are not uniformly distributed. In addition, some of these gauges were not used to record daily measurements due to various reasons including the civil war in the country. Furthermore, Sri Lanka has only a few stations to measure temperature, wind speed, relative humidity, air pressure, etc. Therefore, there is climatic data scarcity in the country. Thus, ground-measured climatic data were not significantly used for the analysis.
The present study used monthly climate data dynamically downscaled from the global circulation model (GCM) via the regional climate model (RCM) for South Asia to extract the historical climate data and future climate data under RCPs (i.e., both RCP 4.5 and RCP 8.5). The above climate data included maximum temperature, precipitation flux, relative humidity, cloud cover, and wind. The selection of GCM, MPI-ESM-LR (Max Planck Institute Earth System Model Lower Resolution), and RCM, RCA4 by SMHI (Swedish Meteorological and Hydrological Institute) were solely due to their performances, being realistic and recommended by previous research works [
1,
38,
39]. The above climate models were publicly accessible on the CORDEX (Coordinated Regional Climate Downscaling Experiment) platform at
https://cordex.org/, accessed on 27 June 2022, or downloaded from IS-ENES (Infrastructure for the European Network for Earth System Modelling) at
https://climate4impact.eu/, accessed on 1 July 2022.
RCM data have significant biases due to the imperfect conceptualization, internal climatic variability, discretization, and spatial averages within grid cells [
40,
41,
42]. Therefore, in order to reduce the biases, linear scaling (LS), quantile mapping, and local intensity scaling methods were commonly used [
41,
43]. The present study followed the LS method, as it is widely used and validated in both the global and Sri Lankan contexts [
44,
45,
46]. The LS bias correction method required field-measured climate data (i.e., maximum temperature, precipitation, and relative humidity), which were purchased from the Meteorological Department of Sri Lanka from 1990–2018, covering all of Sri Lanka with monthly temporal resolutions. Furthermore, tourist arrivals by country and guest nights were extracted from statistical reports at
https://www.sltda.gov.lk/en, accessed on 27 June 2022, of the Sri Lanka Tourism Development Authority (SLTDA) from 2010 to 2018, with monthly temporal resolutions.
2.3. GIS-Based HCI Computation and Visualization
To remove the biases of RCMs, the LS bias correction method was applied for climate data (i.e., maximum temperature, precipitation (after converting precipitation flux into depths), and relative humidity) using Equations (1)–(4). Typically, temperature is corrected with addictive terms and both precipitation and relative humidity with a multiplier. Nevertheless, Fang et al. [
47] stated that for hydrological modeling aspects, bias correction for relative humidity and wind has the least significance. Additionally, the findings of Krakovska et al. [
48] mentioned RCMs and that the satellite-observed cloud cover product has the least biases. Therefore, as the present study focuses on climate conditions at ground level, bias-corrected climate variables (temperature, precipitation, and relative humidity) were taken into consideration, with raw climate variables such as cloud cover and wind. The raw data extracted from RCMs for the wind were taken due to limited ground measurements available in Sri Lanka over time.
where
,
,
, and
are the bias-corrected historical precipitation data for the required month from RCM, uncorrected historical precipitation data for the required month from RCM, observed precipitation data, uncorrected historical precipitation data from RCM, monthly mean of observed precipitation and monthly mean of historical precipitation data from RCM, respectively.
where
and
are the bias-corrected future precipitation data for the required month from RCP and uncorrected future precipitation data for the required month from RCP, respectively.
where
,
,
,
,
, and
are the bias-corrected historical temperature data for the required month from RCM, uncorrected historical temperature data for the required month from RCM, observed temperature data, uncorrected historical temperature data from RCM, monthly mean of observed temperature and monthly mean of historical temperature data from RCM, respectively.
where
and
are the bias-corrected future temperature data for the required month from RCP and uncorrected future temperature data for the required month from RCP, respectively.
Based on the climate data obtained from the Department of Meteorology, Sri Lanka, during the 1990–2018 period and remote-sensed data, Sri Lanka had minimum, maximum, and average temperatures of 15 °C, 30 °C and 28 °C, respectively. Meanwhile, the average relative humidity, rainfall, wind speed, and cloud cover are 79%, 2000 mm, 16 km/h, and 70%, respectively.
The bias-corrected monthly temperature, precipitation, and relative humidity data for available gauging stations were spatially distributed with the inverse distance weight (IDW) method in an open-source QGIS environment. The selection of the IDW method among spatial interpolation techniques such as a natural neighbor, Kriging, and spline was conducted with the recommendations of Chen and Liu [
49] and Pingale et al. [
50]. Furthermore, the interpolated IDW products have a fine cell resolution of 0.009°
0.009°. However, wind and cloud cover products are available on a regular grid format (i.e., 0.44°
0.44°). Therefore, in order to generate a common domain to extract data for each climate variable, a 0.25°
0.25° regular grid covering all of Sri Lanka was used.
Equations (5)–(7) explain the holiday climate index for urban environments (
HCIUrban) and for beaches (
HCIBeach) [
12,
16]. The
HCIBeach and
HCIUrban vary within the range of 0–100, giving the physical meaning of being impossible to stay or ideal for tourists.
where
is the thermal comfort rating (can be calculated from Equation (7)), and
and
are relative humidity and temperature (°C), respectively. In addition,
,
, and
are aesthetic rating, precipitation rating, and wind rating, respectively.
The standard rating/practiced values expected for
, and
are given by Rutty et al. [
12] and Scott et al. [
14]. The aesthetic rating (
A) changes with the cloud cover percentage. When cloud cover increases, the aesthetic rating usually decreases for both
HCIBeach and
HCIUrban. However, the highest rating starts at 15% and 11% cloud cover for
HCIBeach and
HCIUrban cases. The rating reaches the lowest at 100% cloud cover. More information on these is showcased in
Table A1 and
Table A2 in the
Appendix A. The authors developed their own Python script to assign a rating in this research. In order to obtain a smooth finish in the spatial distribution of indices, natural neighbor interpolation was performed in the QGIS environment [
51].
HCI values were calculated for historical (2010–2018) and projected years (2021–2050 and 2071–2100) for urban as well as beach destinations. Even though climatic data were available since the 1990s, a common period of 2010–2018 was selected due to the data limitation of tourists. Future-based models were developed for the near-future (2021–2050) and far-future (2071–2100) years.
2.4. HCI and Tourist Arrivals
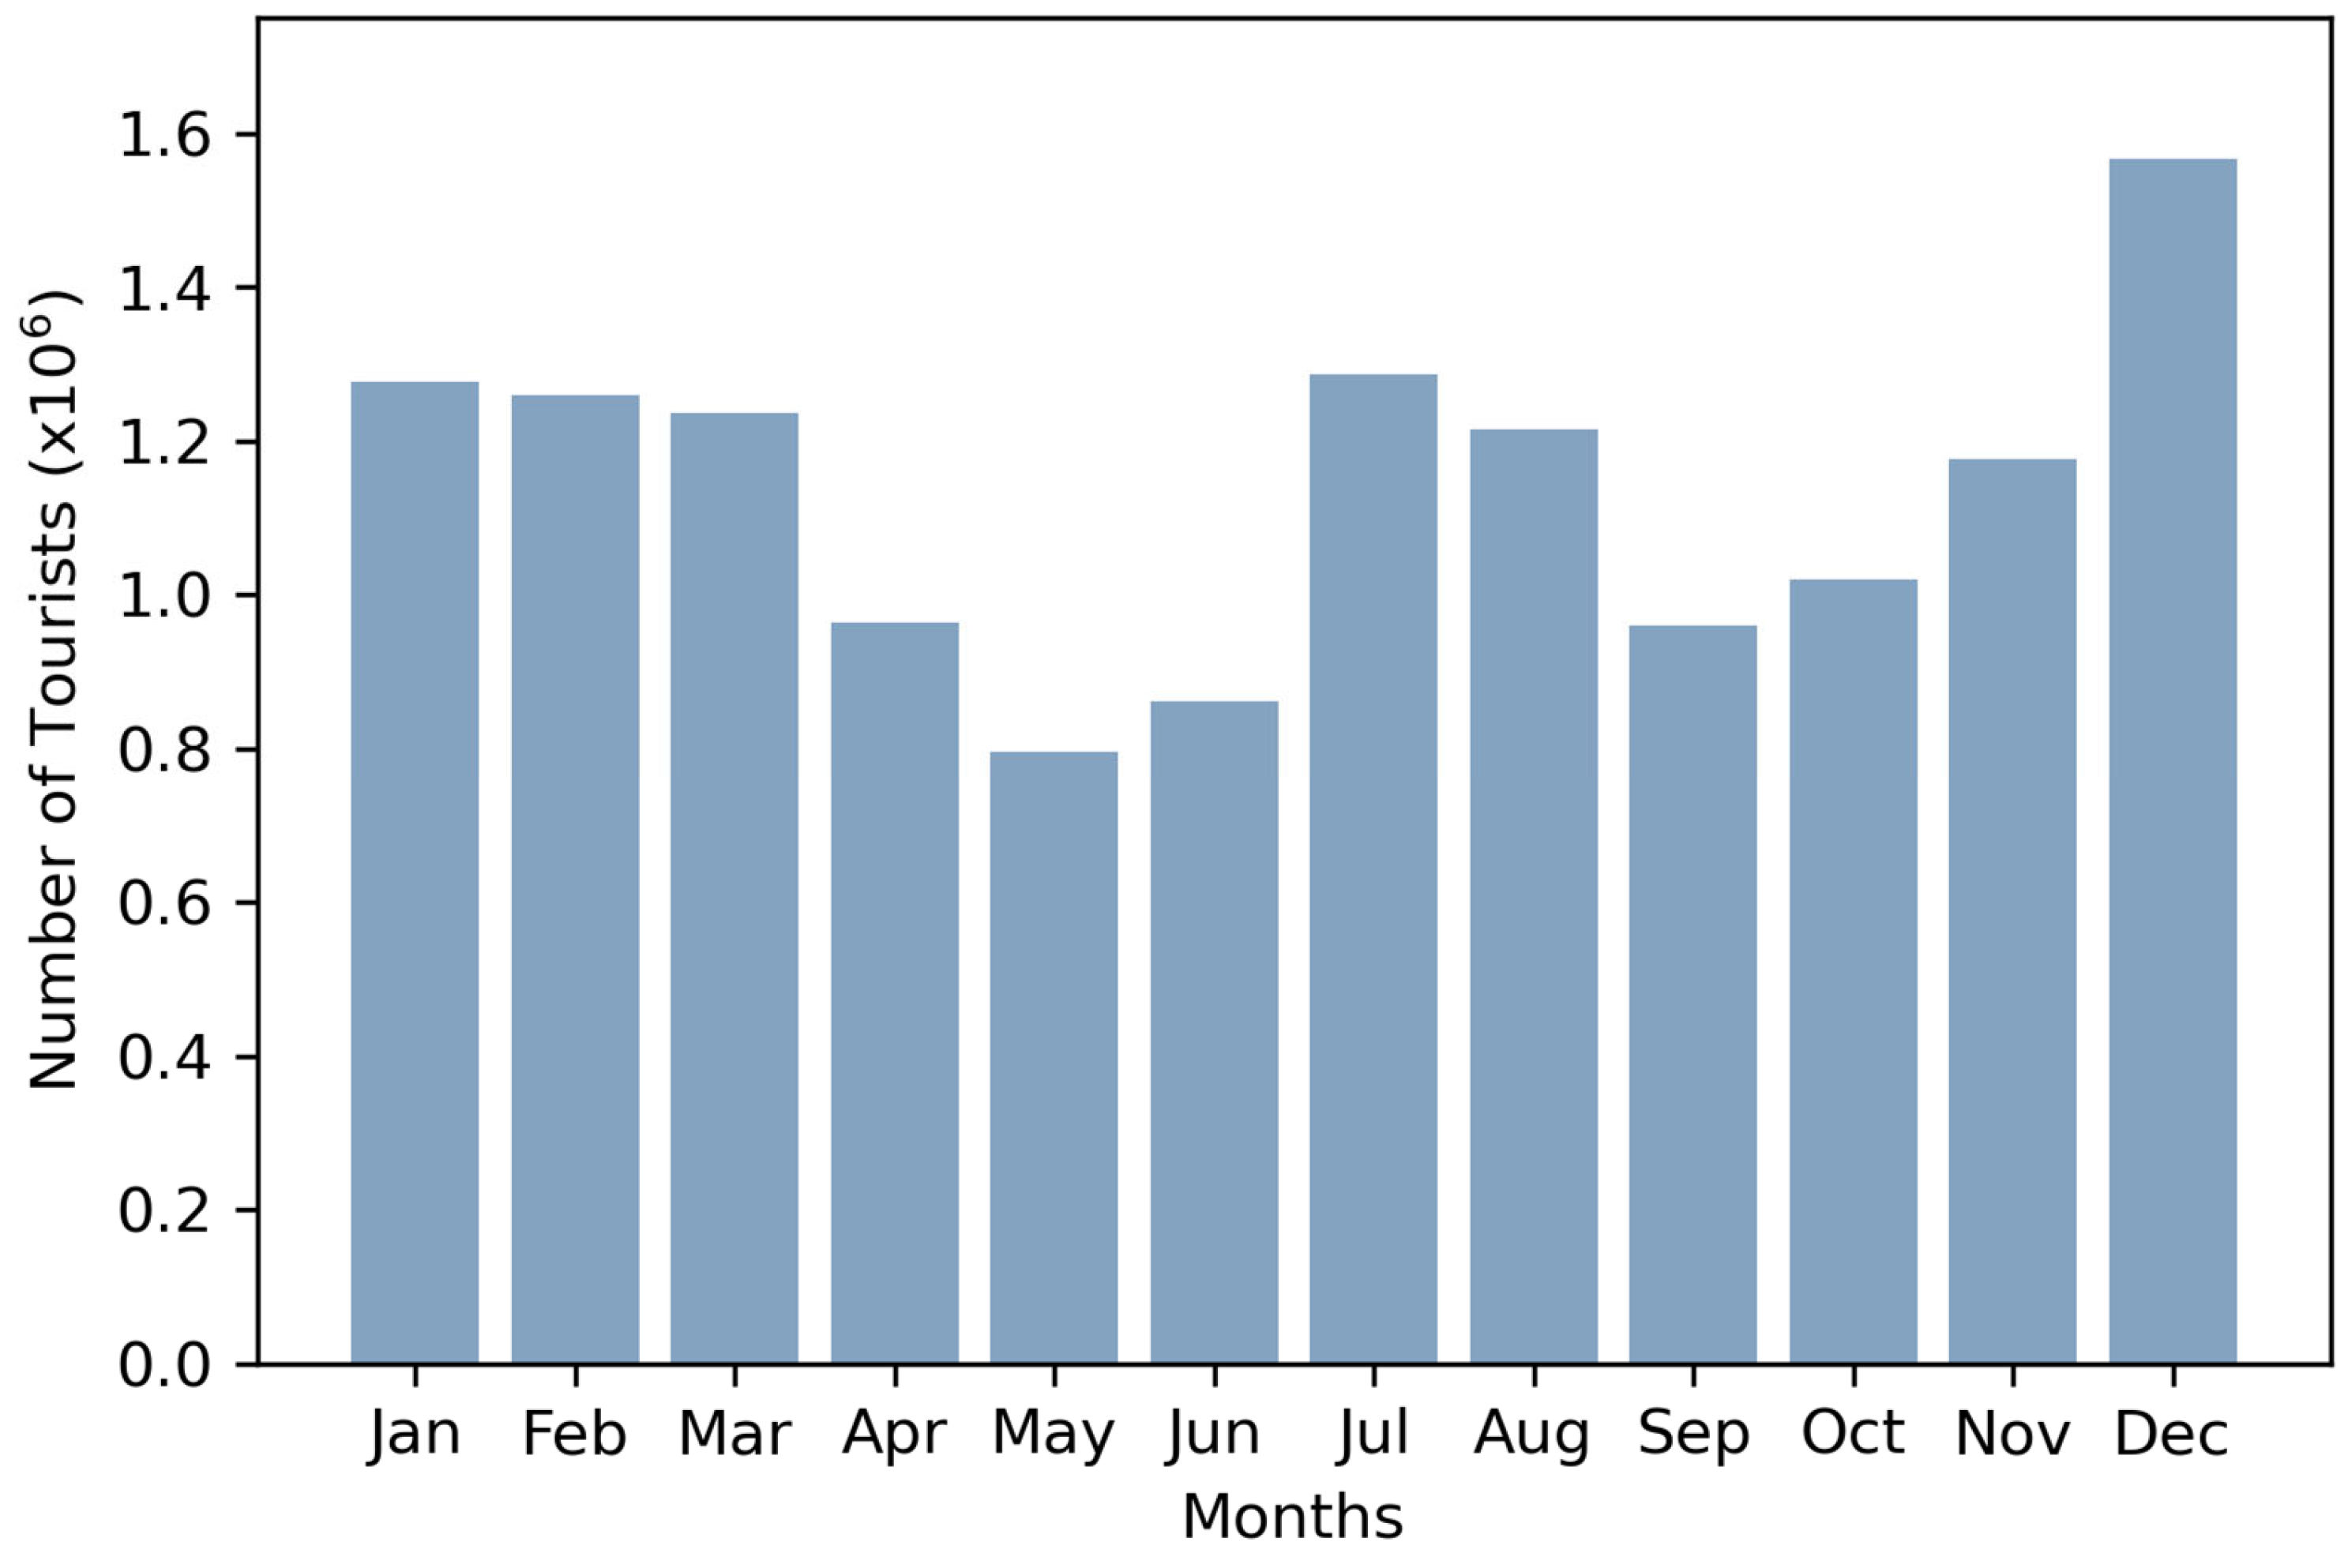
Sri Lanka has become an increasingly popular tourist destination since the end of the three-decades-long civil war in 2009. According to the census and statistics of the STDA in 2018, about 2,333,796 foreign tourists arrived in Sri Lanka.
Figure 2 presents the total tourist arrivals for each month from 2010 to 2018. The maximum number of tourists visited Sri Lanka in December while the minimum was in the months of May and June. The top 10 nationalities visiting Sri Lanka were Indians, Chinese, British, Germans, Australians, French, Maldivians, Americans, Russians, and Dutch.
Therefore, to showcase the relationship between climate variables and tourist arrivals, the authors conducted an analysis based on the staying of foreign tourists within a specific region (i.e., number of tourist bed nights/average days of stay) and tourist (purpose of visit, especially traveling and pleasure) shares by country with the HCIBeach and HCIUrban scores. This was conducted only for observational purposes to enhance the importance of the work and not to devise conclusions based on it.
The correlation between
HCIBeach,
HCIUrban, and tourist arrivals/tourists who stayed in a particular destination in the Sri Lankan context was assessed using the correlation coefficient (shown in Equation (8)). Demiroglu et al. [
1], Scott et al. [
14], and Hasanah et al. [
24] have also accepted the usage of correlation coefficients for these parameters.
where
and
are the variables (i.e.,
HCI values and tourist Arrivals/number of tourists staying in a particular destination) needed to calculate the correlation. Additionally, a zero correlation coefficient (
R) indicates no relationship between the two variables, and
R = 1 or
R = −1 indicates a perfect relationship. The strength can be anywhere between 0 and
[
52].
3. Results and Discussion
3.1. Holiday Climate Index under General Condition
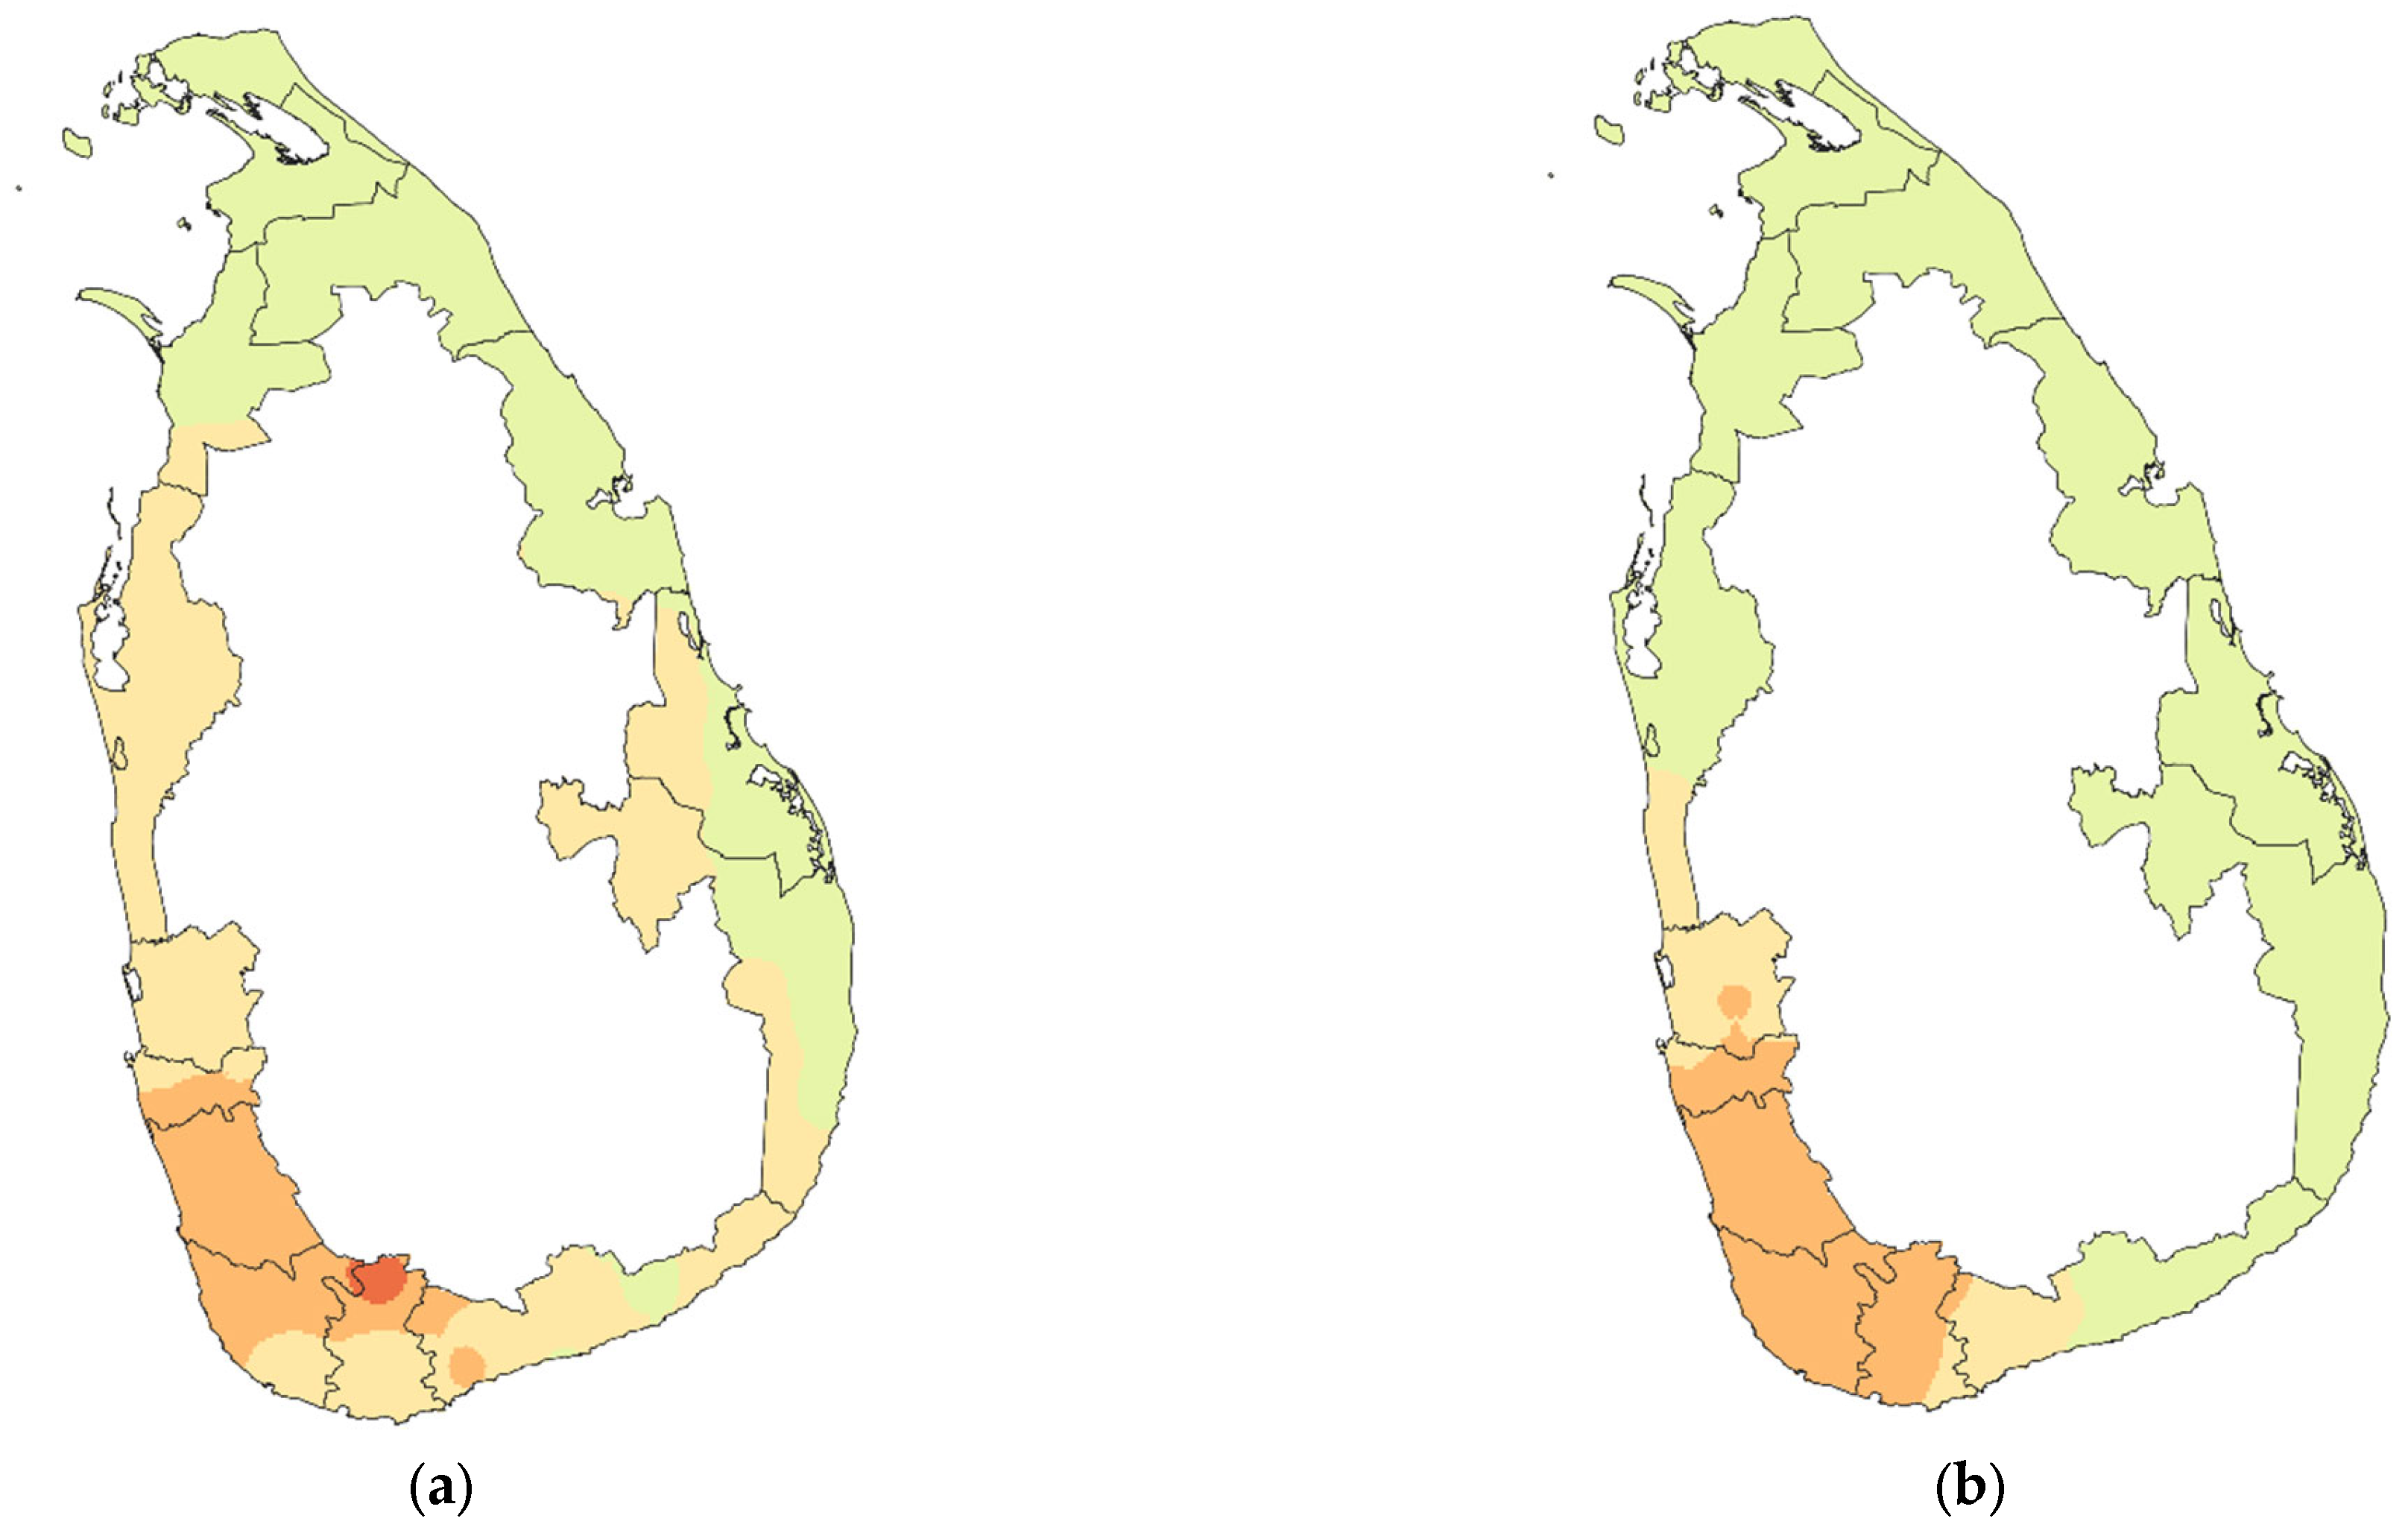
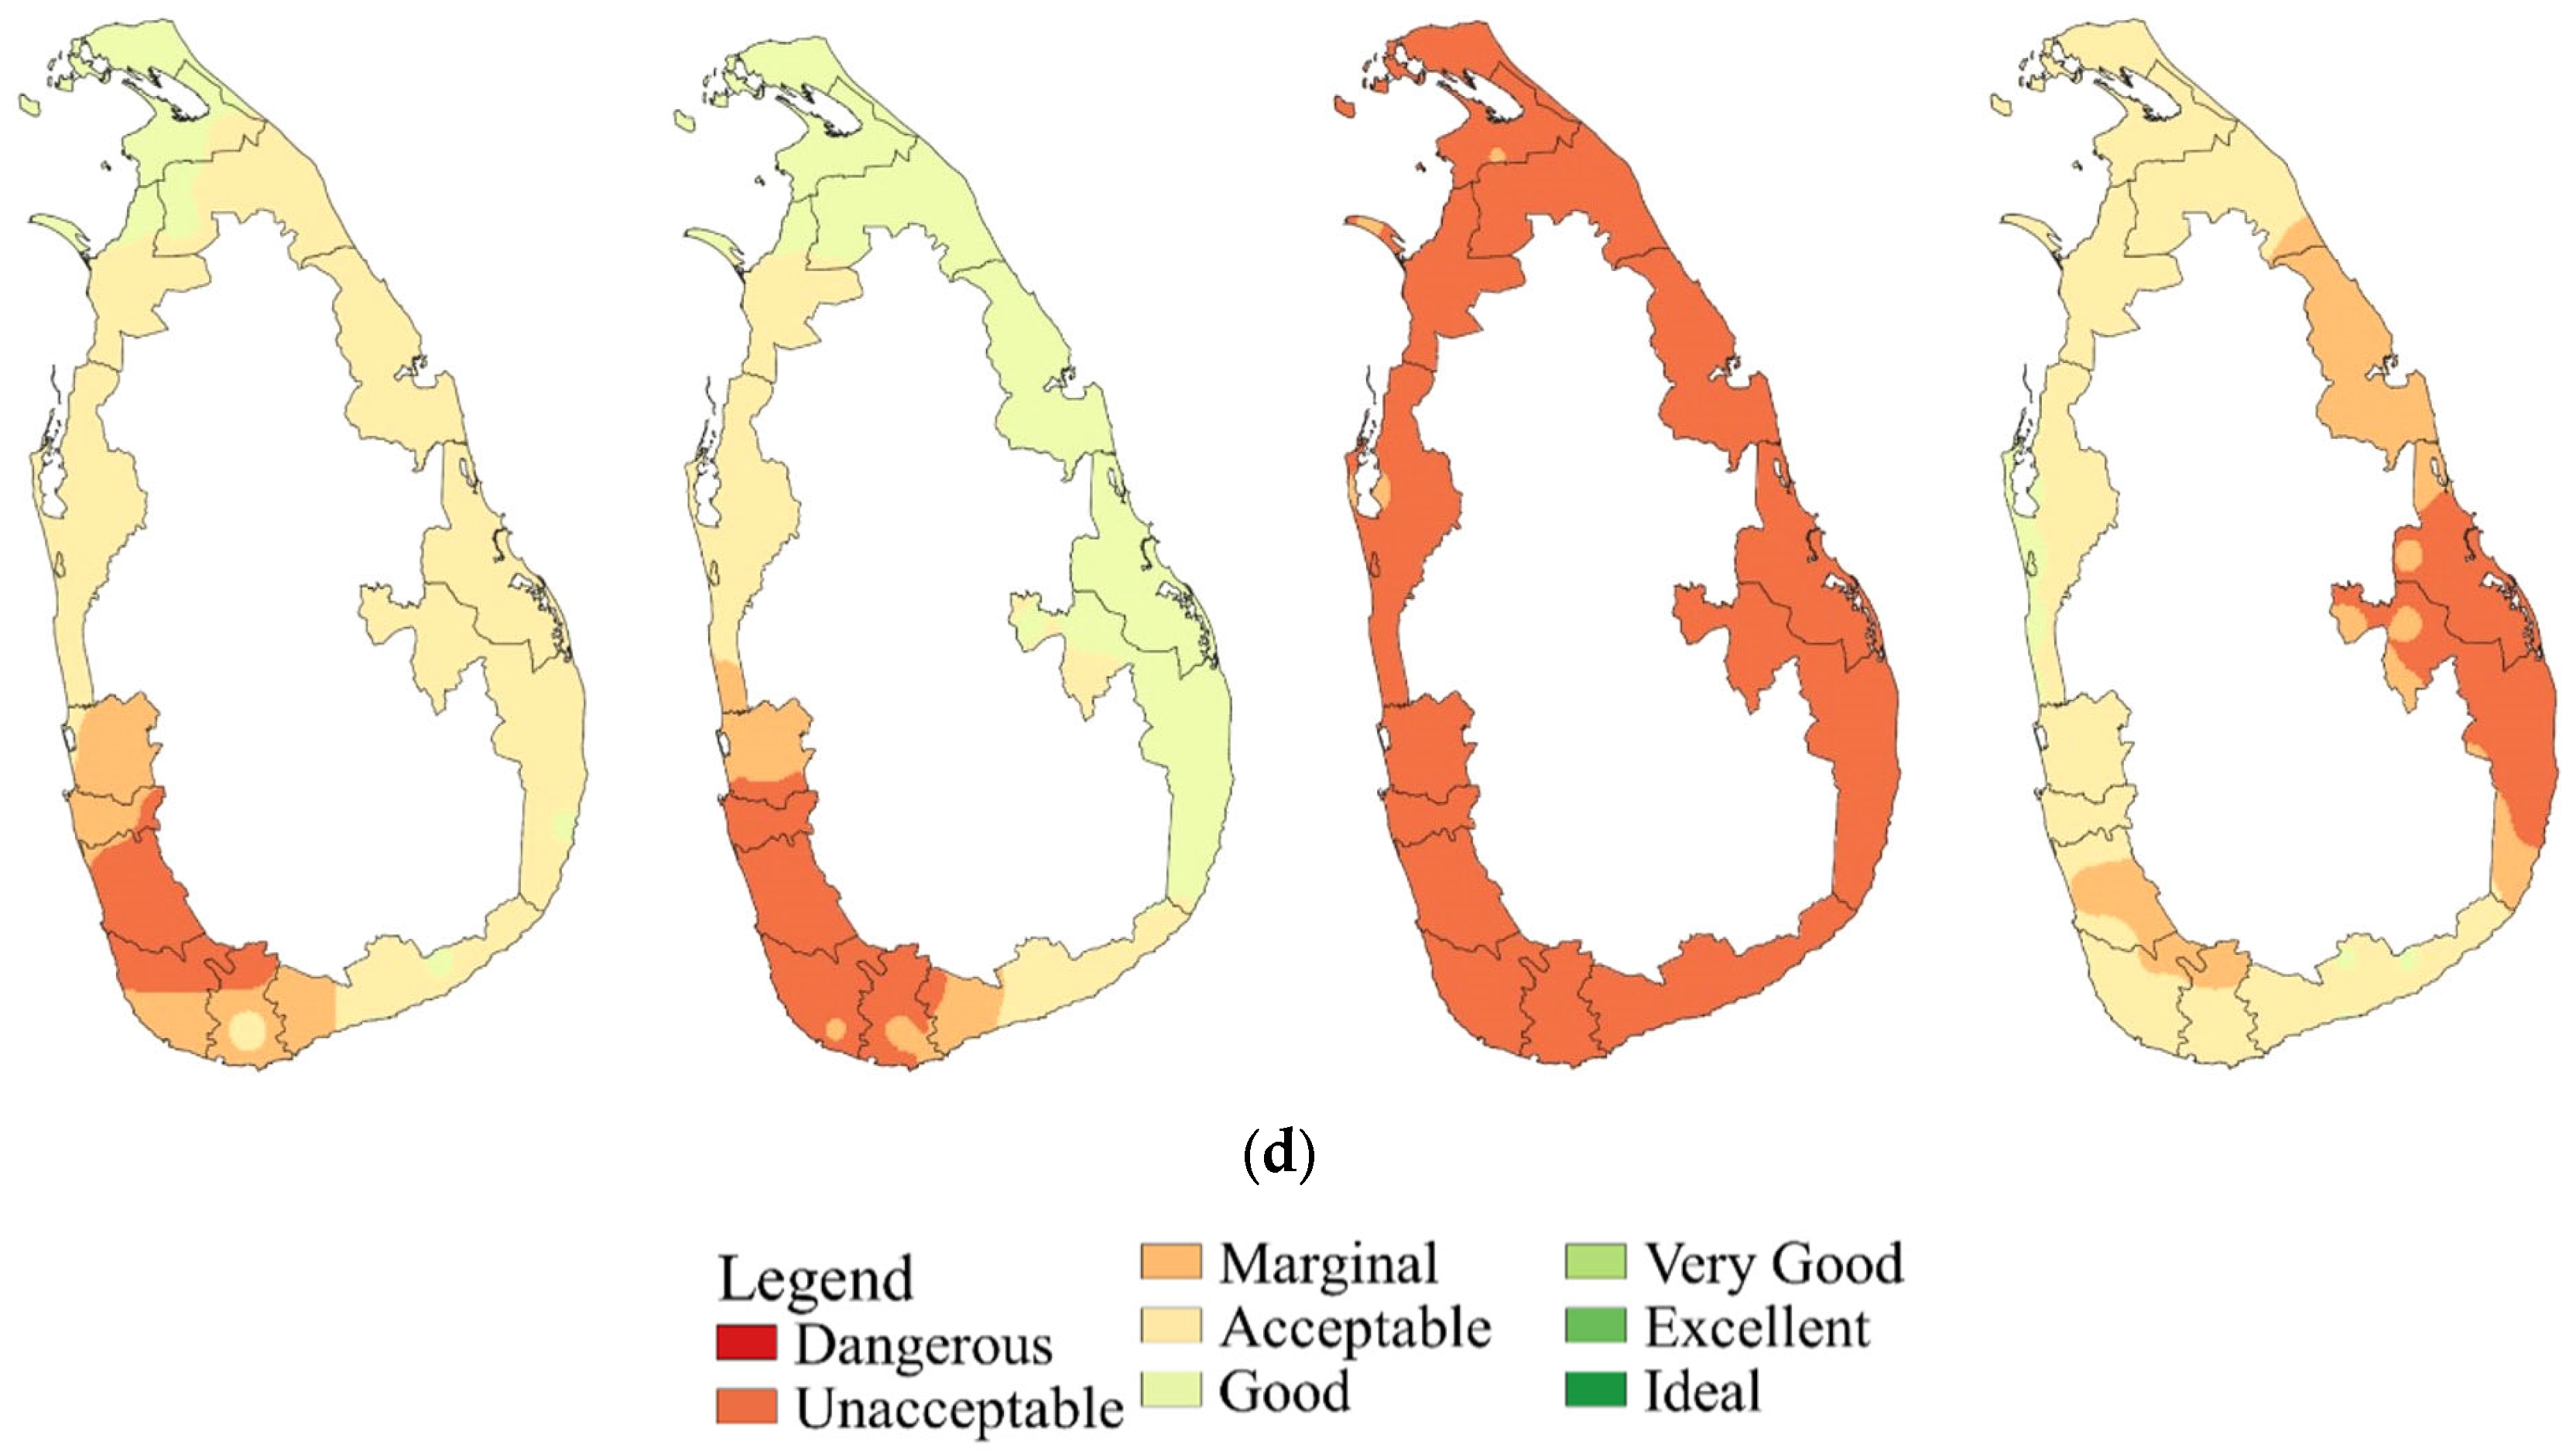
The spatial distribution of
HCI scores obtained for the beach destinations for different monsoonal seasons are shown in
Figure 3 and monthly scores are presented in
Table 1. The scores obtained from the analysis for the western and southern beach destinations reveal that, during the 1st Inter monsoon, Southwest monsoon, and Northeast monsoon,
HCIBeach scores range from 47–57, 45–59, 51–61 (acceptable to marginal), respectively. However, some areas showed some patches of good conditions under the observed climatic data. Nevertheless, during the 2nd Inter monsoon period (October to November) both western and southern coasts showed the least comfortable conditions (i.e., unacceptable to acceptable condition/
HCIBeach score ranging from 40–43) due to high precipitation, relative humidity, wind, and cloud cover. However, the temperature is quite far below the annual peak, although the average maximum temperature is approximately 28 °C.
In addition, HCIBeach scores obtained for the eastern and the northern coasts of Sri Lanka were consistently high compared to both the western and the southern coastal regions. HCIBeach scores for both 1st Inter monsoon and Southwest monsoon period on the northern and eastern coasts range from 58 to 61 and 56 to 61, respectively (i.e., acceptable to good). However, for the Northeast monsoon, HCI scores for both the northern and eastern coastal regions ranged from 44 to 61 (i.e., marginal to acceptable). On the other hand, in the 2nd Inter monsoon period, the condition of the north and east coasts is within the marginal range (i.e., HCIBeach is around 39–50) and the climate condition is below the expectations of the tourists.
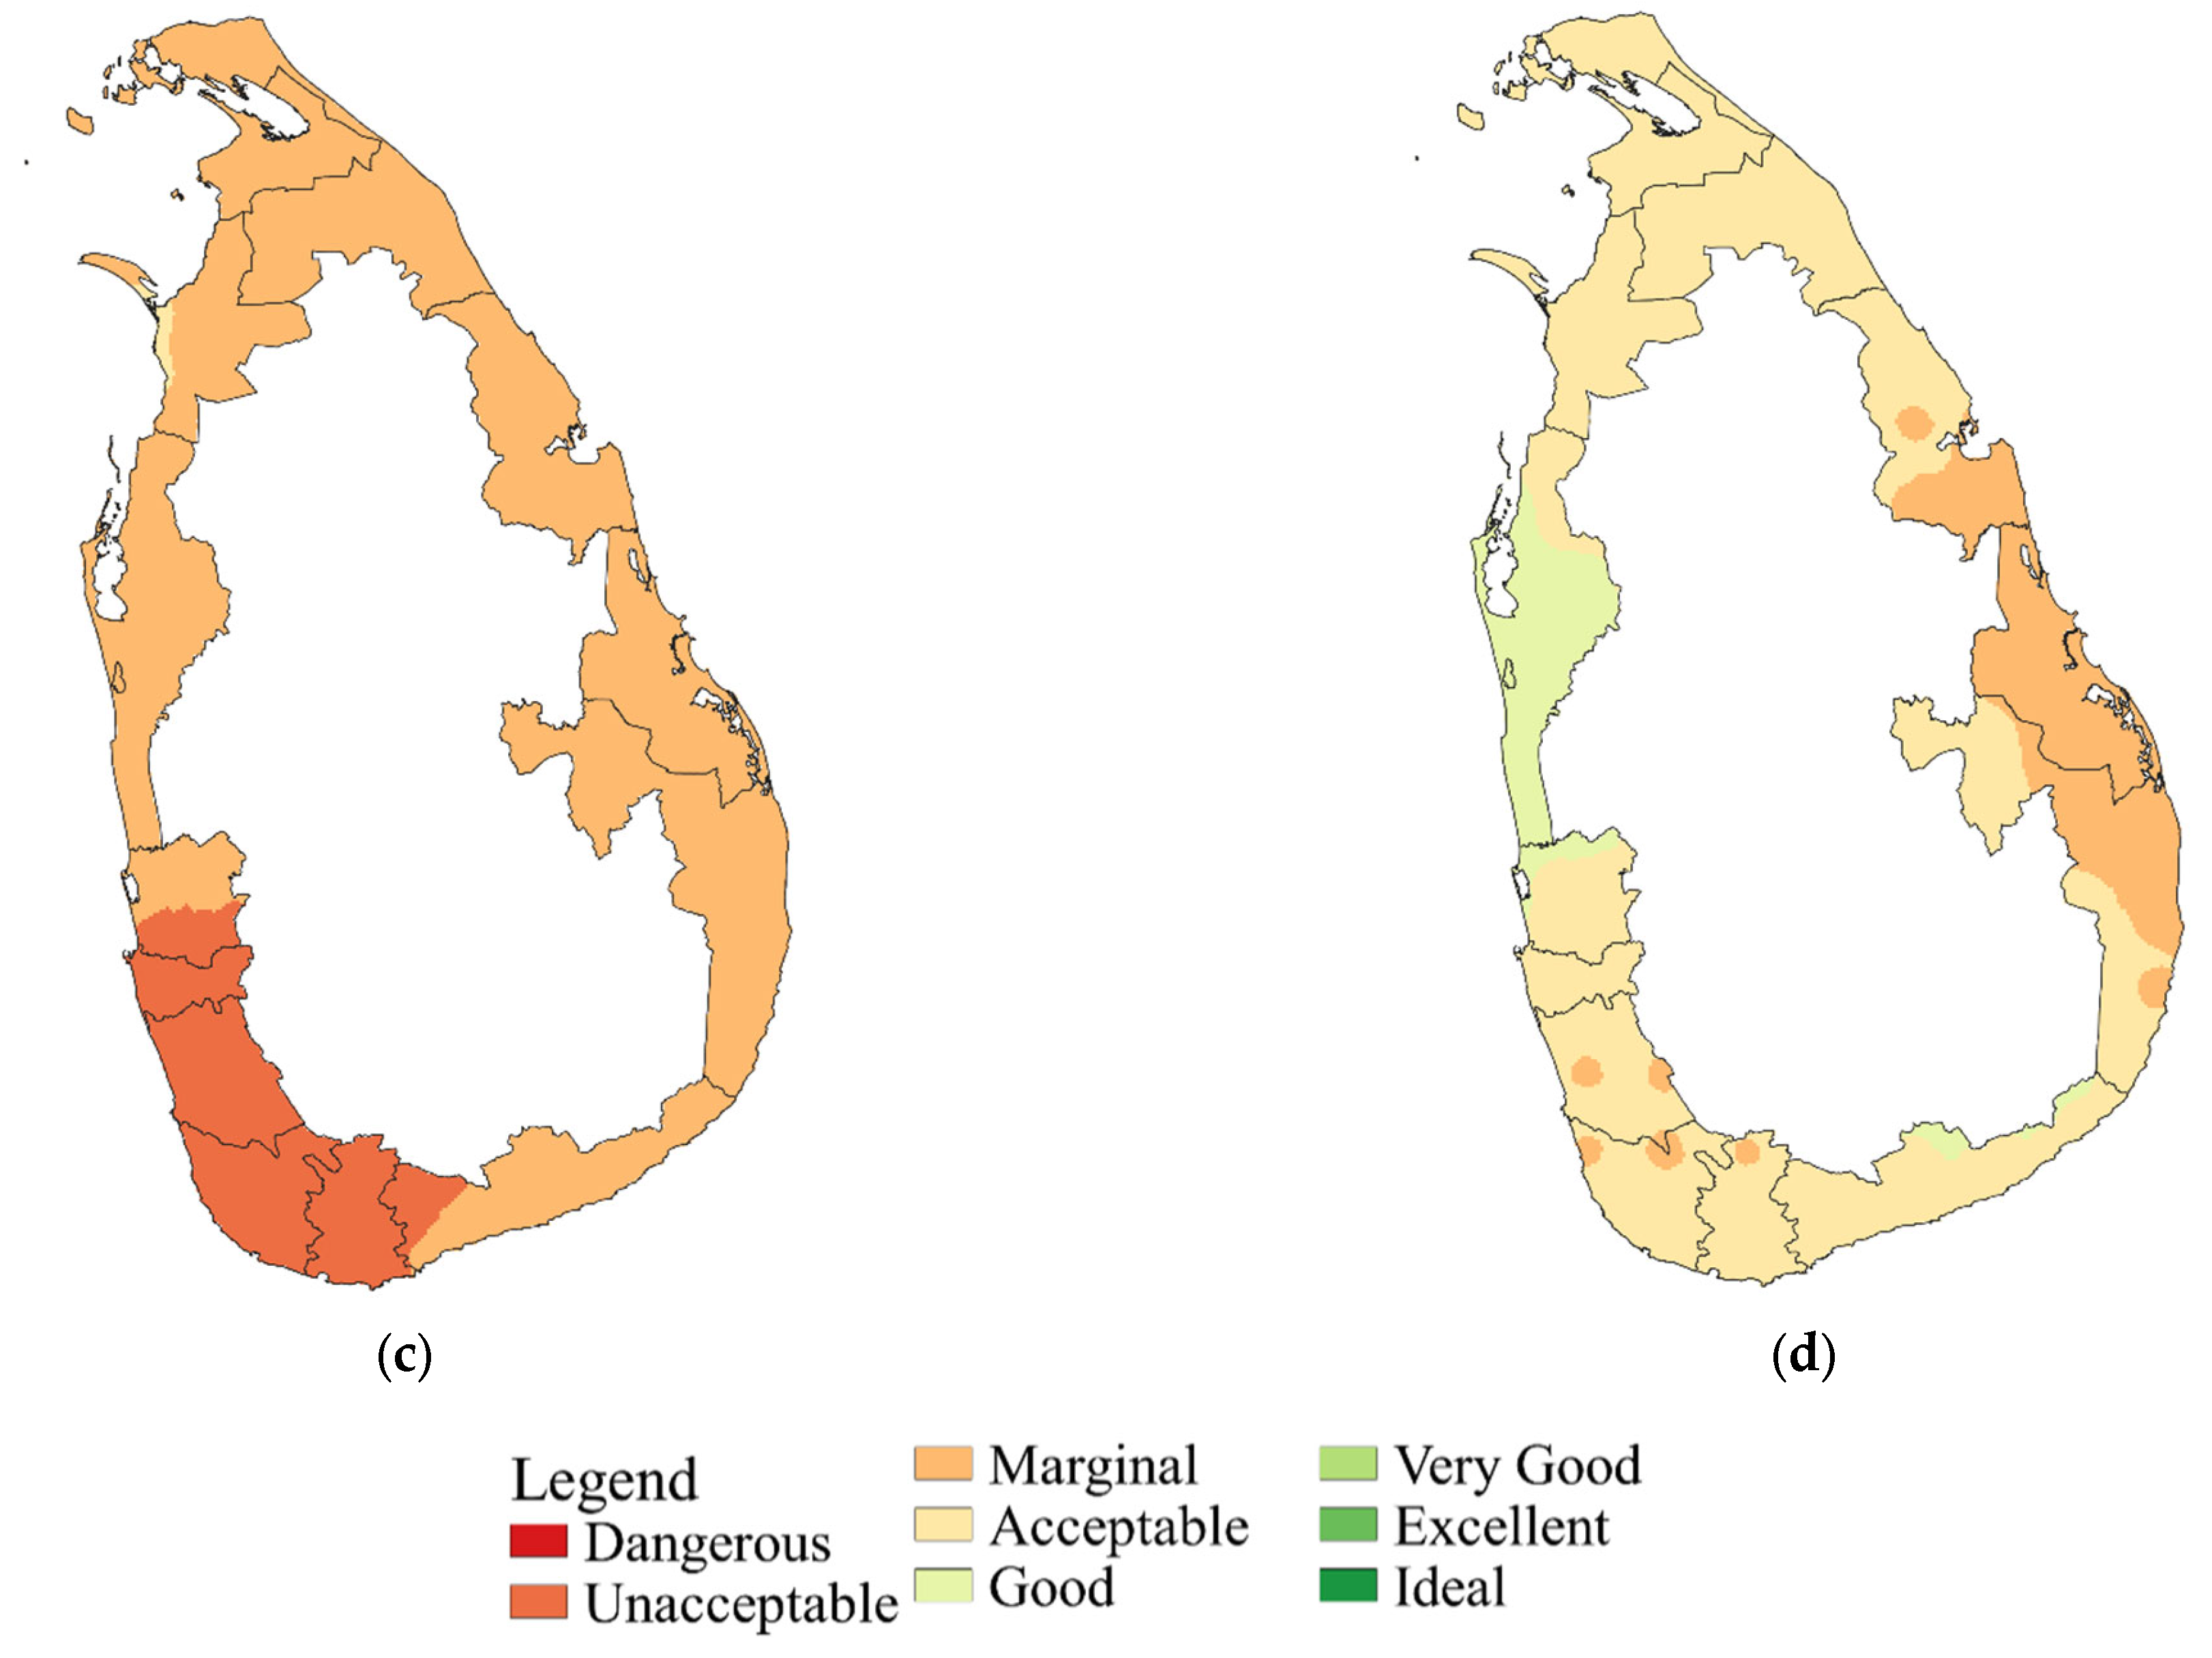
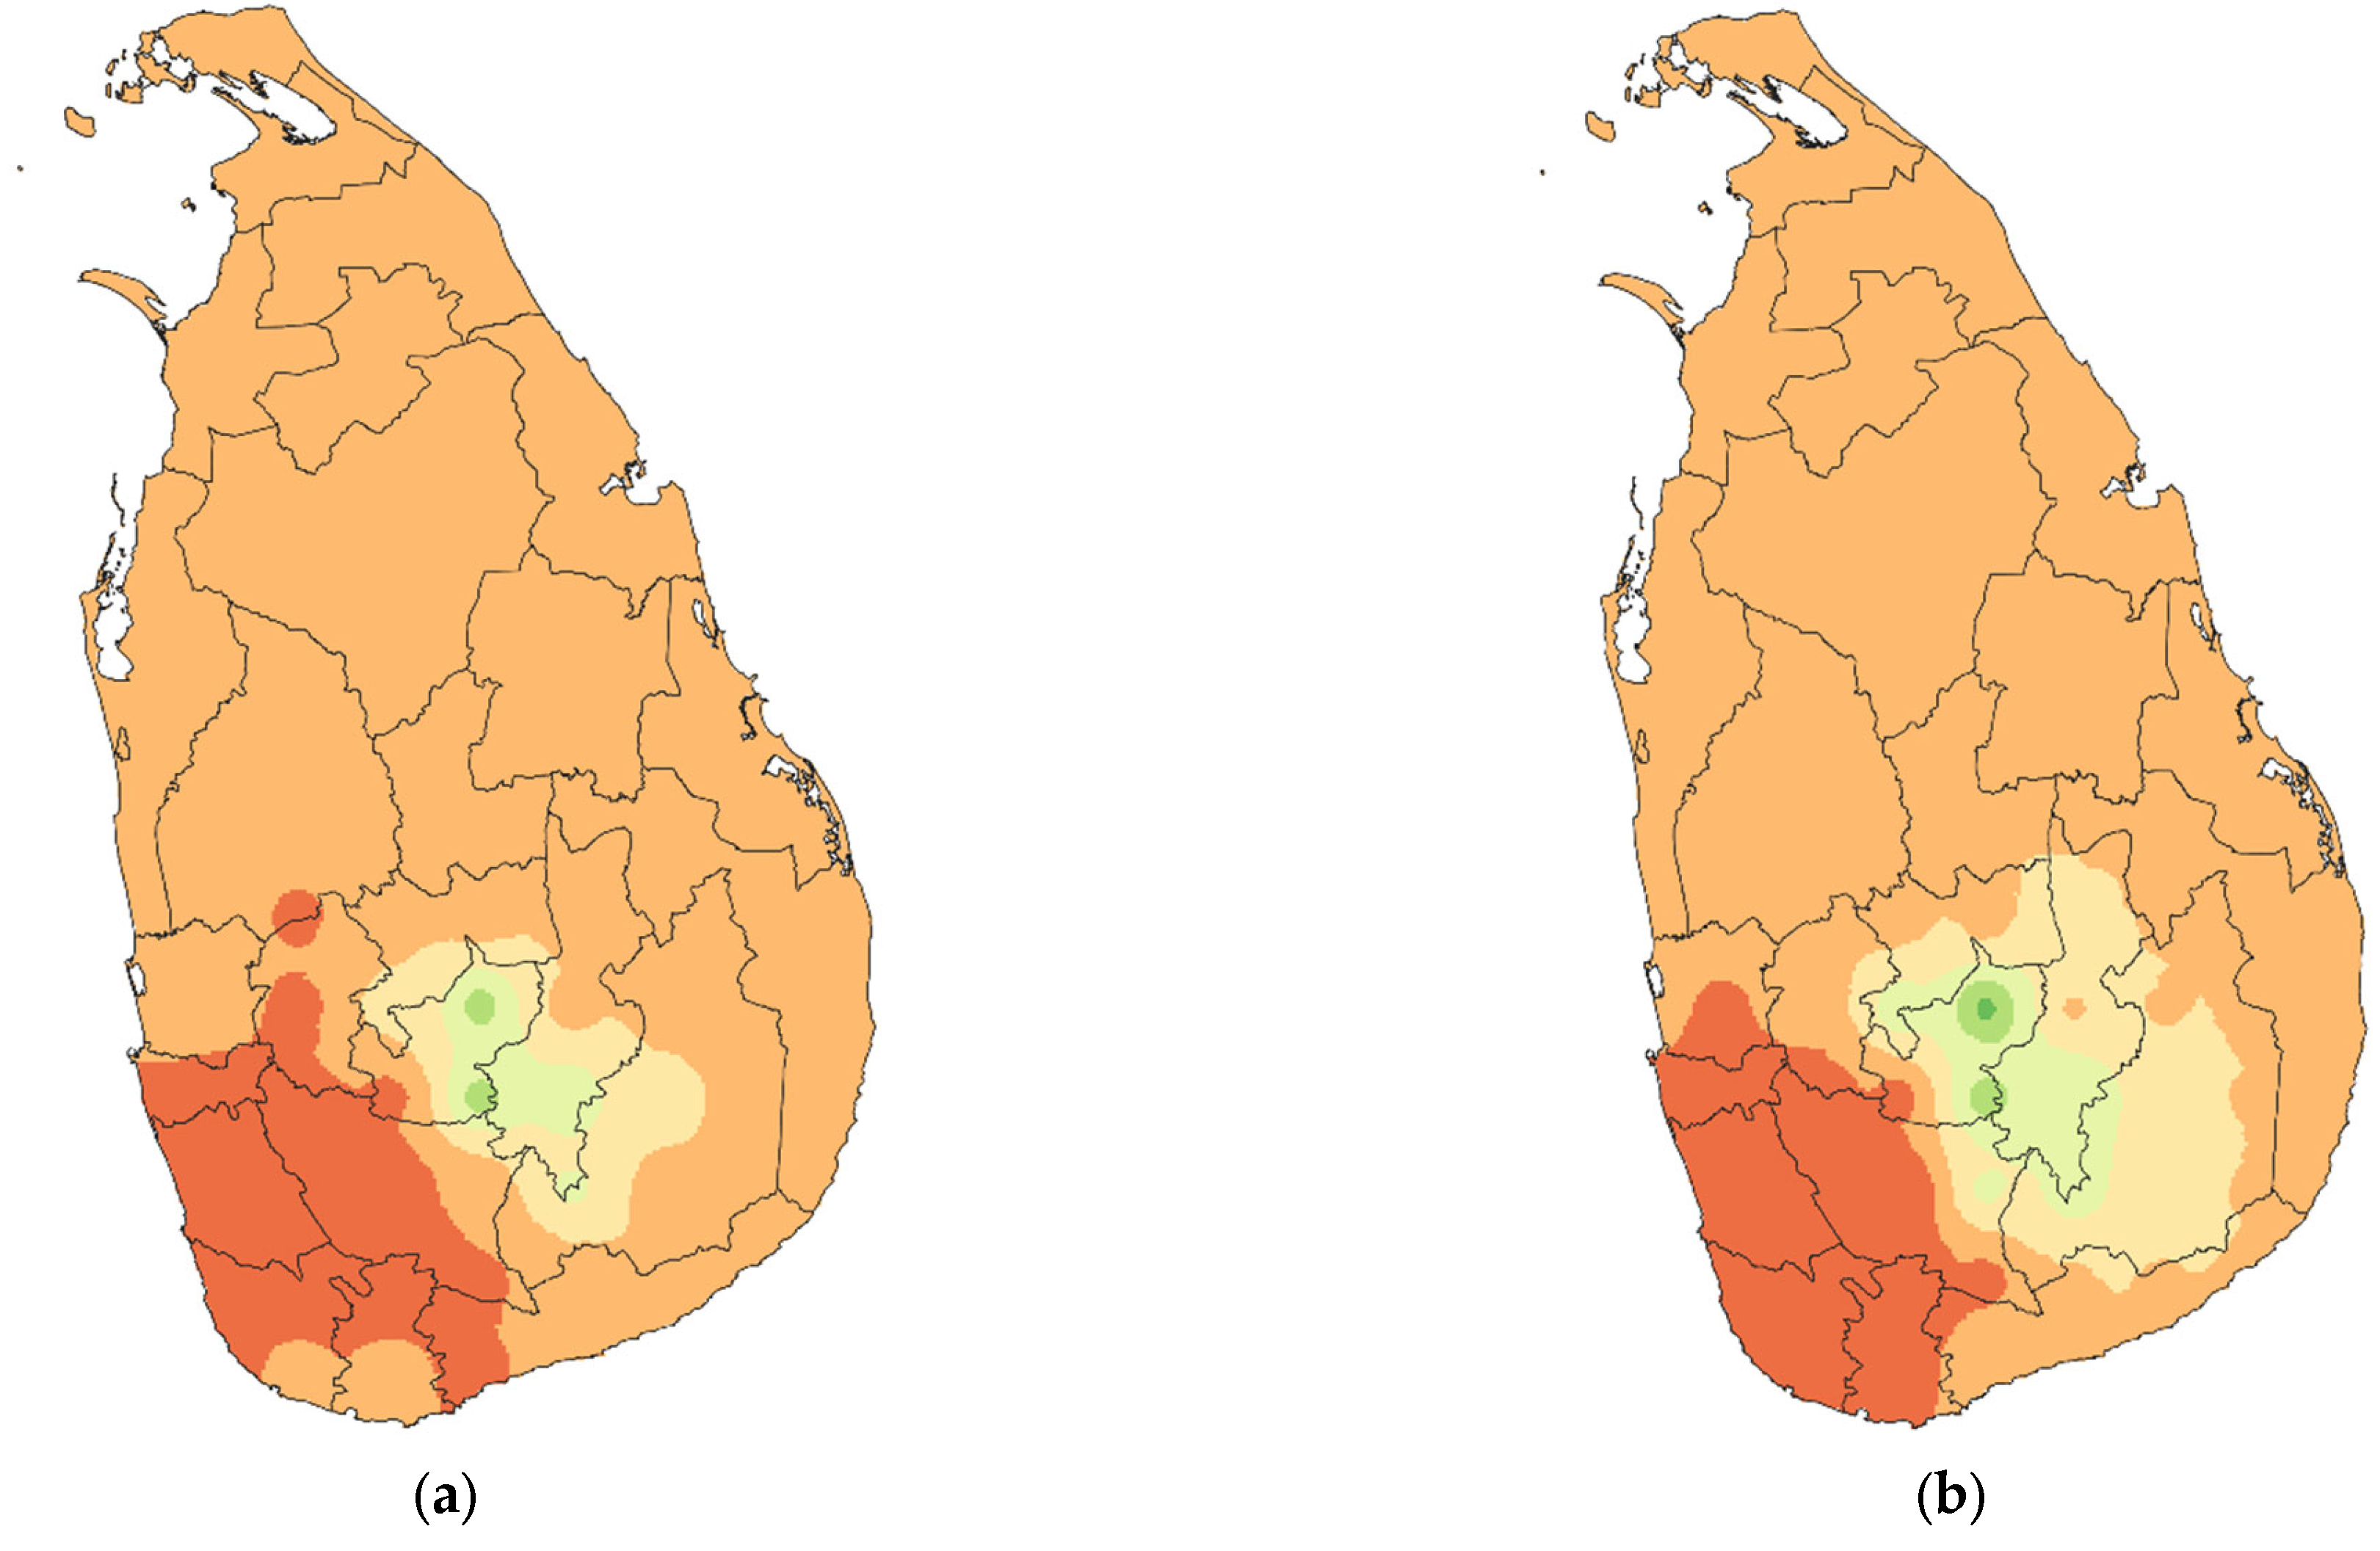
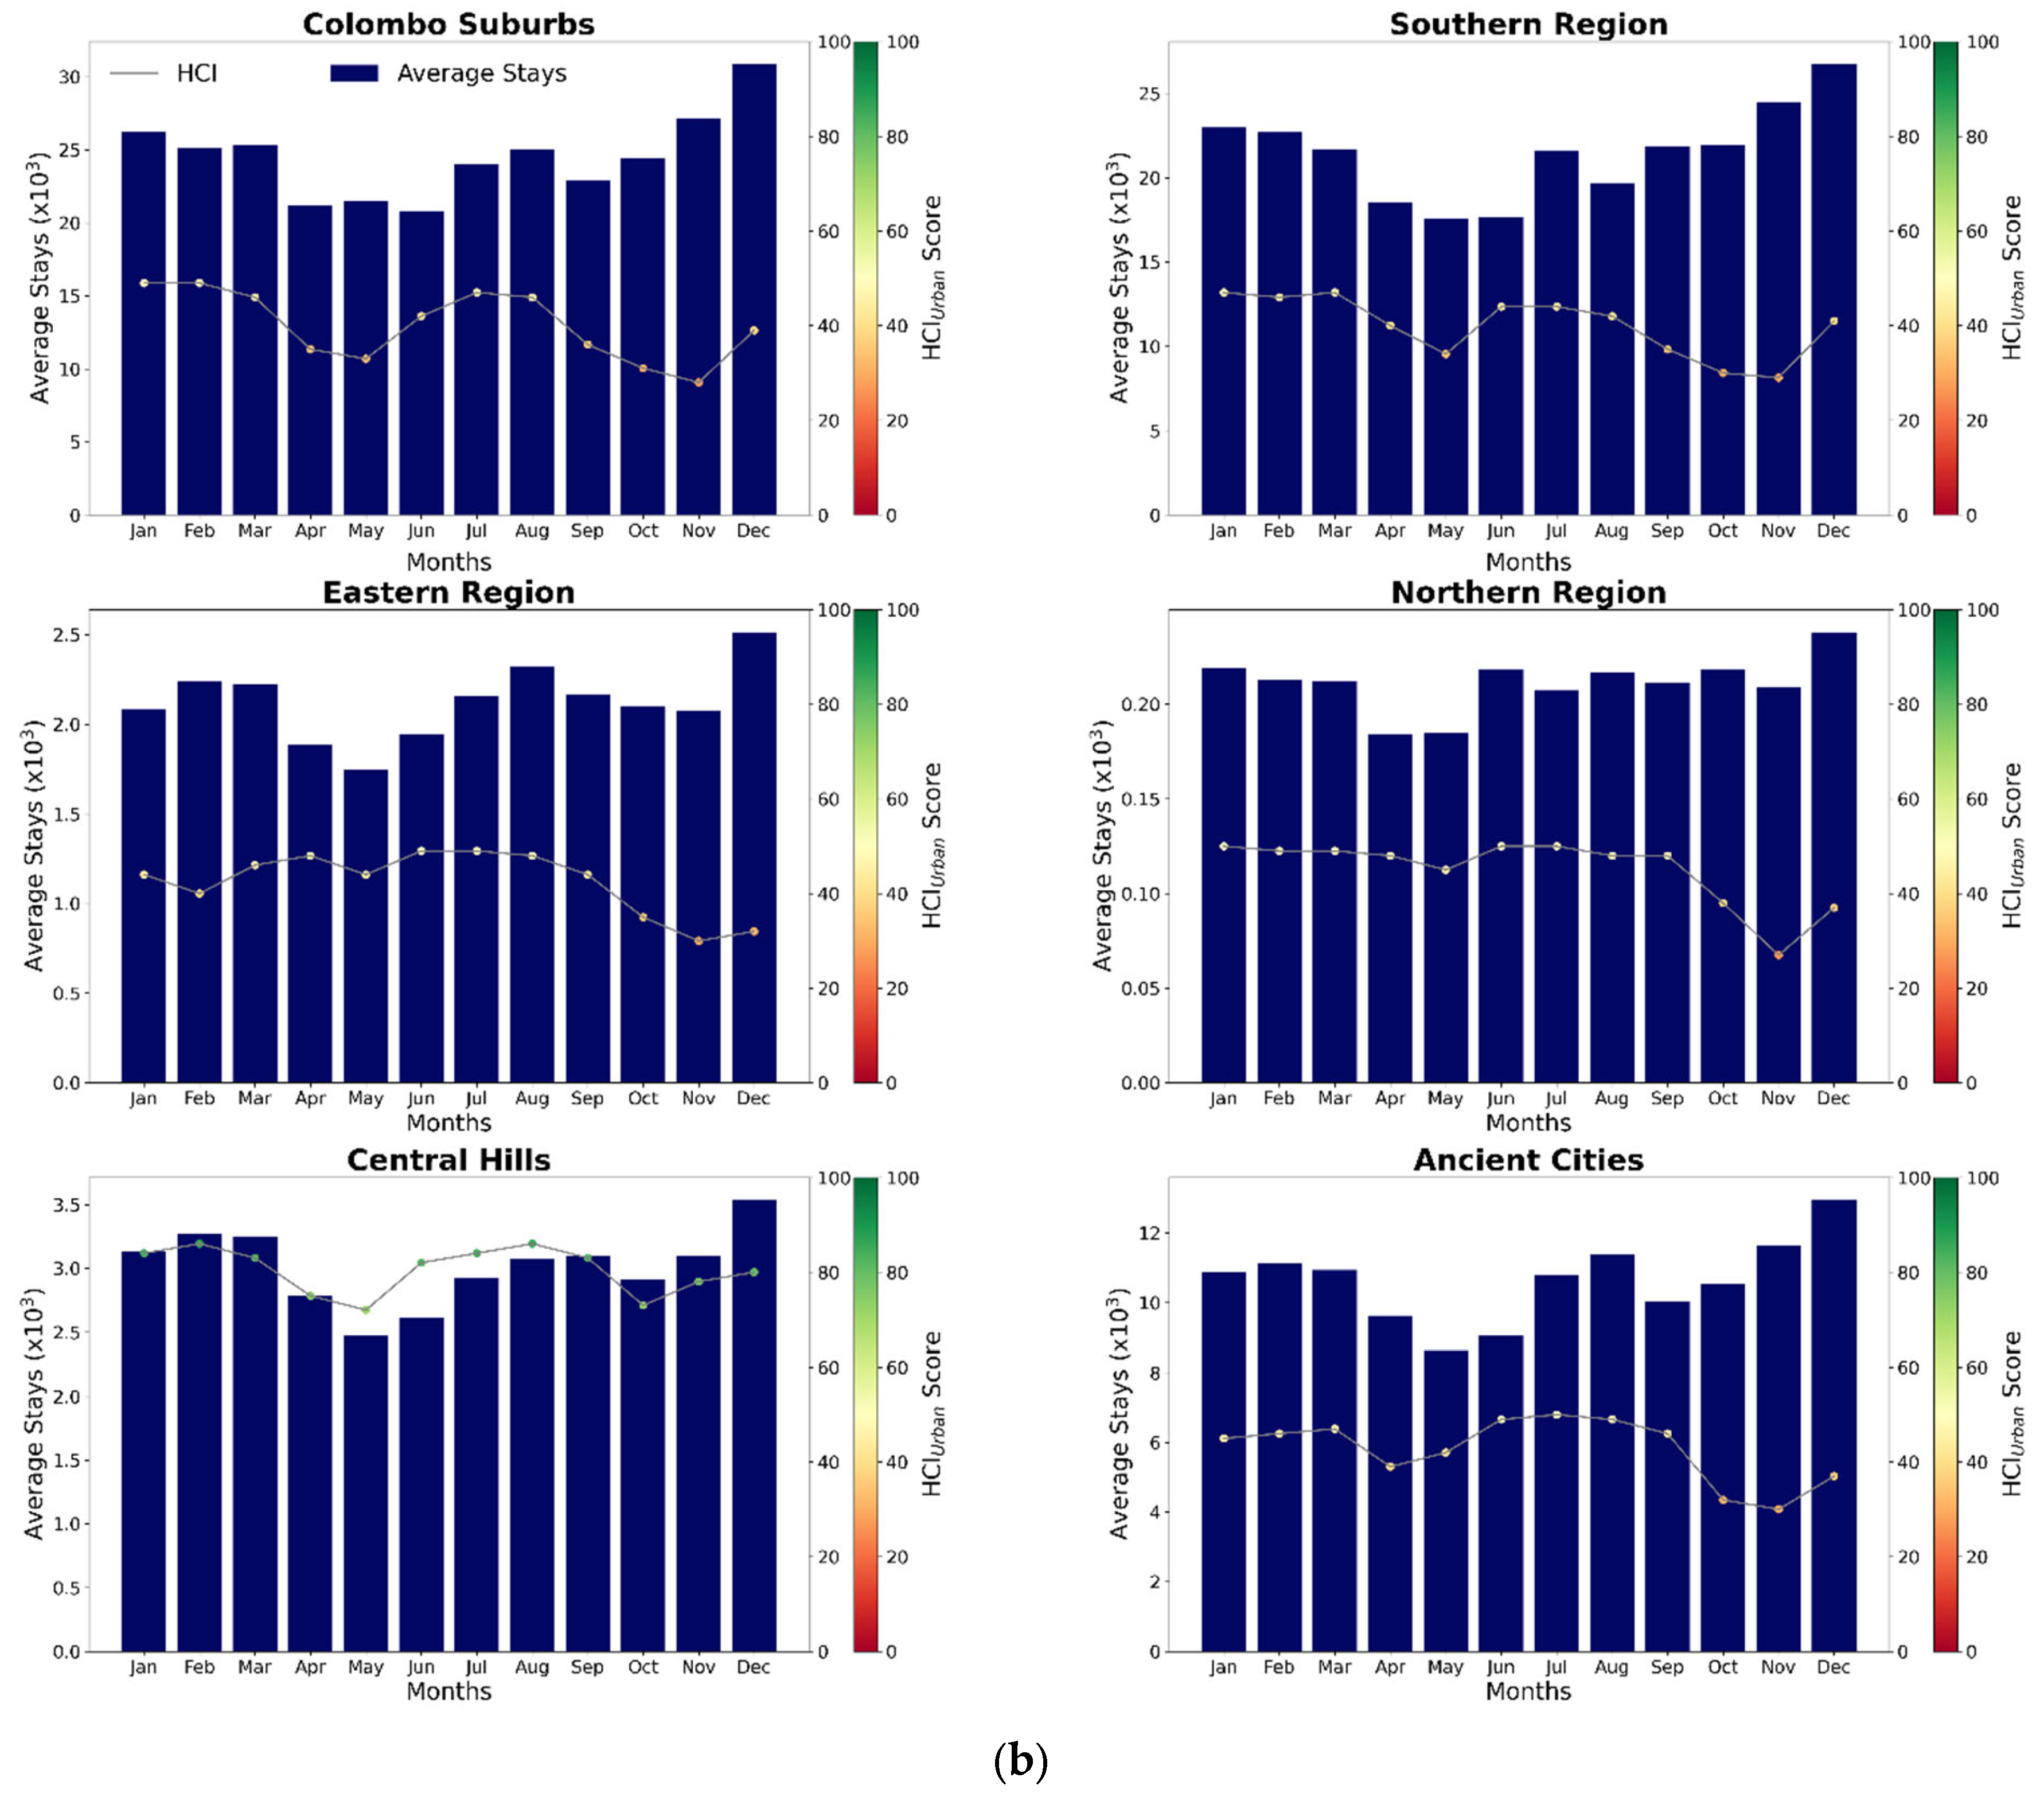
Similar to the beach tourists, Sri Lanka has urban tourists too. During this study, urban tourist destinations were classified into six main regions by the SLTDA, namely Ancient Cities (i.e., Anuradhapura, Polonnaruwa, Kandy, and Kurungegala), Colombo Suburbs (i.e., Colombo and tourist sites), Southern Region (i.e., Galle City, Matara, Hambantota, and Kataragama), Northern Region (Jaffna and tourist destinations), Central Hills (i.e., Nuwara Eliya, Ratnapura, and Ella), and Eastern Region (i.e., Trincomalee and Batticaloa). Based on the analysis conducted on the HCI urban scores, it was revealed that most of the calculated values are very dynamic and ranging from unacceptable to excellent during different monsoonal seasons.
Figure 4 and
Table 2 show the spatial distribution and
HCIUrban values for the considered regions of Sri Lanka. According to the obtained results, only the Central Hills have the comfort level expected by the tourists. The rest of the tourist sites are within the unacceptable to the marginal range. However, out of all the monsoonal seasons, the 2nd inter monsoon period can be considered as the most unacceptable climate condition in all the sites except for the Central Hills. Furthermore, it was observed that usually, in all the monsoonal seasons, Colombo to the Southern region has unacceptable
HCIUrban scores.
3.2. Comparison of HCIs to Toursim Climate Index (TCI)
The tourism climate index (
TCI) developed by Mieczkoski [
13] was also calculated for the whole Sri Lanka for the period of 2010 to 2018. More information on the formulations and interpretations of the
TCI can be found in Mieczkoski [
13].
Figure 5 showcases the obtained
TCI maps for the four seasons.
Similarities can be found between
HCIUrban (refer to
Figure 4) and
TCI (refer to
Figure 5). Favorable tourist scenarios can be found in the Central Hills during the 1st and 2nd Inter monsoon from both indices. A closer relationship can also be found in Southwest monsoon maps. However, contrasting scenarios can be observed in the Northeast monsoon maps for
HCIBeach or
HCIUrban and
TCI. The eastern side of Sri Lanka showcases contrasting behaviors for these two indices during the Northeast monsoon where the eastern area is under the rainy weather conditions. Nevertheless, the
HCI maps were developed for future climatic scenarios. However, as the uncertainty level of
TCI is comparatively high due to the unavailability of long-term daily data covering all of Sri Lanka, the daily comfort index (CIA) and daytime comfort index (CID) required for determining
TCI were estimated in order to comply with Mieczkoski’s [
13] technique.
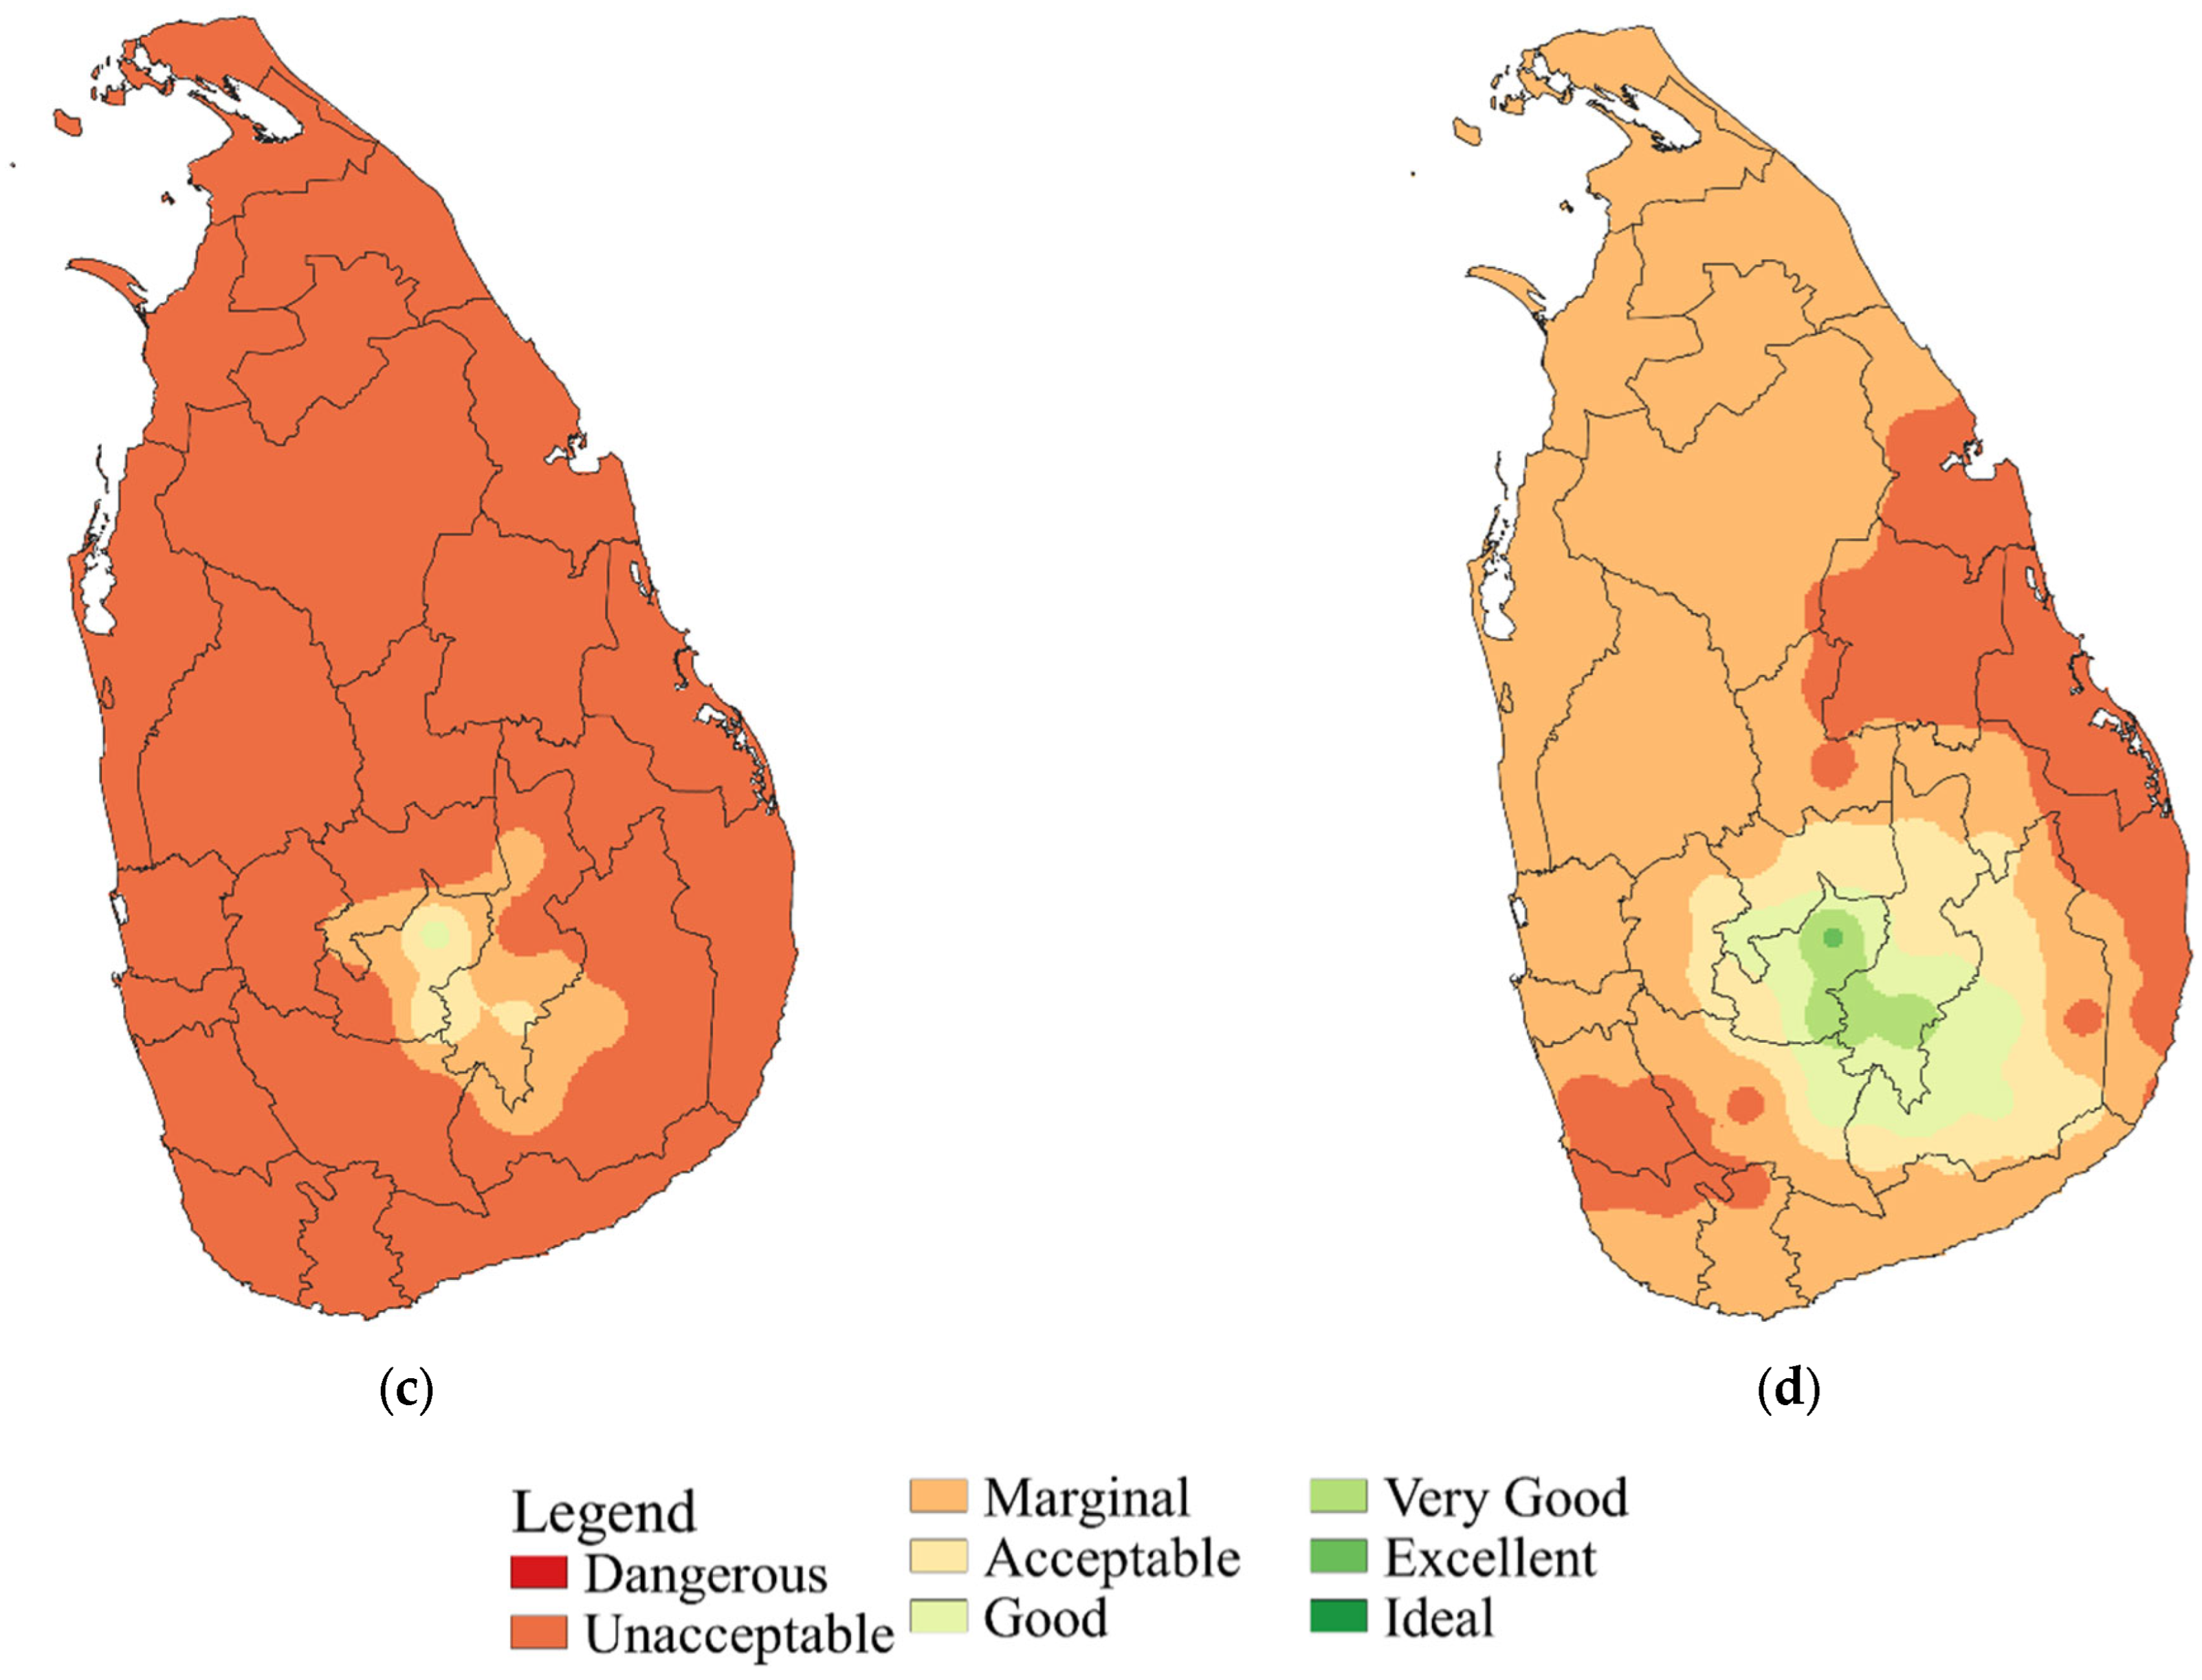
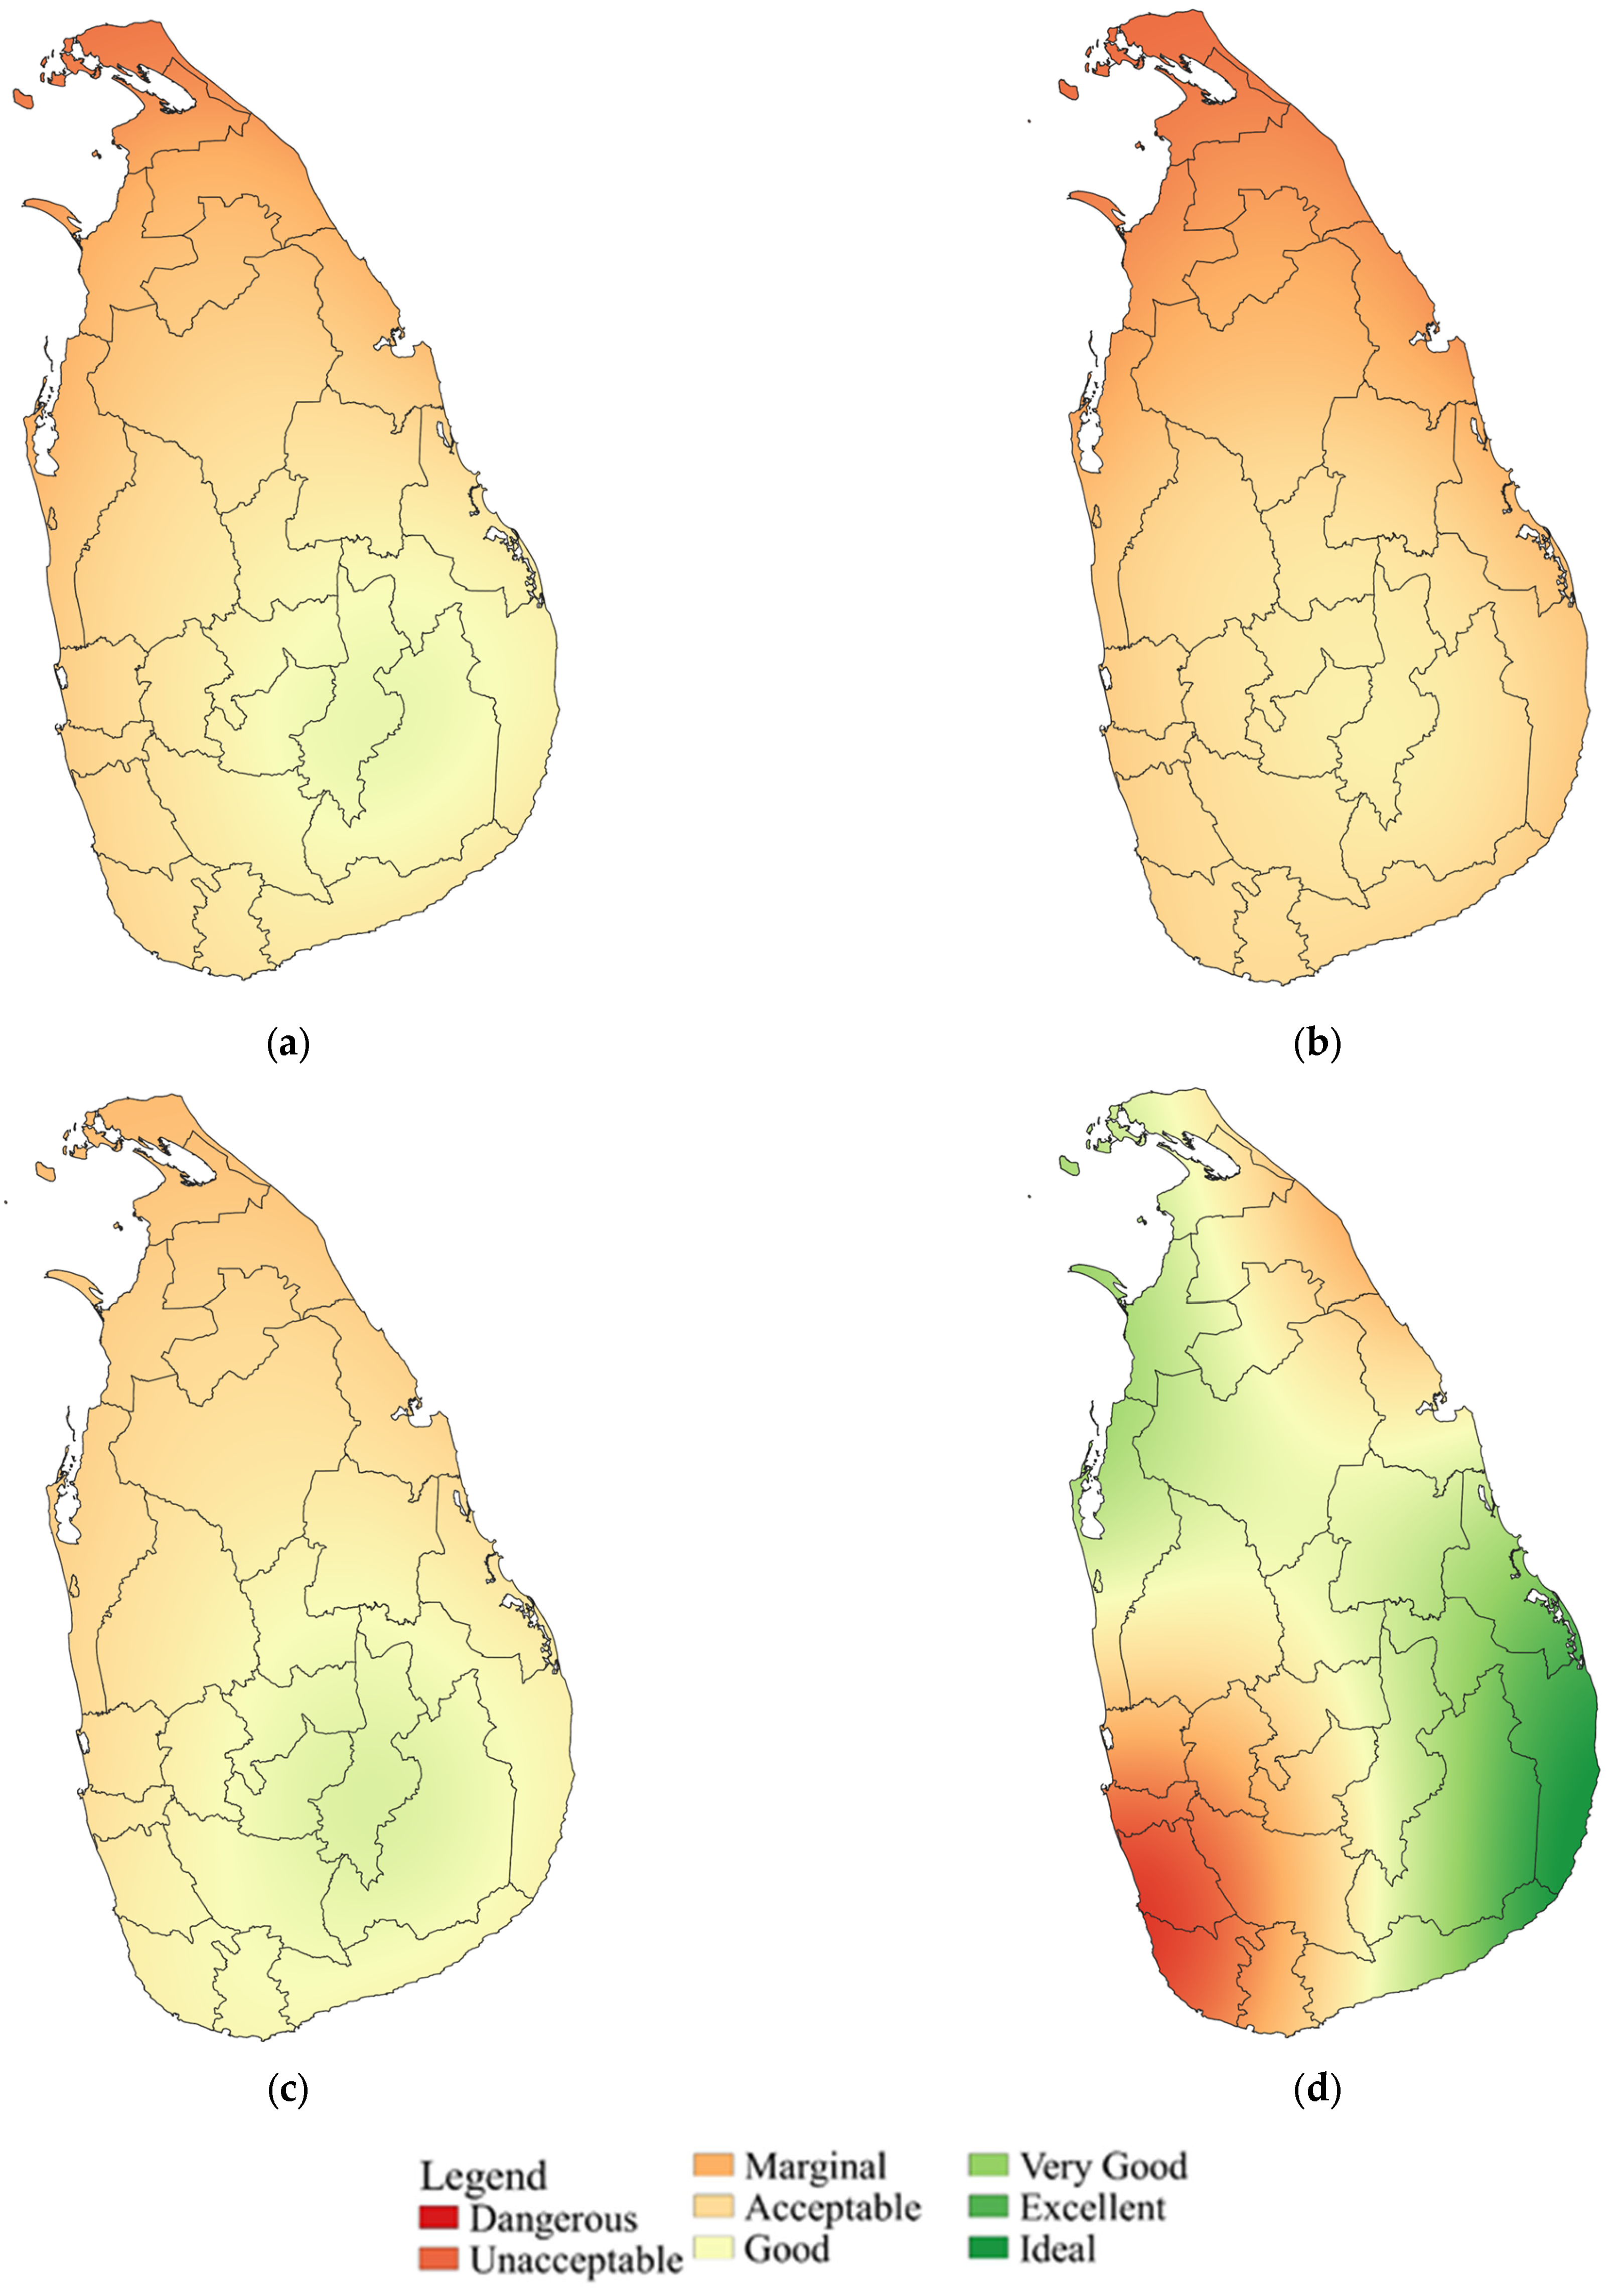
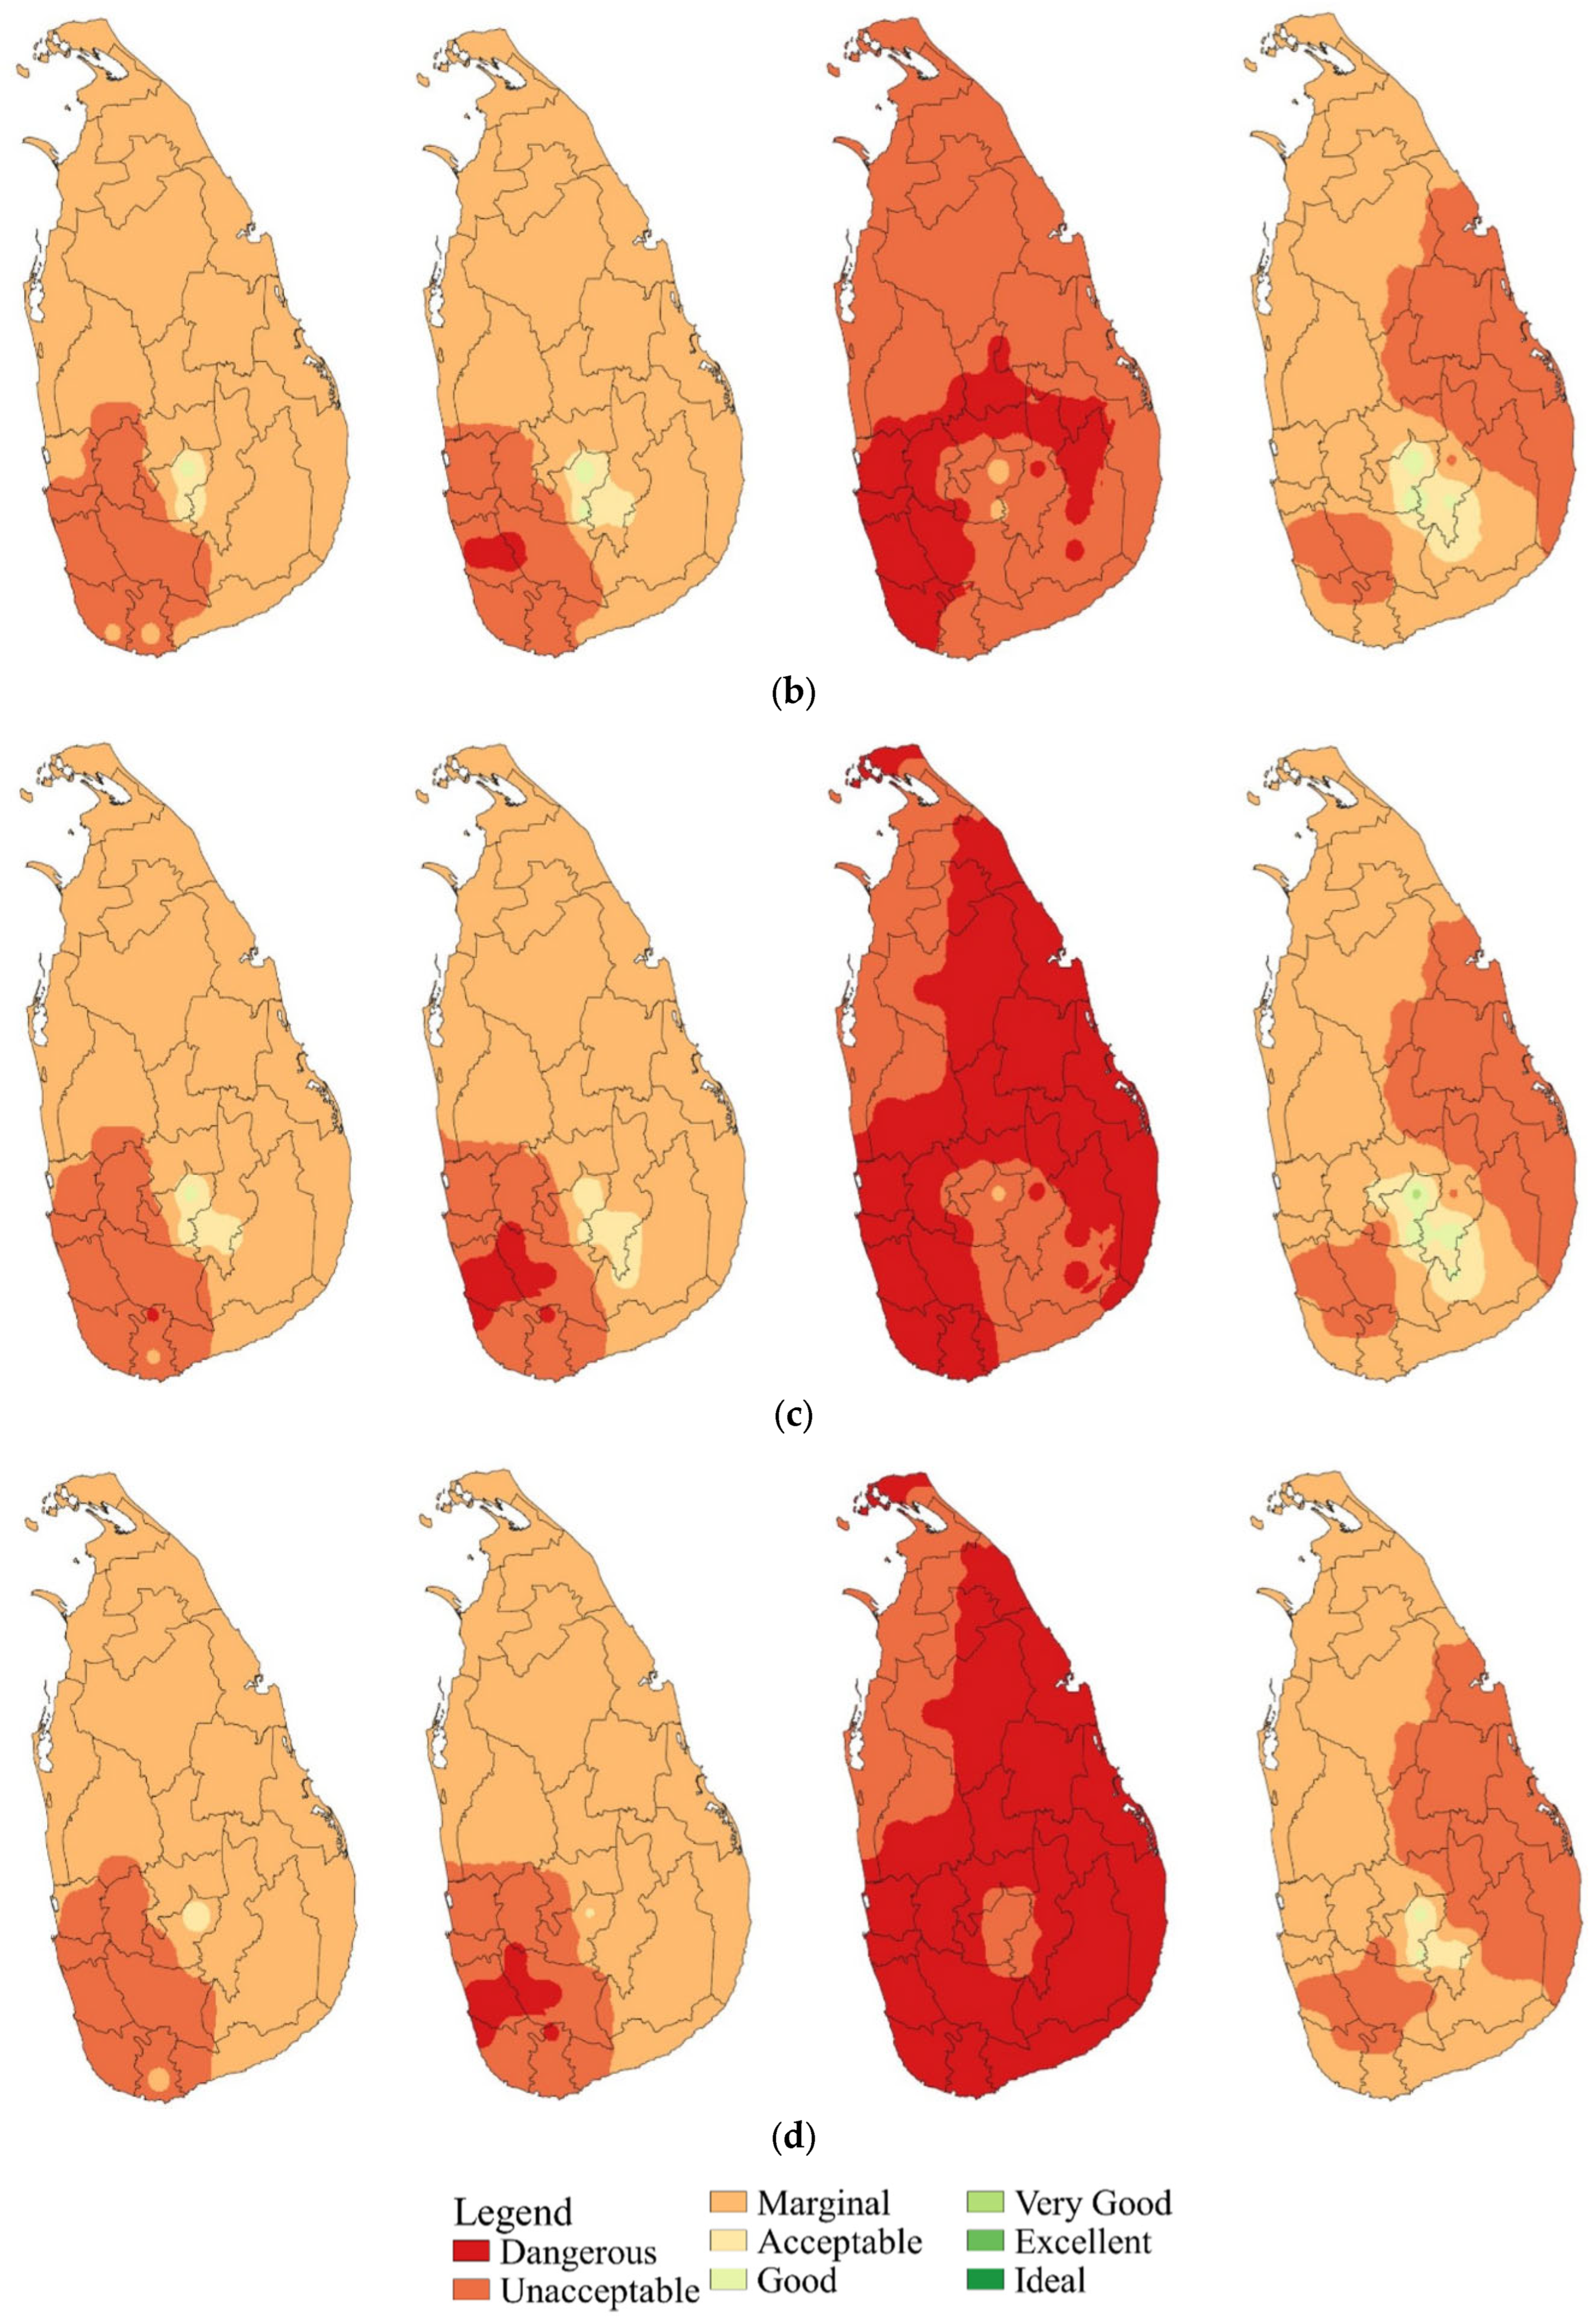
3.3. Climate Projections and HCI
The influence of climate change on both urban and beach tourist destinations is yet to be discovered in the Sri Lankan context. The projections with the RCP4.5 and RCP8.5 scenarios showed an increase in temperature and decrease in precipitation for many of the regions of Sri Lanka. The analysis was carried out for two sets of 30 years under seasonal climates (2021–2050 and 2071–2100). The generated maps are shown in
Figure 6 and
Figure 7. Seasonal variation in the
HCIBeach and
HCIUrban can be clearly seen from these figures.
Based on the analysis conducted with reference to 2021–2050 and 2071–2100 on beach destinations, it is observed that the HCIBeach scores for most of the beach destinations under RCP8.5 increased during the 1st Inter monsoon and Northeast monsoon period compared to RCP4.5. Though, in general, the conditions are still within unacceptable ranges. The HCIBeach scores of both the western and southern coasts increased under RCP8.5; however, northern and eastern beach scores further decreased during the Southwest monsoon. In addition, the 2nd Inter monsoon period of all the beach destinations have the least comfortable climate conditions (i.e., low HCIBeach scores). However, under RCP8.5, it is further degraded. Importantly, some beach destinations showed favorable responses against climate change. However, it does not mean that sea-level rise will not affect the above destinations. Nevertheless, sea-level rise was not considered in this study.
Furthermore, it was understood that all the
HCIBeach scores for RCP4.5 and RCP8.5 during the future projections are well below the observed
HCIBeach scores calculated based on field measured data (refer to
Table A3).
The
HCIUrban score spatial distribution and values under future projections for RCP4.5 and RCP8.5 are shown in
Figure 7. The detailed numerical presentation is given in
Table A4 in the Appendix. The analysis conducted with reference to 2021–2050 and 2071–2100 under both RCP4.5 and RCP8.5 on urban destinations reveals that the
HCIUrban scores of all the urban destinations, except the Central Hills, increased during the 1st Inter monsoon period. Furthermore, the
HCIUrban scores of each of the Colombo suburbs, Southern region, and Central Hills decreased during the Southwest monsoon while other regions showed an increasing trend in
HCIUrban scores. The
HCIUrban scores of most of the regions converted from unacceptable to a dangerous situation in the 2nd Inter monsoon period. However, in the Northeast monsoon period, all the urban destinations except the Eastern region behave similarly to the 1st Inter monsoon period. Additionally, similar trends were followed by
HCIUrban scores for RCP4.5 during both 2021–2050 and 2071–2100 and RCP8.5 for both 2021–2050 and 2071–2100. Based on the above results, it can be concluded that future climatic scenarios could lead to unfavorable climatic situations in most urban destinations.
3.4. Visual Relationship between HCI and Tourism
Figure 8 shows the distribution of the average number of tourists who stayed in a particular region with the
HCIBeach and
HCIUrban scores obtained for 2010–2018.
Figure 8 was used to understand the visual relationships between
HCI and tourist arrivals, if there are any. In general, it can be seen that the tourist arrivals increased in July and reached its maximum during December. However, from January to June, the number of tourist arrivals decreased and showed the least arrivals in June. However, from the July to August period, there is an increase in tourist arrivals. This was observed in all the regions considered for the present study. Additionally, most tourists selected the western coast/Colombo suburbs to stay and spend their holidays. The trend decreases as per the locations stated: southern coast, Ancient Cities, Central Hills, eastern coast, and northern coast.
Most of the
HCI beach scores range from 40 to 70 (unfavorable to excellent). The month of May is when the lowest number of tourist arrivals has the lowest number of
HCI values. Therefore, one can argue that there is a correlation between the climate and tourist arrivals. However, the month of November, which has an increasing number of tourist arrivals, showcased lower
HCI scores. Therefore, these two cases are contrasting. Therefore, rather than a correlation analysis, the authors would like to consider this to observe visual relationships and patterns. However, to showcase the insignificance of the correlation analysis in such a study, the results from the analysis are presented herein.
Table 3 presents the correlation values for
HCI scores and the average number of tourists who stayed in a particular location.
Overall, the correlation values are much lower other than that of the Central Hills (R = 0.51). The correlation analysis conducted for the average number of tourists who stayed in the selected beach destinations reveals that all the HCI beach scores have a negligible correlation (i.e., correlation coefficient <0.3) with the average number staying in the above locations except for the eastern coast. The eastern coast showed a low negative correlation. Therefore, a sound correlation was not able to be showcased between the climate and tourists’ arrivals. Therefore, it can be concluded herein that the correlation analysis is not recommended in such a study consisting number of other variables.
However, the comparisons conducted based on the HCIBeach and HCIUrban scores’ effect on a particular nation is not an entirely random event and has shown some acceptable relationships. Nation by nation studies also suggested that higher HCI values have higher tourist arrivals and vice versa. Chinese, French, Dutch, and American tourists showcased interests in the western and southern beaches, while some others showcased negative relationships to northern beaches. Similar observations can be seen for urban destinations, too. However, more investigations with more years of data are required for sound conclusions.
3.5. Influence of Climate Change under RCP4.5 and RCP8.5 on Tourist Arrivals
Based on the analysis conducted on HCIBeach and HCIUrban scores for the future, it is identified that the HCIBeach and HCIUrban scores of the considered regions can increase or decrease depending on the monsoonal season, considered time duration, and RCPs. Similarly, tourist arrivals in the country had no, low (+/−), marginal (+/−), or high correlation with the HCIBeach and HCIUrban scores of a particular region over the months. Furthermore, it is found that some nationalities expect to have high HCI scores, whereas several do not have such expectations. Therefore, it is clear that regions showing an increase in HCI scores have a favorable response from tourists expecting high HCI scores. However, the response from the tourists expecting low HCI scores has a negative impact. Nevertheless, regions where the HCI scores are low have a favorable response from tourists expecting low HCI scores and vice versa. Therefore, climate change has both favorable and unfavorable responses against tourism. However, the net impact of climate change on tourism is unfavorable.
3.6. Comparison Analysis of HCI and Tourism in Nearby Countries and Their Recommendations
Several related studies in the region can be found in the literature. Hasanah et al. [
24] have carried out
HCI calculations for a world famous tourist destination, the Borobudur Temple in Indonesia. They have found strong correlations between the number of tourist arrivals and
HCI values. Therefore, they have concluded that foreign tourists are keener on weather issues when touring. Yu et al. [
21,
22] have extensively looked at the
HCI in relation to tourism in China. They have looked at more than 700 climate stations in China for both beach and urban destinations that are important for tourism. Not only have they found a good correlation between
HCI scores and tourist arrivals, but they have also projected future attractions using the RCP4.5 and RCP8.5 climatic scenarios for the year 2100. Japan also looked at
HCI and its relationship to tourism for the city of Tokyo [
23]. Unfavorable situations are projected for tourists in Tokyo under the changing climate, and thus declining features can be seen in tourism in Tokyo.
Studies have looked at the countries in Mediterranean climates. Hejazizadeh et al. [
18] and Mahtabi and Taran [
19] have researched the impact of climate change on tourism in Iran. Among them, Hejazizadeh et al. [
18] looked at the east, central, and southeast regions of Iran for their study, while Mahtabi and Taran [
19] looked at the two cities called Isfahan and Rasht in Iran. Both studies showcased the importance of
HCI under changing climates and suggested future policies on tourism can be investigated based on their results.
Furthermore, Rutty et al. [
12] also formulated the relationship between the
HCIBeach indexes and tourist arrivals in Caribbean islands and found out that there was a strong positive correlation between them. Therefore, the importance of the climate on tourism to islands with sandy beaches was highlighted by Rutty et al. [
12]. In addition, related studies can be found in the context of the North American continent, in Canada. Matthews et al. [
20] also identified a strong correlation between
HCI and the tourism industry. Therefore, overall, it can be concluded herein that there is a strong relationship between the
HCI and tourism all over the world. However, it was not fully evident in Sri Lanka. The unavailability of quality data (before 2010) might be a possible reason; however, further investigations are proposed.
3.7. Findings of this Research into Policy Implications
As stated earlier, a significant contribution to the economy in Sri Lanka is supported by tourism. There was a prediction that 2.5 million tourist arrivals would be reached by 2025. However, the country’s weather patterns are drastically changing and the impact of these changes is reflected in the tourism from this research. Therefore, a fruitful dialogue has to be started between the tourist board of Sri Lanka and the related government agencies to rectify the corrective measures and then attract more tourists to the country. In addition, the research findings can be used to develop new areas to attract more tourists. These policy decisions can be implemented with the use of the findings of this research.
3.8. Potential Limitations
The present study uses the data of GCM and RCMs to obtain future climatic scenarios under climate change. Bias corrections were conducted under the assumption that the historical data sets reflect the present and future. However, there is uncertainty about the future due to anthropogenic activities and their influence on climate change. Therefore, model predictions can deviate from realistic scenarios. Some external drivers such as terrorism, political crises, global sanctions, and global outbreaks (COVID-19) could result in a reduction in tourist flows. This could result in no correlations between tourist arrivals and climatic indices. In such scenarios, the potential technique would be obsolete. Therefore, the authors conducted this study under the assumption that tourist flows would follow the same trends in the future and that there would be no influence of political–economic crises, global sanctions, terrorism, or global outbreaks.
4. Conclusions
This research investigates the impact of climate change on tourism in Sri Lanka. A holiday climate index (HCI) was developed for the famous beach and urban destinations of Sri Lanka to investigate tourism arrivals with respect to the changing climate. Results from the years 2010 to 2018 conclude that there is a relationship between the climate and tourist arrivals. The months of May and June were found to be the months with the lowest tourist arrivals with lower HCI scores. In addition, higher HCI scores can be found for the month of December with higher tourist arrivals. Even though tourist arrivals and HCI scores showcase some visual relationships, mathematically, it was found that there is no significant correlation between them. Nevertheless, country-specific tourists showcase an interesting correlation with the climate. Chinese tourists have the highest interest in HCI scores while Indian tourists have the lowest interest. Therefore, the overall results of this research conclude that the changing climate is only one of the important parameters among some others for tourist arrivals. Thus, further research is highly essential to investigate the other factors affecting tourism in the country and then to assess the overall impact.
This research further investigates the possible future behavior of tourism in changing climates. The possible cases for beach and urban destinations were assessed under two climate scenarios, RCP4.5 and RCP8.5, using climatic models. The projections were presented for the near future (2021–2050) and far future (2071–2100) and the findings are proposed to the tourism industry stakeholders for any changes in policy decisions to adapt to the situations. Sri Lanka is expecting more Chinese nationals to visit Sri Lanka in future with ongoing development projects with the help of China; thus, this study would be helpful. The present study was conducted from 1990–2018, and on the near future and far future under RCPs, and the validations were conducted using tourism data from 2010 to 2018. However, the civil war (before 2010), the Easter Sunday attack (in the year 2019), and the COVID–19 pandemic (2020–halfway through 2022) impacted the tourism industry. Therefore, this study neglected the anthropogenic and external influences and solely focused on the climatic influence on tourist arrivals. Additionally, the IPCC 2021 6th assessment report updated the RCPs and HCIs based on new climatic models that are yet to be discovered. Furthermore, that would be helpful to understand the climatic impacts on the tourism industry.


 ,
, 


