Article

Recent Warming Trends in the Arabian Sea: Causative Factors and Physical Mechanisms

by
Jiya Albert
1,
Venkata Sai Gulakaram
2,
Naresh Krishna Vissa
2,
Prasad K. Bhaskaran
1,* and
Mihir K. Dash
3
1
Department of Ocean Engineering & Naval Architecture, Indian Institute of Technology Kharagpur, Kharagpur 721 302, India
2
Department of Earth and Atmospheric Sciences, National Institute of Technology, Sundargarh District, Rourkela 769 008, India
3
Centre for Oceans, Rivers, Atmosphere and Land Sciences, Indian Institute of Technology Kharagpur, Kharagpur 721 302, India
*
Author to whom correspondence should be addressed.
Climate 2023, 11(2), 35; https://doi.org/10.3390/cli11020035
Submission received: 19 December 2022 / Revised: 16 January 2023 / Accepted: 19 January 2023 / Published: 29 January 2023
(This article belongs to the Special Issue Subseasonal to Seasonal Climate Forecasting)

Abstract

:
In recent years, and particularly from 2000 onwards, the North Indian Ocean (NIO) has been acting as a major sink of ocean heat that is clearly visible in the sub-surface warming trend. Interestingly, a part of the NIO—the Arabian Sea (AS) sector—witnessed dramatic variations in recent sub-surface warming that has direct repercussion on intense Tropical Cyclone (TC) activity. This study investigated the possible causative factors and physical mechanisms towards the multi-decadal warming trends in surface and sub-surface waters over the AS region. Responsible factors towards warming are examined using altimetric observations and reanalysis products. This study used ORAS5 OHC (Ocean Heat Content), derived meridional and zonal heat transport, currents, temperature, salinity, Outgoing Longwave Radiation (OLR), and air-sea fluxes to quantify the OHC build-up and its variability at water depths of 700 m (D700) and 300 m (D300) during the past four decades. The highest variability in deeper and upper OHC is noticed for the western and southern regions of the Indian Ocean. The warming trend is significantly higher in the deeper regions of AS compared to the upper waters, and relatively higher compared to the Bay of Bengal (BoB). Increased OHC in AS show good correlation with decreased OLR in the past 20 years. An analysis of altimetric observations revealed strengthening of downwelling Kelvin wave propagation leading to warming in eastern AS, mainly attributed due to intrusion of low saline water from BoB leading to stratification. Rossby wave associated with deepening of thermocline warmed the southern AS during its propagation. Heat budget analysis reveals that surface heat fluxes play a dominant role in warming AS during the pre-monsoon season. Increasing (decreasing) trend of surface heat fluxes (vertical entrainment) during 2000–2018 played a significant role in warming the southeastern sector of AS.

1. Introduction

The Arabian Sea (AS), a semi-marginal sea located in the western North Indian Ocean (NIO) basin had recently experienced enhanced Tropical Cyclone (TC) activity compared to the eastern sector, the Bay of Bengal (BoB) [1,2,3,4]. Most of the occurrences are focused over the onset phase of the Indian Summer Monsoon [2], and the co-existence of positive IOD and La Niña events has contributed to more intense cyclones in the recent decades [1]. Enhanced convective activity over this basin, along with the formation and intensification of intense TCs can have profound impact on the socio-economic balance of coastal community in the Indian sub-continent [5]. Tropical cyclones are disastrous extreme weather event phenomena that can result in widespread destruction to life and property during its landfall. It can lead extreme water level and wind-wave conditions [6,7,8,9,10,11] and also change the upper ocean characteristics [12,13,14,15] having implications on coastal vulnerability [16,17,18,19]. A recent study [20] indicated that intensity of severe cyclonic storms in the NIO region showed an increasing trend in the past four decades. Based on historical archived best-track cyclone records, the scientific community is well aware that cyclone frequency is 5:1for the BoB and AS regions located in the NIO region, respectively. However, in a changing climate and in particular during the recent decades, the AS basin is no longer considered as a less cyclone-active in terms of TC activity. The pre- (March-May) and post-monsoon (October–December) seasons witnessed intense TC activity over the AS region. Some of the examples of the cyclonic storms witnessed over AS region are tabulated in Table 1.
Strong energy interactions through air-sea enthalpy (latent and sensible heat) fluxes are the critical mechanisms driving the generation and propagation of TCs [21,22,23]. Observed warming over NIO and specifically the region confined over the less cyclone-active AS basin with enhanced convective activity is attracting the attention of researchers [24,25]. Prior studies have focused exclusively on the western tropical Indian Ocean of AS signifying warming at a faster rate as compared to rest of the tropical Indian Ocean [20,26,27]. A study by [28] demonstrated that cyclogenesis over AS during the post-monsoon season is modulated by both the monsoon rainfall and El Niño with a support of positive Indian Ocean Dipole (IOD) events. It is noteworthy that a single phenomenon hardly explains the observed variability over the AS region. Recently, Ref. [29] demonstrated that apart from several known atmospheric forcing effects, the inter-annual variability of OHC (Ocean Heat Content) could influence the post-monsoon AS cyclogenesis. Additionally, the salinity variations existing over the domain partially modulates the OHC of this region. Their study provided valuable information on the heat exchange mechanism between the southwest Indian Ocean (SWIO) and AS, that induces variability in the AS OHC. In addition, their analysis [29] also attributed the recent trend for increased OHC (from 2011 onwards) with elevated sea-surface carbon levels over the AS region. Moreover, it is remotely influenced by the heat transport mechanism facilitated largely by the variability in equatorial current flow patterns [30]. It is interesting to note that the projected Indian Ocean (IO) warming trend is faster than the input heat sources attributed from direct air-sea heat flux. Significant weakening of the Agulhas current system and its transport in a warming climate could further reduce the outward heat transport from the southern exit of the Indian Ocean [30]. Recently, the studies also confirmed two to three times increased biological productivity in AS waters with the subsequent occurrence of TCs [31]. On a longer time-scale, the emission of CO2 gas from the ocean to the atmosphere could increase from 2 to 6 times. Findings also demonstrate the possibility of more frequent TCs in the future that could lead to oxygen deficiency in the AS. The release of more CO2 into the atmosphere in a longer-term perspective increases the possibility for more warming [31]. Conducive ocean-atmosphere conditions in the AS basin linked with recent warming trends has a direct bearing on the TC activity. Based on the above discussions, and keeping in view the importance of this problem, it is pertinent to explore the different pathways of heat transport influencing the surface and sub-surface waters of AS that still remain as an open question warranting a detailed study to understand the future TC activity over this basin. This study aims to understand the causative factors and responsible physical mechanisms of the oceanic processes that contribute to enhanced heat content in the AS region.

1.1. Arabian Sea Warming and Enhanced Cyclone Activity

The Indian Ocean (IO) has experienced rapid warming since 1998, which is intrinsically associated with an increased water mass exchange by the Indonesian Throughflow (ITF) [32,33,34]. In addition, prior studies have established that any variations in a warming environment can lead to an increase in the frequency and intensity of TCs [35,36,37]. For example, the study by [38] based on ensemble simulations from 15 coupled GCMs (General Circulation Models) showed a 4.6% increase in the TC potential intensity over the AS region. Analyzing the TC data from 1970 to 2007, Ref. [24] reported a negative-fold increase in the occurrence of TCs after 1995, the period when AS was undergoing a regional climate shift. Subsequently, Ref. [39] proposed that the recent increase in the intensity of pre-monsoon (May–June) TCs over AS is a consequence due to reduction in the basin-wide vertical wind shear attributed due to simultaneous increase in the anthropogenic black carbon and sulfate emissions. In addition, there are other studies that strongly signify frequent occurrence of intense cyclones over the AS region that can pose significant risk and vulnerability to the coastal regions. A recent study by [20] postulated an increase trend (~ 16.75%) in the intensity of SCS (Severe Cyclonic Storms) that formed over NIO during the past four decades. The Power Dissipation Index (PDI) also showed a correlation of 0.58 with SCS during the period 1979–2019 [3]. The above-mentioned studies clearly decipher that warming in the AS is factual and that has a significant bearing on enhanced severity of TCs.

1.2. Tropical Cyclone Formation and Equatorial Wave Activity

The important contributions from TC-induced ocean mixing towards the variation in ocean heat transport and circulation remained as an indignation [40,41,42]. Mixing is driven by the strong surface wind stress induced by the TC vortex motion. Further, there were disagreements, namely the TC induced circulation mixing pumps warm water from surface to the deeper layers. The equator-poleward (meridional) warm water transport contributes towards the variation in Ocean Heat Transport (OHT).
The important contributions outlined above are reinforced by the remote forcing effects on the mid-latitude weather systems attributed due to inter-basin scale SST (Sea Surface Temperature) and its variability [35,43]. The major fuel triggering the genesis and propagation characteristics of TCs is the heat transfer from the ocean [44]. Generation of this fueling energy is initiated from the surface heat fluxes and moisture from the ocean. The basic state of the atmospheric conditions varies due to this energy transfer enhancing its potential for convection and precipitation [45]. On the contrary, a negative feedback mechanism is initiated parallelly by the cyclone-induced wind stress due to turbulent mixing of the upper ocean layers, that eventually cools the ocean surface by Ekman pumping [46,47,48,49]. These studies provide an inevitable link between the thermodynamic properties of the ocean with TCs throughout its entire life span. There are several studies that postulated a strong relationship existing between TC formation and the equatorial wave activity [50,51,52,53,54,55,56]. The major contributions were provided by (i) Mixed Rossby Gravity Waves, (ii) Equatorial Rossby Waves, (iii) Kelvin Waves, and (iv) Madden Julien Oscillation [57]. These waves appear to enhance the local circulation patterns by increasing the organized upward vertical motion, low-level vorticity at the genesis location, and modulate the vertical shear [51]. In this study, the inevitable factors that contribute to AS warming and the possible physical mechanisms are explored. Using this conceptual evaluation, the present study aims to provide a plausible explanation on the recent intensification of TCs over the AS region. The first objective explores the sensitivity of ocean warming phenomenon over the AS and its comparison with neighboring regions in the NIO. Further, a comprehensive study is reported to establish the impact of equatorial waves on TC activity over the AS region.

1.3. Role of Kelvin Wave Activity

The NIO is a unique ocean basin that experience seasonal reversal of the monsoonal wind system having a direct implication on the ocean circulation aspect, which makes the NIO quite distinctive compared to the other ocean basins [58,59]. In the Equatorial Indian Ocean (EIO), the zonal winds are semi-annual and seasonal in nature triggering the fluctuations in sea surface heights over both the central and eastern equatorial regions [60,61,62]. The easterly (westerly) winds over this region are favorable towards the formation of equatorially trapped upwelling (downwelling) Kelvin waves that propagate towards the eastern equatorial Indian Ocean. After reaching the eastern boundary, these waves propagate as coastally trapped waves along the BoB coast, also known as the coastal Kelvin waves [60,61,62,63]. During the course of propagation, the westward propagating Rossby waves are radiated by the Kelvin waves influencing the circulation over the NIO region [61,62,63,64,65]. In the EIO, there are two pair of alternate upwelling and downwelling Kelvin waves that modulate the circulation aspects of BoB and AS [58,60,61]. Among these Kelvin waves, the second downwelling Kelvin waves that propagate during October–December in BoB, are the only waves that travel to AS influencing the west Indian coastal current [58,60,61,63,64]. A sea-level high is formed in the Southeastern Arabian Sea (SEAS) due to the propagation of Kelvin and radiated Rossby waves, which is also known as Lakshadweep high [58,66,67]. Ref. [68] postulated that the intrusion of low salinity waters during November–December forms the near-surface stratification, which sets the stage for formation of warm pool in the following months. With the evolution of time, this will extent spatially and spread southwestward towards the Somalia coast [60,68,69].
To address the physical mechanism behind the projected warming in the Arabian Sea (AS), the current study has considered various physical mechanisms responsible for warming trend in the Arabian Sea region using altimetric observations and reanalysis products. Section 2 contains the relevant information regarding the data sets and methodology used in the study. This follows the salient observations, results and discussion covered in Section 3. Finally, the conclusions and important outcomes of the study are presented in Section 4.

2. Data and Methods

2.1. Data

This study uses the datasets pertaining to ocean heat, derived heat transport, currents, temperature, salinity, OLR and air-sea fluxes that can provide valuable insights into the underlying dynamics that cause the variability in convective activity over the AS basin. The ocean currents, temperature, and salinity datasets were obtained from the Ocean Reanalysis System 5 (ORAS5, monthly). ORAS5 is an eddy-permitting ocean and sea-ice ensemble reanalysis system that provides the global ocean and sea-ice conditions from 1979 to the present [70]. Daily Outgoing Longwave Radiation (OLR) data is obtained from the National Oceanic and Atmospheric Administration (NOAA) [71] with a spatial resolution of 2.5º, available at (http://apdrc.soest.hawaii.edu, accessed on 6 September 2021). Daily air-sea fluxes such as the net heat flux, latent heat flux, sensible heat flux, and wind stress data were obtained from the TropFlux project of INCOIS (Indian National Centre for Ocean Information Services) [72,73]. Evaporation data is obtained from the OA flux project of the Woods Hole Oceanographic Institution (WHOI) having a spatial resolution of 1º × 1º for the period 1985–2018 [74].
This study investigated the intra-seasonal heat transport variability using an objective index that identifies the ocean Equatorial (Kelvin and Rossby) waves (EW) using the satellite observations of Sea Surface Height (SSH) [75,76,77,78]. The daily SSH anomalies data having a spatial resolution of 0.25º and covering a period of 26 years (1993–2018) were used in this study. SSH anomaly data were obtained from the Copernicus Marine and Environment Monitoring Service (CMEMS, https://marine.copernicus.eu/, accessed on 8 September 2021) to demonstrate the decadal variations in the propagation characteristics of Kelvin and Rossby waves. The current methodology is superior and versatile because it exhibits the systematic relationships between intra-seasonal modes in the atmosphere and ocean. The procedure involved in evaluating Equatorial Waves (EW) and the derived teleconnections hold regardless of the identifying index used.

2.2. Methodology

The initial analysis focused on the assessment of relative warming in AS and its comparison with other sub-domains over the NIO region. The study domain is sub-divided into seven sub-regions [79] based on the geographical boundaries (as listed in Table 2 and Figure 1). To address the physical mechanism attributed to projected warming in the Arabian Sea (AS), the current study has considered multiple aspects observed by different researchers. Skillful predictions of OHC in the upper 300 m and 700 m across dynamical environment contributes to accurate surface predictions such as Sea Surface Temperature (SST) [25]. Higher warming in the AS compared to other ocean basins have been reported in previous observations [80], in which the largest projected and observed trends in relative SST and potential intensity were found over the tropical part of this region. Another study has also proven the influence of Atlantic Ocean SST on the variations in AS SST [81]. Large scale circulation events like La Niña are usually associated with the accumulation of heat in the western tropical Pacific which is further transported to the Indian Ocean sector such as AS and BoB [82]. The occurrence of much deeper thermocline depth leads to the vertical redistribution of heat in the Indo-Pacific Ocean basin [83]. Similarly, the heat budget over the Pacific and Indian Ocean basins are affected by the transport of heat through the Indonesian through flow [84,85,86]. Therefore, the effective warming over the AS basin needs a detailed analysis over both AS and BoB regions (depicted as Regions 1 and 2), the Pacific Ocean Component-South China Sea (Region 3), tropical regions A and B (Regions 4 and 5), adjacent open ocean west and east sector from the South Indian Ocean (Regions 6 and 7).
Sub-surface OHC supports the TC formation and its intensification. Maximum energy supplied by the oceans towards the convective activity in the atmosphere is available within the upper 300 m water depth. Heat content in the relatively deep oceanic layer (700 m) represents the distribution and inter-basin scale heat exchange between the adjacent water bodies. Therefore, two independent datasets: (i) for OHC integrated over the upper 300 m (D300) and (ii) upper 700 m of the oceanic layer (D700) were used in this study to identify the amount of ocean warming. The D300 is used to assess the amount of sub-surface warming over the different sub-domains and D700 is used to determine the warming over deeper oceanic layers during the period 1979–2020.
The OHC was estimated using the mathematical formulation:
H = ρ C p h 1 h 2 T z d z
where T z represents the temperature as a function of water depth z integrated over the column from surface to 300 m or 700 m water depths. Thereafter, the OHC transport is estimated in terms of meridional and zonal components for the study period. Meridional and zonal heat transport across the latitude from BoB to AS are estimated by using the following equations described by [87,88,89].
Meridional   Transport = c p   ρ x 1 x 2 z 0 θ v   d z   d x
Zonal   Transport = c p   ρ y 1 y 2 z 0 θ u   d z   d y
where the terms x , y represent the zonal and meridional coordinates, respectively, z is the vertical coordinate, u and v are the zonal and meridional velocities, respectively. The terms θ ,   ρ ,   c p represents the potential temperature, seawater density, and the specific heat capacity of seawater, respectively.
The ocean mixed-layer heat budget analysis is estimated to understand the processes responsible for increasing the warming trend in the sub-surface water depths. The heat budget is computed by using the methodology described by [90,91,92].
T t = Q n e t C p ρ h u T x + v T y w e Δ T h
In the presence of Barrier Layer Thickness (BLT):
w e = Λ w c 1 u * 3 c 2 B h β g h Δ S
In the absence of Barrier Layer Thickness (BLT):
w e = Λ w c 1 u * 3 c 2 B h α g h Δ T
where,
B = α × q q ρ C p + β S 0 P E
The four terms in the above Equation (4) represents the temperature tendency, surface heat flux (atmosphere forcing), horizontal advection, and the entrainment flux. The variable T represents the mixed layer averaged temperature, Q n e t is the near-surface net heat flux, C p is the specific heat constant, ρ is the density of seawater, h is the mixed layer depth, u and   v are the zonal and meridional velocities, respectively. The term Δ T represents the difference between the mixed layer averaged temperature and the temperature at the base of the mixed layer. The entrainment velocity is represented by w e which is parameterized based on the presence and absence of barrier layer [15,16,17,18,19,20,21,22,23,24,25,26,27,28,29,30,31,32,33,34,35,36,37,38,39,40,41,42,43,44,45,46,47,48,49,50,51,52,53,54,55,56,57,58,59,60,61,62,63,64,65,66,67,68,69,70,71,72,73,74,75,76,77,78,79,80,81,82,83,84,85,86,87,88,89,90,91].
The estimations of uncertainty in the linear trends were carried out using the Confidence Interval (CI). This is a statistical technique that determines the probability of a calculated interval containing a true value. Trend statistics were estimated with 95% CI, and it provides information on how reliable the estimation is connected, with respect to the other samples collected. Using the bootstrapping method, samples are replaced with data points existing in a common dataset that leads to more accurate and efficient results related to CI. The method includes a t-test to determine the statistical significance, and bootstrapping method can provide the confidence interval value for the estimated slope of a linear trend. The interval indicates the range (upper bound and lower bound) of credible values for the slope, given the data and assumptions used in the analysis. For the desired parameters of OHC and OLR, the CI is estimated to have narrow confidence intervals. The results are more desirable since this provides us with a narrow range of values that contain the linear trend. All the data sets are tested using the t-test and found to be statistically significant.

3. Results and Discussion

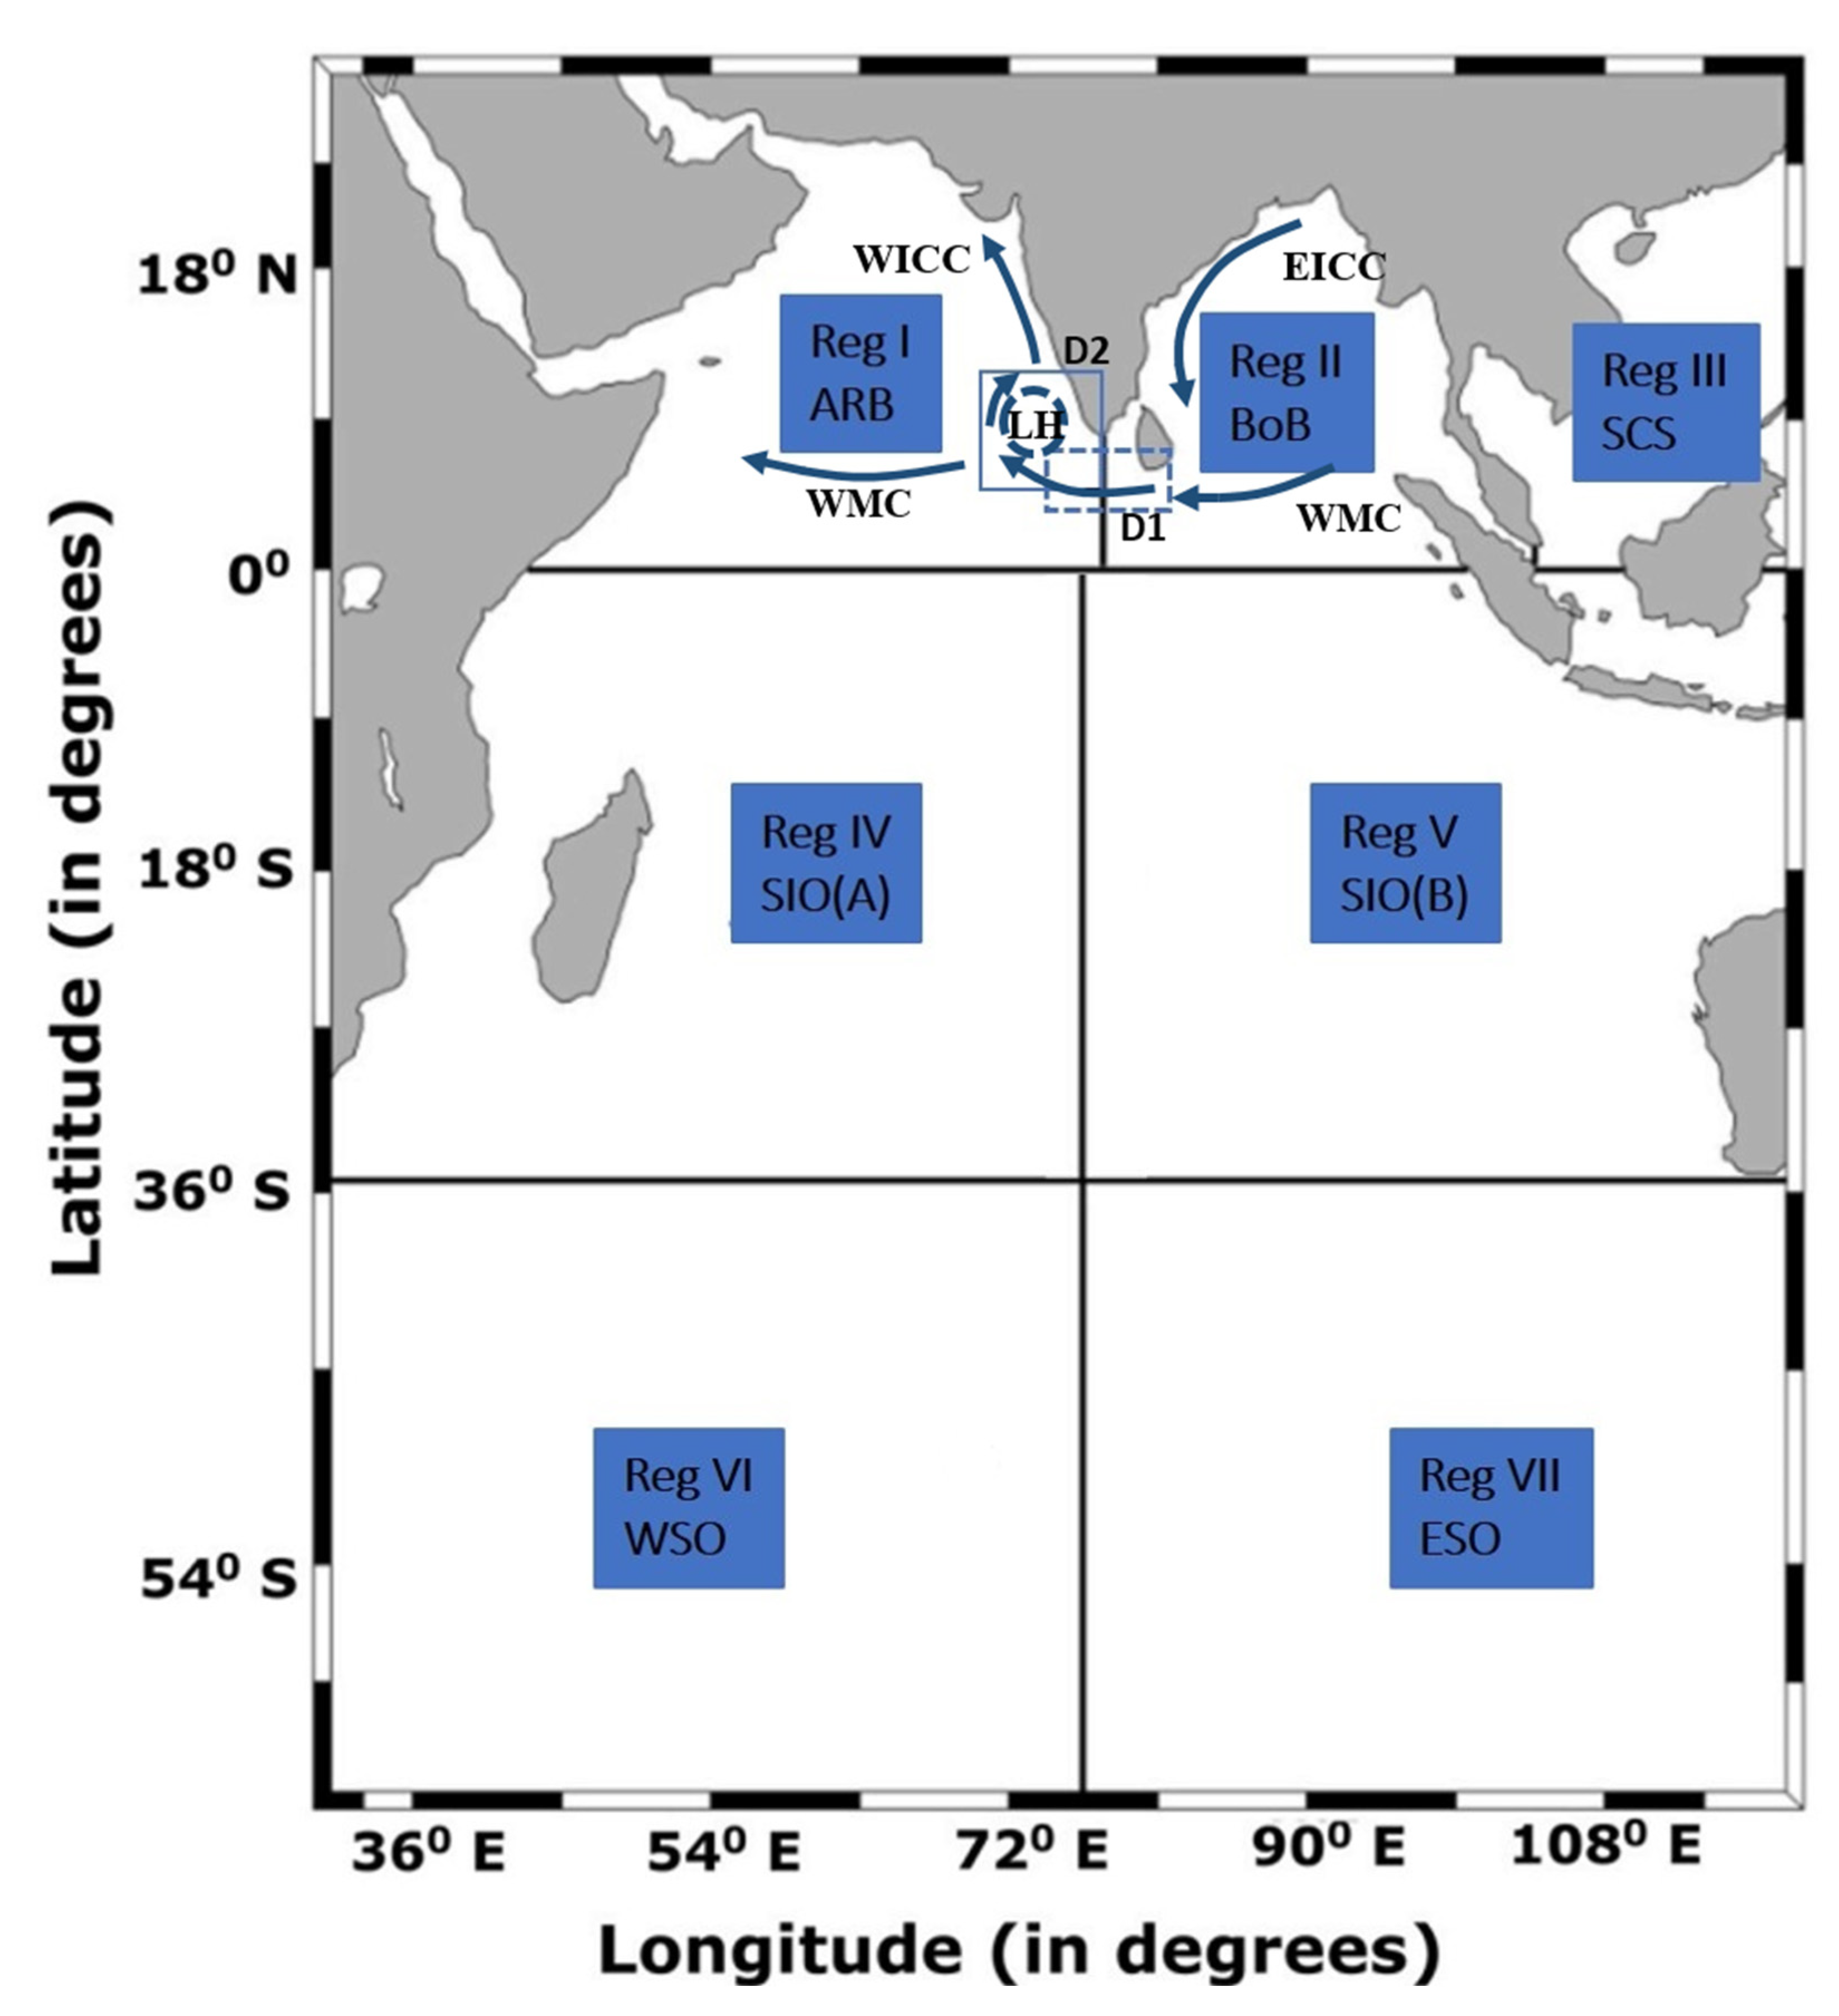
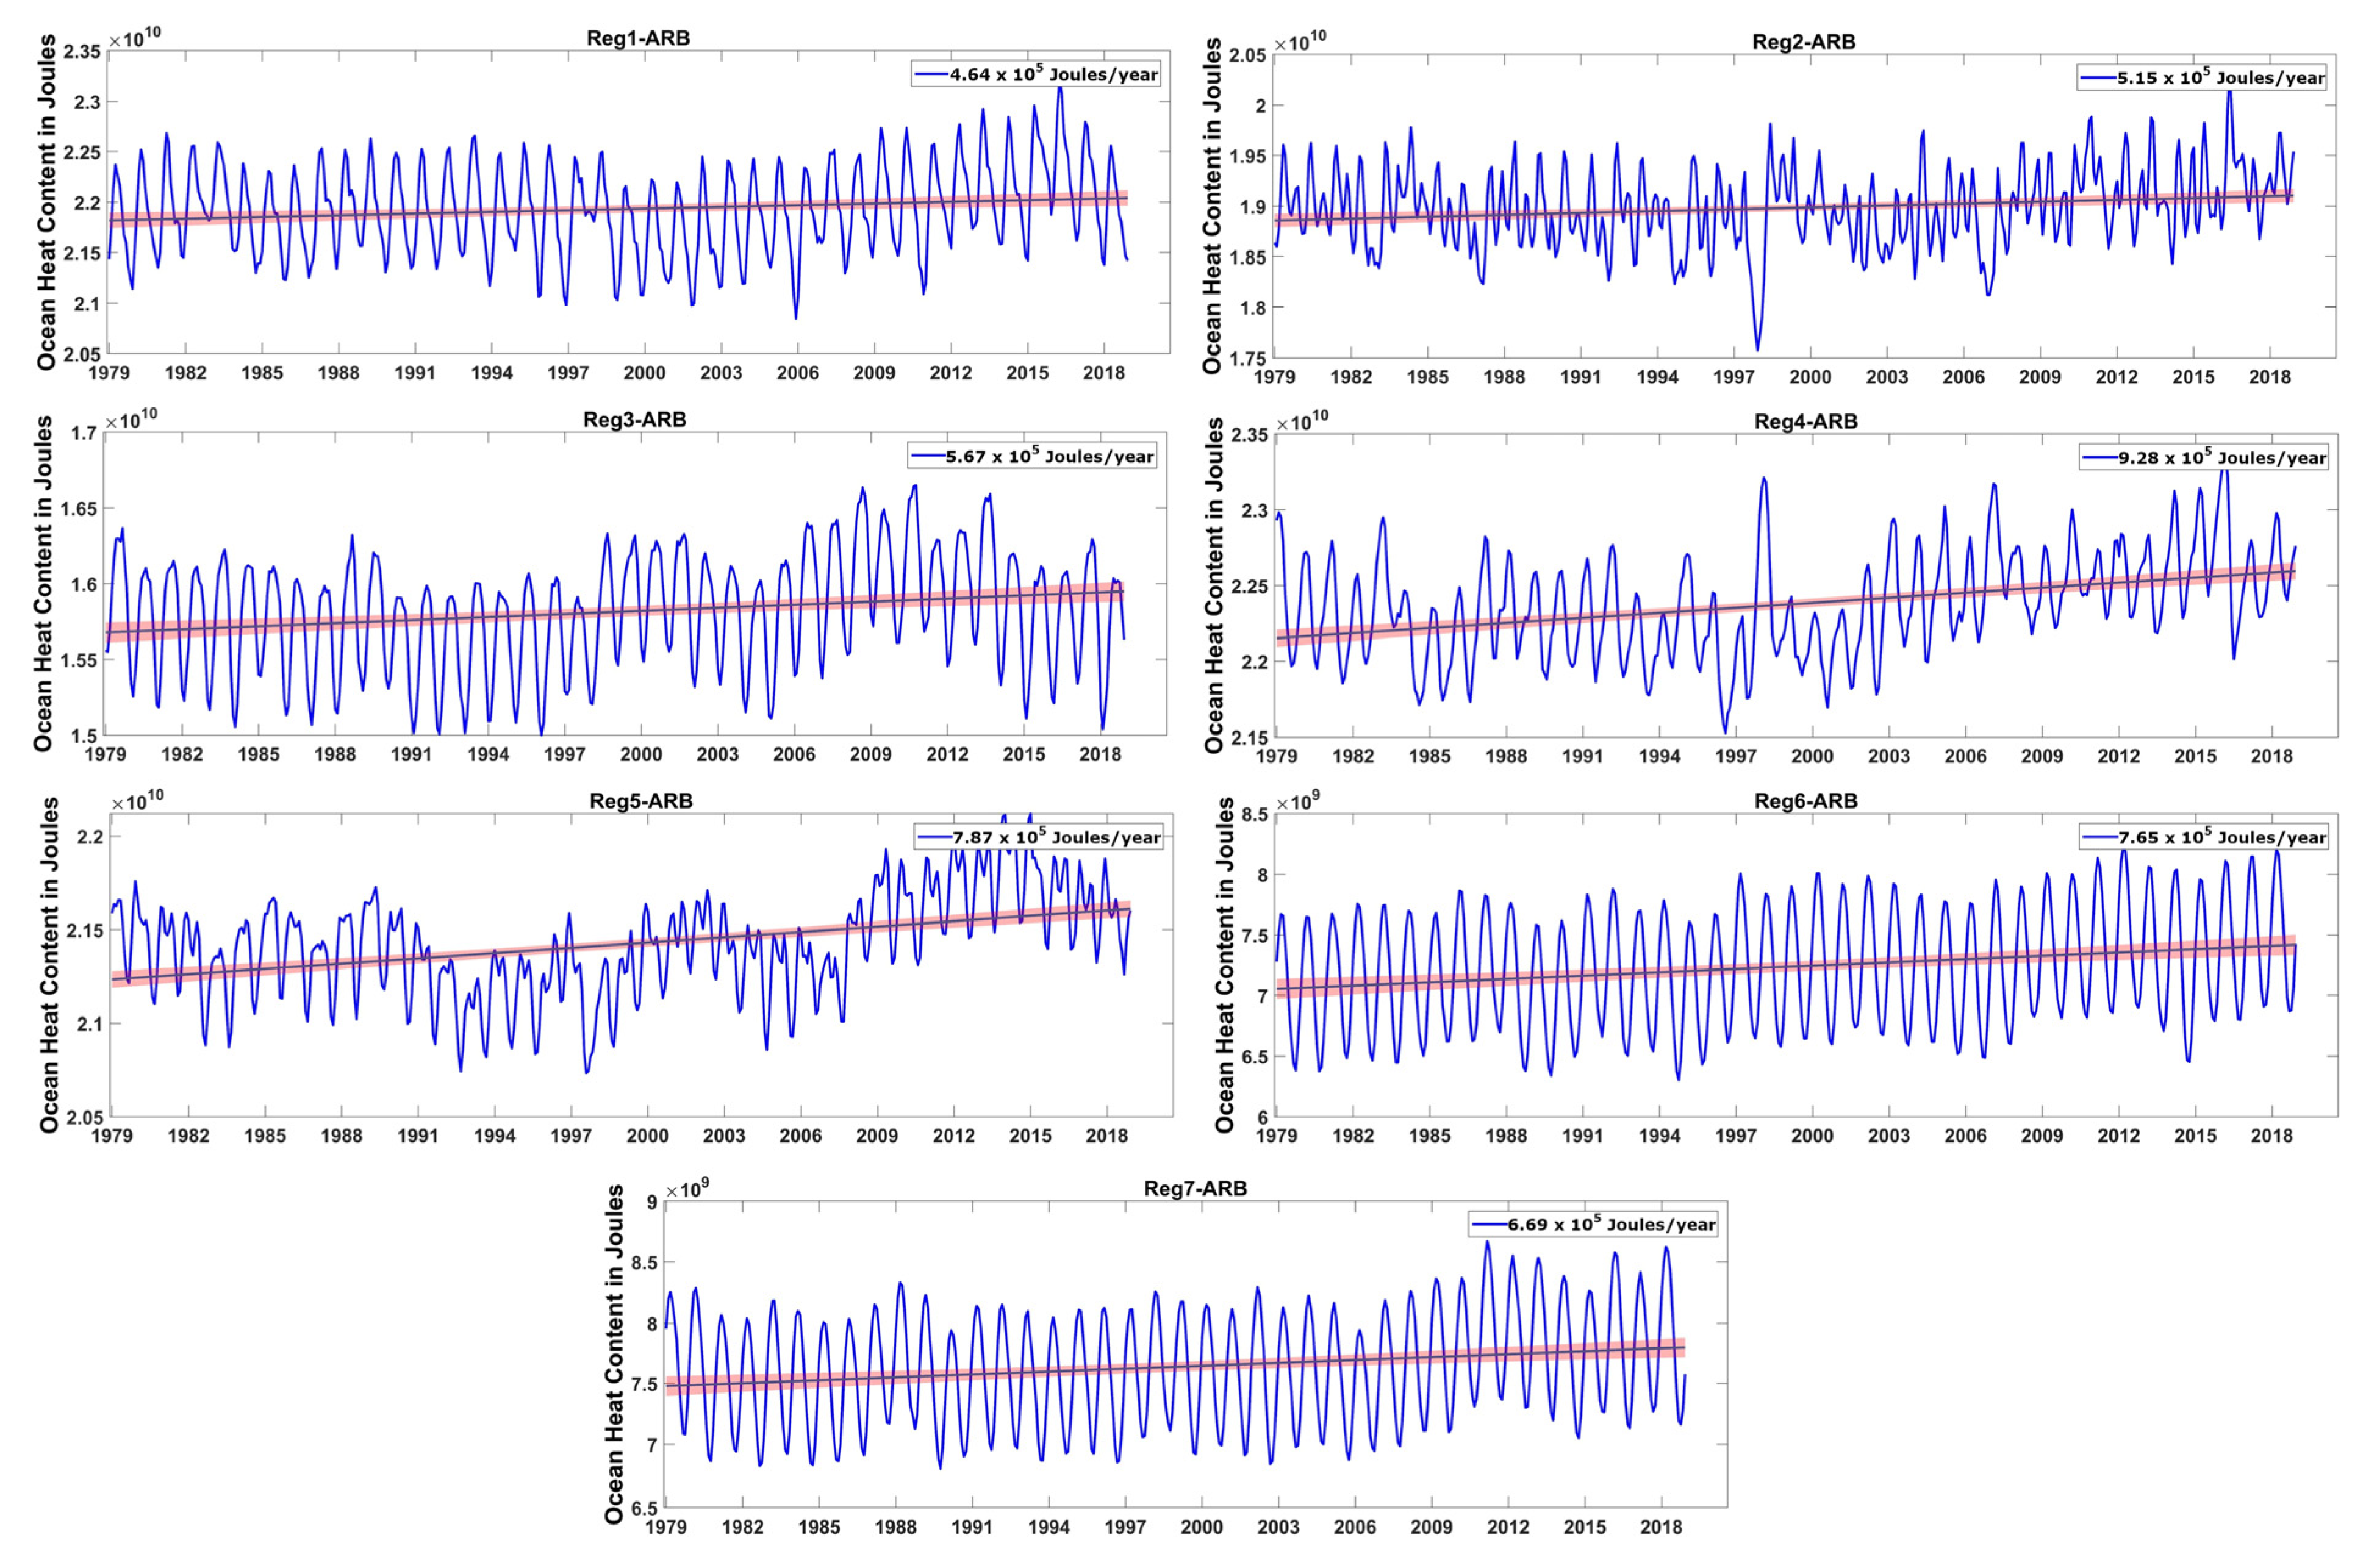
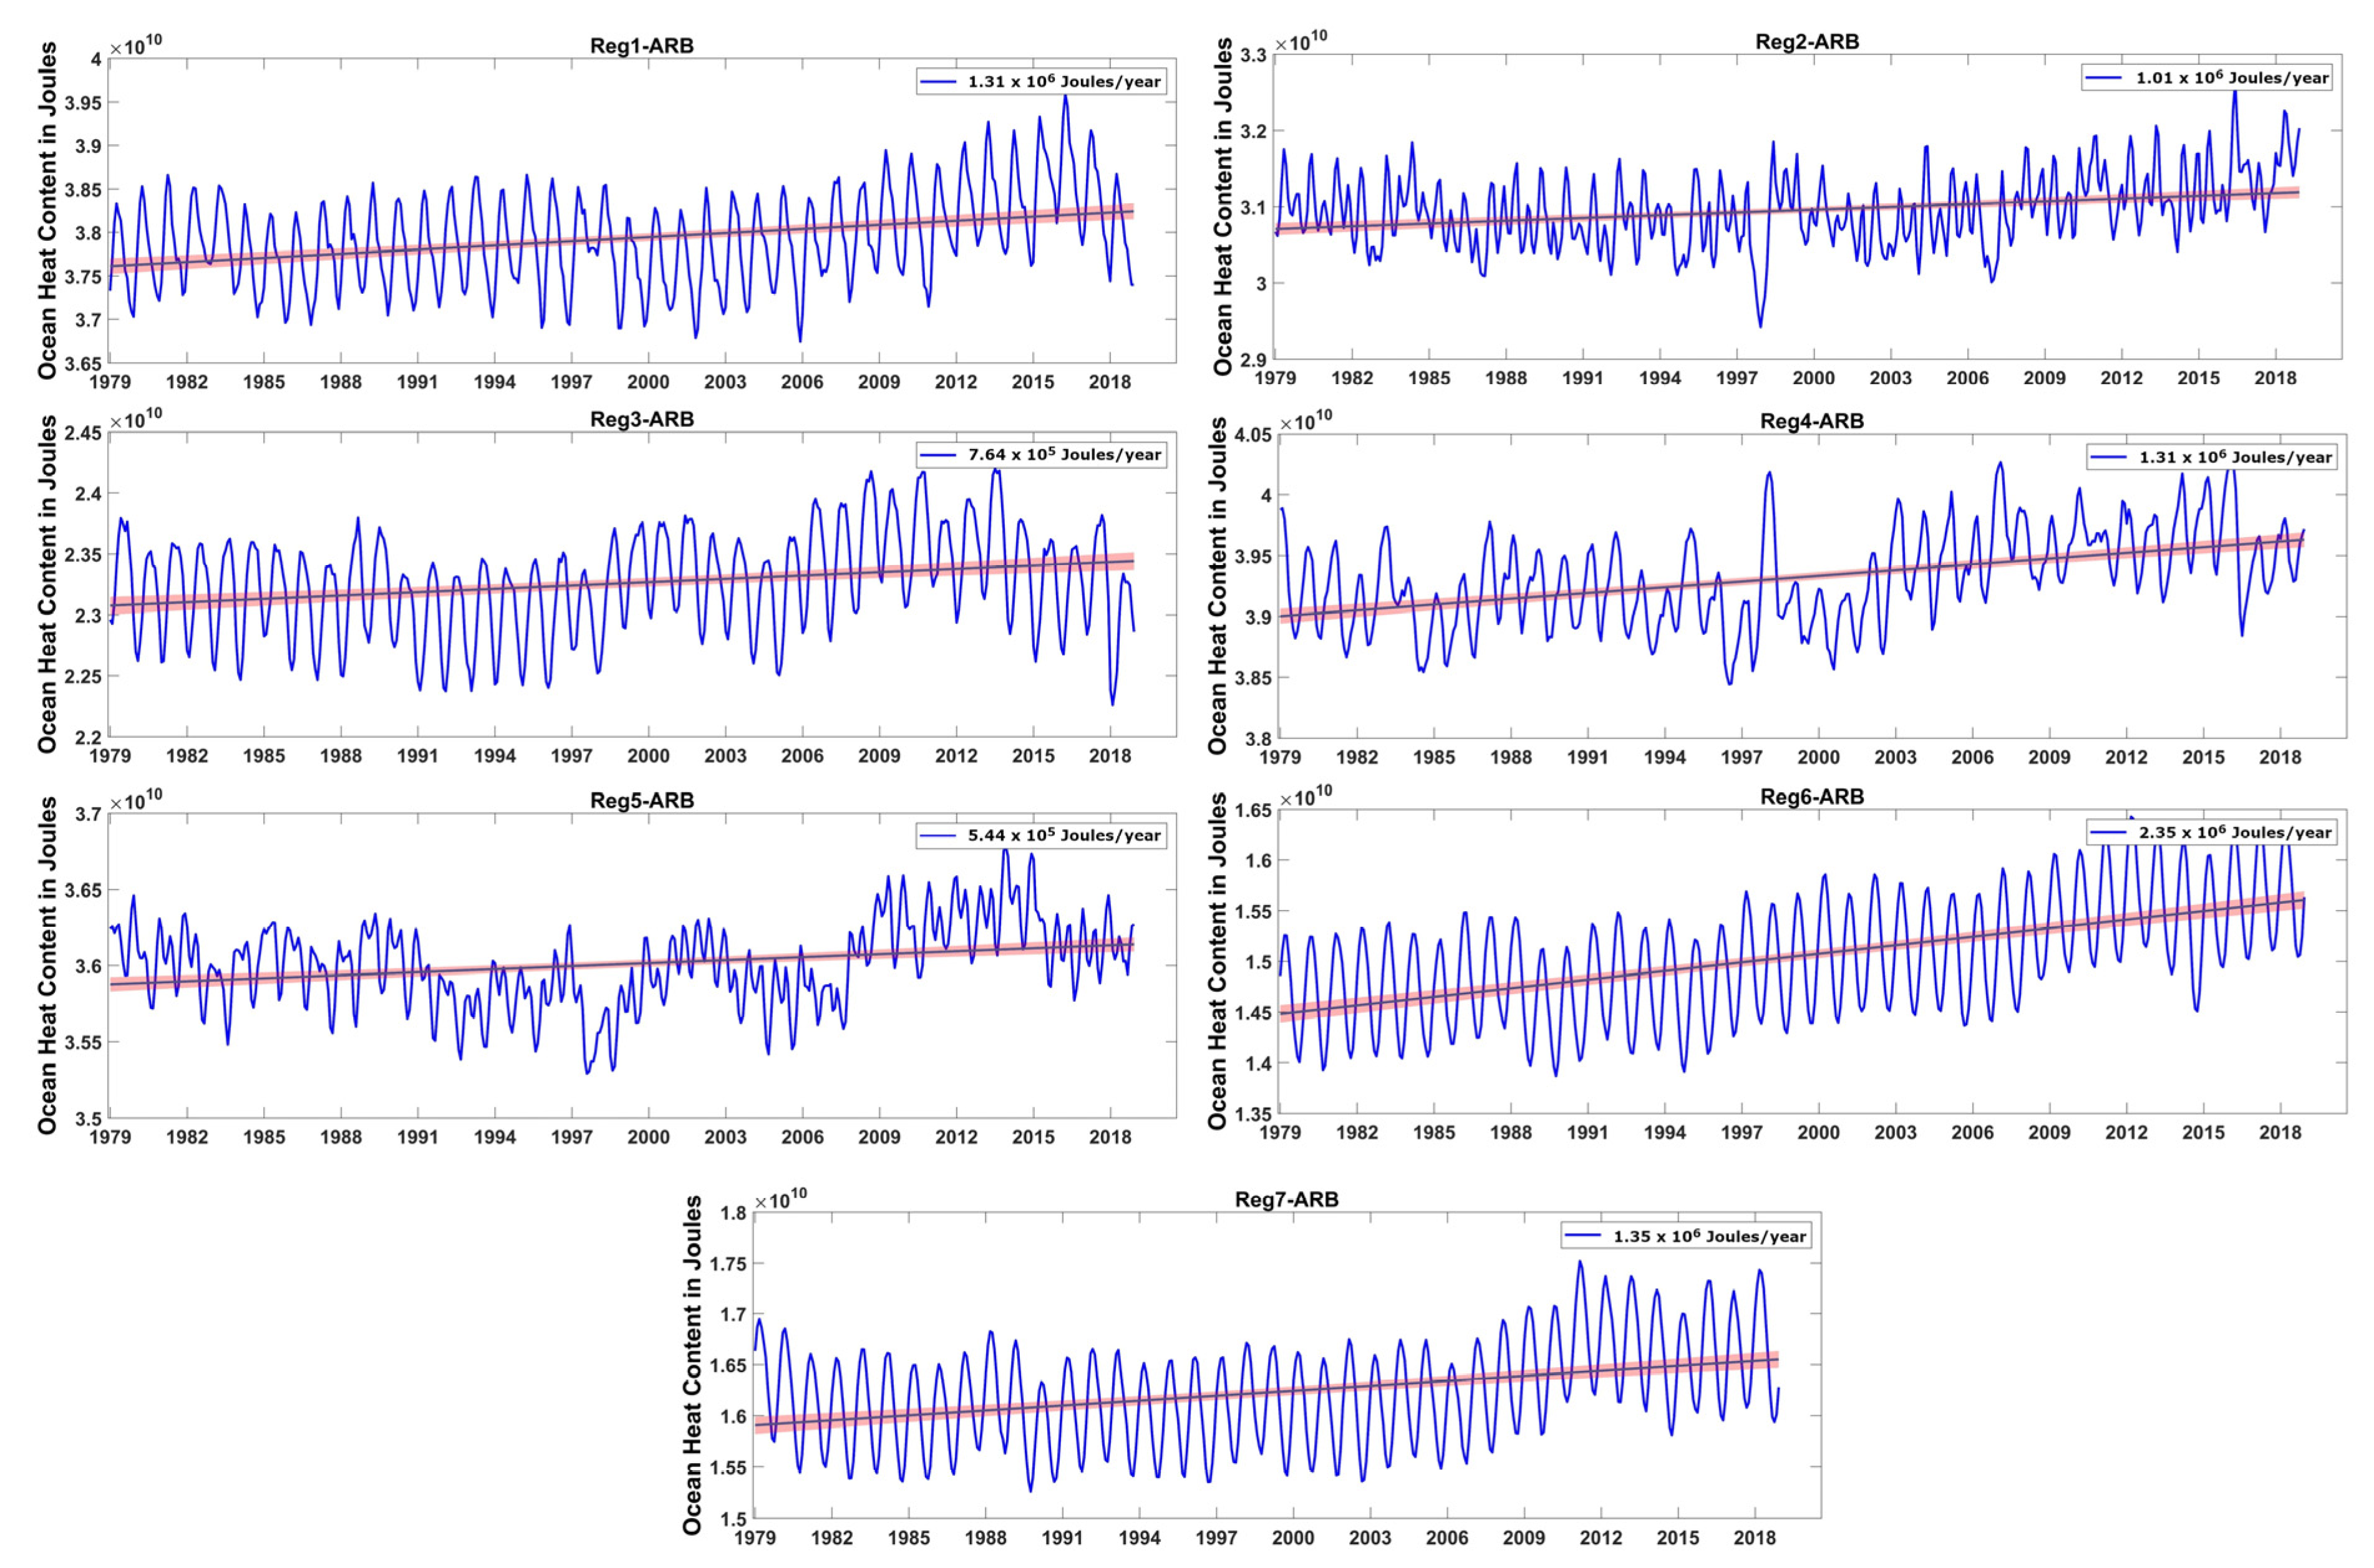
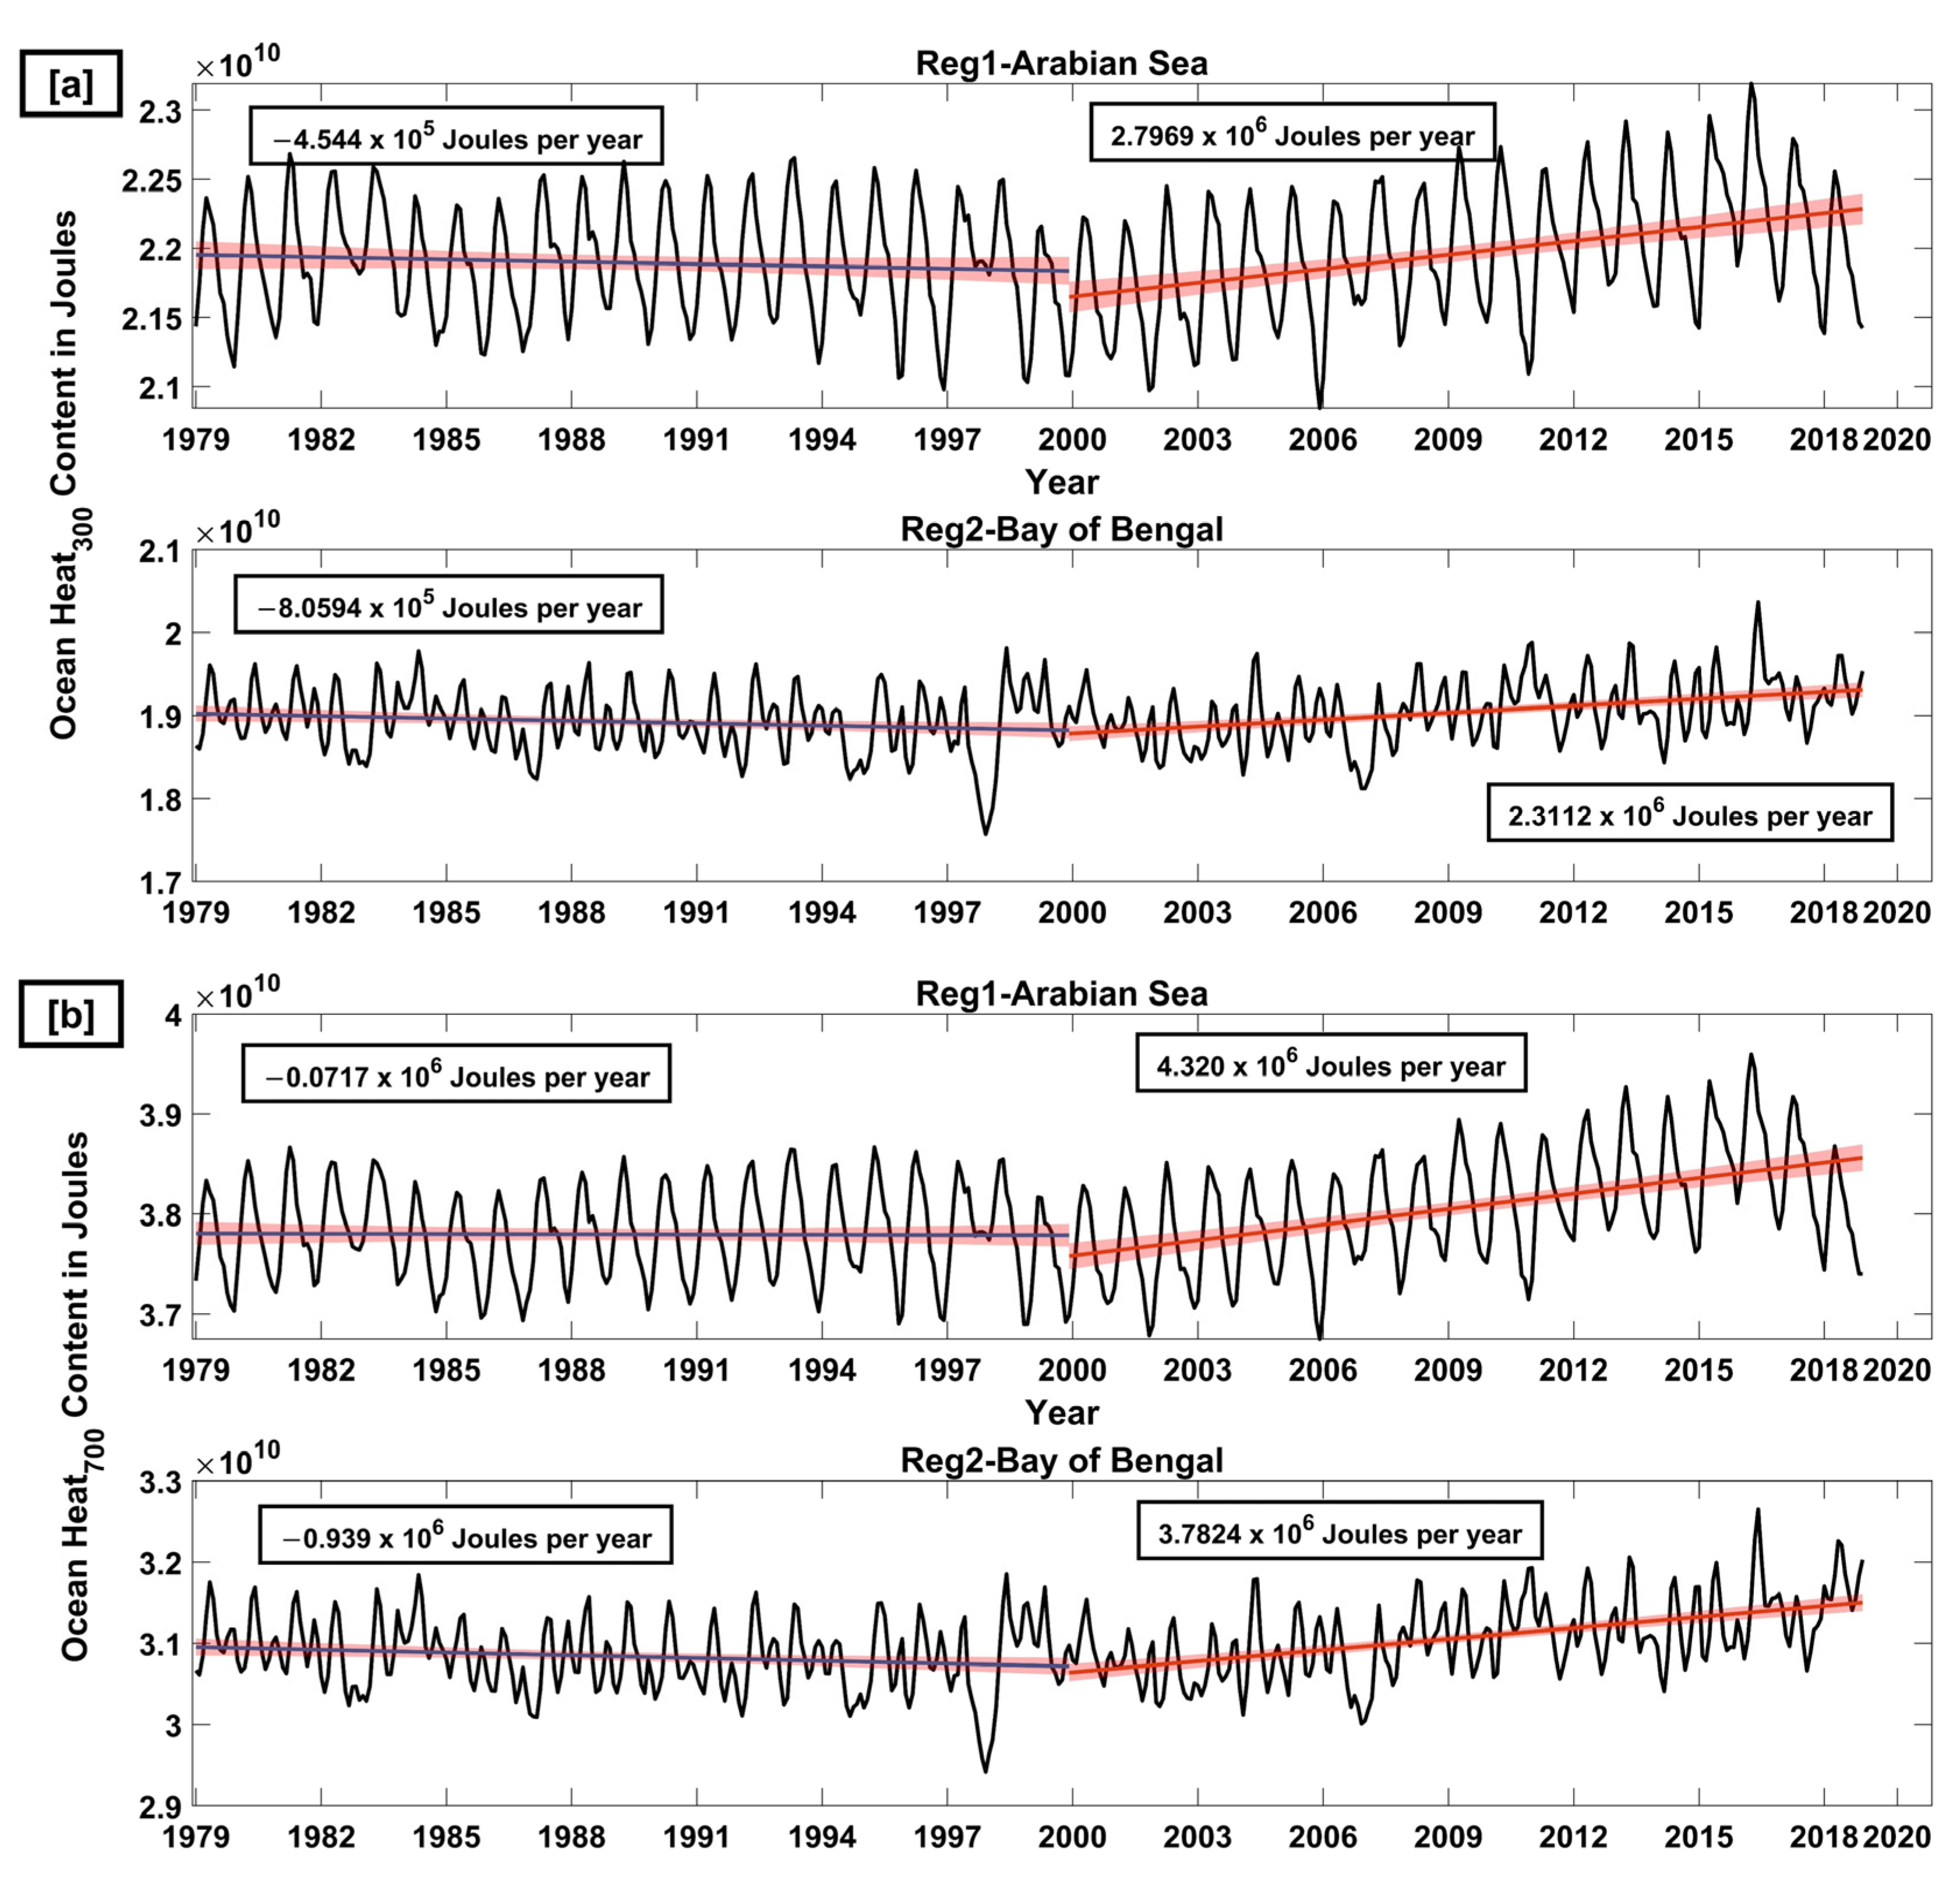
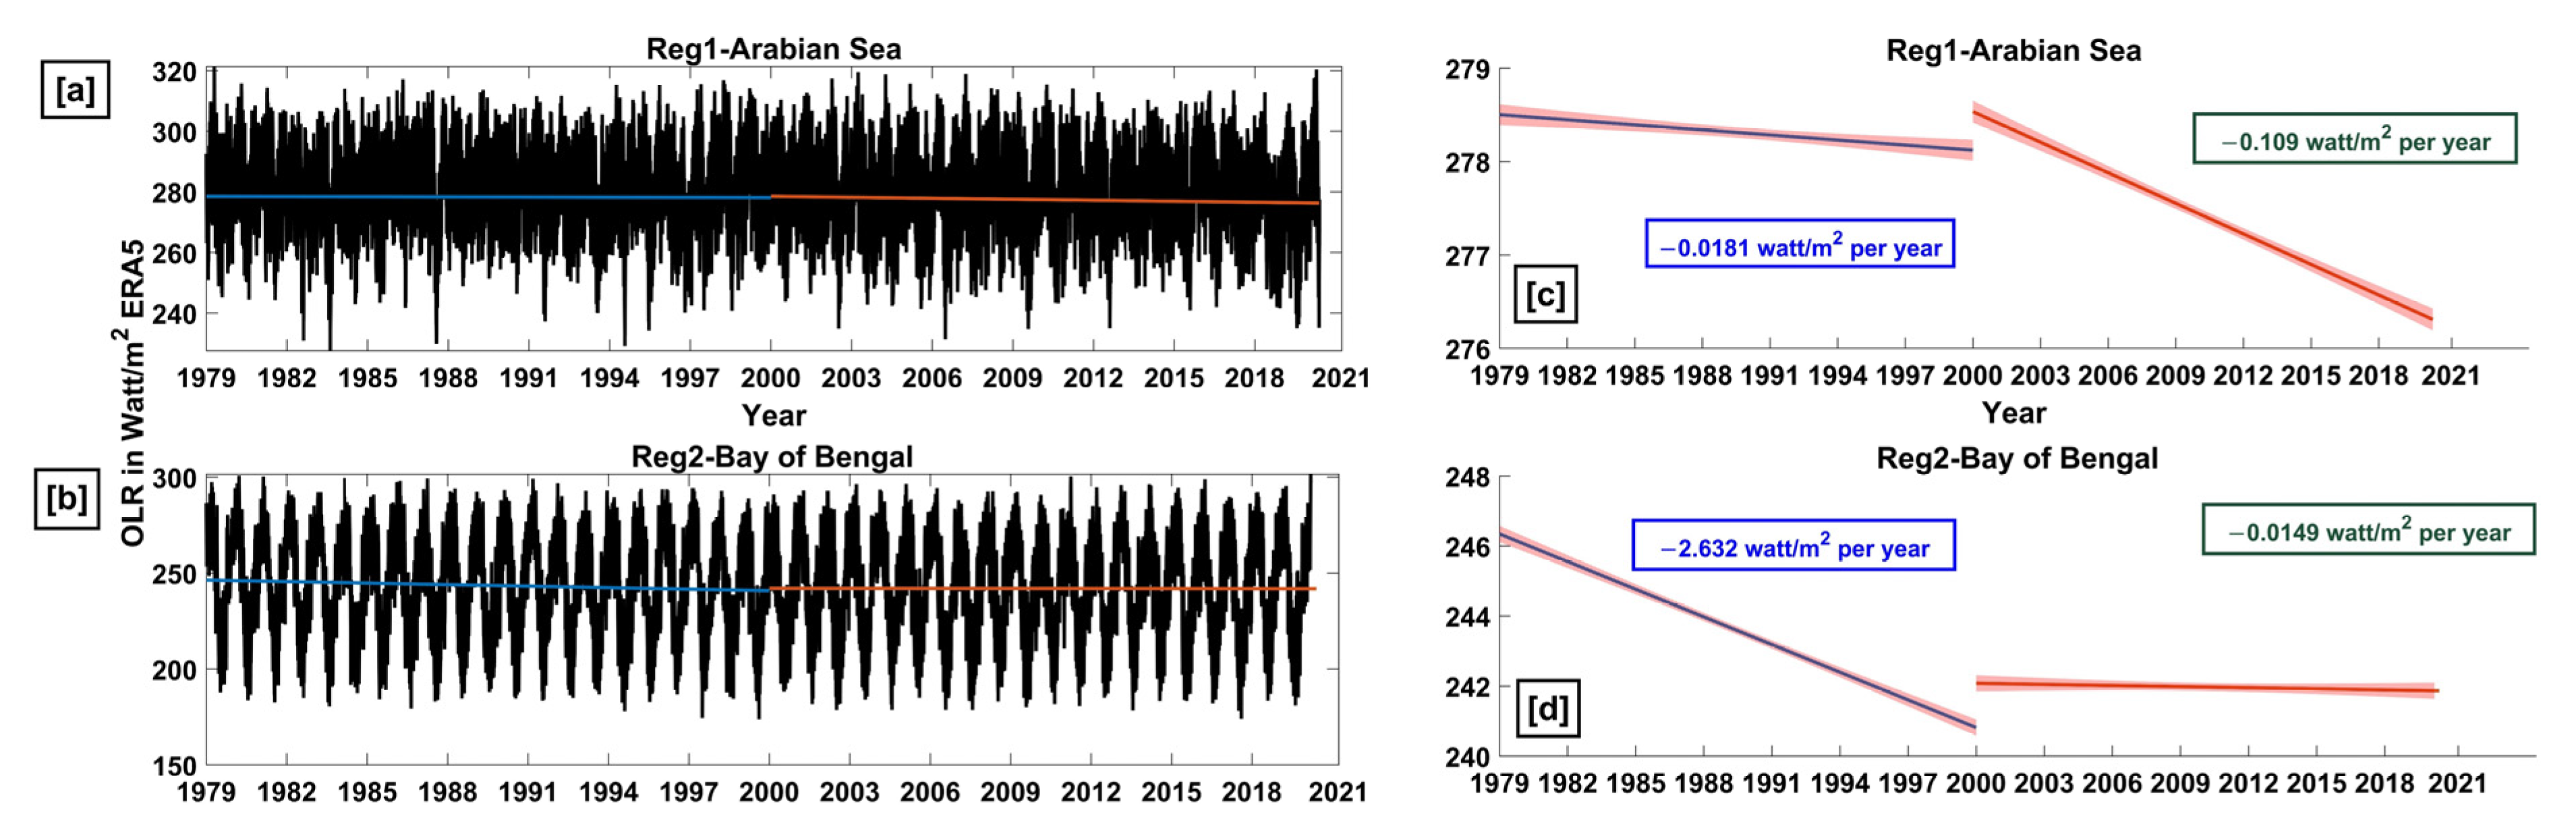
3.1. Analysis of Ocean Warming at Various Sub-Domains in the NIO

This study performed a detailed analysis to understand the variability in OHC utilizing the ORAS5 data for both the upper 300 m (D300) and 700 m (D700) water depths during the period 1979–2020. The spatial averaged OHC values were considered in the study domain that covers seven different sub-domains. Analysis was carried out on the time-series distribution of OHC data at D300 (Figure 2) and D700 (Figure 3) at all the seven sub-domains that represents the northern, central, and southern Indian Ocean regions.
Results suggest that the trends in general exhibited by D700 are relatively higher compared to D300 at all the seven locations (Figure 2 and Figure 3). Maximum trend value of D300 is observed at Reg 4 (Figure 2) that corresponds to the tropical South Indian Ocean connecting the AS portion and minimum for the ARB region (Figure 2). However, the highest variability in D700 is noticed at Reg 6 (Figure 3f) that corresponds to the western extra-tropical South Indian Ocean and the Southern Ocean regions (south of 60° S). The oceanic layers exhibit a uniform warming throughout the depth (D700 and D300) mostly over the western side of the Indian Ocean and the Southern Ocean. Additionally, it supports findings from the prior studies that reported on significant weakening of the Agulhas current transport, which reduces the southward heat transport out of the Indian Ocean resulting in heat accumulation over the southern regions [30].
To determine the requisite conditions that prevail over both the AS and BoB basins, it is required and necessary to perform a comparison of the OHC time series. The time-series trend in OHC considering two epochs (before and after the year 2000) over both the AS and BoB basins at D300 and D700 showed a distinct 10-year cycle (Figure 4). The top panel (Figure 4a) represents the D300 OHC distribution, and the sub-plots are for Reg 1 in AS (top-panel) and BoB (bottom-panel). It is clearly seen from Figure 4a, that prior to the year 2000, the OHC trend in the AS and BoB were decreasing at a rate of −0.45 × 10⁶ J yr−1 and −0.81 × 10⁶ J yr−1, whereas for the post-2000 period in both these basins, the OHC trend showed an increase at a rate of 2.8 × 10⁶ J yr−1 and 2.3 × 10⁶ J yr−1 with a higher increasing rate in the AS sector compared to BoB. Similarly, for the D700 OHC distribution (Figure 4b), it is evident that prior to the year 2000, the OHC trend in AS and BoB were decreasing at a rate of −0.072 × 10⁶ J yr−1 and −0.94 × 10⁶ J yr−1, whereas for the post-2000 period in both these basins, the OHC trend showed an increase at a rate of 4.32 × 10⁶ J yr−1 and 3.78 × 10⁶ J yr−1 with an higher incremental rate in the AS sector compared to BoB. It is interesting to note that the warming trend in AS since 1979 until the present (2020) has been consistent and the OHC warming trend for D700 is much higher (4.32 × 10⁶ J yr−1) as compared to the BoB (3.78 × 10⁶ J yr−1). The increased warming for AS in the present decade (2000–2020) is about 0.54 × 10⁶ J yr−1 higher compared to BoB and this enhanced warming in AS has a consequence on the TC activity.
The trends mentioned above clearly decipher that warming is consistent in the NIO basin, and the heat build-up in both the AS and BoB basins is a matter of concern. It is evident from the analysis period 2000–2020 exhibiting significant warming trends at both D300 and D700. For deeper water depths D700 the warming is about 1.54 (1.64) times higher compared to D300 for the AS (BoB) (Figure 4a) clearly indicating heat accumulation in deeper water depths.
Considering the deeper water, the warming trend at D700 over AS is almost 12.5% higher compared to the BoB. Similarly, the AS experiences almost 17.37% warming at D300 that is about half the OHC at D700 (Figure 4a,b). OHC depends not only on the heat inflow-outflow exchanges but also on the longwave radiative fluxes.
The clear indicator for global heating is contributed by the energy imbalance between the incoming solar radiation and outgoing longwave radiation due to the increase in the heat-trapping gases emitted by anthropogenic activities [92,93,94]. The residual net sea surface heat fluxes (Qnet) comprises the heat due to global warming in the global ocean basins [95]. The OHC anomaly is a better metric for the impact due to projected climate change. The present study carried out the estimation of trend analysis in Qnet (Figure S1), air temperature at 2 m height (Figure S2) and wind speed at 10 m (Figure S3) over the AS and BoB basins. The ocean heat content warming is substantiated by the decreasing net sea surface heat fluxes and increased air temperature along with the decreased wind speed. Prior studies indicate that the level of thermal energy progression reaches up to the 2000 m depth of ocean since the late 1950s until date. In this study, we examine the sensitivity of Outward Longwave Radiation (OLR) towards the variation of OHC in both AS and BoB basins (Figure 5). Increased heat storage in the AS waters has a correlation with decreased OLR (−0.109 W m−2) during the past two decades (Figure 5a). Instead, a less significant decreasing trend in OLR values (−0.0149 W m−2) are seen over the BoB for the same period (Figure 5b).

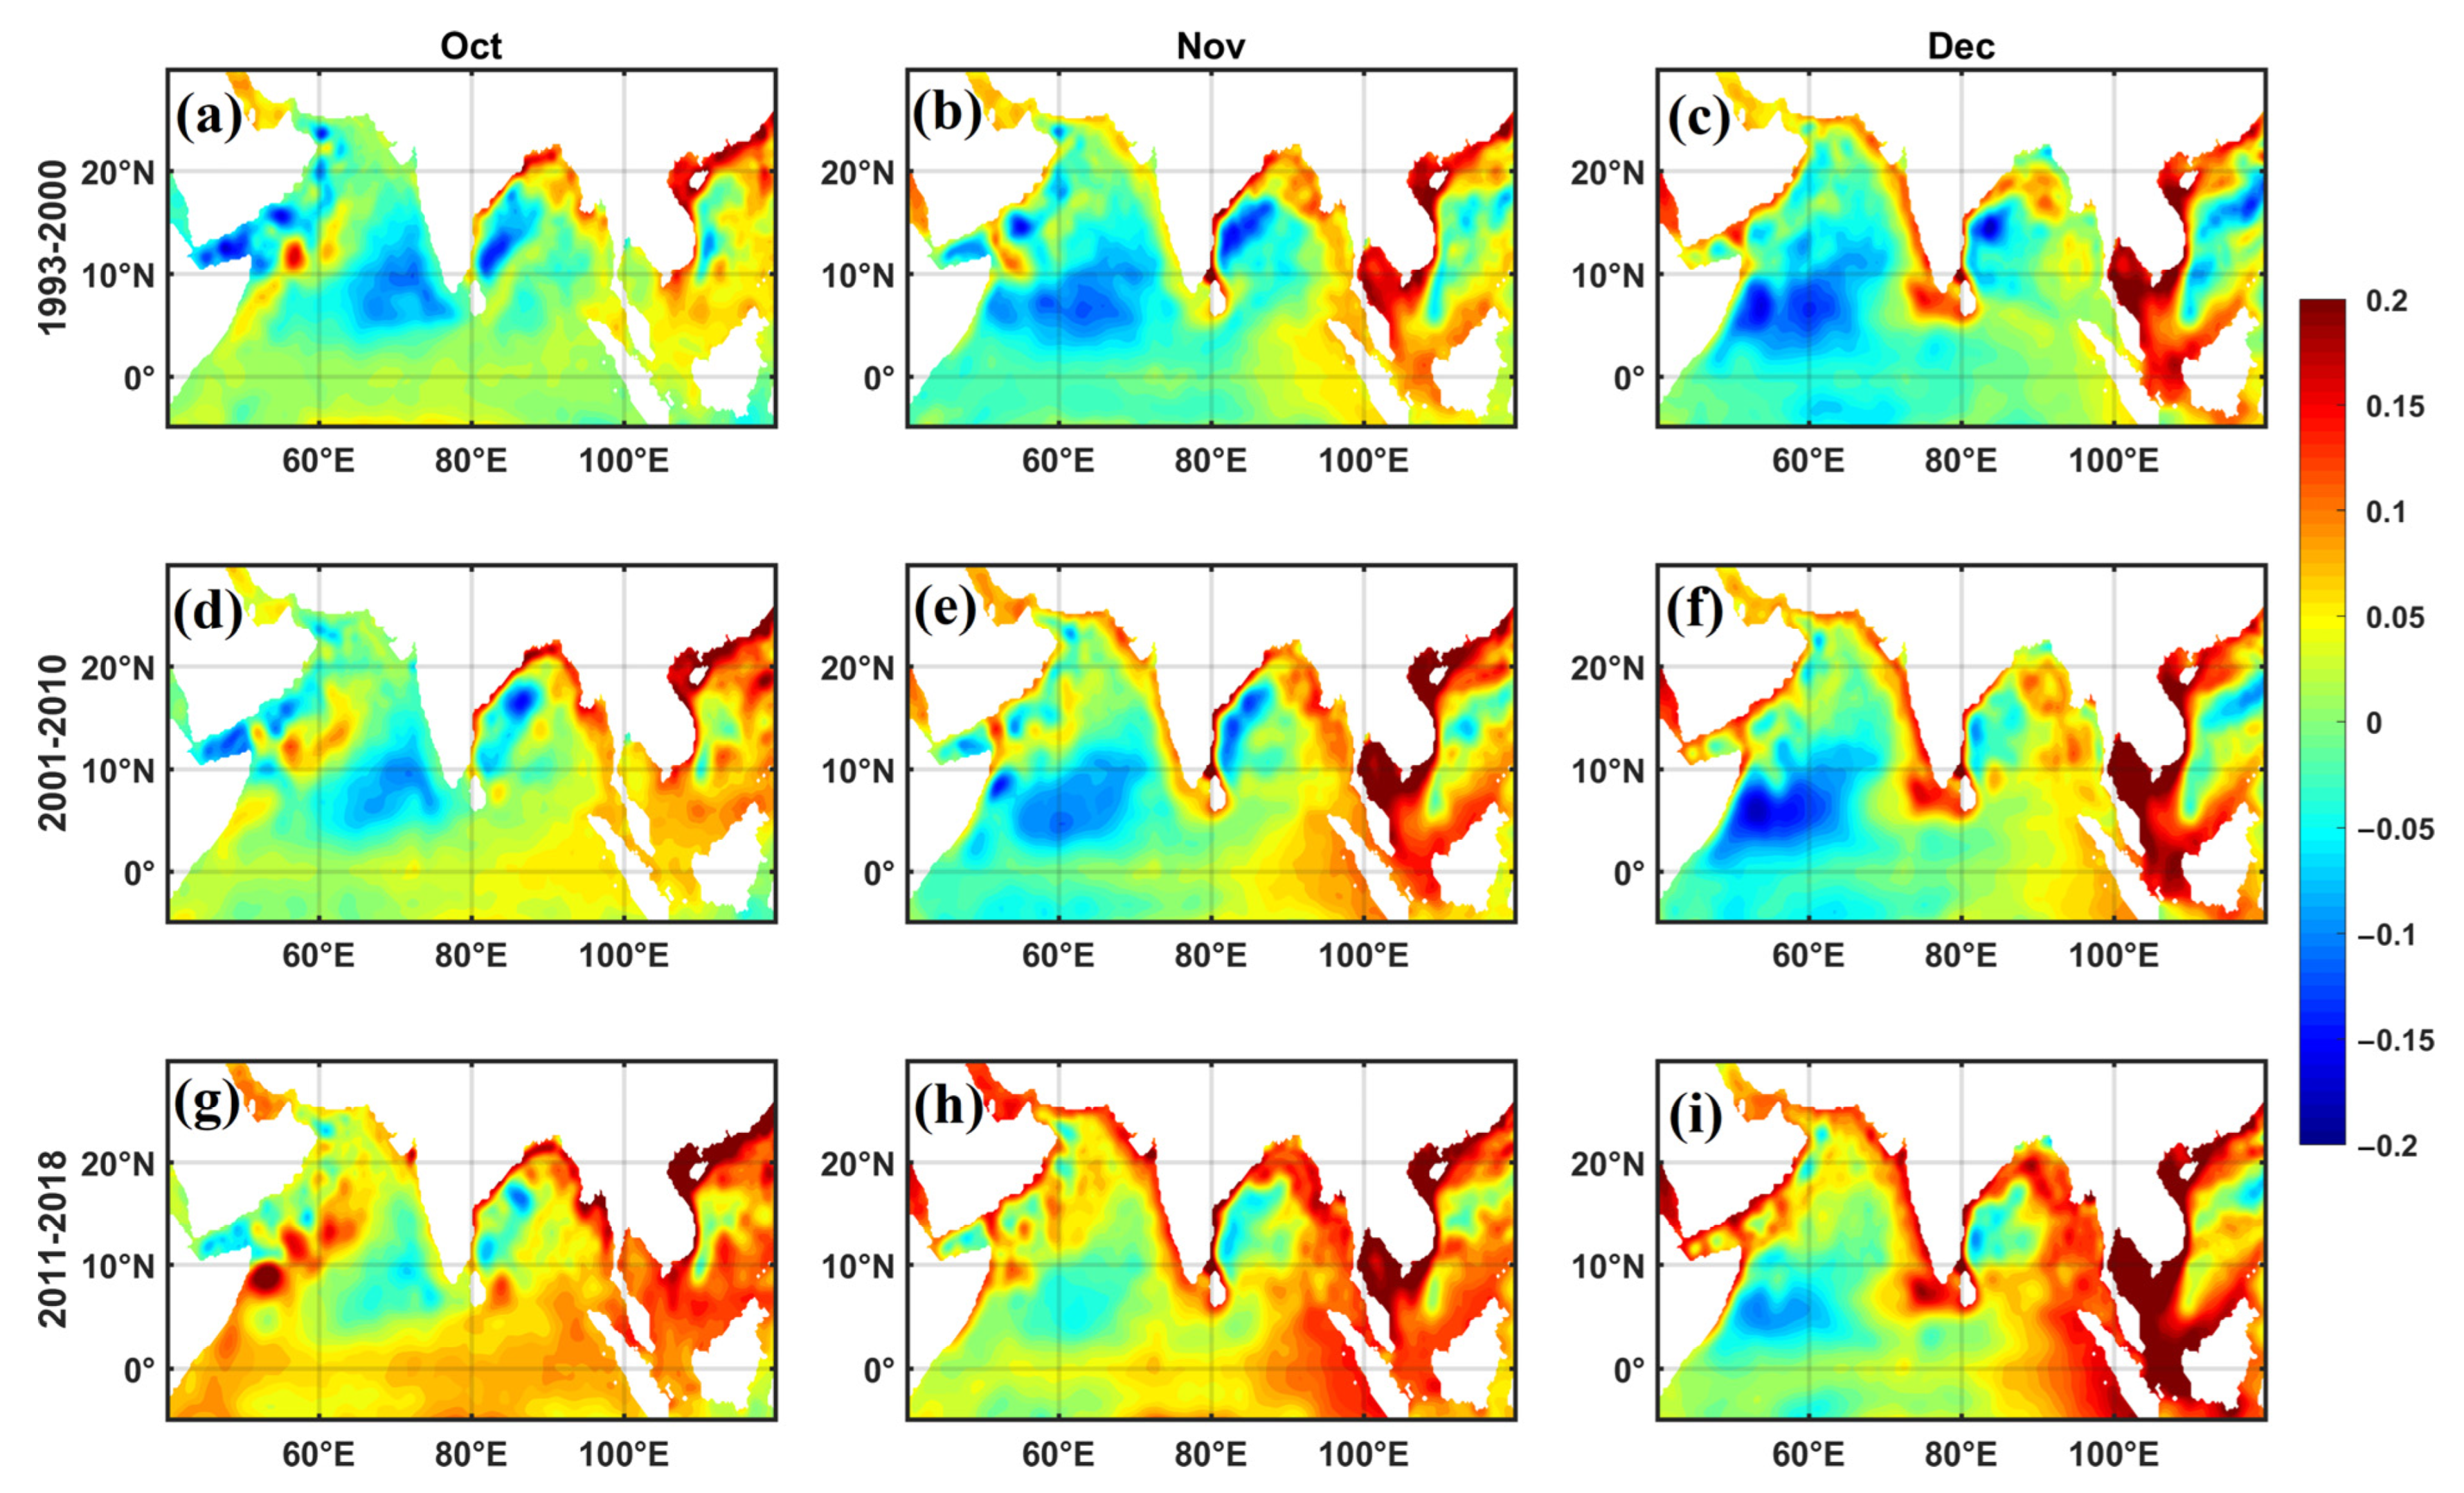
3.2. Role of Second Downwelling Kelvin Wave

The spatial variation in SSHA representing the propagation characteristics of second downwelling Kelvin wave in the NIO region during October–December is shown in Figure 6. The propagation of the second downwelling Kelvin wave (high SSHA) initiates from the EIO in October (Figure 6a) due to the favorable conditions formed by the presence of westerly winds over the EIO [60,62]. The propagation Kelvin wave reaches the southern tip of Sri Lanka by November leading to high sea level (Figure 6b) along the coast of BoB as a coastally trapped Kelvin wave. This high sea level further extends westward during December with an increase in its intensity, reaches the Lakshadweep Sea and forms increased sea level known as Lakshadweep High (Figure 6c) [58,67]. This formation of high further leads to the development of high SST in the SEAS [69,96]. Ref. [97] proposed the importance of the Kelvin wave propagation in generating the favorable conditions for the formation of SST high in the SEAS. High SSHA associated with the warm SST extends further southwestward towards Somalia coast as a function of time [60,69]. Furthermore, from Figure 6, it is evident that strength of downwelling Kelvin wave has significantly increased from first altimetric decade (1993–2000) to the recent decades (2011–2018). The time series plot of longitude versus time for SSH anomaly averaged for the equatorial region (−2.5° S to 2.5° N) is shown in Figure 7. It clearly depicts the eastward propagation and decadal increase in the strength of the Kelvin wave in recent years.
The current system associated with this second downwelling Kelvin wave transports the fresh, low-saline waters from BoB basin to the Southeastern AS (SEAS) during the post-monsoon season [58,67,98]. The intrusion of low-saline freshwater leads to the formation of temperature inversion causing significant increase in SST during November to February which in turn increase warming over SEAS [67,96,97,99,100]. The decadal mean SST variation averaged over SEAS (Figure 7d) clearly shows the increase of warming trend during the post-monsoon season. A substantial increase in warming caused by strong influx of low-saline water into SEAS attributes due to increased strength of Kelvin wave propagation. Thus, this observed warming in the post-monsoon season play a major role in formation of Arabian Sea warm pool in the following season [68]. The westward propagating Rossby wave associated with the deepening of thermocline is radiated due to propagation of this Kelvin wave system [63,68]. The decadal variation in SSHA and the thermocline depth (D20) averaged over the latitudinal band (2° N–12° N) is shown in Figure 8. The clear westward propagation high SSHA is evident in each decade depicts the westward propagation of downwelling Rossby wave that is radiated due to the propagation of downwelling Kelvin wave. The decadal variation also shows that the increase in the strength of downwelling Rossby wave increases with each decade that could also play an important role in warming the southern regions of AS from December to April. In addition, the deepening of thermocline associated with the propagation of Rossby wave is also seen increasing in the recent decades. Increased strength in currents and heat transport from BoB to AS through the East India Coastal Current (EICC) result in warming during the winter season is discussed in the following section.
The uncertain distribution of enhanced SST’s and it inter basin tele-connections are still a question of debate today for the researchers [101]. The presence of an inter-basin teleconnection dipole between the warmer Atlantic and Indo-western Pacific with cooling over eastern Pacific is prominent during the past three decades [101,102].
During the past three decades, tropical sea surface temperature (SST) had shown dipole-like trends, with warming over the tropical Atlantic and Indo-western Pacific but cooling over the eastern Pacific. Variations in SST over the tropical Indian and Atlantic Oceans can modulate Pacific SST on interannual and decadal timescales. The Atlantic warming energize the easterly wind anomalies over the Indo-western Pacific as Kelvin waves and westerly anomalies over the eastern Pacific as Rossby waves. The wind changes induce an Indo-western Pacific warming exclusively focusing over the Arabian Sea through the wind–evaporation–SST effect [103,104]. Arabian Sea warming is possibly one of the residual effects of this inter-basin teleconnections involving the propagation of Kelvin and Rossby waves. Study by [102] suggested the growth of stronger connection in the recent past between the tropical ocean basins based on the evidence from climate models. More enhanced warming trends over the Arabian sea can be expected in the near future.

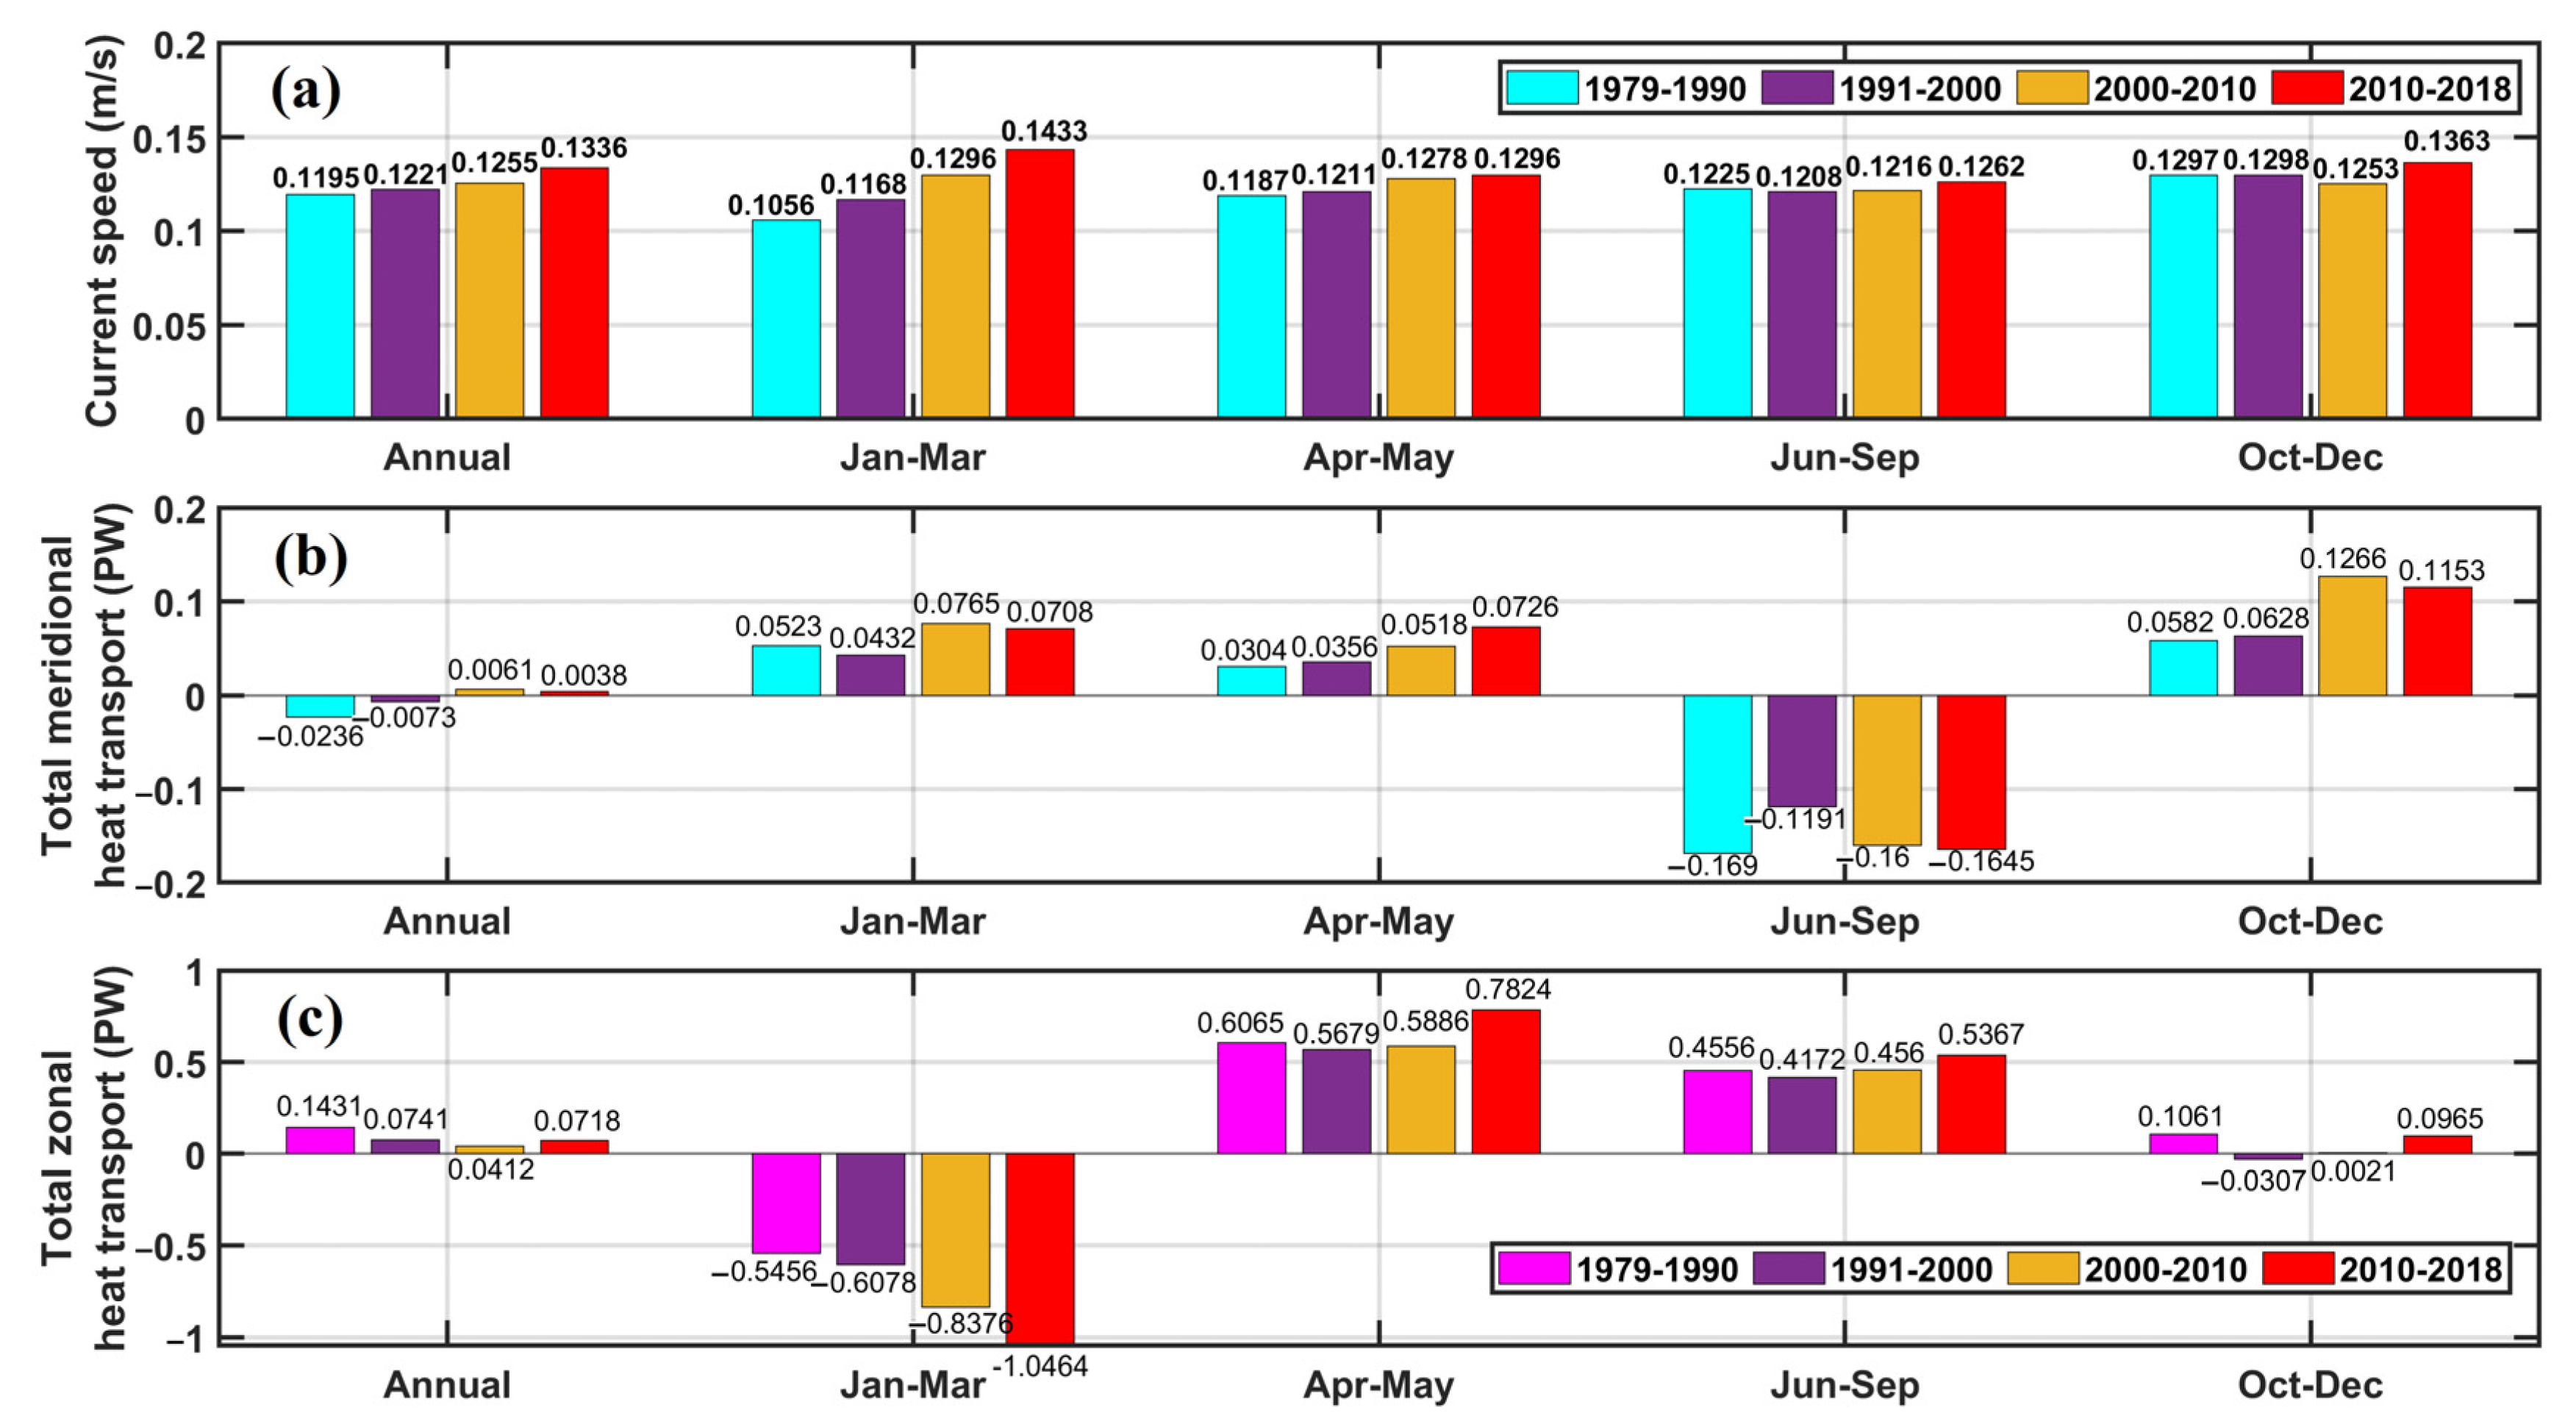
3.3. Inter-Basin Scale Heat Transport

The EICC current system that flows equatorward from November in the BoB feeds the westward propagating Winter Monsoon Current (WMC) that flows south of Sri Lanka transporting low-saline waters from the BoB to the eastern AS. During the mature phase of WMC from December to February, the westward flowing WMC bifurcates into two branches, one flowing northward around the Lakshadweep high and merges into the poleward flowing West Indian Coastal Current (WICC). The other branch flows westward direction reaching the southern regions of the AS [58]. The schematic representation of circulation during winter monsoon is shown in Figure 1. The decadal variation pertaining to the current and heat transport from BoB is estimated for two regions (D1 and D2) as shown in Figure 1. One of the regions lies in the passage between the equator and Sri Lanka (D1, 2° N–7° N, 73° E–82° E) and the other lies in the AS mini warm-pool region (D2, 4° N–14° N, 68° E–78° E). The selection of the study region that is the passage between the equator and Sri Lanka is important, as the summer monsoon current and WMC flows through this region connecting the AS and the BoB basins. It is the only region that has a straight flow without having any meandering flow [58].
The decadal variation in currents and the total meridional, zonal heat transport averaged over D700 for D1 and D2 are shown in Figure 9 and Figure 10, respectively. Results indicate a strong decadal increase in current speed during the winter in both the domains. However, the current magnitude is seen strengthening in the recent years during winter as compared to the other seasons. Consistent with the current speed, the westward heat transport from BoB during winter also show a substantial increase during the recent decades. It is this decadal increase in heat transport which is one of the causative factors playing an important role in warming over AS during the winter season.

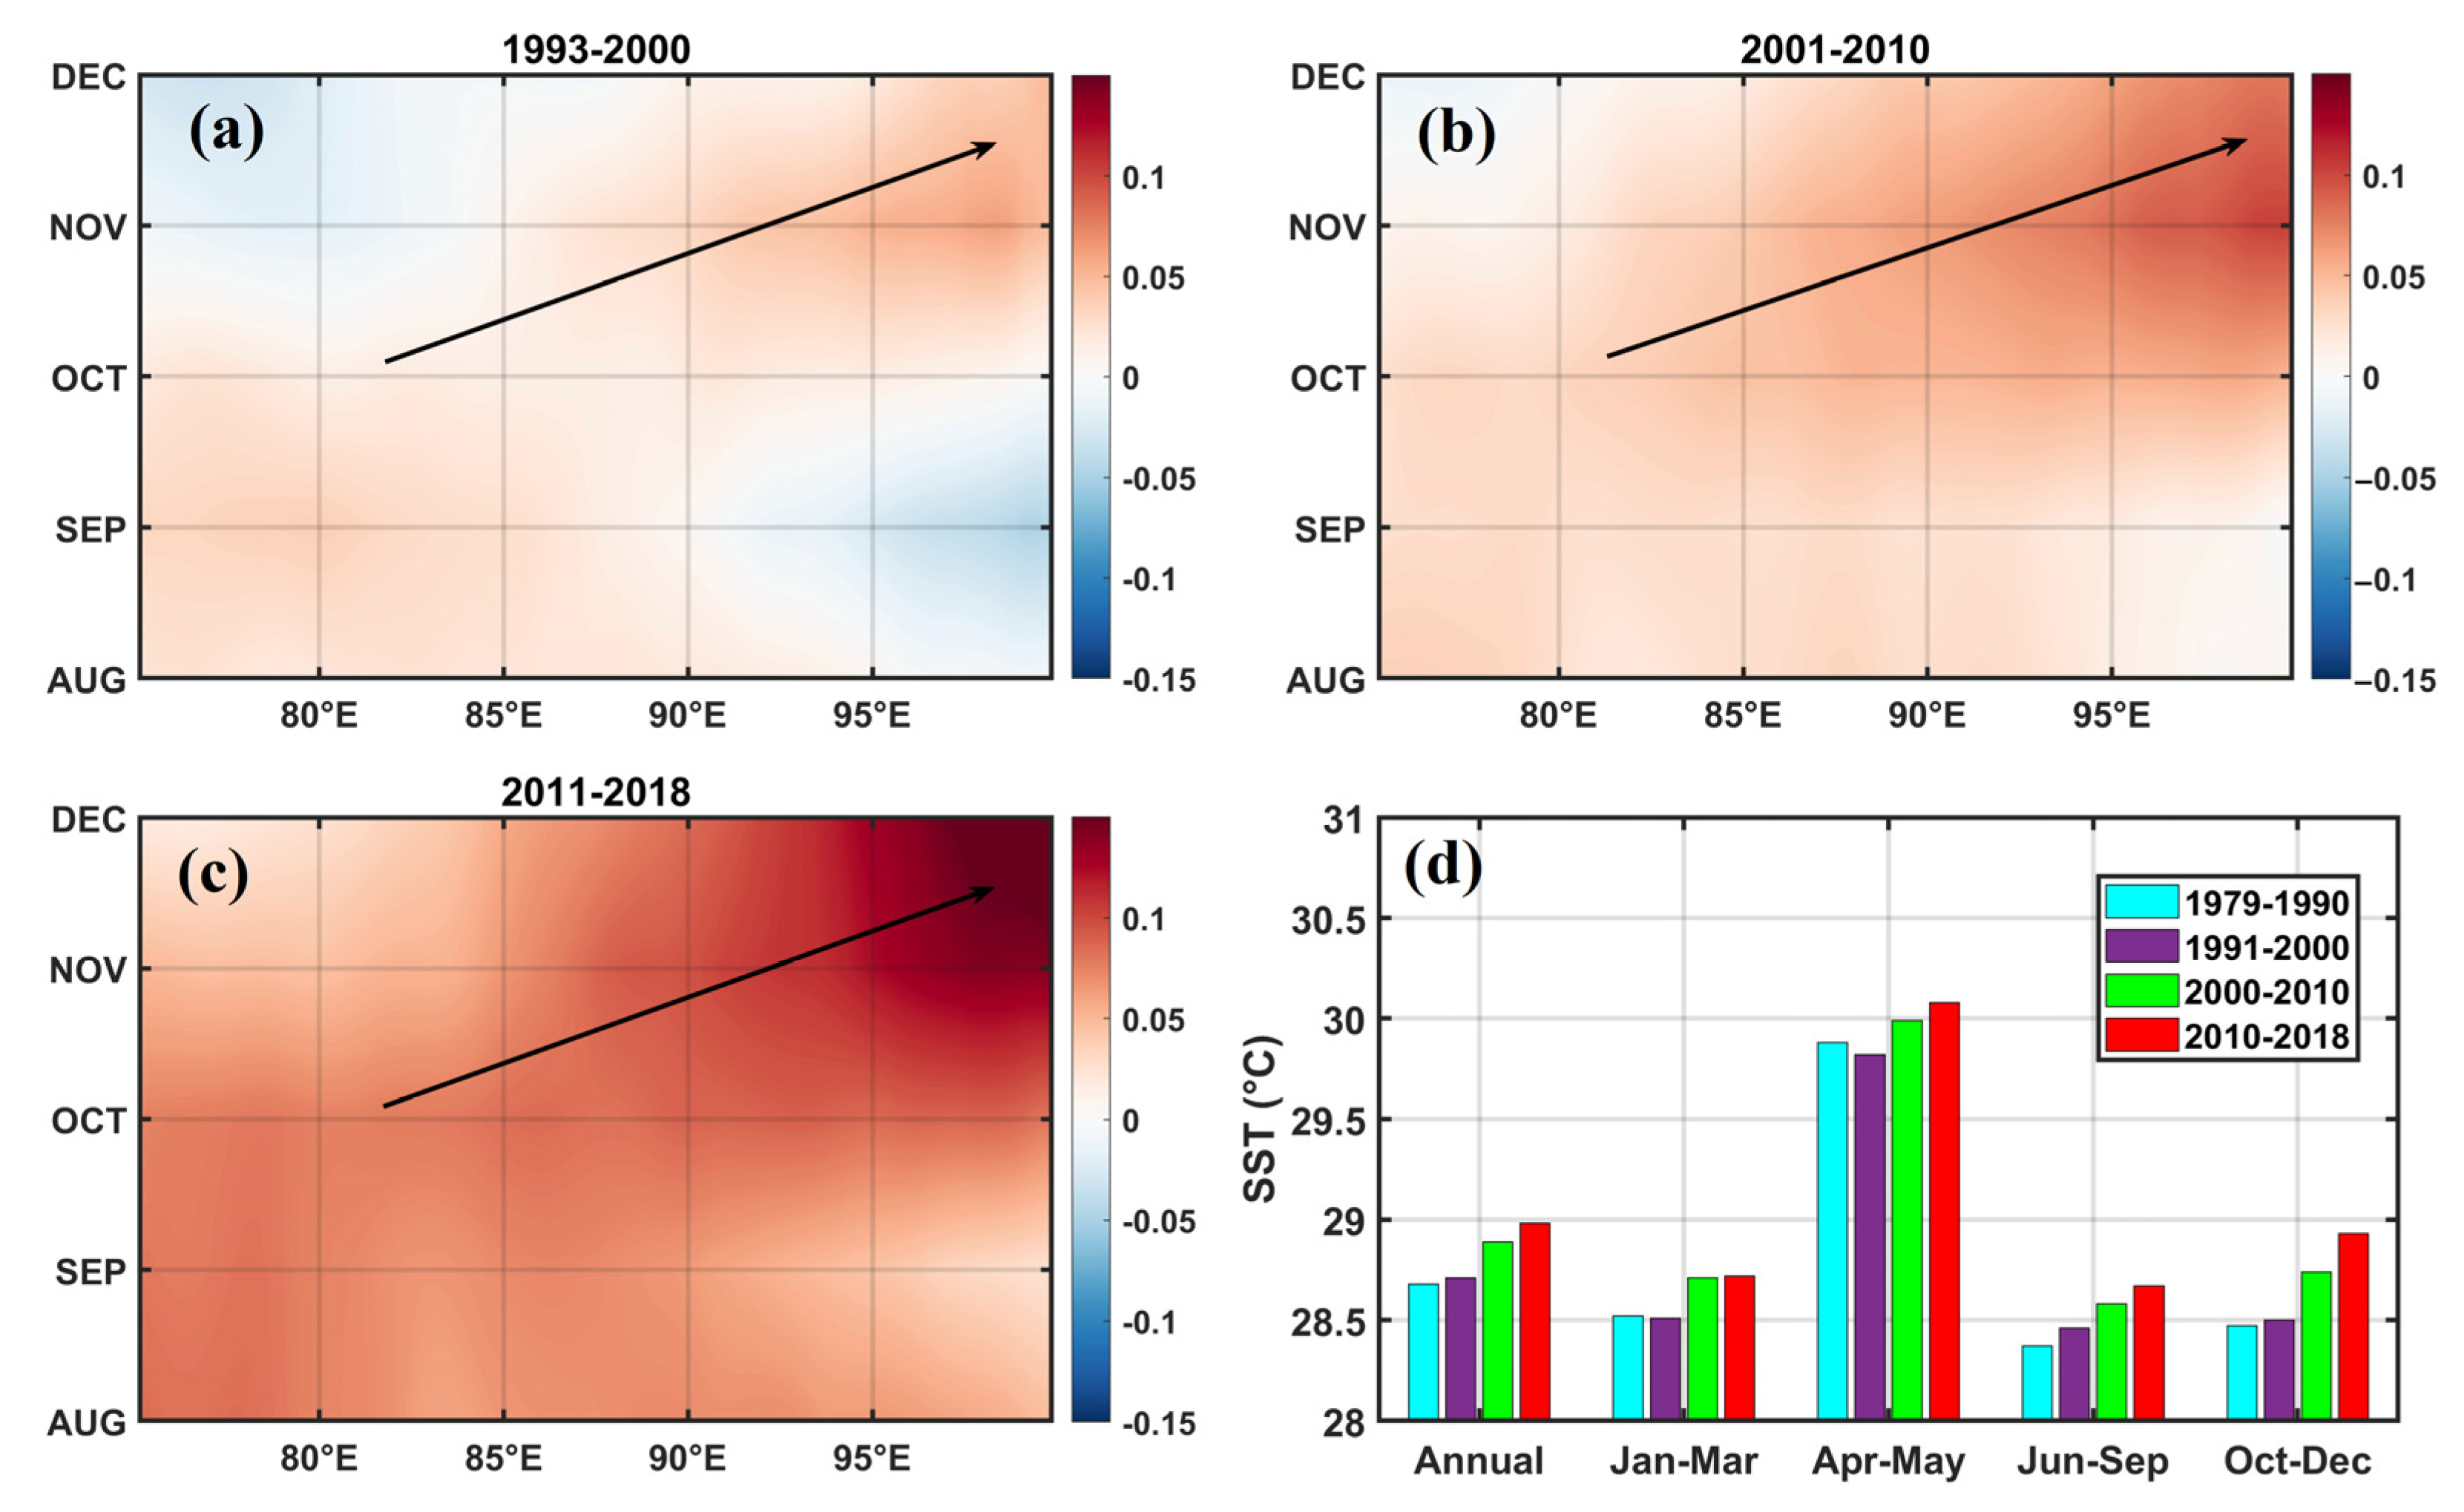
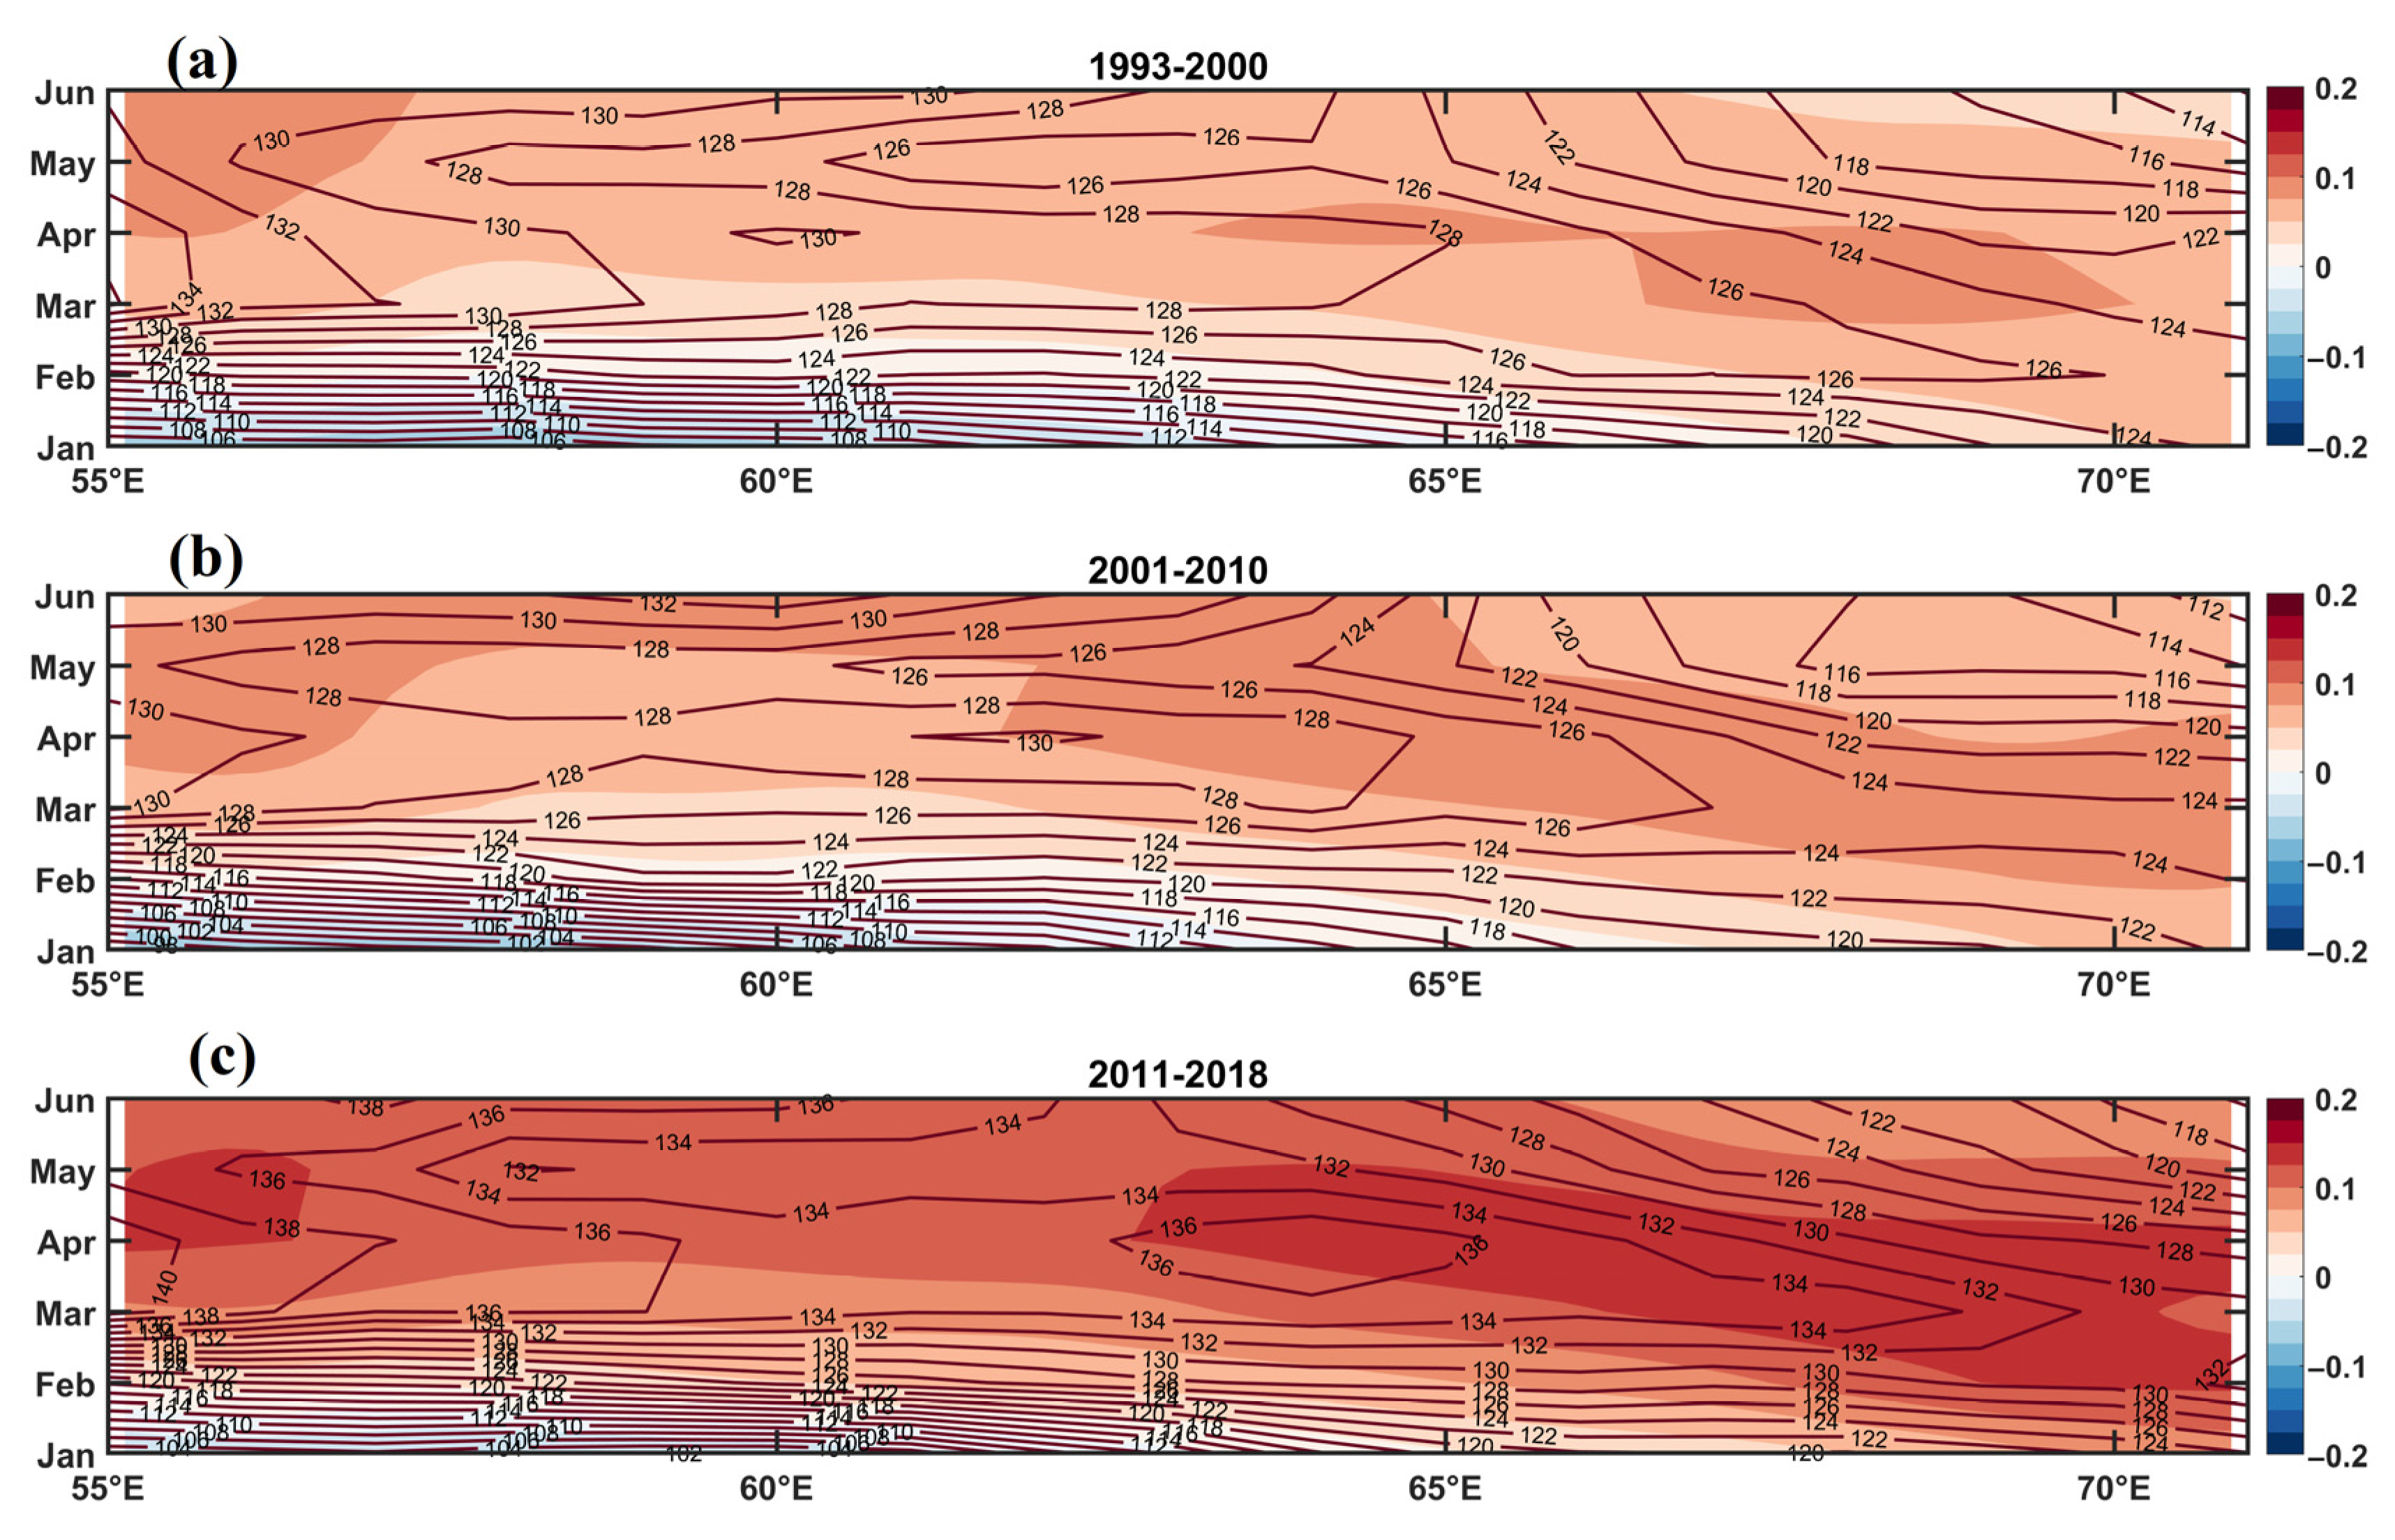
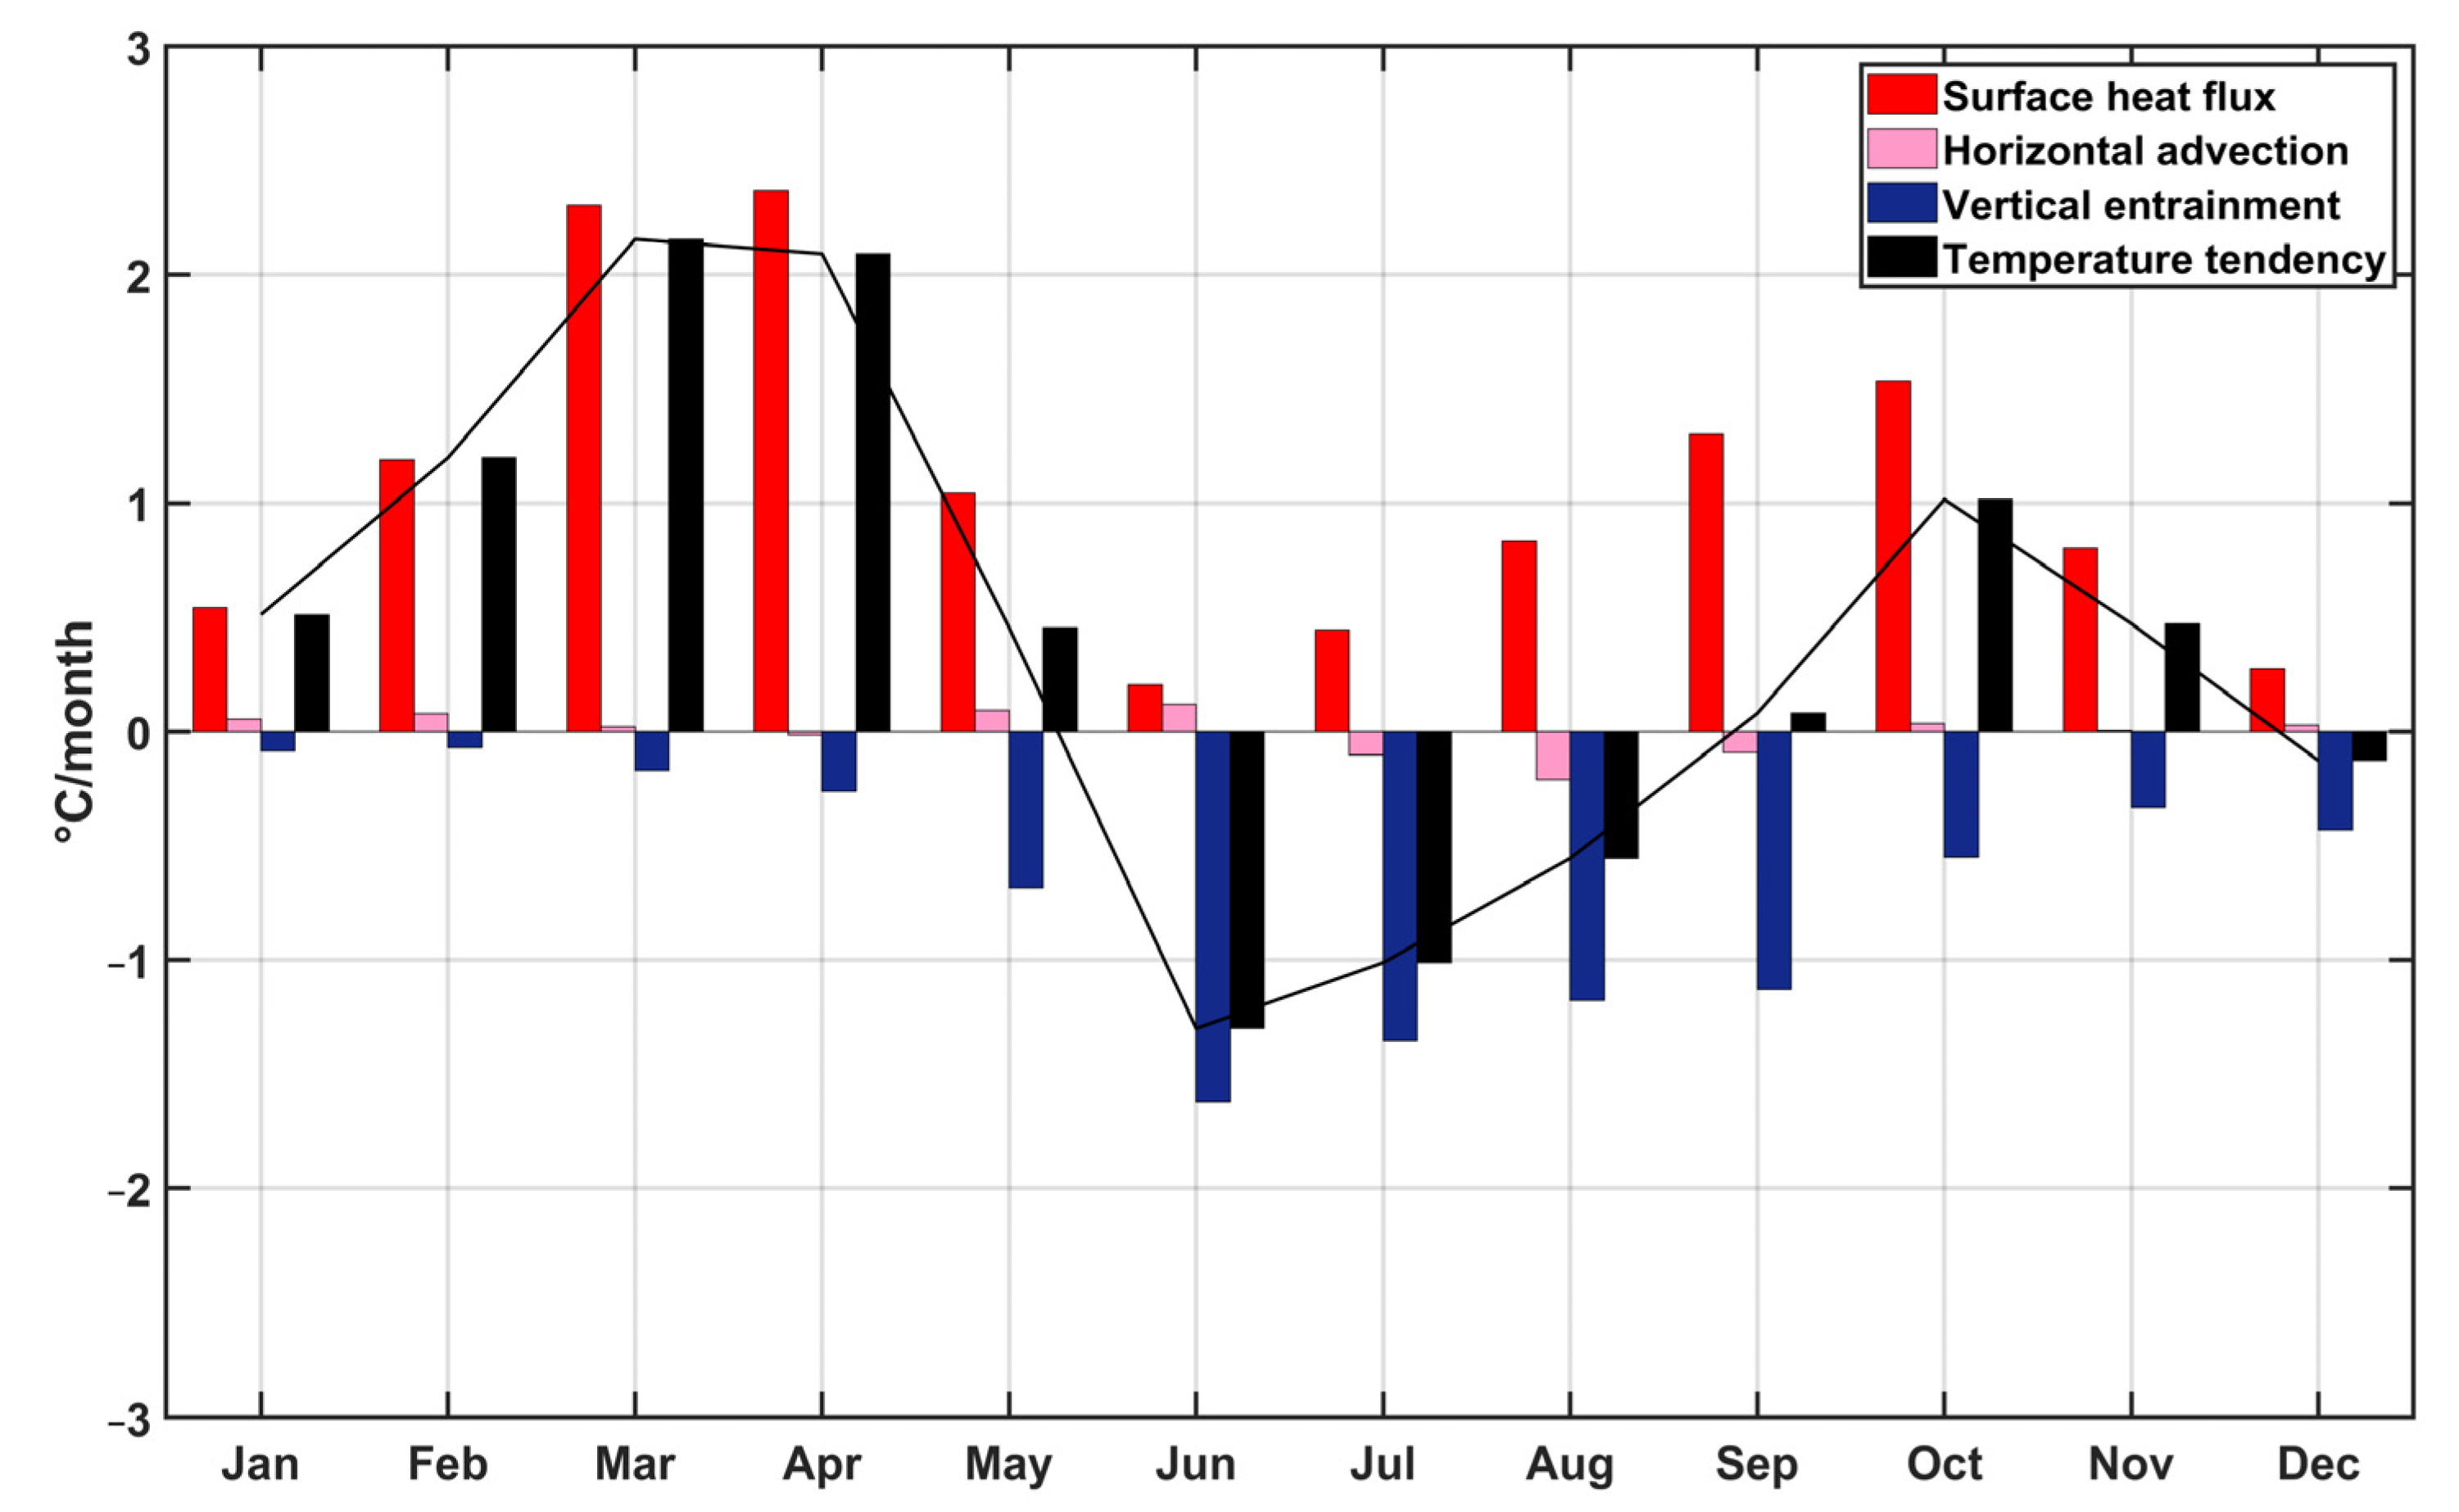
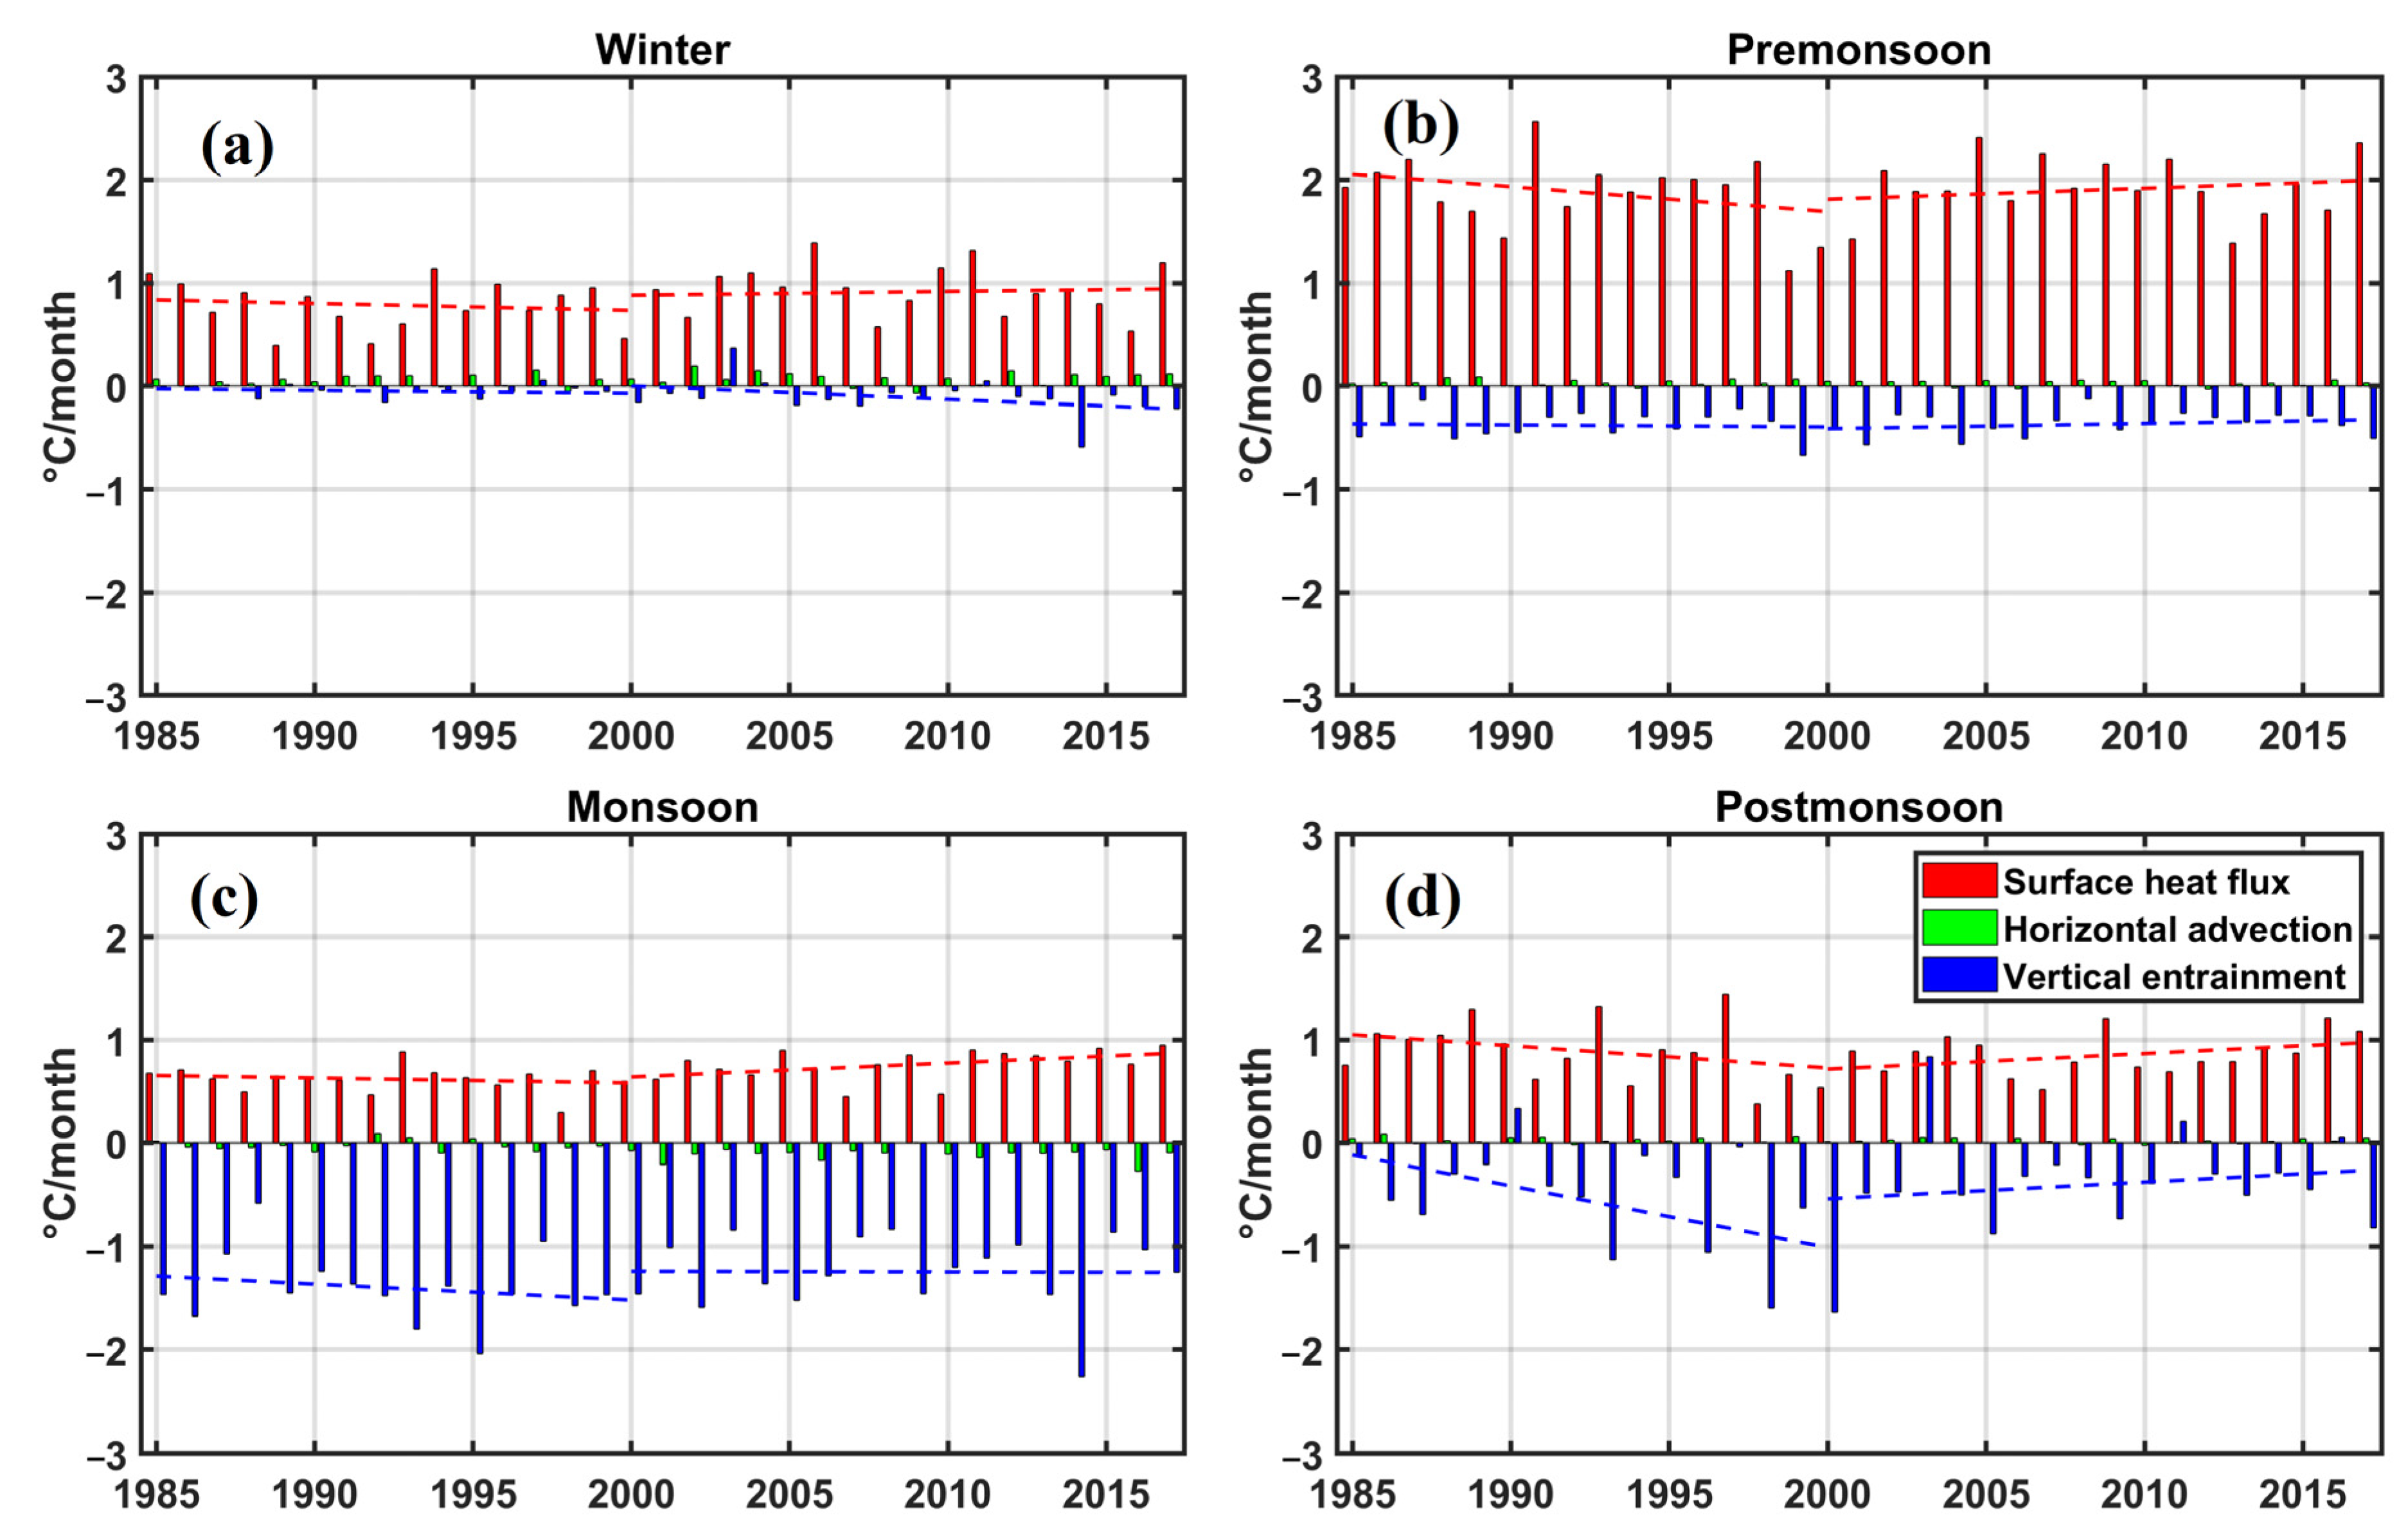
3.4. Role of Surface Heat Flux and Entrainment in the SEAS

The physical processes responsible for increased warming trends in the SEAS are estimated using the heat budget analysis. The climatological monthly variation of surface heat flux, horizontal advection, vertical entrainment averaged over a period of 33 years are shown in Figure 11. Results clearly indicate that surface heat flux is the dominant factor that is responsible for warming in SEAS during the winter season, whereas vertical entrainment plays an important role during the monsoon season [105,106]. The trend analysis for each term in different seasons are shown in Figure 12. It is seen that for the pre-monsoon season, wherein the temperature tendency mostly depends on surface heat fluxes, a decreasing trend is noticed from 1985 to 2000. In the recent years, from 2000 onwards the surface heat flux exhibited an increasing trend, and that is consistent with increased warming over SEAS during this season. Vertical entrainment, the second dominant term showed a decreasing trend during the recent years indicating that the cooling effect caused by entrained water into the mixed layer also decreased during the recent years.
Surface heat fluxes play an important role in other seasons, with an increasing trend during the recent years. Vertical entrainment showed a decreasing trend indicating declined cooling in the mixed layer depths during both pre- and post-monsoon seasons, whereas during the winter (not significant) and monsoon periods an increasing trend is observed.

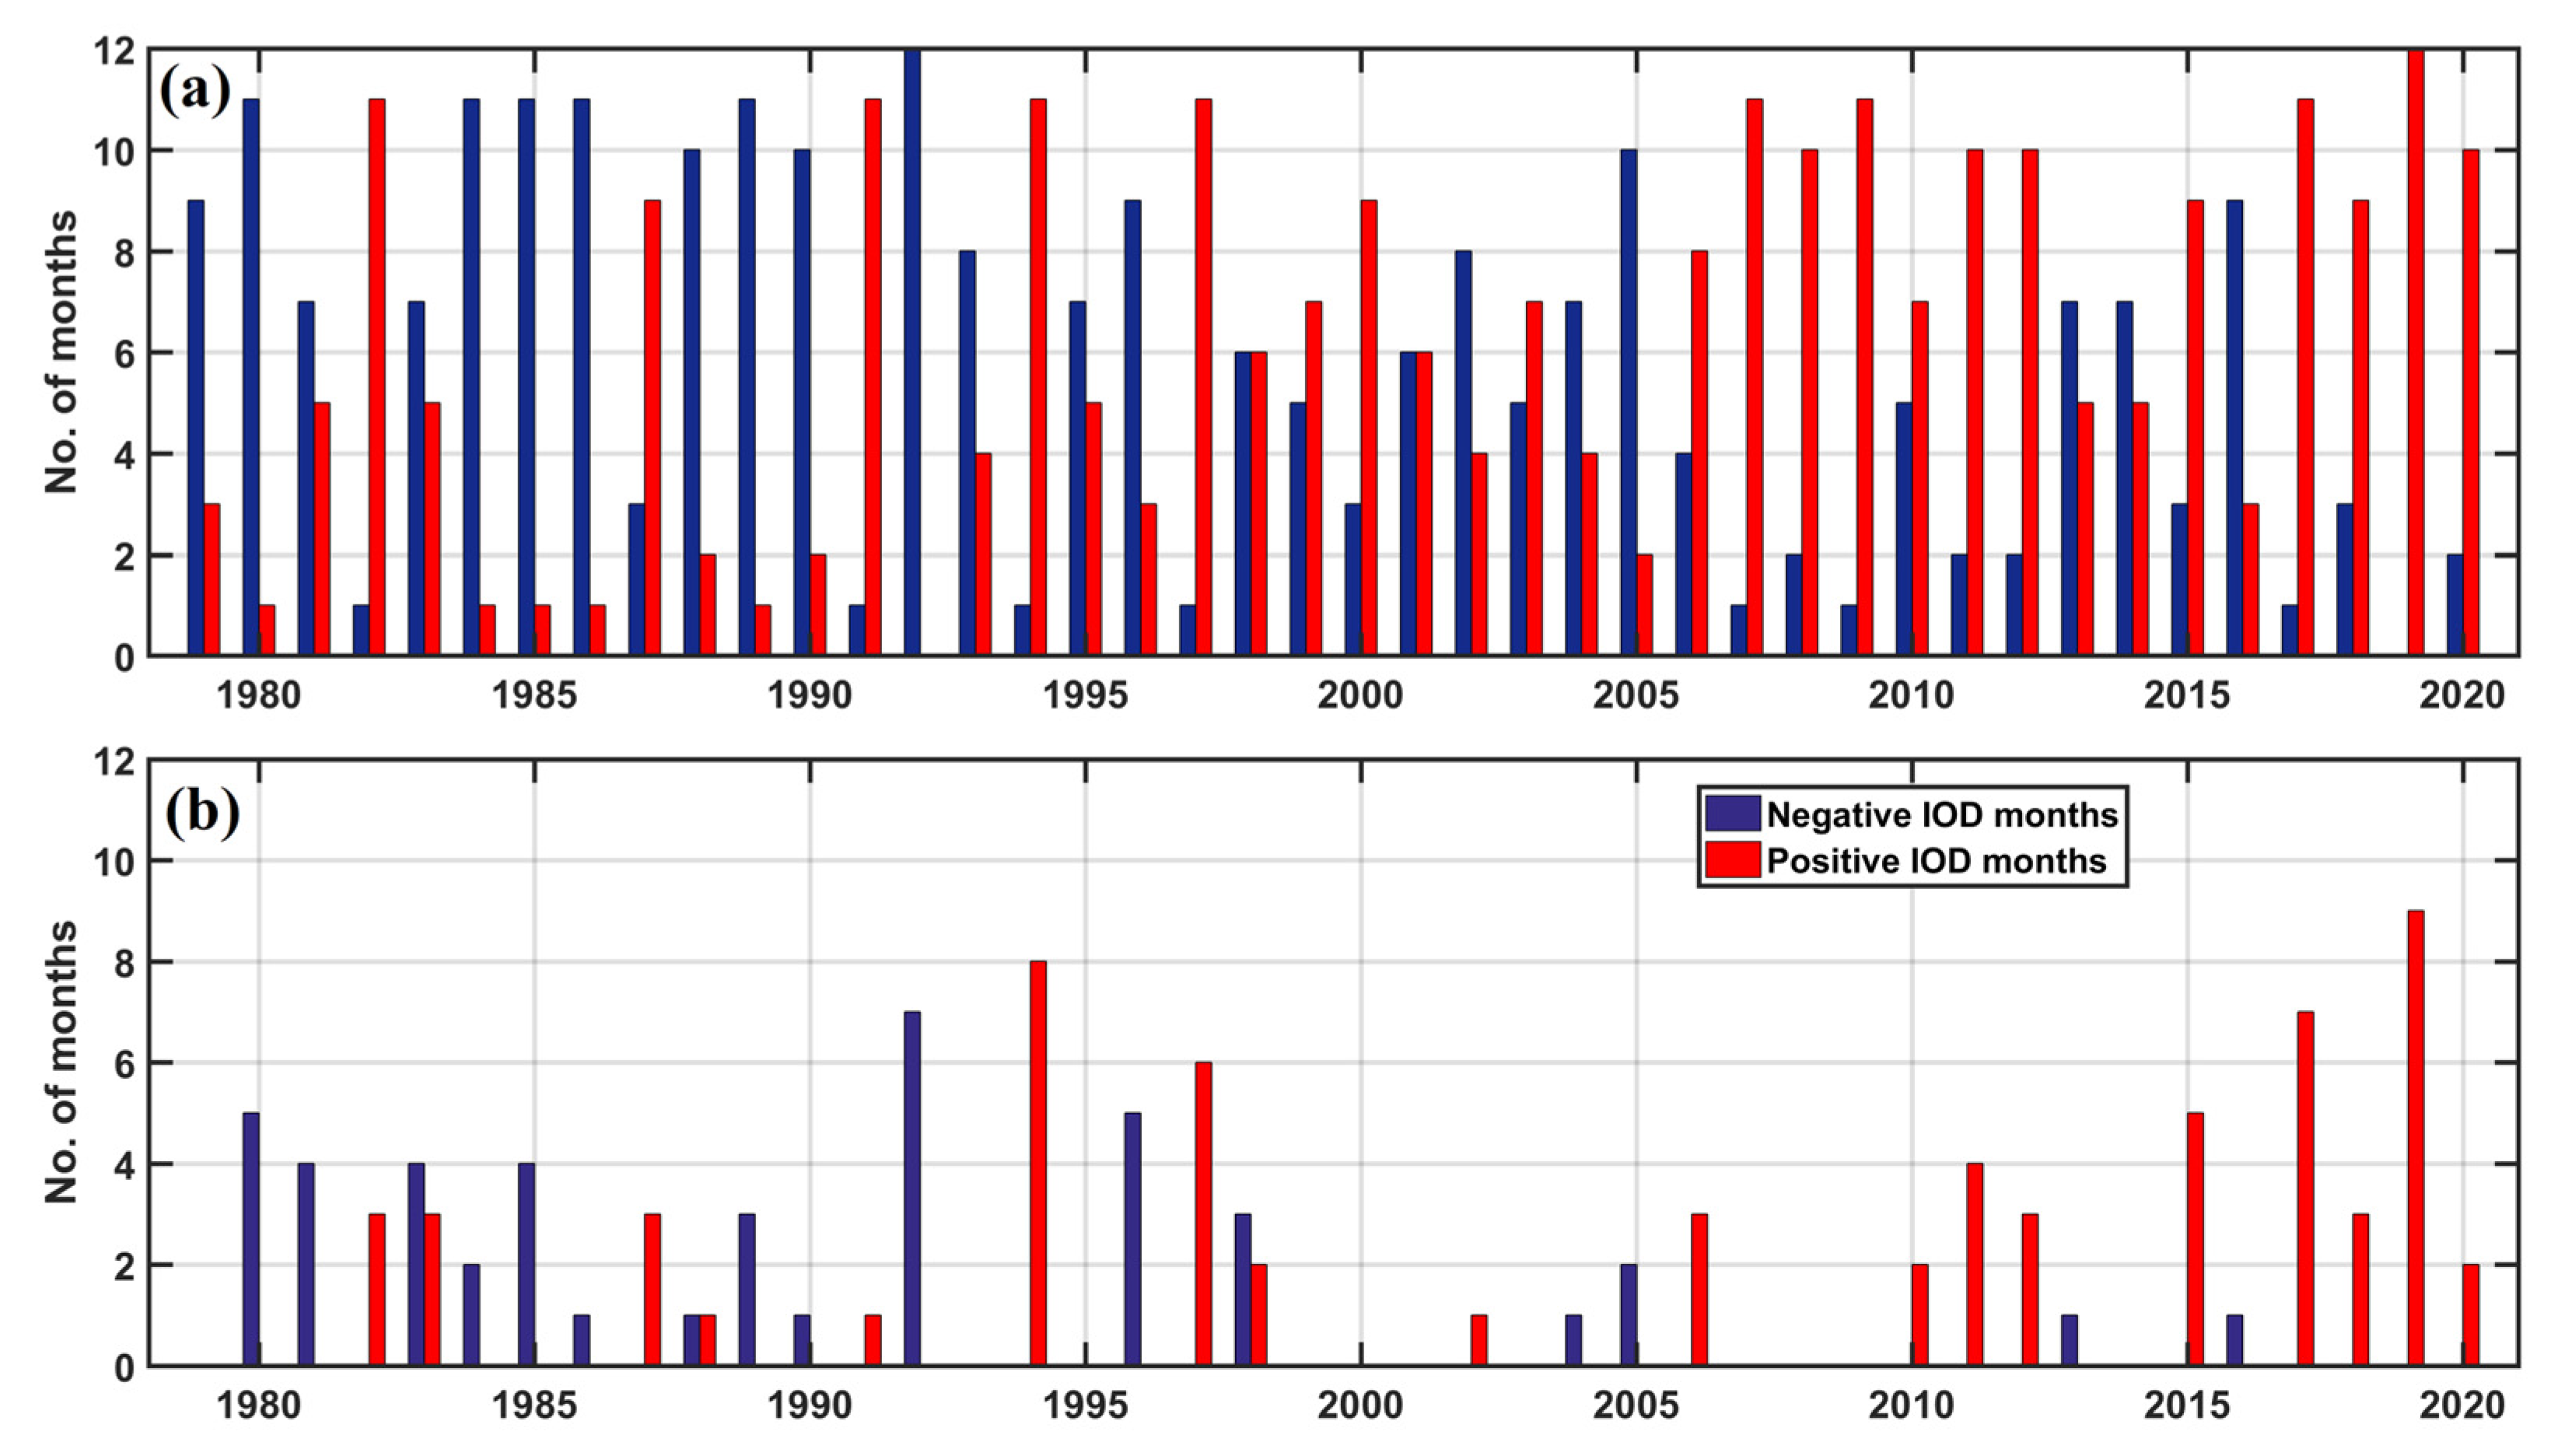
3.5. Frequency of Positive Indian Ocean Dipole (IOD) Months

The positive (negative) IOD months are characterized as unusual warming (cooling) in the western IO and cooling (warming) over the southeastern IO regions. The positive IOD leads to drought conditions in Indonesia, lower rainfall than the average value over many parts of Australia and flood events in east Africa [107] and vice-versa for the negative IOD events. The frequent occurrence of positive IOD events might play an important role in increasing the weather extremes [108]. The total number of positive and negative months per year based on the Dipole Mode Index (DMI) is shown in Figure 13. It is evident that the frequency of positive IOD months are increasing in the recent years, whereas the negative IOD months are declining. The results clearly suggest that the occurrence of positive IOD events are escalating in recent years could be associated with increased warming of AS in the recent years. The escalation of positive IOD events and warming of AS could be attributed to the recent increase in frequency of extreme weather events such as extreme severe cyclonic storms over the AS basin.

4. Conclusions

This study investigated the causative factors, possible physical mechanisms, and the characteristic feature of ocean parameters leading to the multi-decadal variations in the sub-surface ocean heat content over the North Indian Ocean region. It analyzed the historical observational data and thereby quantified the heat transport. Specifically, the study focused on the unique warming trends in the Arabian Sea region that recently experienced enhanced tropical cyclone activity. A detailed investigation was carried out using observational data products, derived heat transport, currents, temperature, salinity, outgoing longwave radiation, and the air-sea fluxes to quantify sub-surface warming trends in the past four decades. The causative factors and the underlying physical mechanisms responsible for increased warming have been reported. The main findings from this study are summarized as follows.
The study examined the causative factors and various physical mechanisms responsible for the warming trend in the Arabian Sea region using altimetric observations and reanalysis products. Among the different factors that contribute to warming in the Arabian Sea, the western regions of the Indian Ocean and Southern Indian Ocean region exhibited the highest variability in sub-surface ocean heat content. Warming in the deeper ocean layers is more significant compared to the upper layers in the Arabian Sea, wherein the trend is relatively imperceptible in the Bay of Bengal region. Sub-surface warming in the Arabian Sea is more prominent among the seven Indian ocean sub-domains considered in this study. Increased heat content is observed along with decreased trends in the Outward Longwave Radiation over the past 20 years. Whereas, a significant decreasing warming trend is noticed for the Bay of Bengal during this period. Significant evidence from the large-scale circulation features enhancing Arabian Sea warming are also observed during the study. Altimetric observations reveal strengthening of second downwelling Kelvin wave propagation that causes warming over the eastern Arabian Sea attributed due to strong influx of low-saline waters from the Bay of Bengal leading to near-surface stratification. Rossby wave associated with the deepening of thermocline causes warming over the southern Arabian Sea during its propagation. Estimated heat transport through the conveying channel from Bay of Bengal to the Arabian Sea basin in the upper 700 m water depth increased rapidly in recent years during winter, and that plays a significant role in warming the southeastern Arabian Sea. Heat budget analysis reveals that the surface heat fluxes play a dominant role in warming the Arabian Sea during the pre-monsoon season. The increasing (decreasing) trend of surface heat fluxes (vertical entrainment) during 2000–2018 play a significant role in warming the southeast Arabian Sea. Additionally, increasing (decreasing) positive (negative) DMI months during the recent years has a relation with increased warming in the western Indian Ocean and southern Arabian Sea regions. The escalation of positive DMI months in recent years has a relationship with the increased occurrence of extreme weather events in the Arabian Sea.
The current study demonstrated the indication of warming and heat entrainment over the Arabian Sea basin especially over the southeastern subdomain region. The comprehensive ocean model analysis is warranted to quantify the incoming heat source to the Arabian Sea and outgoing flux rates, to measure the heat trapped inside ocean waters. The results can provide valuable insights to the future cyclonic activity over the basin.

Supplementary Materials

The following supporting information can be downloaded at: https://www.mdpi.com/article/10.3390/cli11020035/s1.

Author Contributions

All authors contributed to the study conception and design. Material preparation, data collection and analysis were performed by J.A. and V.S.G. The first draft of the manuscript was written by J.A., V.S.G., N.K.V., P.K.B. and all authors commented on previous versions of the manuscript. Conceptualization: P.K.B.; methodology: J.A., N.K.V., P.K.B. and M.K.D.; formal analysis and investigation: J.A., V.S.G., N.K.V. and P.K.B.; writing—original draft preparation: J.A. and V.S.G.; writing—review and editing: J.A., V.S.G., N.K.V., P.K.B. and M.K.D.; supervision: P.K.B. All authors have read and agreed to the published version of the manuscript.

Funding

The authors did not receive support from any organization for the submitted work. No funding was received to assist with the preparation of this manuscript.

Institutional Review Board Statement

Not applicable.

Informed Consent Statement

Not applicable.

Data Availability Statement

The datasets generated during and/or analyzed during the current study are available from the corresponding author on reasonable request.

Conflicts of Interest

The authors declare no conflict of interest.

References

  1. Akhila, R.S.; Kuttippurath, J.; Sarojini, B.B.; Chakraborty, A.; Rahul, R. Observed tropical cyclone-driven cold wakes in the context of rapid warming of the Arabian Sea. J. Oper. Oceanogr. 2022, 1–16. [Google Scholar] [CrossRef]
  2. Baburaj, P.P.; Abhilash, S.; Nirmal, C.A.; Sreenath, A.V.; Mohankumar, K.; Sahai, A.K. Increasing incidence of Arabian Sea cyclones during the monsoon onset phase: Its impact on the robustness and advancement of Indian summer monsoon. Atmos. Res. 2022, 267, 105915. [Google Scholar] [CrossRef]
  3. Francis, D.; Chaboureau, J.-P.; Nelli, N.; Cuesta, J.; Alshamsi, N.; Temimi, M.; Pauluis, O.; Xue, L. Summertime duststorms over the Arabian Peninsula and impacts on radiation, circulation, cloud development and rain. Atmos. Res. 2020, 2020, 105364. [Google Scholar]
  4. Francis, D.; Temimi, M.; Fonseca, R.; Nelli, N.R.; Abida, R.; Weston, M.; Wehbe, Y. On the analysis of a summer-time convective event in a hyper-arid environment. Q. J. R. Meteorol. Soc. 2021, 147, 501–525. [Google Scholar] [CrossRef]
  5. Murty, T.; El-Sabh, M. Cyclones and storm surges in the Arabian Sea: A brief review. Deep Sea Res. Part A Oceanogr. Res. Pap. 1984, 31, 665–670. [Google Scholar] [CrossRef]
  6. Bhaskaran, P.K.; Kalra, R.; Dube, S.K.; Sinha, P.C.; Rao, A.D.; Kumar, R.; Sarkar, A. Extreme wave conditions over the Bay of Bengal during a severe cyclone—Simulation experiment with two spectral wave models. Mar. Geod. 2000, 23, 91–102. [Google Scholar] [CrossRef]
  7. Bhaskaran, P.K.; Nayak, S.; Bonthu, S.R.; Murty, P.L.N.; Sen, D. Performance and validation of a coupled parallel ADCIRC-SWAN model for THANE cyclone in the Bay of Bengal. Environ. Fluid Mech. 2013, 13, 601–623. [Google Scholar] [CrossRef]
  8. Bhaskaran, P.K.; Gayathri, R.; Murty, P.L.N.; Bonthu, S.R.; Sen, D. A numerical study of coastal inundation and its validation for Thane Cyclone in the Bay of Bengal. Coast. Eng. 2013, 83, 108–118. [Google Scholar] [CrossRef]
  9. Gayathri, R.; Murty, P.L.N.; Bhaskaran, P.K.; Srinivasa Kumar, T. A numerical study of hypothetical storm surge and coastal inundation for AILA cyclone in the Bay of Bengal. Environ. Fluid Mech. 2016, 16, 429–452. [Google Scholar] [CrossRef]
  10. Murty, P.L.N.; Sandhya, K.G.; Bhaskaran, P.K.; Jose, F.; Gayathri, R.; Balakrishnan Nair, T.M.; Srinivasa Rao, T.; Shenoi, S.S.C. A coupled hydrodynamic modeling system for PHAILIN cyclone in the Bay of Bengal. Coast. Eng. 2014, 93, 71–81. [Google Scholar] [CrossRef]
  11. Nayak, S.; Bhaskaran, P.K.; Venkatesan, R. Near-shore wave induced setup along Kalpakkam coast during an extreme cyclone event in the Bay of Bengal. Ocean Eng. 2012, 55, 52–61. [Google Scholar] [CrossRef]
  12. Vissa, N.K.; Satyanarayana, A.N.V.; Bhaskaran, P.K. Response of Upper Ocean during passage of MALA cyclone utilizing ARGO data. Int. J. Appl. Earth Obs. Geo-Inf. 2012, 14, 149–159. [Google Scholar] [CrossRef]
  13. Vissa, N.K.; Satyanarayana, A.N.V.; Bhaskaran, P.K. Response of oceanic cyclogenesis metrics for NARGIS cyclone: A case study. Atmos Sci. Lett. 2013, 14, 7–13. [Google Scholar] [CrossRef] [Green Version]
  14. Vissa, N.K.; Satyanarayana, A.N.V.; Bhaskaran, P.K. Intensity of tropical cyclones during pre- and post-monsoon seasons in relation to accumulated tropical cyclone heat potential over Bay of Bengal. Nat. Hazards 2013, 68, 351–371. [Google Scholar] [CrossRef]
  15. Vissa, N.K.; Satyanarayana, A.N.V.; Bhaskaran, P.K. Response of Upper Ocean and Impact of Barrier Layer on SIDR cyclone induced sea surface cooling. Ocean Sci. J. 2013, 48, 279–288. [Google Scholar] [CrossRef]
  16. Gayathri, R.; Bhaskaran, P.K.; Jose, F. Coastal Inundation Research: An Overview of the Processes. Curr. Sci. 2017, 112, 267–278. [Google Scholar] [CrossRef]
  17. Nayak, S.; Bhaskaran, P.K. Coastal Vulnerability due to extreme waves at Kalpakkam based on historical tropical cyclones in the Bay of Bengal. Int. J. Clim. 2014, 34, 1460–1471. [Google Scholar] [CrossRef]
  18. Sahoo, B.; Bhaskaran, P.K. Multi-hazard risk assessment of coastal vulnerability from tropical cyclones—A GIS based approach for the Odisha coast. J Environ. Management. 2017. [Google Scholar] [CrossRef]
  19. Sahoo, B.; Bhaskaran, P.K. Prediction of storm surge and coastal inundation using Artificial Neural Network—A case study for 1999 Odisha Super Cyclone. Weather and Climate Extremes. 2019. [Google Scholar] [CrossRef]
  20. Albert, J.; Krishnan, A.; Bhaskaran, P.K.; Singh, K.S. Role and influence of key atmospheric parameters in large-scale environmental flow associated with tropical cyclogenesis and ENSO in the North Indian Ocean basin. Clim. Dyn. 2021, 58, 1–18. [Google Scholar] [CrossRef]
  21. Bister, M.; Emanuel, K.A. Dissipative heating and hurricane intensity. Meteorol. Atmos. Phys. 1998, 65, 233–240. [Google Scholar] [CrossRef]
  22. Emanuel, K.A. Sensitivity of Tropical Cyclones to Surface Exchange Coefficients and a Revised Steady-State Model incorporating Eye Dynamics. J. Atmos. Sci. 1995, 52, 3969–3976. [Google Scholar] [CrossRef]
  23. Emanuel, K.A. Thermodynamic control of hurricane intensity. Nature 1999, 401, 665–669. [Google Scholar] [CrossRef]
  24. Kumar, S.P.; Roshin, R.P.; Narvekar, J.; Kumar, P.D.; Vivekanandan, E. Response of the Arabian Sea to global warming and associated regional climate shift. Mar. Environ. Res. 2009, 68, 217–222. [Google Scholar] [CrossRef] [PubMed] [Green Version]
  25. McAdam, R.; Masina, S.; Balmaseda, M.; Gualdi, S.; Senan, R.; Mayer, M. Seasonal forecast skill of upper-ocean heat content in coupled high-resolution systems. Clim. Dyn. 2022, 58, 3335–3350. [Google Scholar] [CrossRef]
  26. Roxy, M.K.; Ritika, K.; Terray, P.; Masson, S. The Curious Case of Indian Ocean Warming. J. Clim. 2014, 27, 8501–8509. [Google Scholar] [CrossRef] [Green Version]
  27. Roxy, M.K.; Ritika, K.; Terray, P.; Murtugudde, R.; Ashok, K.; Goswami, B.N. Drying of Indian subcontinent by rapid Indian Ocean warming and a weakening land-sea thermal gradient. Nat. Commun. 2015, 6, 7423. [Google Scholar] [CrossRef] [Green Version]
  28. Sumesh, K.G.; Kumar, M.R.R. Tropical cyclones over north Indian Ocean during El-Niño Modoki years. Nat. Hazards 2013, 68, 1057–1074. [Google Scholar] [CrossRef]
  29. Suchandra, A.B.; Mandal, A. Variability of Ocean Features and their Impact on Cyclogenesis over Arabian Sea During Post Monsoon Season. Res. Sq. 2021. [Google Scholar] [CrossRef]
  30. Ma, J.; Feng, M.; Lan, J.; Hu, D. Projected Future Changes of Meridional Heat Transport and Heat Balance of the Indian Ocean. Geophys. Res. Lett. 2020, 47, 1–9. [Google Scholar] [CrossRef]
  31. Chowdhury, R.R.; Kumar, S.P.; Narvekar, J.; Chakraborty, A. Back-to-back occurrence of tropical cyclones in the Arabian Sea during October–November 2015: Causes and responses. J. Geophys. Res. Ocean. 2020, 125, e2019JC015836. [Google Scholar] [CrossRef]
  32. Cheng, L.; Trenberth, K.E.; Fasullo, J.; Boyer, T.; Abraham, J.; Zhu, J. Improved estimates of ocean heat content from 1960 to 2015. Sci. Adv. 2017, 3, e1601545. [Google Scholar] [CrossRef] [PubMed] [Green Version]
  33. Lee, S.K.; Park, W.; Baringer, M.O.; Gordon, A.L.; Huber, B.; Liu, Y. Pacific origin of the abrupt increase in Indian Ocean heat content during the warming hiatus. Nat. Geosci. 2015, 8, 445–449. [Google Scholar] [CrossRef] [Green Version]
  34. Liu, W.; Xie, S.-P.; Lu, J. Tracking ocean heat uptake during the surface warming hiatus. Nat. Commun. 2016, 7, 10926. [Google Scholar] [CrossRef] [Green Version]
  35. Emanuel, K. Increasing destructiveness of tropical cyclones over the past 30 years. Nature 2005, 436, 686–688. [Google Scholar] [CrossRef] [PubMed]
  36. Trenberth, K. Uncertainty in Hurricanes and Global Warming. Science 2005, 308, 1753–1754. [Google Scholar] [CrossRef] [PubMed] [Green Version]
  37. Webster, P.J.; Holland, G.J.; Curry, J.A.; Chang, H.-R. Changes in Tropical Cyclone Number, Duration, and Intensity in a Warming Environment. Science 2005, 309, 1844–1846. [Google Scholar] [CrossRef] [Green Version]
  38. Yu, J.; Wang, Y. Response of tropical cyclone potential intensity over the north Indian Ocean to global warming. Geophys. Res. Lett. 2009, 36, 1–5. [Google Scholar] [CrossRef] [Green Version]
  39. Evan, A.T.; Camargo, S.J. A climatology of Arabian Sea cyclonic storms. J. Clim. 2011, 24, 140–158. [Google Scholar] [CrossRef] [Green Version]
  40. Emanuel, K. Contribution of tropical cyclones to meridional heat transport by the oceans. J. Geophys. Res. Atmos. 2001, 106, 14771–14781. [Google Scholar] [CrossRef]
  41. Hu, A.; Meehl, G.A. Effect of the Atlantic hurricanes on the oceanic meridional overturning circulation and heat transport. Geophys. Res. Lett. 2009, 36, 1–6. [Google Scholar] [CrossRef]
  42. Scoccimarro, E.; Gualdi, S.; Bellucci, A.; Sanna, A.; Fogli, P.G.; Manzini, E.; Vichi, M.; Oddo, P.; Navarra, A. Effects of Tropical Cyclones on Ocean Heat Transport in a High-Resolution Coupled General Circulation Model. J. Clim. 2011, 24, 4368–4384. [Google Scholar] [CrossRef] [Green Version]
  43. Sriver, R.; Huber, M. Low frequency variability in globally integrated tropical cyclone power dissipation. Geophys. Res. Lett. 2006, 33, 1–5. [Google Scholar] [CrossRef] [Green Version]
  44. Emanuel, K. Tropical cyclones. Ann. Rev. Earth Planet. Sci. 2003, 31, 75–104. [Google Scholar] [CrossRef]
  45. Srinivas, C.V.; Mohan, G.M.; Naidu, C.V.; Baskaran, R.; Venkatraman, B. Impact of air-sea coupling on the simulation of tropical cyclones in the North Indian Ocean using a simple 3D ocean model coupled to ARW. J. Geophys. Res. Atmos. 2016, 121, 9400–9421. [Google Scholar] [CrossRef] [Green Version]
  46. Bender, M.A.; Ginis, I.; Kurihara, Y. Numerical simulations of tropical cyclone-ocean interaction with a high-resolution coupled model. J. Geophys. Res. Atmos. 1993, 98, 23245–23263. [Google Scholar] [CrossRef]
  47. Bosart, L.F.; Velden, C.S.; Bracken, W.E.; Molinari, J.; Black, P.G. Environmental Influences on the Rapid Intensification of Hurricane Opal (1995) over the Gulf of Mexico. Mon. Weather Rev. 2000, 128, 322. [Google Scholar] [CrossRef]
  48. Lin, Y.-L.; Chen, S.-Y.; Hill, C.M.; Huang, C.-Y. Control Parameters for the Influence of a Mesoscale Mountain Range on Cyclone Track Continuity and Deflection. J. Atmos. Sci. 2005, 62, 1849–1866. [Google Scholar] [CrossRef]
  49. Schade, L.R.; Emanuel, K.A. The Ocean’s Effect on the Intensity of Tropical Cyclones: Results from a Simple Coupled Atmosphere–Ocean Model. J. Atmos. Sci. 1999, 56, 642–651. [Google Scholar] [CrossRef]
  50. Bessafi, M.; Wheeler, M.C. Modulation of south Indian Ocean tropical cyclones by the Mad-den–Julian oscillation and convectively coupled equatorial waves. Mon. Weather Rev. 2006, 134, 638–656. [Google Scholar] [CrossRef]
  51. Frank, W.M.; Roundy, P.E. The Role of Tropical Waves in Tropical Cyclogenesis. Mon. Weather Rev. 2006, 134, 2397–2417. [Google Scholar] [CrossRef]
  52. Schreck, C.J., III; Molinari, J. Tropical cyclogenesis associated with Kelvin waves and the Madden–Julian oscillation. Mon. Weather Rev. 2011, 139, 2723–2734. [Google Scholar] [CrossRef]
  53. Schreck, C.J.; Molinari, J.; Aiyyer, A. A global view of equatorial waves and tropical cyclogenesis. Mon. Weather Rev. 2012, 140, 774–788. [Google Scholar] [CrossRef] [Green Version]
  54. Shen, B.W.; Tao, W.K.; Lin, Y.L.; Laing, A. Genesis of twin tropical cyclones as revealed by a global mesoscale model: The role of mixed Rossby gravity waves. J. Geophys. Res. Atmos. 2012, 117, 1–28. [Google Scholar] [CrossRef] [Green Version]
  55. Ventrice, M.J.; Thorncroft, C.D.; Janiga, M.A. Atlantic Tropical Cyclogenesis: A Three-Way Interaction between an African Easterly Wave, Diurnally Varying Convection, and a Convectively Coupled Atmospheric Kelvin Wave. Mon. Weather Rev. 2012, 140, 1108–1124. [Google Scholar] [CrossRef]
  56. Ventrice, M.J.; Thorncroft, C.D.; Schreck, C.J., III. Impacts of convectively coupled Kelvin waves on environmental conditions for Atlantic tropical cyclogenesis. Mon. Weather Rev. 2012, 140, 2198–2214. [Google Scholar] [CrossRef] [Green Version]
  57. Zhang, C. Madden-Julian oscillation. Rev. Geophys. 2005, 43, 1–36. [Google Scholar] [CrossRef] [Green Version]
  58. Shankar, D.; Vinayachandran, P.N.; Unnikrishnan, A.S. The monsoon currents in the north Indian Ocean. Prog. Oceanogr. 2002, 52, 63–120. [Google Scholar] [CrossRef]
  59. Shenoi, S.S.C. Intra-seasonal variability of the coastal currents around India: A review of the evidences from new observations. Indian J. Geo Mar. Sci. 2010, 39, 489–496. [Google Scholar]
  60. Rao, R.R.; Kumar, M.G.; Ravichandran, M.; Rao, A.R.; Gopalakrishna, V.V.; Thadathil, P. Interannual variability of Kelvin wave propagation in the wave guides of the equatorial Indian Ocean, the coastal Bay of Bengal and the southeastern Arabian Sea during 1993–2006. Deep Sea Res. Part I Oceanogr. Res. Pap. 2010, 57, 1–13. [Google Scholar] [CrossRef]
  61. Sreenivas, P.; Gnanaseelan, C.; Prasad, K. Influence of El Niño and Indian Ocean Dipole on sea level variability in the Bay of Bengal. Glob. Planet. Chang. 2012, 80, 215–225. [Google Scholar] [CrossRef]
  62. Yu, L.; O’Brien, J.J.; Yang, J. On the remote forcing of the circulation in the BoB. J. Geophys. Res. 1991, 96, 20449–20454. [Google Scholar] [CrossRef]
  63. Subrahmanyam, B.; Robinson, I.S.; Blundell, J.R.; Challenor, P.G. Indian Ocean Rossby waves observed in TOPEX/POSEIDON altimeter data and in model simulations. Int. J. Remote Sens. 2001, 22, 141–167. [Google Scholar] [CrossRef]
  64. McCreary, J.P., Jr.; Kundu, P.K.; Molinari, R.L. A numerical investigation of dynamics, thermodynamics and mixed-layer processes in the Indian Ocean. Prog. Oceanogr. 1993, 31, 181–244. [Google Scholar] [CrossRef]
  65. Schott, F.A.; Xie, S.P.; McCreary, J.P., Jr. Indian Ocean circulation and climate variability. Rev. Geophys. 2009, 47, 47. [Google Scholar] [CrossRef] [Green Version]
  66. Amol, P.; Bemal, S.; Shankar, D.; Jain, V.; Thushara, V.; Vijith, V.; Vinayachandran, P.N. Modulation of chlorophyll concentration by downwelling Rossby waves during the winter monsoon in the southeastern Arabian Sea. Prog. Oceanogr. 2020, 186, 102365. [Google Scholar] [CrossRef]
  67. Shenoi, S.S.C.; Shankar, D.; Shetye, S.R. Remote forcing annihilates barrier layer in south-eastern Arabian Sea. Geophys. Res. Lett. 2004, 31, 1–4. [Google Scholar] [CrossRef] [Green Version]
  68. Rao, R.R.; Jitendra, V.; GirishKumar, M.S.; Ravichandran, M.; Ramakrishna, S.S.V.S. Interannual variability of the Arabian Sea Warm Pool: Observations and governing mechanisms. Clim. Dyn. 2015, 44, 2119–2136. [Google Scholar] [CrossRef]
  69. Shenoi, S.C.; Shankar, D.; Gopalakrishna, V.V.; Durand, F. Role of ocean in the genesis and annihilation of the core of the warm pool in the southeastern Arabian Sea. Mausam 2005, 56, 147–160. [Google Scholar] [CrossRef]
  70. Zuo, H.; Balmaseda, M.A.; Tietsche, S.; Mogensen, K.; Mayer, M. The ECMWF operational ensemble reanalysis–analysis system for ocean and sea ice: A description of the system and assessment. Ocean Sci. 2019, 15, 779–808. [Google Scholar] [CrossRef] [Green Version]
  71. Liebmann, B.; Smith, C.A. Description of a Complete (Interpolated) Outgoing Longwave Radiation Dataset. Bull. Am. Meteorol. Soc. 1996, 77, 1275–1277. [Google Scholar]
  72. Kumar, B.P.; Vialard, J.; Lengaigne, M.; Murty, V.S.N.; McPhaden, M.J. TropFlux: Air-sea fluxes for the global tropical oceans—Description and evaluation. Clim. Dyn. 2011, 38, 1521–1543. [Google Scholar] [CrossRef]
  73. Kumar, B.P.; Vialard, J.; Lengaigne, M.; Murty, V.S.N.; McPhaden, M.J.; Cronin, M.F.; Pinsard, F.; Reddy, K.G. TropFlux wind stresses over the tropical oceans: Evaluation and comparison with other products. Clim. Dyn. 2012, 40, 2049–2071. [Google Scholar] [CrossRef]
  74. Yu, L.; Jin, X.; Weller, R.A. Multidecade Global Flux Datasets from the Objectively Analyzed Air-sea Fluxes (OAFlux) Project: Latent and Sensible Heat Fluxes, Ocean Evaporation, and Related Surface Meteorological Variables. Woods Hole Oceanogr. Inst. OAFlux Proj. Tech. Rep. (OA-2008-01) 2008, 1–64. [Google Scholar]
  75. Kikuchi, K.; Wang, B.; Kajikawa, Y. Bimodal representation of the tropical intraseasonal oscillation. Clim. Dyn. 2012, 38, 1989–2000. [Google Scholar] [CrossRef]
  76. Kiladis, G.N.; Dias, J.; Straub, K.H.; Wheeler, M.C.; Tulich, S.N.; Kikuchi, K.; Weickmann, K.M.; Ventrice, M.J. A Comparison of OLR and Circulation-Based Indices for Tracking the MJO. Mon. Weather Rev. 2014, 142, 1697–1715. [Google Scholar] [CrossRef]
  77. Matthews, A.J. Primary and successive events in the Madden–Julian Oscillation. Q. J. R. Meteorol. Soc. 2008, 134, 439–453. [Google Scholar] [CrossRef] [Green Version]
  78. Wheeler, M.C.; Hendon, H.H. An all-season real-time multivariate MJO index: Development of an index for monitoring and prediction. Mon. Weather Rev. 2004, 132, 1917–1932. [Google Scholar] [CrossRef]
  79. Sreelakshmi, S.; Bhaskaran, P.K. Regional wise characteristic study of significant wave height for the Indian Ocean. Clim. Dyn. 2020, 54, 3405–3423. [Google Scholar] [CrossRef]
  80. Vecchi, G.A.; Soden, B.J. Effect of remote sea surface temperature change on tropical cyclone potential intensity. Nature 2007, 450, 1066–1070. [Google Scholar] [CrossRef]
  81. Hari, V.; Pathak, A.; Koppa, A. Dual response of Arabian Sea cyclones and strength of Indian monsoon to Southern Atlantic Ocean. Clim. Dyn. 2021, 56, 2149–2161. [Google Scholar] [CrossRef]
  82. Albert, J.; Bhaskaran, P.K. Ocean heat content and its role in tropical cyclogenesis for the Bay of Bengal basin. Clim. Dyn. 2020, 55, 3343–3362. [Google Scholar] [CrossRef]
  83. Cheng, L.; Trenberth, K.E.; Fasullo, J.T.; Mayer, M.; Balmaseda, M.; Zhu, J. Evolution of Ocean Heat Content related to ENSO. J. Clim. 2019, 32, 3529–3556. [Google Scholar] [CrossRef]
  84. Sprintall, J.; Wijfels, S.E.; Molcard, R.; Jaya, I. Direct estimates of the Indonesian Throughfow entering the Indian Ocean: 2004–2006. J. Geophys. Res. 2009, 114, C07001. [Google Scholar] [CrossRef]
  85. Mayer, M.; Balmaseda, M.A.; Haimberger, L. Unprecedented 2015/2016 Indo-Pacific heat transfer speeds up tropical Pacific heat recharge. Geophys. Res. Lett. 2018, 45, 3274–3284. [Google Scholar] [CrossRef]
  86. Mayer, M.; Haimberger, L.; Balmaseda, M.A. On the energy exchange between tropical ocean basins related to ENSO. J. Clim. 2014, 27, 6393–6403. [Google Scholar] [CrossRef]
  87. Bryan, K. Measurements of meridional heat transport by ocean currents. J. Geophys. Res. Earth Surf. 1962, 67, 3403–3414. [Google Scholar] [CrossRef]
  88. Hall, M.M.; Bryden, H.L. Direct estimates and mechanisms of ocean heat transport. Deep Sea Res. Part A Oceanogr. Res. Pap. 1982, 29, 339–359. [Google Scholar] [CrossRef]
  89. Zheng, Y.; Giese, B.S. Ocean heat transport in Simple Ocean Data Assimilation: Structure and mechanisms. J. Geophys. Res. Earth Surf. 2009, 114, 1–17. [Google Scholar] [CrossRef] [Green Version]
  90. Jacob, S.D.; Shay, L.K. The Role of Oceanic Mesoscale Features on the Tropical Cyclone—Induced Mixed Layer Response: A Case Study. J. Phys. Oceanogr. 2003, 33, 649–676. [Google Scholar] [CrossRef]
  91. Wang, X.; Han, G.; Qi, Y.; Li, W. Impact of barrier layer on typhoon-induced sea surface cooling. Dyn. Atmos. Ocean. 2011, 52, 367–385. [Google Scholar] [CrossRef]
  92. Rhein, M.; Rintoul, S.R.; Aoki, S.; Campos, E.J.D.; Chambers, D. Observations: Ocean. Climate Change 2013: The Physical Science Basis. In Contribution of Working Group I to the Fifth Assessment Report of the Intergovernmental Panel on Climate Change; Cambridge University Press: Cambridge, UK, 2013. [Google Scholar]
  93. Trenberth, K.E.; Fasullo, J.T.; Balmaseda, M.A. Earth’s energy imbalance. J. Clim. 2014, 27, 3129–3144. [Google Scholar] [CrossRef] [Green Version]
  94. Von Schuckmann, K.; Palmer, M.D.; Trenberth, K.E.; Cazenave, A.; Chambers, D.; Champollion, N.; Hansen, J.; Josey, S.A.; Loeb, N.; Mathieu, P.-P.; et al. An imperative to monitor Earth’s energy imbalance. Nat. Clim. Chang. 2016, 6, 138–144. [Google Scholar] [CrossRef] [Green Version]
  95. Cheng, L.; Zhu, J.; Abraham, J.; Trenberth, K.E.; Fasullo, J.T.; Zhang, B.; Yu, F.; Wan, L.; Chen, X.; Song, X. 2018 Continues Record Global Ocean Warming. Adv. Atmos. Sci. 2019, 36, 249–252. [Google Scholar] [CrossRef]
  96. Shankar, D.; Shetye, S.R. On the dynamics of the Lakshadweep high and low in the southeastern Arabian Sea. J. Geophys. Res. Ocean. 1997, 102, 12551–12562. [Google Scholar] [CrossRef]
  97. Shenoi, S.S.C.; Shankar, D.; Shetye, S.R. On the sea surface temperature high in the Lakshad-weep Sea before the onset of the southwest monsoon. J. Geophys. Res. Ocean. 1999, 104, 15703–15712. [Google Scholar] [CrossRef] [Green Version]
  98. Shetye, S.; Shenoi, S.; Gouveia, A.; Michael, G.; Sundar, D.; Nampoothiri, G. Wind-driven coastal upwelling along the western boundary of the Bay of Bengal during the southwest monsoon. Cont. Shelf Res. 1991, 11, 1397–1408. [Google Scholar] [CrossRef]
  99. Durand, F.; Shetye, S.R.; Vialard, J.; Shankar, D.; Shenoi, S.S.C.; Ethe, C.; Madec, G. Impact of temperature inversions on SST evolution in the south-eastern Arabian Sea during the pre-summer monsoon season. Geophys. Res. Lett. 2004, 31, 1–4. [Google Scholar] [CrossRef]
  100. Rao, R.R.; Sivakumar, R. Seasonal variability of sea surface salinity and salt budget of the mixed layer of the north Indian Ocean. J. Geophys. Res. 2003, 108, 1–14. [Google Scholar] [CrossRef]
  101. Fosu, B.; He, J.; Liguori, G. Equatorial Pacific warming attenuated by SST warming patterns in the tropical Atlantic and Indian Oceans. Geophys. Res. Lett. 2020, 47, e2020GL088231. [Google Scholar] [CrossRef]
  102. Li, X.; Xie, S.P.; Gille, S.; Yoo, C. Atlantic-induced pan-tropical climate change over the past three decades. Nat. Clim. Chang. 2016, 6, 275–279. [Google Scholar] [CrossRef] [Green Version]
  103. Xie, S.P.; Philander, S.G.H. A coupled ocean-atmosphere model of relevance to the ITCZ in the eastern Pacific. Tellus A 1994, 46, 340–350. [Google Scholar] [CrossRef] [Green Version]
  104. Xie, S.P.; Deser, C.; Vecchi, G.; Ma, J.; Teng, H.; Wittenberg, A. Global warming pattern formation: Sea surface temperature and rainfall. J. Clim. 2010, 23, 966–986. [Google Scholar] [CrossRef] [Green Version]
  105. de Boyer Montegut, C.; Mignot, J.; Lazar, A.; Cravatte, S. Control of salinity on the mixed layer depth in the world ocean. Part I: General description. J. Geophys. Res. Ocean. 2007, 112, 1–12. [Google Scholar] [CrossRef]
  106. Shenoi, S.S.C.; Shankar, D.; Shetye, S.R. Differences in heat budgets of the near-surface Arabian Sea and Bay of Bengal: Implications for the summer monsoon. J. Geophys. Res. 2002, 107, 1–14. [Google Scholar] [CrossRef]
  107. Saji, N.H.; Goswami, B.N.; Vinayachandran, P.N.; Yamagata, T. A dipole mode in the tropical Indian Ocean. Nature 1999, 401, 360–363. [Google Scholar] [CrossRef]
  108. Cai, W.; Santoso, A.; Wang, G.; Weller, E.; Wu, L.; Ashok, K.; Masumoto, Y.; Yamagata, T. Increased frequency of extreme Indian Ocean Dipole events due to greenhouse warming. Nature 2014, 510, 254–258. [Google Scholar] [CrossRef]
Figure 1. The map of Northern Indian Ocean region showing the study regions marked I-VII and D1 (2° N–7° N; 73° E–82° E) and D2 (4° N–14° N; 68° E–78° E) along with the schematic representation of circulation in the NIO during winter monsoon. WICC—West Indian Coastal Current, EICC—East Indian Coastal Current, WMC—Winter Monsoon Current, and LH—Lakshadweep High.
Climate 11 00035 g001
Figure 2. Variability in ORAS5 OHC at 300 m along with the corresponding confidence interval (red patches) at different sub-domains of the Indian Ocean region (1979–2020).
Climate 11 00035 g002
Figure 3. Variability in ORAS5 OHC at 700 m along with the corresponding confidence interval (red patches) at different sub-domains of the Indian Ocean region (1979–2020).
Climate 11 00035 g003
Figure 4. Variability in ORAS5 OHC at (a) D300 (top panel) and (b) D700 (bottom panel) along with the corresponding confidence interval (red patches) over the Arabian Sea and Bay of Bengal region during the period 1979–2020 (trend analysis separated before and after the year 2000).
Climate 11 00035 g004
Figure 5. Trend of Outgoing Longwave Radiation (W m−2) along with the corresponding confidence interval (red patches) over the (a) Arabian Sea and (b) Bay of Bengal region during 1979–2020. The magnified view of the OLR trends on a two decadal scale are shown in (c) for Arabian Sea, and (d) for Bay of Bengal.
Climate 11 00035 g005
Figure 6. The decadal variation in SSHA (m, color shading) representing the propagation of second downwelling Kelvin wave in the North Indian Ocean during October, November and December.
Climate 11 00035 g006
Figure 7. (ac) SSHA decadal variation in longitude versus time plot averaged for the latitudinal band (−2.5° S to 2.5° N). The black arrow represents the propagation of the Kelvin wave. (d) Decadal variation of SST in the southeastern Arabian Sea for different seasons.
Climate 11 00035 g007
Figure 8. Decadal variation in SSHA representing the propagation of Rossby wave (shaded) along with the D20 contour averaged over the latitudinal band of 2° N–12° N.
Climate 11 00035 g008
Figure 9. Decadal variation in (a) current speed, (b) meridional heat transport, and (c) zonal heat transport for different seasons in domain D1.
Climate 11 00035 g009
Figure 10. Decadal variation, the same as in Figure 9, but for domain D2.
Climate 11 00035 g010
Figure 11. Monthly climatological variation of heat budget terms (°C/month) averaged in the SEAS.
Climate 11 00035 g011
Figure 12. Trend analysis of heat budget terms in different seasons (a) winter, (b) pre-monsoon, (c) monsoon, and (d) post-monsoon.
Climate 11 00035 g012
Figure 13. Total number of positive and negative months based on DMI. (a) The upper panel shows the total number of months having DMI < 0 (blue) and DMI > 0 (red). (b) Bottom panel; same as the upper panel, but for DMI > 0.4 and DMI < −0.4.
Climate 11 00035 g013
Table 1. Summary of cyclonic storms witnessed over Arabian Sea region.
IntensityName of the CycloneTime Period
Super Cyclonic Storms (SuCS)GONU1–7 June 2007
KYARR24 October–3 November 2019
Extremely Severe Cyclonic Storms (ESCS)ARB 0121–28 May 2001
NILOFER23–31 October 2014
CHAPALA28 October–4 November 2015
MEGH4–10 November 2015
TAUKTE14–19 May 2021
Very Severe Cyclonic Storm (VSCS)PHET31 May–7 June, 2010
Severe Cyclonic Storm (SCS)NISARGA1–4 June 2020
Table 2. Details of sub-domains in the Indian Ocean region used for the study.
LabelNameRegionDomain
ARBReg 1Arabian Sea EQ: 30° N; 30° E: 78° E
BoBReg 2Bay of Bengal EQ: 30° N;
78° E: 105° E
SCSReg 3South China Sea EQ: 30° N;
105° E: 120° E
SIO (A)Reg 4Tropical South Indian Ocean—A35° S: EQ; 30° E: 78° E
SIO (B)Reg 5Tropical South Indian Ocean—B35° S: EQ; 78° E: 120° E
WSOReg 6Western extra-tropical south Indian Ocean and the Southern Ocean (south of 60° S) 63° S: 35° S;
30° E: 76° E
ESOReg 7Eastern extra-tropical south Indian Ocean and the Southern Ocean (south of 60° S) 63° S: 35° S;
76° E: 120° E
SEAS (A)D1South eastern Arabian Sea—A 2° N: 7°N;
73° E: 80° E
SEAS (B)D2South eastern Arabian Sea—B 4° N: 14°N;
68° E: 78° E
Disclaimer/Publisher’s Note: The statements, opinions and data contained in all publications are solely those of the individual author(s) and contributor(s) and not of MDPI and/or the editor(s). MDPI and/or the editor(s) disclaim responsibility for any injury to people or property resulting from any ideas, methods, instructions or products referred to in the content.

