1. Introduction
Environmental satellite data availability and quality increase exponentially with time, allowing their extensive use in a wide spectrum of applications. Geostationary meteorological satellites such as the European Organisation for the Exploitation of Meteorological Satellites (EUMETSAT) Meteosat series are ideal for monitoring fast-evolving weather phenomena due to their high refresh rate, despite their relatively lower resolution compared to polar-orbiting satellites.
To maximize the exploitation of the Meteosat series data on nowcasting, (EUMETSAT) established in 1997 the Satellite Application Facility on support of the Nowcasting and Very Short Range Forecasting Satellite Application Facility (NWC SAF). A software package that allows the generation of a series of products from geostationary satellites was developed, aiming to support nowcasting and very short-range forecasting for the areas covered by the field of view of the Meteosat satellites. In its later versions, it also includes support for other meteorological satellites, such as the GOES [
1] and the new Himawari [
2] satellite series. More about NWC SAF can be found on the facility’s website [
3].
Two kinds of products are devoted to providing precipitation rate: convective rainfall rate (CRR) and convective rainfall rate from microphysical properties. Among the last three versions of the NWC SAF software (GEO v2016, GEO v2018, and GEO v2021), the CRR product remains unchanged. The convective rainfall rate from microphysical properties of the 2016 version (GEO v2016) was a daytime product and was upgraded in the 2018 version (GEO v2018) to operate under nighttime conditions, while in the 2021 version (GEO v2021), a new, improved algorithm was released. To avoid confusion. we will refer to the Convective Rainfall Rate from Cloud Physical Properties algorithm of version GEO v2018 as CRR-Ph v2018, to the new algorithm (GEO v2021) as CRRPh v2021 and to convective rainfall rate as CRR v2021. More about CRR v2021 and CRRPh v2021 can be found in the user’s manual [
4], the Algorithm Theoretical Basis [
5], and the Scientific and Validation Report [
6] that are available on the NWC SAF website [
3]. Information about CRR-Ph v2018 can be found in the user’s manual [
7], the Algorithm Theoretical Basis [
8], the Scientific and Validation Report [
9], and the Scientific Report on response to the ESSL testbed feedback on NWC SAF precipitation products [
10], also available on the NWC SAF website [
3].
A variety of satellite precipitation products are available nowadays. The Climate NOAA CPC Morphing Technique (CMORPH) [
11,
12], the Global Precipitation Measurement (GPM) Integrated Multi-satellite Retrievals (IMERG) [
13,
14], the Tropical Rainfall Measurement Mission (TRMM) Multi-satellite Precipitation Analysis (TMPA) [
15,
16,
17], the Precipitation Estimation from Remotely Sensed Information using Artificial Neural Networks (PERSIANN) [
18,
19,
20,
21,
22], the EUMETSAT Satellite Application Facility on Support to Operational Hydrology and Water Management (H-SAF) precipitation products [
23,
24], and the Soil Moisture To Rain (SM2RAIN) datasets [
25,
26] are among the most commonly used. They are based on different methodologies and present various spatial and temporal characteristics. It should be noted, however, that many of them are not available in near real-time mode. In order to improve their accuracy, they ingest input data from various sources, such as for example from rain gauge data, radar data, and soil moisture data. This introduces a significant delay that extends from hours to months. The NWC SAF precipitation products focus on computing estimations in real-time mode, with only satellite and numerical weather prediction (NWP) forecast model data information as input in the basic configuration.
Regarding the efficiency of the various versions of CRR, CRR-Ph, and CRRPh products, the literature is rather limited. Marcos et al. [
27] showed that the CRR v2013 daytime algorithm overestimates the extent of the precipitation areas and underestimates the higher rain intensities. They also showed that CRR-Ph v2013 performs better than CRR v2013, but for high solar zenith angles, it overestimates the precipitation rates. An underestimation of the precipitation areas of the strongest rainfall was found for both products. Pelajić [
28] showed an improvement in CRR-Ph v2013 efficiency under better illumination conditions (lower sun zenith angles (SZAs)). Comparing convective cases estimations against rain gauge observations, he demonstrated an overestimation of lower precipitation rates and suggested that the product is not suitable for the estimation of high precipitation rates. According to Marcos et al. [
29], who evaluated the efficiency of CRR v2016 and CRR-Ph GEO v2016 using data from the Spanish radar network as ground truth, the mean error (ME) and the mean absolute error (MAE) of CRR v2016 were 0.82 mm/h and 1.55 mm/h, respectively, while the probability of detection (POD) and false alarm rate (FAR) were 53.74% and 45.53%. In regard to CRR-Ph v2016, ME was 0.68 mm/h, MAE was 1.42 mm/h, POD was 54.89%, and FAR was 43.09%. It is worth mentioning an improvement of the statistics for better illumination conditions. Tapiador et al. [
30], using the Spanish radar network data as ground truth, showed that CRR-Ph v2016 is superior to CRR v2016 for the delineation of convective precipitation areas and also for the estimation of rainfall rates. The CRR v2016 product efficiency was assessed by Hill et al. [
31]. In their analysis, they compared Tropical Africa V6 GPM IMERG-Final estimations against CRR v2016 from 1 March 2019 to 31 July 2019. They noticed that the day algorithm is superior to the night one. Rainfall rates below 3 mm/h were often missed, which is expected as CRR v2016 attempts to filter out stratiform precipitation. In addition, they demonstrated that the hit rate is increased with increasing precipitation threshold up to 5 mm/h, but it decreases afterwards. False alarms are increased continuously as they move to higher thresholds, but after the 5 mm/h limit, the rate of increase is reduced. Karagiannidis et al. [
32] compared CRR and CRR-Ph v2016 against rain gauge data for a full year over the Greek area. They showed that CRR v2016 overestimates the extent of the precipitation areas and underestimates the rainfall totals. They also suggested that the CRR v2016 nighttime algorithm is inferior to the CRR-Ph v2016 algorithm in regard to the delineation of precipitation areas, and it overestimates the precipitation totals. Their analysis also highlighted important differences in the performance for different seasons. Finally, Diamandi et al. [
33] also used rain gauge data from five warm-period months over Romania as ground truth to assess the degree of efficiency of the CRR and CRR-Ph v2018.1 products. They found a slightly better POD for CRR-Ph v2018.1 and relatively high FARs for both products. They argued that the products overestimate the extent of precipitation areas and rainfall rates and also that a lot of precipitation cases were not identified.
In the present paper, we attempt to compare the estimation efficiency of the CRRPh v2021 product to the efficiency of the CRR-Ph v2018 and CRR v2021 using rain gauge data as ground truth. The influence of selected topographic features on the efficiency of CRRPh v2021 is also examined.
Section 2 briefly presents the algorithm of the new product,
Section 3 describes the data,
Section 4 presents the methods used in the analysis, and
Section 5 illustrates the most important results. Finally,
Section 6 summarizes the conclusions of the study.
2. The CRRPh v2021 Algorithm
Details about the algorithm can be found in the Algorithm Theoretical Basis document [
5]. To briefly present the key features of the innovative GEO v2021 algorithm of CRRPh, the algorithm was developed using principal component Analysis (PCA) in order to reduce the number of independent variables (dimensions) of the model while keeping the maximum amount of information. By reducing the dimensions, it is expected to also reduce the noise introduced in the estimation of precipitation. At the same time, the computational time is also reduced. The principal components are used to develop a lookup table (LUT). During the day, the visible channels offer very important information for the computation of most products of NWC SAF, including cloud water path (CWP) [
34,
35,
36] and precipitation products, resulting in superior estimations compared to nighttime. In order to minimize that difference, the CRRPh v2021 uses the same algorithm during daytime and nighttime, which implies to generate a pseudo visual channel centered at 0.6 μm (VIS06) and a pseudo cloud water path for nighttime, since those channels are mandatory inputs. The method to simulate both VIS06 and CWP inputs is also based on PCA.
3. Data
A full year (2019) of precipitation products and rain gauge (RG) data are used in the analysis. To generate the NWC SAF precipitation products an NWP model is needed, together with the Spinning Enhanced Visible and InfraRed Imager (SEVIRI) satellite data and other optional input data. The Global Forecast System (GFS) model was used. The horizontal resolution of the model used is 0.25 degrees, and parameters are available in 31 pressure levels (1, 2, 3, 5, 7, 10, 20, 30, 50, 70, 100, 150, 200, 250, 300, 350, 400, 450, 500, 550, 600, 650, 700, 750, 800, 850, 900, 925, 950, 975, 1000 hPa) and surface. Sea surface temperature data at 1 degree’s horizontal resolution derived from the Operational Sea Surface Temperature and Sea Ice Analysis (OSTIA) were ingested into the software. Meteosat-11 data in high-rate transmission (HRIT) format were processed. Stability correction was applied, while lightning correction was not applied. The day–night sun zenith angle threshold was kept to the default value of 70 degrees.
In order to assess the influence of topographical features, such as elevation, slope, and aspect, the shuttle radar topography mission (SRTM) digital elevation model of version 4 at 90 m resolution is used. Slope is the degree of inclination of the ground surface, while aspect is the compass direction or azimuth that a ground surface faces. Slope and aspect were computed using the 8 nearest grid points around each RG. More about the digital elevation model can be found in [
37,
38].
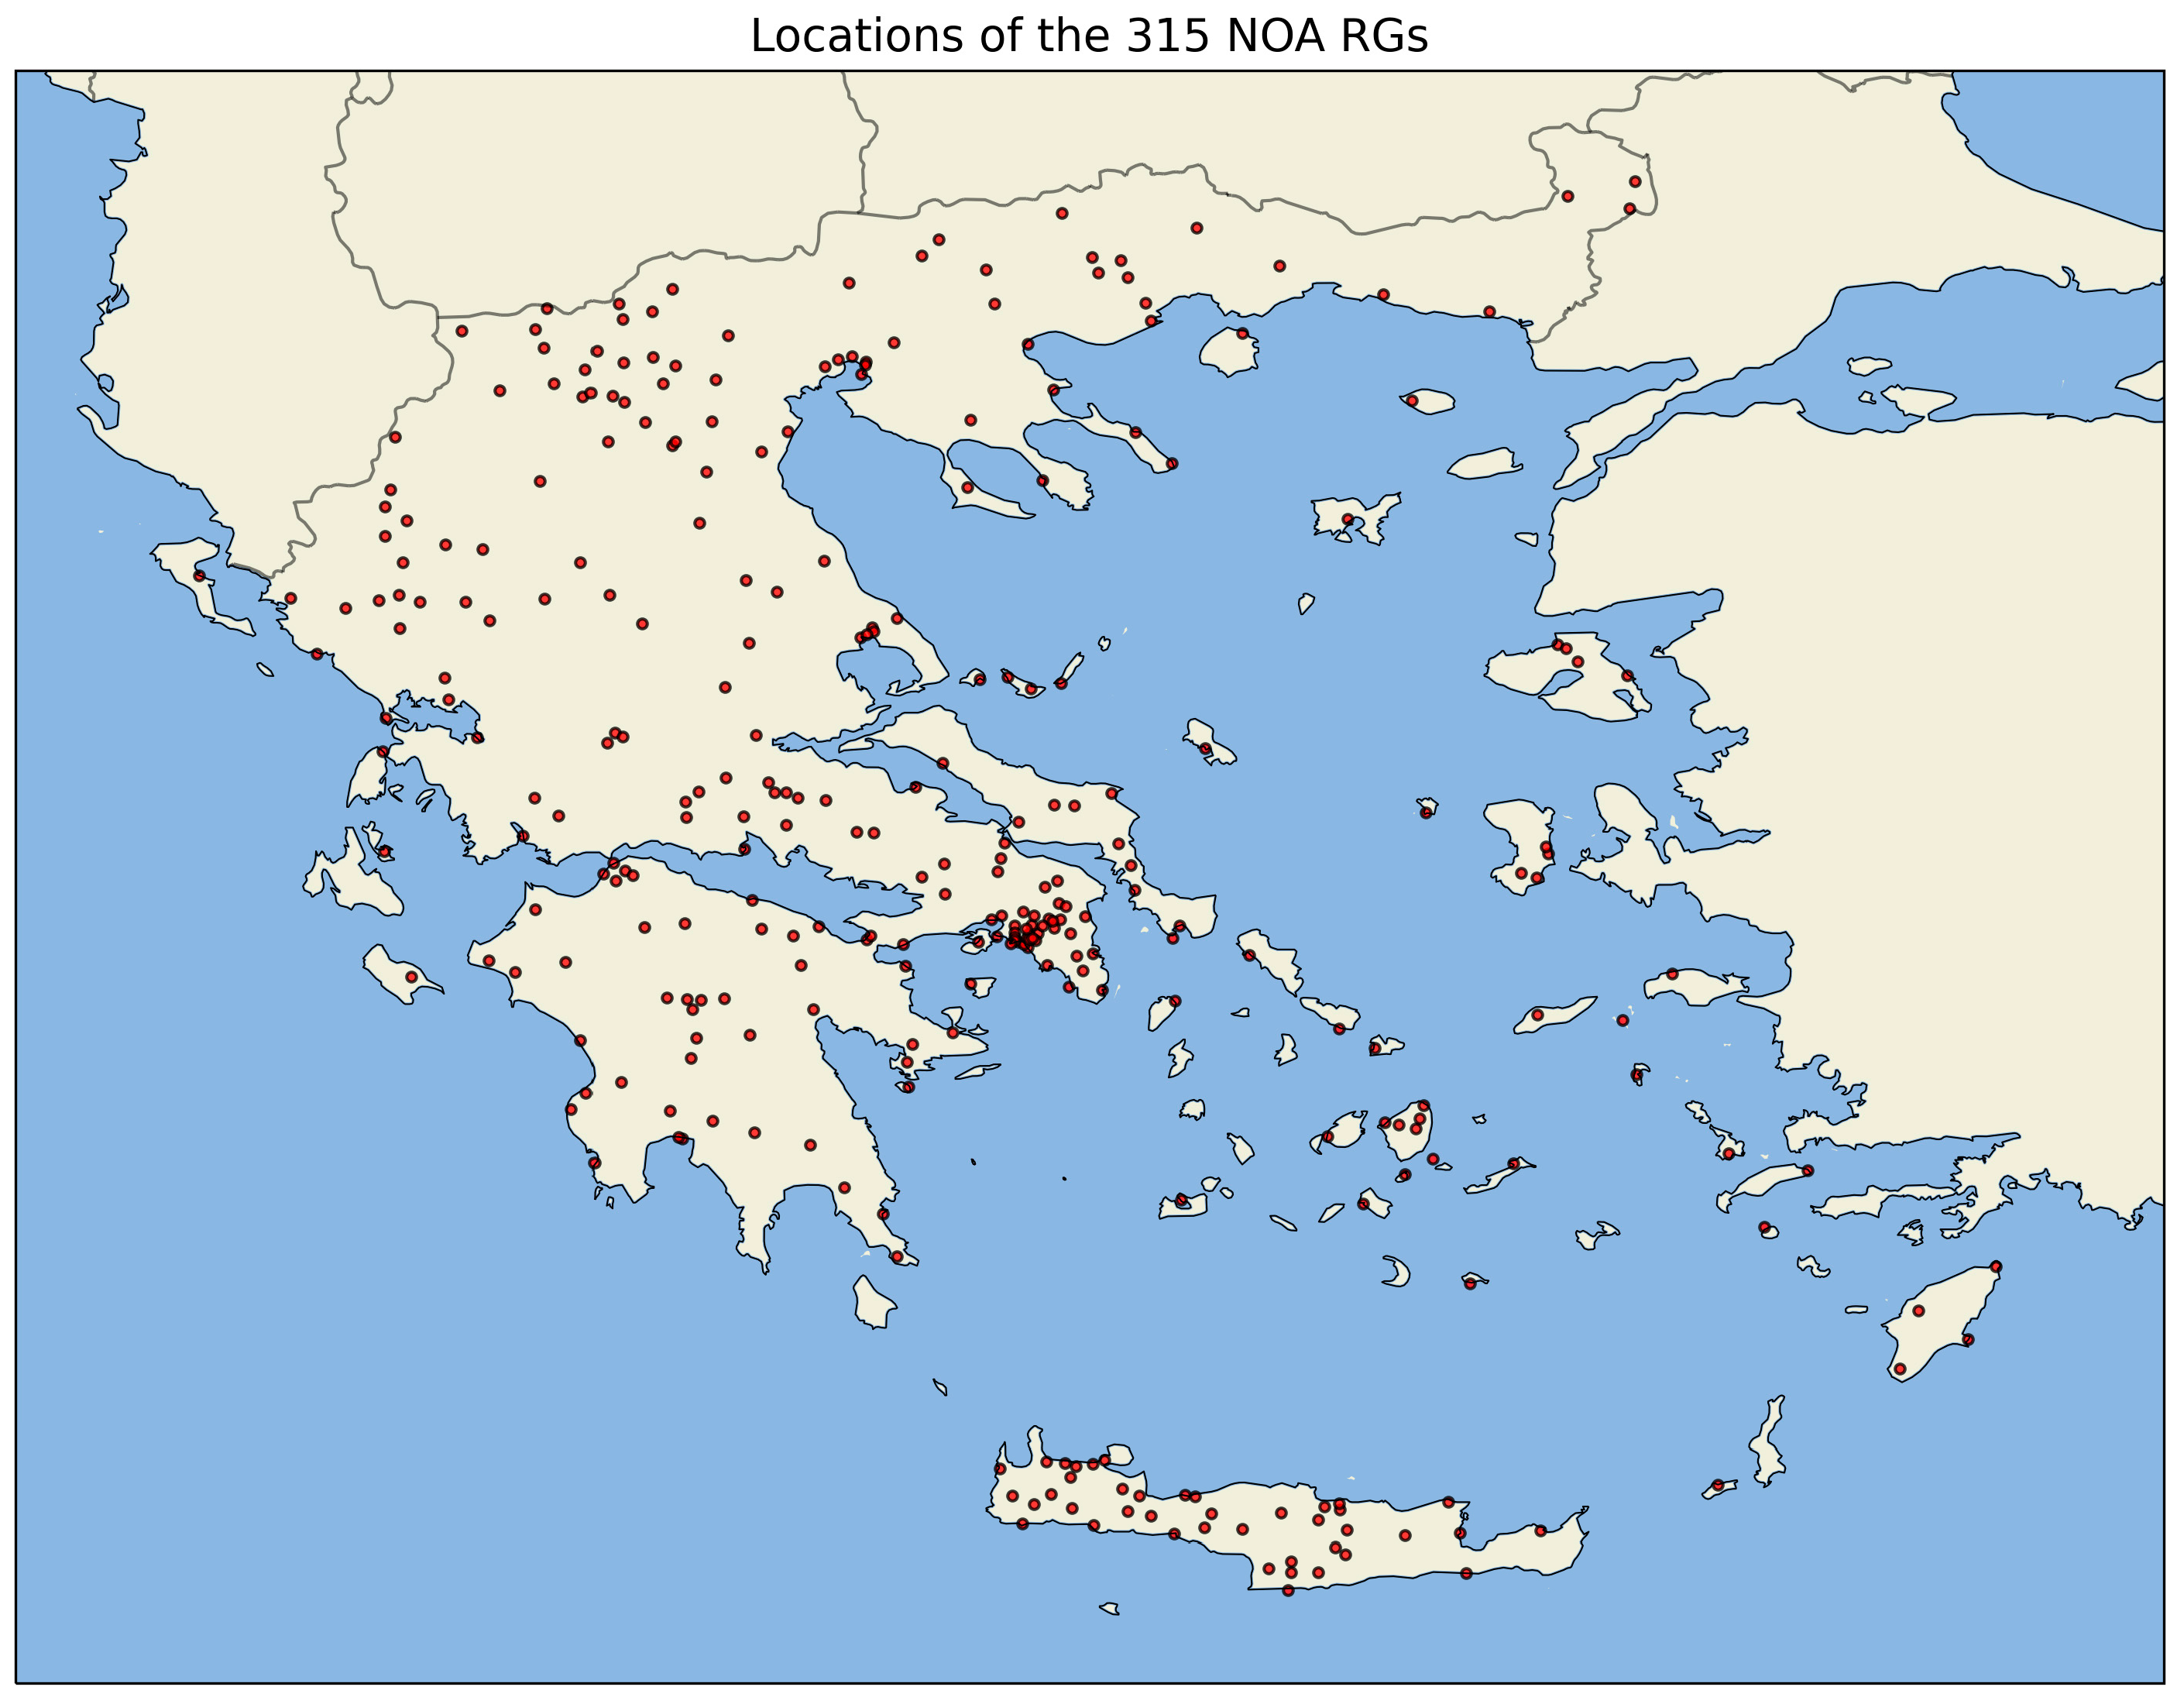
The rain gauge (RG) observations that are used in the analysis are extracted from the historical database data of the network of meteorological stations of the National Observatory of Athens (NOA). More about the network can be found in Lagouvardos et al. [
39]. 315 RGs were finally selected after a quality and completeness screening. All rain accumulations were checked for erroneous values based on comparisons against neighboring stations and reports from local authorities and individuals. All time series of the analysis have a minimum completeness of 90%. Each of the RGs accumulates precipitation every 10 min, namely at HH:00, HH:10, HH:20, HH:30, HH:40, and HH:50, where HH is the hour. The precision of the gauges is 0.2 mm.
Figure 1 depicts the locations of the 315 GRs, distributed over mainland and islanding regions of Greece.
The RG observations and the precipitation product estimations were temporarily upscaled to 1 h in order to be comparable, following the procedures described below.
Regarding the RGs, the upscaling was straightforward. A simple addition of the six 10-min observations within the hour amounts to the hourly accumulation (e.g., the addition of 12:10, 12:20, 12:30, 12:40, 12:50, and 13:00 accumulations results in the 12:00–13:00 accumulation).
Regarding the computation of the 1-h precipitation products accumulations, the upscaling was based on a two-step approach. First, the instantaneous rain rates of each time slot are converted to 15-min rain accumulations after a division by a factor of 4, since each hour comprises four 15-min periods. Then, the four instantaneous precipitation rates are added to obtain the hourly accumulation. The Greek area is scanned by SEVIRI around 10 min after the nominal scan time. Therefore, the addition of 12:00, 12:15, 12:30, and 12:45 accumulations (scanning Greece around 12:10, 12:25, 12:40, and 12:55) results in the 12:00–13:00 precipitation accumulation of each of the NWC SAF products.
4. Methodology
Since the RG sites and the SEVIRI pixel centers do not coincide, a direct comparison between them is not feasible. Moreover, an analysis using only the closest SEVIRI pixel may suffer from the so-called “double penalty problem”. To address these two issues, the 4 nearest SEVIRI pixel centers are used in the analysis. Each RG observation is compared against the CRR v2021, CRR-Ph v2018, and CRRPh v2021 estimations of (i) the nearest SEVIRI pixel (ii) the maximum value of the 4 nearest SEVIRI grid pixels, and (iii) the mean value of the 4 nearest SEVIRI grid pixels. Categorical and error statistics are computed and analyzed. The analysis showed that the results of the nearest value and the maximum value of the 4 nearest pixels analyses do not deviate significantly from those of the mean value analysis and certainly do not present qualitative differences. Since the mean value is considered the more balanced indication of the product estimations compared to the nearest neighbor or the maximum value of the 4 nearest pixels, the results of the mean value analysis are considered as indicative of the overall estimation efficiency of the products. In the following paragraphs, only results from the mean value analysis will be presented.
Two issues had to be considered before proceeding with the computation of the statistics. The first one is that the analysis is made for day and night separately. To discriminate between day and night, the sun zenith angle (SZA) of each pixel is extracted from the auxiliary outputs of NWC SAF software. A single value has to be computed for each of the three approaches (nearest pixel value, maximum value of 4 nearest pixels, mean value of 4 nearest pixels). Regarding the nearest pixel analysis, the SZA of the specific time and pixel is used. For the mean and maximum value of the 4 nearest pixels, the mean value of SZA of those 4 nearest pixels is used.
The second issue is the exclusion of noncloudy pixels. The non-cloudy pixels that are expected to result in correct negatives are the majority and therefore will inflate positively some statistics. To avoid that artificial improvement, it was decided to exclude non-cloudy pixels from the analysis of all products. In order to do so, the parallax-corrected cloud mask, as computed by the CMA product, is used. Only those pixels categorized as “cloudy” are kept in the analysis.
4.1. Categorical Statistics
In order to assess the efficiency of each product in the identification of precipitation areas, regardless of rain intensity, their estimations are considered as a dichotomous (yes/no) parameter. To compute the necessary statistics, one has to first define the elements of a contingency table (see
Table 1).
When the satellite estimation is equal or over a threshold of precipitation, the estimation is considered positive (“yes”); otherwise, the estimation is considered negative (“no”). When the RG measurement is equal or higher, the threshold the observation is considered positive (“yes”); otherwise, the observation is considered negative (“no”). The precipitation threshold in the present analysis is set equal to the precision of the RGs which is 0.2 mm.
The “hits”, “misses”, “false alarms”, and “correct negatives” are defined as follows:
“Hits” are the events that were positively estimated and were actually observed (satellite estimation “yes”/RG observation “yes”);
“Misses” are the events that were negatively estimated but did actually occur (satellite estimation “no”/RG observation “yes”);
“False alarms” are the events that were positively estimated but did not actually occur (satellite estimation “yes”/RG observation “no”), and;
“Correct negatives” are the events that were negatively estimated and were not observed by the RG (satellite estimation “no”/RG observation “no”).
Finally, four categorical statistics are computed and then analyzed, according to the following formulas.
Probability of Detection:
POD indicates the fraction of the observed “yes” events that were positively estimated by the product.
False Alarm Ratio:
FAR indicates the fraction of the positive estimations that did not actually occur.
BIAs Score:
BIAS is an indication of the overall overestimation or underestimation of the product. Values over 1 suggest overestimation, while values below 1 suggest underestimation.
Accuracy:
Accuracy is the fraction of the estimations that are correct. It is strongly influenced by the number of correct negatives.
4.2. Error Statistics
To obtain an indication of the accuracy of the estimation of precipitation accumulations, four statistics are computed, according to the following formulas:
Normalized Mean Absolute Error:
where
is the estimation of the algorithms,
is the observation of the RGs,
is the total number of estimation–observation pairs, and
is the average value of the observations. More information about the statistics used can be found in [
40].
5. Results
5.1. Categorical Statistics
5.1.1. 24-H Categorical Statistics
The categorical statistics, without distinction between day and night, are initially examined.
Table 2 summarizes the results. POD is clearly higher for CRRPh v2021, reaching an overall 61% against 38.3% for CRR-Ph v2018 and 30.0% for CRR v2021. This is quite a remarkable improvement for the new algorithm.
POD for CRRPh v2021 presents a rather weak seasonality. Winter in Greece is dominated by precipitation of very limited convection, while summer precipitation is mostly of convective nature, and spring and autumn are showing a mixed behavior. The fact that CRRPh v2021 shows increased sensitivity regardless of season is a much-desired characteristic and suggests that the new algorithm is efficient in the identification of precipitation areas, regardless of the precipitation type.
CRRPh v2021 FAR is slightly higher than CRR-Ph v2018 and CRR v2021. It reaches an overall 50.3%, with the higher value found for the summer dataset (60.0%) and the lower for winter (43.4%). CRRPh v2021 is less selective than the two previous products; however, the difference is rather small. In combination with the clearly higher sensitivity of the new algorithm, it is argued that the higher overestimation of the precipitation areas is an acceptable tradeoff, and overall, CRRPh v2021 outperforms the two other products.
The analysis of BIAS suggests that CRRPh v2021 overestimates the precipitation areas, while CRR v2021 underestimates them and CRR-Ph v2018 presents a mixed behavior with overestimation for summer, underestimation for winter and autumn, and no indication of overestimation or underestimation for spring. The seasonal difference of CRR-Ph v2018 is a non-desirable characteristic, since it lowers the end user’s trust in the product.
Finally, Accuracy is high for all the products, ranging from 80.1% for winter CRR-Ph v2018 to 92.4% for summer CRR v2021. However, as noted in the methodology section, Accuracy is strongly affected by the number of correct negatives. In our analysis, the correct negatives are the overwhelming majority. For example, during summer, for the CRRPh v2021 product, the total number of correct negatives is 55,653, while the total number of hits, misses, and false alarms is just 16,072, which amounts to only around 29% of the correct negatives.
5.1.2. Daytime Categorical Statistics
Daytime categorical statistics are summarized in
Table 3. During daytime, the POD difference between CRRPh v2021 and CRR v2021 remains very high; however, the difference between CRRPh v2021 and CRR-Ph v2018 is quite diminished compared to the 24-h analysis. A remarkable 75.5% POD is found for the CRRPh v2021 summer dataset. FAR is slightly lower for daytime compared to the 24-h analysis in almost every case, but the difference is very small. Small differences are noted for BIAS too; however, the general tendency of CRRPh v2021 to overestimate, of CRR v2021 to underestimate, and of CRR-Ph v2018 to present a mixed behavior remains valid for daytime datasets too. Finally, Accuracy retains very high values, which is expected since correct negatives dominate the daytime datasets too.
5.1.3. Nighttime Categorical Statistics
The nighttime categorical statistics are presented in
Table 4. What is more interesting in the analysis of the nighttime statistics is the fact that CRRPh v2021 POD holds high values that are comparable to the daytime and the 24-h ones. For example, the POD of the 24-h dataset is 61.0%, for the daytime dataset is 67.1%, and for the nighttime dataset is 58.8%. On the contrary, CRR-Ph POD presents much lower values. CRR v2021 POD presents similar and rather low values for daytime and nighttime. CRRPh v2021 FAR values are similar for daytime and nighttime, while the relatively lower FAR values that CRR-Ph v2018 is exhibiting during daytime are increased for nighttime to levels similar to CRRPh v2021. The overestimation of CRRPh v2021 is slightly decreased for nighttime, as indicated by the BIAS values, while both CRR-Ph v2018 and CRR v2021 underestimate during nighttime. Accuracy holds high values since correct negatives are the majority during nighttime too.
5.2. Error Statistics
5.2.1. 24-H Error Statistics
The error statistics, without distinction between day and night, are summarized in
Table 5. We consider the normalized MAE (NMAE) as a more representative metric than MAE when examining the errors of the estimated precipitation accumulations because MAE does not take into consideration the mean observed precipitation. However, having an indication of the relative deviation from the mean is very important when trying to assess the efficiency of the estimations. For example, seasonality can lead to significantly different average precipitation, and therefore MAE alone cannot give an indication of the efficiency of the algorithm. In simple words, it is quite different to have an MAE of 1 mm with a mean observed value of 10 mm than an MAE of 1 mm with a mean observed value of 1 mm. The average absolute errors of the first case are clearly smaller than those of the second case when compared to the average measurement of the parameter, suggesting a more efficient estimation for the first case.
The normalized absolute errors (NMAEs) of CRRPh v2021 are higher during autumn, smaller during spring and the whole year, and present the lower values during winter and summer seasons. CRR-Ph v2018 and CRR v2021 seem to perform slightly better than CRRPh v2021, especially during autumn. Overall, it seems that the normalized absolute errors are comparable to the average observed values of precipitation, with the exception of CRRPh v2021 autumn when they are higher.
ME reveals the dominant sign of the errors and therefore the overall tendency of the product to overestimate or underestimate precipitation accumulations. At the same time, since the signs of the errors are included in the computation of the metric, errors of opposite signs will cancel each other, thus ME is not a good indication of the magnitude of deviations from the mean. CRR v2021 strongly underestimates precipitation accumulations, while CRR-Ph v2018 also underestimates them but to a smaller degree. CRRPh v2021 is in general more balanced with the exception of autumn where a clear overestimation is evident.
CRRPh v2021 presents the highest absolute errors (MAEs), ranging from 1.7 mm for winter and spring to 3.1 mm for autumn. CRR-Ph v2018 follows with MAE ranging from 1.5 mm for spring to 2.5 mm for summer while the lowest MAEs are found for CRR v2021, ranging from 1.3 mm for spring to 2.2 mm for autumn. Overall, CRRPh v2021 carries higher accumulation errors than CRR-Ph v2018 and CRR v2021.
Comparing RMSE to MAE for each product, it is found that RMSE is higher than MAE by a factor that ranges from 1.6 to 2.0. Only small fluctuations between seasons are noted; therefore, it is argued that the influence of outliers does not present significant seasonal variations. Τhe increase factor is slightly smaller for CRRPh v2021, but since MAE is also smaller, it is argued that the influence of outliers does not present a profound difference between the three products.
5.2.2. Daytime Error Statistics
Daytime error statistics are presented in
Table 6. NMAE presents rather similar values that range from 0.8 (winter for CRRPh v2021) to 1.2 (winter for CRR-Ph v2018), suggesting minor differences between the products. As indicated by the inspection of ME, CRR v2021 strongly underestimates precipitation accumulations, while CRR-Ph v2018 and CRRPh v2021 in general overestimate the accumulations. From the analysis of RMSE and MAE, it is deduced that the outliers present limited seasonal fluctuations and also small differences between the three products.
5.2.3. Nighttime Error Statistics
The nighttime error statistics are presented in
Table 7. CRR-Ph v2018 and CRR v2021 NMAE values are around 1, but CRRPh v2021 has higher values for the autumn, spring, and year datasets. Comparing the values of 24-h, daytime, and nighttime analyses, it becomes evident that the higher values of NMAE of CRRPh v2021 are associated with nighttime since daytime values revolve around 1. CRR-Ph v2018 and CRR v2021 present similar values for day and night. By analyzing the ME values for the night, day, and 24-h datasets, it can be seen that the CRR v2021 underestimation is more pronounced during nighttime. CRR-Ph v2018 overall underestimation is mainly attributed to nighttime, since during daytime, a smaller overestimation is evident. Regarding CRRPh v2021, a more consistent behavior between day and night is identified, but it should be noted that the product suffers from seasonal differences and strong overestimation during autumn. CRRPh v2021 presents the highest MAEs, CRR-Ph v2018 follows, and CRR v2021 presents the lowest values. Finally, RMSE is higher than MAE by a factor ranging from 1.6 to 2.0 for all products and seasons. As in the cases of 24-h and daytime analyses, it is argued that the seasonal change of outlier influence is small and that there is no clear evidence of increased outlier influence for one product against the others.
5.3. The Influence of Topography on the CRRPh v2021 Product
Aiming to identify the possible influence of topography on the efficiency of the new algorithm for the Convective Rainfall Rate from Cloud Physical Properties (CRRPh v2021), the categorical and error statistics were computed for different bins of elevation, slope, and aspect. Twenty-four-hour, yearly datasets are used. The results are summarized in
Table 8. Only POD, FAR, BIAS, NMAE, MAE, and ME statistics are presented since the remaining statistics do not change the conclusions drawn.
First, the dataset was divided into 5 elevation bins (in meters): [0–100), [100–200), [200–400), [400–800), and [800+). The bins were selected in a way that serves a sense of distinction between plains, semi-mountainous, and mountainous regions and also results in a similar number of stations for each bin. POD and FAR present a small decrease over 200 m of elevation. The mild decrease in BIAS over 200 m suggests a slight reduction of overestimation for higher elevations. The NMAE and MAE are slightly reduced after 200 m of elevation, while ME is clearly decreased over 200 m. Since the decrease in MAE does not follow the decrease in ME, it is deduced that the reduction of ME is associated with a more balanced distribution of positive and negative sign errors around the average for the higher elevations.
Next, the dataset is divided into 5 slope bins (in degrees): [0–1), [1–2), [2–4), [4–8), and [8+). The bins were selected in a fashion that results in comparable numbers of stations. A small decrease in POD, FAR, and BIAS is evident over 4 degrees. NMAE is very slightly reduced for higher slopes and MAE presents negligible fluctuations, but ME is significantly smaller, suggesting a more balanced distribution of the errors around the average.
Finally, the dataset is divided into four aspect bins that represent the four quadrants. The POD, FAR, and BIAS statistics fluctuate mildly between the quadrants, with marginally higher values for the fourth quadrant [270–360 degrees). NMAE and ME are slightly higher for the third and fourth quadrants, while MAE values are higher for the first quadrant. Since there are no significant changes for normalized MAE and MAE, the smaller values of ME for the second and mainly for the first quadrant should be associated with a more balanced distribution of errors around the average for these quadrants.
5.4. Examples of Visual Comparison between the Three Products
To graphically illustrate the difference in the behavior of the three products regarding the delineation of precipitation areas, maps over the Greek area for one arbitrary daytime and one arbitrary nighttime precipitation event are plotted and discussed.
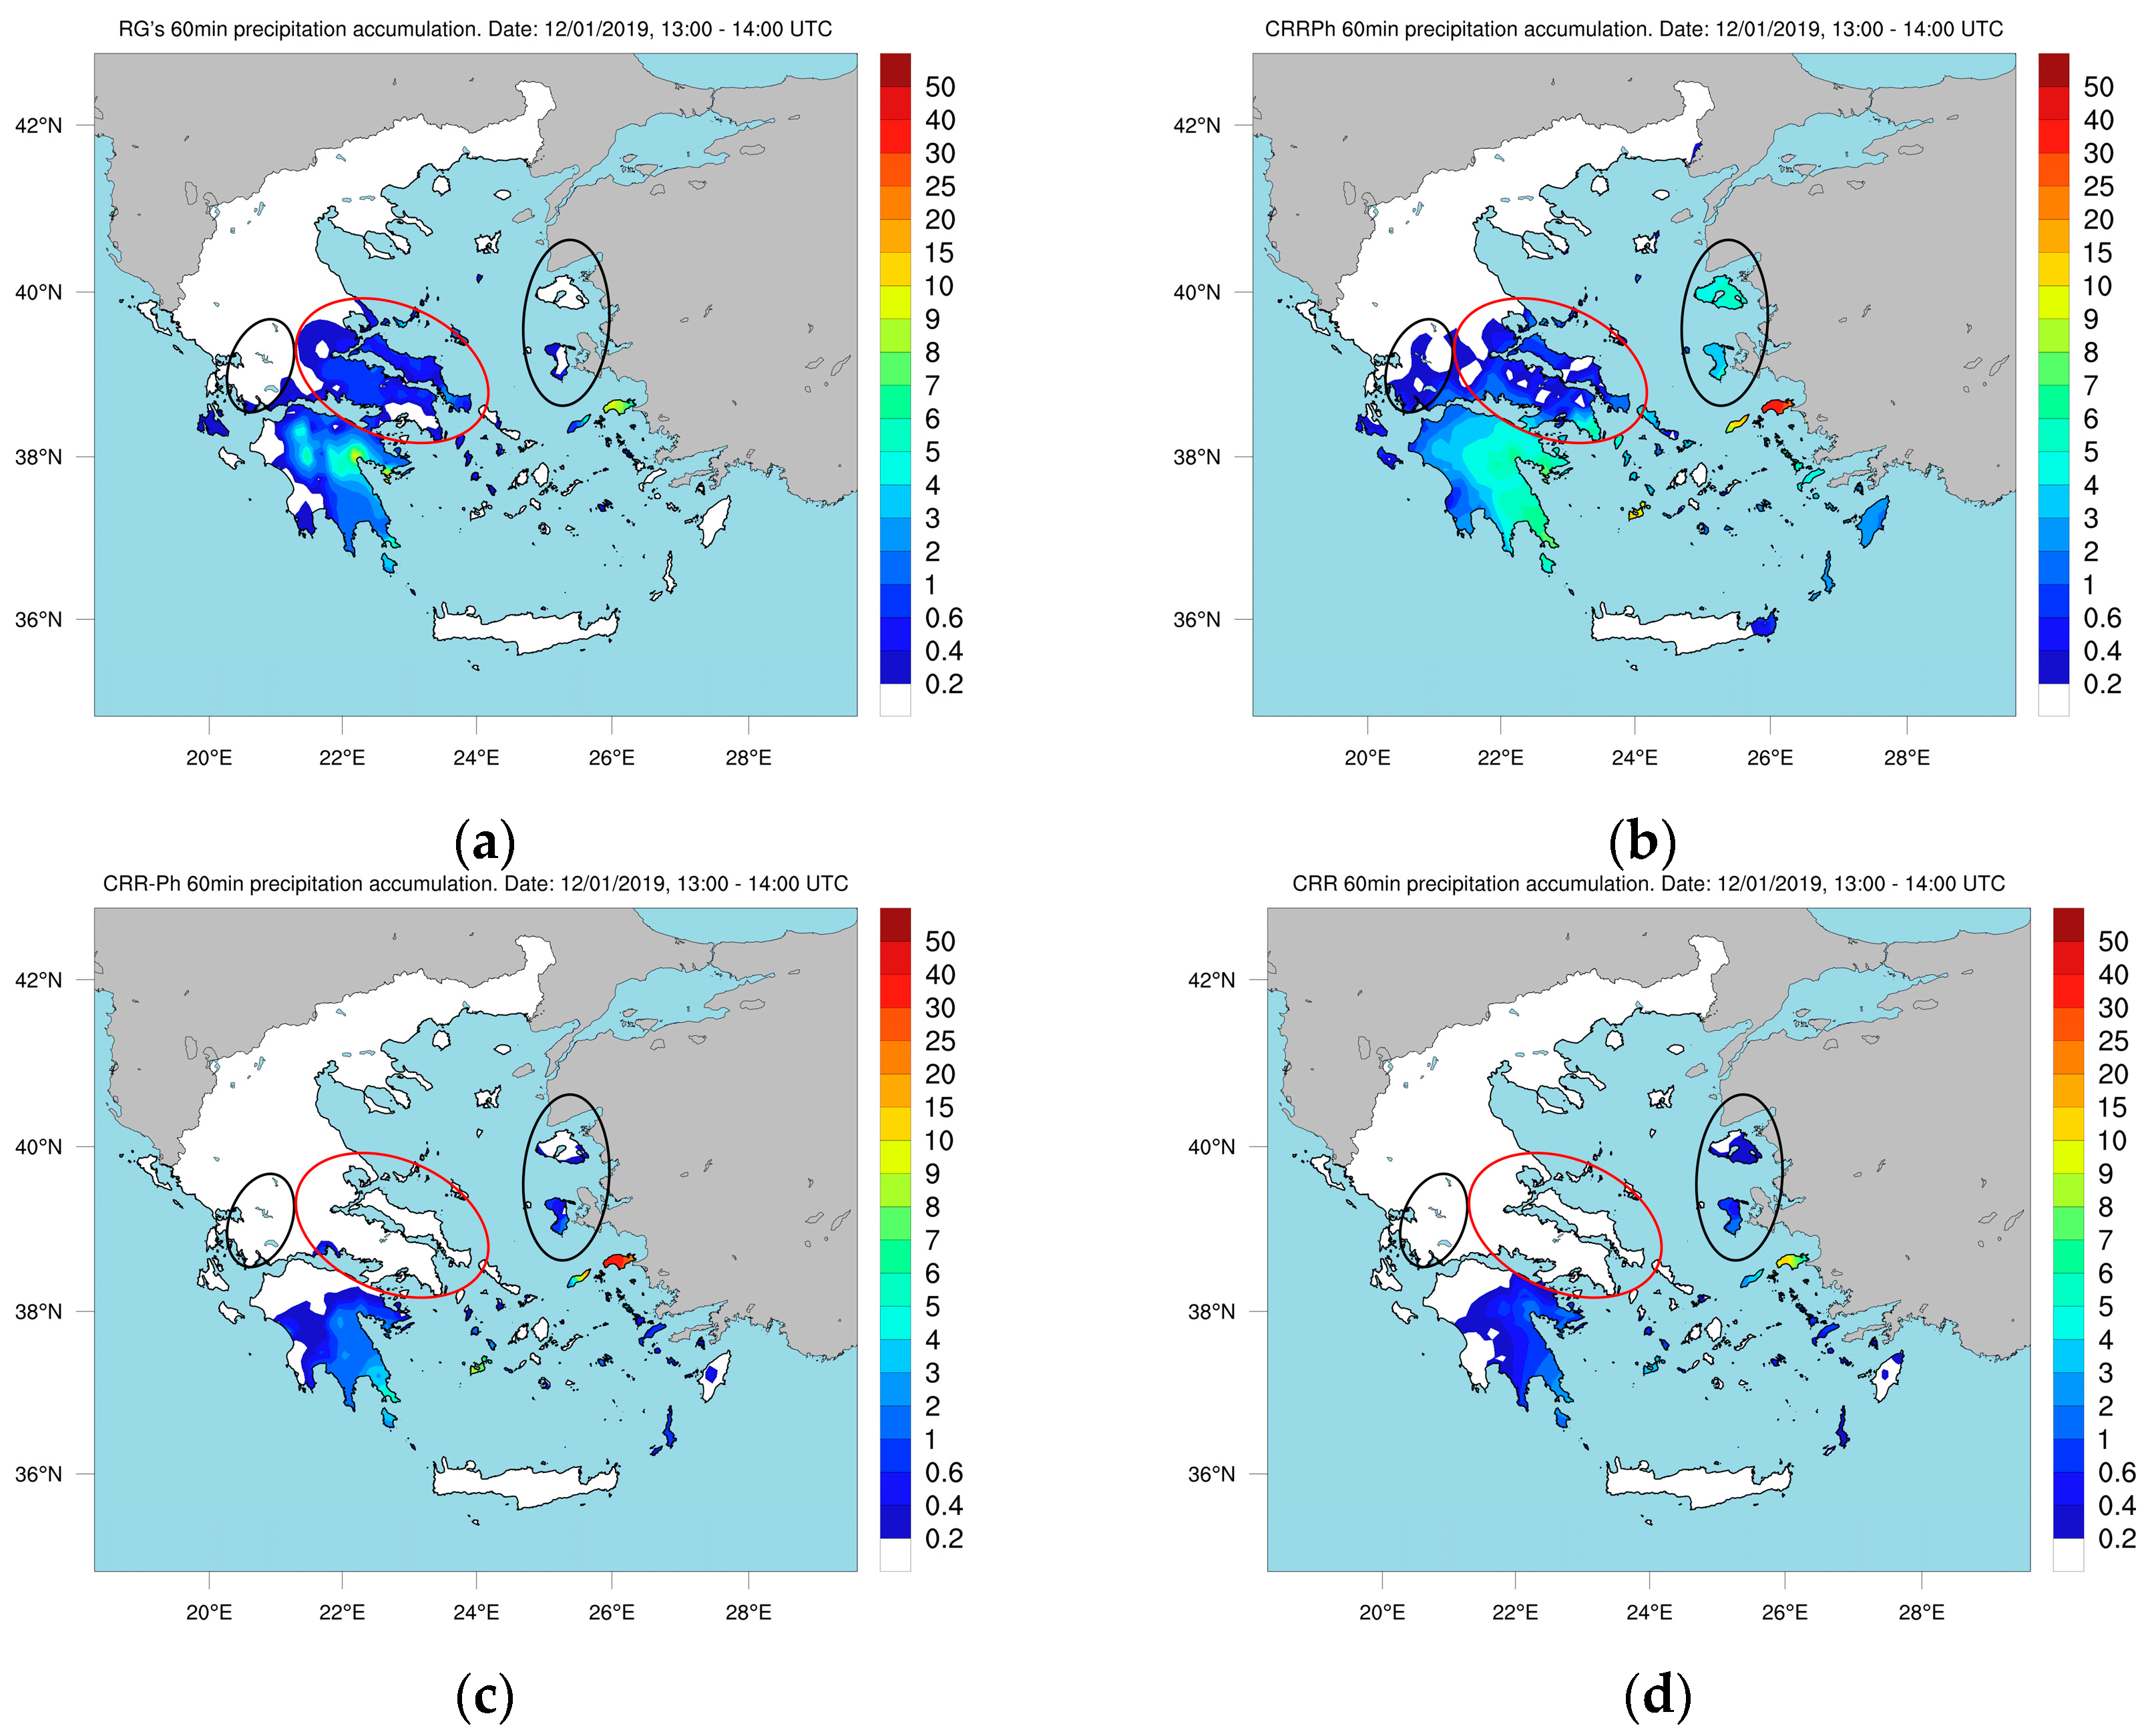
The winter daytime example is depicted in
Figure 2. Only CRRPh v2021 identifies a significant part of the precipitation area inside the red ellipses, supporting our finding that CRRPh v2021 is more sensitive, especially compared to CRR v2021. On the other hand, CRRPh v2021 overestimates to a higher degree the precipitation areas inside the black ellipses, in contrast to CRR-Ph v2018 and especially to CRR v2021 and in agreement with the slightly lower selectivity found for CRRPh v2021.
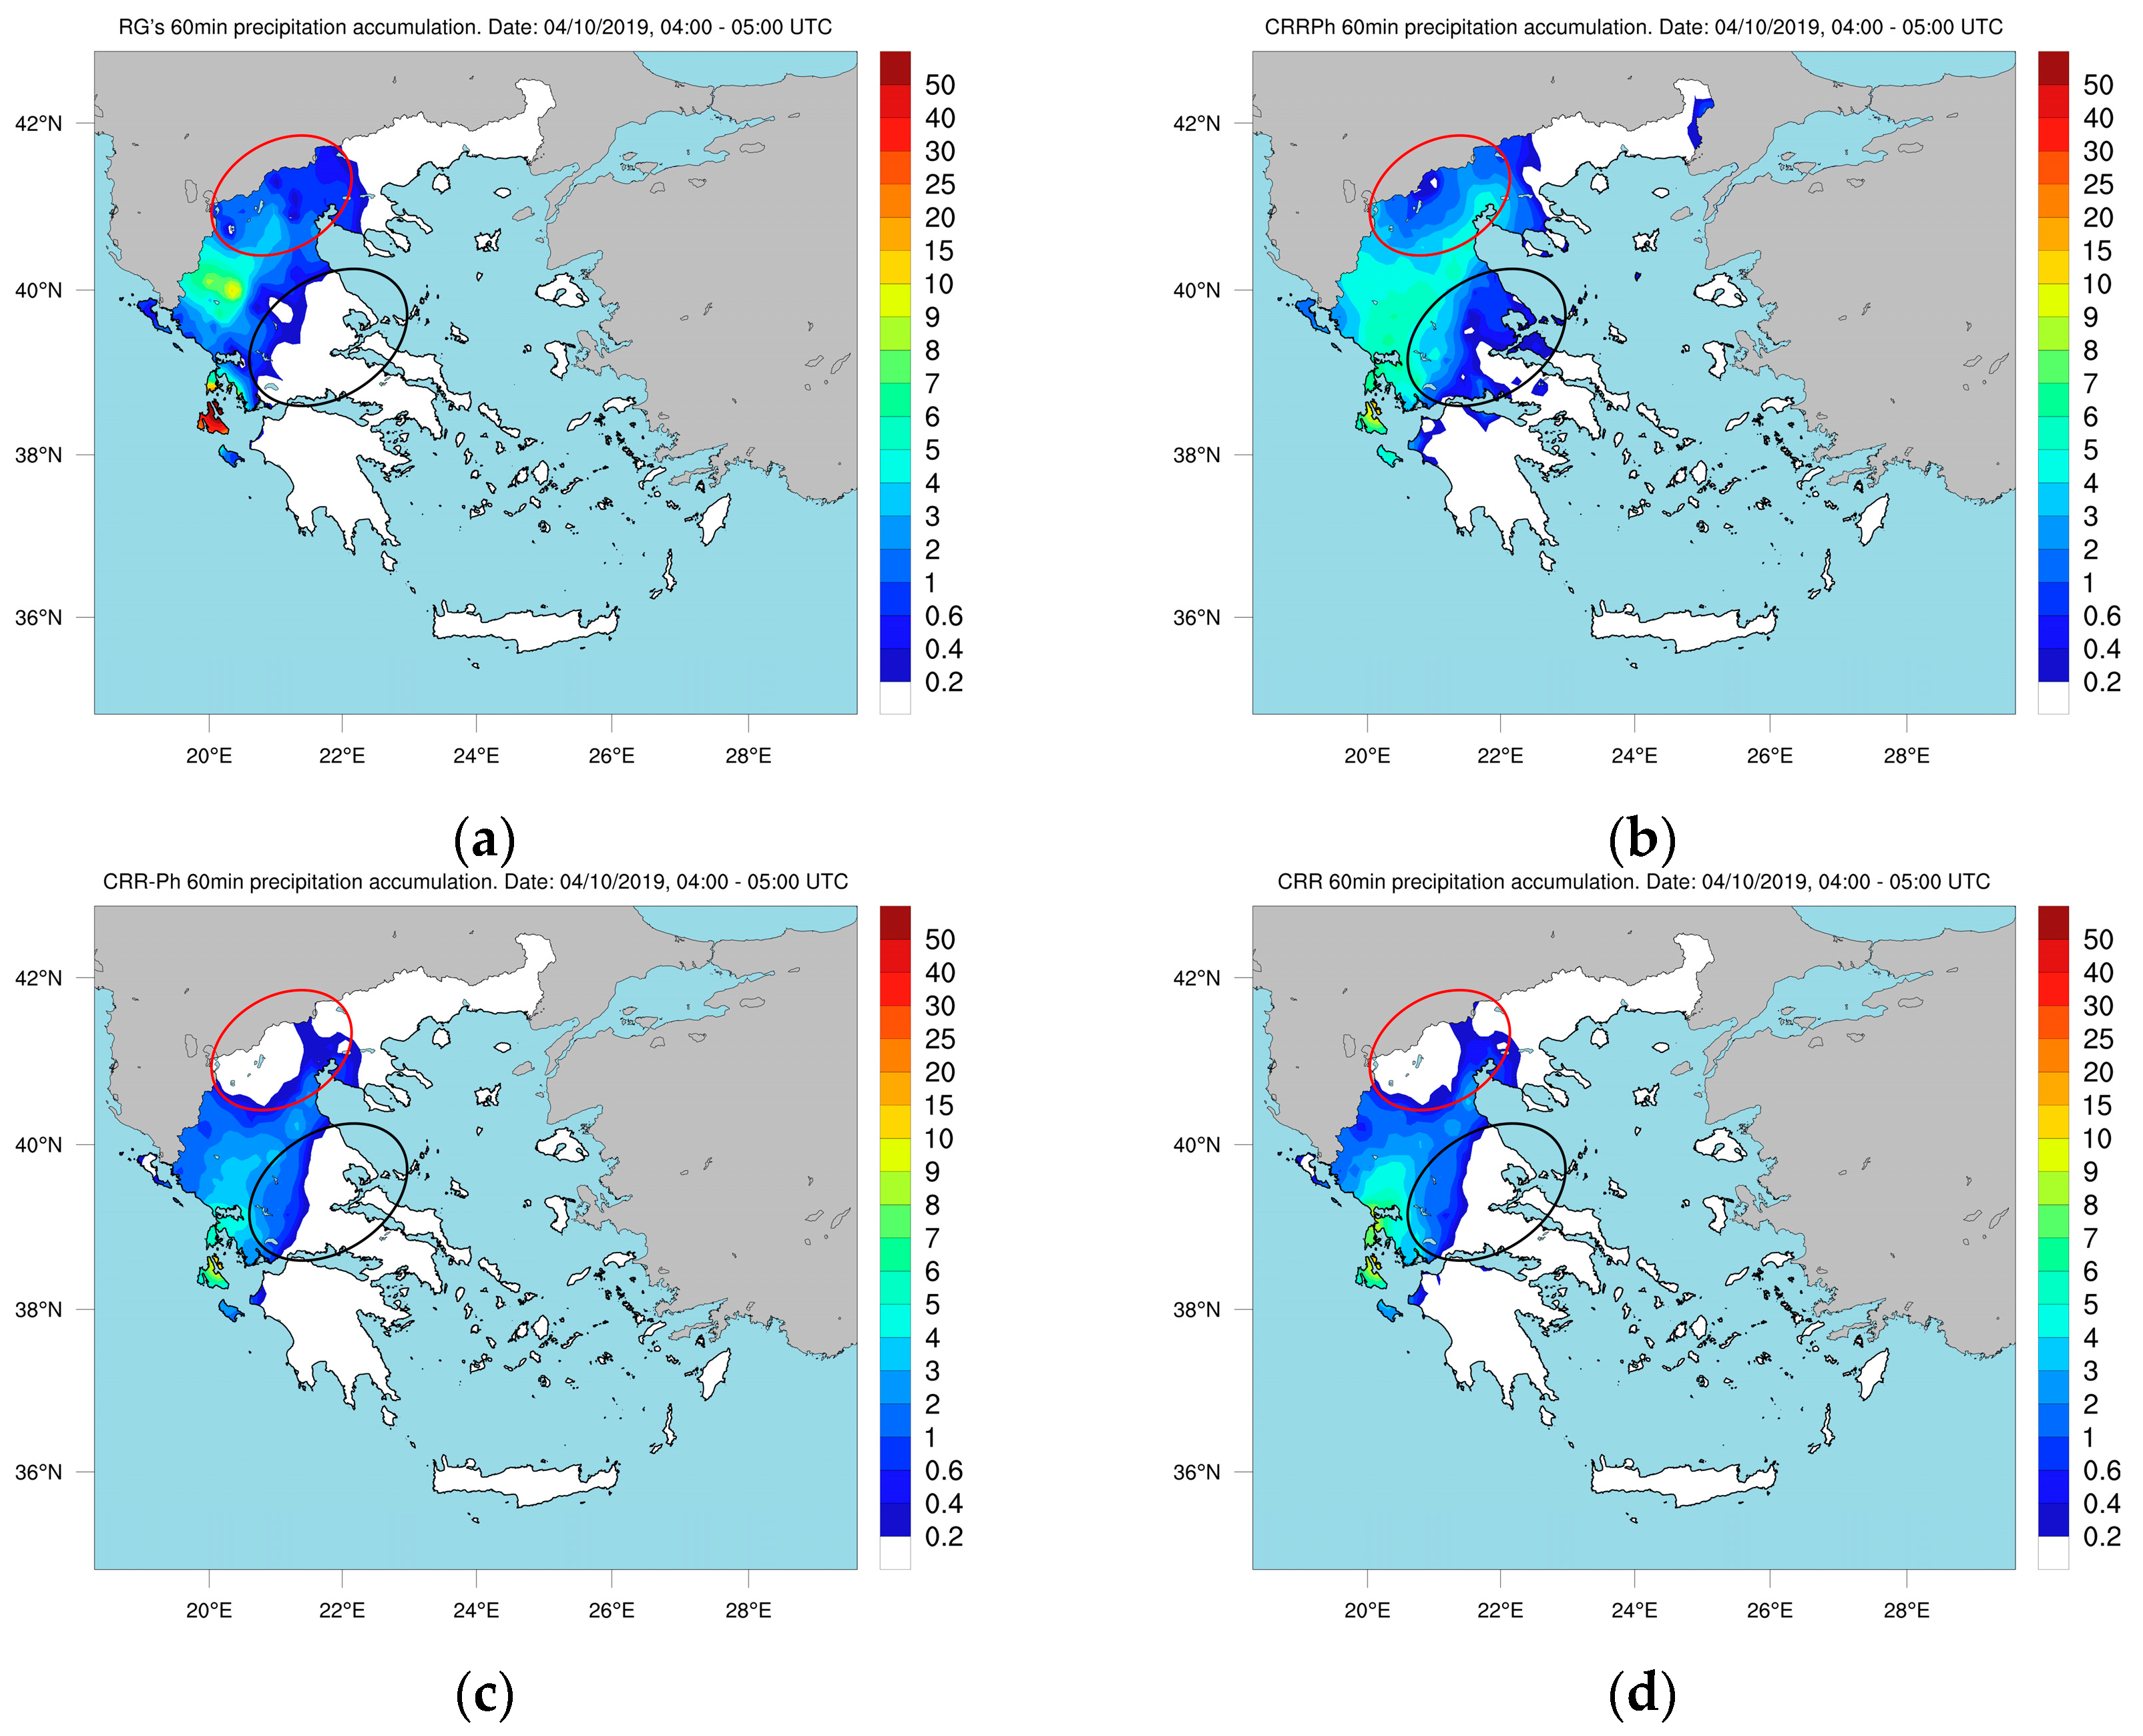
Figure 3 depicts an autumn nighttime example. A significant part of precipitation is identified only by CRRPh v2021 and not CRR-Ph v2018 or CRR v2021 (red ellipses) illustrating thus the clearly higher nighttime sensitivity of the new algorithm. At the same time, the new algorithm overestimates the precipitation areas (black ellipses), presenting lower selectivity than the other two products, in agreement with the FAR and BIAS findings for the autumn nighttime dataset.
6. Conclusions
In the present analysis, the estimation efficiency of the new NWC SAF convective rainfall rate from microphysical properties product (CRRPh v2021) is assessed and compared to earlier versions of NWC SAF precipitation products. The dependency of the new algorithm on topography is also examined. The product estimations are compared against rain gauge data covering a full year (2019) over the Greek area. Categorical and error statistics are computed and analyzed, aiming to identify the differences in the estimation efficiency of the new product (CRRPh v2021) against the earlier versions and reveal any possible influence of the topography on the efficiency of CRRPh v2021.
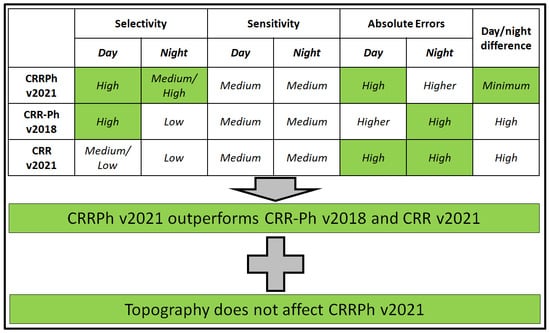
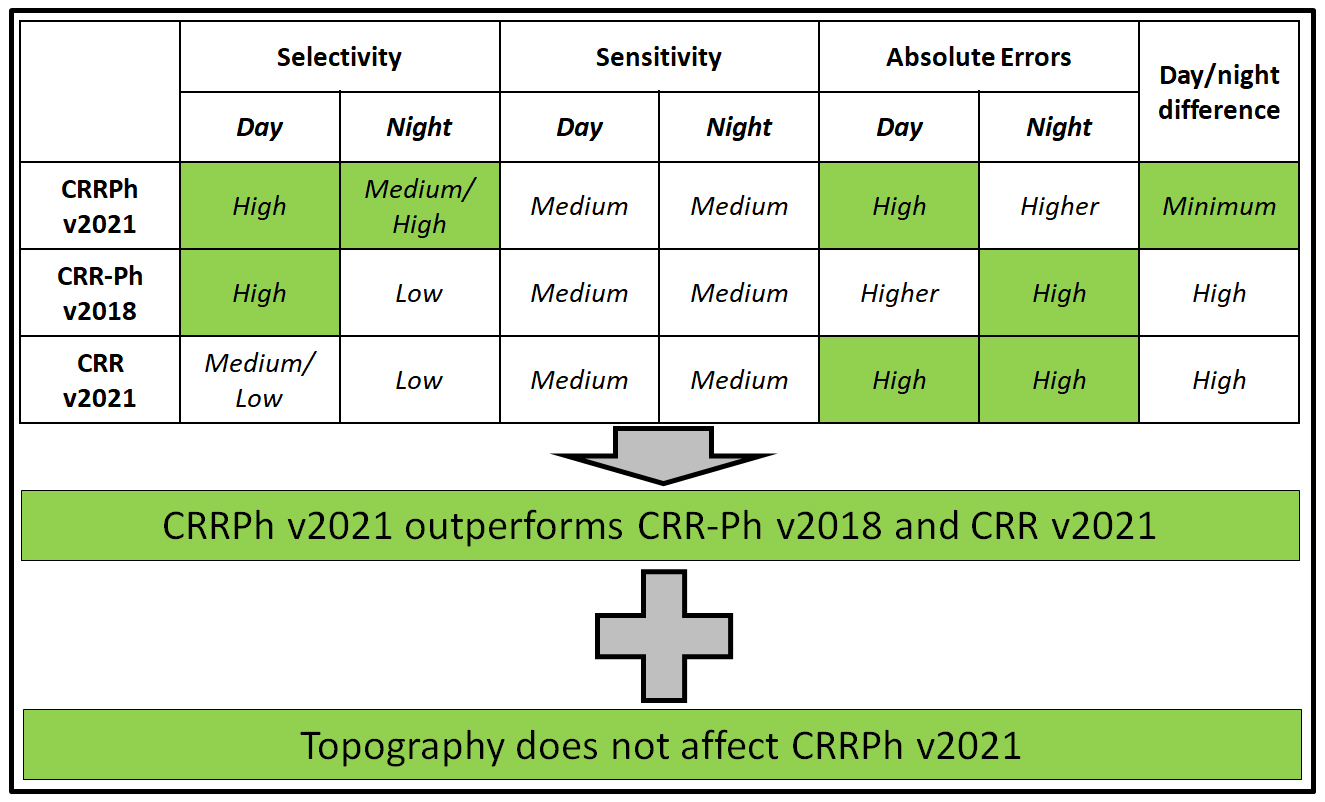
CRRPh GEO v2021 is more sensitive than CRR-Ph v2018 and CRR v2021, as suggested by the higher POD values, especially during nighttime, but it is slightly less selective, having relatively higher FAR values. BIAS values are also higher for CRRPh v2021, suggesting increased overestimation. Since POD, FAR, and BIAS are related, the BIAS increase can be partially attributed to the increase of the precipitation areas identified by CRRPh v2021, a notion that is also supported by the increase in POD and FAR. Overall, it could be stated that although the new algorithm tends to overestimate the areas of rainfall, it manages to identify most of the precipitation cases in contrast to CRR-Ph v2018 and CRR v2021. It is argued that CRRPh v2021 outperforms CRR-Ph v2018 and CRR v2021 in regard to the delineation of the precipitation areas. This argument is based on the assumption that the adverse effects of a case of precipitation that was not nowcasted can be more than those of a case that was nowcasted but did not actually occur; therefore, the slightly increased false alarms of CRRPh v2021 can be considered as an acceptable tradeoff.
The day/night difference in the efficiency of the delineation of the precipitation areas is reduced substantially for the new algorithm compared to the previous ones. The categorical statistics of CRRPh v2021 clearly present smaller variations when shifting from day to night compared to CRR-Ph v2018 and CRR v2021. This is a highly desirable characteristic, as it agrees with the notion that the physics of precipitation do not change abruptly when moving from day to night conditions, it strengthens the sense of confidence of the end users of the CRRPh v2021 product and permits the operational application of the algorithm in a 24-h basis.
CRRPh v2021 suffers from higher absolute accumulation errors compared to the other two products. From the combined examination of the absolute and the signed errors, it becomes evident that although CRRPh v2021 presents higher errors, they are of both positive and negative signs and also that the dominant sign of the errors is dependent on the season.
The analysis of error statistics of CRRPh v2021 shows a limited differentiation regarding the signed errors between day and night, in contrast to CRR-Ph v2018 and CRR v2021. CRRPh v2021 presents a small differentiation between day and night regarding the precipitation accumulations. CRR-Ph v2018 presents a limited overestimation during daytime and strong underestimation during nighttime, overall underestimating precipitation accumulations. CRR v2021 heavily underestimates the precipitation accumulations both during day and night conditions.
Regarding the influence of elevation and slope on the estimation efficiency of the new algorithm, it was shown that sensitivity, selectivity, and accumulation errors decrease slightly for high elevation and slope bins. The decrease is rather small and cannot support the suggestion that these topographic parameters affect substantially the estimation efficiency of the product. Aspect presents a practically negligible effect on the CRRPh v2021 estimation efficiency.
The conclusions of the present analysis are in general agreement with those of Lahuerta et al. [
6], who performed a subjective and objective validation of the CRRPh v2021 product using radar data from selected days of 2016 as ground truth. The subjective validation, which consisted of visual comparisons between CRRPh v2021 and radar images indicated an acceptable degree of performance under day and night conditions. According to the objective validation results during daytime conditions without distinction between convective and non-convective cases in the Iberian Peninsula, POD was 70.99% and FAR was 47.48% for instantaneous rain rates, while for hourly accumulations, POD was 77.08% and FAR was 52.48%. During nighttime, POD was 55.85% and FAR was 65.88% for instantaneous rain rates, while for hourly accumulations, POD was 60.70% and FAR was 68.94%. The POD and FAR values of the present study are close enough to those of Lahuerta et al. [
3], as they do not deviate more than ~10% and ~18%, respectively. Such differences could be attributed to a variety of reasons, such as the different sizes of datasets, the nature of ground truth data, the area of analysis, the methodology of hourly accumulation computations, etc.
In general, CRRPh v2021 identifies most of the precipitation areas, although it overestimates to a certain degree the precipitation areas. Therefore, it is argued here that the product could be used as a total rainfall rate algorithm and not just as a convective rainfall rate algorithm after adequate adaptations. For example, the recalibration of the algorithm using a wider dataset that includes precipitation of limited convection, such as winter stratiform precipitation cases, could improve the identification of total precipitation.
All NWC SAF precipitation products, including CRRPh v2021, are developed aiming to help forecasters in their everyday nowcasting duties. One of their main objectives is the delineation of precipitation areas in near real time. CRRPh v2021 satisfies that need successfully enough and certainly better than its predecessors. Keeping that in mind, we argue that CRRPh v2021 outperforms CRR-Ph v2018 and CRR v2021 despite its relatively higher precipitation accumulation errors. Such errors may be considered as a disadvantage for other applications like hydrology, but they are of lesser importance in regard to the objectives of NWC SAF precipitation products. The new CRRPh v2021 algorithm was released in the NWC SAF GEO software package GEO v2021 in April 2022, and it has been declared operational by EUMETSAT.
Author Contributions
Conceptualization, A.K., J.A.L., X.C., P.R. and K.L.; methodology, A.K., J.A.L., L.L., X.C., K.L., V.K. and P.R.; software, A.K.; validation, A.K., J.A.L., L.L., X.C., K.L., V.K. and P.R.; data curation, A.K.; writing—original draft preparation, A.K.; writing—review and editing, A.K., J.A.L., L.L., X.C., K.L., V.K. and P.R.; visualization, A.K.; supervision, A.K., X.C., K.L. and P.R.; project administration, P.R. and K.L. All authors have read and agreed to the published version of the manuscript.
Funding
This research was funded by the “European Organization for the Exploitation of Meteorological Satellites (EUMETSAT)”, through the “Satellite Application Facility on Support to Nowcasting and Very short range forecasting (NWCSAF)” “Visiting Scientist Activity (VSA)” program.
Data Availability Statement
Not applicable.
Conflicts of Interest
The authors declare no conflict of interest.
References
- GOES Satellite Network. Available online: https://www.nasa.gov/content/goes-overview/index.html (accessed on 14 January 2023).
- Meteorological Satellite Center of JMA. Available online: https://www.data.jma.go.jp/mscweb/en/oper/operation.html (accessed on 14 January 2023).
- EUMETSAT NWC SAF Website. Available online: nwc-saf.eumetsat.int (accessed on 14 January 2023).
- Lahuerta, J.A.; Lliso, L.; Ripodas, P. User Manual for the Precipitation Product Processors of the NWC/GEO. 2022. Available online: nwc-saf.eumetsat.int (accessed on 14 January 2023).
- Lahuerta, J.A.; Lliso, L.; Ripodas, P. Algorithm Theoretical Basis Document for the Precipitation Product Processors of the NWC/GEO. 2021. Available online: nwc-saf.eumetsat.int (accessed on 14 January 2023).
- Lahuerta, J.A.; Lliso, L.; Ripodas, P. Scientific and Validation Report for the Precipitation Product Processors of the NWC/GEO. 2022. Available online: nwc-saf.eumetsat.int (accessed on 14 January 2023).
- Lahuerta, J.A.; Cablet, X.; Ripodas, P. User Manual for the Precipitation Product Processors of the NWC/GEO. 2019. Available online: nwc-saf.eumetsat.int (accessed on 14 January 2023).
- Hernanz, A.; Lahuerta, J.A.; Llisom, L.; Ripodas, P. Algorithm Theoretical Basis Document for the Precipitation Product Processors of the NWC/GEO. 2019. Available online: nwc-saf.eumetsat.int (accessed on 14 January 2023).
- Lahuerta, J.A.; Cabletm, X.; Ripodas, P. Scientific and Validation Report for the Precipitation Product Processors of the NWC/GEO. 2019. Available online: nwc-saf.eumetsat.int (accessed on 14 January 2023).
- Lahuerta, J.A.; Lliso, L.; Cablet, X.; Ripodas, P. Scientific Report on response to the ESSL testbed feedback on NWC SAF precipitation products. 2021. Available online: nwc-saf.eumetsat.int (accessed on 14 January 2023).
- Joyce, R.J.; Janowiak, J.E.; Arkin, P.A.; Xie, P. CMORPH: A method that produces global precipitation estimates from passive microwave and infrared data at high spatial and temporal resolution. J. Hydromet. 2004, 5, 487–503. [Google Scholar] [CrossRef]
- Kummerow, C.; Hong, Y.; Olson, W.S.; Yang, S.; Adler, R.F.; McCollum, J.; Ferraro, R.; Petty, G.; Shin, D.-B.; Wilheit, T.T. Evolution of the Goddard profiling algorithm (GPROF) for rainfall estimatin from passive microwave sensors. J. Appl. Meteor. 2001, 40, 1801–1820. [Google Scholar] [CrossRef]
- Huffman, G.; Bolvin, D.; Braithwaite, D.; Hsu, K.; Joyce, R.; Xie, P.; Yoo, S.-H. Algorithm Theoretical Basis Document (ATBD) NASA Global Precipitation Measurement (GPM) Integrated Multi-satellitE Retrievals for GPM (IMERG). NASA, NASA/GSFC, NASA/GSFC Code 612, Greenbelt, MD 20771. 2013, 4, 16. Available online: https://gpm.nasa.gov/resources/documents/algorithm-information/IMERG-V06-ATBD (accessed on 14 January 2023).
- Skofronick-Jackson, G.; Petersen, W.A.; Berg, W.; Kidd, C.; Stocker, E.F.; Kirschbaum, B.D.; Kakar, R.; Braun, S.A.; Huffman, G.J.; Iguchi, T.; et al. The Global precipitation measurement (GPM) mission for science and society. Bull. Am. Meteorol. Soc. 2017, 98, 1679–1695. [Google Scholar] [CrossRef] [PubMed]
- Huffman, G.; Bolvin, D.; Nelkin, E.; Wolff, D.B.; Adler, R.F.; Gu, G.; Hong, Y.; Bowman, K.B.; Stocker, E.F. The TRMM multisatellite precipitation analysis (tmpa): Quasi-global, multiyear, combined-sensor precipitation estimates at fine scales. J. Hydrometeorol. 2007, 8, 38–55. [Google Scholar] [CrossRef]
- Huffman, G.J.; Adler, R.F.; Bolvin, D.T.; Nelkin, E.J. The TRMM multi-satellite precipitation analysis (TMPA). In Satellite Rainfall Applications for Surface Hydrology; Gebremichael, M., Hossain, F., Eds.; Springer: Dordrecht, The Netherlands, 2010; pp. 3–22. [Google Scholar]
- Liu, Z.; Ostrenga, D.; Teng, W.; Kempler, S. Tropical rainfall measuring mission (TRMM) precipitation data and services for research and applications. Bull. Am. Meteorol. Soc. 2012, 93, 1317–1325. [Google Scholar] [CrossRef] [Green Version]
- Hong, Y.; Hsu, K.L.; Sorooshian, S.; Gao, X. Precipitation estimation from remotely sensed imagery using an artificial neural network cloud classification system. J. Appl. Meteorol. 2004, 43, 1834–1852. [Google Scholar] [CrossRef] [Green Version]
- Hsu, K.; Gao, X.; Sorooshian, S.; Gupta, H.V. Precipitation estimation from remotely sensed information using artificial neural networks. J. Appl. Meteorol. Clim. 1997, 36, 1176–1190. [Google Scholar] [CrossRef]
- Hsu, K.; Gupta, H.V.; Gao, X.; Sorooshian, S. Estimation of physical variables from multichannel remotely sensed imagery using a neural network: Application to rainfall estimation. Water Resour. Res. 1999, 35, 1605–1618. [Google Scholar] [CrossRef]
- Nguyen, P.; Ombadi, M.; Sorooshian, S.; Hsu, K.; AghaKouchak, A.; Braithwaite, D.; Ashouri, H.; Thorstensen, A.S. The PERSIANN family of global satellite precipitation data: A review and evaluation of products. Hydrol. Earth Syst. Sci. 2018, 22, 5801–5816. [Google Scholar] [CrossRef] [Green Version]
- Sorooshian, S.; Hsu, K.; Gao, X.; Gupta, H.V.; Imam, B.; Braithwaite, D. Evaluation of PERSIANN system satellite-based estimates of tropical rainfall. Bull. Am. Meteorol. Soc. 2000, 81, 2035–2046. [Google Scholar] [CrossRef]
- Mugnai, A.; Casella, D.; Cattani, E.; Dietrich, S.; Laviola, S.; Levizzani, V.; Panegrossi, G.; Petracca, M.; Sanò, P.; Di Paola, F.; et al. Precipitation products from the hydrology SAF. Nat. Hazards Earth Syst. Sci. 2013, 13, 1959–1981. [Google Scholar] [CrossRef] [Green Version]
- Puca, S.; Porcu, F.; Rinollo, A.; Vulpiani, G.; Baguis, P.; Balabanova, S.; Campione, E.; Ertürk, A.; Gabellani, S.; Iwanski, R.; et al. The validation service of the hydrological SAF geostationary and polar satellite precipitation products. Nat. Hazards Earth Syst. Sci. 2014, 14, 871–889. [Google Scholar] [CrossRef]
- Brocca, L.; Moramarco, F.; Melone, F.; Wagner, W. A new method for rainfall estimation through soil moisture observations. Geophys. Res. Lett. 2013, 40, 853–858. [Google Scholar] [CrossRef]
- Brocca, L.; Ciabatta, L.; Massari, C.; Moramarco, T.; Hahn, S.; Hasenauer, S.; Kidd, R.; Dorigo, W.; Wagner, W.; Levizzani, V. Soil as a natural rain gauge: Estimating global rainfall from satellite soil moisture data. J. Geophys. Res. Atmos. 2014, 119, 5128–5141. [Google Scholar] [CrossRef]
- Marcos, C.; Sancho, J.M.; Tapiador, F.J. NWC SAF convective precipitation product from MSG: A new day-time method based on cloud top physical properties. Thethys J. Mediterr. Meteorol. Climatol. 2015, 12, 3–11. [Google Scholar] [CrossRef]
- Pelajić, I. Validation of NWCSAF Precipitation Products. Visiting Scientist Activity report. 2016. Available online: nwc-saf.eumetsat.int (accessed on 14 January 2023).
- Marcos, C.; Calbet, X.; Ripodas, P. Scientifc and validation report for the precipitation product processors of the NWC/GEO v2016. Technical Note. AEMET. 2016. Available online: nwc-saf.eumetsat.int (accessed on 14 January 2023).
- Tapiador, F.J.; Marcos, C.; Sancho, J.M. The convective rainfall rate from cloud physical properties algorithm for meteosat secondgeneration satellites: Microphysical basis and intercomparisons using an object-based method. Remote Sens. 2019, 11, 527. [Google Scholar] [CrossRef] [Green Version]
- Hill, P.G.; Stein, T.H.M.; Roberts, J.A.; Fletcher, J.K.; Marsham, J.H.; Groves, J. How skilful are Nowcasting Satellite Applications Facility products for tropical Africa? Meteorol. Appl. 2020, 27, e1966. [Google Scholar] [CrossRef]
- Karagiannidis, A.; Lagouvardos, K.; Kotroni, V.; Giannaros, T.M. Assessment of the v2016 NWCSAF CRR and CRR Ph precipitation estimation performance over the Greek area using rain gauge data as ground truth. Meteorol. Atmospheric Phys. 2021, 133, 879–890. [Google Scholar] [CrossRef]
- Diamandi, A.; Mihai, A.M.A.; Chivu, A.; Popescu, M. Comparison of the NWC SAF CRR and CRR-Ph products over Romania with rain gauge data. In Proceedings of the EUMETSAT Meteorological Satellite Conference 2022, Brussels, Belgium, 19–23 September 2022. [Google Scholar]
- Kerdraon, G.; Fontaine, E.; Ripodas, P. Algorithm Theoretical Basis Document for the Cloud Product Processors of the NWC/GEO. 2021. Available online: nwc-saf.eumetsat.int (accessed on 14 January 2023).
- Kerdraon, G.; Fontaine, E.; Ripodas, P. User Manual for the Cloud Product Processors of the NWC/GEO: Science Part. 2022. Available online: nwc-saf.eumetsat.int (accessed on 14 January 2023).
- Kerdraon, G.; Péré, S.; Fontaine, E.; Ripodas, P. Scientific and Validation report for the Cloud Product Processors of the NWC/GEO. 2022. Available online: nwc-saf.eumetsat.int (accessed on 14 January 2023).
- SRTM 90m DEM Digital Elevation Database. Available online: https://srtm.csi.cgiar.org/ (accessed on 14 January 2023).
- GDAL Documentation. Programs. Gdaldem. Available online: https://gdal.org/programs/gdaldem.html (accessed on 14 January 2023).
- Lagouvardos, K.; Kotroni, V.; Bezes, A.; Koletsis, I.; Kopania, T.; Lykoudis, S.; Mazarakis, N.; Papagiannaki, K.; Vougioukas, S. The automatic weather stations NOANN network of the National Observatory of Athens: Operation and database. Geosci. Data J. 2017, 4, 4–16. [Google Scholar] [CrossRef]
- Forecast Verification methods Across Time and Space Scales. Available online: https://www.cawcr.gov.au/projects/verification/ (accessed on 14 January 2023).
Figure 1.
The locations of the 315 RGs.
Figure 1.
The locations of the 315 RGs.
Figure 2.
13:00–14:00 UTC precipitation accumulations (in mm) for 12 January 2019, derived from (a) RG observations, (b) CRRPh v2021 estimations, (c) CRR-Ph v2018 estimations, and (d) CRR v2021 estimations.
Figure 2.
13:00–14:00 UTC precipitation accumulations (in mm) for 12 January 2019, derived from (a) RG observations, (b) CRRPh v2021 estimations, (c) CRR-Ph v2018 estimations, and (d) CRR v2021 estimations.
Figure 3.
04:00–05:00 UTC precipitation accumulations (in mm) for 4 October 2019, derived from (a) RG observations, (b) CRRPh v2021 estimations, (c) CRR-Ph v2018 estimations, and (d) CRR v2021 estimations.
Figure 3.
04:00–05:00 UTC precipitation accumulations (in mm) for 4 October 2019, derived from (a) RG observations, (b) CRRPh v2021 estimations, (c) CRR-Ph v2018 estimations, and (d) CRR v2021 estimations.
Table 1.
Contingency table.
Table 1.
Contingency table.
| | | | RG Observation | |
|---|
| | | Yes | No | Total |
|---|
| | yes | Hits | False alarms | Satellite estimation yes |
| Satellite observation | no | Misses | Correct negatives | Satellite estimation no |
| | Total | RG observation yes | RG observation no | Total |
Table 2.
Twenty-four-hour categorical statistics for CRRPh v2021, CRR-Ph v2018, and CRR v2021.
Table 2.
Twenty-four-hour categorical statistics for CRRPh v2021, CRR-Ph v2018, and CRR v2021.
| | | Year | Winter | Spring | Summer | Autumn |
|---|
| | POD (%) | 61.0 | 56.3 | 65.8 | 66.4 | 65.6 |
| CRRPh v2021 | FAR (%) | 50.3 | 43.4 | 57.4 | 60.0 | 50.8 |
| | BIAS | 1.2 | 1.0 | 1.5 | 1.7 | 1.3 |
| | Accuracy (%) | 83.2 | 80.6 | 85.7 | 86.3 | 82.9 |
| | POD (%) | 38.3 | 32.8 | 46.1 | 53.5 | 39.2 |
| CRR-Ph v2018 | FAR (%) | 44.9 | 40.3 | 53.1 | 53.5 | 36.9 |
| | BIAS | 0.7 | 0.6 | 1.0 | 1.1 | 0.6 |
| | Accuracy (%) | 84.5 | 80.1 | 87.6 | 88.9 | 86.0 |
| | POD (%) | 30.0 | 23.9 | 34.3 | 37.5 | 37.7 |
| CRR v2021 | FAR (%) | 49.8 | 43.1 | 60.2 | 56.7 | 43.1 |
| | BIAS | 0.6 | 0.4 | 0.9 | 0.9 | 0.7 |
| | Accuracy (%) | 85.6 | 80.7 | 87.8 | 92.4 | 86.8 |
Table 3.
Daytime categorical statistics for CRRPh v2021, CRR-Ph v2018, and CRR v2021.
Table 3.
Daytime categorical statistics for CRRPh v2021, CRR-Ph v2018, and CRR v2021.
| | | Year | Winter | Spring | Summer | Autumn |
|---|
| | POD (%) | 67.1 | 59.9 | 70.6 | 75.5 | 73.1 |
| CRRPh v2021 | FAR (%) | 48.2 | 35.5 | 55.8 | 59.9 | 46.1 |
| | BIAS | 1.3 | 0.9 | 1.6 | 1.9 | 1.4 |
| | Accuracy (%) | 87.2 | 85.6 | 87.7 | 87.8 | 88.2 |
| | POD (%) | 61.8 | 56.8 | 62.8 | 70.1 | 67.2 |
| CRR-Ph v2018 | FAR (%) | 37.9 | 28.6 | 45.2 | 50.8 | 33.1 |
| | BIAS | 1.0 | 0.8 | 1.1 | 1.4 | 1.0 |
| | Accuracy (%) | 89.8 | 87.0 | 90.8 | 90.9 | 91.2 |
| | POD (%) | 31.1 | 22.4 | 34.7 | 38.1 | 45.0 |
| CRR v2021 | FAR (%) | 47.5 | 35.8 | 55.7 | 59.2 | 42.7 |
| | BIAS | 0.6 | 0.3 | 0.8 | 0.9 | 0.8 |
| | Accuracy (%) | 90.5 | 86.2 | 91.4 | 94.6 | 92.3 |
Table 4.
Nighttime categorical statistics for CRRPh v2021, CRR-Ph v2018, and CRR v2021.
Table 4.
Nighttime categorical statistics for CRRPh v2021, CRR-Ph v2018, and CRR v2021.
| | | Year | Winter | Spring | Summer | Autumn |
|---|
| | POD (%) | 58.8 | 55.3 | 63.0 | 59.0 | 63.2 |
| CRRPh v2021 | FAR (%) | 51.1 | 45.5 | 58.3 | 60.1 | 52.3 |
| | BIAS | 1.2 | 1.0 | 1.5 | 1.5 | 1.3 |
| | Accuracy (%) | 81.2 | 78.9 | 84.2 | 84.8 | 80.5 |
| | POD (%) | 29.3 | 25.7 | 36.4 | 40.0 | 29.9 |
| CRR-Ph v2018 | FAR (%) | 49.4 | 46.1 | 59.0 | 56.8 | 39.5 |
| | BIAS | 0.6 | 0.5 | 0.9 | 0.9 | 0.5 |
| | Accuracy (%) | 81.8 | 77.7 | 85.4 | 86.8 | 83.5 |
| | POD (%) | 29.4 | 24.6 | 34.2 | 36.9 | 34.6 |
| CRR v2021 | FAR (%) | 51.0 | 45.9 | 63.2 | 53.7 | 43.4 |
| | BIAS | 0.6 | 0.5 | 0.9 | 0.8 | 0.6 |
| | Accuracy (%) | 80.1 | 76.5 | 83.1 | 85.3 | 81.5 |
Table 5.
Twenty-four-hour error statistics for CRRPh v2021, CRR-Ph v2018, and CRR v2021.
Table 5.
Twenty-four-hour error statistics for CRRPh v2021, CRR-Ph v2018, and CRR v2021.
| | | Year | Winter | Spring | Summer | Autumn |
|---|
| | NMAE (unitless) | 1.2 | 1.0 | 1.2 | 1.0 | 1.4 |
| CRRPh v2021 | ME (mm) | 0.3 | 0.0 | 0.4 | −0.2 | 1.1 |
| | MAE (mm) | 2.0 | 1.7 | 1.7 | 2.4 | 3.1 |
| | RMSE (mm) | 3.7 | 2.7 | 2.9 | 4.3 | 5.7 |
| | NMAE (unitless) | 1.0 | 1.0 | 1.1 | 1.0 | 1.1 |
| CRR-Ph v2018 | ME (mm) | −0.6 | −0.8 | −0.3 | −0.6 | −0.6 |
| | MAE (mm) | 1.8 | 1.6 | 1.5 | 2.4 | 2.5 |
| | RMSE (mm) | 3.5 | 2.9 | 2.9 | 4.6 | 4.7 |
| | NMAE (unitless) | 0.9 | 0.9 | 0.9 | 1.0 | 1.0 |
| CRR v2021 | ME (mm) | −1.1 | −1.2 | −0.8 | −1.2 | −0.9 |
| | MAE (mm) | 1.6 | 1.4 | 1.3 | 2.1 | 2.2 |
| | RMSE (mm) | 3.0 | 2.5 | 2.4 | 4.1 | 4.2 |
Table 6.
Daytime error statistics for CRRPh v2021, CRR-Ph v2018, and CRR v2021.
Table 6.
Daytime error statistics for CRRPh v2021, CRR-Ph v2018, and CRR v2021.
| | | Year | Winter | Spring | Summer | Autumn |
|---|
| | NMAE (unitless) | 1.0 | 0.8 | 1.1 | 1.1 | 1.1 |
| CRRPh v2021 | ME (mm) | 0.1 | −0.2 | 0.3 | 0.1 | 0.7 |
| | MAE (mm) | 1.7 | 1.4 | 1.5 | 2.6 | 2.5 |
| | RMSE (mm) | 3.1 | 2.3 | 2.5 | 4.5 | 4.2 |
| | NMAE (unitless) | 1.1 | 1.2 | 1.1 | 1.0 | 1.0 |
| CRR-Ph v2018 | ME (mm) | 0.3 | 0.4 | 0.2 | −0.1 | 0.2 |
| | MAE (mm) | 1.9 | 1.9 | 1.6 | 2.5 | 2.2 |
| | RMSE (mm) | 3.5 | 3.4 | 2.9 | 4.6 | 4.0 |
| | NMAE (unitless) | 0.9 | 0.9 | 0.9 | 1.0 | 1.0 |
| CRR v2021 | ME (mm) | −0.9 | −1.1 | −0.7 | −1.2 | −0.5 |
| | MAE (mm) | 1.5 | 1.2 | 1.2 | 2.2 | 2.2 |
| | RMSE (mm) | 2.9 | 2.2 | 2.3 | 4.3 | 4.2 |
Table 7.
Nighttime error statistics for CRRPh v2021, CRR-Ph v2018, and CRR v2021.
Table 7.
Nighttime error statistics for CRRPh v2021, CRR-Ph v2018, and CRR v2021.
| | | Year | Winter | Spring | Summer | Autumn |
|---|
| | NMAE (unitless) | 1.2 | 1.1 | 1.3 | 1.0 | 1.4 |
| CRRPh v2021 | ME (mm) | 0.4 | 0.0 | 0.5 | −0.5 | 1.3 |
| | MAE (mm) | 2.2 | 1.8 | 1.9 | 2.2 | 3.4 |
| | RMSE (mm) | 3.9 | 2.8 | 3.1 | 4.2 | 6.1 |
| | NMAE (unitless) | 1.0 | 0.9 | 1.0 | 1.0 | 1.1 |
| CRR-Ph v2018 | ME (mm) | −1.0 | −1.2 | −0.6 | −0.9 | −0.8 |
| | MAE (mm) | 1.8 | 1.5 | 1.5 | 2.3 | 2.5 |
| | RMSE (mm) | 3.4 | 2.7 | 2.8 | 4.6 | 4.9 |
| | NMAE (unitless) | 0.9 | 0.9 | 1.0 | 0.9 | 1.0 |
| CRR v2021 | ME (mm) | −1.1 | −1.3 | −0.8 | −1.2 | −1.1 |
| | MAE (mm) | 1.7 | 1.5 | 1.4 | 2.1 | 2.3 |
| | RMSE (mm) | 3.1 | 2.6 | 2.4 | 3.9 | 4.2 |
Table 8.
Categorical and error statistics for CRRPh v2021 for different bins of elevation, slope, and aspect. Twenty-four-hour, yearly datasets are used.
Table 8.
Categorical and error statistics for CRRPh v2021 for different bins of elevation, slope, and aspect. Twenty-four-hour, yearly datasets are used.
| Elevation (m) | [0–100) | [100–200) | [200–400) | [400–800) | [800+) |
|---|
| POD (%) | 64.5 | 61.5 | 57.3 | 58.6 | 57.0 |
| FAR (%) | 51.8 | 51.7 | 49.8 | 48.9 | 45.9 |
| BIAS (unitless) | 1.3 | 1.3 | 1.1 | 1.1 | 1.1 |
| NMAE (unitless) | 1.2 | 1.2 | 1.1 | 1.1 | 1.1 |
| ME (mm) | 2.1 | 2.0 | 2.0 | 2.0 | 2.0 |
| MAE (mm) | 0.6 | 0.5 | 0.2 | 0.0 | 0.1 |
| Slope (degrees) | [0–1) | [1–2) | [2–4) | [4–8) | [8+) |
| POD (%) | 63.1 | 63.3 | 64.2 | 60.2 | 56.9 |
| FAR (%) | 52.9 | 51.4 | 52.0 | 50.2 | 46.0 |
| BIAS (unitless) | 1.3 | 1.3 | 1.3 | 1.2 | 1.1 |
| NMAE (unitless) | 1.3 | 1.2 | 1.2 | 1.1 | 1.1 |
| ME (mm) | 2.0 | 2.0 | 2.1 | 2.0 | 2.1 |
| MAE (mm) | 0.6 | 0.5 | 0.6 | 0.3 | −0.1 |
| Aspect (degrees) | [0–90) | [90–180) | [180–270) | [270–360) | |
| POD (%) | 60.6 | 59.9 | 61.3 | 62.4 | |
| FAR (%) | 49.1 | 50.9 | 50.3 | 50.8 | |
| BIAS (unitless) | 1.2 | 1.2 | 1.2 | 1.3 | |
| NMAE (unitless) | 1.1 | 1.1 | 1.2 | 1.2 | |
| ME (mm) | 2.1 | 2.0 | 2.0 | 2.1 | |
| MAE (mm) | 0.2 | 0.3 | 0.4 | 0.4 | |
| Disclaimer/Publisher’s Note: The statements, opinions and data contained in all publications are solely those of the individual author(s) and contributor(s) and not of MDPI and/or the editor(s). MDPI and/or the editor(s) disclaim responsibility for any injury to people or property resulting from any ideas, methods, instructions or products referred to in the content. |
© 2023 by the authors. Licensee MDPI, Basel, Switzerland. This article is an open access article distributed under the terms and conditions of the Creative Commons Attribution (CC BY) license (https://creativecommons.org/licenses/by/4.0/).


 ,
, 


