Article

Appraisal of Satellite Rainfall Products for Malwathu, Deduru, and Kalu River Basins, Sri Lanka

1
Department of Civil Engineering, New Mexico State University, 1780 E University Ave, Las Cruces, NM 88003, USA
2
Department of Civil Engineering, Faculty of Engineering, Sri Lanka Institute of Information Technology, Malabe 10115, Sri Lanka
3
Water Engineering and Management, School of Engineering and Technology, Asian Institute of Technology, Pathum Thani 12120, Thailand
4
Hydrology and Aquatic Environment, Division of Environmental and Natural Resources, Norwegian Institute of Bioeconomy and Research, 1431 Ås, Norway
5
Water, Energy and Environmental Engineering Research Unit, Faculty of Technology, University of Oulu, 90014 Oulu, Finland
6
Institute for Sustainable Industries & Liveable Cities, Victoria University, P.O. Box 14428, Melbourne, VIC 8001, Australia
7
College of Engineering and Science, Victoria University, P.O. Box 14428, Melbourne, VIC 8001, Australia
*
Author to whom correspondence should be addressed.
Climate 2022, 10(10), 156; https://doi.org/10.3390/cli10100156
Submission received: 8 September 2022 / Revised: 10 October 2022 / Accepted: 18 October 2022 / Published: 20 October 2022
(This article belongs to the Special Issue Subseasonal to Seasonal Climate Forecasting)

Abstract

:
Satellite Rainfall Products (SRPs) are now in widespread use around the world as a better alternative for scarce observed rain gauge data. Upon proper analysis of the SRPs and observed rainfall data, SRP data can be used in many hydrological applications. This evaluation is very much necessary since, it had been found that their performances vary with different areas of interest. This research looks at the three prominent river basins; Malwathu, Deduru, and Kalu of Sri Lanka and evaluates six selected SRPs, namely, IMERG, TRMM 3B42, TRMM 3B42-RT, PERSIANN, PERSIANN-CCS, PERSIANN-CDR against 15+ years of observed rainfall data with the use of several indices. Four Continuous Evaluation Indices (CEI) such as Root Mean Square Error (RMSE), Percentage Bias (PBIAS), Pearson’s Correlation Coefficient (r), and Nash Sutcliffe Efficiency (NSE) were used to evaluate the accuracy of SRPs and four Categorical Indices (CI) namely, Probability of Detection (POD), Critical Success Index (CSI), False Alarm Ratio (FAR) and Proportion Correct (PC) was used to evaluate the detection and prediction accuracy of the SRPs. Then, the Mann–Kendall Test (MK test) was used to identify trends in the datasets and Theil’s and Sens Slope Estimator to quantify the trends observed. The study of categorical indicators yielded varying findings, with TRMM-3B42 performing well in the dry zone and IMERG doing well in the wet zone and intermediate zone of Sri Lanka. Regarding the CIs in the three basins, overall, IMERG was the most reliable. In general, all three basins had similar POD and PC findings. The SRPs, however, underperformed in the dry zone in terms of CSI and FAR. Similar findings were found in the CEI analysis, as IMERG gave top performance across the board for all four CEIs in the three basins. The three basins’ overall weakest performer was PERSIANN-CCS. The trend analysis revealed that there were very few significant trends in the observed data. Even when significant trends were apparent, the SRP projections seldom captured them. TRMM-3B42 RT had the best trend prediction performance. However, Sen’s slope analysis revealed that while the sense of the trend was properly anticipated, the amplitude of the prediction significantly differed from that of the observed data.

1. Introduction

Water assets in heterogeneous terrains, especially for the mountainous river basins, provides decision-makers and hydrologists with a critical and demanding situation due to the shortage of intensive in-situ rainfall tracking stations [1]. Traditional rain gauge stations provide the most accurate rainfall data on a point basis. In addition, rainfall is one of the most important hydrologic parameters for many studies related to water resources and climate analysis. However, due to the high spatial variability of rainfall, it is difficult to capture the spatial and temporal variation of rainfall systems based on randomly distributed rain gauges, which do not meet the requirements of aquifer models and other related research [2]. Therefore, now the focus is directed mainly toward Satellite Rainfall Products (SRPs) as an alternative to address all the shortcomings of ground rain gauge stations. Several SRPs are available, but not all the available types of SRPs can be used for one area of interest. This is mainly because the methods by which they are processed and extracted are different from each other [3].
Several SRPs, such as the Integrated Multi-satellite Retrievals for GPM (IMERG), the Tropical Rainfall Measuring Mission (TRMM), and the Precipitation Estimation from Remotely Sensed Information using Artificial Neural Networks (PERSIANN) group, are widely used he past studies as an alternative to the ground measured rainfall [4,5,6]. The GPM_IMERG product by the National Aeronautics and Space Association (NASA) was produced by using algorithms that intercalibrate, merge and interpolate the data from satellite microwave estimates, microwave-calibrated infrared satellite estimates, precipitation gauge analysis, and several other precipitation estimators. Thus, the product is considered a strong and better product then extracting rainfall data by some researchers [7,8]. However, the TRMM 3B42 version 7 product was generated by a combined mission between NASA and Japan Aerospace Exploration Agency (JAXA), but the production was based on estimates obtained from TRMM Microwave Imager (TMI), and Precipitation Radar (PR) sources through the TRMM Satellite [9,10]. In addition, the PERSIANN group of SRPs was produced using the Artificial Neural Network (ANN) [11]. Likewise, different SRPs were produced in different methods, and thereby it is very important to assess their applicability to different catchment areas before using them in practical situations.
As stated in the preceding paragraphs, research is being carried out for different areas of interest around the world to check the applicability of the selected SRPs. It has been proved by many researchers that the performance of SRPs varies with factors such as elevation, rainfall intensity, topography, etc. [12,13,14,15]. However, most of the river basins in Sri Lanka are not tested for these SRPs (except for a couple of river basins, such as the Mahaweli and Kelani River basins [16,17]).
Evaluation of SRPs for the Mahaweli River basin, which is the longest river in Sri Lanka, had already been carried out by Perera et al. [16]. A similar study was carried out due to the importance of the Kelani River basin, as a frequently flooding river basin [17]. Nevertheless, Sri Lanka geographically has a radial pattern of river basins covering most of its land and therefore, the river basins are the heart of the country [18]. Sri Lanka has a dense rain gauge network (more than 500 rain gauges for a total of 65,610 km2 area); however, some areas are not comprehensively covered and represent the spatial distribution of rainfall. In addition, some of the rain gauges were not functioned well in the past due to the war environment in northern and eastern Sri Lanka. In addition, some of the rain gauges were not maintained well due to various other reasons, such as financial restrictions and a lack of human resources.
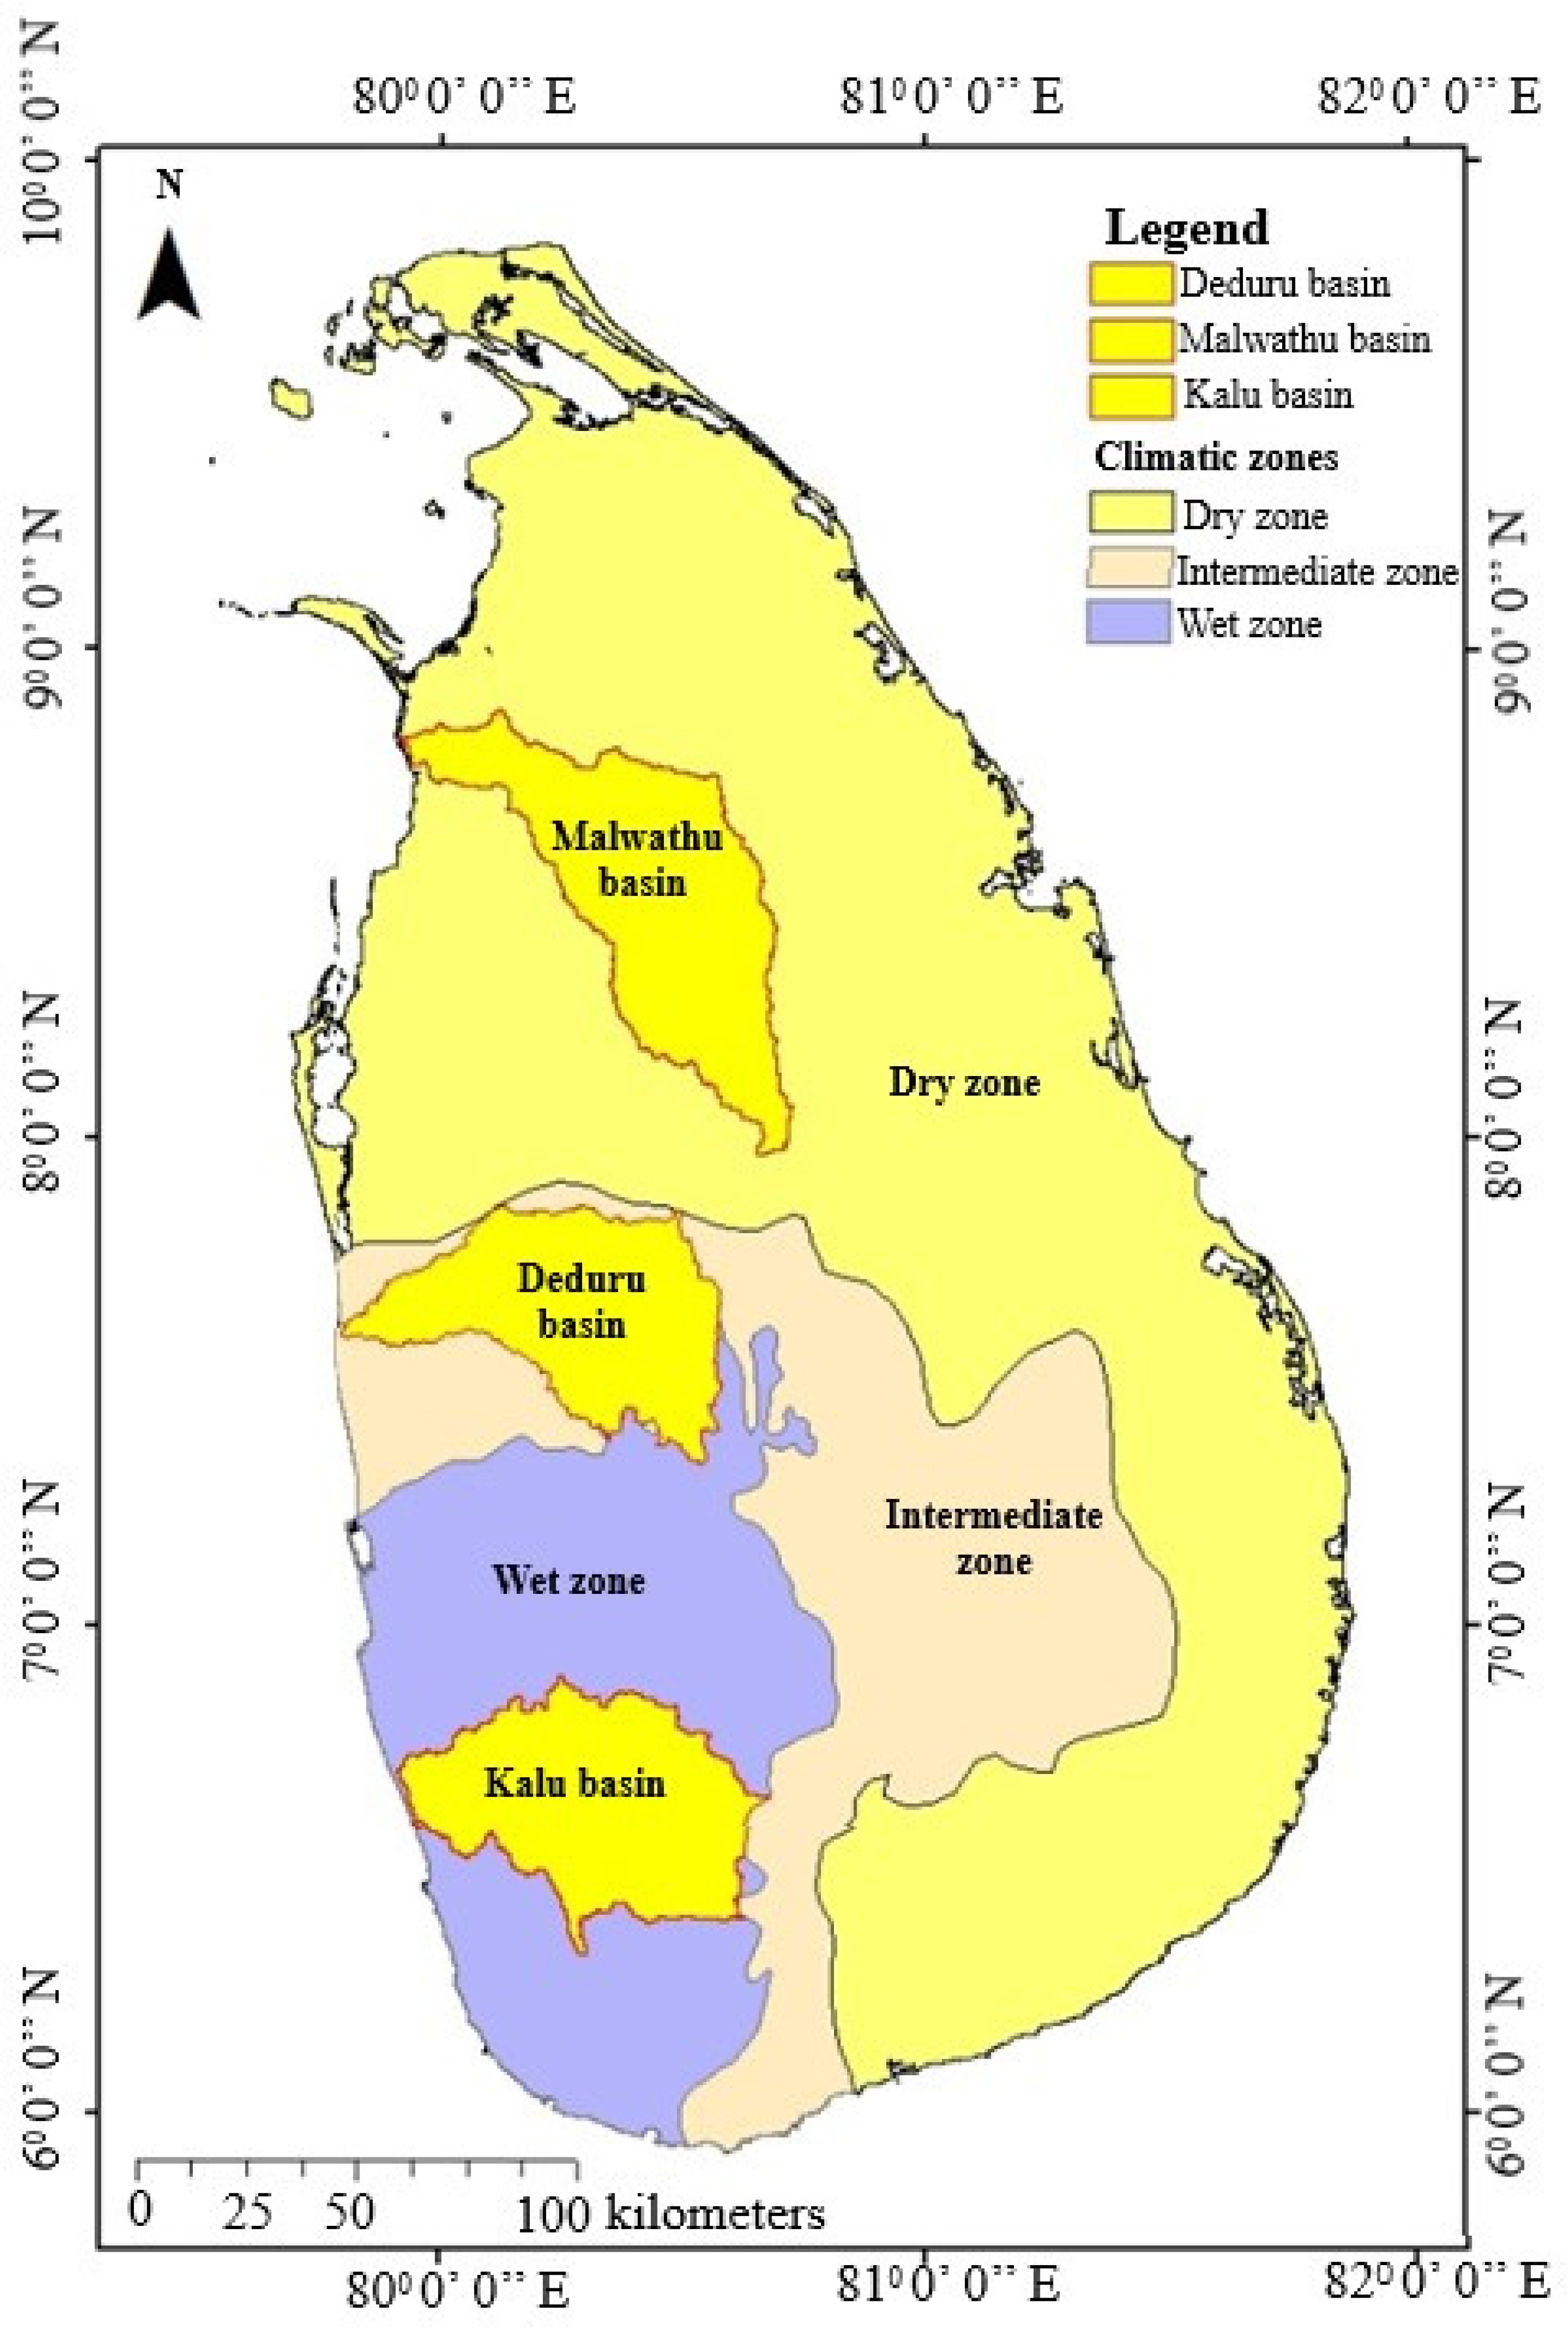
Therefore, this study investigates the applicability of SRPs to three of the important river basins in Sri Lanka named Malwathu, Deduru, and Kalu river basins. Due to their significant contributions to society, these rivers are of utmost importance to the country. Thus, it is crucial to assess the applicability of such SRPs to be used in places of scarce rain gauge coverage in the Malwathu, Deduru, and Kalu catchments.
This research study focuses on evaluating IMERG V6, TRMM 3B42, TRMM 3B42RT, PERSIANN, PERSIANN-CCS, and PERSIANN-CDR precipitation products for the earlier stated river basins. Malwathu river basin is the second largest river basin in Sri Lanka. After originating in the Ritigala Hills and Inamaluwa Hills in the north-central province of Sri Lanka, the Malwathu River drifts through the Mannar region and exits into the Indian Ocean [18]. The Kalu river basin is the third longest river in Sri Lanka. Starting from the Central Hills, it falls into the Indian ocean at Kalutara District, with a major part of the catchment in the highest rainfall area of the country [19]. Deduru river basin is the sixth longest river in Sri Lanka, with major parts of the river basin in Kurunegala and Puttalam districts in the Northwestern Province through which it enters the sea at Chilaw while the other parts lie in the Kandy and Matale districts in the Central Province [20]. This clearly shows the importance these river basins carry for the country in terms of agricultural use, drinking water supply, and many other economic benefits as well. The scarcity of rain gauge stations makes it of utmost importance to find an alternative method to obtain rainfall data for these river basins since rainfall data plays an important role in all of the hydrological applications associated with these basins. This is the first study to evaluate the selected SRPs for three major river basins, which fall into three different zones in the country. The previous studies carried out by Perera et al. [16,17] is not focusing on the dry and inter-mediate zones separately. Therefore, this particular study focuses on all three climatic zones of the country, thus marking the novelty and the great importance this study has to society.

2. Study Area and Data Sets

2.1. River Basins

The Malwathu River spans 164 km, with its basin being Sri Lanka’s second-largest river basin at 3284 km2. The lower river basin of the Malwathu River lies in the Vavuniya and Mannar districts, while the upper river basin lies in the Anuradhapura district. Nuwara Wewa and Tissa Wewa reservoirs of this basin are already used as drinking water sources for public water supply. The upper part of the catchment is in the dry zone receiving less than 1500 mm; however, the bottom part of the catchment is very dry as it is in a semi-arid area receiving an average rainfall of 1000 mm (refer to Figure 1) [19].
Deduru River is the sixth longest river in Sri Lanka covering about 2600 km2 in total, with 3% in the central province and the rest in the northwestern province of the country. It is about 115 km long, and it consists of 9 tributaries. This basin water mostly contributes to the irrigational purposes in the areas of Northwestern Province. The river basin mostly falls into the intermediate zone of the country, as shown in Figure 1 [21]. However, it receives a monthly rainfall of 108 mm to 280 mm from September to December, which is the rainy season for the river basin.
Kalu River is the third longest river in Sri Lanka, starting from the central hills and falling into the Indian Ocean in the Kalutara district covering 2766 km2 with a large part of the catchment in the highest rainfall area of the country. The average annual rainfall of the basin is 4000 mm and leads to 4000 million m3 of annual flow, thus, it falls in the wet zone of the country (refer to Figure 1). Kalu River basin is home to a large population and facilitates the area with many valuable services, such as the provision of water for drinking, agriculture, etc. [20].
The mixed land use pattern for three river basins can be seen in Figure 2 (a—Deduru, b—Kalu, and c—Malwathu). These land use types vary from agricultural to buildup areas. The diversity of land uses showcases the importance of assessing the hydrological behavior of the river basins. Irrigated areas can be clearly seen in all three river basins. Thus, water availability is essential to the success of agriculture. In addition, water resources management is significant in the events of floods as the river basins have many populated (urbanized) areas.

2.2. Rain Gauge Data

Rainfall data from 23 stations with 15+ years of daily rainfall data were used for this study (6 stations to cover Malwathu, 7 stations to cover Deduru, and 10 stations to cover the Kalu river basins). These data were purchased from the Department of Meteorology, Sri Lanka. However, it was well noted that the availability of these data is not uniform. Some stations have daily data since January 1990, but some others have after 1990. This observation again verifies the importance of this research work; the suitability of SRPs in the absence of ground-measured rainfall data. Nevertheless, the available data were tested for homogeneity tests and found to be homogeneous. The spatial distribution of rain gauges in three river basins is given in Figure 3 with their elevation maps. In addition, the details of the rain gauge stations of each river basin are tabulated in Table 1 with the identification number for clarity.
Malwathu River basin has a rain gauge density of 1.8 gauges per 1000 km2, whereas the Deduru River basin has a rain gauge density of 2.7 gauges per 1000 km2. However, the Kalu River basin is denser in rain gauges and has a density of 3.6 gauges per 1000 km2 which is higher than the rain gauge density for most of the research studies that incorporate evaluating SRPs for different areas of interest [16,22,23,24]. However, these densities clearly showcased their non-homogeneous spatial distribution in a particular river basin. Missing data for each basin were less than 10%, and the missing data were filled either by using rainfall data from nearby stations or by obtaining APHRODITE data which contain rainfall data for the whole of Asia [25].

2.3. Satellite Rainfall Products

To evaluate the effectiveness of SRPs with respect to rain gauge data, six SRPs were considered, namely, PERSIANN, Precipitation Estimation from Remotely Sensed Information using Artificial Neural Networks–Cloud Classification System (PERSIANN-CCS), Precipitation Estimation from Remotely Sensed Information using Artificial Neural Networks–Climate Data Record (PERSIANN-CDR) from the Center for Hydrometeorology and Remote Sensing, IMERG Version 6, TRMM Multisatellite Precipitation Analysis (TMPA) 3B42 (Version 7), and TRMM Multisatellite Precipitation Analysis (TMPA) 3B42RT (Version 7) from National Aeronautics and Space Administration, USA, NASA GESDISC data provider. These SRPs were extracted under the daily accumulates as per their availability and matched with the ground-measured rainfall data to have the same period in order to do the evaluation. The details of SRPs are as given in Table 2.
The precipitation products were extracted for each station to the closest grid (center points) depending on the resolution of each SRP. Therefore, it is noted that the SRPs do not clearly present the exact locations of ground-measured rainfall locations. Different methods and techniques were used to extract the precipitation products. The CHRS data portal was used to extract the PERSIANN group of products as CSV files. IMERG and TRMM products were extracted as NetCDF (Network Common Data Form) files from NASA GESDISC portal. R codes in RStudio were used to merge the files in Climate Data Operator (CDO) for IMERG data. A similar approach was followed for TRMM products; however, they were run in the MATLAB environment.
Figure 4 presents the annual cumulative precipitation variation of three rain gauges in the three catchments (Kurunegala for Deduru Oya, Eheliyagoda for Kalu River, and Anuradhapura for Malwathu Oya). The annual precipitations were presented for observed rainfalls and six precipitation products. The precipitation products were used without performing the bias correction. Thus, the real comparison can be made. Even though these annual cumulative rainfalls are not connected from one year to another, dashed lines were drawn to showcase the temporal variation. In addition, the observed (ground-measured) rainfalls were drawn in straight lines for observable comparison; only the years 2000 to 2015 are shown here to make the plots uniform due to availability. It can be clearly seen that some of the precipitation products have underestimated the real rainfall while others have overestimated the observed rainfall. Therefore, there is a clear discrepancy in precipitation products. Therefore, it is necessary to investigate the suitability of these precipitation products to be used in real-world scenarios.
The underestimations and overestimations can be clearly seen in Table 3. It presents the annual means and standard deviations for tested precipitation products against the observed rainfall. Table 3 only presents the three selected stations to explain the importance of analyzing comparative studies among precipitation products thus assessing the suitability of using them in many hydrological applications in the absence of ground-measured rainfall data.

3. Methodology

3.1. Evaluation Indices

The four continuous evaluation indices; Pearson’s correlation coefficient (r), Root Mean Square Error (RMSE), Percentage Bias (PBIAS), and Nash Sutcliffe Efficiency (NSE), as described in Table 4 were used to evaluate the accuracy of SRPs against the gauge rainfall data [16,26].
Furthermore, four categorical indices; False Alarm Ratio (FAR), Critical Success Index (CSI), Probability of Detection (POD), and Proportion Correct (PC), as described in Table 5 was used with a threshold of 1 mm/day to evaluate the detection and prediction accuracy of SRPs when compared with gauge rainfall data [16,27,28]. The contingency table used for the analysis using these indices was obtained from Perera et al. [16].

3.2. Non-Parametric Tests for Rainfall Trends

Mann–Kendall trend test (MK test) [29], along with Thiel’s and Sen’s Slope Estimator were used to identify trends and magnitude of the trends between the rain gauge and SRP rainfall data. MK Test compares the data between the two datasets and identifies any trends that may be present within them. It uses two hypotheses (H0 for no trend and H1 when a trend is present). Initially, the Mann–Kendall Statistic (S) finds out whether the trend is increasing or decreasing or whether there is no significant trend. Then to find the probability of obtaining a significant trend, a normalized test statistic, Z, was computed which incorporates the computed S value as given in Equation (1) below [30]. A 95% significance level was used to determine whether the trend observed is increasing, decreasing, or no trend [16].
Z c = S 1 Var S , S > 0 0 , S = 0 S + 1 Var S , S < 0   where ,   Var S = n n 1 2 n + 5 i = 1 t t i i i 1 2 i + 5 18
Theil’s and Sens Slope Estimator [31] were used to obtain a magnitude for the observed trends. The test sets the data in ascending order and then calculates the slope for each time series data pair. Finally, the median value, Qi was calculated using Equation (2) below.
Q i = Q n + 1 2 , i f   N   i s   o d d 1 2 Q n 2 + Q n + 2 2 , i f   N   i s   e v e n

3.3. Overall Methodology

The Kalu Ganga, Deduru Oya and, Malwathu Oya basins fall under the three wet, intermediate climatic zones. The wet zone, intermediate zone, and dry zone have annual mean rainfall ranges >2500 mm/year, 2500–1500 mm/year, and <1500 mm/year, respectively. The performance of the six SRPs considered herein was evaluated using four categorical indices (CI) and four continuous evaluation indices (CEI) for SRPs and ground-measured daily rainfall data. The CIs evaluated the detection accuracy of the SRPs while the CEIs were used to evaluate the continuous performance of the SRPs with respect to the rain gauge data. Therefore, the comparisons were made for SRPs against the ground measured rainfalls. Finally, a trend analysis was conducted using a combination of the Mann–Kendall Test (MK test) and Sen’s Slope Estimator considering a confidence level of 95% for annual, seasonal, and monthly estimates. The summary of overall analysis is given in Figure 5.

4. Results and Discussion

4.1. Accuracy of SRPs with Respect to Rain Gauge Data

Figure 6 presents the station-wise evaluation indices (r, RMSE, PBias, and NSE) results for the three river basins. The results of the correlation coefficient between observed rain gauge data and the SRPs are mixed with none of the basins having standout results (refer to Figure 6a). However, all the products have shown positive correlations across all rain gauges except Mediya Wewa (which has the lowest correlation coefficients). This suggests that observed rainfall is not a good match to the SRPs of Mediya Wewa. The Malwathu Oya basin has given a basin-wide mean correlation of 0.48, while the Deduru Oya basin and Kalu Ganga basin have showcased basin-wide mean correlation values of 0.38 and 0.43, respectively. The IMERG proves to be the best performer in terms of correlation with means of 0.57, 0.42, and 0.50. In addition, the strongest correlation (0.65) was given by IMERG to Vavuniya, whereas the worst performer in terms of correlation was PERSIANN-CDR with a mean correlation of just 0.37 across the three basins. Researchers have different views on the correlation coefficient from its numerical value. Some researchers believe the coefficient has to be above 0.9 to be a better match; however, some others believe that it can be acceptable even at 0.5–0.6. However, this can be varied based on the considered context [32,33,34,35,36]. Accordingly, in the context of climate analysis, many researchers suggested that a 0.5–0.6 correlation is somewhat acceptable [37,38].
As evident in Figure 6b, the highest RMSE across all three basins of 23.92 was given by PERSIANN-CCS in the Usk Valley rain gauge. The PERSIANN-CCS performs the poorest across the three basins with exceptions at Halwathura, Mediyaya Wewa, and Chilaw. IMERG has proven to be a clear best performer overall with regard to RMSE as well with a mean of 13.0 compared to the overall mean of all SRPs of 15.07. The variation of the RMSE values of the IMERG SRP across the three basins is 6.87 to 22.15. Similar results were reported by Perera, 2022 [16], where IMERG performed the best in terms of RMSE in the Mahaweli basin as well. Overall, the RMSE results of the Kalu Ganga basin (Wet zone) are worse than that of the other two basins with a basin-wide mean across all the SRPs of 18.65 while Deduru Oya and Malwathu Oya gave basin-wide means across all SRPs of 12.37 and 12.24 respectively. Similar results were documented in a study in Pakistan [39] where RMSE tended to be higher in regions with higher average annual rainfall.
Results of PBias present significant bias (refer to Figure 6c) of Malwathu (dry zone) and Deduru (intermediate zone) to the Kalu River basin (wet zone). PBias values are positive throughout the Malwathu River basin with the exception of IMERG and TRMM-3B42 SRPs in the Vavuniya rain gauge. However, they are even, minor biases at −0.22 and −2.42, respectively. The highest positive bias across all rain gauges in the dry zone was found for the PERSIANN-CCS SRP with a maximum of +122.21 at Pawatakulam. Apart from IMERG SRPs in Wariyapola, Ridibendi Ela, Chilaw, Kurunegala, and Mediyaya Wewa, all other SRPs had positive biases in the Deduru River basin, which is in the intermediate zone. The highest positive bias in the intermediate zone of 78.53 was shown by TRMM-3B42 in Chilaw. However, the situation for the wet zone is contrasting. In the Wet zone, apart from the very minor positive biases exhibited by PERSIANN and PERSIANN-CCS in St. Vincent’s Group region, all other SRPs have negative biases with the highest negative bias (−55.71) recorded for TRMM-3B42_RT at Usk Valley. Therefore, based on the PBias, the best performer for the dry zone is the TRMM-3B42, with a mean of 15.0, while the second best performer is IMERG (with a mean of 15.84). However, IMERG showcased the best performance in the intermediate zone and wet zone with basin means of −4.09 and −30.59, respectively.
It is apparent that IMERG is the best performer across the three basins with respect to the NSE with basin means of 0.20, 0.58, and 0.16 for Malwathu Oya, Deduru Oya, and Kalu Ganga basins respectively (refer to Figure 6d). However, PERSIANN-CCS which has recorded sub-zero NSE values in all regions apart from Geekiyan Kanda and Eheliyagoda is the least performer. Overall, the Malwathu Oya (dry zone) and the Kalu Ganga (wet zone) have yielded positive mean all-SRP-NSE values of 0.02 and 0.07 while the Deduru Oya (intermediate zone) has given a negative mean all-SRP-NSE value of −0.08. Additionally, the Malwathu Oya and the Kalu Ganga basin have yielded more consistent NSE results with respective variations of −0.83 to 0.38 and −0.28 to 0.35 respectively while the Deduru Oya has given an NSE variation of−0.99 to 0.70. However, the closest to ideal results were given by the IMERG SRP in the Deduru Oya basin with a mean of 0.58 and a variation of 0.5 to 0.7.

4.2. Detection Accuracy of SRPs

The CI performance of the SRPs was initially investigated separately for three river basins. A threshold of 1 mm/day was considered for rainy days. Therefore, if the rainfall is less than 1 mm/day, that particular day is considered a non-rainy day [40,41]. Figure 7 illustrates the results of the CI analyses.
All SRPs performed somewhat similarly for the categorical indices of the Kalu Ganga Basin (blue-coloured sectors in Figure 6a–d). IMERG SRP has outperformed in terms of CSI and PC with basin-wide means of 0.56 and 0.73, respectively. The best FAR was found in TRMM-3B42 and TRMM-3B42_RT SRPs with a basin-wide mean of 0.27 while PERSIANN-CDR SRP shows a significantly better POD value compared to the other products. However, PERSIANN was outperformed by the others with regard to POD, CSI, and PC giving mean values of 0.63, 0.48, and 0.66 respectively. Therefore, the station-to-station variation of CI performance is similar in all the SRPs.
In the Deduru Oya Basin (green-coloured sectors in Figure 7), the IMERG SRP shows the best performance across all four categorical indices with basin mean values of 0.84, 0.64, 0.27, and 0.86 for POD, CSI, FAR, and PC, respectively. However, in terms of CSI, FAR, and PC, the IMERG SRP has a significant advantage over all the other SRPs. Nevertheless, in terms of POD, the PERSIANN-CDR SRPs have also given good results but with less consistency compared to IMERG. In addition, PERSIANN-CDR falls short in all the other indices performing the poorest in terms of both CSI and FAR. In general, all the SRPs except IMERG show similar station-wise variations. However, a significant drop in the PC for PERSIANN-CCS can be seen in the Ridibendi Ela SRP signifying that the PERSIANN-CCS prediction accuracy of detected rainfall events in the region is low.
Similar overall results can be seen for the Malwathu Oya Basin (red-coloured sectors in Figure 7). There is no clear best performer across all the categorical indices. TRMM-3B42 shows the best performance in terms of CSI, FAR, and PC, with basin-wide means of 0.44, 0.47, and 0.84, respectively. TRMM-3B42_RT has nearly matched the performance of TRMM-3B42 in CSI, FAR, and PC, but they both have fallen short of the other SRPs when it comes to POD with basin-wide means of around 0.75. PERSIANN-CDR and PERSIANN-CCS jointly were the best performers in terms of POD with a mean of 0.82 across the basin. In addition to this, noticeably superior values of CSI and FAR can be seen in all the SRPs at Vavuniya and Anuradhapura compared to the other gauge stations in the basin.
Looking at all three basins as a whole, TRMM-3B42 and TRMM-3B42_RT have showcased nearly identical results across all CIs. The POD performance of the SRPs is best in terms of mean and consistency in the Malwathu Oya (dry zone) with a mean of 0.79 and variation of 0.70 to 0.86 across all SRPs. The best-performing basin in terms of CSI is the Kalu Ganga (wet zone) basin with a mean of 0.53 across the SRPs. The variation of CSI from station to station is consistent across all three basins with the exception being IMERG SRP in the Deduru Oya (intermediate zone) basin which performs significantly better than the other SRPs. Considering the variation of FAR across the basins, all the SRPs have performed considerably better in the Kalu Ganga basin (wet zone) compared to the other two basins with a mean of 0.32 across all six SRPs. The variation of PC is most consistent between stations in the Kalu Ganga basin with a mean of 0.69 and a variation of 0.59 to 0.76 among all six SRPs. However, the mean PC performance is better in the Deduru Oya and Malwathu Oya basins (0.71 and 0.77, respectively).
The summary of best performing SRPs is given in Table 6. Overall, none of the SRPs has been dominant across all the basins. The performance seems to vary significantly with the climatic zone. In a similar study incorporating the same six SRPs conducted in the Mahaweli basin of Sri Lanka, Perera et al. [16] concluded that IMERG performed the best in the dry zone in terms of all four CIs considered in this study. However, that observation is not consistent with the results obtained in this study.

4.3. Trend Analysis

Table 7 presents the results of the trend analysis carried out for observed rainfall and SRPs. The results herein indicate only the significant trends.
Positive significant trends were seen in Nachchaduwa, Vavuniya, Usk Valley, and Geekiyan Kanda regions for annual scale rainfalls. In the dry zone, trends tallying with the observed data were only shown by PERSIANN-CDR, while in the wet zone, tallying trends were shown by TRMM-3B42 and TRMM-3B42_RT.
Interestingly, monthly trends were only seen in the wet zone. Positive trends tallying with the observed data were shown by TRMM-3B42_RT at Depedena in December and at Usk Valley in both February and December. In the seasonal analysis, tallying positive trends were observed at Depedena for the NEM (IMERG and TRMM-3B42_RT) and at Usk Valley for both NEM (TRMM-3B42_RT) and SWM (IMERG and TRMM-3B42_RT). The only negative trend was seen at Murungan for the SWM (PERSIANN-CDR), which is a comparatively dry area. Overall, no tallying trends were seen between the observed data for the intermediate zone and the SRPs.
Therefore, overall, TRMM-3B42_RT seems to be the best performer in terms of predicting trends in the observed data. However, the results are not consistent. Sen’s slope analysis shows that the gradients of SRP trends deviate heavily from that of the observed data even when the direction of the trend matches. IMERG, which performed well in terms of CI and CEI did not perform well in the trend analysis. This is somewhat contrary to the findings of Perera et al. [16] in the Mahaweli basin where IMERG was the best in the annual and monthly trend analyses. However, the inconsistent nature of the SRPs in trend prediction was noted in that study as well. Therefore, basin-wise studies are important compared to zonal studies.

5. Summary and Conclusions

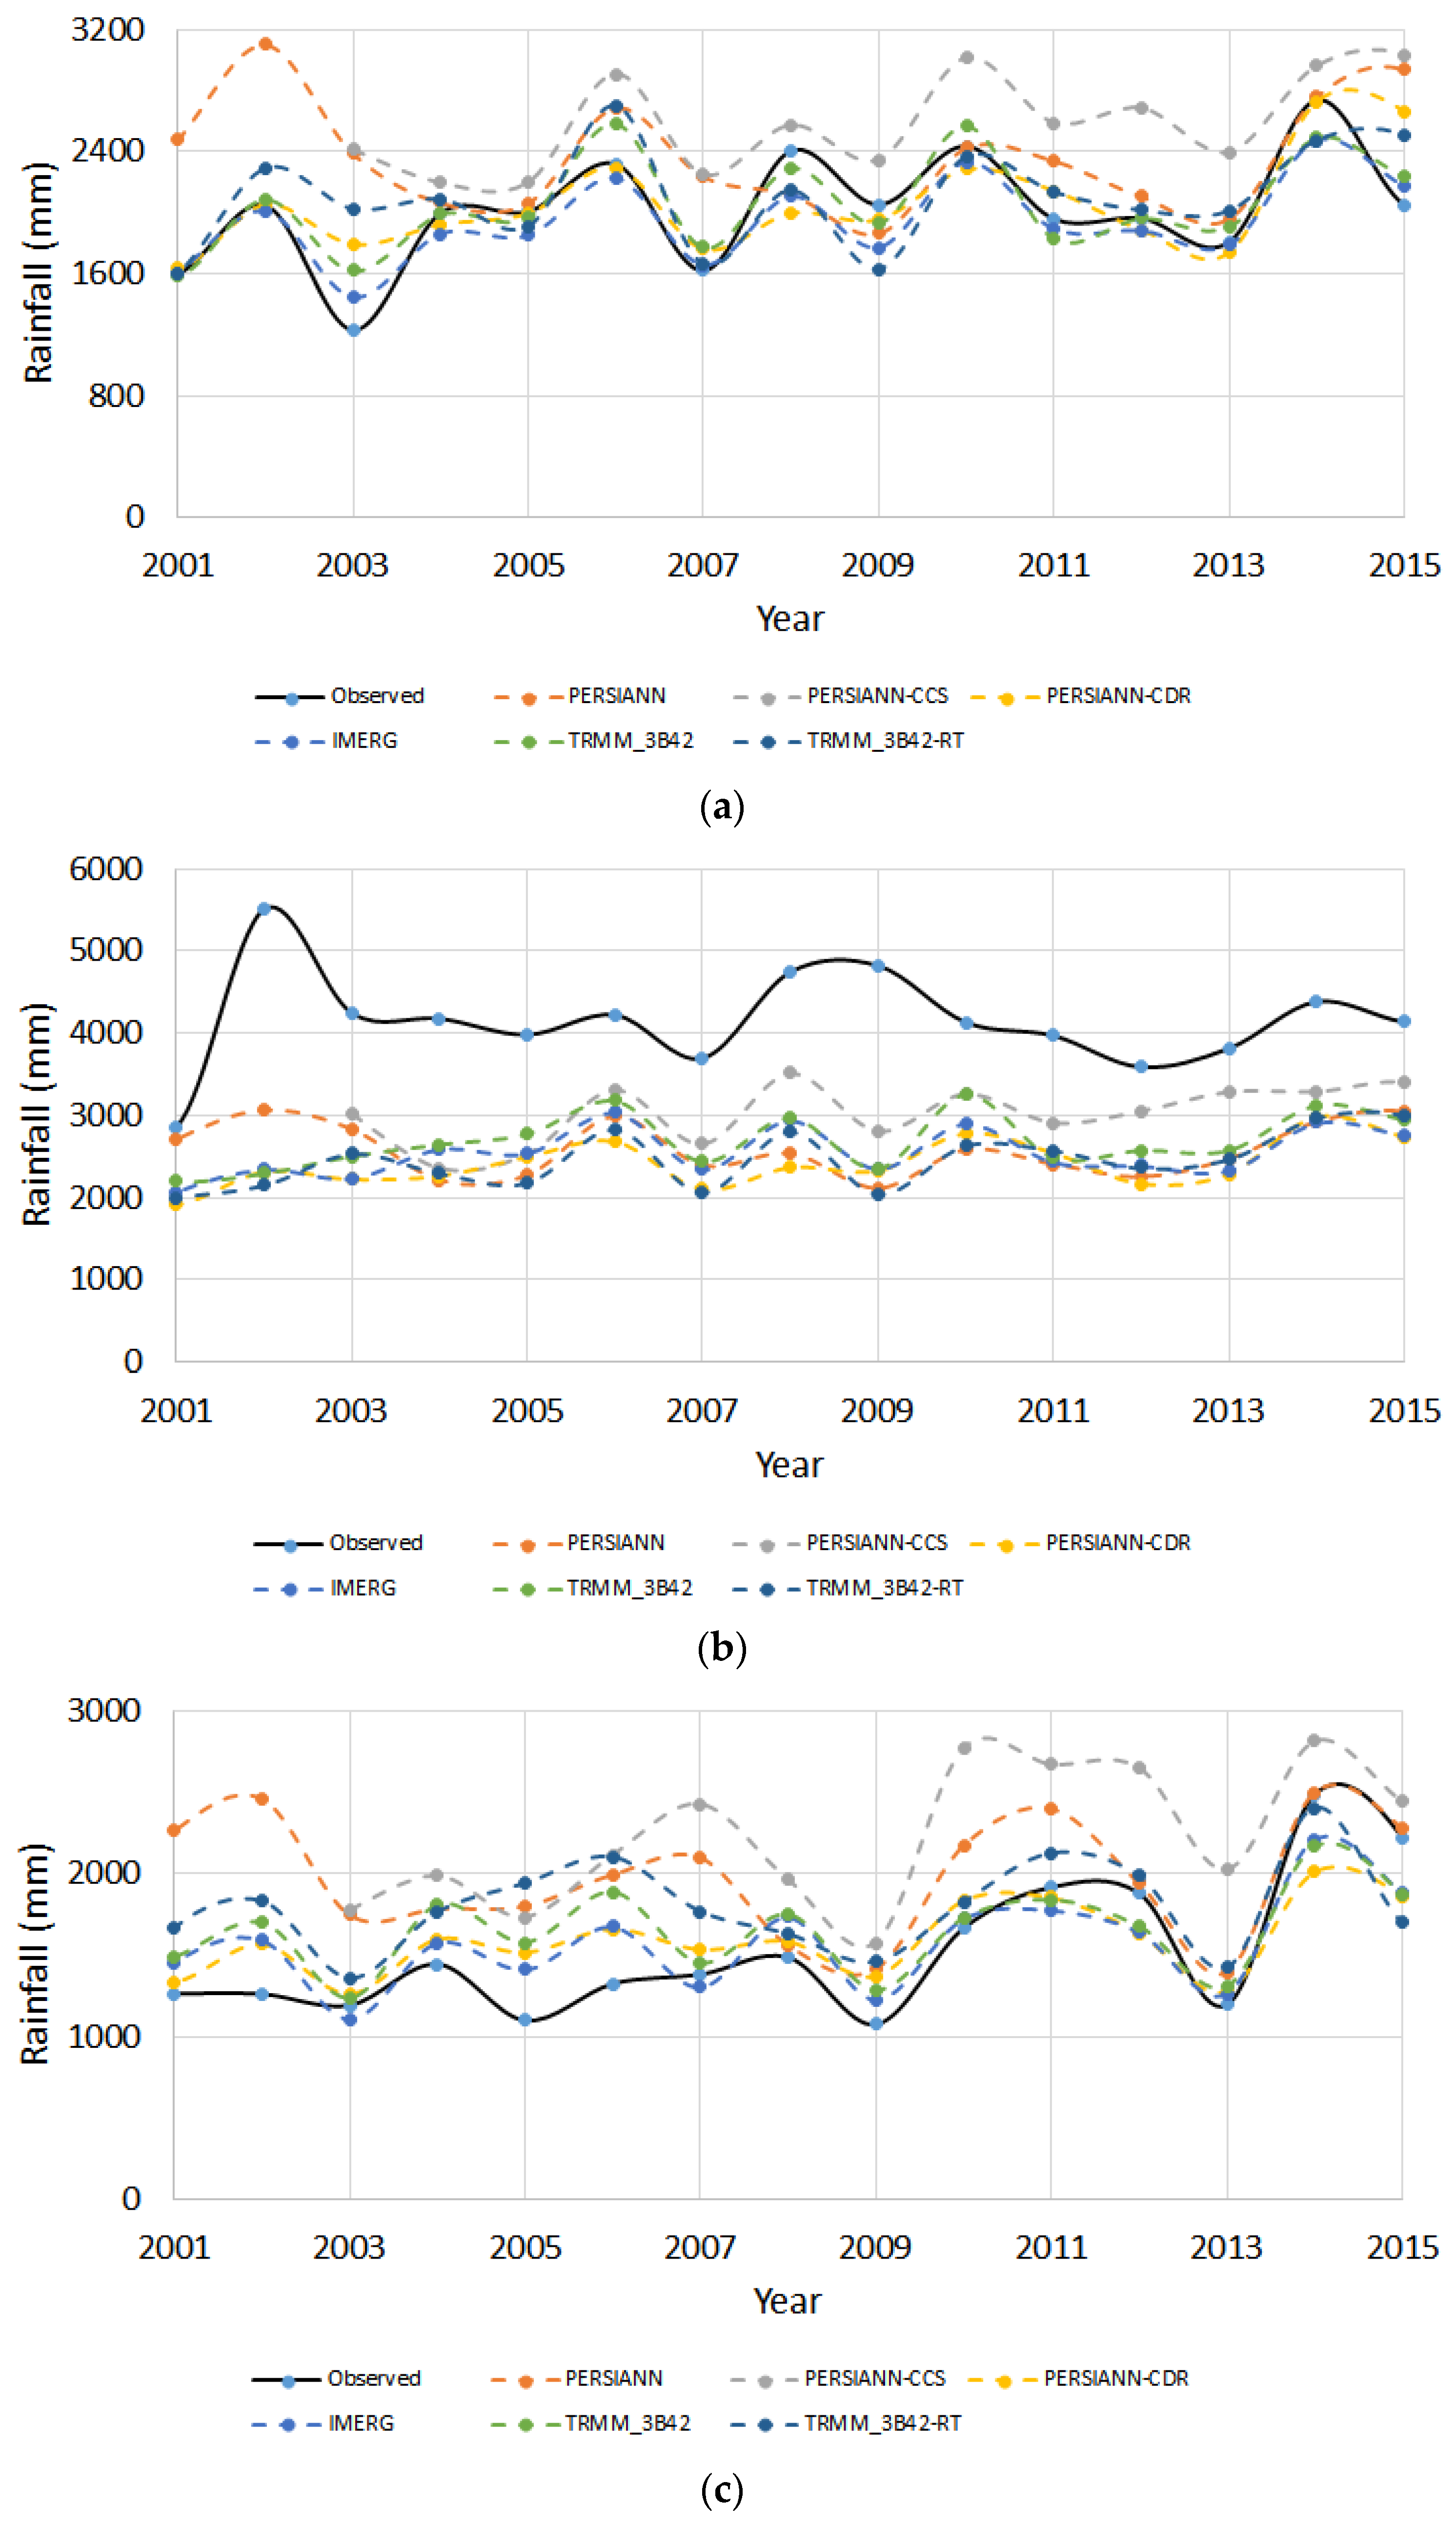
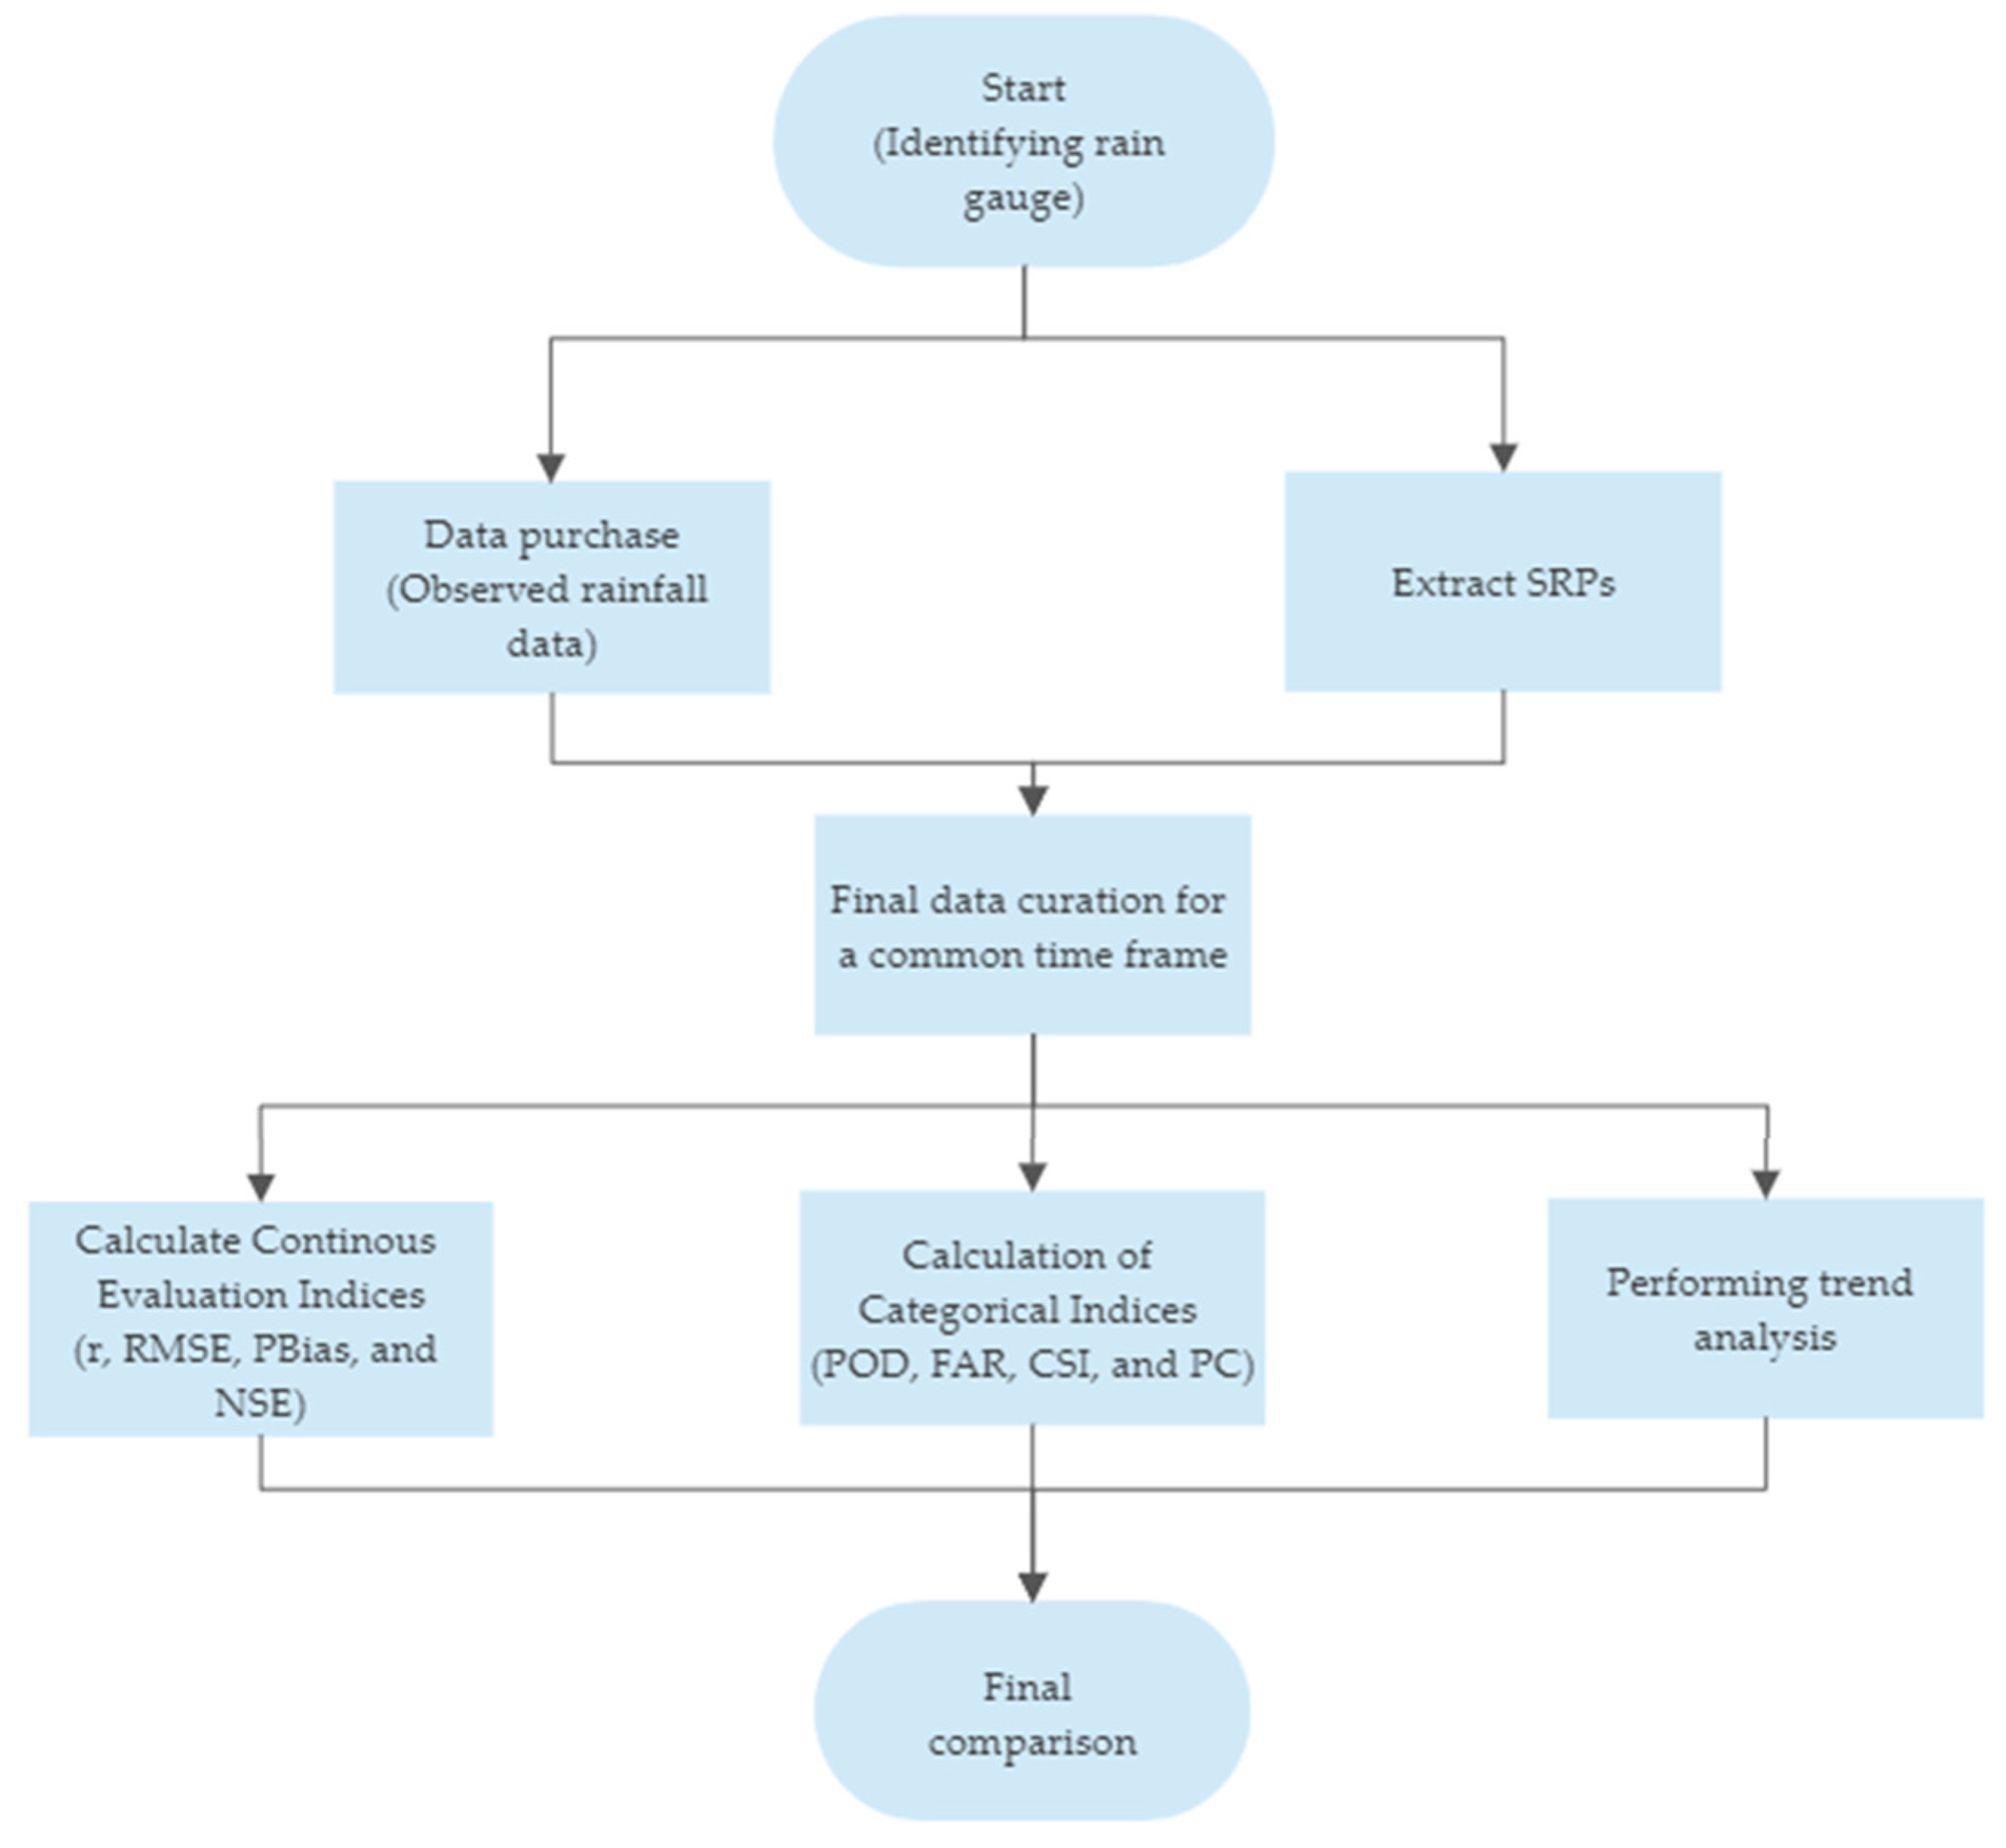
Rainfall data of the three important river basins namely, Malwathu, Deduru, and Kalu of Sri Lanka were used to evaluate six selected SRPs namely, PERSIANN, PERSIANN-CCS, PERSIANN-CDR, IMERG, TRMM-3B42, and TRMM-3B42RT. Four continuous evaluation indices, r, RMSE, PBIAS, and NSE, and four categorical indices, POD, FAR, CSI, and PC were used to evaluate the accuracy and prediction/detection accuracy of SRPs, respectively. Additionally, trend analysis was done in annual, seasonal, and monthly time scales to verify whether the trends predicted by SRPs match trends in observed data using the MK test and Sen’s Slope Estimation.
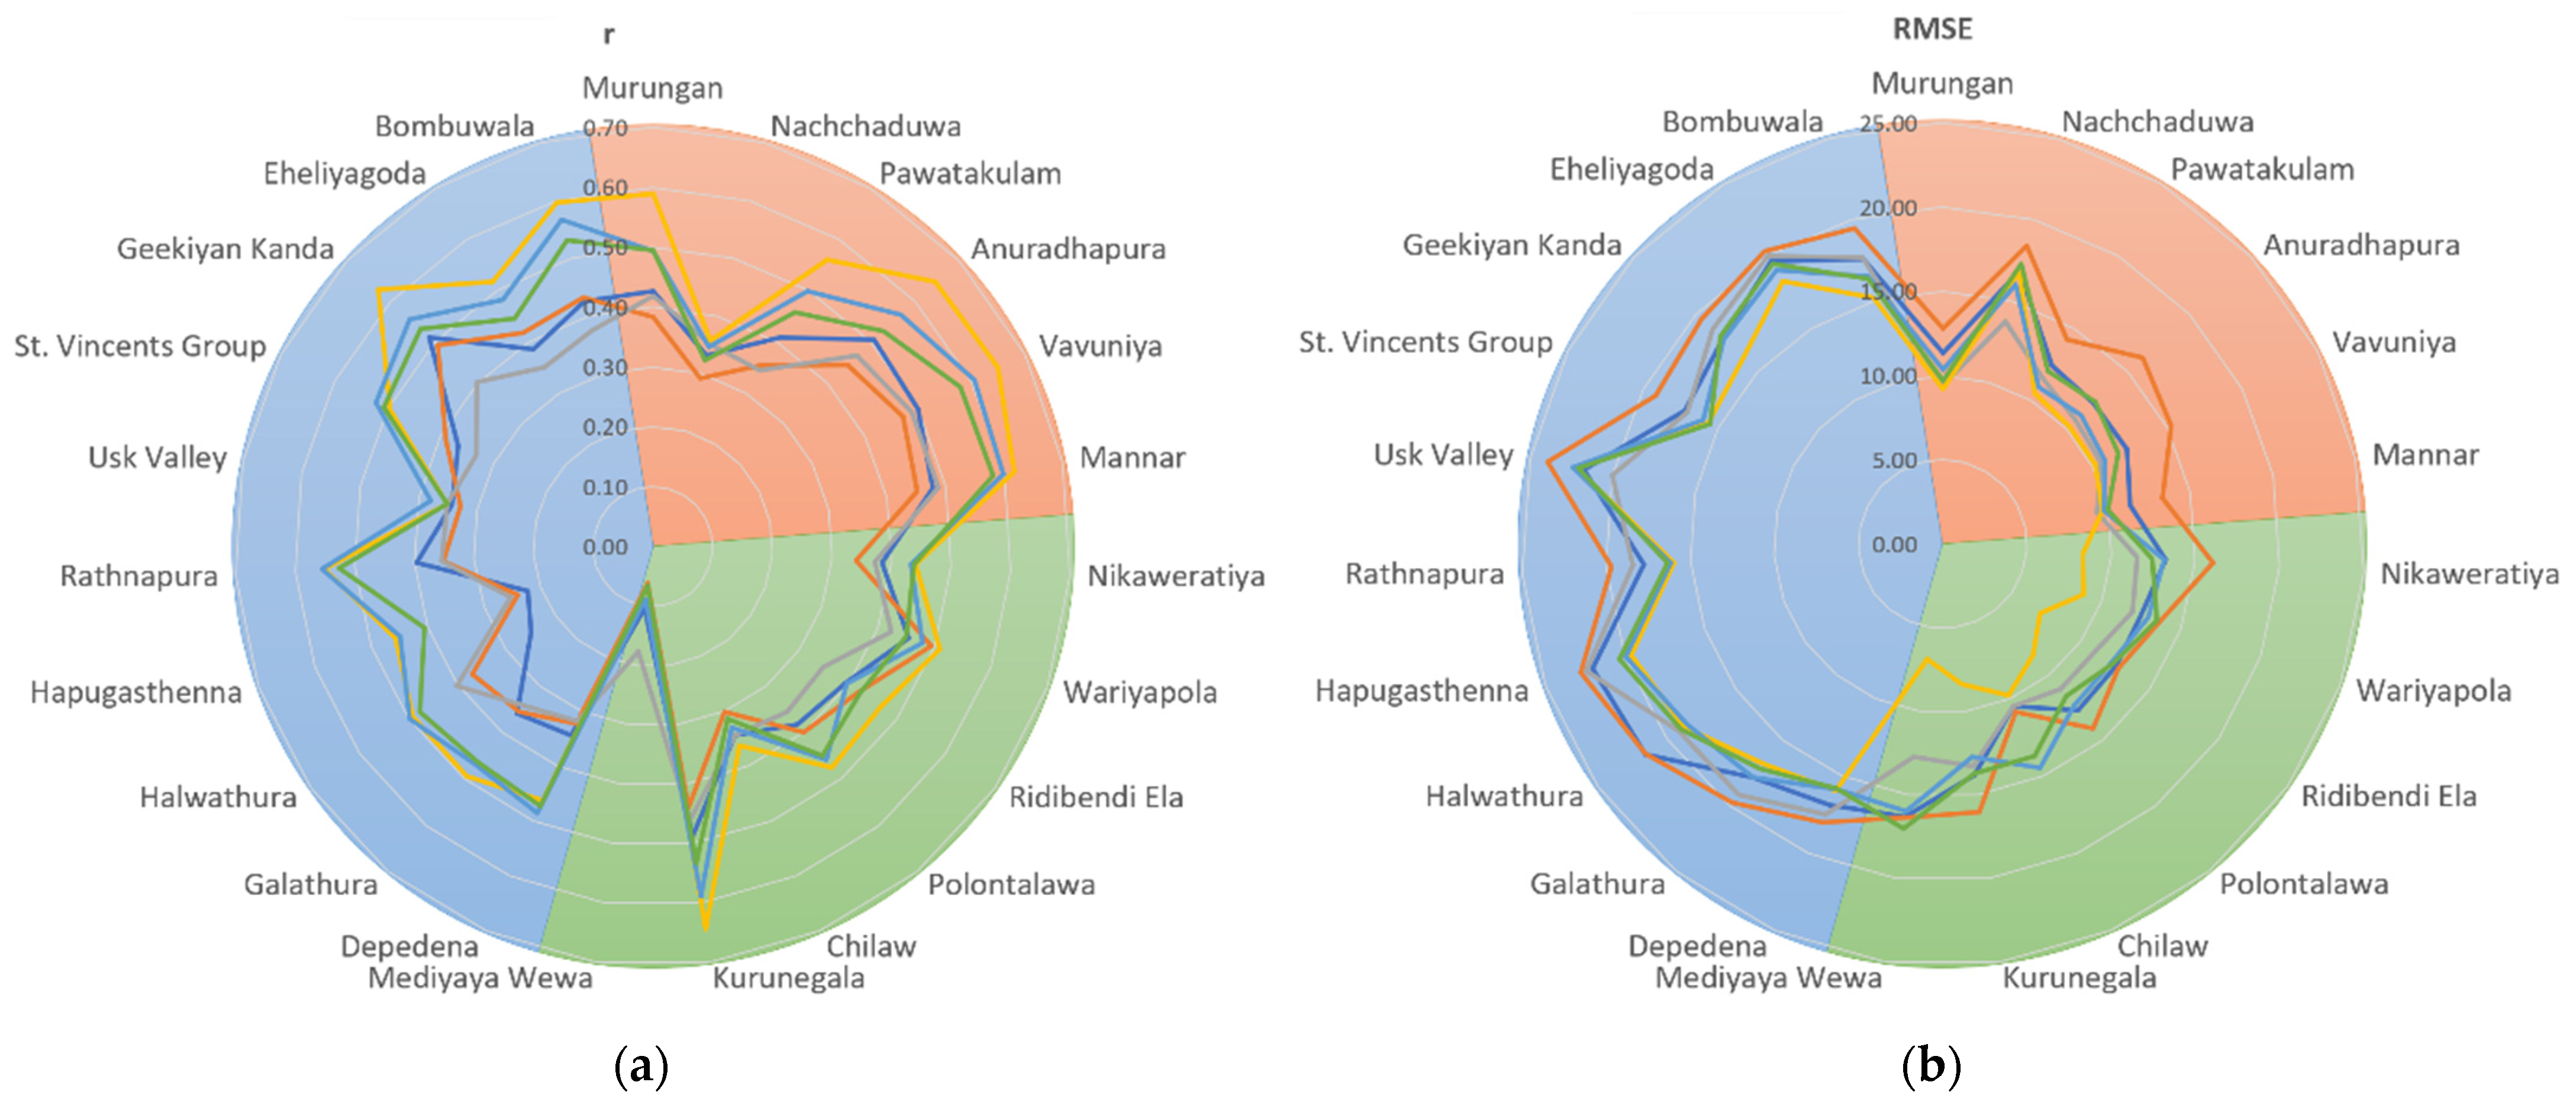
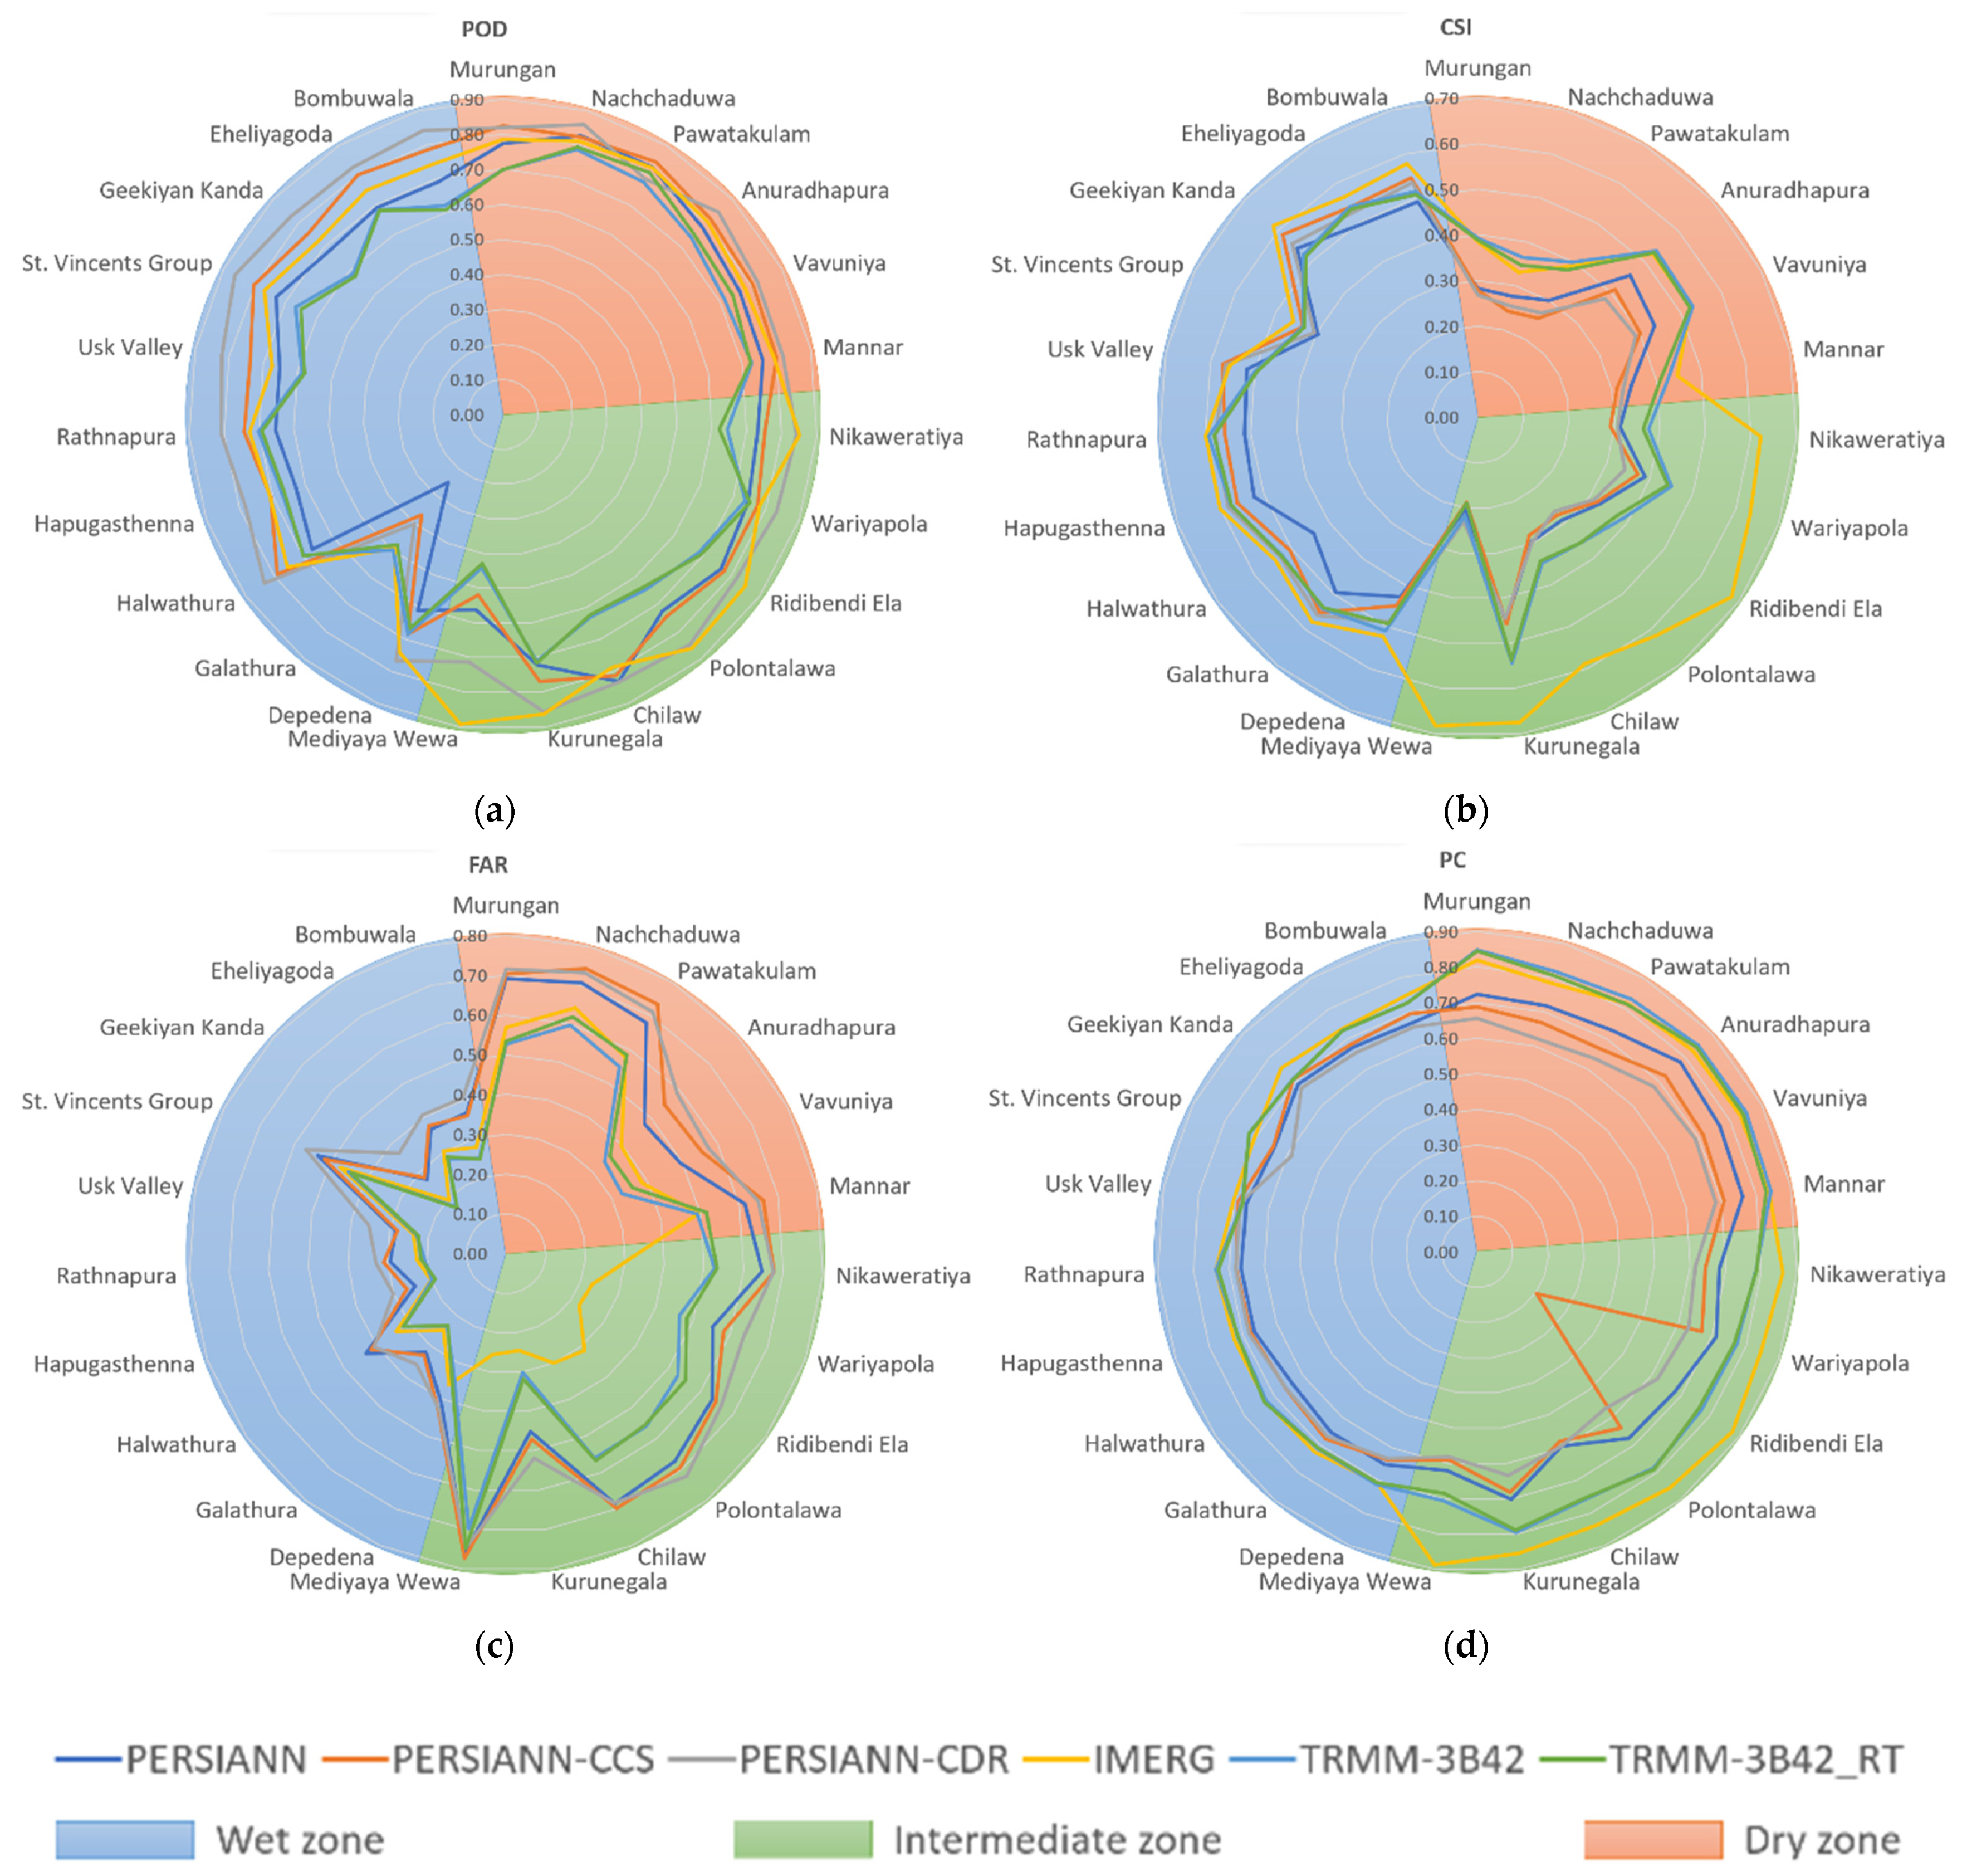
Mixed results were seen in the evaluation of categorical indices TRMM-3B42 performing well in the dry zone while IMERG performed well in the wet zone and intermediate zone. Overall, IMERG was the most consistent in terms of the CIs in the three basins. A clear worst performer cannot be identified as any of the SRPs consistently underperformed in all the CIs. The POD and PC results were fairly consistent among the three basins. However, the SRPs performed better in the wet zone in terms of CSI and FAR. A similar situation can be seen in the results of the CEIs with IMERG coming through as the overall best performer in terms of all four CEIs in the three basins. PERSIANN-CCS was the overall worst performer across the three basins. Once again, all the SRPs seemed to produce better results in the wet compared to the intermediate zone and dry zone. Despite the IMERG SRP performing better overall compared to the other SRPs, it was also not consistent enough.
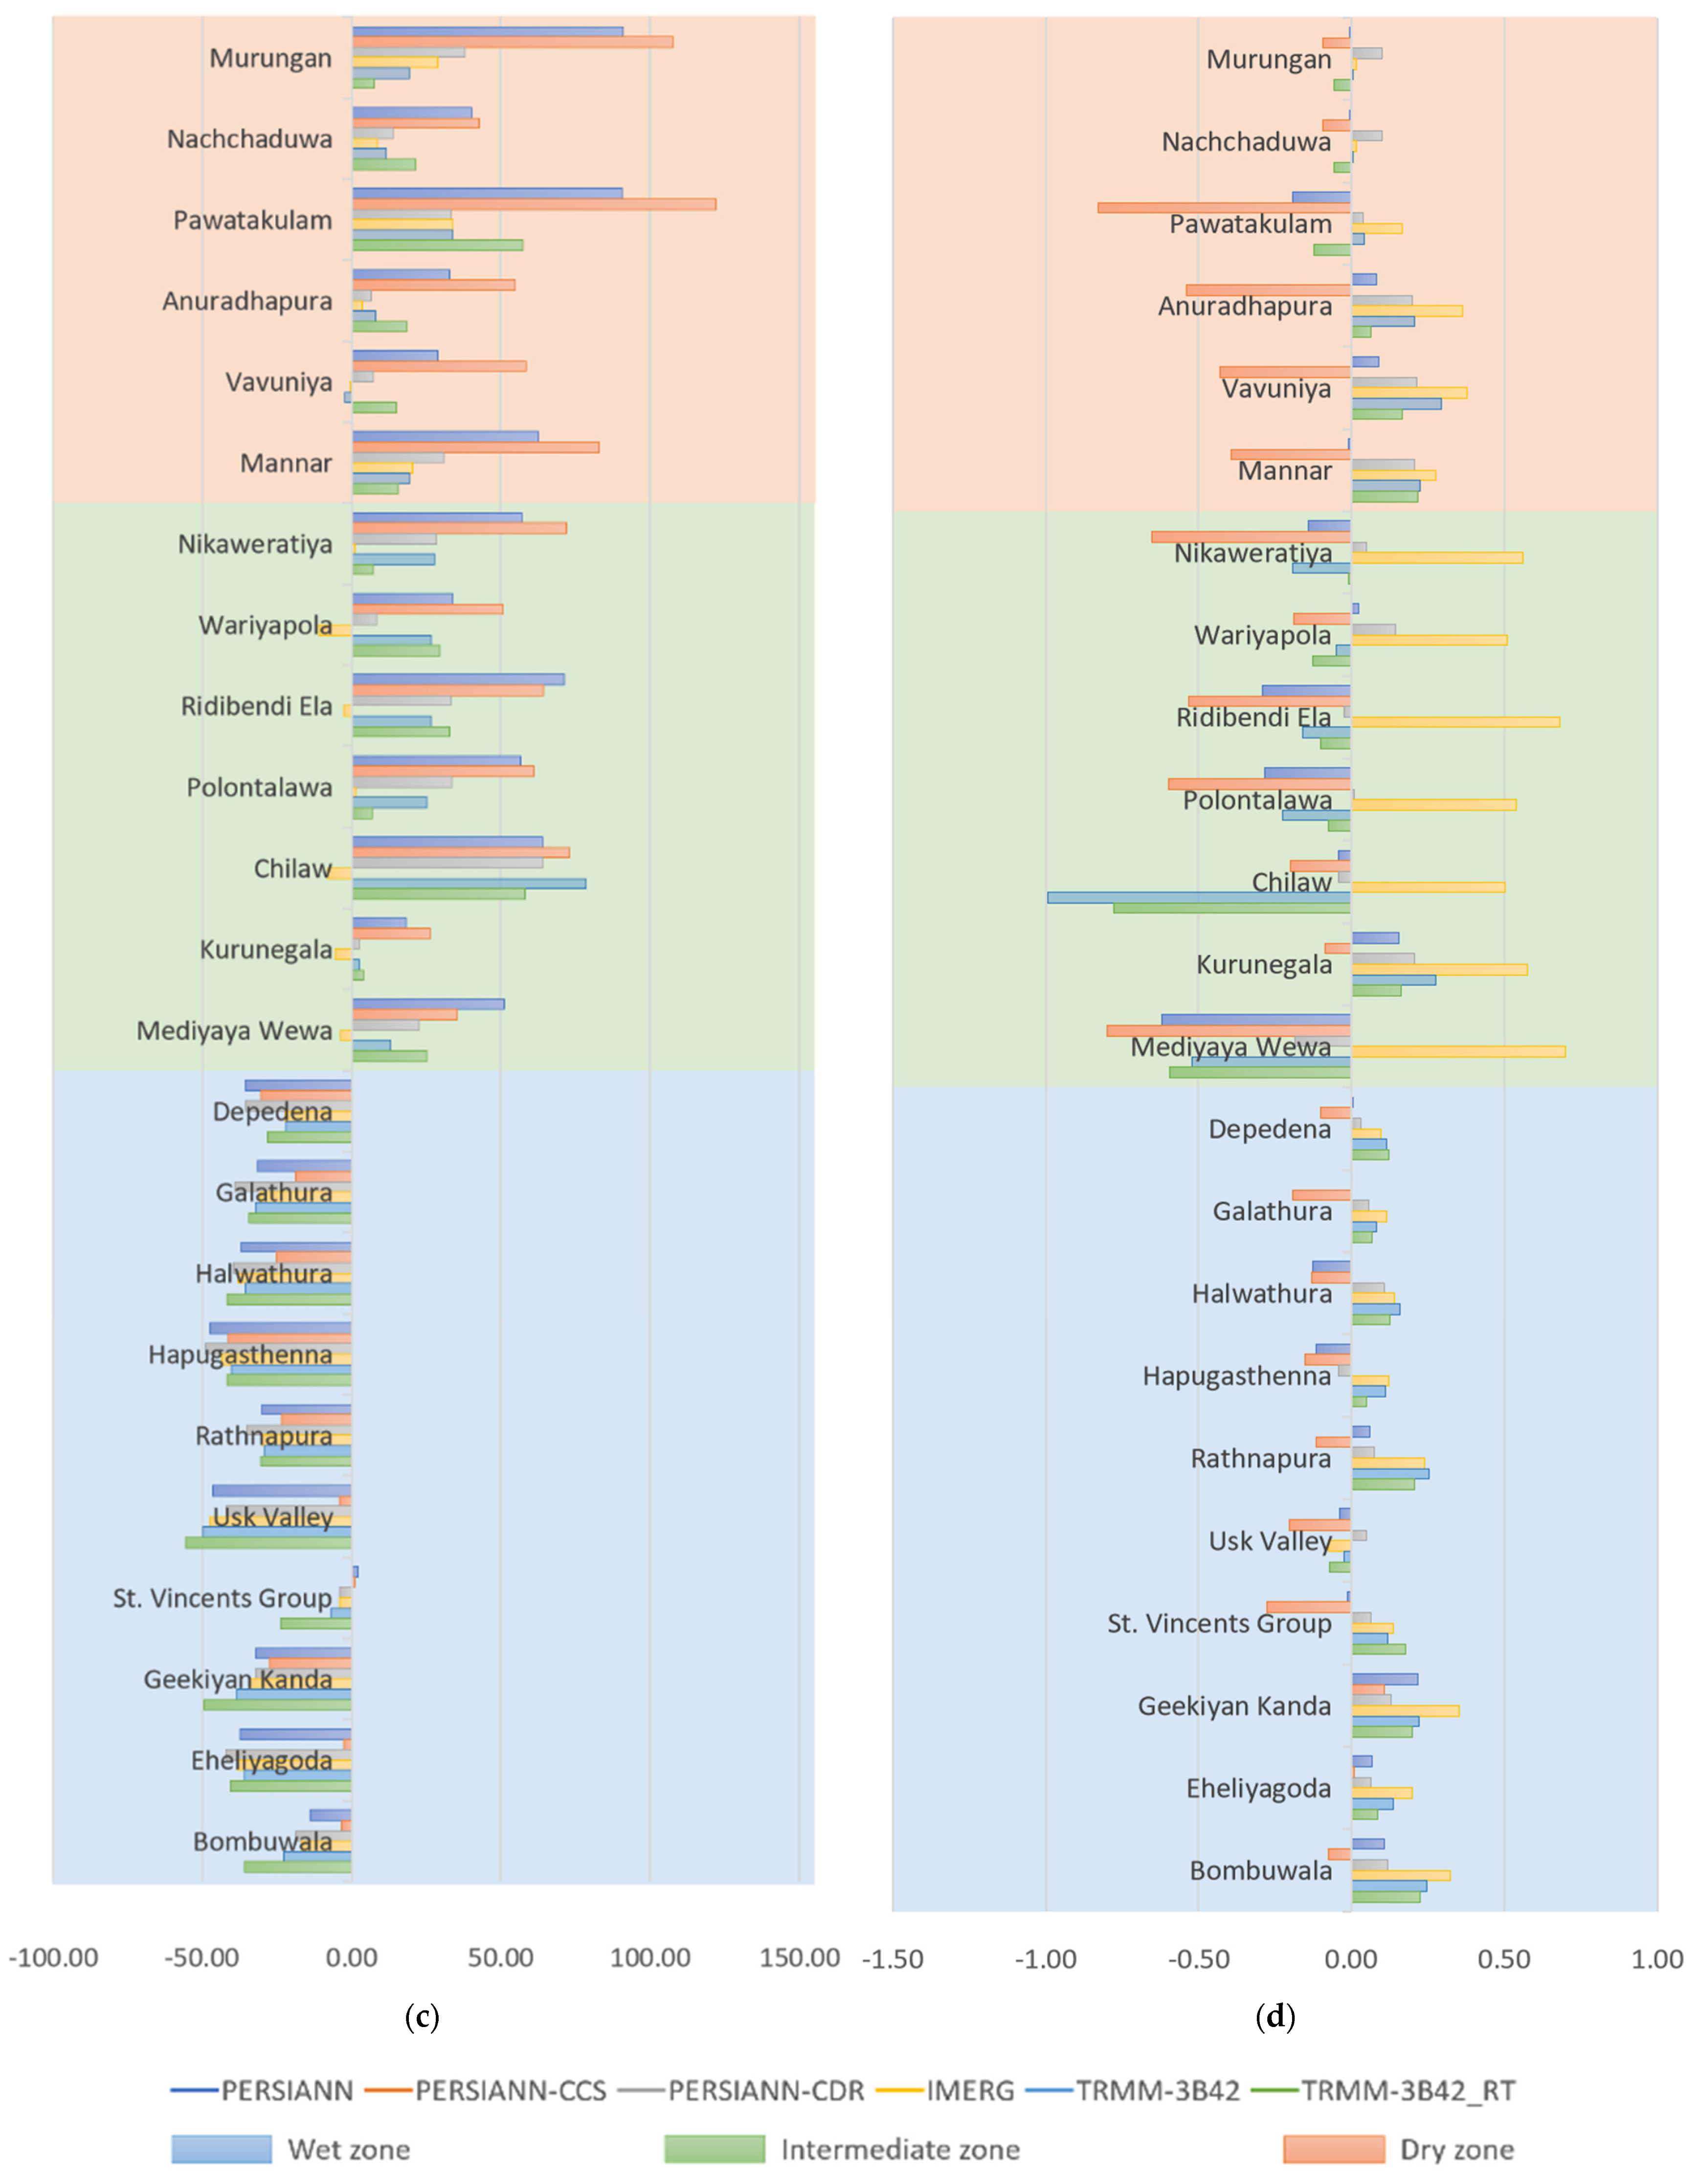
The trend analysis showed that significant trends in the observed data from rain gauges were few and far between. Even when significant trends were present, they were very rarely reflected in the SRP predictions. TRMM-3B42_RT was the best performer in terms of trend prediction with two annual trend predictions, three monthly trend predictions, and four seasonal trend predictions. However, Sen’s slope analysis showed that even though the direction of the trend was predicted accurately, the magnitude of the trend prediction varied heavily from those of the observed data. Therefore, in conclusion, the SRPs tested in this study exhibit significant inaccuracies and cannot be recommended as a complete substitute for rain gauge measurements. Nevertheless, for regions with insufficient rain gauge data, SRPs such as IMERG could be used to obtain an overall idea about the rainfall in the region. However, basin-wise studies are recommended instead of zonal studies (wet, intermediate, and dry) for such studies. This concludes that the basin-wise recognition may not be valid overall for the zone to which that basin belongs. Therefore, more river basins in each climatic zone are recommended for future studies.

Author Contributions

Conceptualization, M.B.G. and U.R.; methodology, H.P. and M.B.G.; software, H.P. and M.B.G.; validation, H.P.; formal analysis, H.P. and N.S.; resources, H.P. and M.B.G.; data curation, H.P. and M.B.G.; writing—original draft preparation, H.P. and N.S.; writing—review and editing, M.B.G., N.M. and U.R.; supervision, M.B.G. and U.R.; project administration, U.R. All authors have read and agreed to the published version of the manuscript.

Funding

This research was carried out under the Sri Lanka Institute of Information Technology (SLIIT) Research Grant of FGSR/RG/FE/2022/02.

Institutional Review Board Statement

Not applicable.

Informed Consent Statement

Not applicable.

Data Availability Statement

The precipitation data used in this research work can be requested by corresponding authors only for research purposes.

Acknowledgments

The authors would like to thank Jamunananda Kirushnananth, Gunasegaram Thashanth, and Kesavendra Shanmugam who were the final year project students of Upaka Rathnayake for initiating the groundwork of this research work. In addition, the authors acknowledge the support that they have received on data purchasing from the Sri Lanka Institute of Information Technology, Sri Lanka.

Conflicts of Interest

The authors declare no conflict of interest.

References

  1. Alazzy, A.; Lü, H.; Chen, R.; Ali, A.; Zhu, Y.; Su, J. Evaluation of Satellite Precipitation Products and Their Potential Influence on Hydrological Modeling over the Ganzi River Basin of the Tibetan Plateau. Adv. Meteorol. 2017, 2017, 3695285. [Google Scholar] [CrossRef] [Green Version]
  2. Kim, J.; Jung, I.; Park, K.; Yoon, S.; Lee, D. Hydrological Utility and Uncertainty of Multi-Satellite Precipitation Products in the Mountainous Region of South Korea. Remote Sens. 2016, 8, 608. [Google Scholar] [CrossRef] [Green Version]
  3. Xiao, S.; Xia, J.; Zou, L. Evaluation of Multi-Satellite Precipitation Products and Their Ability in Capturing the Characteristics of Extreme Climate Events over the Yangtze River Basin, China. Water 2020, 12, 1179. [Google Scholar] [CrossRef] [Green Version]
  4. Omonge, P.; Feigl, M.; Olang, L.; Schulz, K.; Herrnegger, M. Evaluation of satellite precipitation products for water allocation studies in the Sio-Malaba-Malakisi river basin of East Africa. J. Hydrol. Reg. Stud. 2022, 39, 100983. [Google Scholar] [CrossRef]
  5. Liu, C.; Aryastana, P.; Liu, G.; Huang, W. Assessment of satellite precipitation product estimates over Bali Island. Atmos. Res. 2020, 244, 105032. [Google Scholar] [CrossRef]
  6. Gummadi, S.; Dinku, T.; Shirsath, P.; Kadiyala, M. Evaluation of multiple satellite precipitation products for rainfed maize production systems over Vietnam. Sci. Rep. 2022, 12, 485. [Google Scholar] [CrossRef]
  7. Huffman, G.J.; Bolvin, D.T.; Braithwaite, D.; Hsu, K.; Joyce, R.; Kidd, C.; Nelkin, E.J.; Sorooshian, S.; Tan, J.; Xie, P. NASA GPM Integrated Multi-satellitE Retrievals for GPM (IMERG) Algorithm Theoretical Basis Document (ATBD) Version 06, Nasa/Gsfc, no. January, p. 29. 2020. Available online: https://pmm.nasa.gov/sites/default/files/document_files/IMERG_ATBD_V06.pdf (accessed on 2 July 2022).
  8. Huffman, G.J.; Gsfc, N.; Bolvin, D.T.; Braithwaite, D.; Hsu, K.; Joyce, R. Algorithm Theoretical Basis Document (ATBD) NASA Global Precipitation Measurement (GPM) Integrated Multi-satellitE Retrievals for GPM (IMERG); National Aeronautics and Space Administration: Washington, DC, USA, 2015; p. 29. [Google Scholar]
  9. Huffman, G.J.; Bolvin, D.T.; Nelkin, E.J.; Wolff, D.B.; Adler, R.F.; Gu, G.; Hong, Y.; Bowman, K.P.; Stocker, E.F. The TRMM Multisatellite Precipitation Analysis (TMPA): Quasi-Global, Multiyear, Combined-Sensor Precipitation Estimates at Fine Scales. J. Hydrometeorol. 2007, 8, 38–55. [Google Scholar] [CrossRef]
  10. Mondal, A.; Lakshmi, V.; Hashemi, H. Intercomparison of trend analysis of Multisatellite Monthly Precipitation Products and Gauge Measurements for River Basins of India. J. Hydrol. 2018, 565, 779–790. [Google Scholar] [CrossRef]
  11. Sorooshian, S.; Hsu, K.; Gao, X.; Gupta, H.; Imam, B.; Braithwaite, D. Evaluation of PERSIANN System Satellite–Based Estimates of Tropical Rainfall. Bull. Am. Meteorol. Soc. 2000, 81, 2035–2046. [Google Scholar] [CrossRef]
  12. Milewski, A.; Elkadiri, R.; Durham, M. Assessment and Comparison of TMPA Satellite Precipitation Products in Varying Climatic and Topographic Regimes in Morocco. Remote Sens. 2015, 7, 5697–5717. [Google Scholar] [CrossRef]
  13. Tong, K.; Su, F.; Yang, D.; Hao, Z. Evaluation of satellite precipitation retrievals and their potential utilities in hydrologic modeling over the Tibetan Plateau. J. Hydrol. 2014, 519, 423–437. [Google Scholar] [CrossRef]
  14. Kumar, B.; Patra, K.; Lakshmi, V. Daily rainfall statistics of TRMM and CMORPH: A case for trans-boundary Gandak River basin. J. Earth Syst. Sci. 2016, 125, 919–934. [Google Scholar] [CrossRef] [Green Version]
  15. Prakash, S.; Mitra, A.; Pai, D.; AghaKouchak, A. From TRMM to GPM: How well can heavy rainfall be detected from space? Adv. Water Resour. 2016, 88, 1–7. [Google Scholar] [CrossRef]
  16. Perera, H.; Fernando, S.; Gunathilake, M.; Sirisena, T.; Rathnayake, U. Evaluation of Satellite Rainfall Products over the Mahaweli River Basin in Sri Lanka. Adv. Meteorol. 2022, 2022, 1926854. [Google Scholar] [CrossRef]
  17. Perera, H.; Gunathilake, M.; Panditharathne, R.; Al-mahbashi, N.; Rathnayake, U. Statistical Evaluation and Trend Analysis of ANN Based Satellite Products (PERSIANN) for the Kelani River Basin, Sri Lanka. Appl. Comput. Intell. Soft Comput. 2022, 2022, 2117771. [Google Scholar] [CrossRef]
  18. Dissanayake, C.; Rupasinghe, M. Environmental impact of mining, erosion and sedimentation in Sri Lanka. Int. J. Environ. Stud. 1996, 51, 35–50. [Google Scholar] [CrossRef]
  19. Thiruvarudchelvan, T.; Sivakumar, S. Operational policy of the reservoirs in Malwathu Oya river basin to minimize flood damags in Anuradhapura, Vauniya and Mannar districts in northern Sri Lanka. Glob. Sci. 2019, 7, 39–48. [Google Scholar]
  20. Ampitiyawatta, A.; Guo, S. Precipitation trends in the Kalu Ganga basin in Sri Lanka. J. Agric. Sci. 2010, 4, 10–18. [Google Scholar] [CrossRef] [Green Version]
  21. Somaratne, P.G.; Jinapala, K.; Perera, L.R.; Ariyaratne, B.R.; Bandaragoda, D.J.; Makin, I.W. Developing effective Institutions for water Resources Management: A Case study in the Deduru Oya Basin, Sri Lanka. Working Paper 58. 2003. Available online: http://www.iwmi.cgiar.org/publications/iwmi-working-papers/iwmi-working-paper-58/ (accessed on 2 July 2022).
  22. Mu, Y.; Biggs, T.; Shen, S. Satellite-based precipitation estimates using a dense rain gauge network over the Southwestern Brazilian Amazon: Implication for identifying trends in dry season rainfall. Atmos. Res. 2021, 261, 105741. [Google Scholar] [CrossRef]
  23. Paca, V.; Espinoza-Dávalos, G.; Moreira, D.; Comair, G. Variability of Trends in Precipitation across the Amazon River Basin Determined from the CHIRPS Precipitation Product and from Station Records. Water 2020, 12, 1244. [Google Scholar] [CrossRef]
  24. Cavalcante, R.; Ferreira, D.; Pontes, P.; Tedeschi, R.; da Costa, C.; de Souza, E. Evaluation of extreme rainfall indices from CHIRPS precipitation estimates over the Brazilian Amazonia. Atmos. Res. 2020, 238, 104879. [Google Scholar] [CrossRef]
  25. Yatagai, A.; Kamiguchi, K.; Arakawa, O.; Hamada, A.; Yasutomi, N.; Kitoh, A. APHRODITE: Constructing a Long-Term Daily Gridded Precipitation Dataset for Asia Based on a Dense Network of Rain Gauges. Bull. Am. Meteorol. Soc. 2012, 93, 1401–1415. [Google Scholar] [CrossRef]
  26. Gunathilake, M.; Karunanayake, C.; Gunathilake, A.; Marasingha, N.; Samarasinghe, J.; Bandara, I.; Rathnayake, U. Hydrological Models and Artificial Neural Networks (ANNs) to Simulate Streamflow in a Tropical Catchment of Sri Lanka. Appl. Comput. Intell. Soft Comput. 2021, 2021, 6683389. [Google Scholar] [CrossRef]
  27. Wei, G.; Lü, H.; Crow, W.T.; Zhu, Y.; Wang, J.; Su, J. Evaluation of Satellite-Based Precipitation Products from IMERG V04A and V03D, CMORPH and TMPA with Gauged Rainfall in Three Climatologic Zones in China. Remote Sens. 2017, 10, 30. [Google Scholar] [CrossRef] [Green Version]
  28. Gunathilake, M.; Amaratunga, Y.; Perera, A.; Karunanayake, C.; Gunathilake, A.; Rathnayake, U. Statistical evaluation and hydrologic simulation capacity of different satellite-based precipitation products (SbPPs) in the Upper Nan River Basin, Northern Thailand. J. Hydrol. Reg. Stud. 2020, 32, 100743. [Google Scholar] [CrossRef]
  29. Mann, H.B. Non-Parametric Test Against Trend. Econometrica 1945, 13, 245–259. Available online: http://www.economist.com/node/18330371?story%7B_%7Did=18330371 (accessed on 2 July 2022). [CrossRef]
  30. Kendall, M.G. Rank Correlation Methods; University of Michigan: Ann Arbor, MI, USA, 1975; ISBN1 0852641990. ISBN2 9780852641996. [Google Scholar]
  31. Sen, P.K. Estimates of the regression coefficient based on kendall’s tau. J. Am. Stat. Assoc. 1968, 63, 1379–1389. [Google Scholar] [CrossRef]
  32. Mukaka, M. Statistics Corner: A guide to appropriate use of Correlation coefficient in medical research. Malawi Med. J. 2012, 24, 69–71. [Google Scholar]
  33. Taylor, R. Interpretation of the Correlation Coefficient: A Basic Review. J. Diagn. Med. Sonogr. 1990, 6, 35–39. [Google Scholar] [CrossRef]
  34. Benesty, J.; Chen, J.; Huang, Y. On the Importance of the Pearson Correlation Coefficient in Noise Reduction. IEEE Trans. Audio Speech Lang. Process. 2008, 16, 757–765. [Google Scholar] [CrossRef]
  35. Müller, R.; Büttner, P. A critical discussion of intraclass correlation coefficients. Stat. Med. 1994, 13, 2465–2476. [Google Scholar] [CrossRef] [PubMed]
  36. Schober, P.; Boer, C.; Schwarte, L. Correlation Coefficients. Anesth. Analg. 2018, 126, 1763–1768. [Google Scholar] [CrossRef] [PubMed]
  37. Zhang, G.; Xu, X.; Zhou, C.; Zhang, H.; Ouyang, H. Responses of grassland vegetation to climatic variations on different temporal scales in Hulun Buir Grassland in the past 30 years. J. Geogr. Sci. 2011, 21, 634–650. [Google Scholar] [CrossRef]
  38. Mekanik, F.; Imteaz, M.; Gato-Trinidad, S.; Elmahdi, A. Multiple regression and Artificial Neural Network for long-term rainfall forecasting using large scale climate modes. J. Hydrol. 2013, 503, 11–21. [Google Scholar] [CrossRef]
  39. Masood, M.; Shakir, A.; Azhar, A.; Nabi, G.; Habib-u-Rehman. Assessment of Real Time, Multi-Satellite Precipitation Products under Diverse Climatic and Topographic Conditions. Asia-Pac. J. Atmos. Sci. 2019, 56, 577–591. [Google Scholar] [CrossRef]
  40. Qin, Y.; Chen, Z.; Shen, Y.; Zhang, S.; Shi, R. Evaluation of Satellite Rainfall Estimates over the Chinese Mainland. Remote Sens. 2014, 6, 11649–11672. [Google Scholar] [CrossRef] [Green Version]
  41. Catto, J.; Jakob, C.; Nicholls, N. Can the CMIP5 models represent winter frontal precipitation? Geophys. Res. Lett. 2015, 42, 8596–8604. [Google Scholar] [CrossRef]
Figure 1. Climate zone of Sri Lanka.
Climate 10 00156 g001
Figure 2. Land use of the three catchments: (a) Deduru basin; (b) Kalu basin; (c) Malwathu basin.
Climate 10 00156 g002
Figure 3. Elevation maps with rain gauges: (a) Deduru; (b) Kalu; (c) Malwathu.
Climate 10 00156 g003
Figure 4. Elevation maps with rain gauges: (a) For Kurunegala; (b) For Eheliyagoda; (c) For Anuradhapura.
Climate 10 00156 g004
Figure 5. Flowchart of the analysis.
Climate 10 00156 g005
Figure 6. Variation of evaluation indices across the river basins (units are mm/day): (a) r; (b) RMSE; (c) PBias; (d) NSE.
Climate 10 00156 g006aClimate 10 00156 g006b
Figure 7. Variations of categorical indices across the basins: (a) POD; (b) CSI; (c) FAR; (d) PC.
Climate 10 00156 g007
Table 1. Rain gauge information.
River BasinIdentification NumberStation NameLatitudeLongitude
Deduru1Chilaw7.57579.787
2Polontalawa7.7280
3Nikaweratiya7.7580.12
4Mediyaya Wewa7.8880.28
5Ridibendi ela7.72980.262
6Wariyapola7.6280.24
7Kurunegala7.4880.36
Kalu8St. Vincents Group6.5280
9Bombuwala6.5780.02
10Geekiyan Kanda6.680.12
11Usk Valley6.5780.23
12Halwathura6.7280.2
13Galathura6.780.28
14Eheliyagoda6.8580.27
15Rathnapura6.6880.4
16Hapugasthenna6.7280.52
17Depedena 6.4780.55
Malwathu18Mannar8.9879.92
19Murungan8.8380.05
20Vavuniya 8.7580.5
21Pawatakulam8.6880.43
22Anuradhapura 8.33580.415
23Nachchaduwa8.2580.47
Table 2. Details of SRPs.
ProductFinest Time ResolutionData ExtractedSpatial ResolutionSpatial Coverage
PERSIANN1 hMarch 2000–December/20190.25° × 0.25°60° N–60° S
PERSIANN-CSS1 hJanuary 2003–December 20190.04° × 0.04°60° N–60° S
PERSIANN-CDR1 dayJanuary 1990–December 20190.25° × 0.25°60° N–60° S
TRMM-3B42 V73 hJanuary 1998–December 20190.25° × 0.25°50° N–50° S
TRMM-3B42RT V73 hMarch 2000–December 20190.25° × 0.25°60° N–560° S
IMERG V0630 minMarch 2000–December 20190.10° × 0.10°90° N–90° S
Table 3. Statistical information for selected stations.
Precipitation ProductStation
KurunegalaEheliyagodaAnuradhapura
Mean/(Standard deviation) (mm/year)Observed1987.4/(363.8)4106.0/(590.9)1396.4/(352.2)
PERSIANN2331.1/(371.6)2549.7/(328.1)1940.9/(362.9)
PERSIANN-CCS2579.5/(301.0)3031.5/(345.3)2347.5/(510.1)
PERSIANN-CDR2038.8/(305.0)2381.3/(288.0)1488.6/(211.7)
IMERG1880.7/(338.4)2478.7/(381.2)1511.1/(289.5)
TRMM_3B422037.6/(305.5)2673.5/(318.0)1568.0/(253.6)
TRMM_3B42-RT2054.5/(358.4)2420.4/(356.8)1734.4/(320.7)
Table 4. Continuous Evaluation Indices.
Statistical IndicatorsEquationUse of Indicator
r r = i = 1 N O i O ^ S i O ^ i = 1 N O i O ^ 2 i = 1 N S i O ^ 2 Degree of correlation
RMSE RMSE = 1 N i = 1 n ( S i O i ) 2 The absolute average magnitude of error
PBias PBias = i = 1 N ( S i O i ) i = 1 N O i Degree of deviation
NSE NSE = 1 i = 1 n ( S i   O i ) 2 i = 1 n ( O i   O   ^ ) 2 The relative magnitude of variance
where, S i and S ¯ , are the ith station and mean values of SRP data, respectively, O i and O ¯ , are the ith station and mean values of gauge data, respectively, n represents the total number of data considered.
Table 5. Categorical indices.
Categorical StatisticsCalculation FormulaOptimal Value [0, 1]
POD POD = correct   hits correct   hits + misses 1
FAR F AR = false   alarms correct   hits + false   alarms 0
CSI C SI = correct   hits correct   hits + misses + false   alarms 1
PC PC = correct   hits + correct   negatives correct   hits + misses + false   alarms + correct   negatives 1
Table 6. Best performing SRPs in terms of Cis.
Climatic ZoneBest Performer
PODCSIFARPC
Wet zonePERSIANN-CDRIMERGTRMM-3B42_RTIMERG
Intermediate zoneIMERGIMERGIMERGIMERG
Dry zonePERSIANN-CDRTRMM-3B42TRMM-3B42TRMM-3B42
Table 7. Significant trends.
Stationp ValueSen’s Slope (mm)
Annual
NachchaduwaObserved0.00326.9
PERSIANN-CDR0.03220.1
VavuniyaObserved0.00114.2
PERSIANN-CDR0.0139.8
Usk ValleyObserved0.00165.8
TRMM-3B420.00542.3
TRMM-3B42_RT079.7
Geekiyan KandaObserved0.02820.1
TRMM-3B420.01537.1
TRMM-3B42_RT0.00165.9
Monthly
Depedena (December)Observed0.0323.7
TRMM-3B42_RT0.02711.5
Usk Valley (February)Observed0.0045.8
TRMM-3B42_RT0.0486.6
Usk Valley (December)Observed0.0406.5
PERSIANN-CCS0.03321.0
TRMM-3B42_RT0.01311.8
Seasonal
Murungan (SWM)Observed0.016−10.6
PERSIANN-CDR0.025−35.3
Depedena (NEM)Observed0.03918.3
IMERG0.02926.9
TRMM-3B42_RT0.00852.4
Usk Valley (NEM)Observed0.01434.9
TRMM-3B42_RT0.02348.5
Usk Valley (SWM)Observed0.02554.2
IMERG0.04750.4
TRMM-3B42_RT0.04574.3
Publisher’s Note: MDPI stays neutral with regard to jurisdictional claims in published maps and institutional affiliations.

