Article

A Genome-Wide Analysis and Expression Profile of Heat Shock Transcription Factor (Hsf) Gene Family in Rhododendron simsii

1
Jiyang College, Zhejiang A&F University, Zhuji 311800, China
2
College of Advanced Agricultural Sciences, Zhejiang A&F University, Hangzhou 311300, China
3
Zhuji Economic Specialty Station, Zhuji 311800, China
*
Author to whom correspondence should be addressed.
These authors contributed equally to this work.
Plants 2023, 12(22), 3917; https://doi.org/10.3390/plants12223917
Submission received: 6 October 2023 / Revised: 1 November 2023 / Accepted: 16 November 2023 / Published: 20 November 2023
(This article belongs to the Special Issue Recent Advances in Plant Genomics and Transcriptome Analysis)

Abstract

:
Heat shock transcription factors are key players in a number of transcriptional regulatory pathways that function during plant growth and development. However, their mode of action in Rhododendron simsii is still unclear. In this study, 22 RsHsf genes were identified from genomic data of R. simsii. The 22 genes were randomly distributed on 12 chromosomes, and were divided into three major groups according to their phylogenetic relationships. The structures and conserved motifs were predicted for the 22 genes. Analysis of cis-acting elements revealed stress-responsive and phytohormone-responsive elements in the gene promoter regions, but the types and number varied among the different groups of genes. Transcriptional profile analyses revealed that RsHsfs were expressed in a tissue-specific manner, with particularly high transcript levels in the roots. The transcriptional profiles under abiotic stress were detected by qRT-PCR, and the results further validated the critical function of RsHsfs. This study provides basic information about RsHsf family in R. simsii, and paves the way for further research to clarify their precise roles and to breed new stress-tolerant varieties.

1. Introduction

With global climate change, excessive heat is becoming one of the main environmental factors restricting plant growth. Transient or persistent heat stress negatively affects plant growth, and can result in death in severe cases. However, plants can detect even slight changes in temperature and respond accordingly. Plants have evolved a series of complex and efficient response mechanisms to adjust their morphology and physiology to adapt to environmental conditions [1,2]. Studies on the regulation mechanisms of plants have shown that heat shock transcription factors (Hsfs) are key transcription factors in the heat response and in signal transduction [3].
Hsfs were first discovered in yeast [4], and were subsequently found in Drosophila [5] and mammals [6,7]. Plant Hsfs were first discovered and cloned in tomato [4]. Then, 21 members of the Hsf family were identified from Arabidopsis thaliana [8,9] and classified according to their structural characteristics. This became the basis of Hsf research in the following decade. Other studies have since identified members of the Hsf family in many higher plants, including maize [10], cotton [11] and rice [12]. As a transcription factor, Hsf can combine with the heat shock element (HSE) and activate the expression of downstream genes during the response to heat stress [13,14,15].
Hsfs play crucial roles in plant growth and stress response, and their expression is induced by various stresses. For instance, HsfA2 is a heat stress-inducible gene and its product regulates the expression of a subset of downstream stress response genes [16]. Overexpression of HsfA2s from A. thaliana, Zea mays, and Oryza sativa conferred heat tolerance in transgenic Arabidopsis [17,18,19]. In wheat, TaHsfA6f encodes a transcription factor that regulates the expression of several target genes (TaHsps, TaRof1, TaGST) to improve heat resistance [20]. In addition, AtHsfA1s were found to be involved in responses to other stresses, such as salt, osmotic, and oxidative stresses [21]. Overexpression of CarHsfB2 led to increased expression levels of some stress-related genes (RD22, RD26 and RD29A) in transgenic Arabidopsis under drought stress, and improved its drought tolerance [22]. However, SlHsfA3 and VpHsf1 were found to play a negative regulatory role in salt stress and osmotic stress, different from the positive roles of the regulatory factors mentioned above [23,24]. The results of those studies show that Hsf transcription factors play functionally diverse roles in stress responses.
Rhododendron is well known for its beautiful, brightly colored flowers, and is cultivated worldwide. In addition to their ornamental value, Rhododendron species have other uses in food and medicine [25]. For example, its root extracts have been shown to promote blood circulation, stop bleeding, reduce heat, and eliminate toxic materials. Essential oils are extracted from some cultivars. Rhododendron grows best in cool, humid, and ventilated semi-shady environments. The optimum temperature range for growth is 12 °C to 25 °C. When the temperature is too high, new sprouts and leaves grow slowly and become semi-dormant. Therefore, it is essential to study how the heat stress response is regulated in Rhododendron.
The Hsf gene family has been studied in many species, but has not been analyzed in detail in Rhododendron. In this study, 22 RsHsfs were identified, and their gene structure and phylogenetic relationships were determined. The physicochemical properties of the putative proteins and their conserved domains were predicted. The gene promoter regions were analyzed to detect cis-acting elements. The transcriptional profiles of RsHsf genes in different tissues and in response to various abiotic stresses were determined by qRT-PCR, which identified candidate genes involved in stress responses. The results of this study provide a theoretical reference for further studies on the Hsfs of R. simsii and their roles in heat tolerance.

2. Results

2.1. Gene Identification and Physicochemical Properties of Putative Proteins

BLASTX searches were performed using AtHsf gene sequence as queries. PFAM and SMART were used to remove the invalid and repetitive amino acid sequences obtained from Rhododendron simsii genome database [26]. In total, 22 RsHsf genes were identified and named RsHsf1RsHsf22 (Table 1). The proteins encoded by RsHsfs contained 140 (RsHsf2) to 740 (RsHsf3) amino acids (a.a.), with predicted molecular weights ranging from 16.63 (RsHsf2) to 83.56 (RsHsf3) KDa, and isoelectric points ranging from 4.5 (RsHsf2) to 9.13 (RsHsf22). All of the RsHsfs except for RsHsf16 and RsHsf19 were predicted to be unstable proteins. The grand average of hydropathicity values of RsHsfs were all negative. Therefore, RsHsfs were predicted to be predominantly hydrophilic proteins.

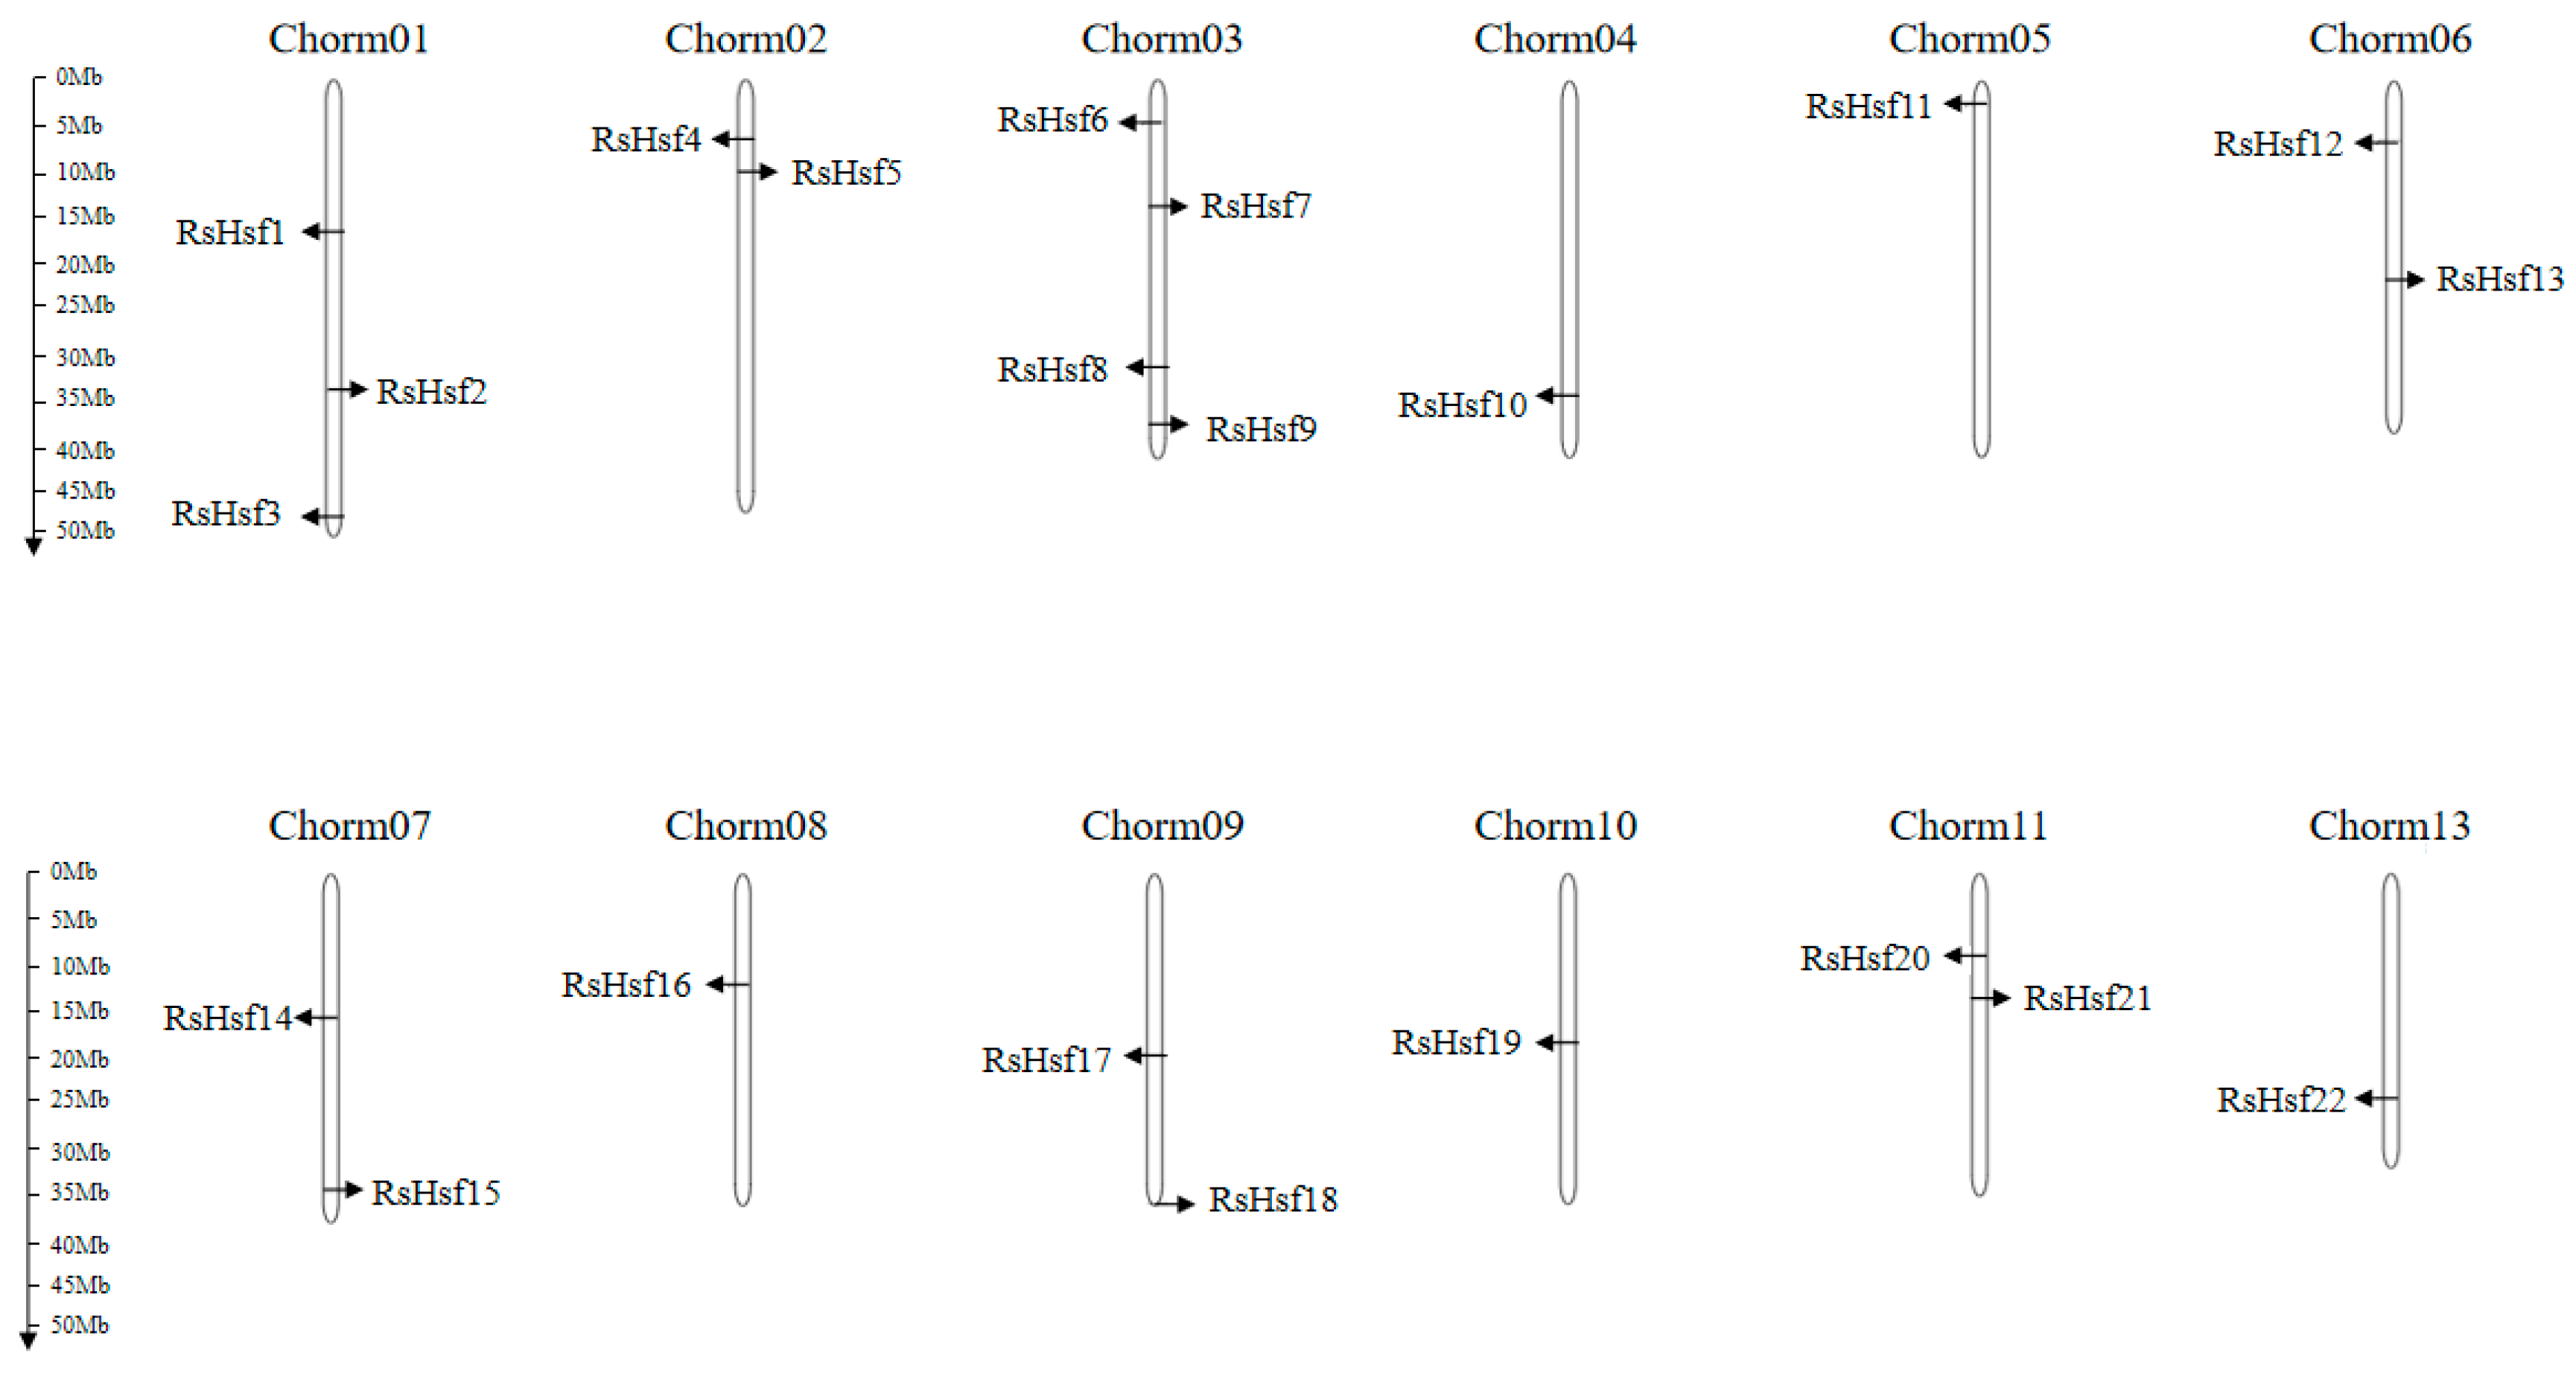
2.2. Location of Genes on Chromosomes

Based on the R. simsii genome database [26], chromosome mapping of RsHsfs showed that the 22 candidate genes were unevenly dispersed on 12 of the 13 chromosomes (all except chromosome 12) (Figure 1). Four genes were located on chromosome 3, three on chromosome 1, two on each of chromosomes 2, 6, 7, 9 and 11, and one on each of chromosomes 4, 5, 8 and 10.

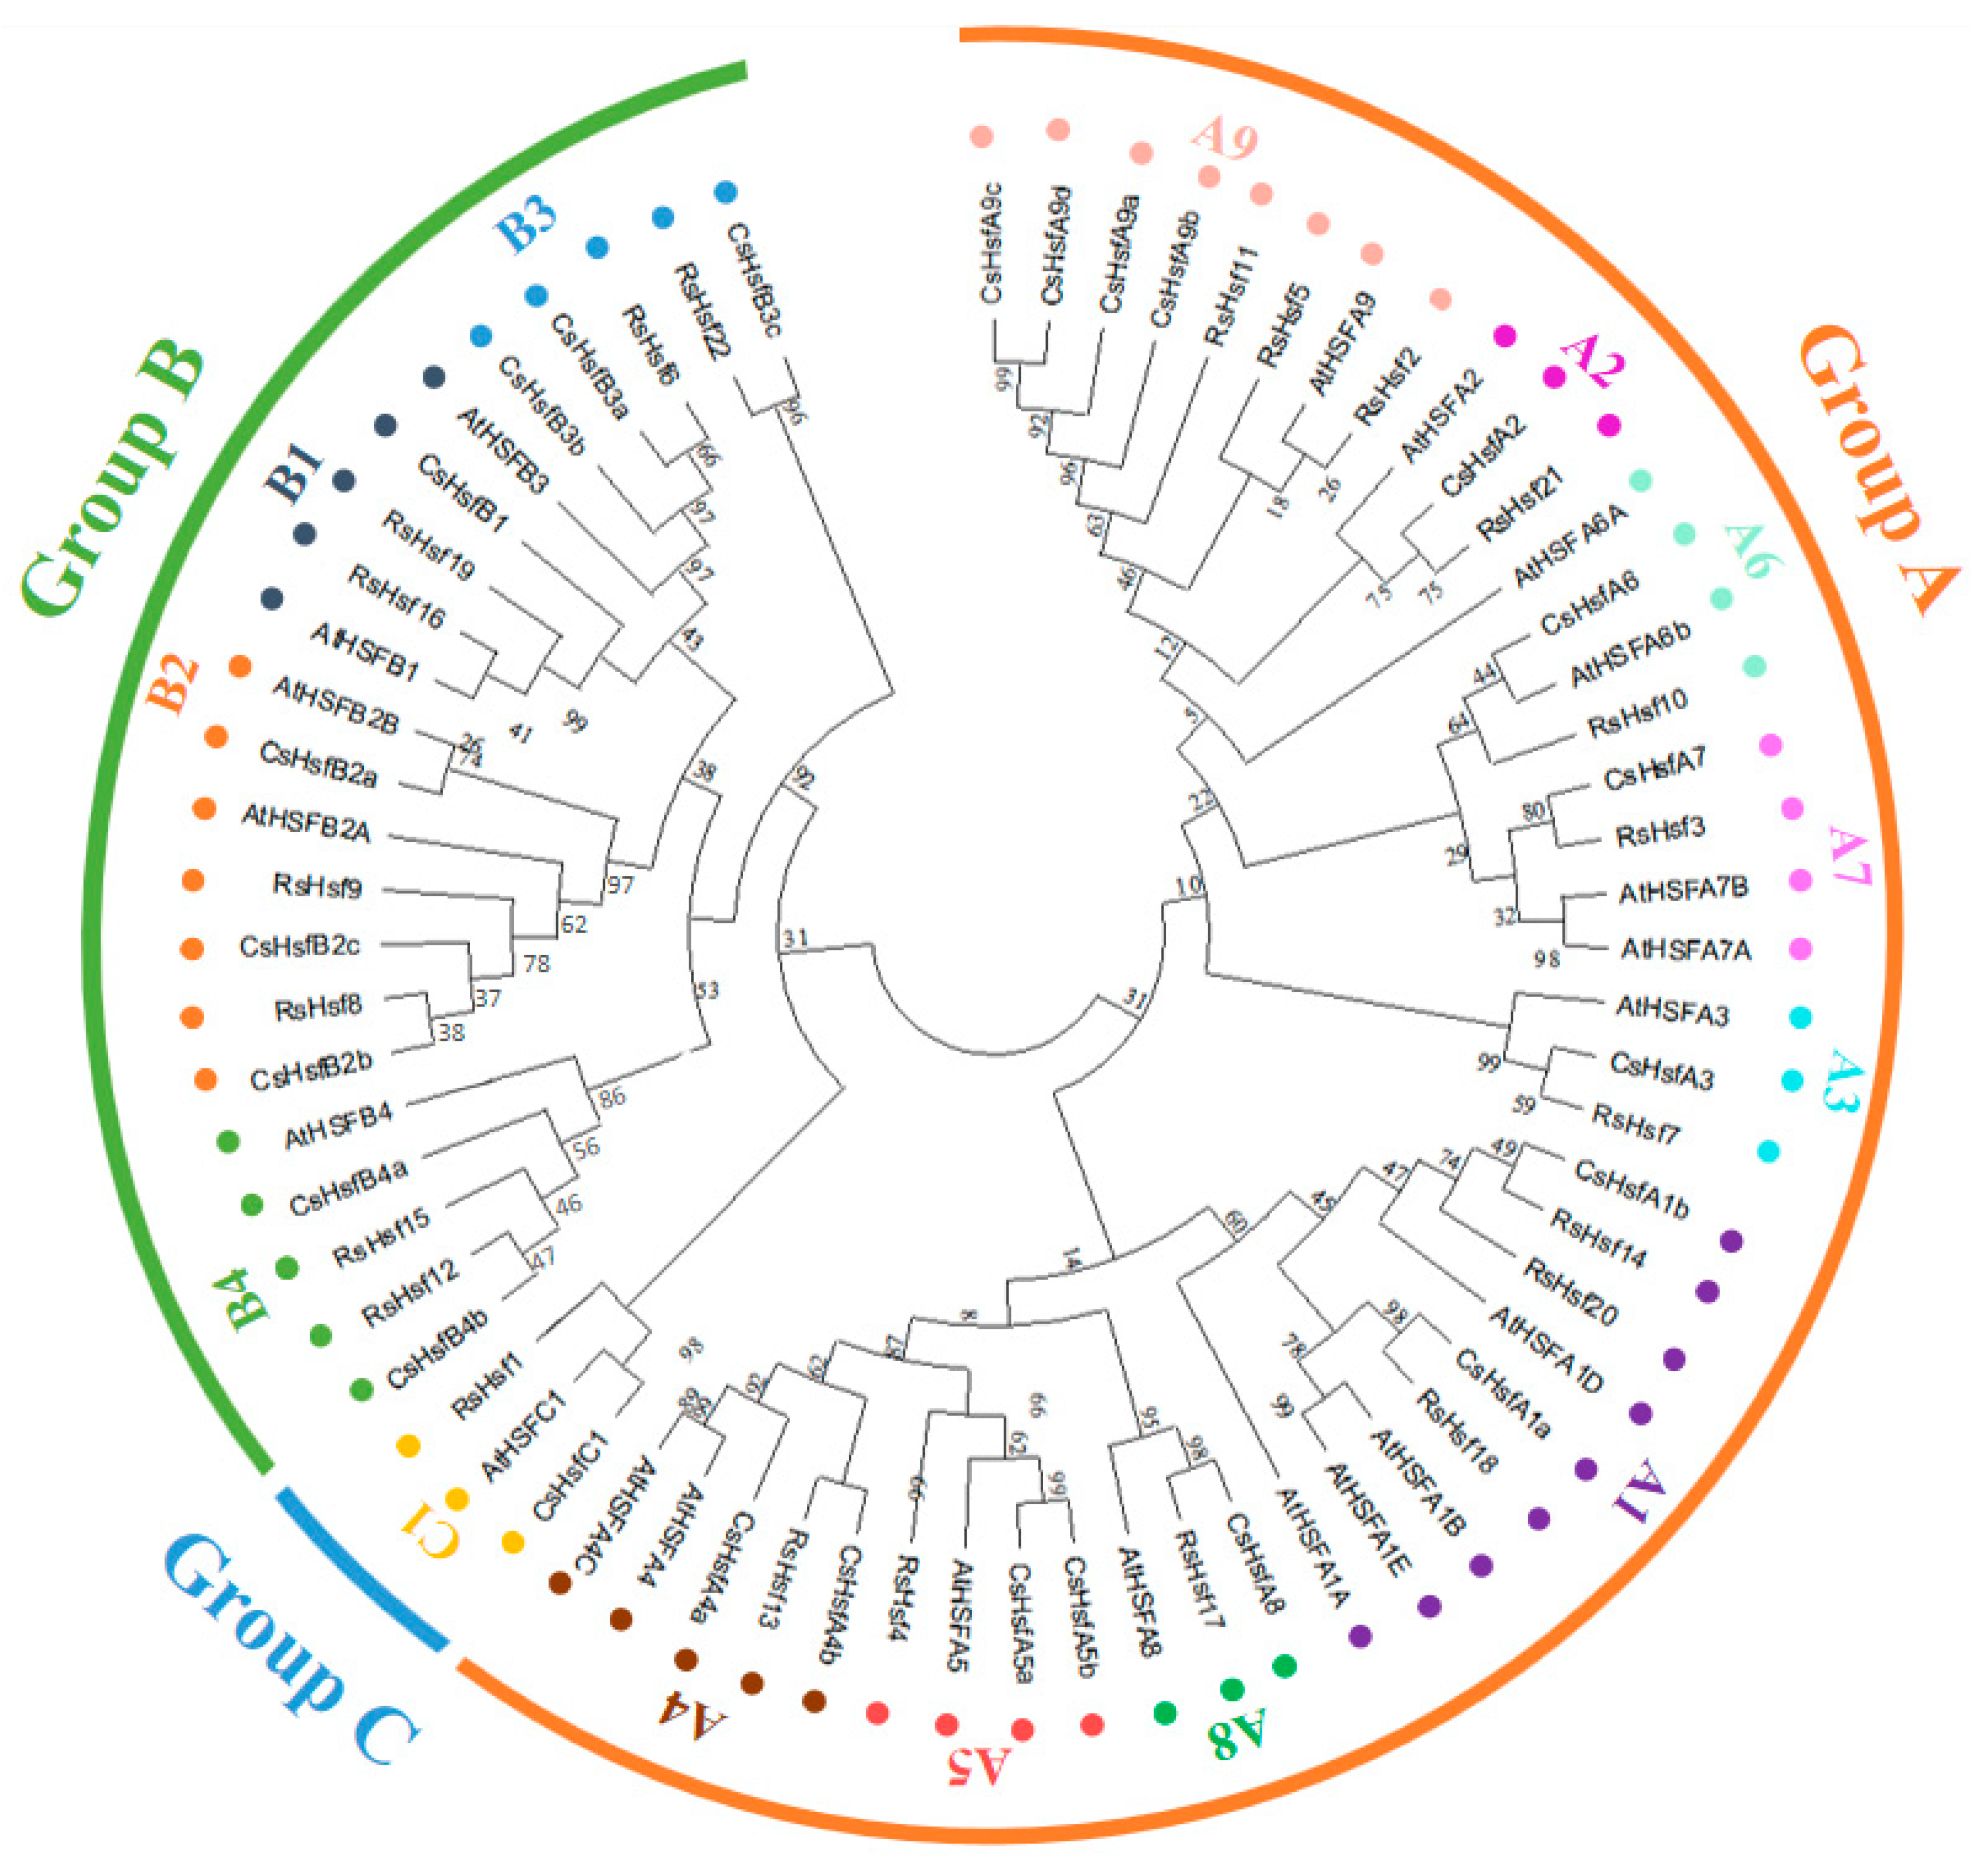
2.3. Phylogenetic Classification

To analyze the phylogenetic relationships of RsHsf proteins, we constructed a phylogenetic tree consisting of 22 RsHsf proteins, 25 CsHsf proteins and 21 AtHsf proteins (Figure 2). Based on the well-established classification of AtHsfs in A. thaliana, the RsHsfs were divided into three major groups: A, B and C. These groups were further subdivided into 14 subgroups. Group A had the largest number of proteins, and had nine-subgroups A1–A9, with 14 proteins in total. Group B had four subgroups B1–B4, with seven proteins: RsHsf6, RsHsf8, RsHsf9, RsHsf12, RsHsf15, RsHsf16 and RsHsf19. Group C was a separate clade with a single RsHsf member, which was strongly associated with group A.

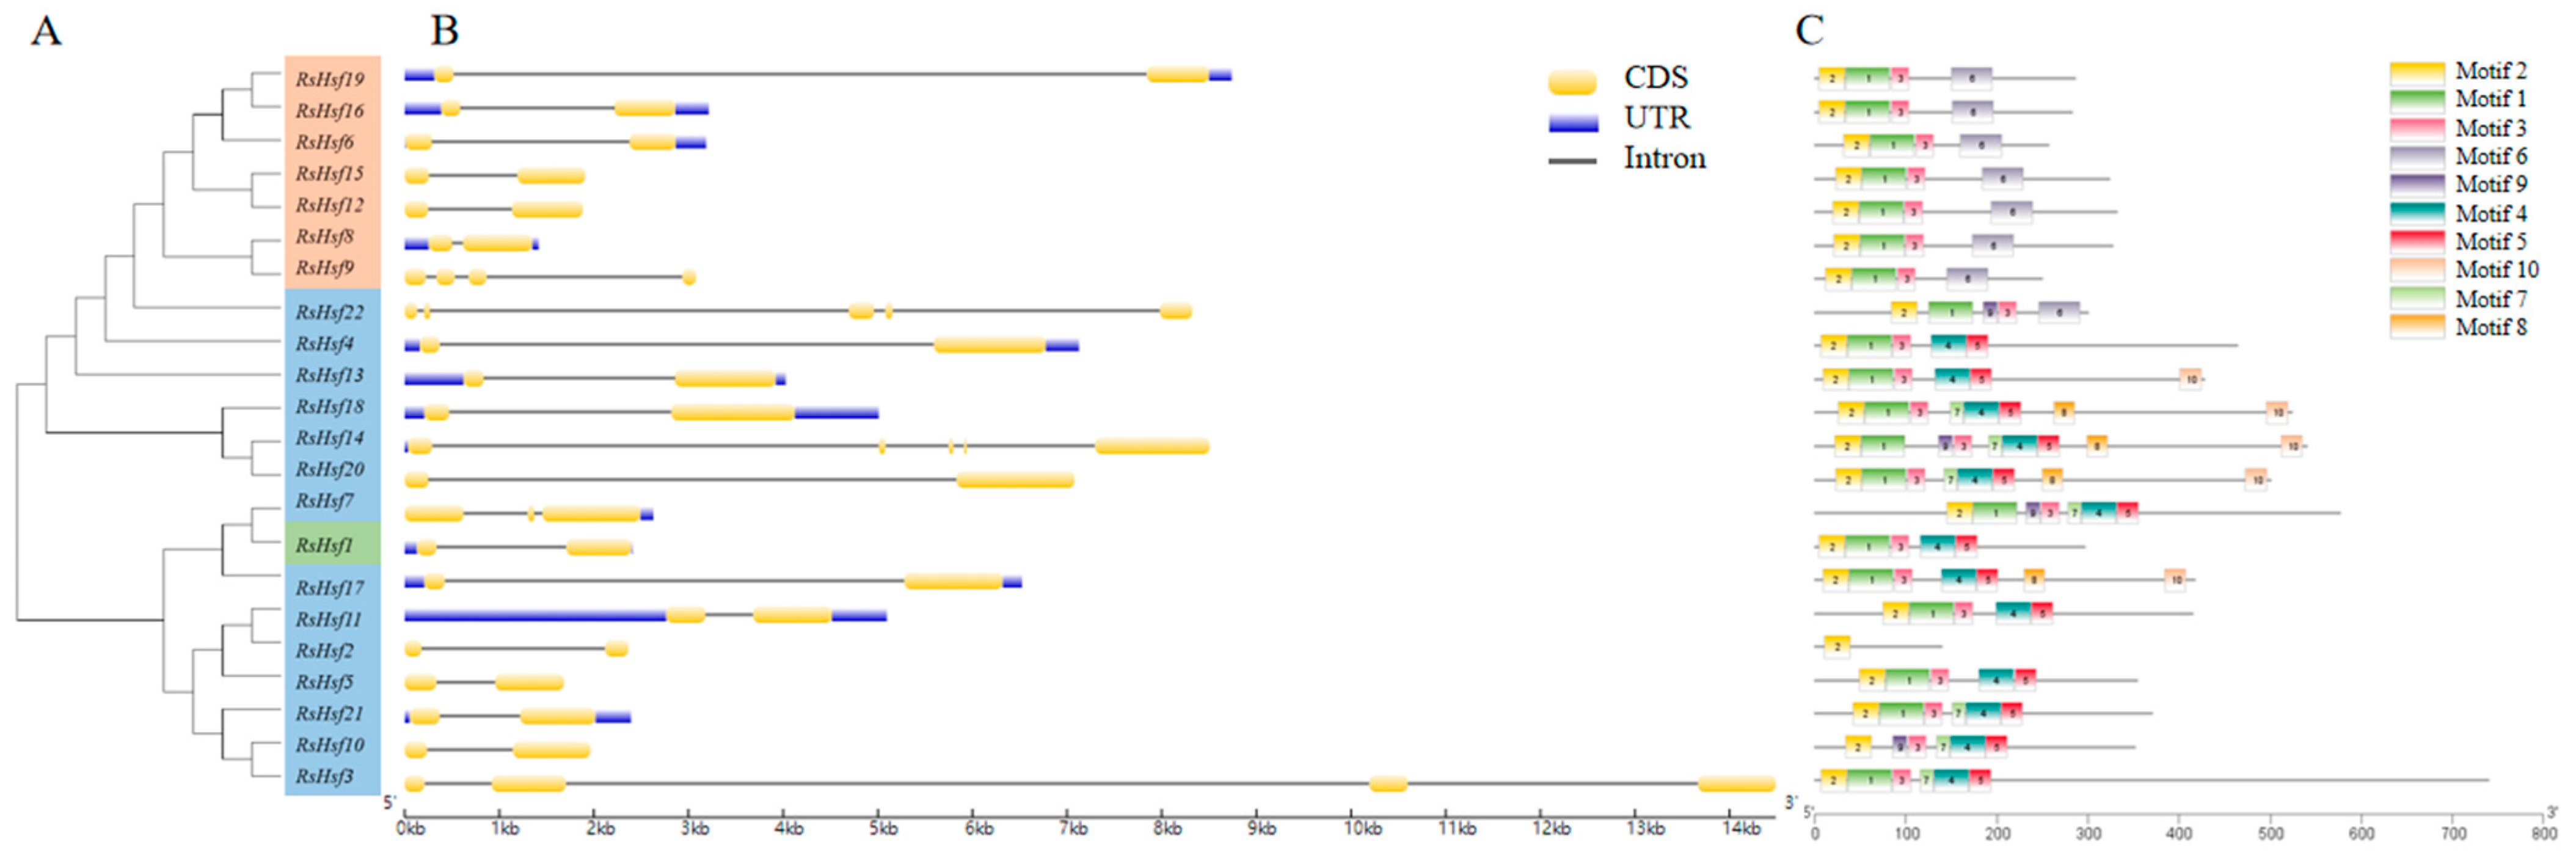
2.4. Gene Structure and Conserved Motifs

The structural diversity of the RsHsf family was analyzed in terms of the exon/intron arrangement of the coding sequences via GSDS (Figure 3) [27]. RsHsfs in the same group typically had similar numbers of introns. Group A members contained one to four introns. All group B members had one introns, except RsHsf14, which had three. The single member of group C had one intron. Among the members of group A, RsHsf14 and RsHsf22 had the largest number of introns (4). RsHsf3 and RsHsf9 each contained three introns, and RsHsf7 contained two introns.
Next, the conserved motifs were predicted. Ten conserved motifs were identified, with lengths ranging from 16 a.a. to 49 a.a, as shown in (Figure S1). All members showed similar motif composition, but there were small differences among the different groups. Among the predicted motifs, motif 1, motif 2 and motif 3 were the most widely distributed and highly conserved. Some motifs were only present in certain groups. For instance, motif 6 was present in all members of group B, but was also present in RsHsf22 in group A. Motif 4 and motif 5 were present in group A and group C, but not in group B. These findings suggested that the structure of RsHsfs is highly conserved, and the complex structure and specific motifs of RsHsf members in different groups may have led to the diversification of protein functions.

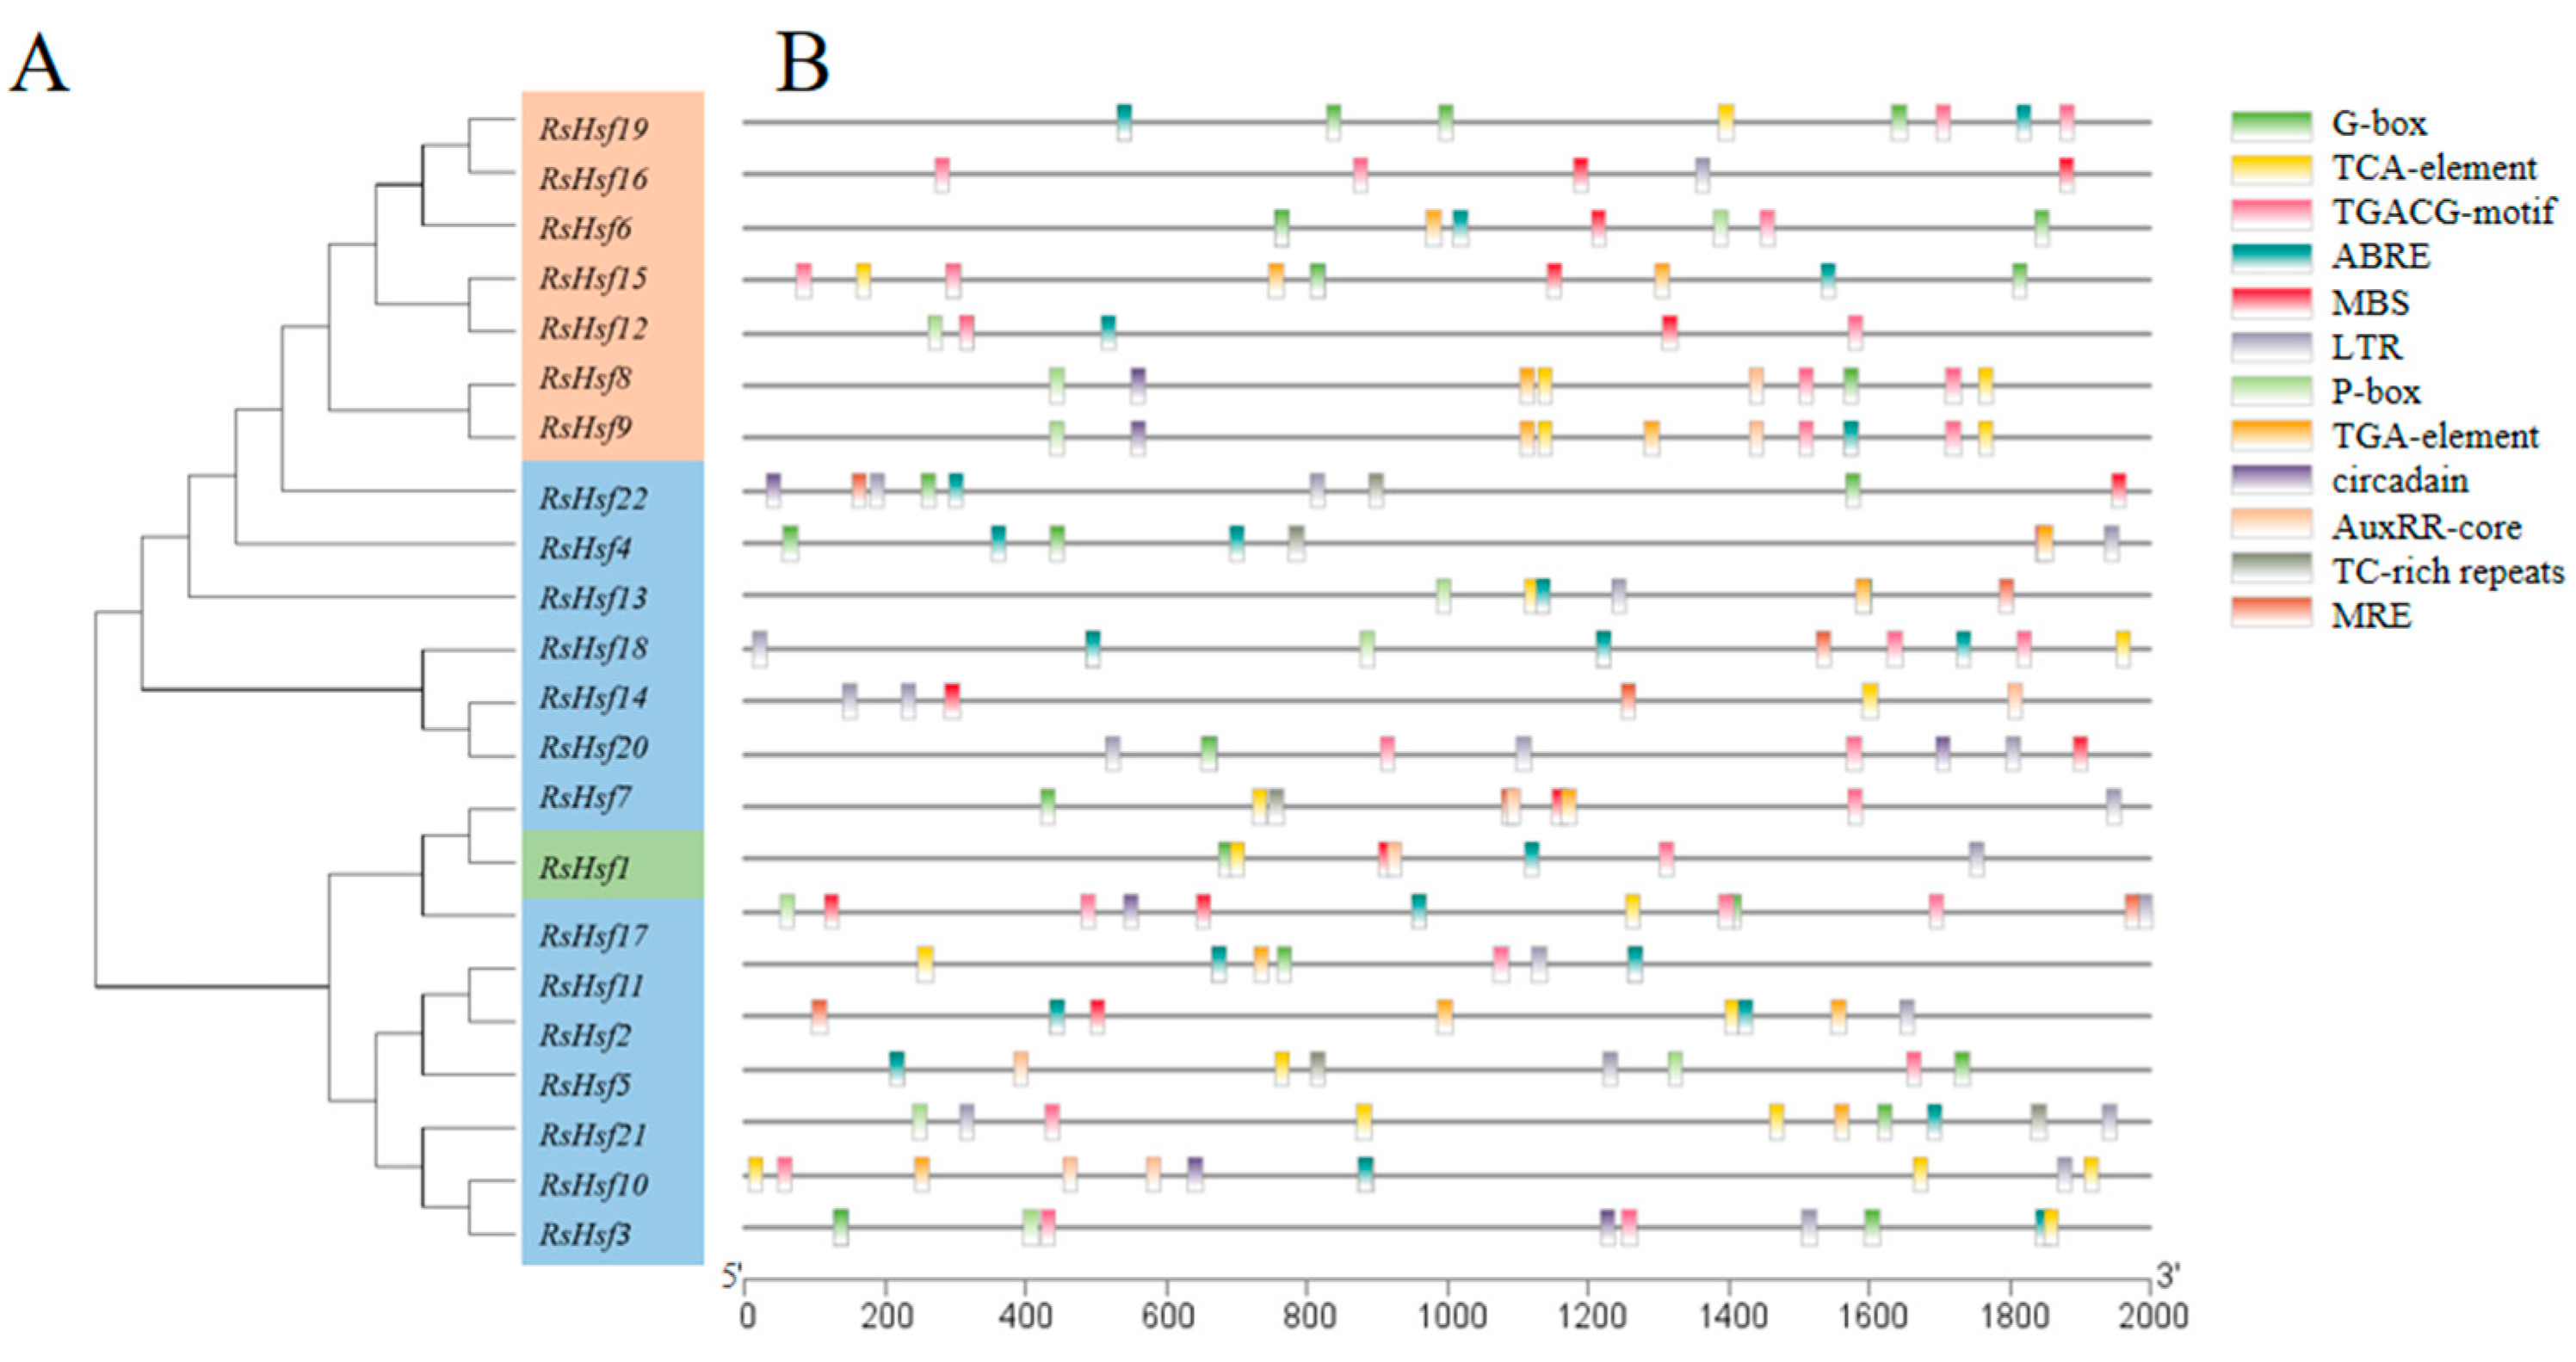
2.5. Promoter Analysis

To explore the regulatory mode and potential functions of RsHsfs, we extracted the 2-kb promoter region upstream of the initiation codon of each gene and used PlantCARE to search for cis-acting elements (Figure 4). This analysis revealed 12 cis-acting elements in three categories: phytohormone-response elements (ABRE, TCA-element, P-box), stress-response elements (TC-rich repeats, MBS, circadian, LTR) and light-response elements (G-box, MRE). Phytohormone-response elements were most frequently detected, indicating that RsHsfs may be associated with multiple phytohormone signaling pathways. All RsHsf promoter regions contained different types of cis-acting elements, indicating that they play essential roles in growth and development and in stress responses.

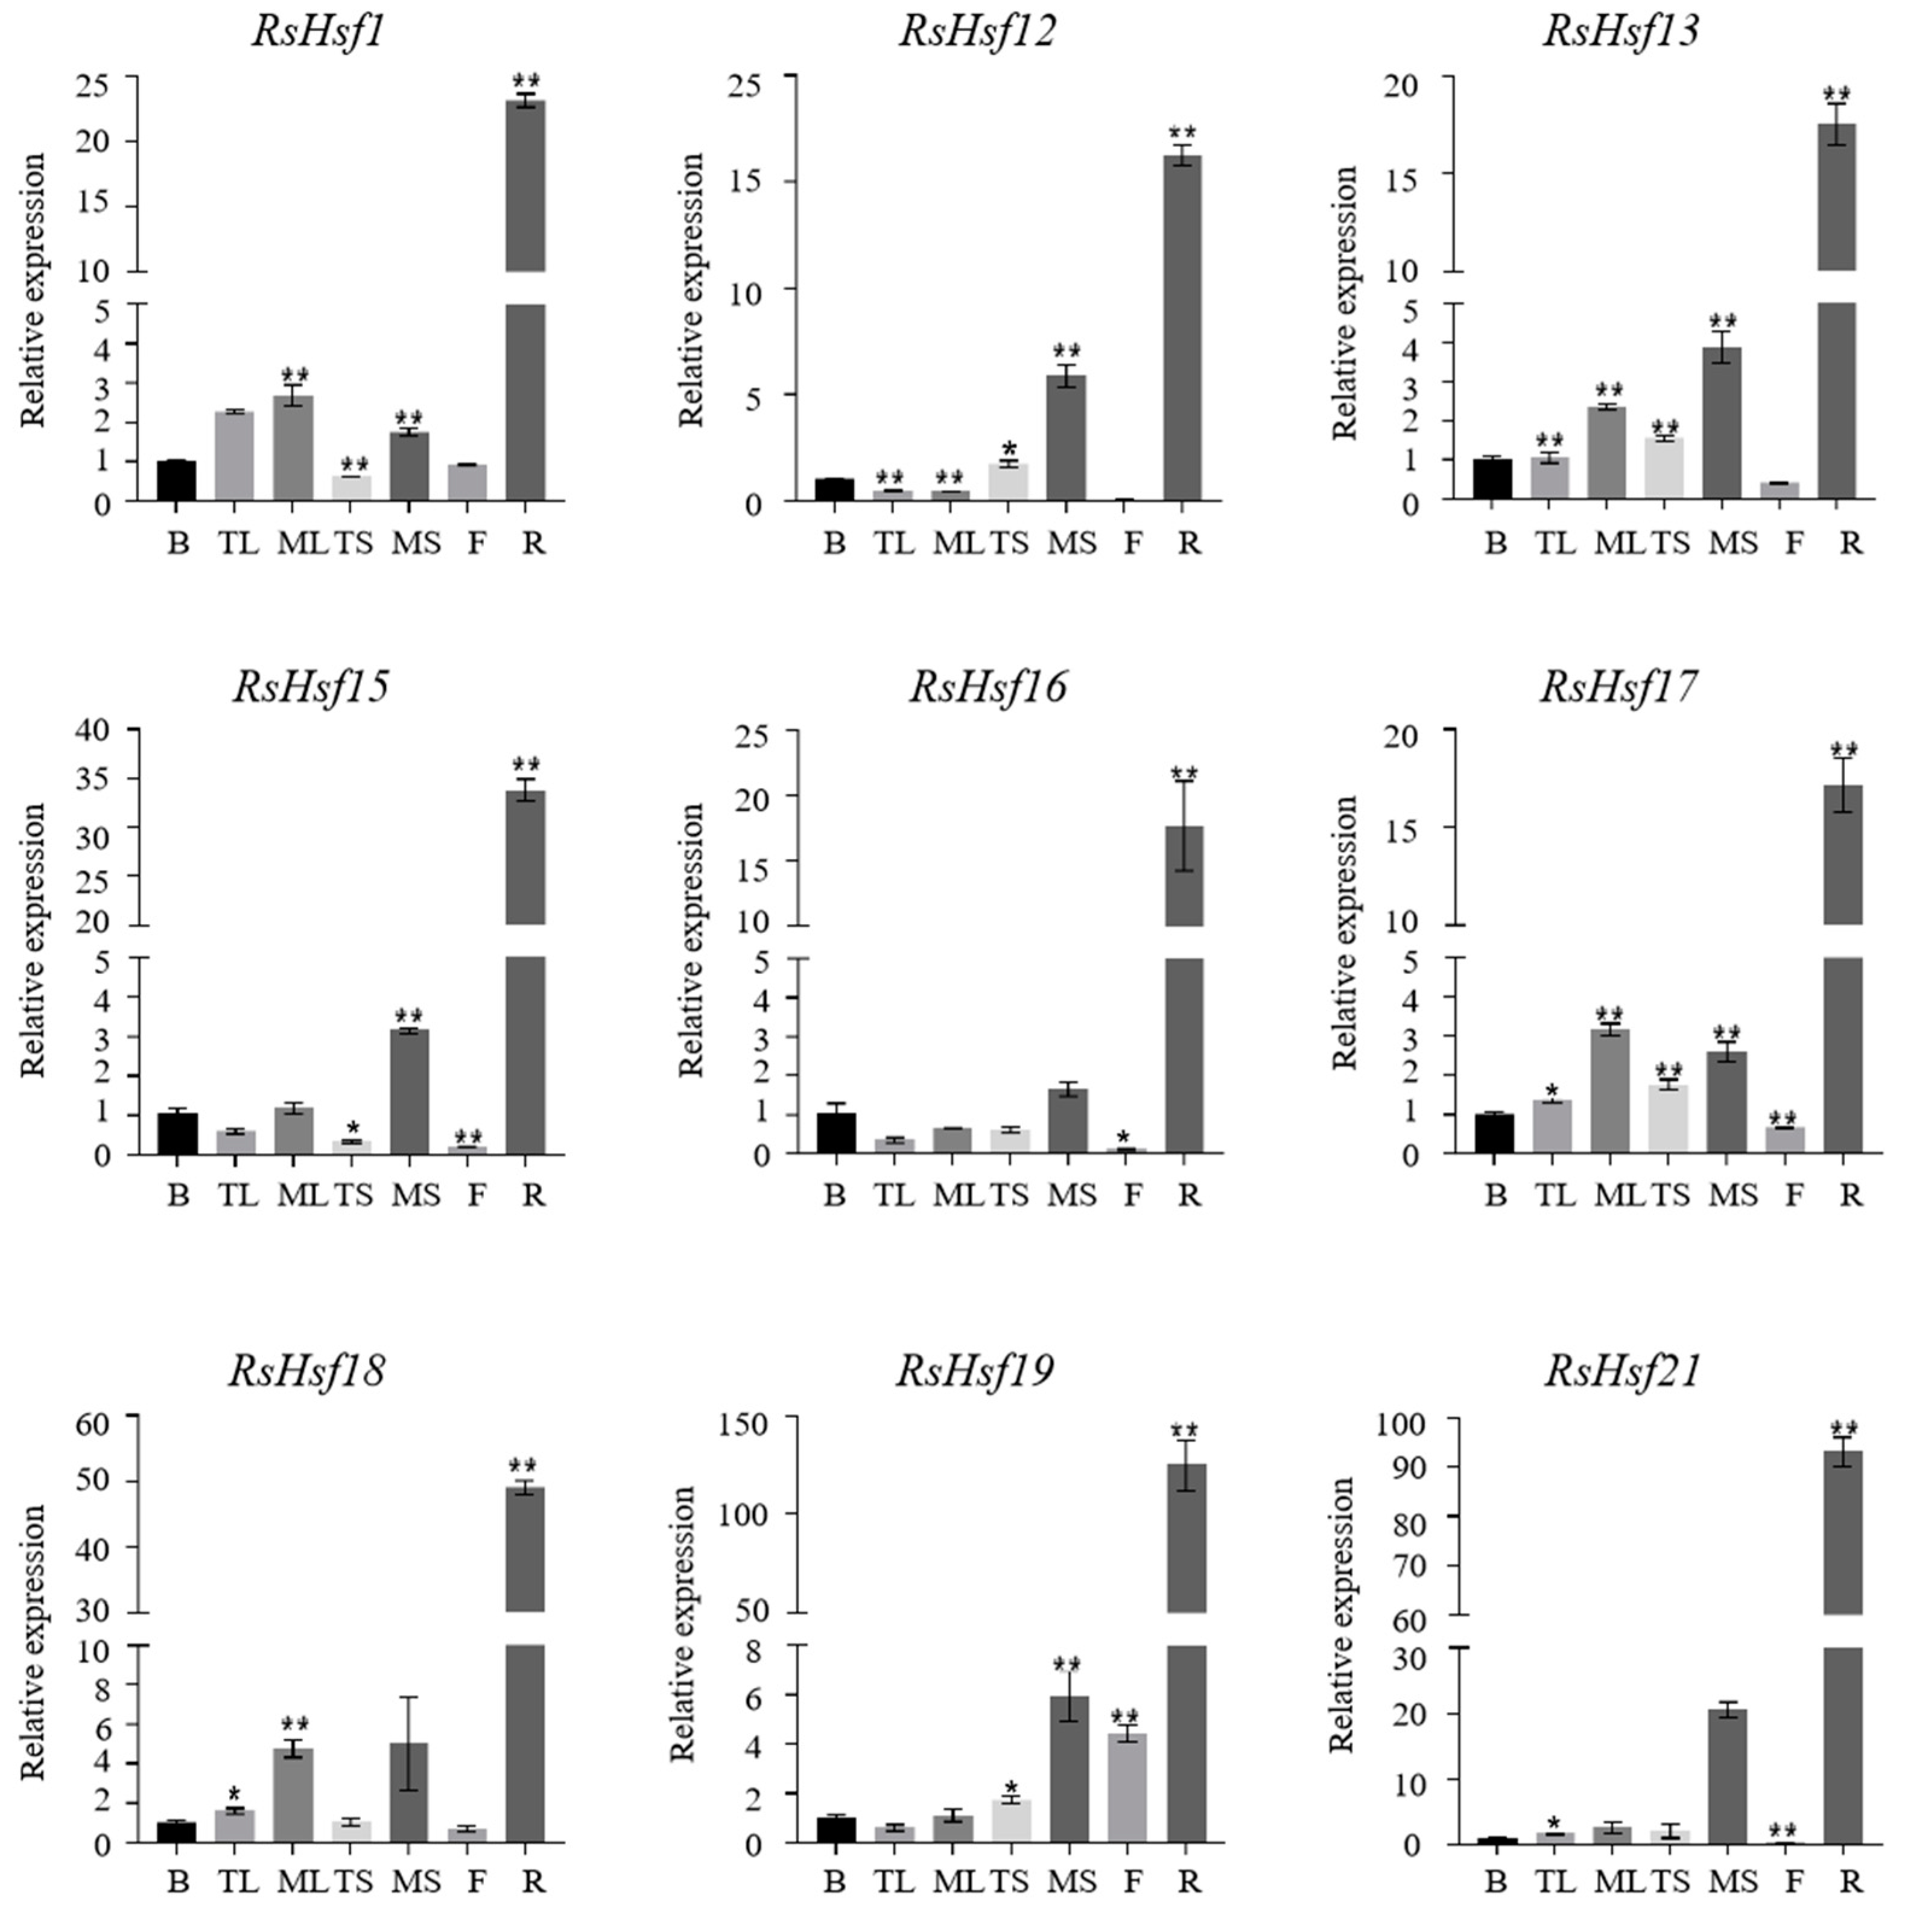
2.6. Tissue-Specific Transcriptional Profiles of RsHsfs

Gene expression patterns can reflect the potential functions of their encoded products to some extent. Based on the sequences of RsHsfs, nine genes were randomly selected for qRT-PCR to analyze their transcriptional profiles in seven different tissues (buds, tender leaves, mature leaves, tender stems, mature stems, flowers, roots) (Figure 5). There were some differences in transcriptional profiles among these genes, indicating that they showed tissue-specific transcriptional patterns. This suggested that RsHsfs have a range of functions in physiological and developmental processes. For example, RsHsf18 transcript levels were relatively high in the mature leaves and mature stems, the transcript level of RsHsf19 in flowers was significantly higher than those of the other genes, and RsHsf21 transcripts were detected in mature stems. Interestingly, the nine genes showed similar transcriptional profiles, with the highest transcript levels in the roots and the lowest in the flowers. Because all of the tested genes showed high transcript levels in the roots, we speculated that RsHsfs may be closely associated with the regulation of gene expression in the roots.

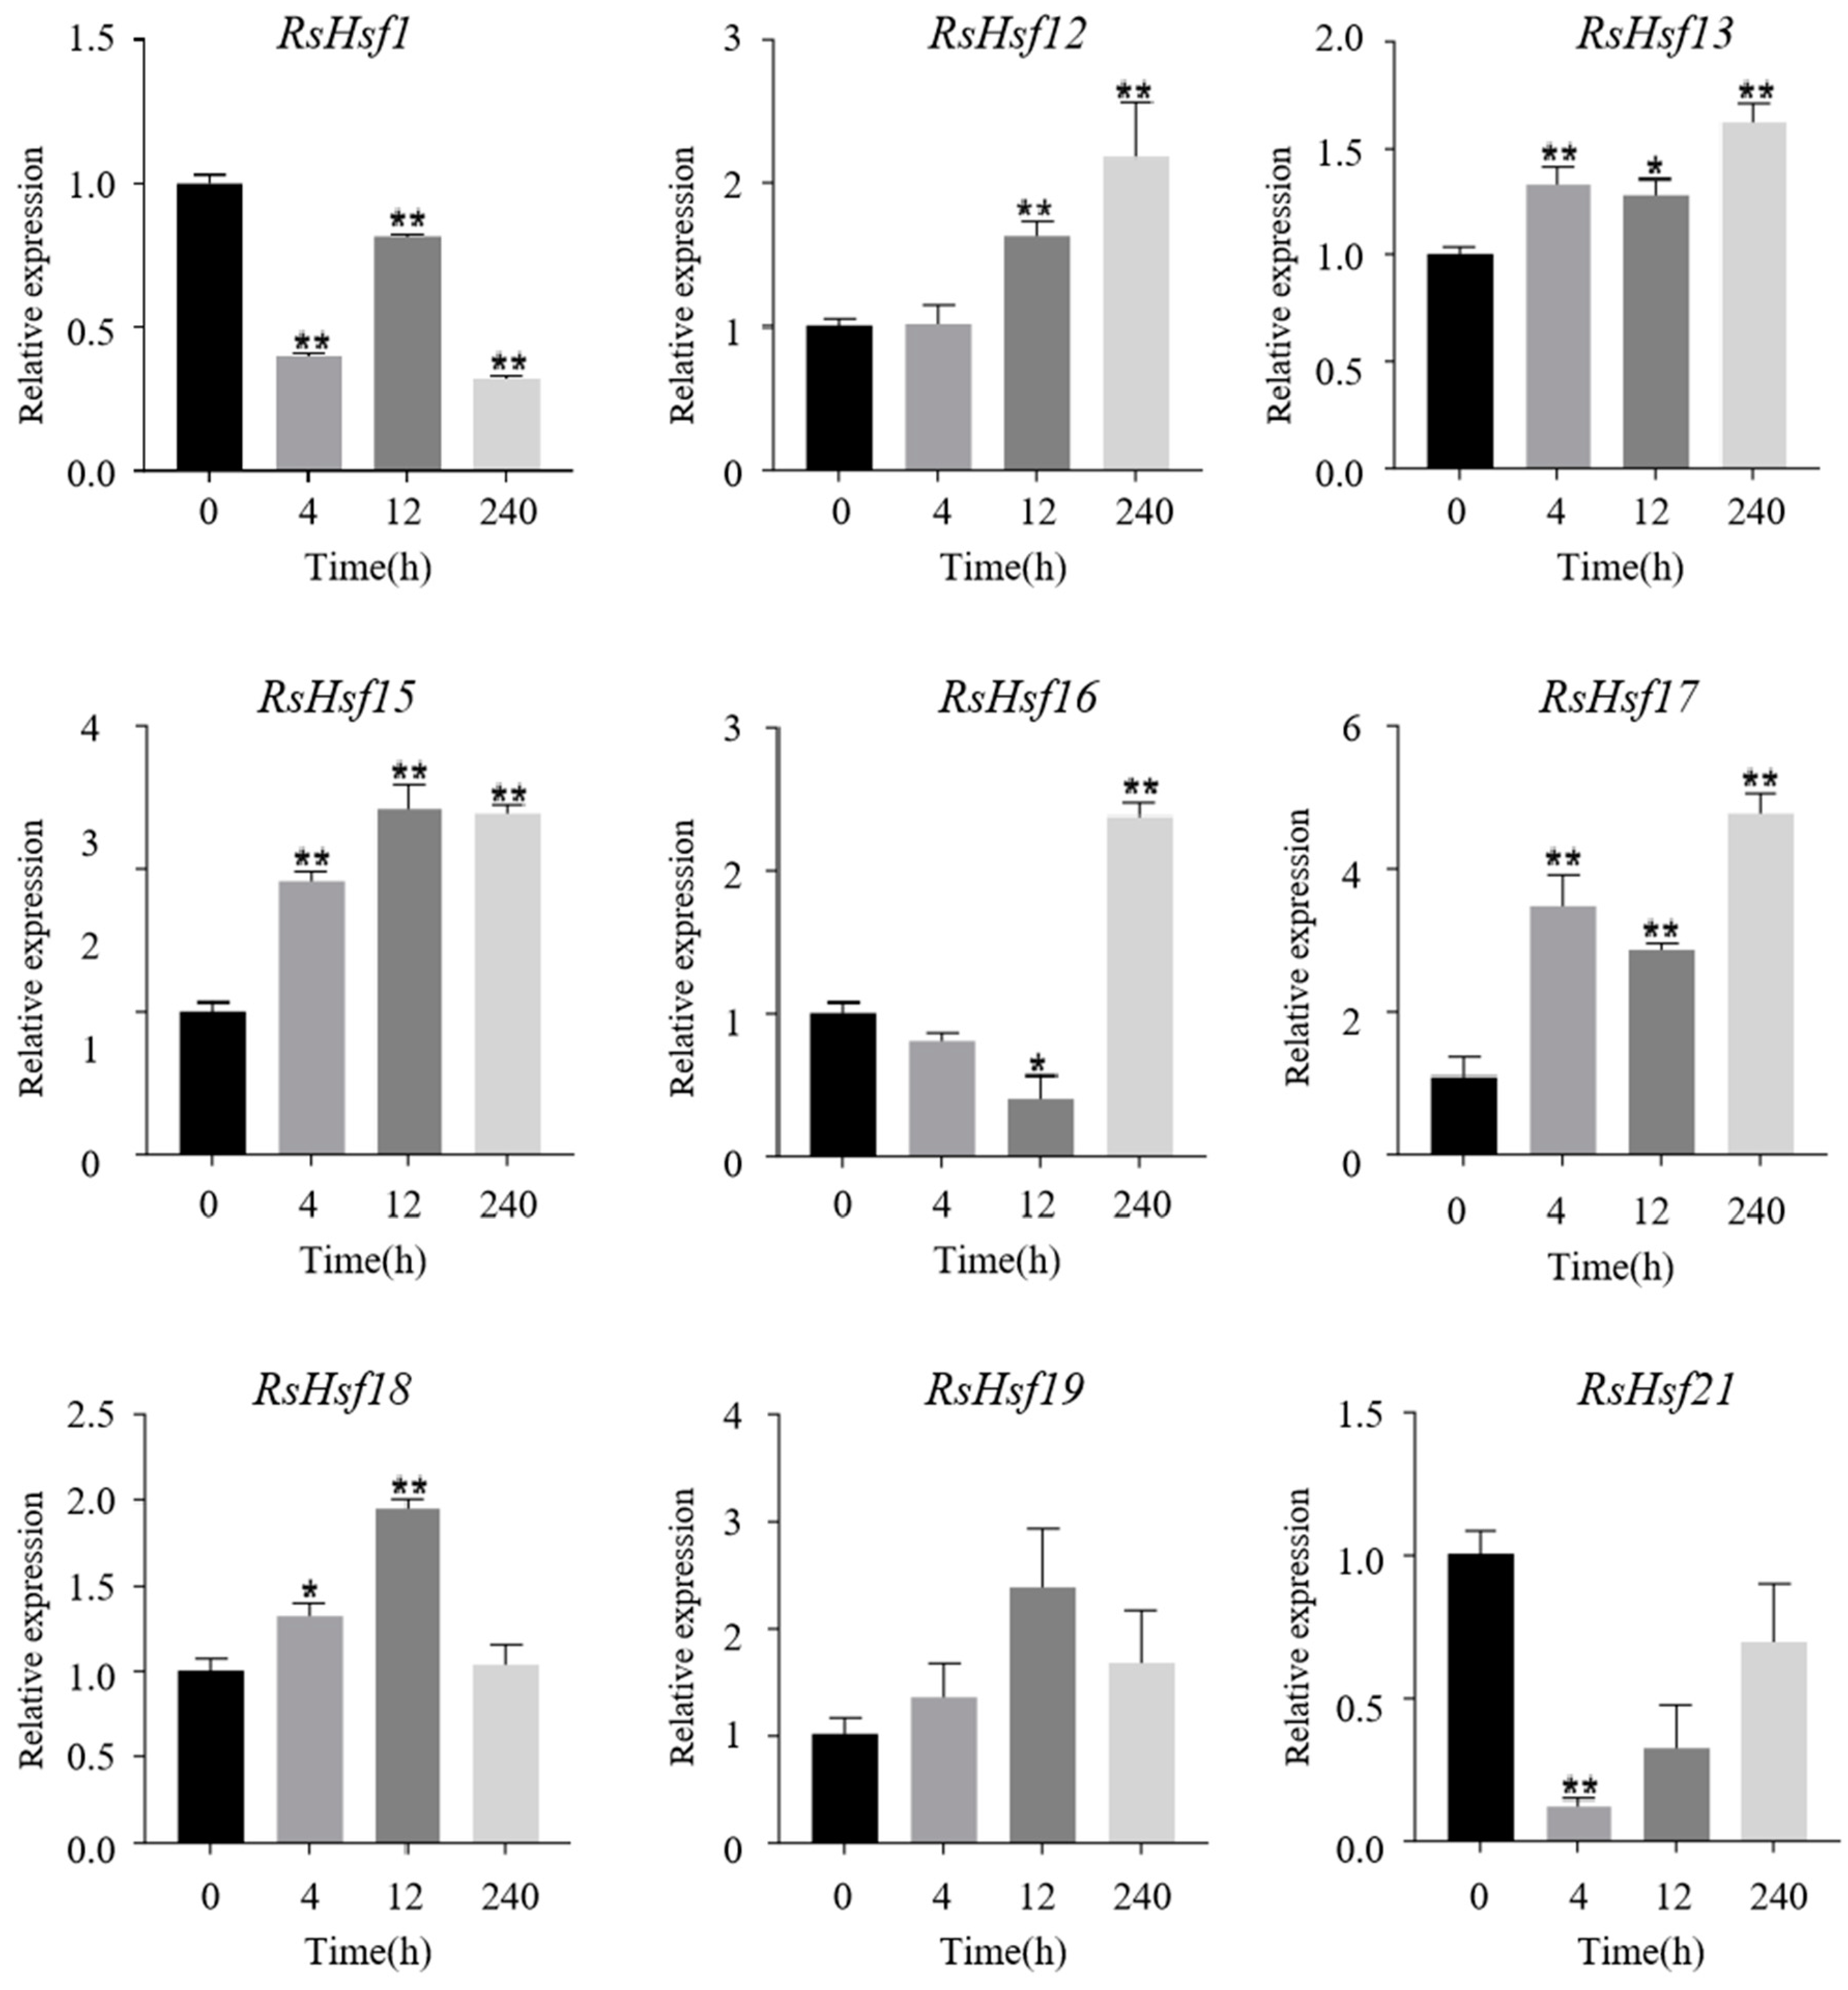
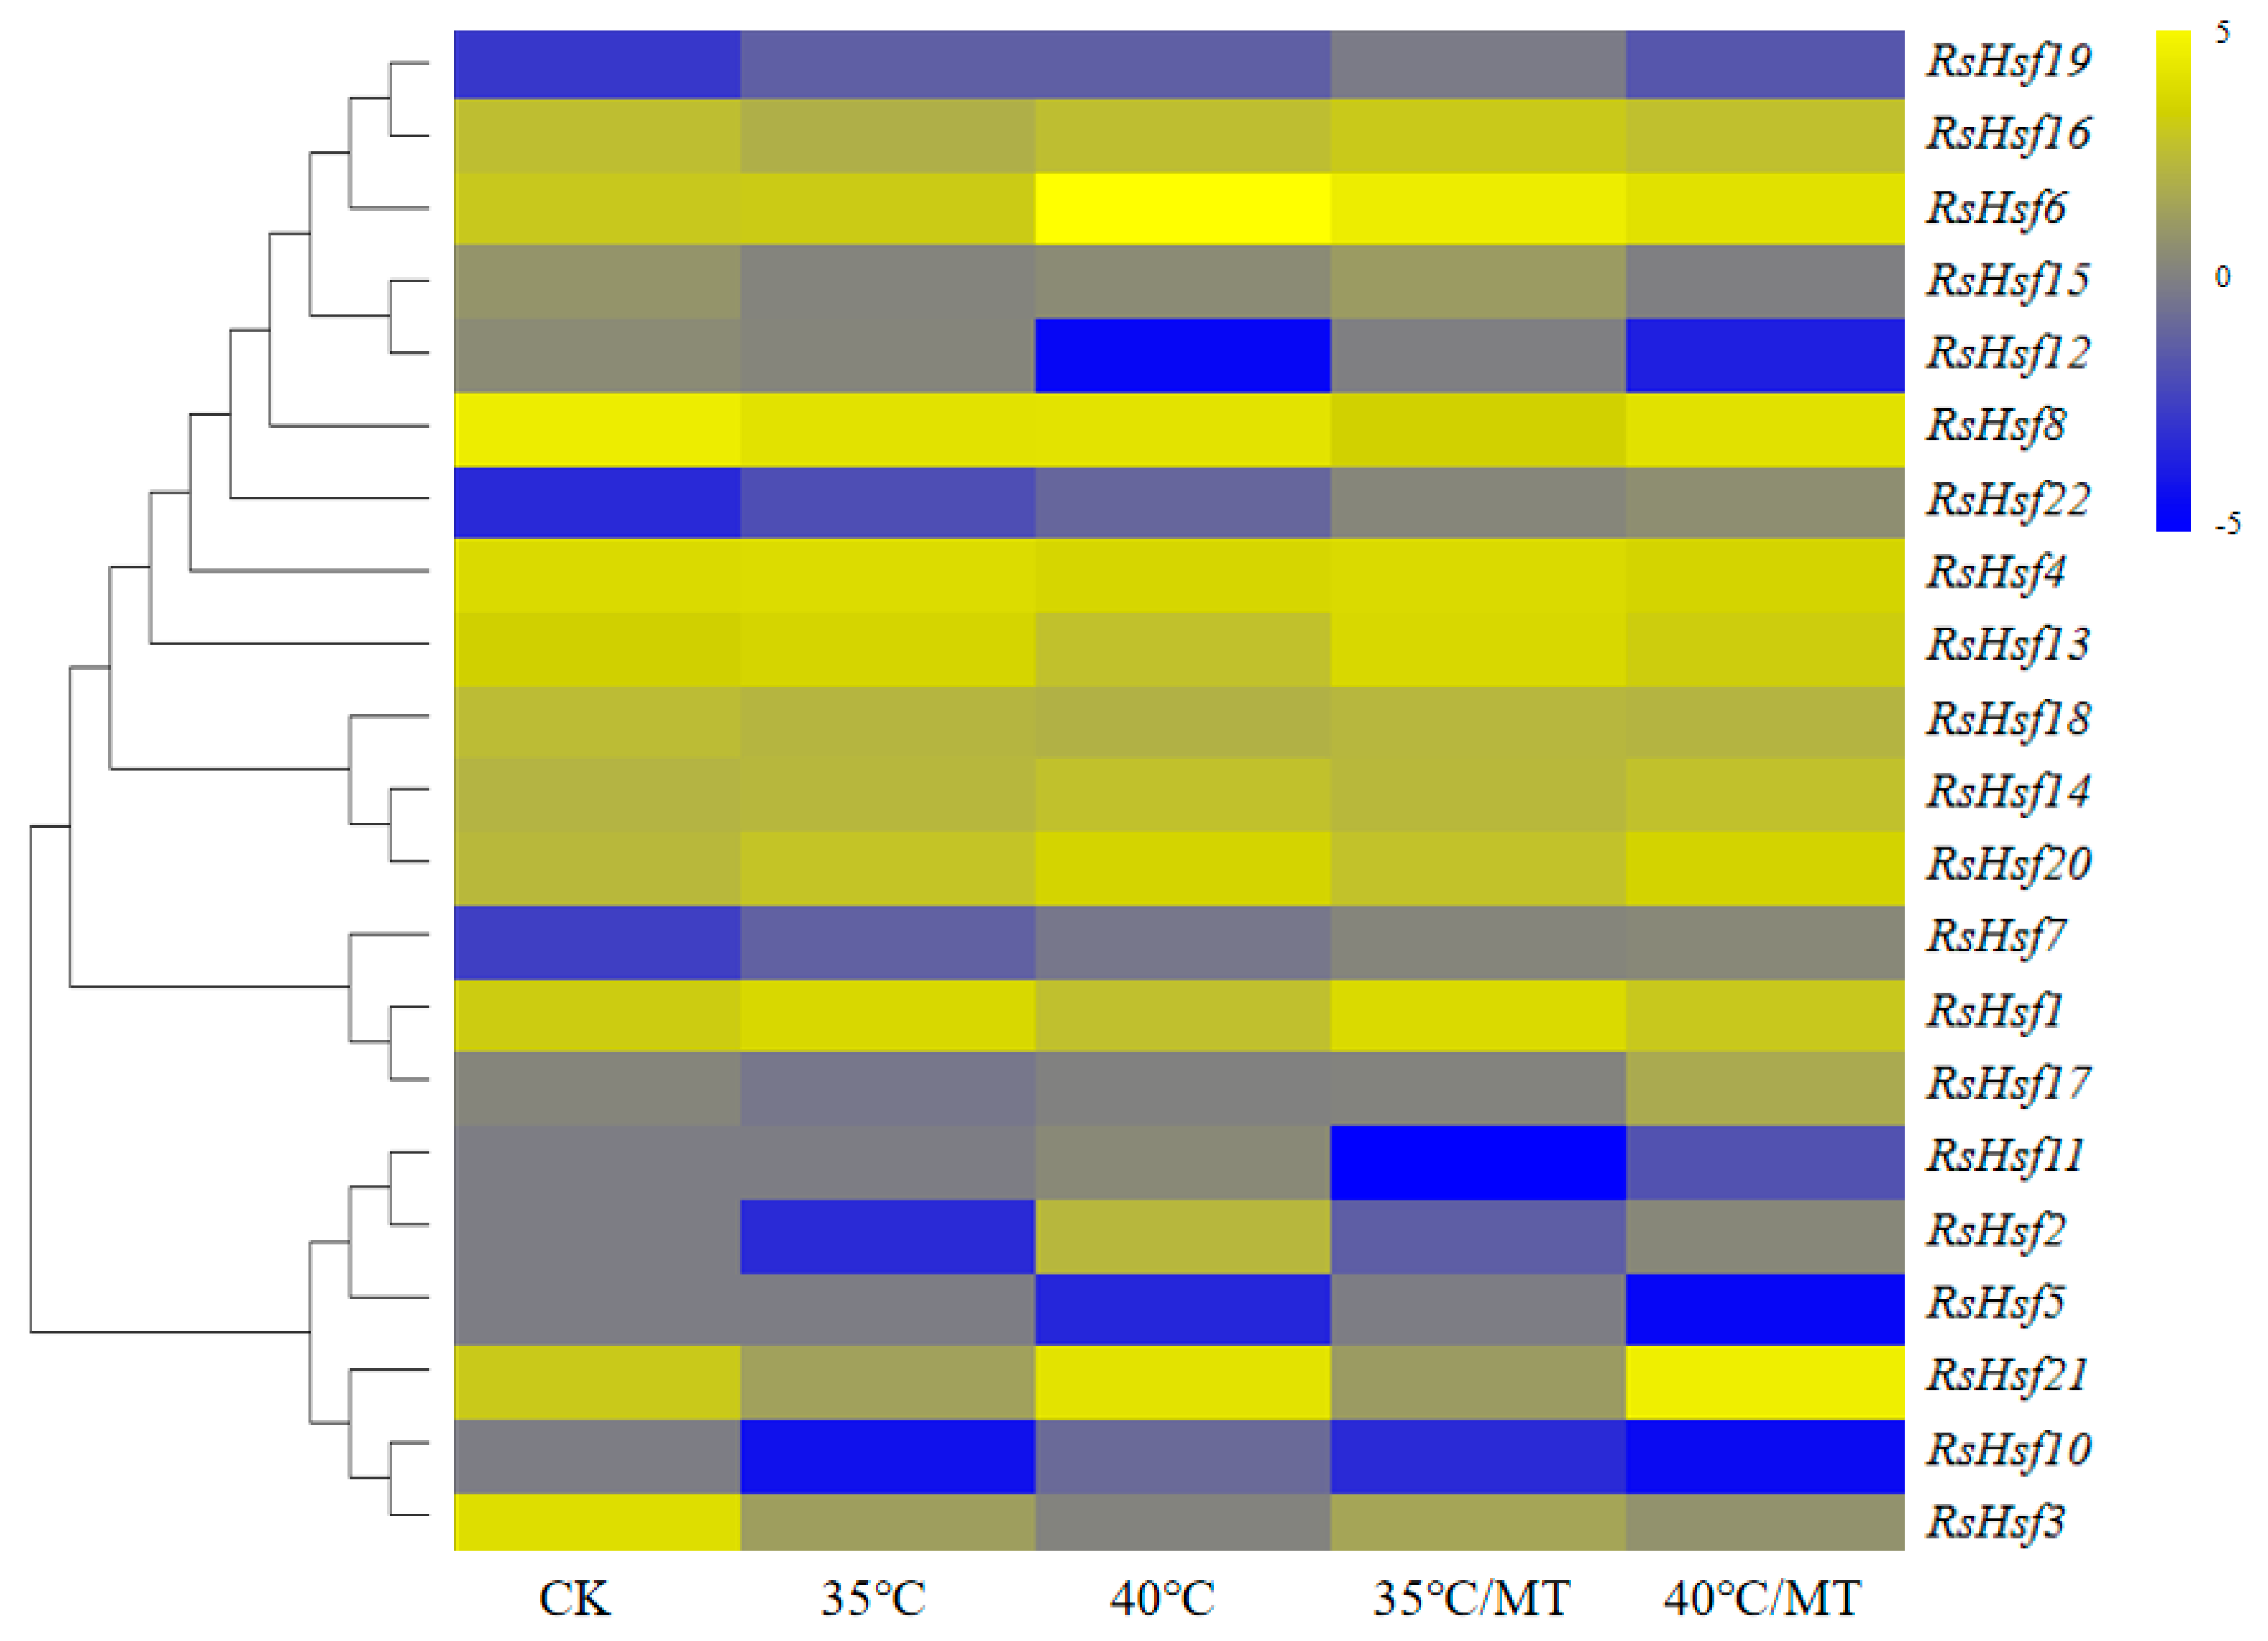
2.7. Transcriptional Profiles of RsHsfs under Abiotic Stresses

To detect the responses of Hsfs to drought stress, we detected the transcript levels of their encoding genes in R. simsii leaves under drought treatment at four time points (0 h, 4 h, 12 h, and 240 h). Most of the genes showed changes in their transcript levels, compared with that at 0 h, but there were differences in the trends in their expression (Figure 6). Under drought stress, RsHsf1 and RsHsf21 were down-regulated, whereas the other genes were up-regulated. The transcript levels of RsHsf12, RsHsf13, RsHsf15, RsHsf16 and RsHsf17 peaked at 240 h of drought stress, at levels much higher than those at 0 h. Notably, nine out of six genes were up-regulated in the early stage of treatment (4 h and 12 h). The remaining genes were down-regulated in the early stage, but reached peak at 240 h. This suggested that these genes may less sensitive to drought.
Transcriptome data were utilized to analyze the transcriptional profiles of RsHsfs under heat and melatonin treatments (Figure 7). Most genes showed changes in their transcript levels under these treatments. Under heat stress, nine genes were up-regulated, four were down-regulated, and nine were not expressed or expressed at very low levels. Interestingly, transcripts of four genes, RsHsf2, RsHsf5, RsHsf10 and RsHsf11, were not detected under normal conditions. However, these genes were strongly regulated under heat stress. Melatonin (N-acetyl-5-methoxypteramine, MT) is an important exogenous growth regulator in plants that mitigates the deleterious effects of various stresses [28,29]. We found that 10 genes were differentially expressed after exogenous application of melatonin under heat stress, compared with their respective transcript levels in melatonin-free rhododendron plants.

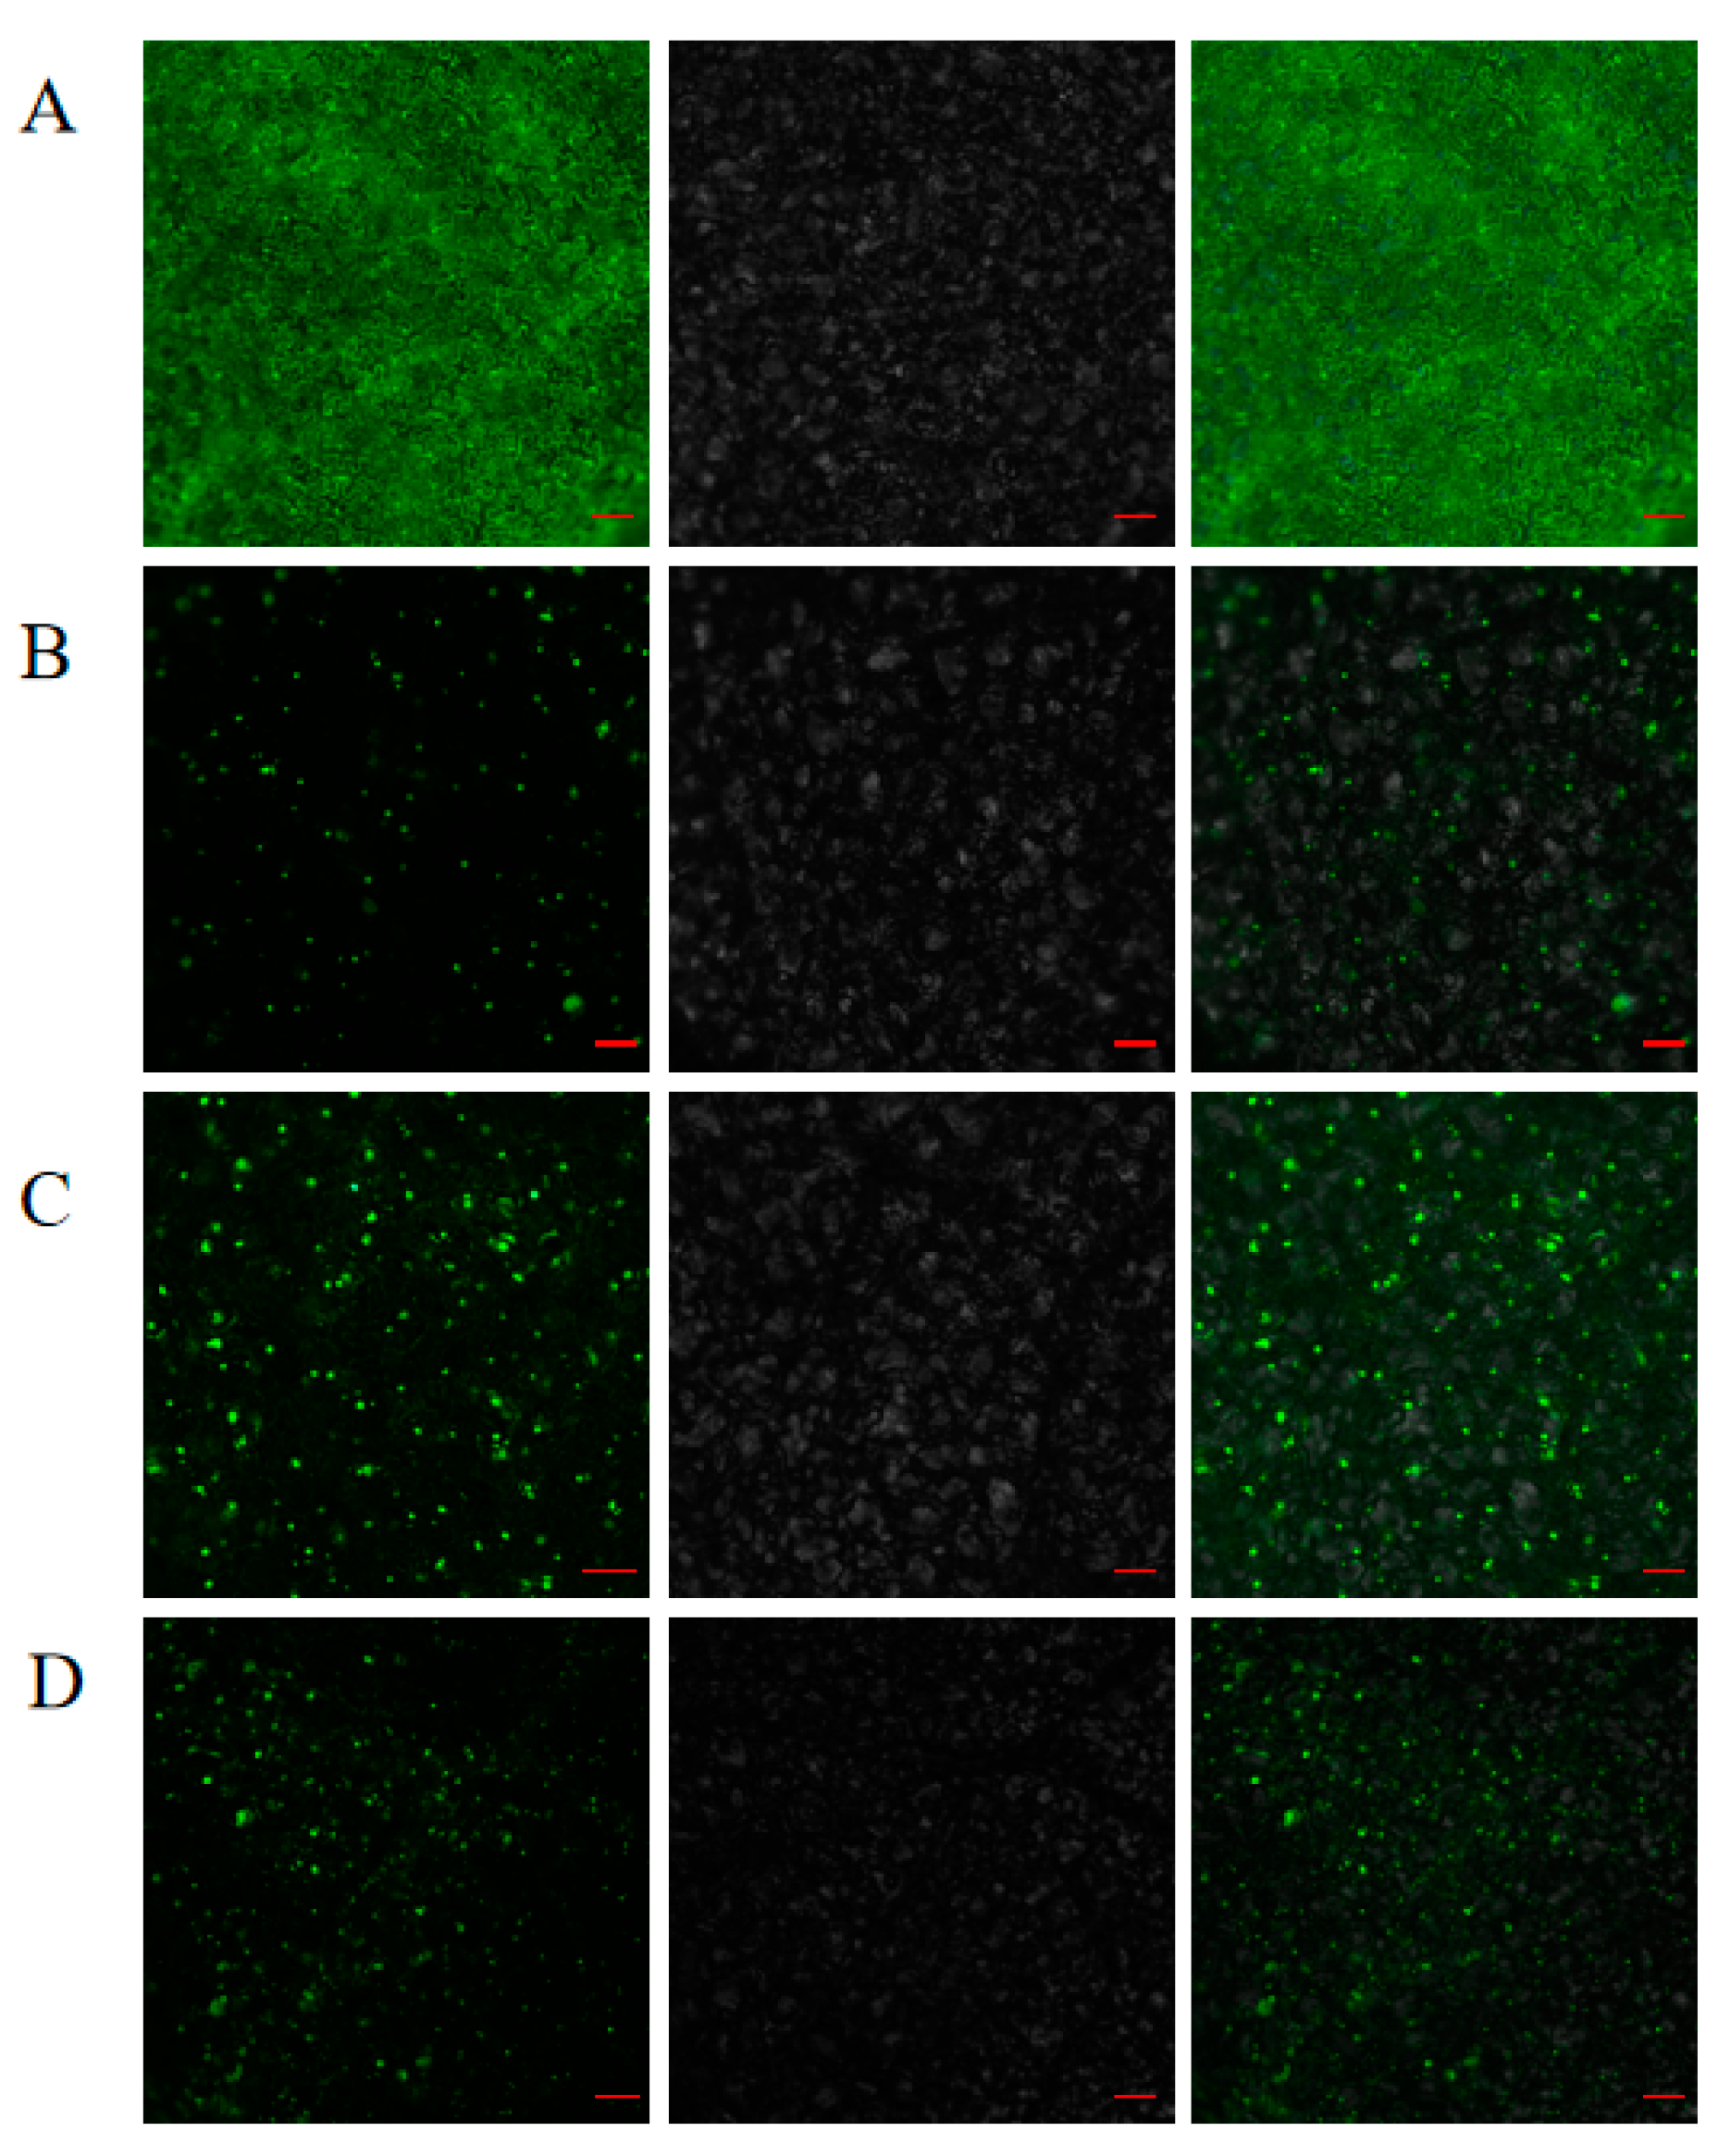
2.8. Subcellular Localization Analyses

To investigate the distribution of RsHsfs in cells, three genes (RsHsf15, RsHsf16 and RsHsf19) were selected for transient expression analyses (Figure 8). The recombinant plasmids were transiently expressed in tobacco leaves, with 35S-GFP as the control. The 35S-GFP signal was distributed throughout leaves uniformly, while fluorescence signals from the target gene products were presented in the nucleus. This confirmed that RsHsf15, RsHsf16 and RsHsf19 localized to the nucleus.

3. Discussion

Heat shock transcription factors are key transcription factors in plants involved in signaling and response to stress [12]. Analyses of Hsf families have been conducted for more than 20 plant species to date [30]. There are 21 Hsf-encoding genes in A. thaliana [8], 24 in tomato [4], 25 in pepper [31], 27 in potato [32], and 25 in C. sinensis [33]. The number of Hsf family genes differs widely in different species. To date, no previous studies have identified or functionally characterized Hsfs in Rhododendron. In this study, 22 genes were identified in the R. simsii genome, similar to the numbers reported in the plants mentioned above. This may be related to the fact that they are dicotyledonous plants with close genetic relationships and conserved evolution. Subcellular localization showed that RsHsf15, RsHsf16 and RsHsf19 were all located in the nucleus, which was consistent with the reported research results of TaHsfA1 in wheat [34], FtHsf18 and FtHsf19 in Tartary buckwheat [35].
The sequences of plant Hsfs vary greatly, but the basic structure and promoter recognition mode are conserved. Hsfs normally contain five functional domains: a DNA-binding domain (DBD), an oligomerization domain (OD), a nuclear localization signal (NLS), a nuclear export signal (NES), and a C-terminal short activator peptide motif (AHA) [36]. Among these domains, the DBD is usually located at the N-terminal, which is the most conserved region and an essential characteristic of Hsf proteins. The DBD structure is a key identifying character of an Hsf protein. Only proteins with the complete conserved DBD structure are classified as Hsf family members [37].
Based on the differences in DBD and OD domains and their connecting parts, Hsf proteins can be classified into three major groups. In this study, the 22 RsHsfs were divided into three groups and 14 subgroups. Those in the same group were similar, but there were obvious differences among subgroups. In this study, the clustering method of RsHsfs was the same as that of AtHsfs [8]. Group A had the most members, and group C had the fewest. The lack of A7, A10, and C2 subgroups in R. simsii indicates that Hsf proteins have a common ancestor, but have constantly evolved in different species. Moreover, our results show that several subfamilies of RsHsf family are larger than that of AtHsf family, including subgroups A2, A5, B1, B4, implying that after the differentiation of these two species, the gene family has expanded more in R. simsii than in A. thaliana [38].
The signaling pathways in plants form a complex intertwined network, and the same transcription factors can participate in multiple signal transduction events. Cis-acting elements located in gene promoter regions are a crucial part of the signal transduction process, and such elements synergistically regulate gene expression to achieve particular physiological outcomes [39]. In this study, we detected a variety of cis-acting elements in the promoter regions, including ABREs, TCA-elements, and P-box elements. These findings indicate that RsHsfs may be regulated by several kinds of phytohormones. In addition, the presence of MBS, P-box, LTR, and other elements indicates that RsHsfs may be regulated by various abiotic factors. Numerous studies have demonstrated that Hsfs can enhance resistance to stress conditions, such as high temperature [40], salt [41], strong light [42] and oxidation [43]. Interestingly, no HSE elements were detected in these promoter regions, implying that these RsHsfs might not be directly induced by heat stress [27].
Exploration of gene expression patterns can shed light on the biological functions of their encoded products [44]. Therefore, we determined the transcript levels of 9 RsHsfs in different tissues. Several RsHsfs showed tissue-specific transcript profiles. For example, there were relatively high transcript levels of RsHsf18 in mature leaves and stems, and of RsHsf19 in flowers. This result indicated that Hsfs are extensively involved in the growth and development of different tissues and organs. Notably, the transcript levels of all RsHsfs were higher in the roots than in other tissues, consistent with their expression patterns in other plants. For example, in alfalfa, MsHsf06 and MsHsf15 were found to be expressed at higher levels in the roots than in other tissues [45], and the same expression pattern was detected in tea tree [46]. StHsf19, StHsf20, StHsf21, StHsf22, StHsf23 and StHsf24 of potato [32] were also found to be highly expressed in the roots, buds and tubers of vegetative organs, indicating that their encoded products participate in vegetative growth. In cassava, MeHsf18 transcript levels were found to be 10–20 times higher in the roots than in the leaves [47]. We speculated that the high transcript levels in roots may be because the roots are the first organ to be affected by changes in soil conditions.
We analyzed the transcript levels of nine genes under drought treatment, and found that seven of them (all except RsHsf1 and RsHsf21) were up-regulated. All these genes had MBS (drought-responsive) elements in their promoter regions. Co-expression of HaHsfA4a and HaHsfA9 genes in tobacco was shown to synergistically enhance the tolerance of transgenic seedlings to drought and oxidative stress [48]. Another study showed that HsfA1b controls certain aspects of drought tolerance and water balance in A. thaliana [49]. Notably, RsHsf2, RsHsf11 and RsHsf21 in the A2 subgroup appeared to be strongly induced by heat stress in the present study. HsfA2 is one of the most important heat shock transcription factors in heat tolerance, and it is expressed only under stress conditions [50]. It accumulates continuously during heat shock and recovery, and it can significantly improve heat resistance both in A. thaliana and tomato [51]. In maize, heat stress induces the expression of HsfA2-type genes; ZmHsf-01, ZmHsf-04 and ZmHsf-17 [10]. In the present study, the transcript levels of RsHsf2, RsHsf13, RsHsf17 and RsHsf18 increased under drought stress, implying that these genes participate in both heat and drought stress responses.
Melatonin is a multifunctional molecule involved in signaling. It is found widely throughout the biosphere. In plants, it has a crucial role in stress resistance and diurnal regulation. Exogenous application of melatonin or accumulation of endogenous melatonin can mitigate damage caused by biotic or abiotic stresses [52], such as high temperature [53], strong light [54], and salt [55]. Recently, we reported that exogenous melatonin can improve the heat tolerance of Rhododendron [29]. Photosynthesis is highly sensitive to heat stress. Exogenous melatonin can ameliorate the expression of photosynthetic pathway genes (RhPGR5A, RhATPB, RhLHCB3 and RhRbsA) in heat-stressed plants. In the present study, application of exogenous melatonin limited the increase in the transcription of several genes under heat stress, including RsHsfs2, RsHsf10 and RsHsf20. The differential expression of RsHsfs under phytohormone and abiotic conditions highlights their extensive and diverse roles in environmental adaptation.

4. Materials and Methods

4.1. Plant Materials and Treatments

Two-year-old plants of R. simsii and the rhododendron cultivar “FengGuan” growing at Jiyang College of Zhejiang A&F University, Zhejiang, China (29°45′ N, 120°14′ E) were used as the experimental materials in this study. Specifically, “FengGuan” was used for qRT-PCR analyses and R. simsii was used for gene cloning experiments. The plants were grown in growth chambers for 2 weeks to adapt to the environmental conditions. The parameters of the growth chambers were set as follows: 14 h light/10 h dark photoperiod, with light supplied at 80 μmol m−2 s−1, temperature 25 °C day/18 °C night, and 70% relative humidity. Plants of uniform size were treated with heat, drought and melatonin. For the drought treatment, irrigation was withheld for 10 days, and samples were taken at 0 h, 4 h, 12 h and 240 h of treatment. The methods of heat and melatonin treatment were as described in our previous report [29].

4.2. Gene Identification and Physicochemical Properties of Putative Proteins

The protein and nucleotide sequences were obtained from R. simsii genome database [26]. The conserved DBD domain of Hsf (Pfam: PF00447) was used as the query in a BLASTP search of the R. simsii proteome. PFAM and SMART excluded the proteins that did not incorporate DBD domain and HR-A/B domain. Finally, 22 RsHsf genes were obtained. ProtParam (http://web.expasy.org/protparam, accessed on 8 June 2023) was used to predict the physicochemical properties of the putative proteins, including the isoelectric point, molecular weight, and number of amino acids. The hydrophilicity and hydrophobicity of proteins were analyzed using Protscale (http://web.expasy.org/protscale/, accessed on 8 June 2023).

4.3. Chromosome Location

Information for mapping the 22 RsHsfs onto chromosomes was obtained from the annotation file of the R. simsii genome database [26]. MG2C (http://mg2c.iask.in/mg2c_v2.0/, accessed on 10 June 2023) was employed to visualize the distribution of RsHsfs on 12 chromosomes.

4.4. Construction of Phylogenetic Tree

The AtHsfs proteins in A. thaliana and CsHsfs proteins in C. sinensis were obtained from Phytozome (http://www.phytozome.net/, accessed on 11 June 2023) and Tea Plant Information Archive (TPIA) (http://tpia.teaplant.org/, accessed on 11 June 2023), respectively. These sequences and those of RsHsfs were used to generate a phylogenetic tree with the maximum-likelihood (ML) method using MEGA 11.0 software. The bootstrap method was selected, and the bootstrap repetition was set to 1000. Default values were used for other parameters. Subsequently, the phylogenetic tree was visualized at the iTOL website (https://itol.embl.de/, accessed on 12 June 2023).

4.5. Gene Structures and Motifs, and Analysis of Gene Promoter Regions

The gene structures, including intron/exon distribution, were predicted on the website of GSDS (http://gsds.gao-lab.org/, accessed on 15 June 2023). Conserved motifs of RsHsfs were detected and analyzed with MEME (https://meme-suite.org/meme/, accessed on 15 June 2023). The number of motif parameters was set to 10, and other parameters were used with default values. The promoter sequences 2 kb upstream of the initiation codon of RsHsfs were extracted from R. simsii genome data, and the cis-acting elements were detected by PlantCare (http://bioinformatics.psb.ugent.be/, accessed on 16 June 2023). The results were visualized using Tbtools software (accessed on 20 June 2023).

4.6. Detection of RsHsf Transcript Levels by qRT-PCR

The transcript levels in stressed plants were performed in the leaves of “FengGuan”. Total RNA was isolated and reverse-transcribed using the EASYspin Plus Complex Plant RNA Kit and TRUEscript RT Master Mix (Aidlab, Beijing, China) according to the manufacturer’s protocols. The obtained RNA and cDNA products were kept at −80 °C until use. Primer Premier5 was used to design gene-specific primers, which were synthesized by Tsingke (Beijing, China) (Table S1). In the qRT-PCRanalyses, the 10 µL reaction mixture consisted of 5 µL MonAmpTM SYBR® Green qPCR Mix, 3 µL cDNA, 0.5 µL Primer-R, 0.5 µL Primer-F, and 1 µL ddH2O. The PCR cycling program was as follows: 10 min at 95 °C, 40 cycles of 15 s at 95 °C, 15 s at 59 °C, and 10 s at 72 °C. The glyceraldehyde 3-phosphate dehydrogenase (GAPDH) gene was used as an internal control [56], the Ct values were calculated on the Roche LightCycler 480 II instrument (Roche Diagnostics, Germany) automatically. The gene transcript levels were calculated using the 2−△△CT method [57]. Data were analyzed via two-tailed Student’ s t-test with p < 0.05 (*) and p < 0.01 (**) set as the thresholds for determining significance. Charts were constructed using Graphpad prism 9.0. Three independent biological replicates were analyzed for each sample.

4.7. Subcellular Localization Analyses

The coding sequences of RsHsfs without the stop codon were amplified from the cDNA of R. simsii. Each product was ligated into the binary vector (pCAMBIA1300-35S::GFP) to produce a Pro35S::RsHsf::GFP construct, which was then transformed into Agrobacterium tumefaciens strain EHA105. The transformed A. tumefaciens was used to infiltrate the leaves of 4-week-old tobacco plants [58]. At 48–72 h after infiltration, GFP signals were observed using Nikon Eclipse Ni-U microscope (Nikon, Tokyo, Japan).

5. Conclusions

In this study, 22 RsHsf genes were identified from genomic data of R. simsii for the first time. The gene structures, phylogenetic relationships and conserved motifs of RsHsf family members were determined. Transcriptional profile analyses revealed that RsHsfs display significant specificity of expression in different tissues, and play important roles in responses to abiotic stress. The results of this study provide basic information about RsHsfs, and give new insights into the function of Hsf genes in abiotic stress resistance in R. simsii.

Supplementary Materials

The following supporting information can be downloaded at: https://www.mdpi.com/article/10.3390/plants12223917/s1, Figure S1: The specific sequence information of 10 motifs. Table S1: Primers of the RsHsfs for qRT-PCR.

Author Contributions

Conceptualization, Y.X. (Yanan Xu) and Y.X. (Yanxia Xu); methodology, Y.X. (Yanan Xu) and Y.J.; validation, D.H. and H.D.; formal analysis, Y.X. (Yanan Xu) and Y.J.; investigation, Y.J. and Y.L. and H.D.; resources, D.H.; data curation, Y.X. (Yanan Xu) and Y.J.; writing—original draft preparation, Y.X. (Yanan Xu); writing—review and editing, Y.X. (Yanxia Xu); supervision, Y.L.; project administration, Y.X. (Yanxia Xu); funding acquisition, Y.X. (Yanxia Xu). All authors have read and agreed to the published version of the manuscript reported.

Funding

This research was funded by the Shaoxing “Hometown of Celebrities” Talent Program, China (RC2022B05) and the Talent Startup Program of Jiyang College of Zhejiang A&F University, China (RQ2020B15).

Data Availability Statement

The data presented in this study are available on request from the corresponding author. The data are not publicly available due to privacy.

Conflicts of Interest

The authors declare no conflict of interest.

References

  1. Boyer, J.S. Plant Productivity and Environment. Science 1982, 218, 443–448. [Google Scholar] [CrossRef] [PubMed]
  2. Dorothea, B.; Ramanjulu, S. Drought and Salt Tolerance in Plants. Crit. Rev. Plant Sci. 2005, 24, 23–58. [Google Scholar]
  3. Klaus, D.S.; Thomas, B.; Ingo, E.; Lutz, N. The plant heat stress transcription factor (Hsf) family: Structure, function and evolution. BBA-Gene Regul. Mech. 2012, 1819, 104–119. [Google Scholar]
  4. Sorger, P.K.; Pelham, H.R. Purification and characterization of a heat-shock element binding protein from yeast. EMBO J. 1987, 6, 3035–3041. [Google Scholar] [CrossRef] [PubMed]
  5. Clos, J.; Westwood, J.T.; Becker, P.B.; Wilson, S.; Lambert, K.; Wu, C. Molecular cloning and expression of a hexameric Drosophila heat shock factor subject to negative regulation. Cell 1990, 63, 1085–1097. [Google Scholar] [CrossRef]
  6. Rabindran, S.K.; Giorgi, G.; Clos, J.; Wu, C. Molecular cloning and expression of a human heat shock factor; HSF1. Proc. Natl. Acad. Sci. USA 1991, 88, 6906–6910. [Google Scholar] [CrossRef]
  7. Sarge, K.D.; Zimarino, V.; Holm, K.; Wu, C.I.; Morimoto, R. Cloning and characterization of two mouse heat shock factors with distinct inducible and constitutive DNA-binding ability. Genes Dev. 1991, 5, 1902–1911. [Google Scholar] [CrossRef]
  8. Lutz, N.; Kapil, B.; Pascal, D.; Shravan, K.M.; Arnab, G.I.; Klaus, D.S. Arabidopsis and the heat stress transcription factor world: How many heat stress transcription factors do we need. Cell Stress. Chaperones 2001, 6, 177–189. [Google Scholar]
  9. Guo, L.H.; Chen, S.; Liu, K.; Liu, Y.; Ni, L.; Zhang, K.; Zhang, L. Isolation of heat shock factor HsfA1a-binding sites in vivo revealed variations of heat shock elements in Arabidopsis thaliana. Plant Cell Physiol. 2008, 49, 1306–1315. [Google Scholar] [CrossRef]
  10. Lin, Y.-X.; Jiang, H.-Y.; Chu, Z.-X.; Tang, X.-L.; Zhu, S.-W.; Cheng, B.-J. Genome-wide identification, classification and analysis of heat shock transcription factor family in maize. BMC Genom. 2011, 12, 76. [Google Scholar] [CrossRef] [PubMed]
  11. Wang, J.; Sun, N.; Deng, T.; Zhang, L.; Zuo, K. Genome-wide cloning, identification, classification and functional analysis of cotton heat shock transcription factors in cotton (Gossypium hirsutum). BMC Genom. 2014, 15, 961. [Google Scholar] [CrossRef] [PubMed]
  12. Xue, G.P.; Sadat, S.; Drenth, J.; McIntyre, C.L. The heat shock factor family from regulation of heat shock protein genes. J. Exp. Bot. 2014, 65, 539–557. [Google Scholar] [CrossRef] [PubMed]
  13. Anckar, J.; Sistonen, L. Regulation of HSF1 function in the heat stress response: Implications in aging and disease. Annu. Rev. Biochem. 2011, 80, 1089–1115. [Google Scholar] [CrossRef] [PubMed]
  14. Davoudi, M.; Chen, J.; Lou, Q. Genome-wide identification and expression analysis of heat shock protein 70 (HSP70) gene family in Pumpkin (Cucurbita moschata) rootstock under drought stress suggested the potential role of these chaperones in stress tolerance. Int. J. Mol. Sci. 2022, 23, 1918. [Google Scholar] [CrossRef]
  15. Banti, V.; Loreti, E.; Novi, G.; Santaniello, A.; Alpi, A.; Perata, P. Heat acclimation and cross-tolerance against anoxia in Arabidopsis. Plant Cell Environ. 2008, 31, 1029–1037. [Google Scholar] [CrossRef]
  16. Schramm, F.; Ganguli, A.; Kiehlmann, E.; Englich, G.; Walch, D.; von Koskull-Doring, P. The heat stress transcription factor HsfA2 serves as a regulatory amplifier of a subset of genes in the heat stress response in Arabidopsis. Plant Mol. Biol. 2006, 60, 759–772. [Google Scholar] [CrossRef]
  17. Banti, V.; Mafessoni, F.; Loreti, E.; Alpi, A.; Perata, P. The heat-inducible transcription factor HsfA2 enhances anoxia tolerance in Arabidopsis. Plant Physiol. 2010, 152, 1471–1483. [Google Scholar] [CrossRef]
  18. Li, G.-L.; Zhang, H.-N.; Shao, H.; Wang, G.-Y.; Zhang, Y.-Y.; Zhang, Y.-J.; Zhao, L.-N.; Guo, X.-L.; Sheteiwy, M.S. ZmHsf05, a new heat shock transcription factor from Zea mays L. improves thermotolerance in Arabidopsis thaliana and rescues thermotolerance defects of the athsfa2 mutant. Plant Sci. 2019, 283, 375–384. [Google Scholar] [CrossRef]
  19. Yokotani, N.; Ichikawa, T.; Kondou, Y.; Matsui, M.; Hirochika, H.; Iwabuchi, M.; Oda, K. Expression of rice heat stress transcription factor OsHsfA2e enhances tolerance to environmental stresses in transgenic Arabidopsis. Planta 2008, 227, 957–967. [Google Scholar] [CrossRef]
  20. Xue, G.-P.; Drenth, J.; McIntyre, C.L. TaHsfA6f is a transcriptional activator that regulates a suite of heat stress protection genes in wheat (Triticum aestivum L.) including previously unknown Hsf targets. J. Exp. Bot. 2015, 66, 1025–1039. [Google Scholar] [CrossRef]
  21. Liu, H.; Liao, H.; Charng, Y. The role of class A1 heat shock factors (HSFA1s) in response to heat and other stresses in Arabidopsis. Plant, Cell Environ. 2011, 34, 738–751. [Google Scholar] [CrossRef]
  22. Ma, H.; Wang, C.; Yang, B.; Cheng, H.; Wang, Z.; Mijiti, A.; Ren, C.; Qu, G.; Zhang, H.; Ma, L. CarHSFB2, a Class B Heat Shock Transcription Factor Is Involved in Different Developmental Processes and Various Stress Responses in Chickpea (Cicer Arietinum L.). Plant Mol. Biol. Report. 2016, 34, 1–14. [Google Scholar] [CrossRef]
  23. Li, Z.; Zhang, L.; Wang, A.; Xu, X.; Li, J. Ectopic overexpression of SlHsfA3, a heat stress transcription factor from tomato, confers increased thermotolerance and salt hypersensitivity in germination in transgenic Arabidopsis. PLoS ONE 2013, 8, e54880. [Google Scholar] [CrossRef]
  24. Peng, S.; Zhu, Z.; Zhao, K.; Shi, J.; Yang, Y.; He, M.; Wang, Y. A Novel Heat Shock Transcription Factor, VpHsf1, from Chinese Wild Vitis pseudoreticulata is Involved in Biotic and Abiotic Stresses. Plant Mol. Biol. Rep. 2013, 31, 240–247. [Google Scholar] [CrossRef]
  25. He, Y.; Lei, Y.S.; Zhang, J.; Wan, Z.Y.; Ji, X.; Yang, S.H.; Xu, Y.X. Cloning and expression analysis of Rhododendron bHLH transcription factor RsMYC2 under abiotic stress. Mol. Plant Breed. 2023, 21, 1103–1110. [Google Scholar]
  26. Yang, F.-S.; Nie, S.; Liu, H.; Shi, T.-L.; Tian, X.-C.; Zhou, S.-S.; Bao, Y.-T.; Jia, K.-H.; Guo, J.-F.; Zhao, W.; et al. Chromosome-level genome assembly of a parent species of widely cultivated azaleas. Nat. Commun. 2020, 11, 5269. [Google Scholar] [CrossRef] [PubMed]
  27. Li, W.; Wan, X.-L.; Yu, J.-Y.; Wang, K.-L.; Zhang, J. Genome-Wide Identification, Classification, and Expression Analysis of the Hsf Gene Family in Carnation (Dianthus caryophyllus). Int. J. Mol. Sci. 2019, 20, 5233. [Google Scholar] [CrossRef] [PubMed]
  28. Shi, H.; Tan, D.; Reiter, R.J.; Ye, T.; Yang, F.; Chan, Z. Melatonin induces class A1 heat-shock factors (HSFA1s) and their possible involvement of thermotolerance in Arabidopsis. J. Pineal Res. 2015, 58, 335–342. [Google Scholar] [CrossRef]
  29. Xu, Y.-X.; Zhang, J.; Wan, Z.-Y.; Huang, S.-X.; Di, H.-C.; He, Y.; Jin, S.-H. Physiological and transcriptome analyses provide new insights into the mechanism mediating the enhanced tolerance of melatonin-treated rhododendron plants to heat stress. J. Integr. Agric. 2023, 22, 2397–2411. [Google Scholar] [CrossRef]
  30. Duan, S.; Liu, B.; Zhang, Y.; Li, G.; Guo, X. Genome-wide identification and abiotic stress-responsive pattern of heat shock transcription factor family in Triticum aestivum L. BMC Genom. 2019, 20, 257. [Google Scholar] [CrossRef]
  31. Guo, M.; Lu, J.-P.; Zhai, Y.-F.; Chai, W.-G.; Gong, Z.-H.; Lu, M.-H. Genome-wide analysis, expression profile of heat shock factor gene family (CaHsfs) and characterisation of CaHsfA2 in pepper (Capsicum annuum L.). BMC Plant Biol. 2015, 15, 151. [Google Scholar] [CrossRef]
  32. Tang, R.; Zhu, W.; Song, X.; Lin, X.; Cai, J.; Wang, M.; Yang, Q. Genome-wide identification and function analyses of heat Shock transcription factors in potato. Front. Plant Sci. 2016, 7, 490. [Google Scholar] [CrossRef]
  33. Xu, P.; Guo, Q.; Pang, X.; Zhang, P.; Kong, D.; Liu, J. New Insights into Evolution of Plant Heat Shock Factors (Hsfs) and Expression Analysis of Tea Genes in Response to Abiotic Stresses. Plants 2020, 9, 311. [Google Scholar] [CrossRef] [PubMed]
  34. Liu, R.; Meng, X.Z.; Yuan, S.N.; Li, G.L.; Yang, Y.; Duan, S.N.; Zhang, H.N.; Guo, X.L. Biological Characteristics and Thermotolerance Analysis of Heat Shock Transcription Factor TaHsfA1 Subfamily Genes in Wheat (Triticum aestivum). J. Agric. Biotechnol. 2022, 30, 1–14. [Google Scholar]
  35. Liu, M.Y.; Huang, Q.; Sun, W.J.; Ma, Z.T.; Huang, L.; Wu, Q.; Tang, Z.Z.; Bu, T.L.; Li, C.L.; Chen, H. Genome-wide investigation of the heat shock transcription factor (Hsf) gene family in Tartary buckwheat (Fagopyrum tataricum). BMC Genom. 2019, 20, 871. [Google Scholar] [CrossRef]
  36. Gong, B.H. Mechanism Analysis of Response to Heat Stress of LIHSFA1 and Its Downstream LIHSP70 from Lily (Lilium longiflorum). Ph.D. Thesis, China Agricultural University, Beijing, China, 2014. [Google Scholar]
  37. Li, P.S. Cloning, Function, and Thermotolerant Mechanism of Heat Stress Transcription Factor (HSF) in Soybean, Wheat, and Arabidopsis. Master’s Thesis, Northwest Agriculture and Forestry University, Yangling, China, 2016. [Google Scholar]
  38. Guo, C.; Wang, Q.; Li, X.X.; Zhang, Z.B.; Wen, L.C.; Deng, Z.C.; Chu, Y.M.; Liu, T.; Cui, M.M.; Guo, Y.F. Genome-wide Identification and Systemic Analysis of the Hsf Gene Family in Nicotiana tabacum L. China Tob. Sci. 2022, 43, 47–56. [Google Scholar] [CrossRef]
  39. Li, P.S.; Zheng, W.J.; Zhou, Y.B.; Chen, M.; Cai, S.C.; Ma, L.J.; Xu, Z.S. Genome-wide identification, classification, and high temperature of Hsf family in Brachypodium diatachyon. J. China Agric. Univ. 2015, 20, 8–18. [Google Scholar]
  40. Baniwal, S.K.; Bharti, K.; Chan, K.Y.; Fauth, M.; Ganguli, A.; Kotak, S.; Mishra, S.K.; Nover, L.; Port, M.; Scharf, K.-D.; et al. Heat stress response in plants: A complex game with chaperones and more than twenty heat stress transcription factors. J. Biosci. 2004, 29, 471–487. [Google Scholar] [CrossRef]
  41. Liu, H.-C.; Charng, Y.-Y. Common and distinct functions of Arabidopsis class A1 and A2 heat shock factors in diverse abiotic stress responses and development. Plant Physiol. 2013, 163, 276–290. [Google Scholar] [CrossRef] [PubMed]
  42. Davletova, S.; Rizhsky, L.; Liang, H.; Zhong, S.Q.; Oliver, D.J.; Coutu, J.; Shulaev, V.; Schlauch, K.; Mittler, R. Cytosolic ascorbate peroxidase 1 is a central component of the reactive oxygen gene network of Arabidopsis. Plant Cell 2005, 17, 268–281. [Google Scholar] [CrossRef]
  43. Nishizawa, A.; Yabuta, Y.; Yoshida, E.; Maruta, T.; Yoshimura, K.; Shigeoka, S. Arabidopsis heat shock transcription factor A2 as a key regulator in response to several types of environmental stress. Plant J. Cell Mol. Biol. 2006, 48, 535–547. [Google Scholar] [CrossRef]
  44. Maheswari, U.; Jabbari, K.; Petit, J.-L.; Porcel, B.M.; Allen, A.E.; Cadoret, J.-P.; De Martino, A.; Heijde, M.; Kaas, R.; La Roche, J.; et al. Digital expression profiling of novel diatom transcripts provides insight into their biological functions. Genome Biol. 2010, 11, R85. [Google Scholar] [CrossRef] [PubMed]
  45. Ma, J.; Zhang, G.; Ye, Y.; Shang, L.; Hong, S.; Ma, Q.; Zhao, Y.; Gu, C. Genome-wide identification and expression analysis of HSF transcription factors in Alfalfa (Medicago sativa) under Abiotic Stress. Plants 2022, 11, 2763. [Google Scholar] [CrossRef]
  46. Zhang, X.; Xu, W.; Ni, D.; Wang, M.; Guo, G. Genome-wide characterization of tea plant (Camellia sinensis) Hsf transcription factor family and role of CsHsfA2 in heat tolerance. BMC Plant Biol. 2020, 20, 244. [Google Scholar] [CrossRef] [PubMed]
  47. Zeng, J.; Huang, Z.Y.; Zhang, Y.X.; Wu, C.L.; Hu, W. Clone and Expression Analysis of MeHSF18 in Cassava. Southwest China J. Agric. Sci. 2020, 33, 2405–2411. [Google Scholar]
  48. Personat, J.M.; Tejedor-Cano, J.; Prieto-Dapena, P.; Almoguera, C.; Jordano, J. Co-overexpression of two Heat Shock Factors results in enhanced seed longevity and in synergistic effects on seedling tolerance to severe dehydration and oxidative stress. BMC Plant Biol. 2014, 14, 1. [Google Scholar] [CrossRef]
  49. Bechtold, U.; Albihlal, W.S.; Lawson, T.; Fryer, M.J.; Sparrow, P.A.; Richard, F.; Persad, R.; Bowden, L.; Hickman, R.; Martin, C.; et al. Arabidopsis HEAT SHOCK TRANSCRIPTION FACTORA1b overexpression enhances water productivity, resistance to drought, and infection. J. Exp. Bot. 2013, 64, 3467–3481. [Google Scholar] [CrossRef] [PubMed]
  50. Döring, P.; Treuter, E.; Kistner, C.; Lyck, R.; Chen, A.; Nover, L. The Role of AHA motifs in the activator function of tomato heat stress transcription factors HsfA1 and HsfA2. Plant Cell 2000, 12, 265–278. [Google Scholar] [CrossRef]
  51. Charng, Y.-Y.; Liu, H.-C.; Liu, N.-Y.; Chi, W.-T.; Wang, C.-N.; Chang, S.-H.; Wang, T.-T. A heat-inducible transcription factor, HsfA2, is required for extension of acquired thermotolerance in Arabidopsis. Plant Physiol. 2007, 143, 251–262. [Google Scholar] [CrossRef]
  52. Arnao, M.B.; Hernández-Ruiz, J. Melatonin in flowering, fruit set and fruit ripening. Plant Reprod. 2020, 33, 77–87. [Google Scholar] [CrossRef]
  53. Xu, X.D. Effects of Exogenous Melatonin on Physiological Responses of Cucumber Seedlings under High Temperature Stress. Master’s Thesis, Northwest Agriculture and Forestry University, Yangling, China, 2010. [Google Scholar]
  54. Byeon, Y.; Back, K. Melatonin synthesis in rice seedlings in vivo is enhanced at high temperatures and under dark conditions due to increased serotonin N-acetyltransferase and N-acetylserotonin methyltransferase activities. J. Pineal Res. 2014, 56, 189–195. [Google Scholar] [CrossRef] [PubMed]
  55. Zheng, X.; Tan, D.X.; Allan, A.C.; Zuo, B.; Zhao, Y.; Reiter, R.J.; Wang, L.; Wang, Z.; Guo, Y.; Zhou, J.; et al. Chloroplastic biosynthesis of melatonin and its involvement in protection of plants from salt stress. Sci. Rep. 2017, 7, 41236. [Google Scholar] [CrossRef] [PubMed]
  56. Zhang, L.; Cai, Y.; Zhang, M.; Du, G.; Wang, J. Selection and Evaluation of Candidate Reference Genes for Quantitative Real-Time PCR in Aboveground Tissues and Drought Conditions in Rhododendron Delavayi. Front. Genet. 2022, 13, 876482. [Google Scholar] [CrossRef] [PubMed]
  57. Livak, K.J.; Schmittgen, T.D. Analysis of relative gene expression data using real-time quantitative PCR and the 2−∆∆Ct method. Methods 2001, 25, 402–408. [Google Scholar] [CrossRef]
  58. Xu, Y.X.; Lei, Y.S.; Huang, S.X.; Zhang, J.; Wan, Z.Y.; Zhu, X.T.; Jin, S.H. Combined de novo transcriptomic and physiological analyses reveal RyALS3-mediated aluminum tolerance in Rhododendron yunnanense Franch. Front. Plant Sci. 2022, 13, 951003. [Google Scholar] [CrossRef]
Figure 1. Chromosomal locations of RsHsfs in R. simsii. The scale represents megabases (Mb) and the sizes of the chromosomes can be determined using the scale given at the left.
Plants 12 03917 g001
Figure 2. Phylogenetic analysis among the identified Hsf-conserved proteins in A. thaliana, C. sinensis and R. Simsii. The 21 A. thaliana, 25 C. sinensis and 22 R. simsii Hsf sequences were aligned using Muscle. The phylogenetic tree was constructed by MEGA11.0 with the maximum likelihood method, and the bootstrap value was set at 1000 repetitions. Different families and subclasses are indicated by different colors.
Plants 12 03917 g002
Figure 3. Phylogenetic tree, gene structure, and distribution of conserved motifs. (A) Phylogenetic tree constructed using MEGA 11.0 software. (B) Schematic of gene structure constructed using tools at gene structure display server. Coding sequences, untranslated regions and introns were represented by yellow boxes, purple boxes and black lines, respectively. The relative position was proportionally displayed based on the kilobase scale at the bottom of the figure. (C) Conserved motifs of RsHsf proteins. Each colored box represented a motif in each of the RsHsf proteins, with the motif’ s number represented. The sizes of the gene can be determined using the scale given at the bottom.
Plants 12 03917 g003
Figure 4. Cis-acting element analysis of promoter regions of RsHsfs. (A) Phylogenetic tree constructed using MEGA 11.0 software. (B) Cis-acting element analysis of RsHsfs. Different colored boxes were represented by different cis-acting elements. The coordinates at the bottom of the figure indicated the length of the gene promoter, which was defined as 2 kb before the start codon.
Plants 12 03917 g004
Figure 5. Transcriptional profiles of RsHsfs in different tissues. B, buds; TL, tender leaves; ML, mature leaves; TS, tender stems; MS, mature stems; F, flowers; R, roots. Gene expression in buds was regarded as control. Data are mean ± standard deviation (SD), calculated from three biological replicates. Vertical lines represent standard deviation. * and ** indicate significant difference at p < 0.05 and p < 0.01, respectively.
Plants 12 03917 g005
Figure 6. Expression profiles of RsHsfs under drought treatment. The detection of transcript levels was performed in leaves. Gene expression at 0 h was normalized to “1”. Data are mean ± standard deviation (SD), calculated from three biological replicates. Vertical lines represent standard deviation. * and ** indicate significant difference at p < 0.05 and p < 0.01, respectively.
Plants 12 03917 g006
Figure 7. Heat map of the expression profiles of RsHsf genes under heat and melatonin treatment. The detection of expressions was performed in leaves. CK, 25 °C melatonin−free plants; 35 °C, 35 °C, melatonin−free plants; 40 °C, 40 °C, melatonin−free plants; 35 °C/MT, 35 °C, melatonin−treated plants; 40 °C/MT, 40 °C, melatonin−treated plants. Log2 transformed FPKM values were used to create heat map. Yellow or blue indicate higher or lower relative abundance or each transcript in each sample.
Plants 12 03917 g007
Figure 8. Subcellular localization of RsHsfs. (A) 35sGFP. (B) RsHsf15-GFP fusion proteins. (C) RsHsf16-GFP fusion proteins. (D) RsHsf19-GFP fusion proteins. For (AD), 35sGFP or RsHsfs-GFP fusion proteins were transiently expressed in tobacco. Left to right: green fluorescence, bright-field and merged microscope images. Scale bars: 100 µm.
Plants 12 03917 g008
Table 1. Physicochemical properties of putative RsHsfs.
Gene NameGene IDAmino AcidMolecular Weight (KDa)Theoretical Isoelectric PointInstability IndexGrand Average of Hydropathicity
RsHsf1Rhsim01G009440029633.015.4257.20−0.47
RsHsf2Rhsim01G016830014016.634.5055.62−0.37
RsHsf3Rhsim01G027210074083.566.8453.50−0.74
RsHsf4Rhsim02G006220046452.265.3560.59−0.82
RsHsf5Rhsim02G007120035439.706.2944.08−0.70
RsHsf6Rhsim03G002720025729.015.5670.97−0.84
RsHsf7Rhsim03G008130057763.554.7060.67−0.52
RsHsf8Rhsim03G017890032736.115.4554.93−0.64
RsHsf9Rhsim03G023690025028.239.4546.61−0.70
RsHsf10Rhsim04G019730035239.114.8356.31−0.61
RsHsf11Rhsim05G001820041546.584.8351.85−0.72
RsHsf12Rhsim06G005150033237.546.7361.12−0.61
RsHsf13Rhsim06G012420042848.775.2656.09−0.77
RsHsf14Rhsim07G013060054059.945.1659.15−0.60
RsHsf15Rhsim07G022790032436.935.9458.81−0.68
RsHsf16Rhsim08G010060028231.206.3833.73−0.77
RsHsf17Rhsim09G008830041747.754.6450.57−0.51
RsHsf18Rhsim09G021340052457.635.5052.32−0.43
RsHsf19Rhsim10G011830028631.888.7631.74−0.74
RsHsf20Rhsim11G001920050155.434.8665.34−0.63
RsHsf21Rhsim11G004310037042.034.7967.84−0.54
RsHsf22Rhsim13G017720030035.049.1346.37−0.79
Disclaimer/Publisher’s Note: The statements, opinions and data contained in all publications are solely those of the individual author(s) and contributor(s) and not of MDPI and/or the editor(s). MDPI and/or the editor(s) disclaim responsibility for any injury to people or property resulting from any ideas, methods, instructions or products referred to in the content.

