
Anti-Obesity Action of Boerhavia diffusa in Rats against High-Fat Diet-Induced Obesity by Blocking the Cannabinoid Receptors

 , , , ,
Abstract
:1. Introduction
2. Materials and Methods
2.1. Chemicals/Reagents
2.1.1. Extracts Preparation
2.1.2. Fractionations of Methanolic Extracts
2.2. ADMET Analysis Punarnavine, Boeravinone B, and Eupalitin
2.3. Molecular Docking
2.3.1. Target Preparation, Ligand Retrieval, and Energy Minimization
2.3.2. Molecular Docking Analysis
2.4. GROMACS 2018 Molecular Dynamics Simulation Studies
2.4.1. HPTLC Analysis of Extracts
2.4.2. Animals
2.4.3. Experimental Study
2.4.4. Estimation of Parameters
Determination of Behavioral Activity and Body Weight
Determination of Weights of Organs and Fat Pads
Determination of Blood Parameters
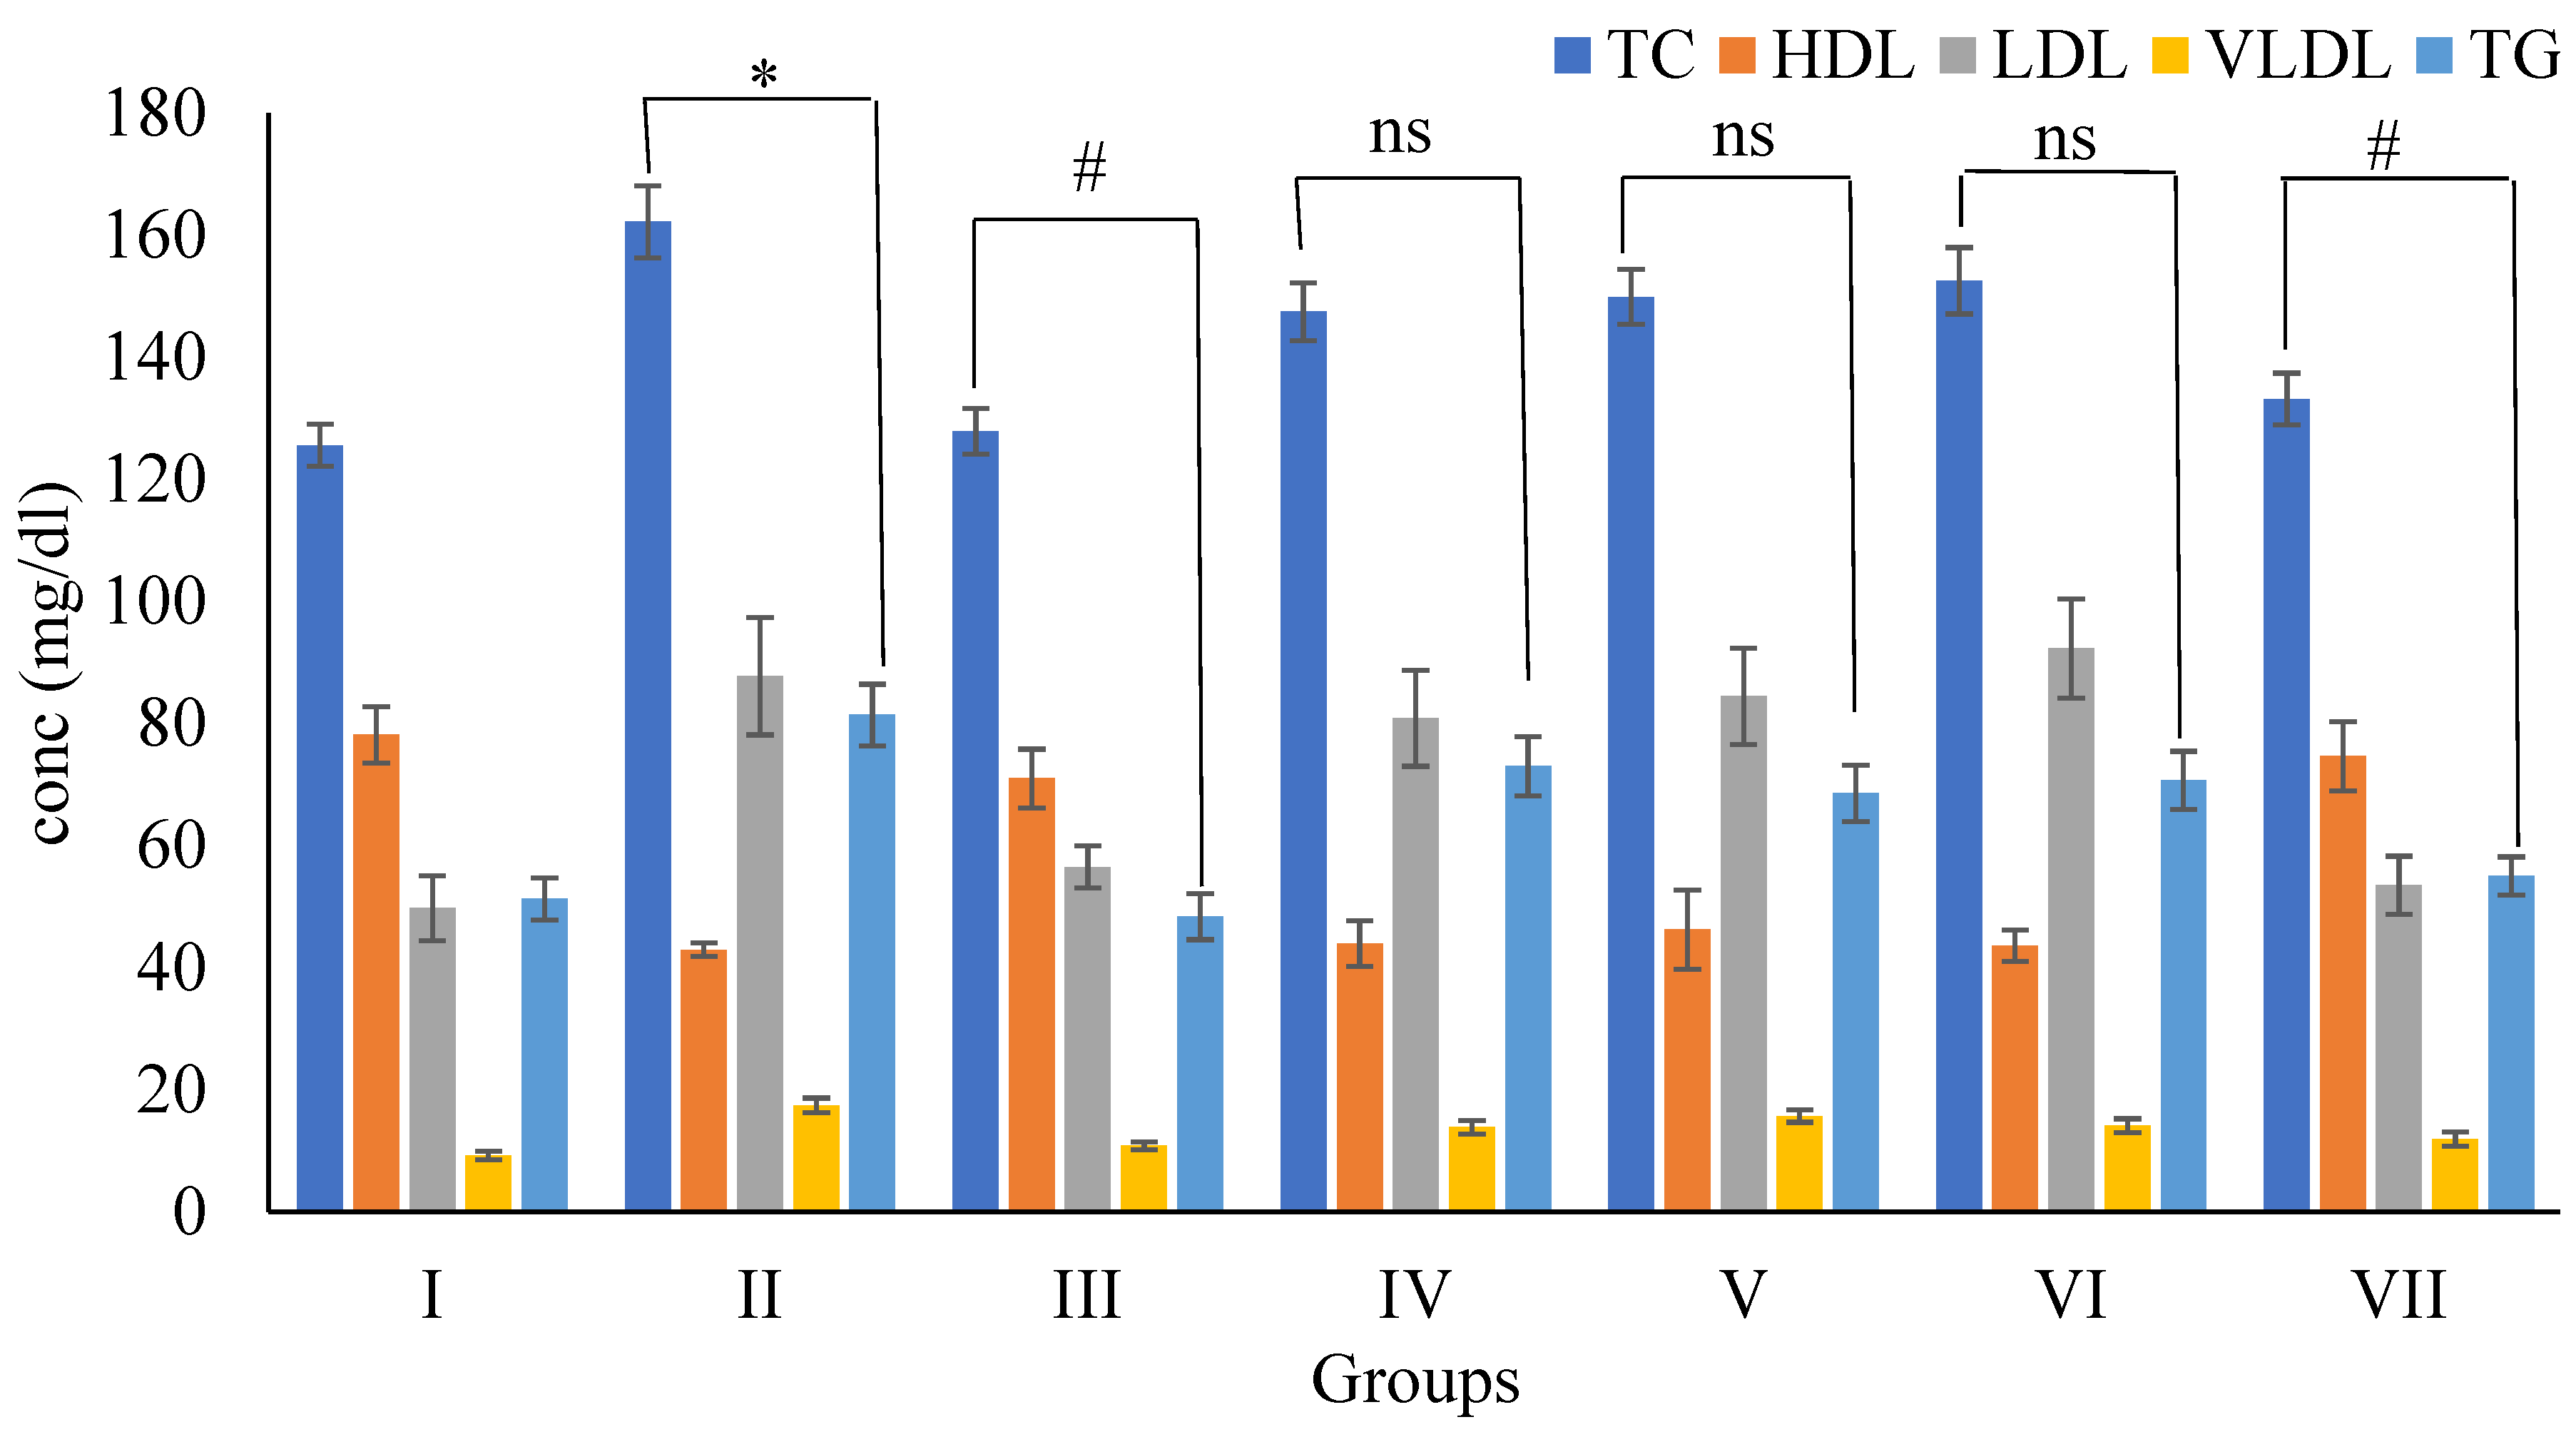
Effects of Wt-F of B. diffusa Extract on Lipid Profile
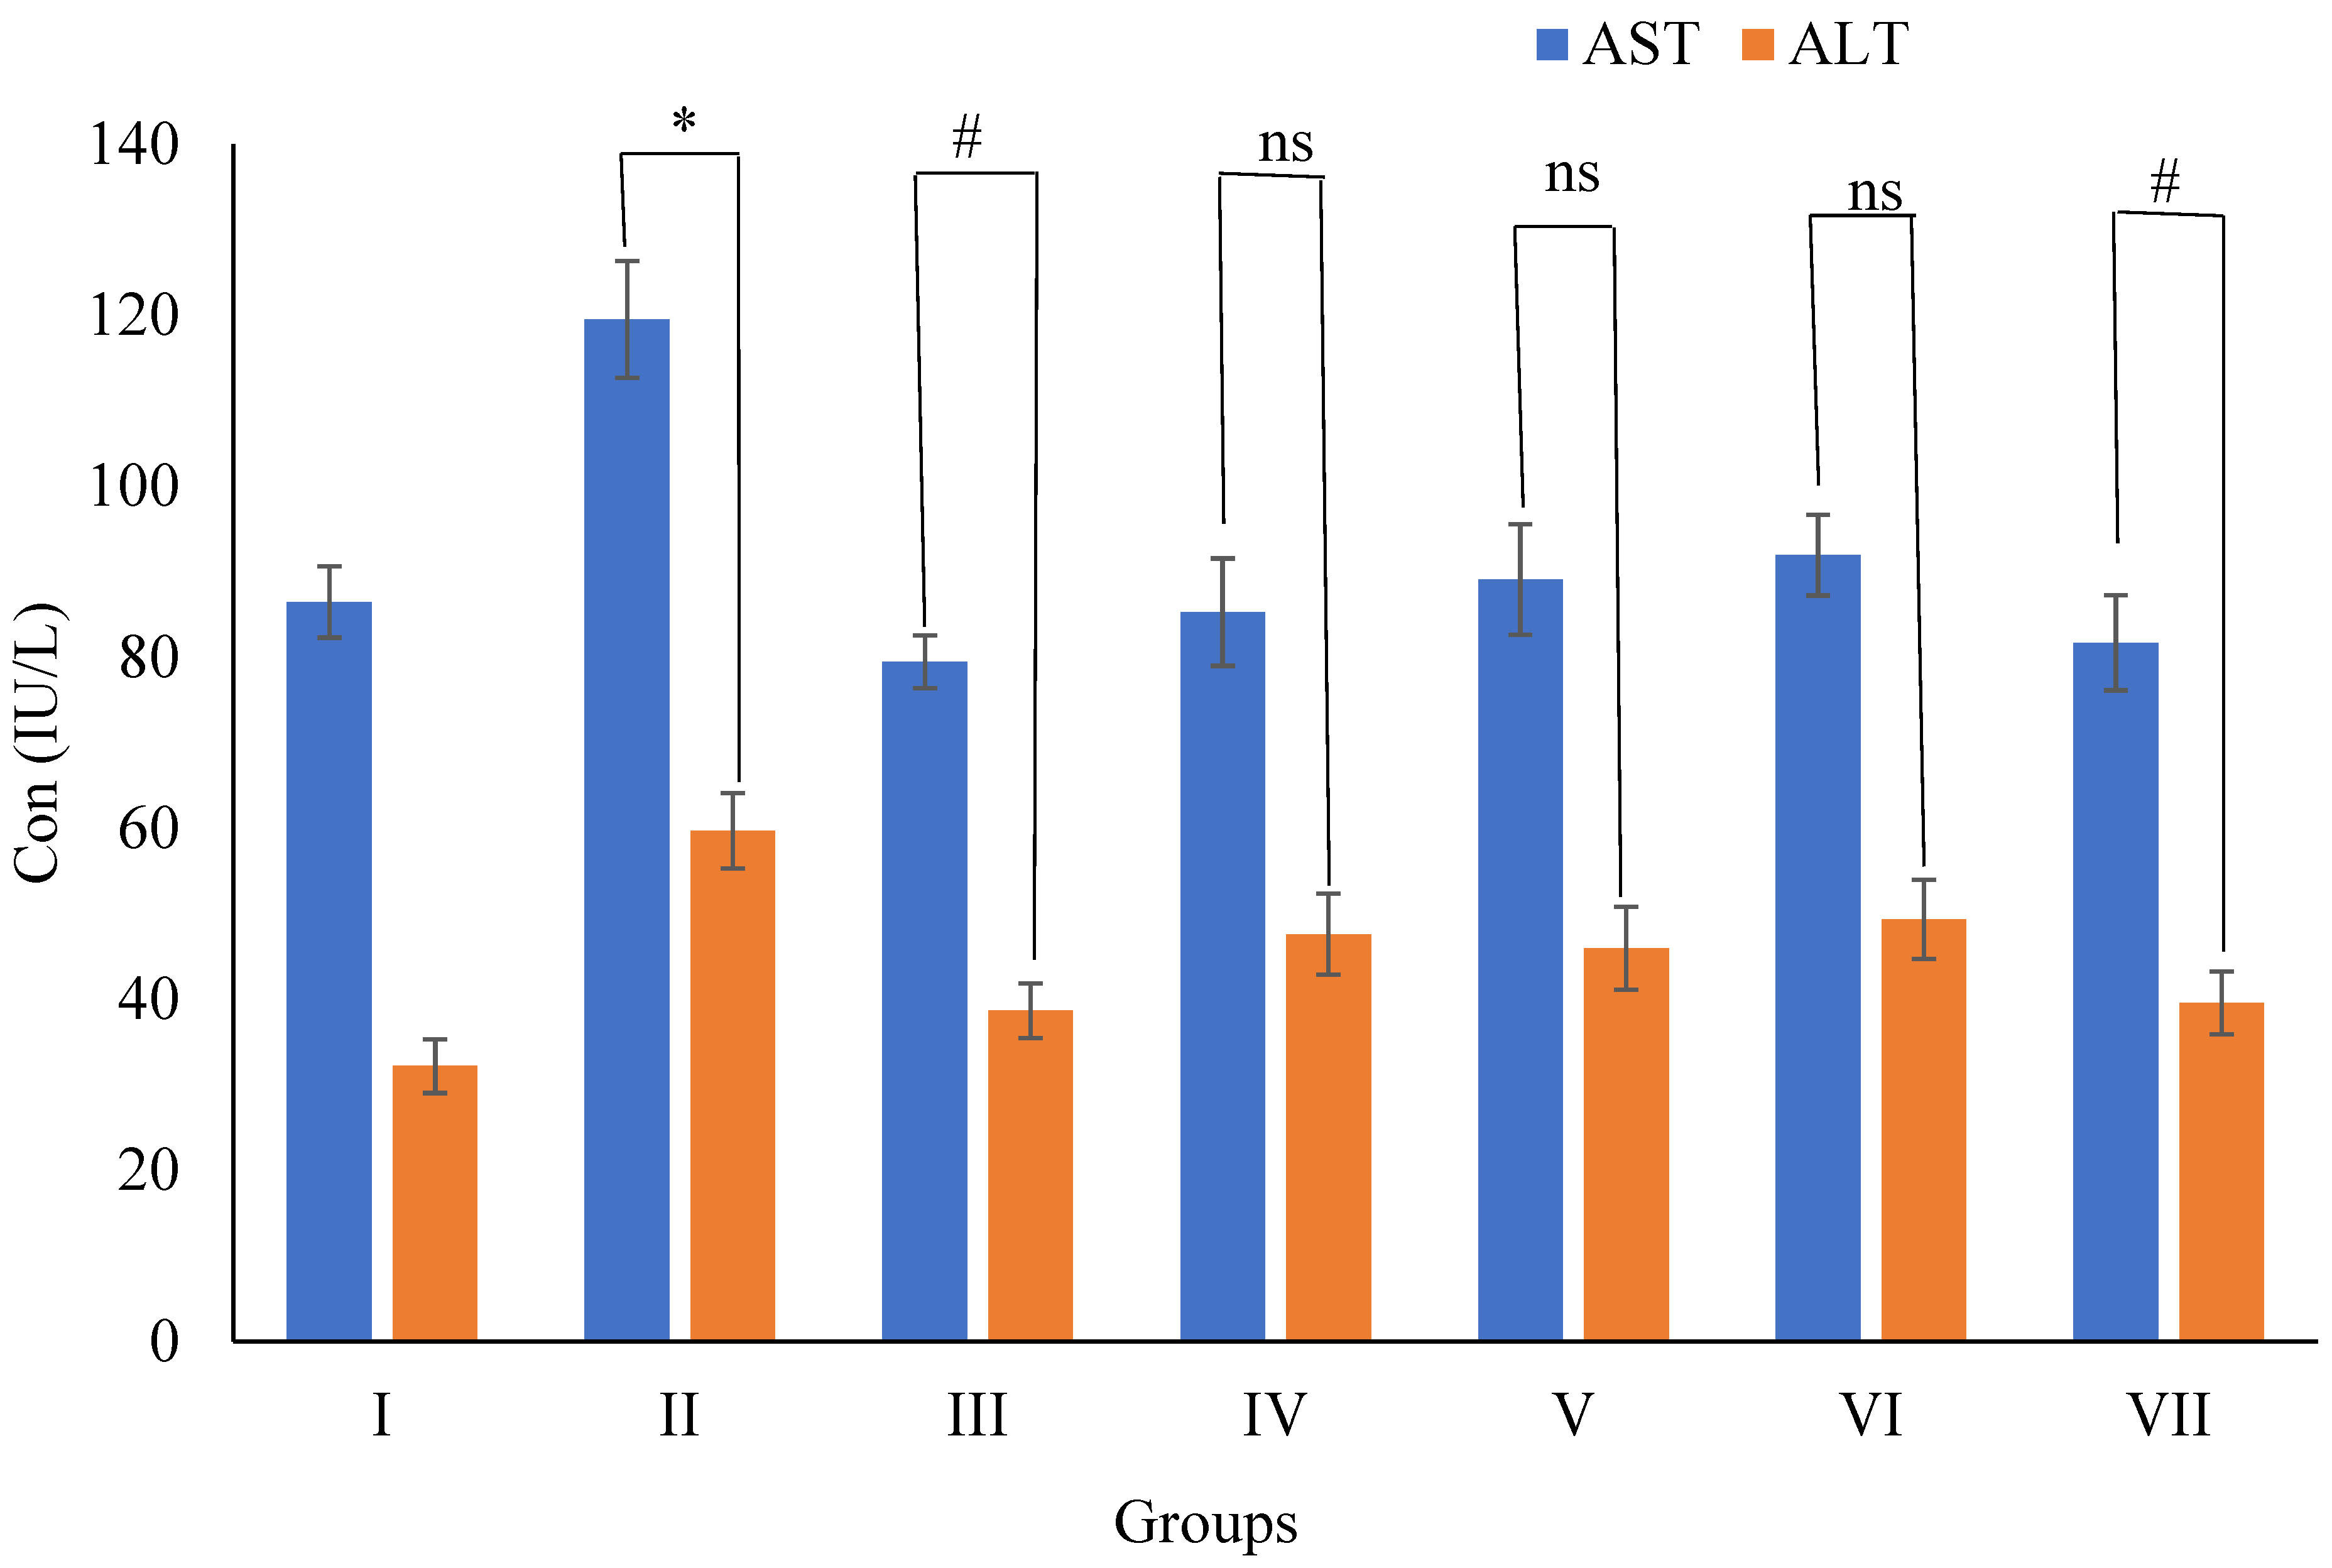
Effects of Wt-F of B. diffusa Extract on Liver Biomarkers (AST and ALT) Levels
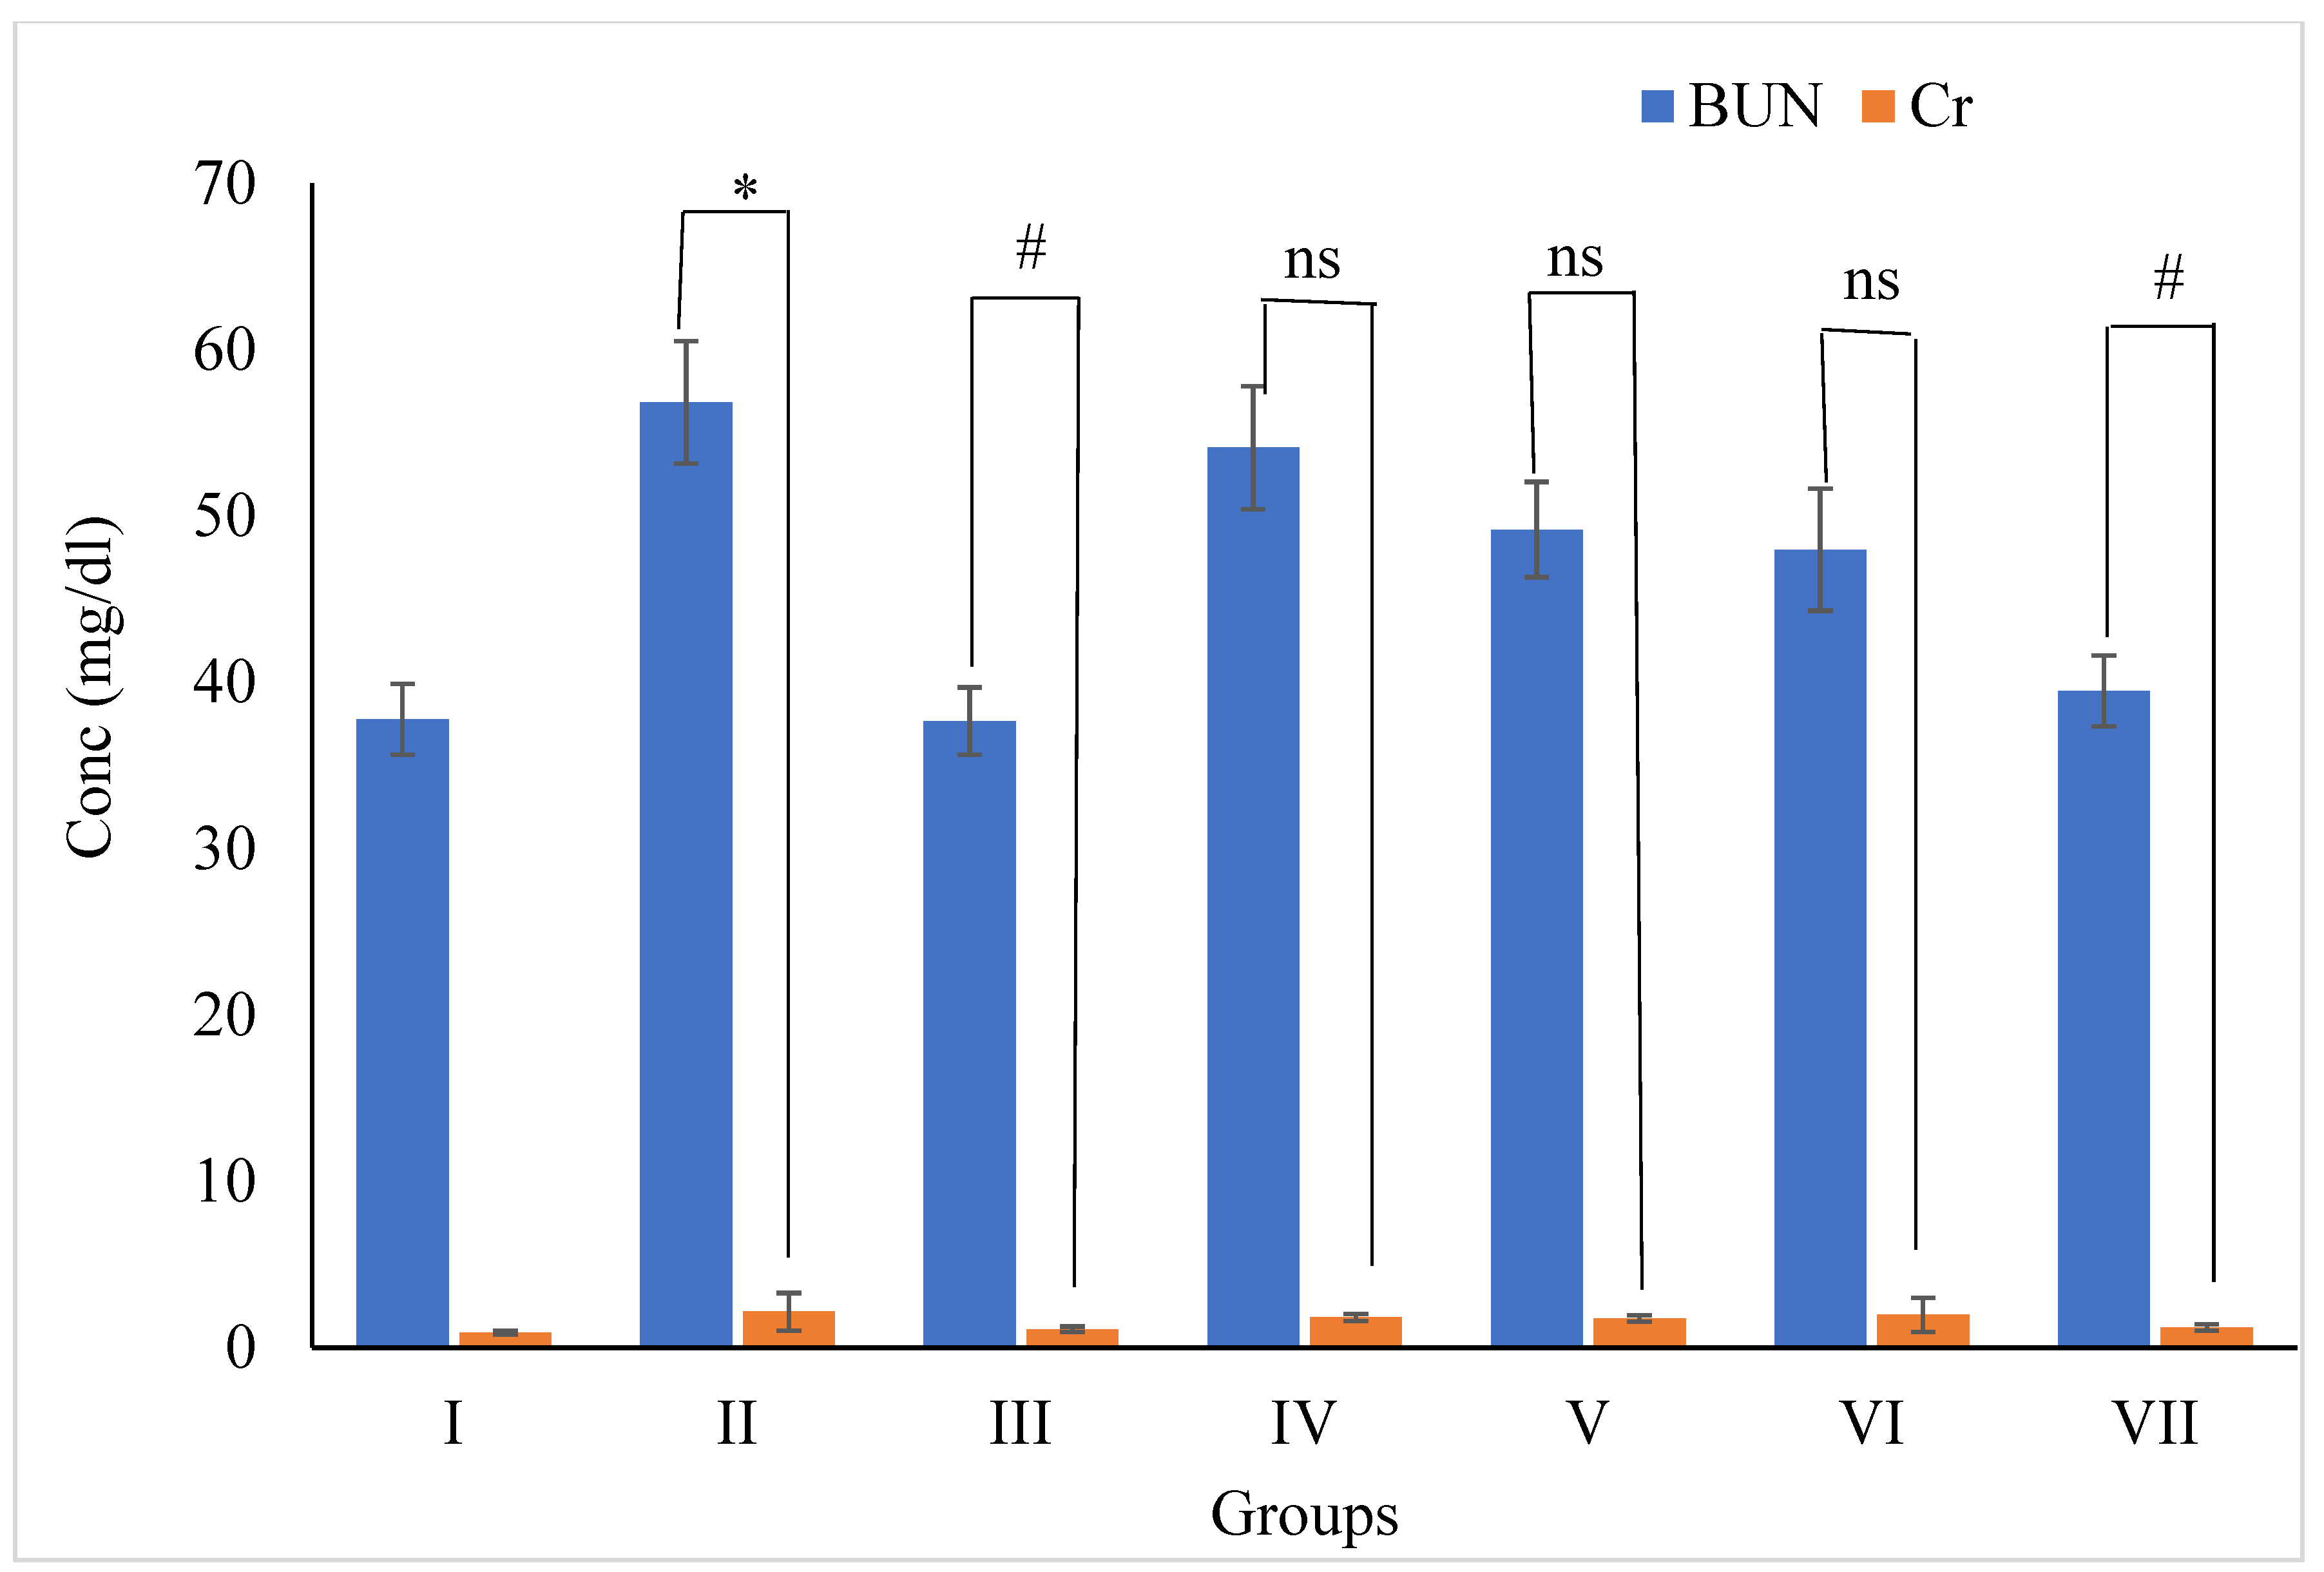
Effects of Wt-F of B. diffusa Extract on Blood Urea Nitrogen and Creatinine
2.4.5. Statistical Analysis:
3. Results
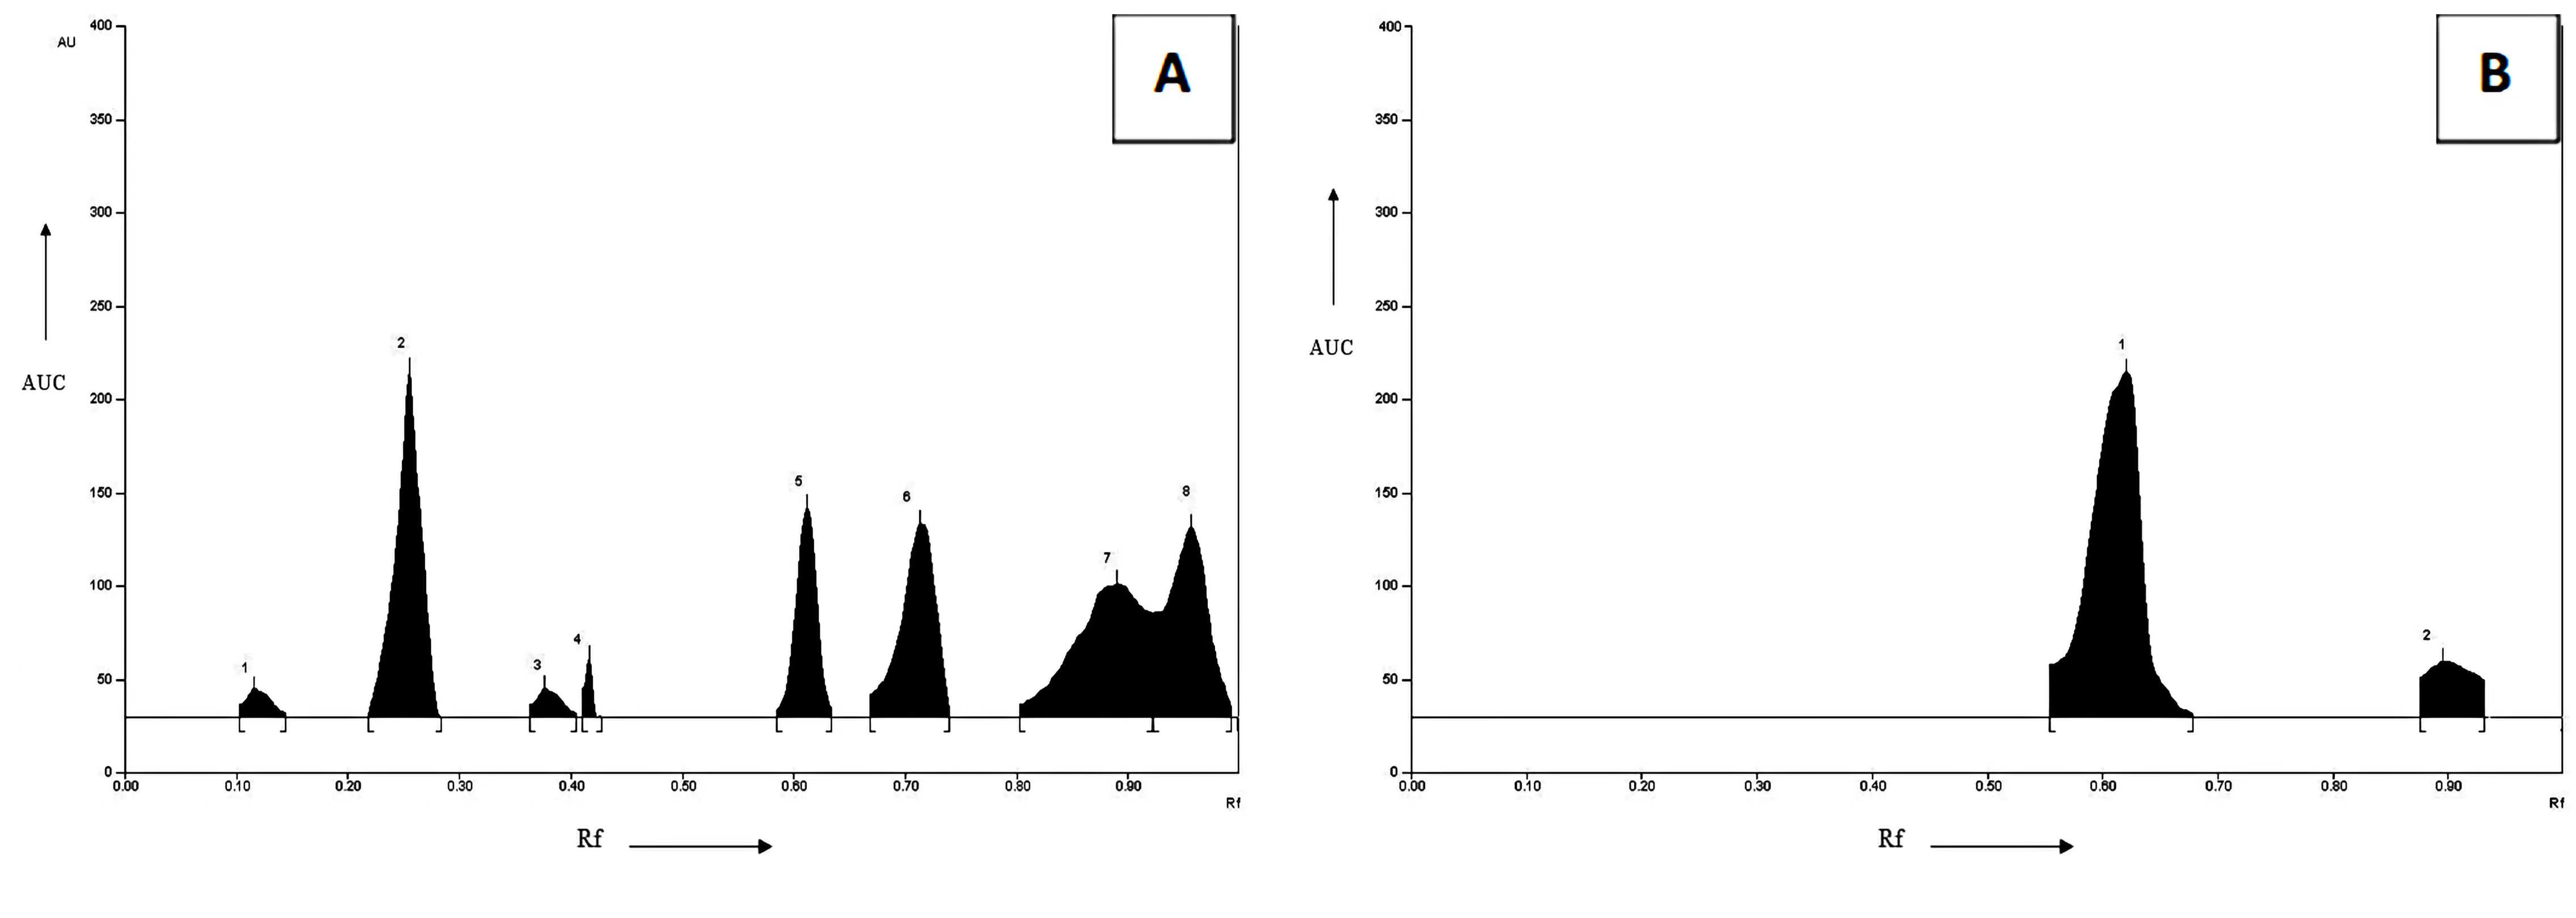
3.1. HPTLC Analysis
3.2. ADMET Predicted Profile and Pharmacokinetics Studies of Punarnavive, Boerhaavine B and Eupalitin
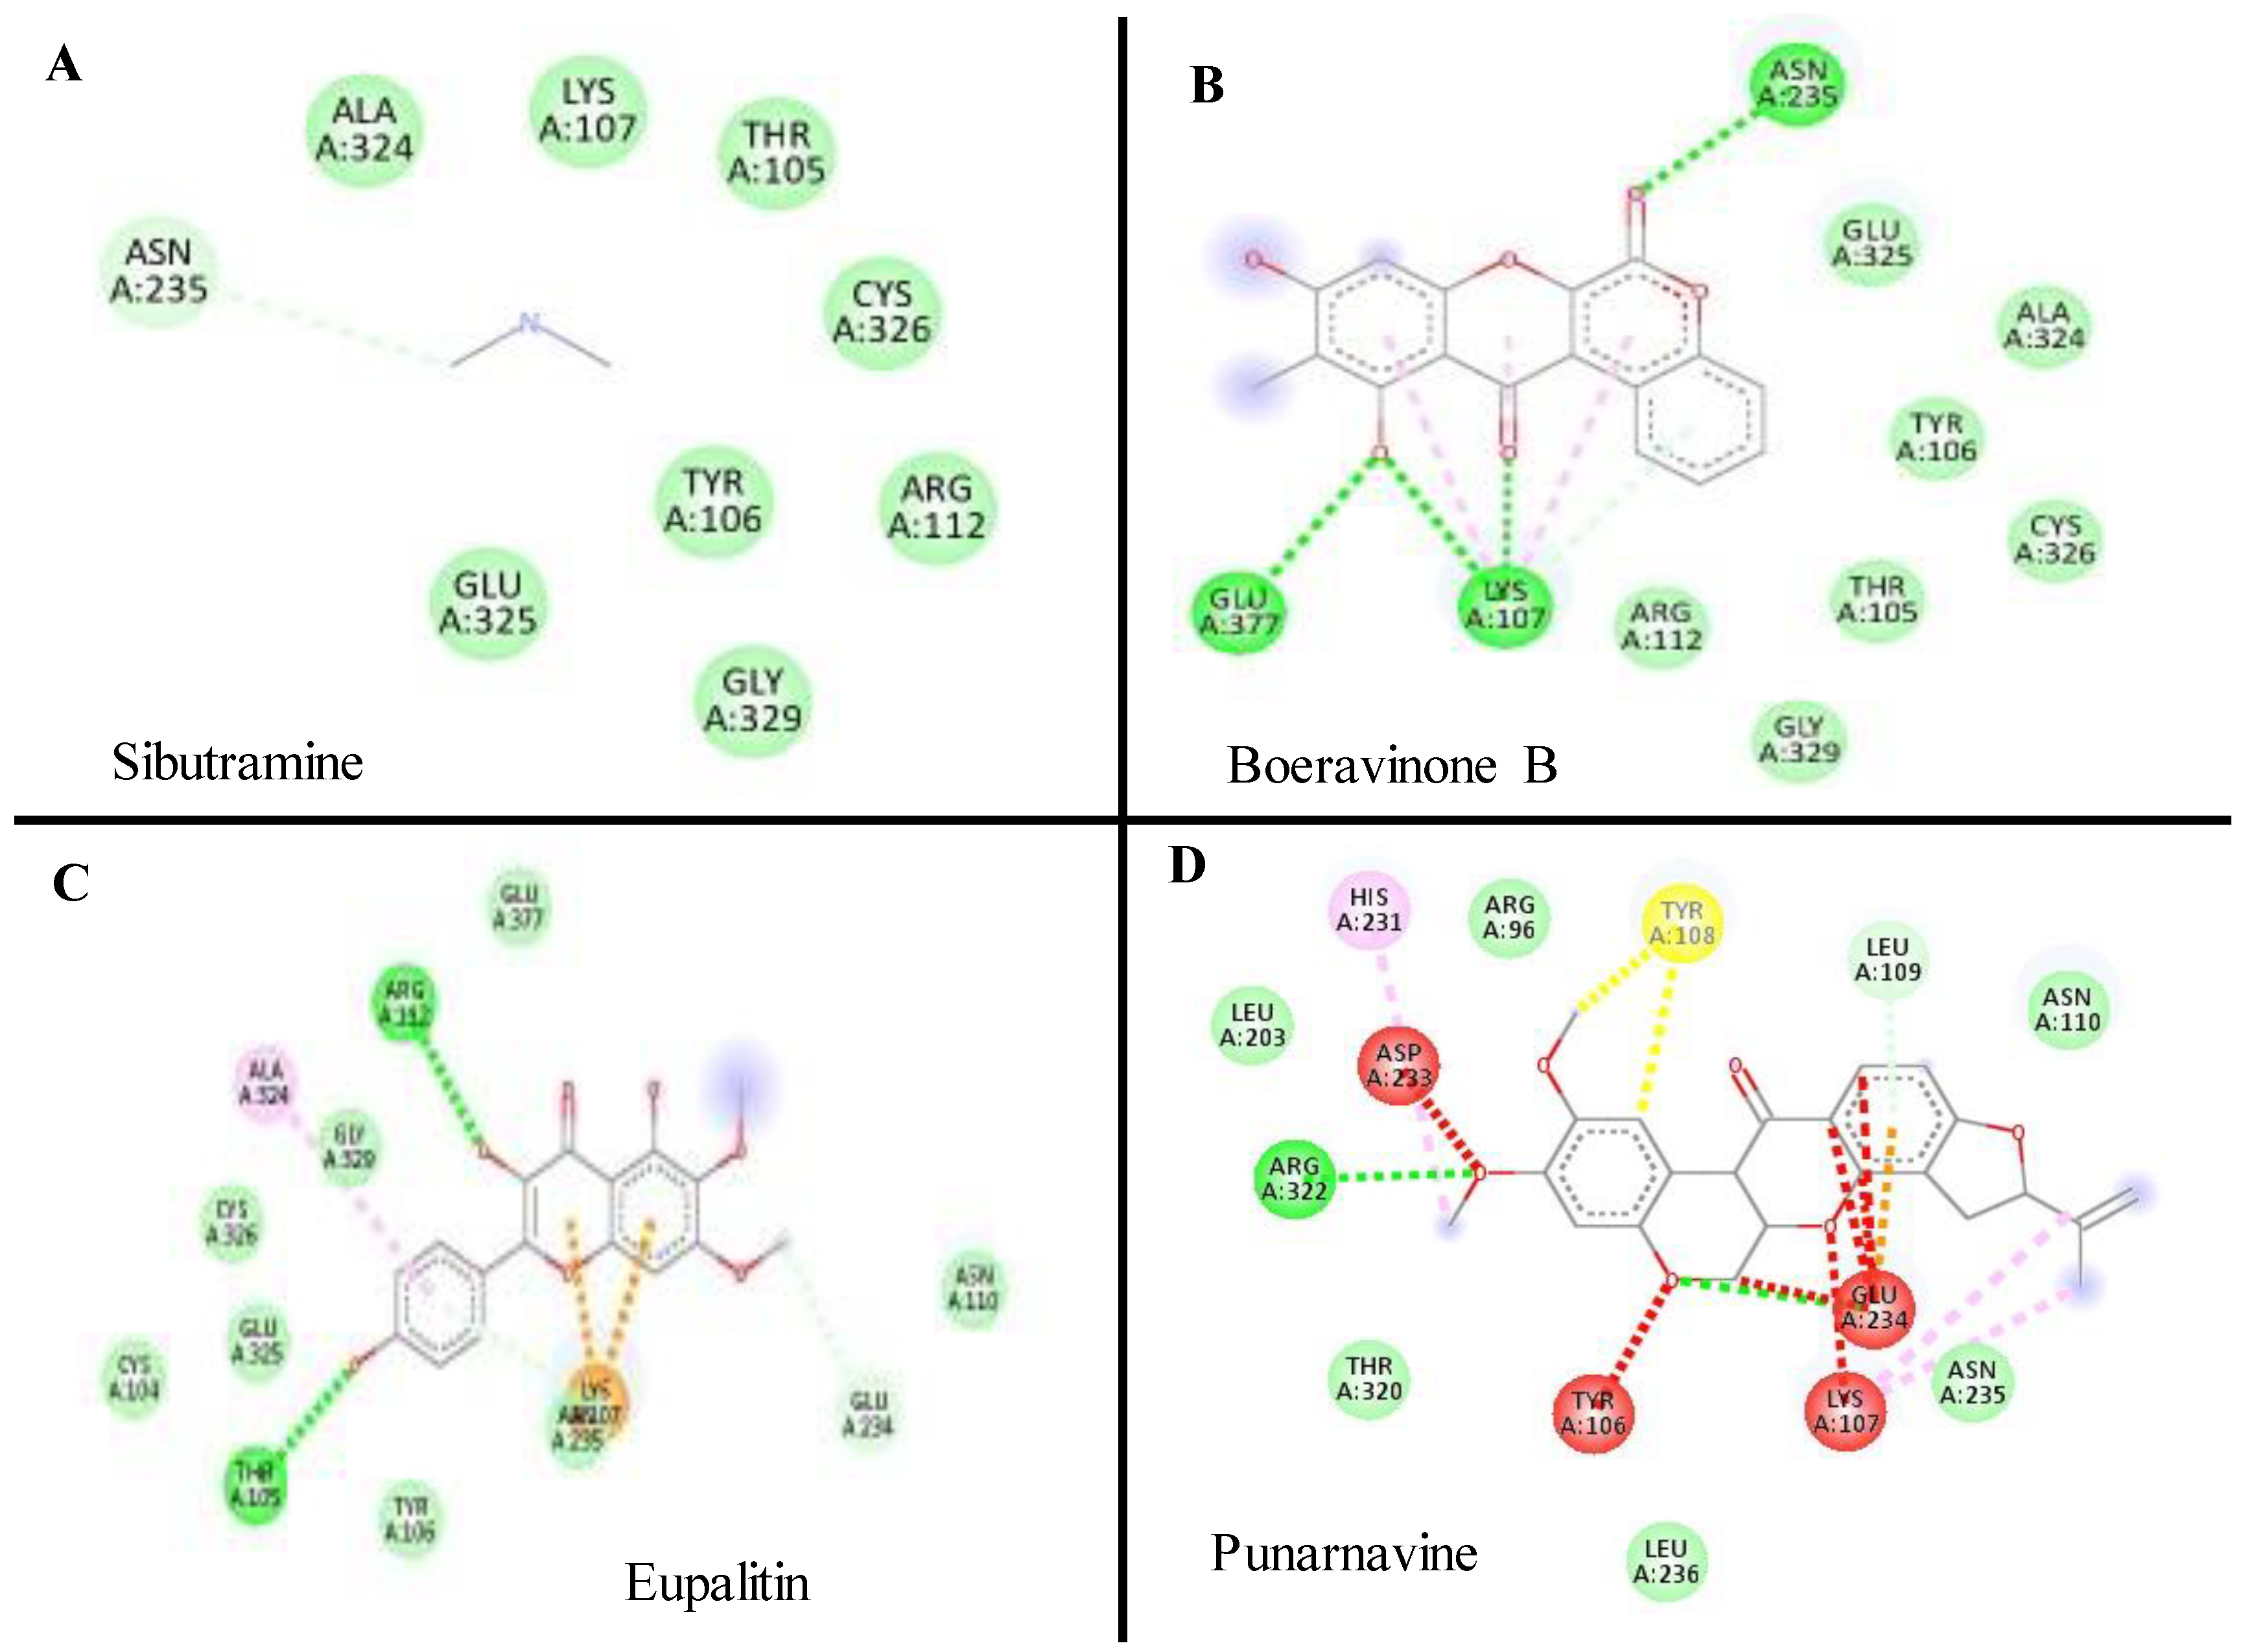
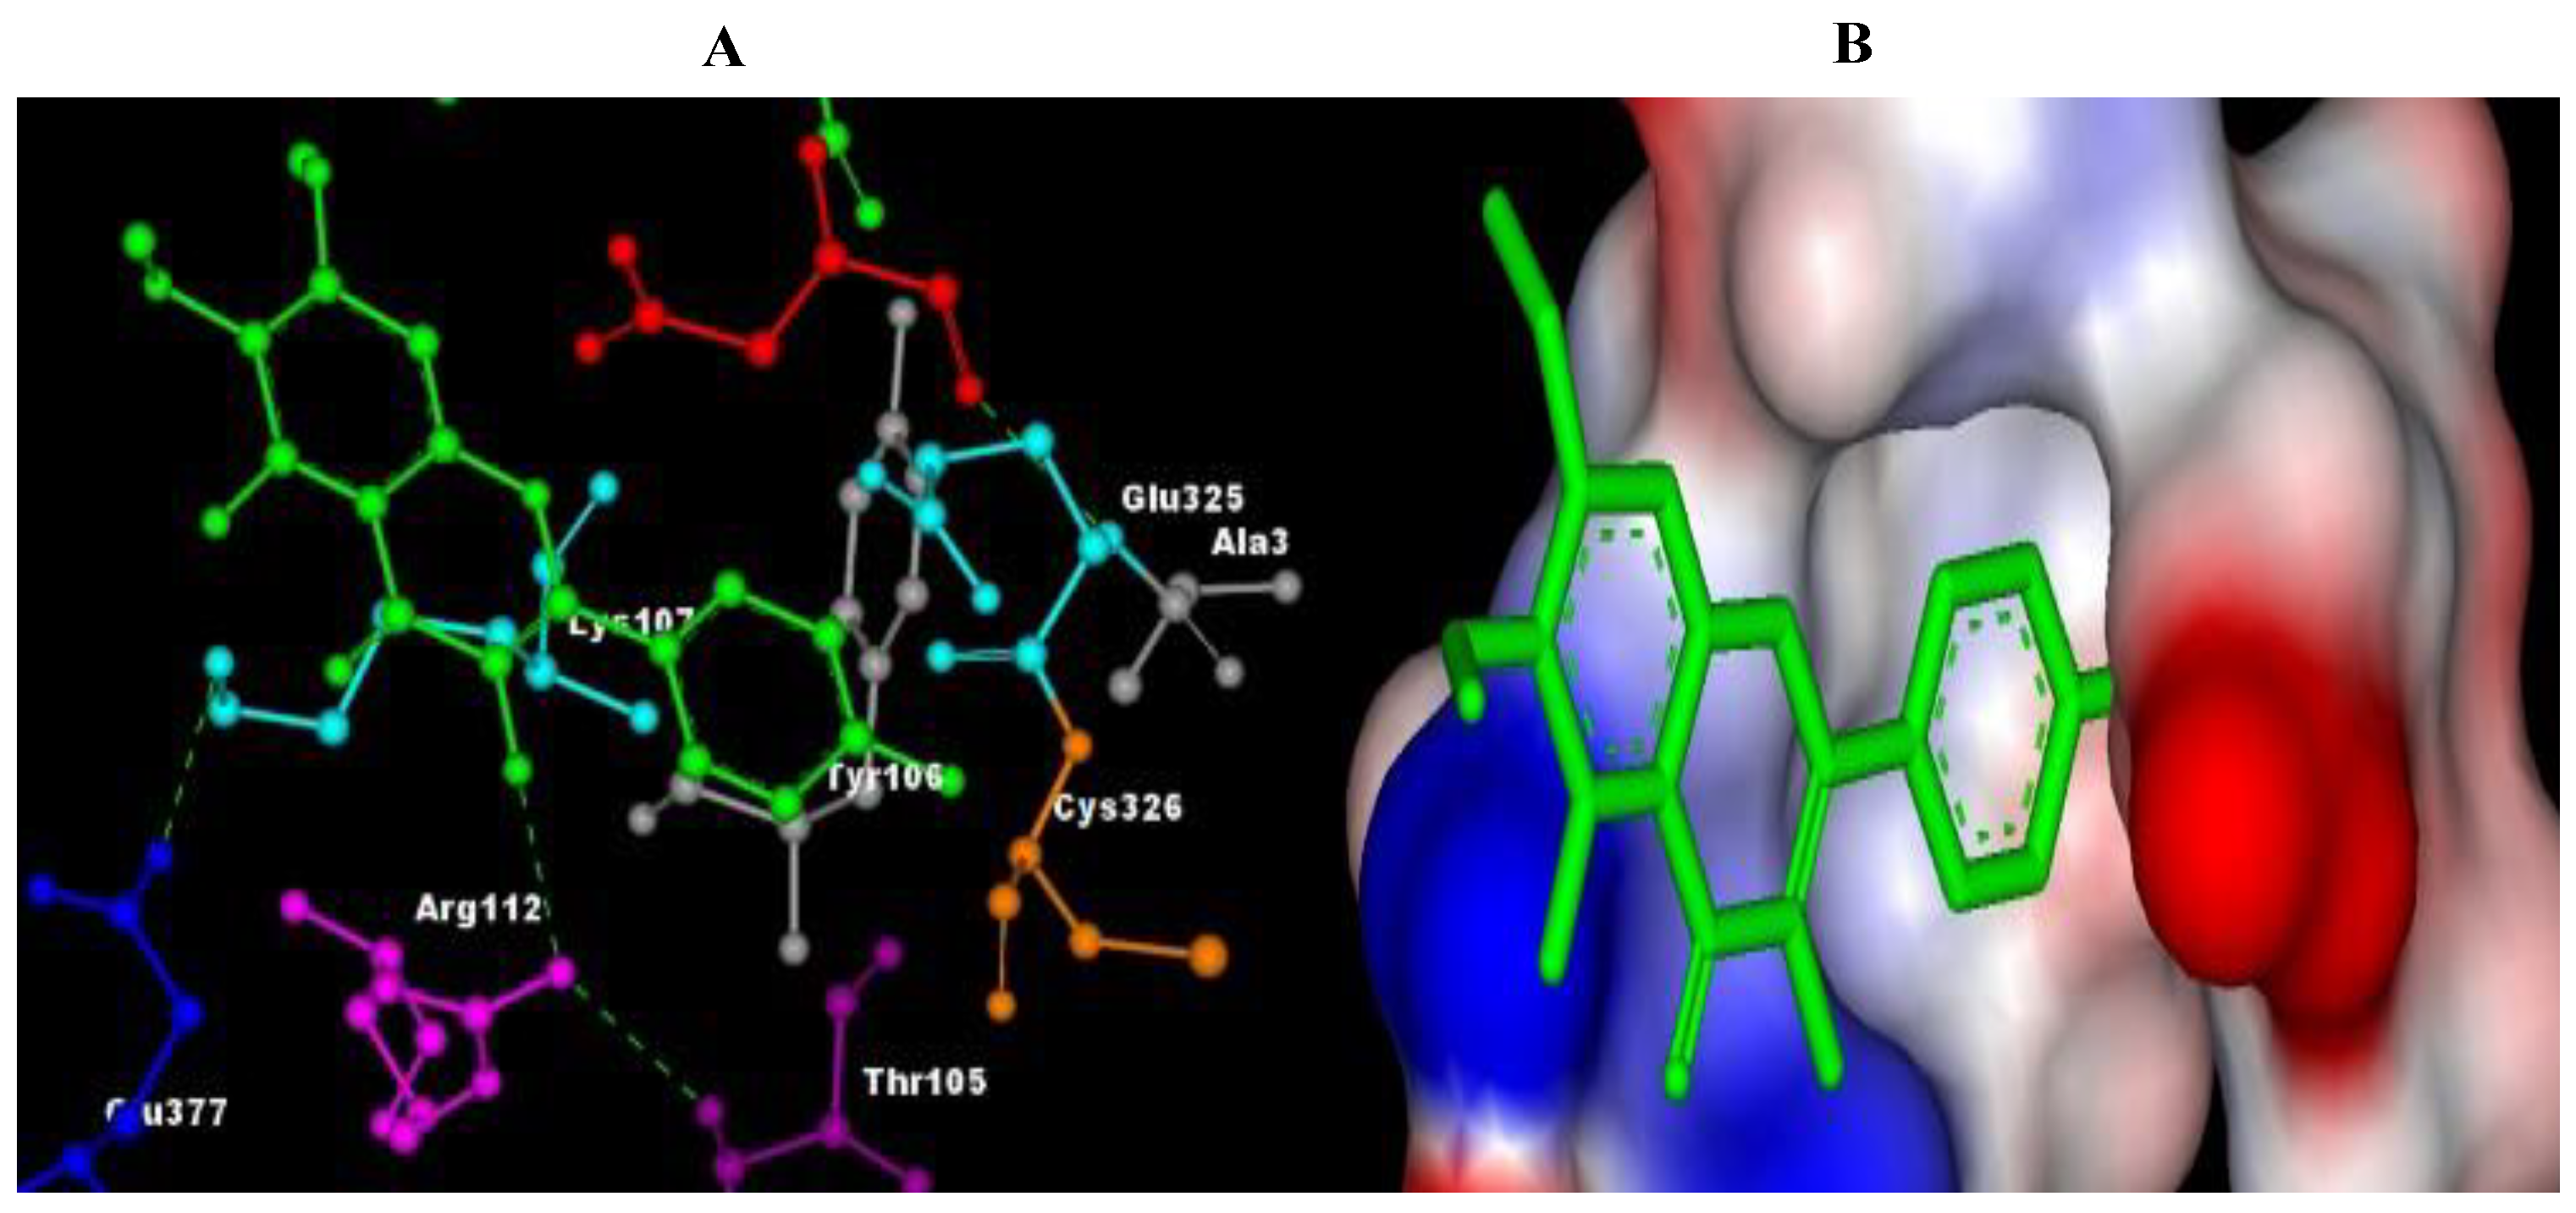
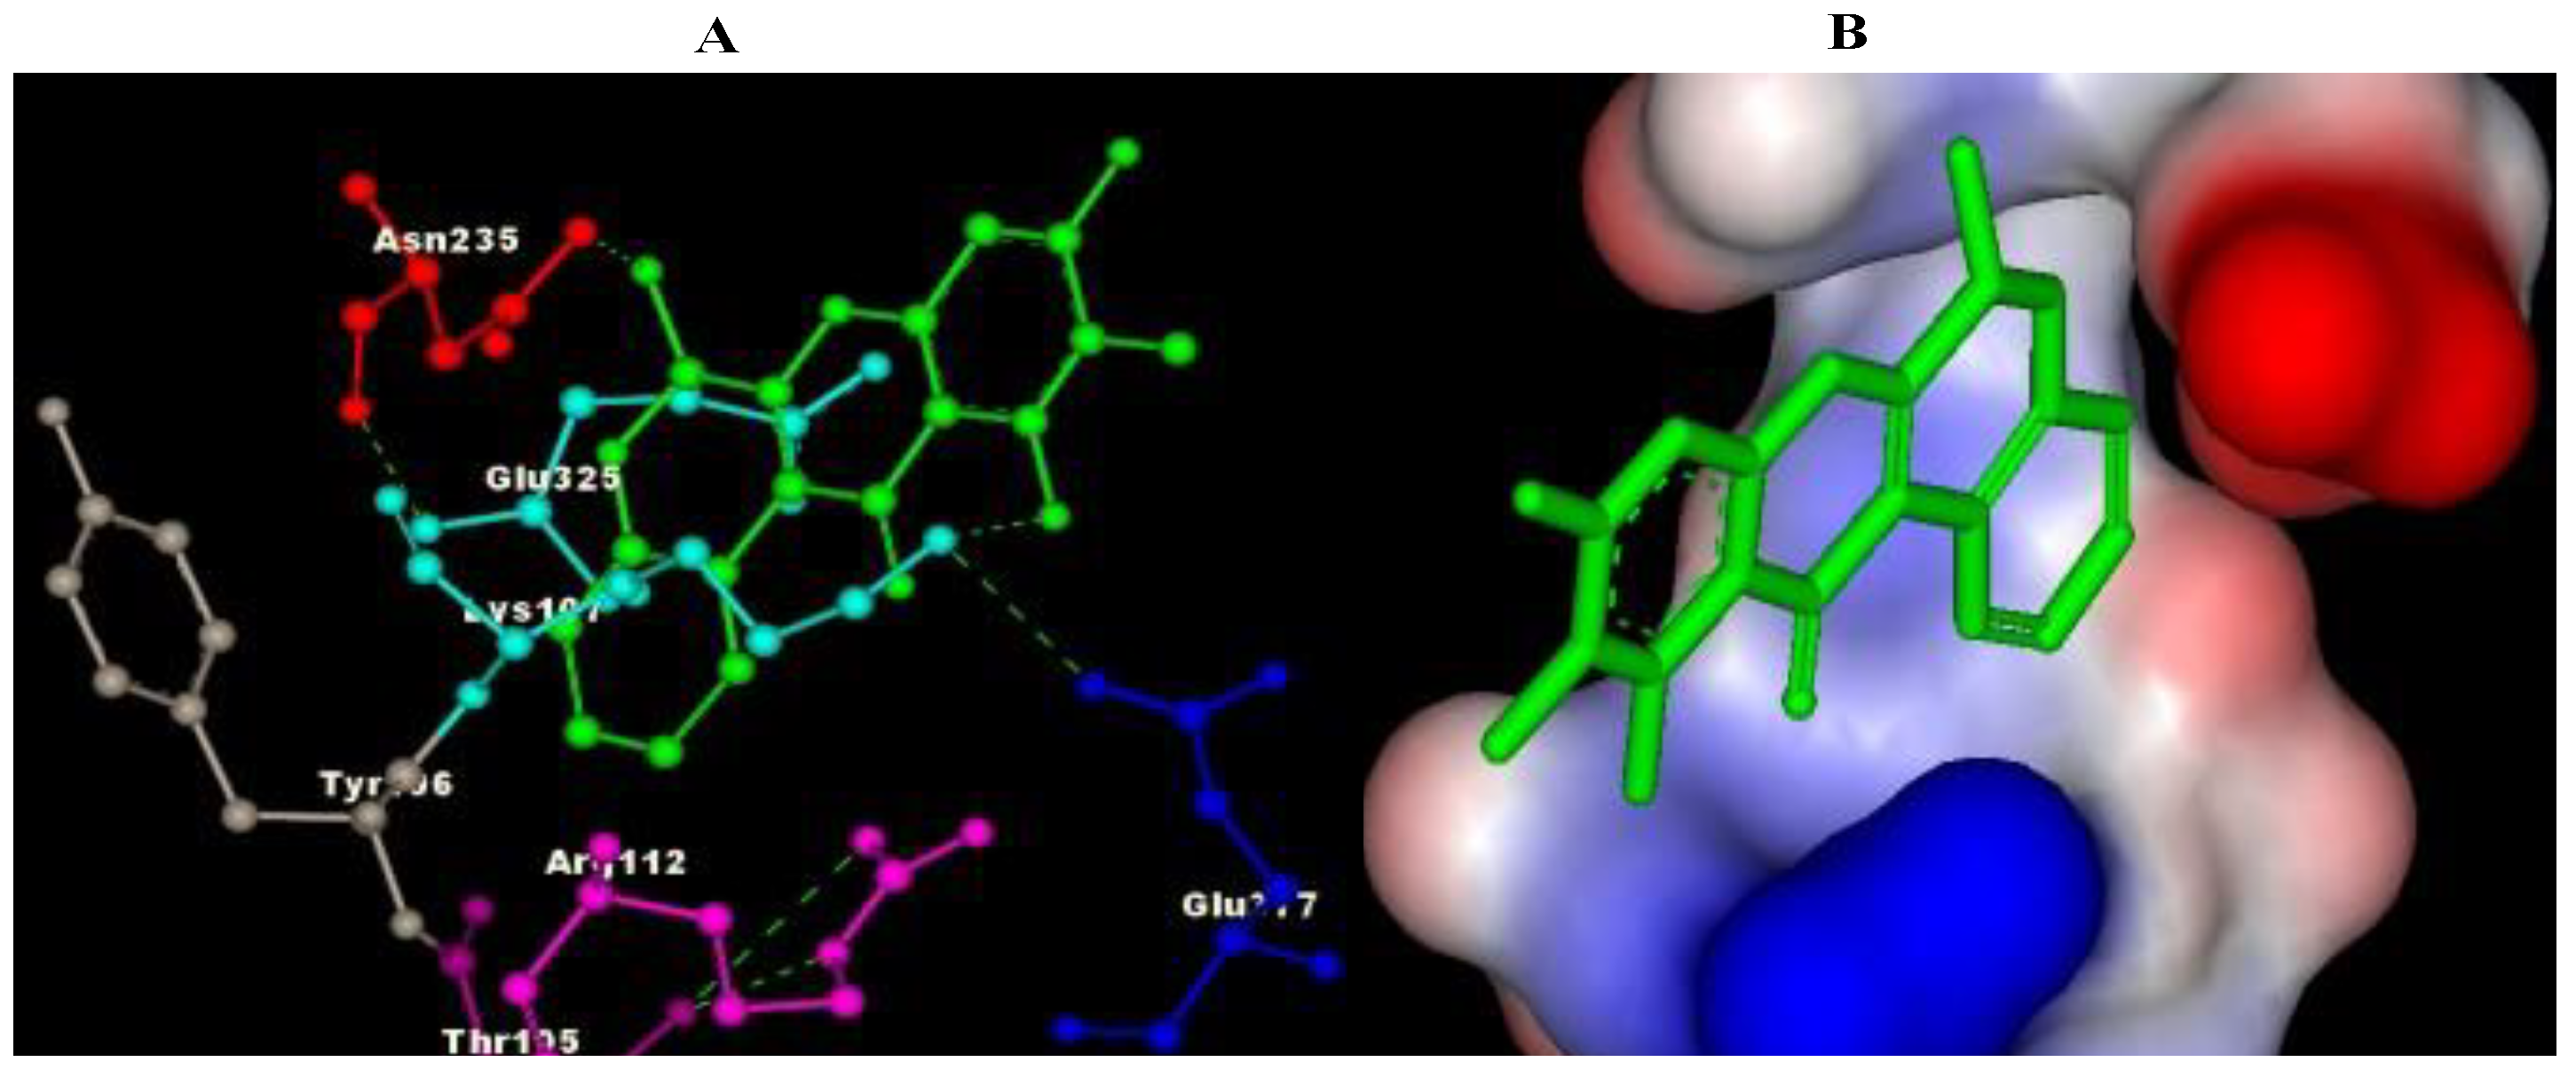
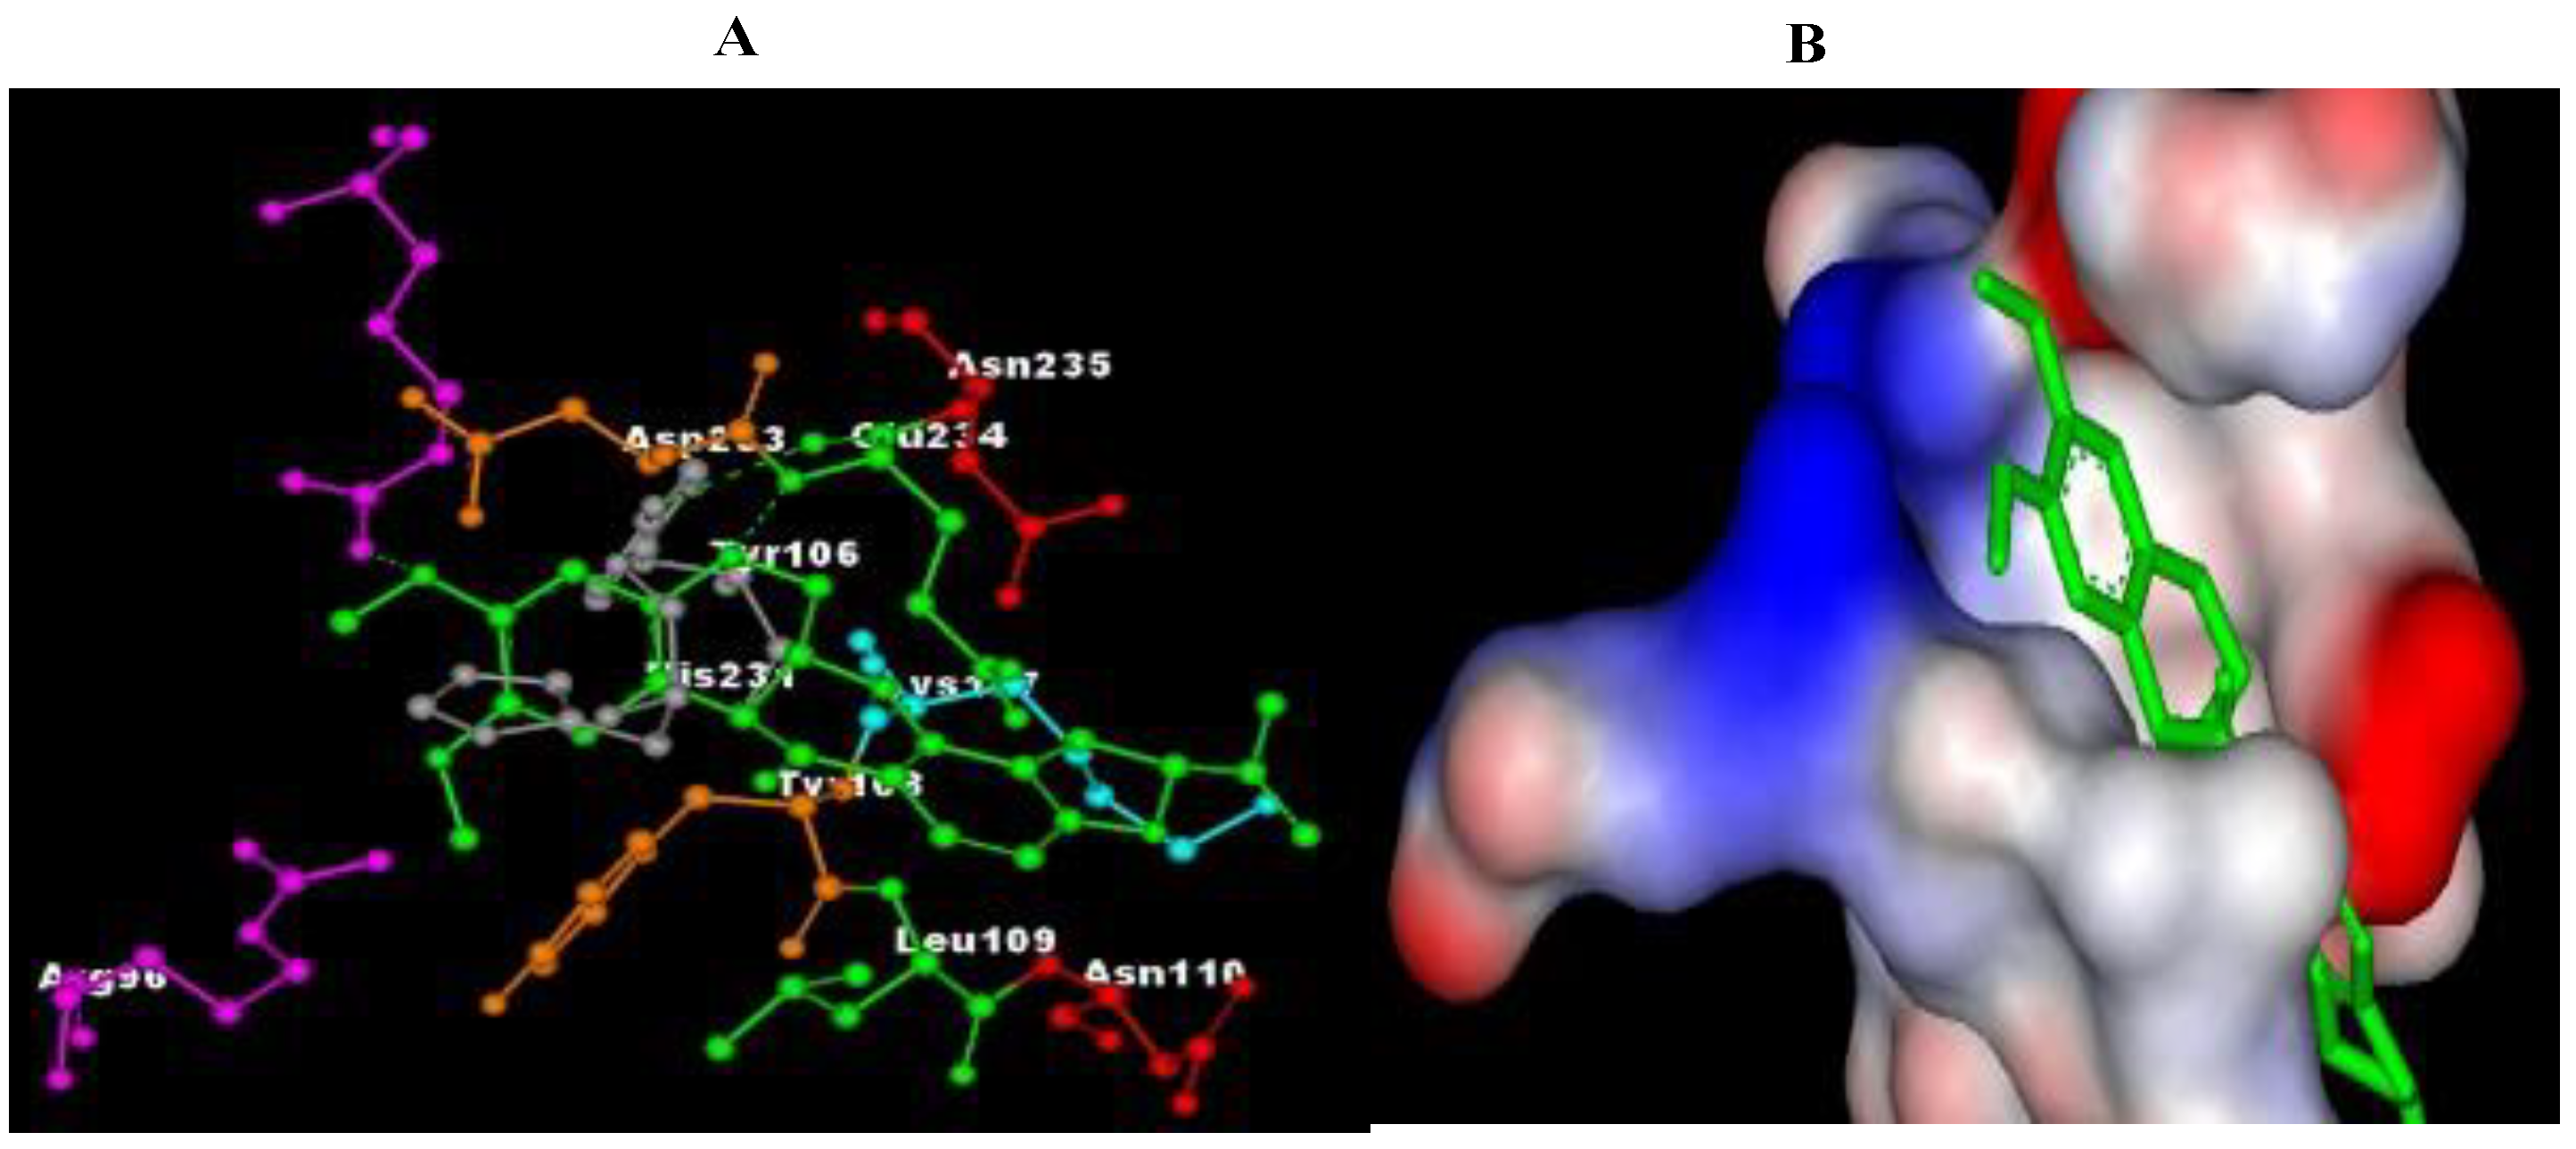
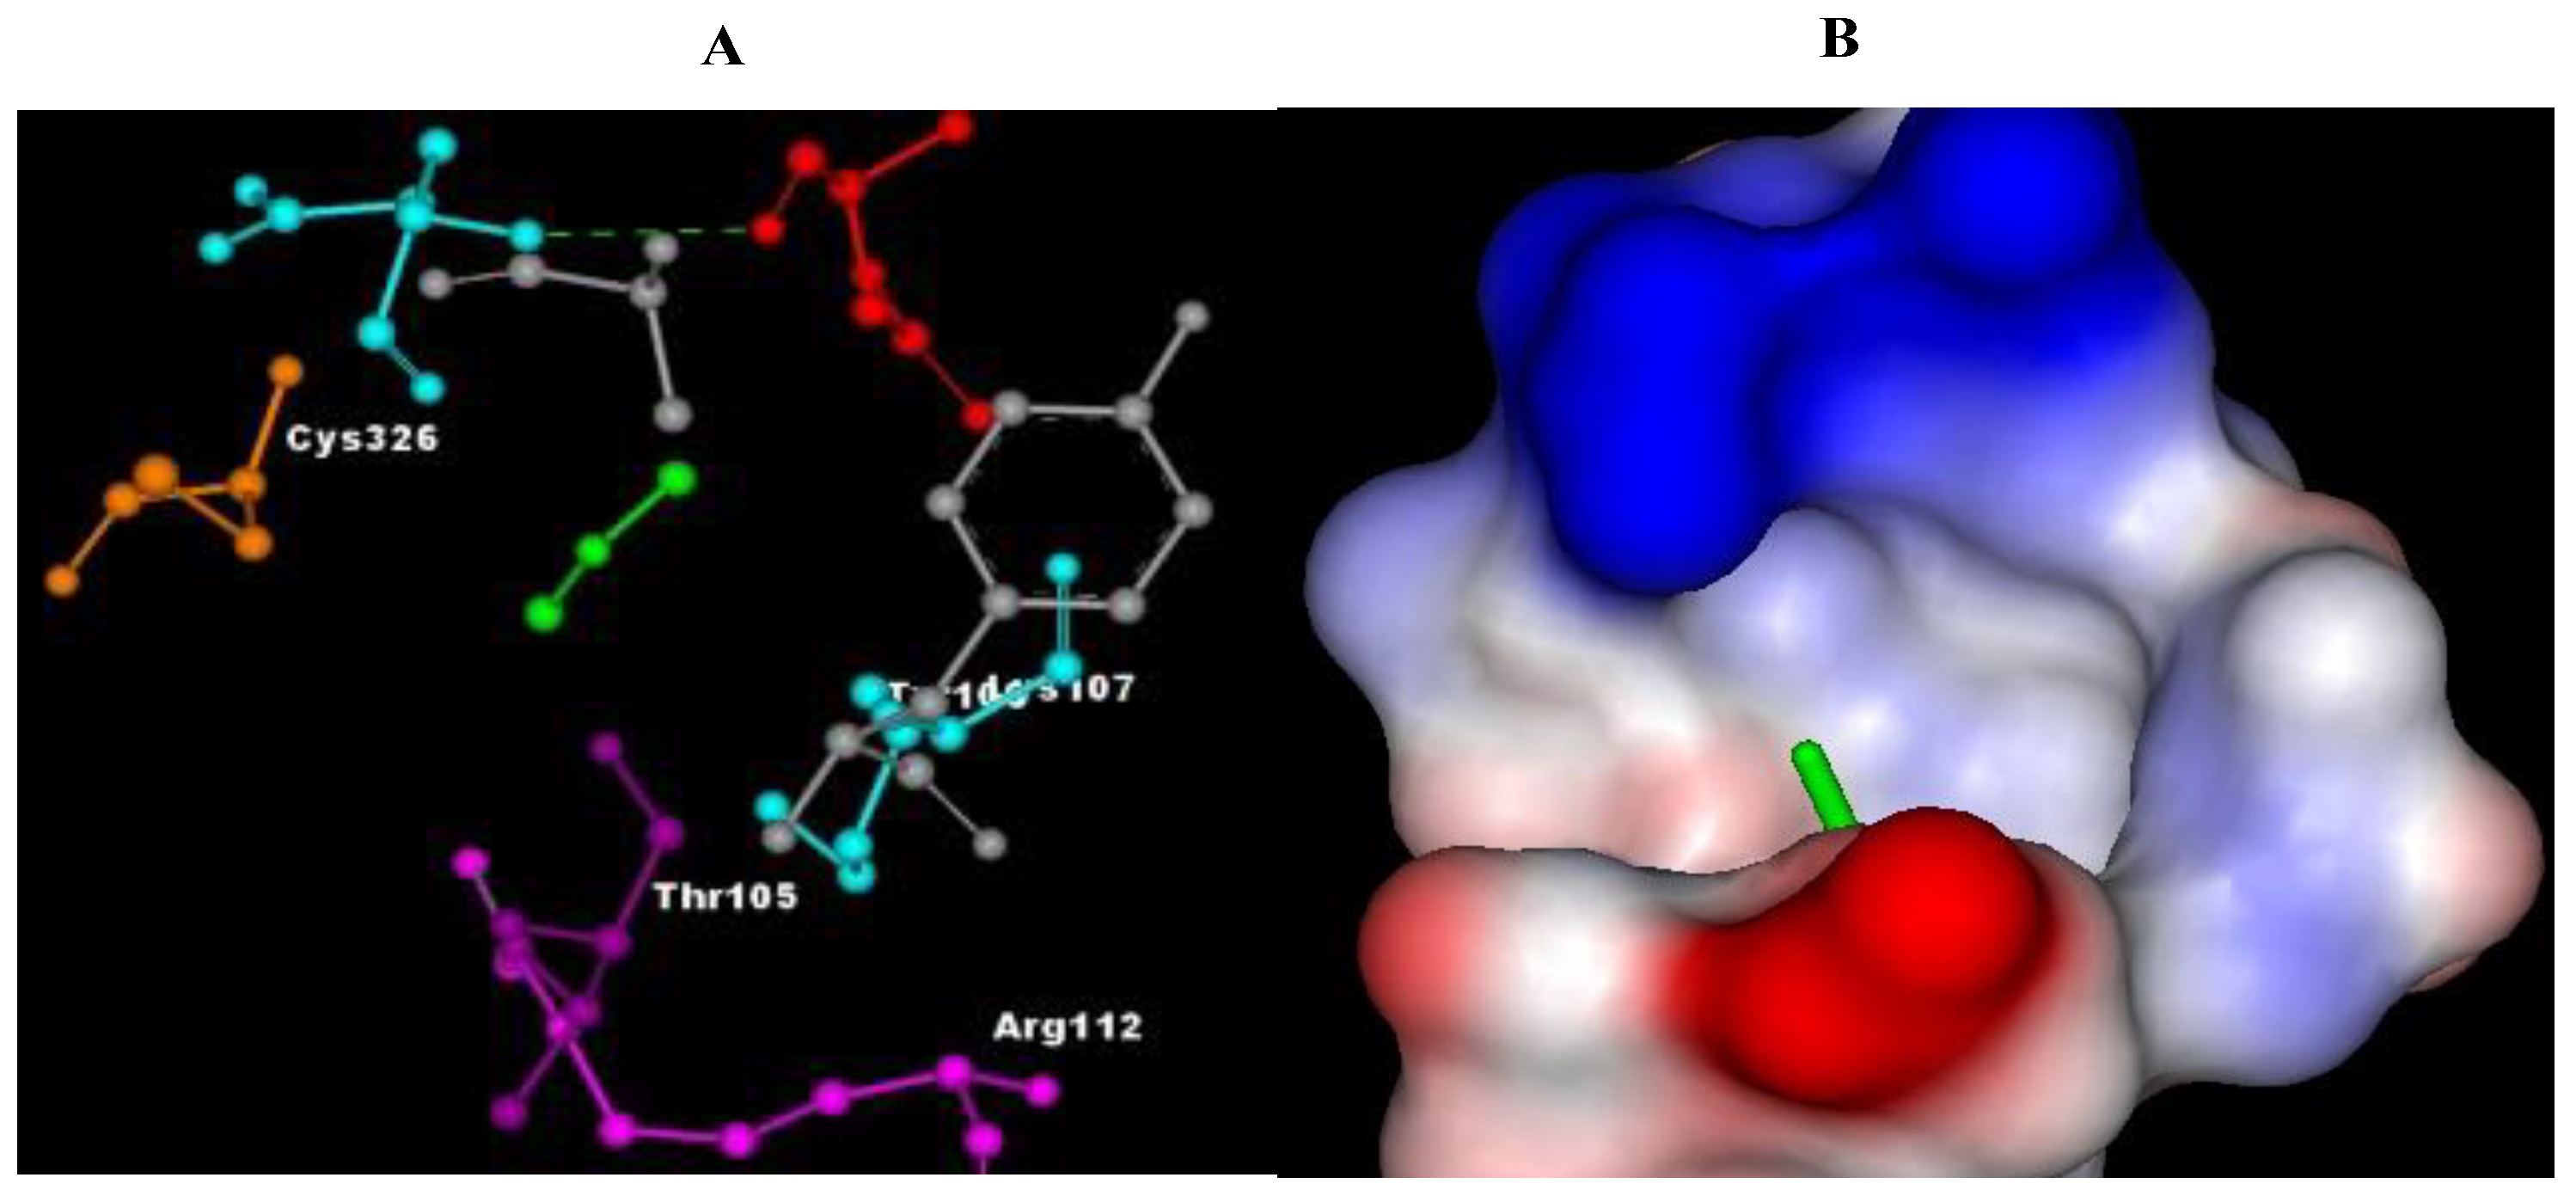
3.3. Molecular Docking
3.4. Molecular Dynamics (MD) Simulations
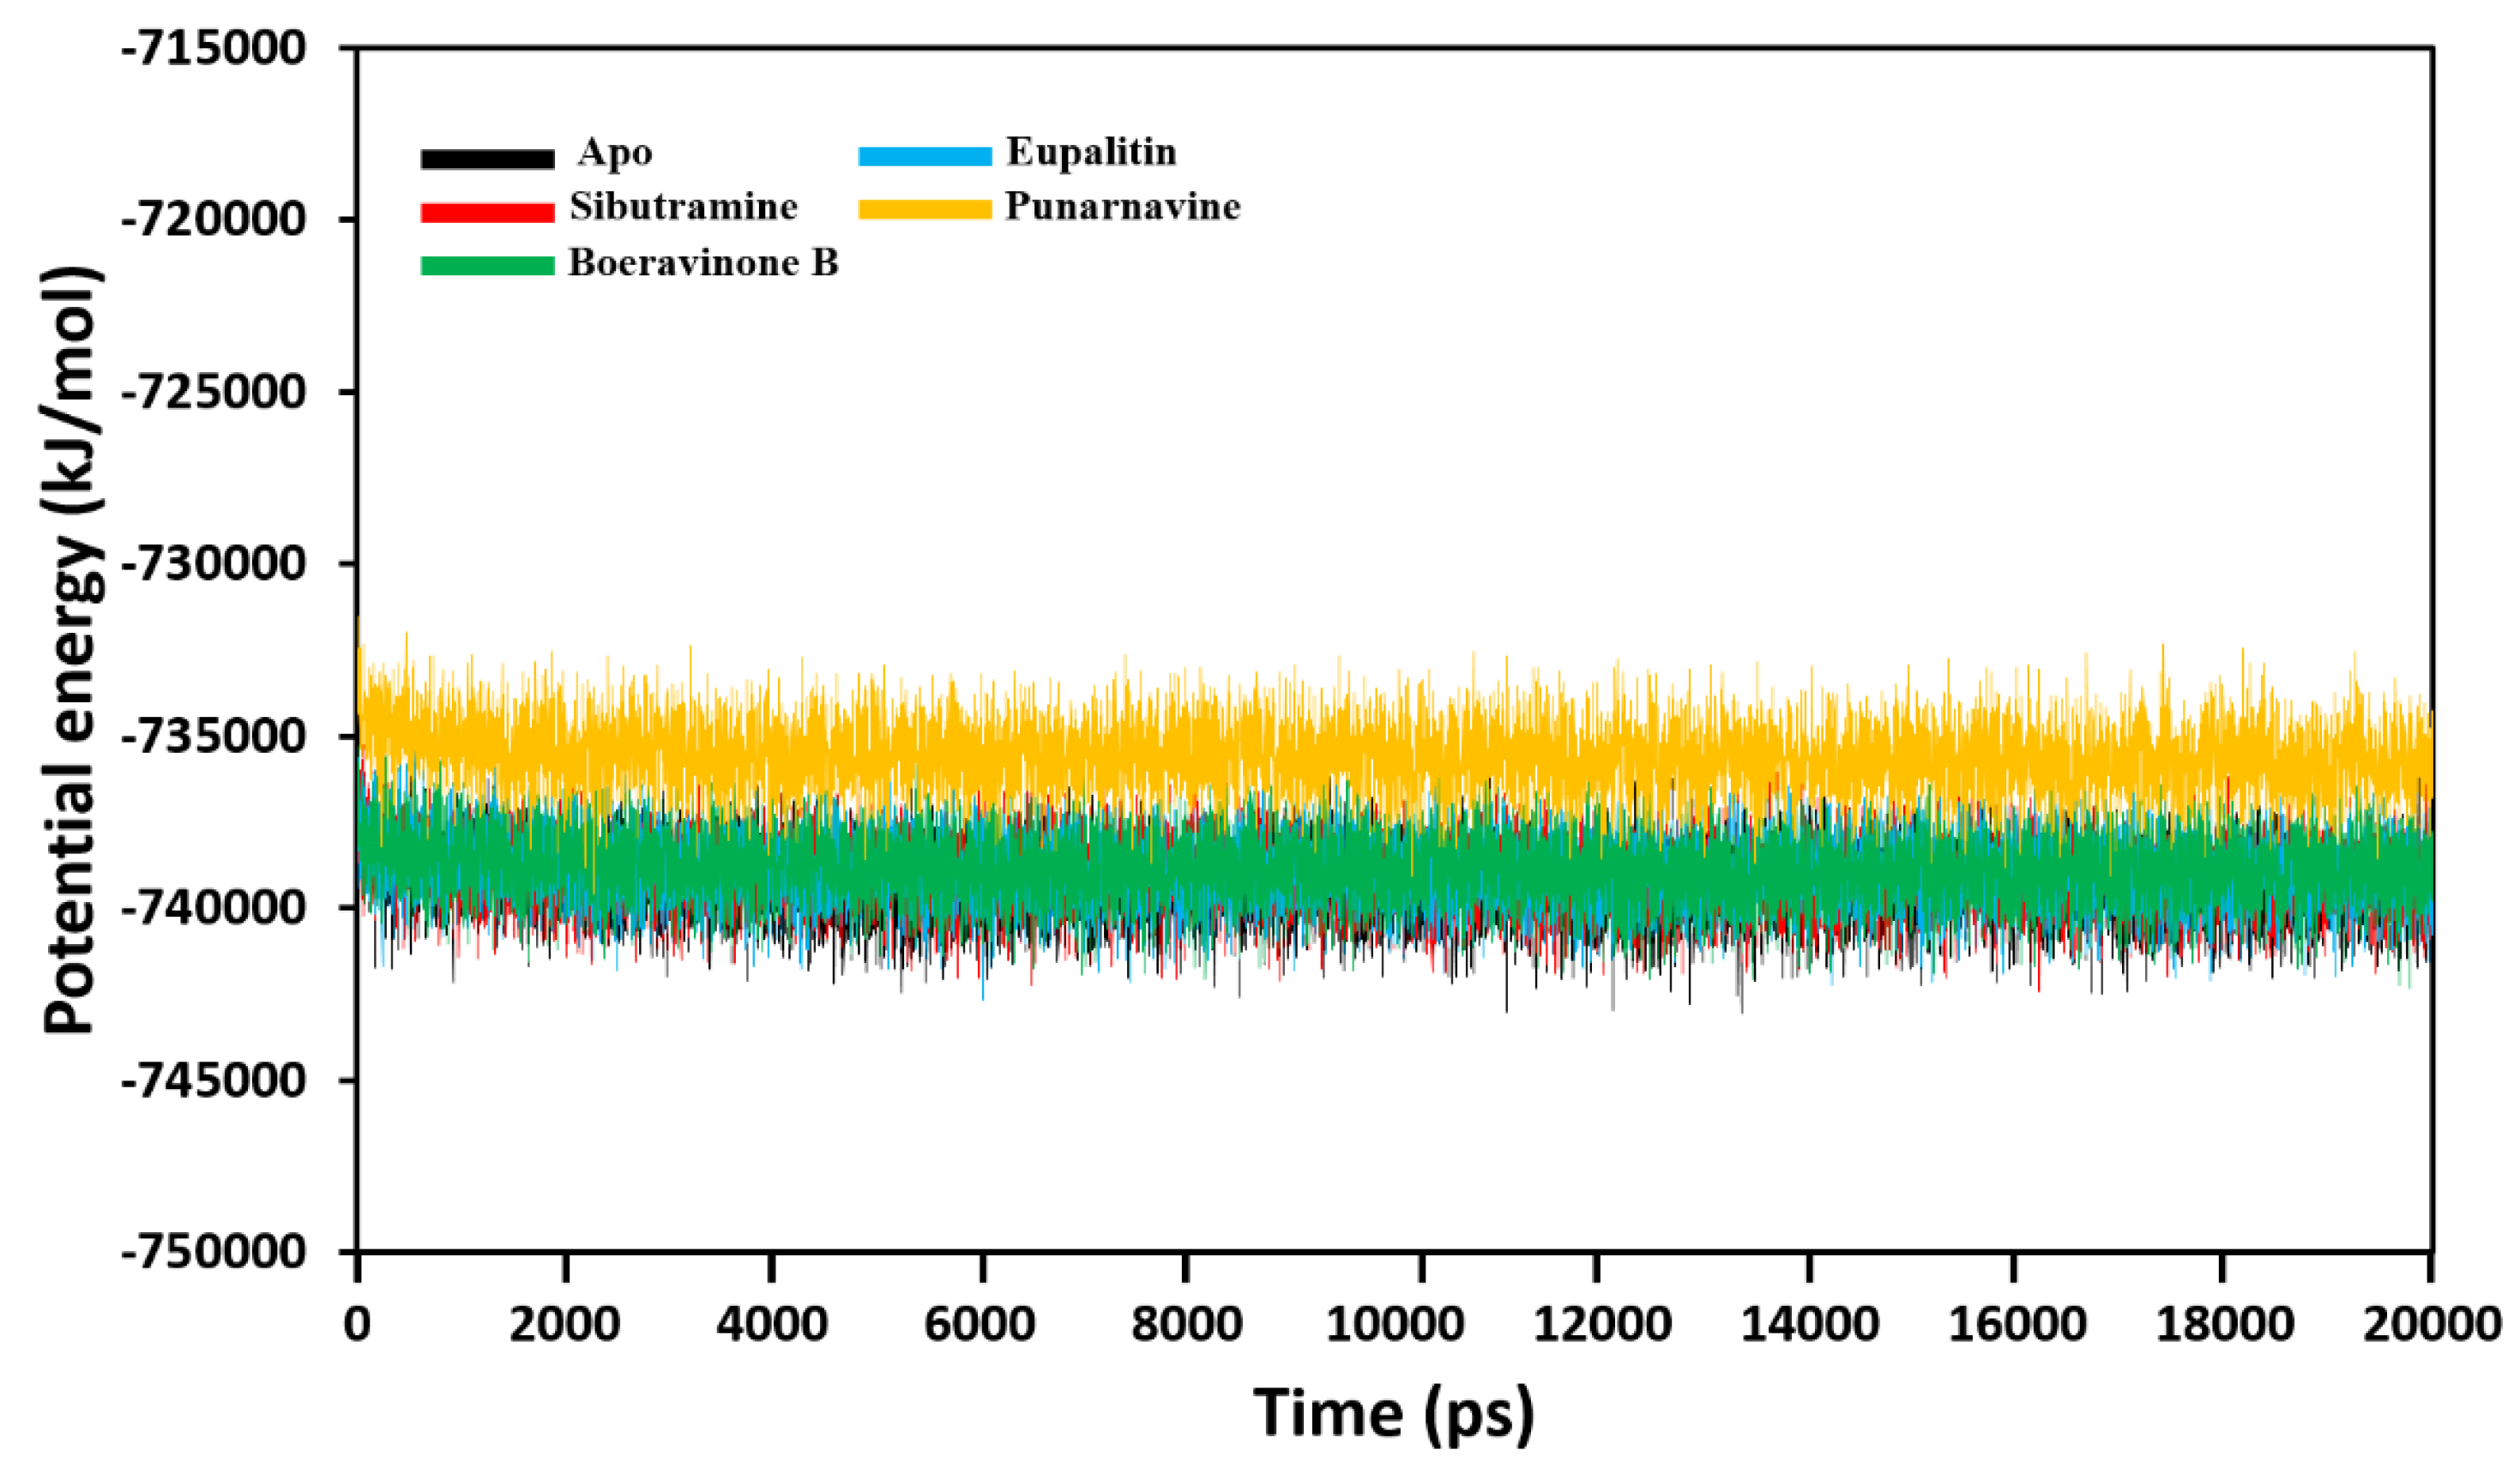
3.4.1. Total Potential Energy Calculations
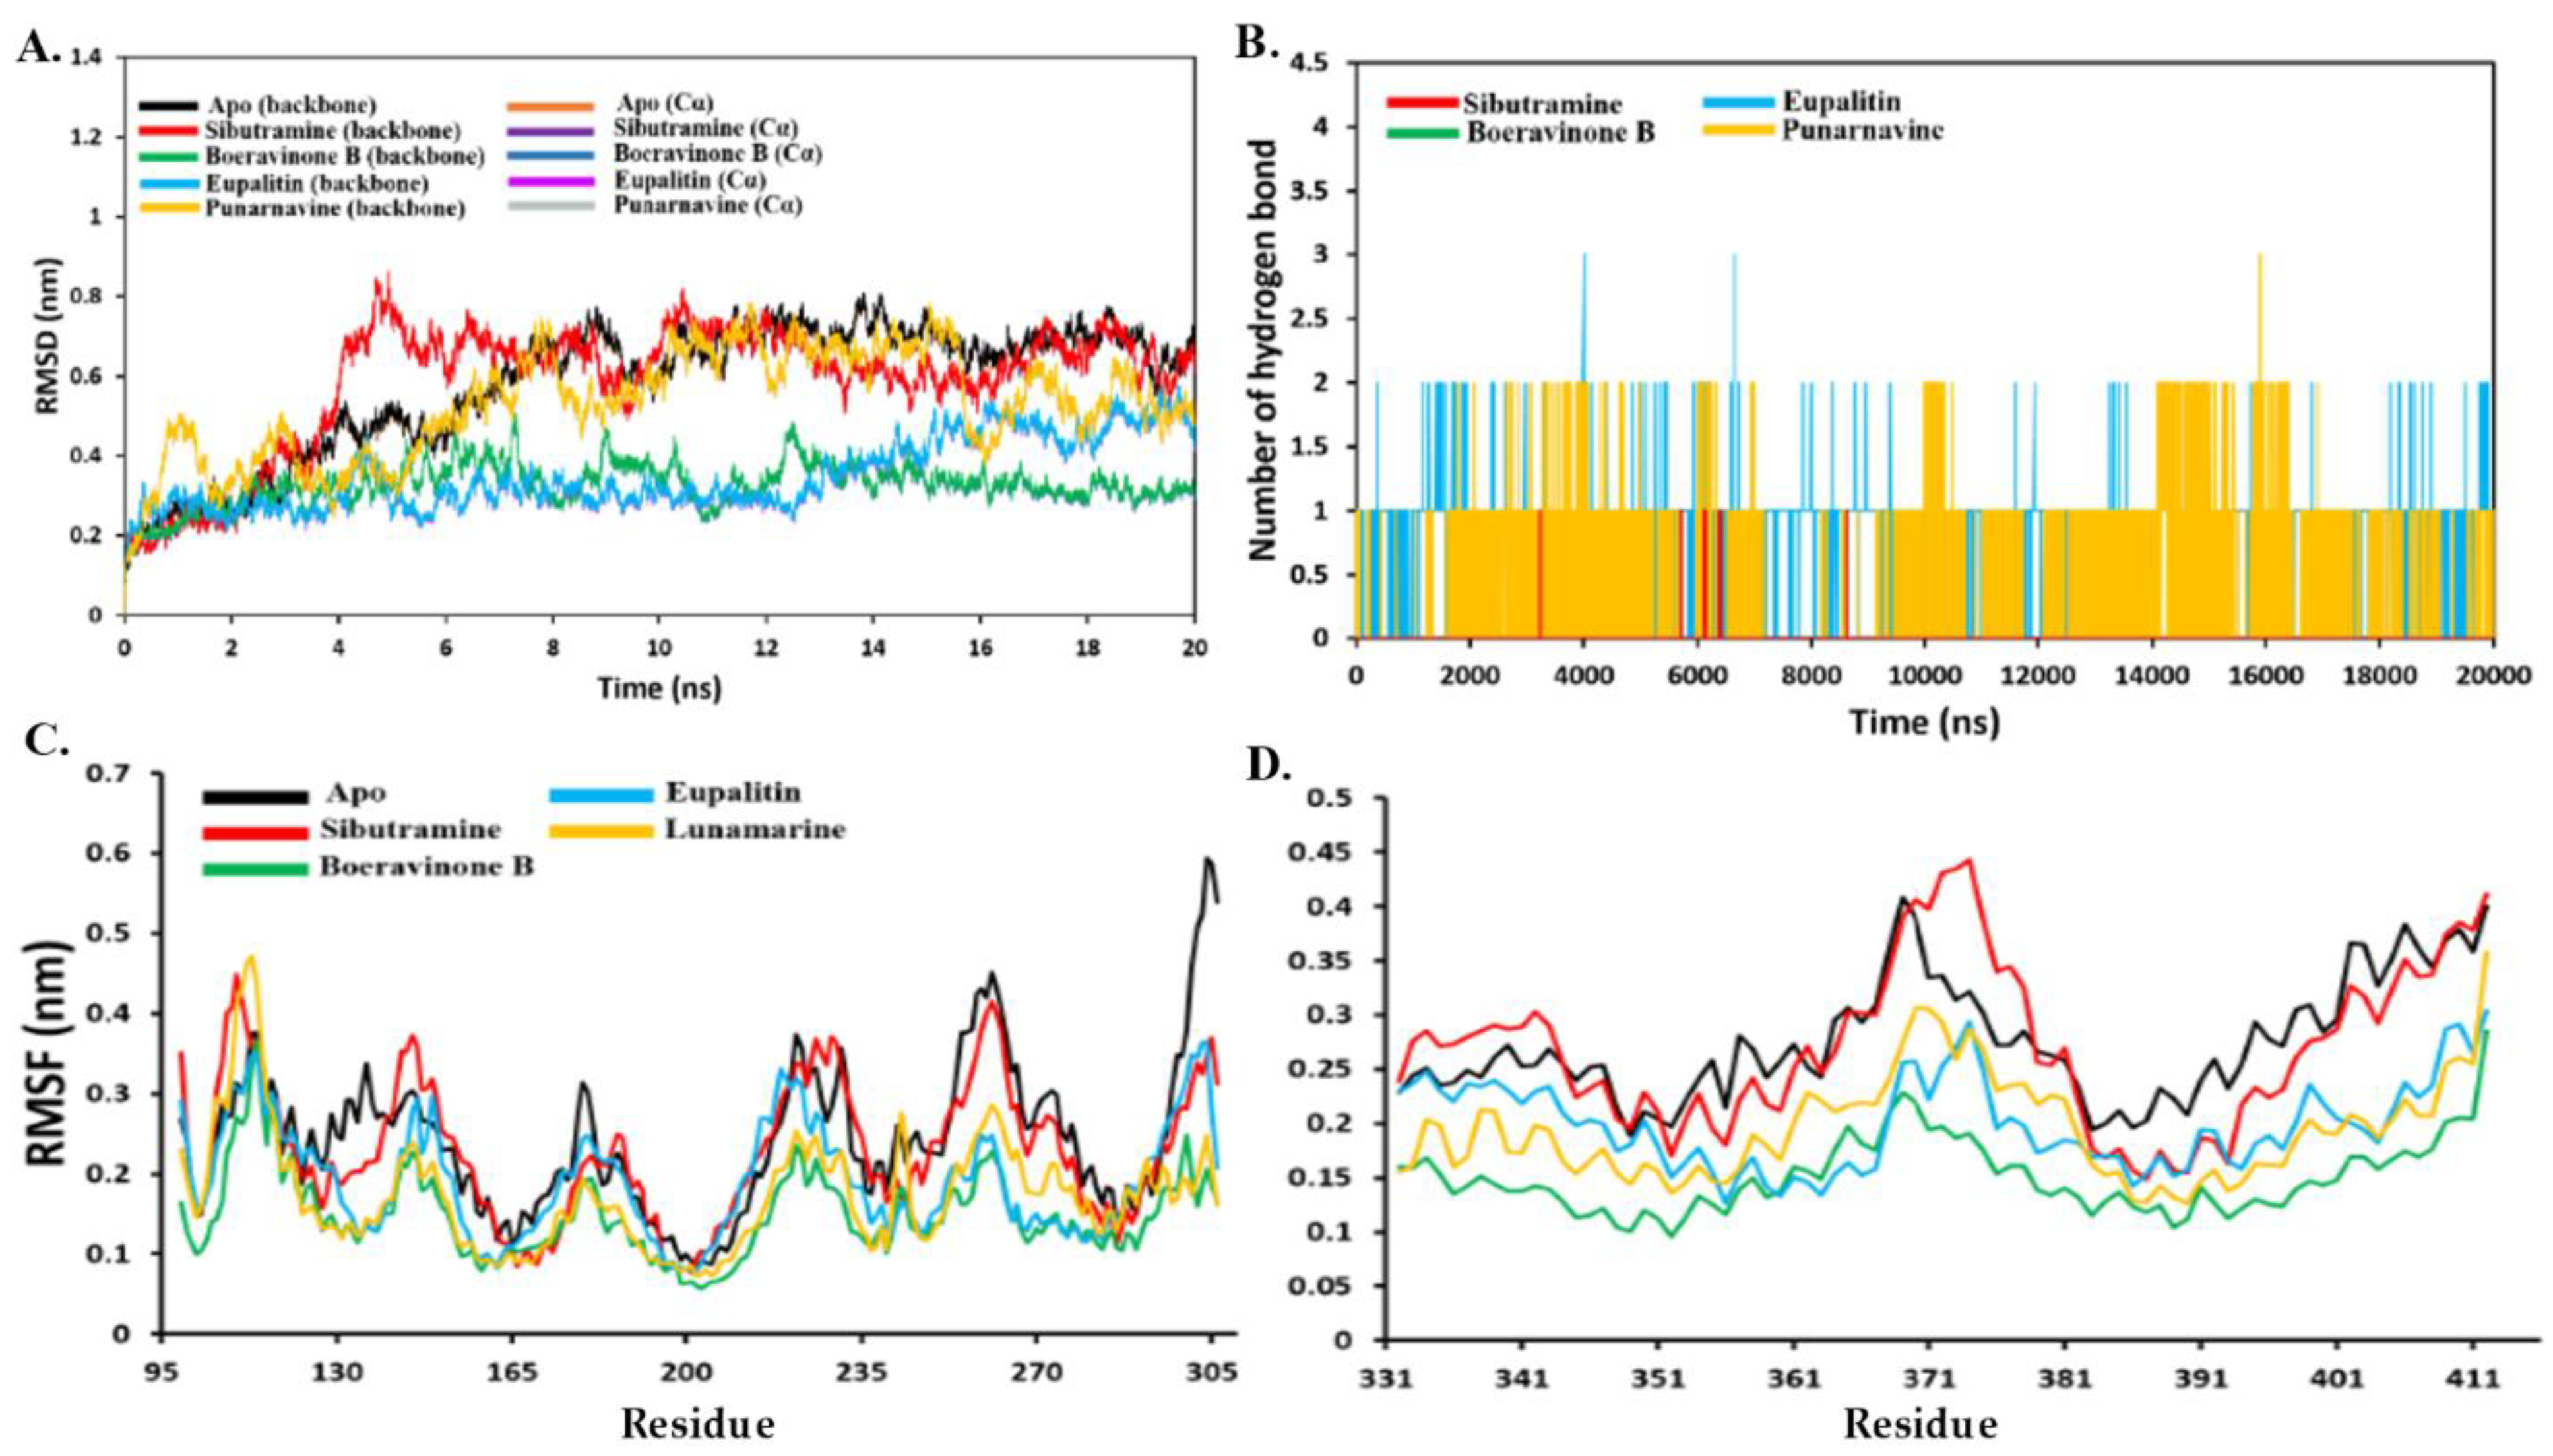
3.4.2. Stability Analysis
3.5. Pharmacological Studies
3.5.1. Effect of Wt-F of B. diffusa Extract on Body Weight in SD Rats
Bodyweight
3.5.2. Effect of Wt-F of B. diffusa Extract on Organs Fat Pad Weight in SD Rats
3.5.3. Effect of Wt-F of B. diffusa Extract on Food Intake in SD Rats
3.5.4. Effects of Wt-F of B. diffusa Extraction Lipid Profile in SD Rats
3.5.5. Effects of Wt-F of B. diffusa Extraction AST & ALT Levels in SD Rats
3.5.6. Effects of Wt-f of B. diffusa Extract on BUN and Creatinine Levels in SD Rats
4. Discussion
5. Conclusions
Author Contributions
Funding
Institutional Review Board Statement
Informed Consent Statement
Data Availability Statement
Acknowledgments
Conflicts of Interest
Abbreviations
References
- Shoaib, A.; Salem-Bekhit, M.M.; Siddiqui, H.H.; Dixit, R.K.; Bayomi, M.; Khalid, M.; Badruddeen; Shakeel, F. Antidiabetic activity of standardized dried tubers extract of Aconitum napellus in streptozotocin-induced diabetic rats. 3 Biotech 2020, 10, 56. [Google Scholar] [CrossRef] [PubMed]
- Savini, I.; Catani, M.V.; Evangelista, D.; Gasperi, V.; Avigliano, L. Obesity-Associated Oxidative Stress: Strategies Finalized to Improve Redox State. Int. J. Mol. Sci. 2013, 14, 10497–10538. [Google Scholar] [CrossRef] [PubMed] [Green Version]
- Haslam, D. Weight management in obesity—Past and present. Int. J. Clin. Pract. 2016, 70, 206–217. [Google Scholar] [CrossRef] [Green Version]
- Dina, C.; Meyre, D.; Gallina, S.; Durand, E.; Körner, A.; Jacobson, P.; Carlsson, L.M.S.; Kiess, W.; Vatin, V.; Lecoeur, C.; et al. Variation in FTO contributes to childhood obesity and severe adult obesity. Nat. Genet. 2007, 39, 724–726. [Google Scholar] [CrossRef] [PubMed]
- Monego, E.T.; Peixoto, M.d.R.; Jardim, P.C.; Sousa, A.L.; Braga, V.L.; Moura, M.F. Different therapies in the treatment of obesity in hypertensive paitients. Bras Cardiol. 1996, 66, 343–347. [Google Scholar]
- Havsteen, B.H. The biochemistry and medical significance of the flavonoids. Pharmacol. Ther. 2002, 96, 167–202. [Google Scholar] [CrossRef]
- Crozier, A.; Jaganath, I.B.; Clifford, M.N. Dietary phenolics: Chemistry, bioavailability and effects on health. Nat. Prod. Rep. 2009, 6, 1001–1043. [Google Scholar] [CrossRef] [PubMed]
- Christensen, R.; Kristensen, P.K.; Bartel, E.M.; Bliddal, H.; Astrup, A. Efficacy and safety of the weight loss drug rimonabant: A meta-analysis of randomized trials. Lancet 2007, 370, 1706–1713. [Google Scholar] [CrossRef]
- Williams, C.M.; Rogers, P.J.; Kirkham, T.C. Hyperphagia in pre-fed rats following oral δ9-THC. Physiol. Behav. 1998, 65, 343–346. [Google Scholar] [CrossRef]
- Kirkham, T.C.; Williams, C.M.; Fezza, F.; Di Marzo, V. Endocannabinoid levels in rat limbic forebrain and hypothalamus in relation to fasting, feeding and satiation: Stimulation of eating by 2-arachidonoyl glycerol. J. Cereb. Blood Flow Metab. 2002, 136, 550–557. [Google Scholar] [CrossRef]
- Anonymous. Indian Pharmacopoeia, Government of India, Ministry of Health and Family Welfare; The Controller of Publications: Delhi, India, 1996; Volumes I and II. [Google Scholar]
- Ali, M. Text Book of Pharmacognosy; CBS Publishers & Distributors: New Delhi, India, 1998; p. 353. [Google Scholar]
- Jarald, E.; Jarald, S.E. Text Book of Pharmacognosy & Phytochemistry; CBS Publishers & Distributors: Bangalore, India, 2007; p. 27. [Google Scholar]
- Kirtikar, K.R.; Basu, B.D. Indian Medicinal Plants; International Book Distributor: Dehradun, India, 2005; p. 2046. [Google Scholar]
- Leyon, P.V.; Lini, C.C.; Kuttan, G. Inhibitory effect of Boerhavia diffusa on experimental metastasis by B16F10 melanoma in C57BL/6 mice. Life Sci. 2005, 76, 1339–1349. [Google Scholar] [CrossRef] [PubMed]
- Chopra, R.N.; Nyer, S.L.; Chopra, I.C. Supplement to the Glossary of Indian Medicinal Plants; CSIR: New Delhi, India, 1980; p. 90. [Google Scholar]
- Singh, R.H.; Udupa, K.N. Studies on the Indian indigenous drug Punarnava (Boerhaavia diffusa L.) Part IV: Preliminary controlled clinical trial in nephrotic syndrome. J. Res. Ind. Med. 1972, 7, 28–33. [Google Scholar]
- Chopra, R.N.; Nayar, S.L.; Chopra, I.C. Glossary of Indian Medicinal Plants; Council of Scientific and Industrial Research (CSIR): New Delhi, India, 1956; p. 39. [Google Scholar]
- Cho, E.; Seddom, J.; Ronser, B.; Willet, W.; Hankison, S. Prospective study of intake of fruits, vegetables, vitamins and carotenoids and related musclopathy. Arch. Opthalmol. 2004, 122, 883–892. [Google Scholar] [CrossRef] [Green Version]
- Ujowundu, C.O.; Igwe, C.U.; Enemor, V.H.; Nwaogu, L.A.; Okafor, O.E. Nutritive and Anti-Nutritive Properties of Boerhavia diffusa and Commelina nudiflora Leaves. Pak. J. Nutr. 2007, 7, 90–92. [Google Scholar] [CrossRef]
- Pereira, D.M.; Faria, J.; Gaspar, L.; Valentao, P.; Andrade, P.B. Boerhavia diffusa: Metabolite profiling of a medicinal plant from Nyctaginaceae. Food Chem Toxicol. 2009, 47, 2142–2149. [Google Scholar] [CrossRef] [PubMed]
- Pari, L.; Amarnath, S.M. Antidiabetic activity of Boerhavia diffusa L. effect on hepatic key enzymes in experimental diabetes. J. Ethnopharmacol. 2004, 91, 109–113. [Google Scholar] [CrossRef]
- Taylor, R.S.L.; Edel, F.; Manandhar, N.P.; Towers, G.H.N. Antimicrobial activities of southern Nepalese medicinal plants. J. Ethnopharmacol. 1996, 50, 97–102. [Google Scholar] [CrossRef]
- Akgul, C.; Saglikoglu, G. Antibacterial activity of crude methanolic extract and its fractions of aerial parts of Anthemis tinctoria. Indian J. Biochem. Biophys. 2005, 42, 395–397. [Google Scholar] [PubMed]
- Cheng, F.; Li, W.; Zhou, Y.; Shen, J.; Wu, Z.; Liu, G.; Lee, W.P.; Tang, Y. Admetsar: A comprehensive source and free tool for evaluating chemical ADMET properties. J. Chem. Inf. Model. 2012, 52, 3099–3105. [Google Scholar] [CrossRef]
- Trott, O.; Olson, A.J. Autodockvina; impoving the speed and accuracy of docking with a new scoring function, effiecient optimization and multithreding. J. Computationa Chem. 2010, 31, 455–461. [Google Scholar]
- Mujumdar, A.M.; Misar, A.V.; Upadhye, A.S. Antidiarrhoeal activity of ethanol extract of the bark of Dalbergia lanceolaria. J. Ethnopharmacol. 2005, 102, 213–216. [Google Scholar] [CrossRef] [PubMed]
- Kaur, G.; Kulkarni, S.K. Antiobesity effect of a polyherbal formulation, ob-200g in female rats fed on cafeteria and atherogenic diets. Indian J. Pharmacol. 2000, 32, 294–299. [Google Scholar]
- Wybenga, D.R.; Pileggi, V.J.; Dirstine, P.H.; Di Giorgio, J. Direct Manual Determination of Serum Total Cholesterol with a Single Stable Reagent. Clin. Chem. 1970, 16, 980–984. [Google Scholar] [CrossRef] [PubMed]
- Friedewald, W.T.; Levy, R.I.; Fredrickson, D.S. Estimation of the Concentration of Low-Density Lipoprotein Cholesterol in Plasma, Without Use of the Preparative Ultracentrifuge. Clin. Chem. 1972, 18, 499–502. [Google Scholar] [CrossRef]
- Reitman, S.; Frankel, S. A Colorimetric Method for the Determination of Serum Glutamic Oxalacetic and Glutamic Pyruvic Transaminases. Am. J. Clin. Pathol. 1957, 28, 56–63. [Google Scholar] [CrossRef] [PubMed]
- Singh, A.; Dubey, S.D.; Patne, S.; Kumar, V. Acute and subchronic toxicity study of calcium based ayurvedic ‘Bhasmas’ and a ‘Pishti’ prepared from marine-sourced animals. J. Herbal Med. Toxicol. 2010, 4, 35–47. [Google Scholar]
- Shirwaikar, A.; Issac, D.; Malini, S. Effects of Avera lanata on cisplatin and gentamicin models of acute renal failure. J. Ethanopharmacol. 2004, 90, 81–86. [Google Scholar] [CrossRef]
- Jubie, S.; Jawahar, N.; Koshy, R.; Gowramma, B.; Murugan, V.; Suresh, B. Anti–arthritic activity of bark extracts of Alangium salviifolium Wang. Rasayan J. Chem. 2008, 1, 433–442.33. [Google Scholar]
- Patil, M.V.K.; Kandhare, A.D.; Bhise, S.D. Anti-arthritic and anti-inflammatory activity of Xanthium srtumarium L. ethanolic extract in Freund’s complete adjuvant induced arthritis. Biomed. Aging Pathol. 2012, 2, 6–15. [Google Scholar] [CrossRef]
- Arnone, M.; Jung, M.; Keane, P.E.; Maffrand, J.P.; Soubrie, P. The CB1 cannabinoid receptor antagonist SR141716 reduces sucrose intake and fat diet preference in lean and obese rats (Abstract). Int. J. Obes. 1999, 23, S63. [Google Scholar]
- Colombo, G.; Agabio, R.; Diaz, G.; Lobina, C.; Reali, R.; Gessa, G.L. Appetite suppression and weight loss after the cannabinoid antagonist SR 141716. Life Sci. 1998, 63, 113–117. [Google Scholar] [CrossRef]
- Simiand, J.; Keane, M.; Keane, P.E.; Soubrié, P. SR 141716, a CB1 cannabinoid receptor antagonist, selectively reduces sweet food intake in marmoset. Behav. Pharmacol. 1998, 9, 179–181. [Google Scholar] [PubMed]
- Kusunoli, M.; Hara, T.; Tsutsumi, K.; Nakamura, T.; Miyata, T.; Sakakibara, F.; Sakamoto, S.; Ogawa, H.; Nakaya, Y.; Storlien, L.H. The lipoprotein lipase activator, No-1886, suppresses fat accumulation and insulin resistance in rats fed a high fat diet. Diabetologia 2000, 43, 875–880. [Google Scholar] [CrossRef] [PubMed] [Green Version]
- MacLean, P.S.; Bergouignan, A.; Cornier, M.-A.; Jackman, M.R. Biology’s response to dieting: The impetus for weight regain. Am. J. Physiol. Integr. Comp. Physiol. 2011, 301, R581–R600. [Google Scholar] [CrossRef] [Green Version]
- Ohia, S.E.; Opere, C.A.; Leday, A.M.; Bagchi, M.; Bagchi, D.; Stohs, S.J. Safety and mechanism of appetite suppression by a novel hydroxycitric acid extract (HCA-SX). Mol. Cell. Biochem. 2002, 238, 89–103. [Google Scholar] [CrossRef]
- Doucet, E.; St-Pierre, S.; Alméras, N.; Imbeault, P.; Mauriège, P.; Pascot, A.; Despres, J.-P.; Tremblay, A. Reduction of visceral adipose tissue during weight loss. Eur. J. Clin. Nutr. 2002, 56, 297–304. [Google Scholar] [CrossRef]
- Camacho, S.; Ruppel, A. Is the calorie concept a real solution to the obesity epidemic? Glob. Health. Action. 2017, 10, 1289650. [Google Scholar] [CrossRef] [Green Version]
- Golbidi, S.; Badran, M.; Laher, I. Antioxidant and Anti-Inflammatory Effects of Exercise in Diabetic Patients. Exp. Diabetes Res. 2012, 2012, 941868. [Google Scholar] [CrossRef] [Green Version]
- Cristino, L.; Bisogno, T.; Di Marzo, V. Cannabinoids and the expanded endocannabinoid system in neurological disorders. Nat. Rev. Neurol. 2019, 16, 9–29. [Google Scholar] [CrossRef]
- Koch, M.; Luis, V.; Kim, J.G.; Kim, J.D.; Hernandez-Nuno, F.; Simonds, E.S.; Castorena, M.C.; Claudia, R.V.; Elmquist, K.J.; Morozov, M.Y.; et al. Hypothalamic POMC neurons promote cannabinoid-induced feeding. Nature 2015, 519, 45–50. [Google Scholar] [CrossRef] [Green Version]
- Thomas, B.F.; Zhang, Y. Overcoming the Psychiatric Side Effects of the Cannabinoid CB1 Receptor Antagonists: Current Approaches for Therapeutics Development. Curr. Top. Med. Chem. 2019, 19, 1418–1435. [Google Scholar] [CrossRef]
- Silvestri, C.; Di, M.V. The endocannabinoid system in energy homeostasis and the etiopathology of metabolic disorders. Cell Metab. 2013, 17, 475–490. [Google Scholar] [CrossRef] [PubMed] [Green Version]
- Quarta, C.; Bellocchio, L.; Mancini, G.; Mazza, R.; Cervino, C.; Braulke, L.J.; Fekete, C.; Latorre, R.; Nanni, C.; Bucci, M.; et al. CB1 Signaling in Forebrain and Sympathetic Neurons Is a Key Determinant of Endocannabinoid Actions on Energy Balance. Cell Metab. 2010, 11, 273–285. [Google Scholar] [CrossRef] [PubMed] [Green Version]
- Quarta, C.; Mazza, R.; Obici, S.; Pasquali, R.; Pagotto, U. Energy balance regulation by endocannabinoids at central and peripheral levels. Trends Mol. Med. 2011, 17, 518–526. [Google Scholar] [CrossRef]
- Trillou, C.R.; Delgorge, C.; Menet, C.; Arnone, M.; Soubrié, P. CB1 cannabinoid receptor knockout in mice leads to leanness, resistance to diet-induced obesity and enhanced leptin sensitivity. Int. J. Obes. 2004, 28, 640–648. [Google Scholar] [CrossRef] [Green Version]
- Khalid, M.; Siddiqui, H.H. Evaluation of weight reduction and anti–cholesterol activity of Punarnava root extract against high fat diets induced obesity in experimental rodent. Asian Pac. J. Trop. Biomed. 2012, 2, S1323–S1328. [Google Scholar] [CrossRef]
- Ferron, A.J.T.; Francisqueti, F.V.; Minatel, I.O.; Silva, C.C.V.D.A.; Bazan, S.G.Z.; Kitawara, K.A.H.; Garcia, J.L.; Correa, C.R.; Moreto, F.; Ferreira, A.L.A. Association between Cardiac Remodeling and Metabolic Alteration in an Experimental Model of Obesity Induced by Western Diet. Nutrients 2018, 10, 1675. [Google Scholar] [CrossRef] [Green Version]
- Saltiel, A.R.; Kahn, C.R. Insulin signalling and the regulation of glucose and lipid metabolism. Nature 2001, 414, 799–806. [Google Scholar] [CrossRef]
- Yamamoto, Y.; Yasuoka, A. Welsh Onion Attenuates Hyperlipidemia in Rats Fed on High-Fat High-Sucrose Diet. Biosci. Biotechnol. Biochem. 2010, 74, 402–404. [Google Scholar] [CrossRef] [Green Version]
- Quin, S.D.; Raghum, P.S. Effects of (−)-epicatechin, a flavonoid on lipid peroxidation and antioxidants in streptozotocin-induced diabetic liver, kidney and heart. Pharmacol. Rep. 2005, 57, 610–615. [Google Scholar]
- Hayes, M.L. Guidelines for acute oral toxicity testing. In Principles and Methods of Toxicology, 2nd ed.; Raven Press: New York, NY, USA, 1989; pp. 143–152. [Google Scholar]
- Crook, M.A. Clinical Chemistry and Metabolic Medicine, 7th ed.; Hodder Arnold: London, UK, 2006; p. 426. [Google Scholar]
- Wallace, T.M.; Utzschneider, K.M.; Tong, J.; Carr, D.B.; Zraika, S.; Bankson, D.D.; Knopp, R.H.; Kahn, S.E. Relationship of Liver Enzymes to Insulin Sensitivity and Intra-Abdominal Fat. Diabetes Care 2007, 30, 2673–2678. [Google Scholar] [CrossRef] [Green Version]
- Amin, K.A.; Nagy, M.A. Effect of Carnitine and herbal mixture extract on obesity induced by high fat diet in rats. Diabetol. Metab. Syndr. 2009, 1, 17. [Google Scholar] [CrossRef] [PubMed] [Green Version]
- Tang, J.; Yan, H.; Zhuang, S. Inflammation and Oxidative Stress in Obesity-Related Glomerulopathy. Int. J. Nephrol. 2012, 2012, 608397. [Google Scholar] [CrossRef] [PubMed] [Green Version]
- Rosas-Villegas, A.; Sánchez-Tapia, M.; Avila-Nava, A.; Ramírez, V.; Tovar, A.R.; Torres, N. Differential Effect of Sucrose and Fructose in Combination with a High Fat Diet on Intestinal Microbiota and Kidney Oxidative Stress. Nutrients 2017, 9, 393. [Google Scholar] [CrossRef] [PubMed]
- Grgic, I.; Campanholle, G.; Bijol, V.; Wang, C.; Sabbisetti, V.S.; Ichimura, T.; Humphreys, B.D.; Bonventre, J.V. Targeted proximal tubule injury triggers interstitial fibrosis and glomerulosclerosis. Kidney Int. 2012, 82, 172–183. [Google Scholar] [CrossRef] [Green Version]
- Nuttall, F.Q. Body mass index: Obesity, BMI, and health: A critical review. Nutr. Today 2015, 50, 117. [Google Scholar] [CrossRef] [Green Version]


| S. No. | Extract | λ (nm) | Rf Values | Area |
|---|---|---|---|---|
| 1 2 | B. diffusa | 254 | 0.11, 0.28 0.38, 0.43 0.61, 0.71 0.90, 0.96 | 625.52, 4821.79 635.28, 498.76 4338.61, 4487.26 4651.92, 4367.64 |
| 366 | 0.61, 0.90 | 6647.29, 1029.34 |
| Molecule | Eupalitin | Boeravinone B | Punarnavine |
|---|---|---|---|
| Formula | C17H14O7 | C17H12O6 | C18H15NO4 |
| Molecular weight | 330.29 g/mol | 312.27 g/mol | 309.32 g/mol |
| No. of heavy atoms | 24 | 23 | 23 |
| No. Aromatic atoms | 16 | 16 | 16 |
| Fraction Csp3 | 0.12 | 0.12 | 0.17 |
| No. rotatable bonds | 3 | 0 | 2 |
| No. H-bond acceptors | 7 | 6 | 4 |
| No. H-bond donors | 3 | 3 | 0 |
| Mol. Refractivity | 86.97 | 82.63 | 87.46 |
| TPSA | 109.36 Å2 | 100.13Å2 | 49.69 Å2 |
| iLOGP | 2.27 | 2.47 | 3.14 |
| XLOGP | 2.82 | 2.39 | 3.12 |
| WLOGP | 2.59 | 2.24 | 2.94 |
| MLOGP | 0.07 | 0.87 | 1.65 |
| SILICOS -IT Log P | 2.59 | 2.62 | 3.47 |
| Log P | 2.59 | 2.12 | 2.87 |
| ESOL Log S | −3.96 | −3.80 | −4.11 |
| Solubility (mg/mL) | 3.62 × 10⁻² | 4.99 × 10⁻² | 2.42 × 10⁻² |
| Solubility (mol/L) | 1.10 × 10⁻⁴ | 1.60 × 10⁻⁴ | 7.83 × 10⁻⁵ |
| Class | Soluble | Soluble | Moderately soluble |
| Log S (Ali clss) | −4.77 | −4.13 | −3.83 |
| Solubility (mg/mL) | 5.56 × 10⁻³ | 2.29 × 10⁻² | 4.55 × 10⁻² |
| Solubility (mol/L) | 1.68 × 10⁻⁵ | 7.34 × 10⁻⁵ | 1.47 × 10⁻⁴ |
| Class | Moderately soluble | Moderately Soluble | Soluble |
| SILICOS-IT | −4.63 | −4.56 | −5.55 |
| Silicos-IT Class | Moderately soluble | Moderately soluble | Moderately soluble |
| Molecule | Eupalitin | Boeravinone B | Punarnavine |
|---|---|---|---|
| GI absorption | High | High | High |
| BBB permeant | No | NO | Yes |
| Pgp substrate | No | NO | No |
| CYP1A2 inhibitor | Yes | Yes | Yes |
| CYP2C19 inhibitor | No inhibitor | No inhibitor | No inhibitor |
| CYP2C9 inhibitor | Yes | No | Yes |
| CYP2D6 inhibitor | Yes | Yes | Yes |
| CYP3A4 inhibitor | Yes | Yes | Yes |
| Log Kp (skin permeation) (cm/s) | −6.31 | −6.51 | −5.97 |
| Lipinski No of violation | 0 | 0 | 0 |
| GHOS | Yes | Yes | Yes |
| Veber | Yes | Yes | Yes |
| EGAN No. violation | Yes | Yes | Yes |
| MUEGGE No violation | Yes | Yes | Yes |
| Bioavailability Score | 0.55 | 0.55 | 0.55 |
| PAINS | 0 | 0 | 0 |
| BRENK | 0 | 0 | 0 |
| Lead likeness | Yes | Yes | Yes |
| Synthetic accessibility | 3.40 | 3.82 | 2.78 |
| Target | Ligands Chemical Structure | Binding Energy Score (Kcal/Mol) | H-Bond Interaction | Hydrophobic Interaction | H-Bond Distance |
|---|---|---|---|---|---|
| Cannabinoid Receptor | Sibutramine | +61.22 | Thr105, Tyr106, Lys107, Arg112, Asn235, Ala324, Glu325, Cys326 | ARGA:112: THR A:105 GLU A:325, ASN A:235:O | 3.20207, 3.08945 |
| Boeravinone B | −3.11 | Thr105, Tyr106, Lys107, Arg112, Asn235, Glu325 Glu377 | THR A: 105, GLY A:329, TYR A:106, LEU A:113, LYS A:107, GLU A:377, LYSA:107, ARG A:112, THR A:105, ARG A:11, THR A:105, ASN A:235, GLU A:325, ASN A:235 | 2.73705, 3.01712 2.62171, 2.22553 2.98739, 3.20207 2.44576, 3.08945 | |
| Eupalitin | −4.28 kcal | Thr105, Tyr106, Lys107, Arg112 Glu234, Asn235, Ala324, Glu325 Cys326, Glu377 | LYS A:107, GLU A:377, ARG A:112, THR A:105, ARG A:112, GLU A:325, ASN A:235:O | 2.62171, 3.20207 2.66729, 3.08945 | |
| Punarnavine | −0.91 | Arg96, Tyr106, Lys107, Tyr108 Leu109, Asn110, His231, Asp233, Glu234, Asn235, Arg322 | A:ARG96:, A:ASN 205, A:TYR 106, GLU A:234, LYS A:107, GLU A:377,TYR A:108, THR A:111, GLU A:234, ARG A:322 | 2.2459, 2.33441 2.44846, 2.60911 2.62171, 2.63316 |
| Groups | Treatments | Initial Body Weight (g) | Final Body Weight (g) | % Increase in Body Weight | % Decrease in Body Weight |
|---|---|---|---|---|---|
| I | Normal Control (NC) | 135.30 ± 3.27 | 203.42 ± 2.24 | 50.35 | - |
| II | High Fat Diet (HFD) | 136.12 ± 2.47 | 320.00 ± 5.01 * | 135.09 | - |
| III | HFD + Sibutramine (5 mg/kg) | 135.23 ± 2.39 | 226.67 ± 2.01 # | 67.61 | 67.48 |
| IV | HFD + Hx-F (200 mg/kg) | 137.50 ± 1.71 | 294.27 ± 4.24 ns | 114.01 | 21.08 |
| V | HFD + chlo-F (200 mg/kg) | 137.50 ± 3.35 | 287.08 ± 4.67 ns | 108.78 | 26.31 |
| VI | HFD + n-but-F (200 mg/kg) | 136.40 ± 1.54 | 284.17 ± 3.21 ns | 108.34 | 26.75 |
| VII | HFD + wt-F (200 mg/kg) | 135.23 ± 2.38 | 228.73 ± 4.17 # | 69.14 | 65.95 |
| Groups | Treatments | Heart (g) | Kidney (g) | Liver (g) | Uterus (g) |
|---|---|---|---|---|---|
| I | Normal Control (NC) | 1.75 ± 0.11 | 1.17 ± 0.09 | 1.54 ± 0.09 | 1.49 ± 0.07 |
| II | High Fat Diet (HFD) | 2.34 ± 0.14 * | 1.59 ± 0.18 * | 2.76 ± 0.16 * | 2.80 ± 0.06 * |
| III | HFD + Sibutramine (5 mg/kg) | 1.77 ± 0.14 # | 1.19 ± 0.09 # | 1.67 ± 0.13 # | 1.54 ± 0.08 # |
| IV | HFD + Hx-F (200 mg/kg) | 2.22 ± 0.17 ns | 1.28 ± 0.11 ns | 2.61± 0.17 ns | 2.15 ± 0.10 ns |
| V | HFD + chlo-F (200 mg/kg) | 2.12 ± 0.20 ns | 1.31 ± 0.12 ns | 2.49 ± 0.18 ns | 2.11± 0.11 ns |
| VI | HFD + n-but-F (200 mg/kg) | 2.29 ± 0.12 ns | 1.29 ± 0.04 ns | 2.71 ± 0.10 ns | 2.09 ± 0.13 ns |
| VII | HFD + wt-F (200 mg/kg) | 1.76 ± 0.09 # | 1.21 ± 0.08 # | 1.62 ± 0.07 # | 1.56 ± 0.11 # |
| Groups | Treatments | Initial Day (g) 0 Day | The Final Day (g) 7th Day |
|---|---|---|---|
| I | Normal Control (NC) | 9.67 ± 1.23 | 10.33 ± 1.80 |
| II | High Fat Diet (HFD) | 8.17 ± 1.35 | 14.83 ± 3.61 * |
| III | HFD + Sibutramine (5 mg/kg) | 10.83 ± 2.12 | 11.50 ± 2.39 # |
| IV | HFD + Hx-F (200 mg/kg) | 8.01 ± 1.29 | 13.67 ± 2.55 ns |
| V | HFD + chlo-F (200 mg/kg) | 10.33 ± 1.43 | 13.17 ± 3.27 ns |
| VI | HFD + n-but-F (200 mg/kg) | 9.33 ± 1.28 | 13.33 ± 3.05 ns |
| VII | HFD + wt-F (200 mg/kg) | 9.67 ± 1.75 | 11.50 ± 2.43 # |
Publisher’s Note: MDPI stays neutral with regard to jurisdictional claims in published maps and institutional affiliations. |
© 2022 by the authors. Licensee MDPI, Basel, Switzerland. This article is an open access article distributed under the terms and conditions of the Creative Commons Attribution (CC BY) license (https://creativecommons.org/licenses/by/4.0/).
Share and Cite
Khalid, M.; Alqarni, M.H.; Shoaib, A.; Wahab, S.; Foudah, A.I.; Aljarba, T.M.; Akhtar, J.; Alamri, M.A.; Ahmad, S. Anti-Obesity Action of Boerhavia diffusa in Rats against High-Fat Diet-Induced Obesity by Blocking the Cannabinoid Receptors. Plants 2022, 11, 1158. https://doi.org/10.3390/plants11091158
Khalid M, Alqarni MH, Shoaib A, Wahab S, Foudah AI, Aljarba TM, Akhtar J, Alamri MA, Ahmad S. Anti-Obesity Action of Boerhavia diffusa in Rats against High-Fat Diet-Induced Obesity by Blocking the Cannabinoid Receptors. Plants. 2022; 11(9):1158. https://doi.org/10.3390/plants11091158
Chicago/Turabian StyleKhalid, Mohammad, Mohammed H. Alqarni, Ambreen Shoaib, Shadma Wahab, Ahmed I. Foudah, Tariq M. Aljarba, Juber Akhtar, Mubarak A. Alamri, and Sarfaraz Ahmad. 2022. "Anti-Obesity Action of Boerhavia diffusa in Rats against High-Fat Diet-Induced Obesity by Blocking the Cannabinoid Receptors" Plants 11, no. 9: 1158. https://doi.org/10.3390/plants11091158