Article

Genome-Wide Characterization of DGATs and Their Expression Diversity Analysis in Response to Abiotic Stresses in Brassica napus

1
State Key Laboratory of Plant Cell and Chromosome Engineering, Institute of Genetics and Developmental Biology, Innovation Academy for Seed Design, Chinese Academy of Sciences, Beijing 100101, China
2
College of Advanced Agriculture Sciences, University of Chinese Academy of Sciences, Beijing 100049, China
3
College of Biology and Agriculture, Zhoukou Normal University, Zhoukou 466001, China
4
Institute of Economical Crops, Yunnan Agricultural Academy, Kunming 650205, China
5
United States Department of Agriculture, Agricultural Research Service, Forage and Range Research Laboratory, Utah State University, Logan, UT 84322-6300, USA
*
Authors to whom correspondence should be addressed.
These authors contributed equally to this work.
Plants 2022, 11(9), 1156; https://doi.org/10.3390/plants11091156
Submission received: 1 April 2022 / Revised: 22 April 2022 / Accepted: 22 April 2022 / Published: 25 April 2022

Abstract

:
Triacylglycerol (TAG) is the most important storage lipid for oil plant seeds. Diacylglycerol acyltransferases (DGATs) are a key group of rate-limiting enzymes in the pathway of TAG biosynthesis. In plants, there are three types of DGATs, namely, DGAT1, DGAT2 and DGAT3. Brassica napus, an allotetraploid plant, is one of the most important oil plants in the world. Previous studies of Brassica napus DGATs (BnaDGATs) have mainly focused on BnaDGAT1s. In this study, four DGAT1s, four DGAT2s and two DGAT3s were identified and cloned from B. napus ZS11. The analyses of sequence identity, chromosomal location and collinearity, phylogenetic tree, exon/intron gene structures, conserved domains and motifs, and transmembrane domain (TMD) revealed that BnaDGAT1, BnaDGAT2 and BnaDGAT3 were derived from three different ancestors and shared little similarity in gene and protein structures. Overexpressing BnaDGATs showed that only four BnaDGAT1s can restore TAG synthesis in yeast H1246 and promote the accumulation of fatty acids in yeast H1246 and INVSc1, suggesting that the three BnaDGAT subfamilies had greater differentiation in function. Transcriptional analysis showed that the expression levels of BnaDGAT1s, BnaDGAT2s and BnaDGAT3s were different during plant development and under different stresses. In addition, analysis of fatty acid contents in roots, stems and leaves under abiotic stresses revealed that P starvation can promote the accumulation of fatty acids, but no obvious relationship was shown between the accumulation of fatty acids with the expression of BnaDGATs under P starvation. This study provides an extensive evaluation of BnaDGATs and a useful foundation for dissecting the functions of BnaDGATs in biochemical and physiological processes.

1. Introduction

Triacylglycerol (TAG), the major component of vegetable oils, consists of three fatty acids esterified to a glycerol backbone. In plants, TAG is not only mainly stored in seeds, functioning as an energy reservoir to facilitate germination and early seedling growth, but also provides precursors for membrane biosynthesis and lipid signaling, which are crucial for normal plant growth and development [1,2,3]. DGAT (diacylglycerol acyltransferase, EC2.3.1.20), the key rate-limiting enzyme of the Kennedy pathway for TAG biosynthesis, catalyzes the final and committed step in this pathway by transferring an acyl group from acyl-CoA to the sn-3 position of sn-1,2-diacylglycerol (DAG) [4,5,6]. In plants, DGATs are classified into three distinct types, namely, DGAT1, DGAT2 and DGAT3, which were first identified in Arabidopsis [7], castor (Ricinus communis) [8] and tung tree (Vernicia fordii) [9] and peanut (Arachis hypogaea) [10], respectively. Since then, many varieties of the three DGAT types have been characterized in different species, such as olive [11,12], tobacco [13], soybean [14,15,16], peanut [17,18], canola [19,20,21], tung tree [9], sunflower [22], Tropaeolum majus [23], maize [24] and cotton [25].
As the final enzyme in TAG biosynthesis, DGAT1s are critical to oilseed development [7,19,26] and have been highlighted as a genetic engineering target to increase storage lipid production in plants [13,27,28,29,30]. In addition, DGAT1s have been demonstrated to be associated with normal growth [30,31,32,33] and abiotic stress responses [34,35,36,37,38,39,40,41,42]. Plant DGAT1s and DGAT2s, although catalyzing the same enzyme activity, have distinct physiological functions [9,43]. Plant DGAT2s were characterized from species that produce oils enriched with unusual FAs, such as R. communis [8], V. fordii [9,43] and ironweed (Vernonia galamensis) [44], which produce TAGs enriched in ricinoleic acid, α-eleostearic acid and vernolic acid, respectively. B. napus DGAT2s (BnaDGAT2s) were shown to play an important role in the accumulation of erucic acid in Brassica napus in one study [45]. Some plant DGAT3s were also confirmed to be involved in TAG synthesis. For example, AhDGAT3-1 was demonstrated to be specific for 1,2-diacylglycerol rather than hexadecanol, glycerol-3-phosphate, monoacylglycerol, lysophosphatidic acid and lysophosphatidylcholine and to prefer oleoyl-CoA as an acyl donor compared to palmitoyl- and stearoyl-CoAs [10]. Heterologous expression of AhDGAT3-3 could restore TAG biosynthesis with preferential incorporation of unsaturated C18 fatty acids into lipids in yeast H1246 [17]. Similar to Arabidopsis, recombinant purified AtDGAT3 produced from Escherichia coli, although very unstable, exhibits DGAT activity in vitro [46], and transient expression of AtDGAT3 in Nicotiana benthamiana confirmed its involvement in TAG synthesis and specificity towards 18:3 and 18:2 FAs [47]. Overexpression of GhDGAT3D improved the oil content in Arabidopsis seeds [25].
The expression patterns of DGATs are very helpful in analyzing their functions. In plants, most DGAT1s are expressed widely in different tissues (roots, stems, leaves, flowers, developing pods, seedlings, germinated seeds, etc.), especially in developing seeds [7,14,15,20,48,49]. The expression levels of B. napus DGAT1s (BnaDGAT1s) during the silique development may be different in diverse germplasm sources, and higher numbers and levels of expression of BnaDGAT1s are correlated with high oil germplasm [50]. The expression patterns of DGAT2s are diverse in different species. Olive OeDGAT2 is highly expressed in mature and ageing tissues, for example, in the late stages of anther and ovary development [11]. Soybean GmDGAT2D is mainly expressed in flowers [14]. Small individual changes in the relative expression of BnaA.DGAT2s were discovered, but the isoforms’ expression decreased as a general trend in the late developmental stages for MAPLUS (nonedible, high-erucic acid), whereas it remained on an even level in MONOLIT (edible, low-erucic acid) [45]. Cytosolic DGAT3 was first purified and identified from developing peanut cotyledons and was highly expressed between 8 and 24 DAF (days after flowering) but not detected in leaves, roots or 30-DAF seeds [10].
Stresses have an important effect on plant DGAT expression. The expression levels of DGAT1s were increased under freezing stress conditions [41,42]. The expression of soybean GmDGAT2D could be promoted by cold, heat or ABA treatment but inhibited by jasmonate and insect infestation [14].
B. napus, one of the most important oil plants in the world, is an allotetraploid species (AACC, 2n = 38) that contains two sets of homologous chromosomes derived from its diploid progenitors, Brassica rapa (AA, 2n = 20) and Brassica oleracea (CC, 2n = 18) [51,52,53]. It was expected that there may be four copies for a gene in B. napus. The copy number, sequence structure, relationship between sequence and function and spatial and temporal expression patterns of BnaDGAT1s, BnaDGAT2s and BnaDGAT3s in B. napus have not been systematically analyzed. In addition, various kinds of stresses, such as P starvation, low N, drought and salinity, have important influences on the growth and development of B. napus, and the expression of BnaDGATs in response to these stresses has important value for analyzing their functions, which have not been reported.
In this study, four DGAT1s, four DGAT2s and two DGAT3s were identified and annotated widely in the B. napus genome. Further characterizations were performed with the analyses of sequence identity, chromosomal location and collinearity, phylogenetic tree, exon/intron gene structures, conserved domains and motifs and transmembrane domain (TMD). The TAG-synthesizing abilities were tested by overexpressing BnaDGATs in both yeast H1246 and INVSc1. Transcriptomic analysis and qRT-PCR were performed to detect the expression patterns of BnaDGATs in different tissues and under different stresses. The cis-elements upstream of the start codons of BnaDGATs were investigated by PlantCARE. Moreover, the contents of fatty acids in roots, stems and leaves under the stresses of P starvation, low N, drought and salinity were analyzed by GS-MS. This study provides an extensive evaluation of BnaDGATs and provides a useful foundation for dissecting the functions of BnaDGATs in lipid metabolism and growth under stress in B. napus.

2. Results

2.1. Identification and Annotation of DGAT Family Members in B. napus

The CDS and protein sequences of AtDGAT1, AtDGAT2 and AtDGAT3 from the Arabidopsis database TAIR (http://www.arabidopsis.org/ (accessed on 25 March 2020)) were used as queries for the BLAST search in the two B. napus databases (GENOSCOPE, https://www.genoscope.cns.fr/brassicanapus/ (accessed on 25 March 2020) and BnPIR, http://cbi.hzau.edu.cn/bnapus (accessed on 2 March 2021)). The results showed that three BnaDGAT1s, four BnaDGAT2s and two BnaDGAT3s in GENOSCOPE and four BnaDGAT1s, four BnaDGAT2s and two BnaDGAT3s in BnPIR were detected (Table 1). To further confirm the BnaDGAT family members, the primers (Table S1) for cloning them were designed according to the genomic DNA and CDSs in the two B. napus databases, and four BnaDGAT1s, four BnaDGAT2s and two BnaDGAT3s (Table 1) were then cloned and identified from B. napus ZS11. Simultaneously, five DGAT genes in Brassica rapa, five in Brassica oleracea, five in Brassica nigra and ten in Brassica juncea were classified using the same BLAST search in the Brassica Database (BRAD, http://brassicadb.cn/#/ (accessed on 11 October 2021)), as well as eight in Brassica carinata in the Brassica Genomics Database (BGD, http://brassicadb.bio2db.com/ (accessed on 11 October 2021)) (Table 1). In addition, DGAT genes in other typical plants, Arachis hypogaea, Glycine max, Ricinus communis, Medicago truncatula, Jatropha curcas, Oryza sativa, Zea mays, Setaria italica and Brachypodium distachyon, were also detected by the same BLAST search in their corresponding genome databases (Table S2). All sequences of the CDS, genomic DNA and protein of DGATs in B. napus and other typical plants in this study are presented in Tables S3–S6.
The amino acid sequences of BnaDGAT genes were characterized: the protein length ranged from 317 AA to 510 AA, and the molecular weight (MW) ranged from 35.64 kDa to 57.96 kDa (Table 2). Moreover, the isoelectric point (pI) values ranged from 7.75 to 8.90, which showed that these proteins are alkaline (Table 2). Moreover, the subcellular localization signals of four BnaDGAT1s and four BnaDGAT2s were detected in the endoplasmic reticulum, as were the DGAT1s and DGAT2s of the other plants in this study (Table 2 and Table S7). No subcellular localization signals of DGAT3s were detected in B. napus or other plants (Table 2 and Table S7).
Identity analysis of BnaDGATs, BraDGATs and BolDGATs was performed by the Clustal W method based on nucleotide sequences and amino acid sequences (Table S8). The results showed that the three DGAT subfamilies shared very low identity with each other subfamily (8.2% to 17.2%), while the similarities among eight DGAT1s, eight DGAT2s and four DGAT3s were high (72.4% to 100%) at the amino acid sequence level. The similarity between every BnaDGAT in the A subgenome and its orthologous one in the C subgenome was higher than 96%. The identity of DGATs based on nucleotide sequences was similar to that based on amino acid sequences (Table S8).

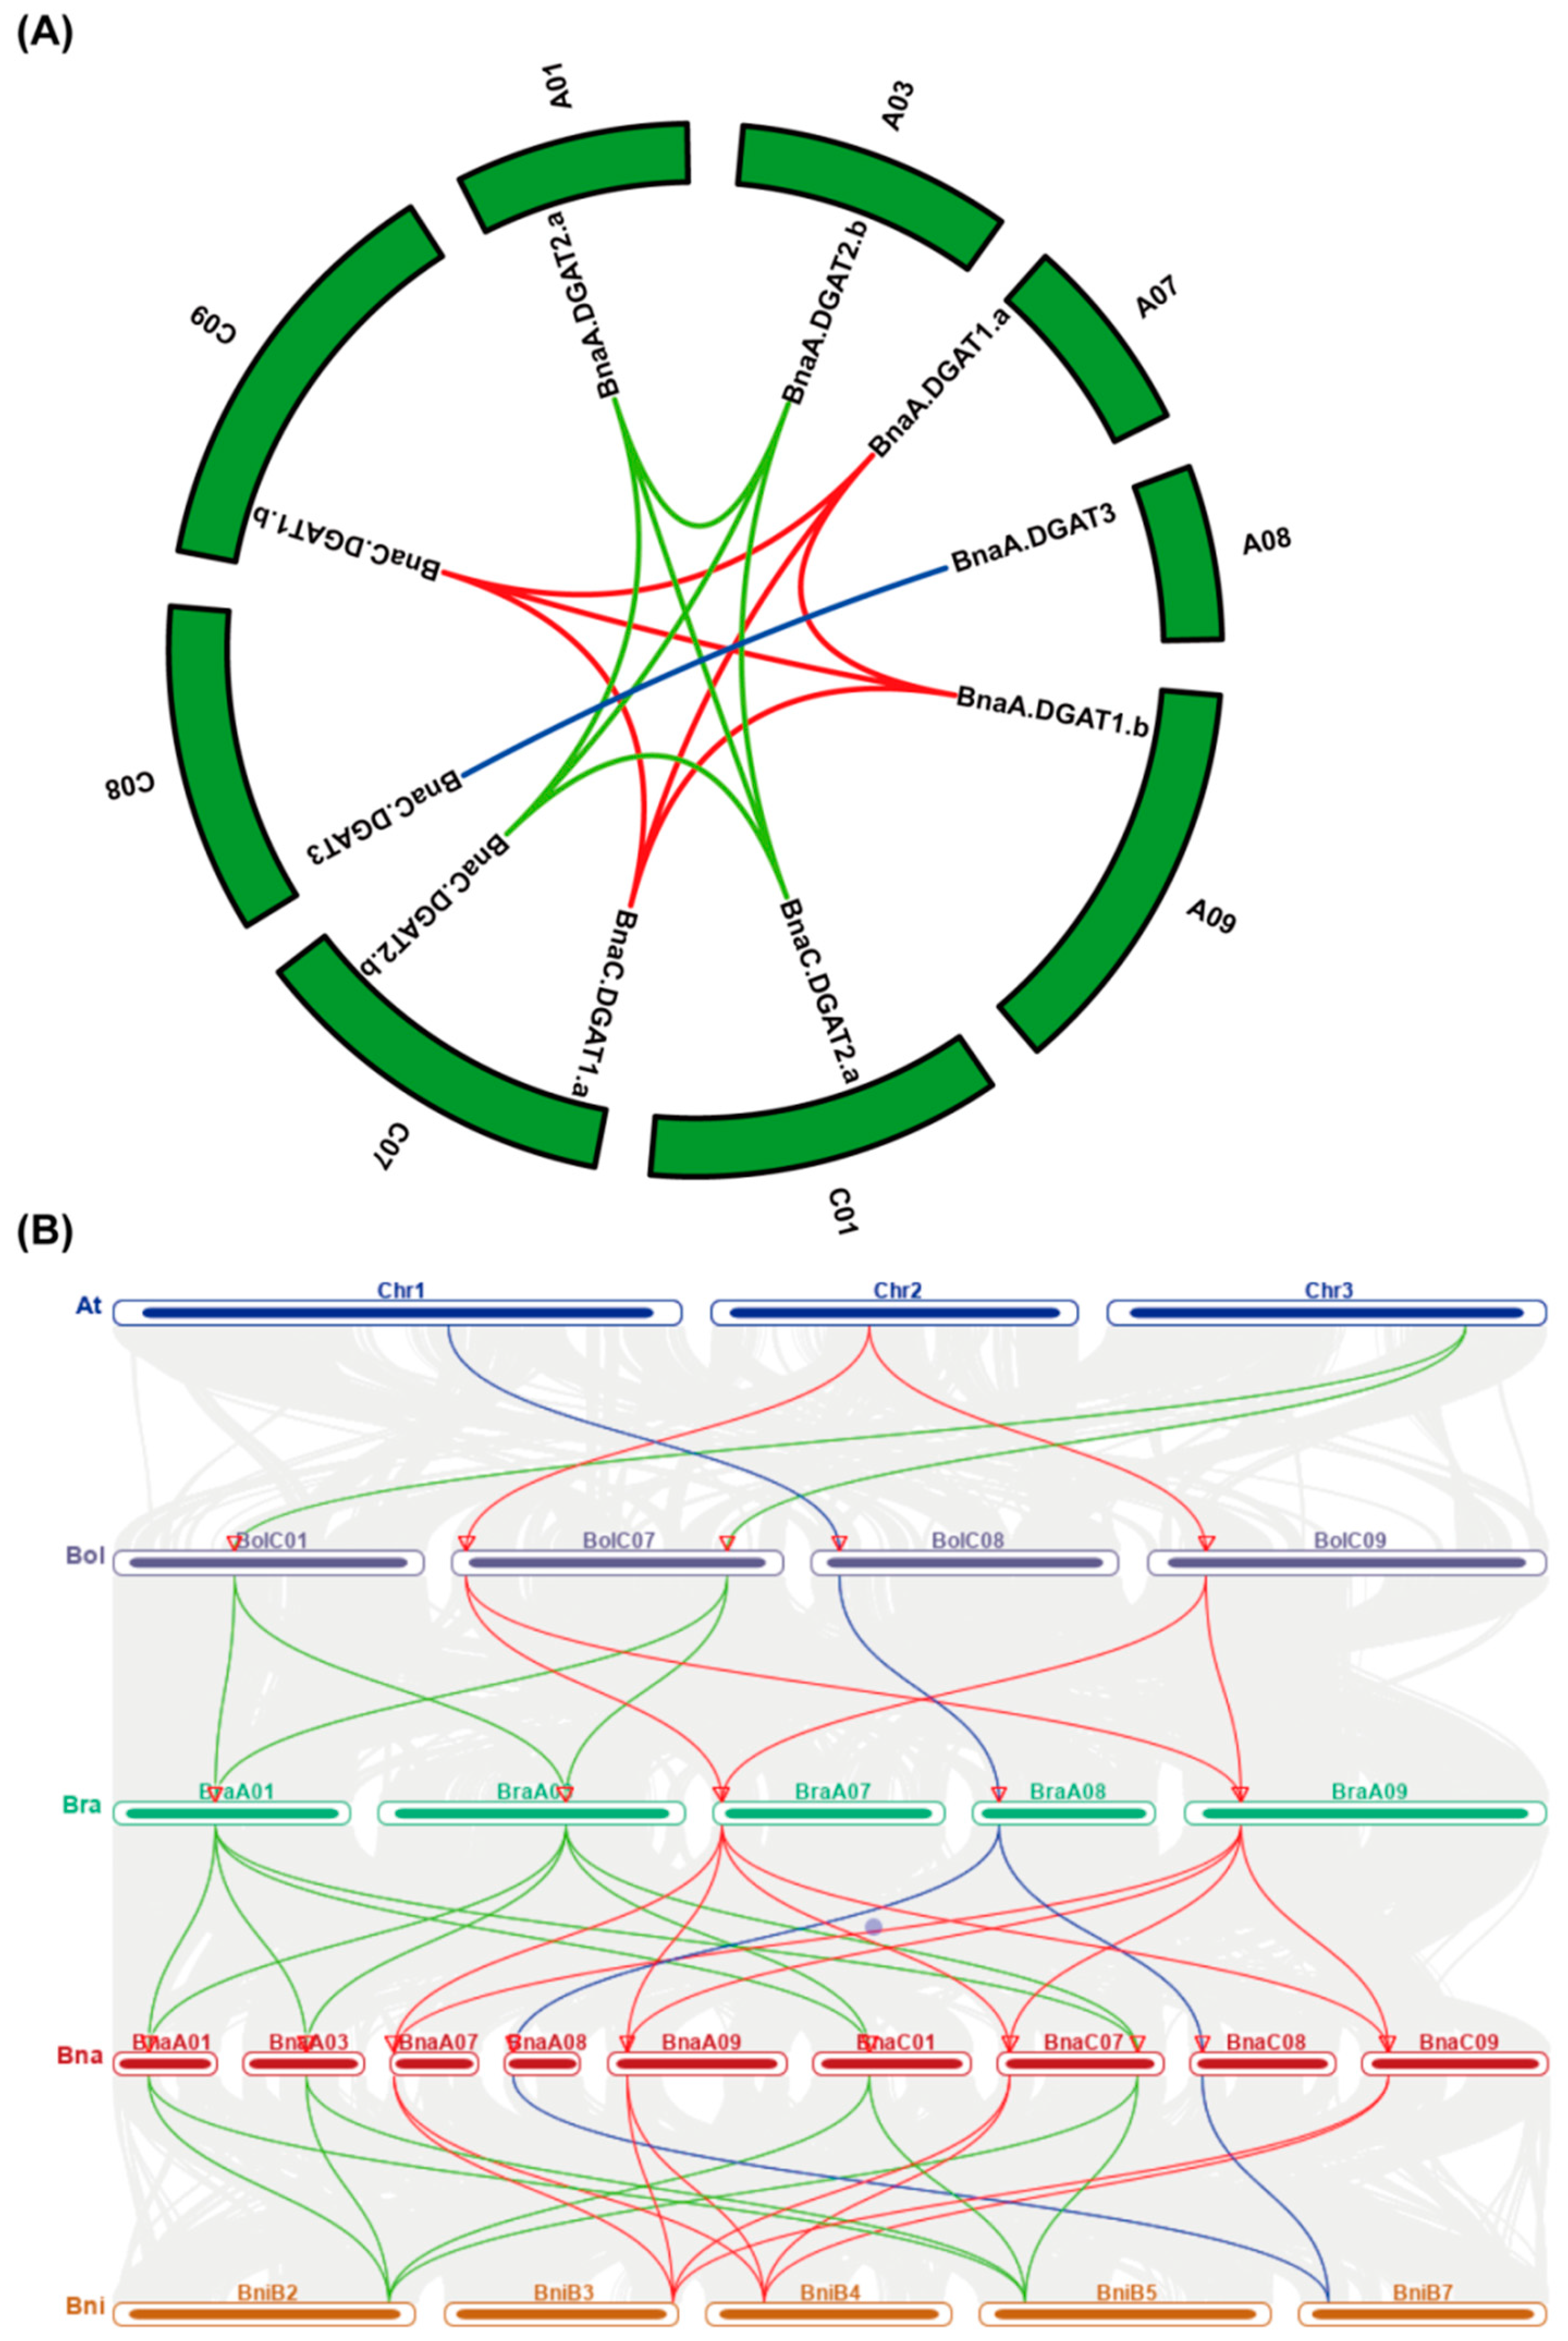
2.2. Chromosomal Location and Collinearity Analysis

Chromosomal location (Table 2 and Figure S1A) analysis showed four BnaDGAT1s distributed on chromosomes A07, A09, C07 and C09; four BnaDGAT2s distributed on chromosomes A01, A03, C01 and C07 and that two BnaDGAT3s were distributed on chromosomes A08 and C08. In B. rapa, five BraDGATs were located on B. rapa chromosomes A07, A09, A01, A03 and A08 (Figure S1B) and in B. oleracea, five BolDGATs were located on B. oleracea chromosomes C07, C09, C01, C07 and C08 (Figure S1C). Five BnaDGAT loci on the B. napus A subgenome were highly parallel with five BraDGAT loci on the B. rapa A genome, and five BnaDGAT loci on the B. napus C subgenome were highly parallel with five BolDGAT loci on the B. oleracea C genome, which suggested that B. napus inherited and retained all the DGAT genes of B. rapa and B. oleracea.
The results of gene synteny analysis (Figure 1A) showed that four BnaDGAT1s, four BnaDGAT2s and two BnaDGAT3s might be duplicated genes, suggesting that BnaDGAT genes were frequently duplicated during oilseed rape evolution. The results of comparative synteny of DGAT gene pairs among A. thaliana, B. oleracea, B. rapa, B. napus and B. nigra (Figure 1B) showed that AtDGAT1, AtDGAT2 and AtDGAT3 had collinearity relationships with two BolDGAT1s/two BraDGAT1s/four BnaDGAT1s/two BniDGAT1s, two BolDGAT2s/two BraDGAT2s/four BnaDGAT2s/two BniDGAT2s and one BolDGAT3/one BraDGAT3/two BnaDGAT3s/one BniDGAT3, respectively.
Moreover, the synonymous mutations (Ks), nonsynonymous mutations (Ka) and Ka/Ks ratios of the orthologous DGAT gene pairs between B. napus and A. thaliana and the paralogous BnaDGAT gene pairs were evaluated (Table 3). The results showed that all of the Ka/Ks ratios of these gene pairs were lower than 1 (Table 3), indicating that these gene pairs experienced strong purifying selective pressure. The duplication time of these gene pairs was presumed using the formula T = Ks/2R, with R (1.5 × 10⁻⁸) representing neutral substitution per site per year. The results showed that the duplication times of the orthologous DGAT gene pairs between B. napus and A. thaliana ranged from 10.67 MYA to 20.11 MYA (Table 3), with an average value of 15.06 MYA. These results indicated that DGATs of B. napus diverged from A. thaliana ~16 MYA, which was consistent with the recent whole-genome triplication event that occurred approximately 9–15 MYA or even 28 MYA [55]. The corresponding duplication times of the paralogous BnaDGAT gene pairs ranged from 1.37 to 12.78 MYA, with an average value of 8.36 MYA (Table 3). Two peaks of duplication times were observed in B. napus: one peak (1.37–3.57 MYA) represented the duplication time of these genes, which occurred during the divergence of the A genome and C genome of Brassica, and the other peak (10.95–12.78 MYA), representing a duplication time of ~10 MYA, corresponded to the Brassica whole-genome triplication event (9–15 MYA) [55]. Therefore, the processes of B. napus speciation and Brassica whole-genome triplication likely played important roles in the divergence of the BnaDGAT duplicated genes in B. napus.

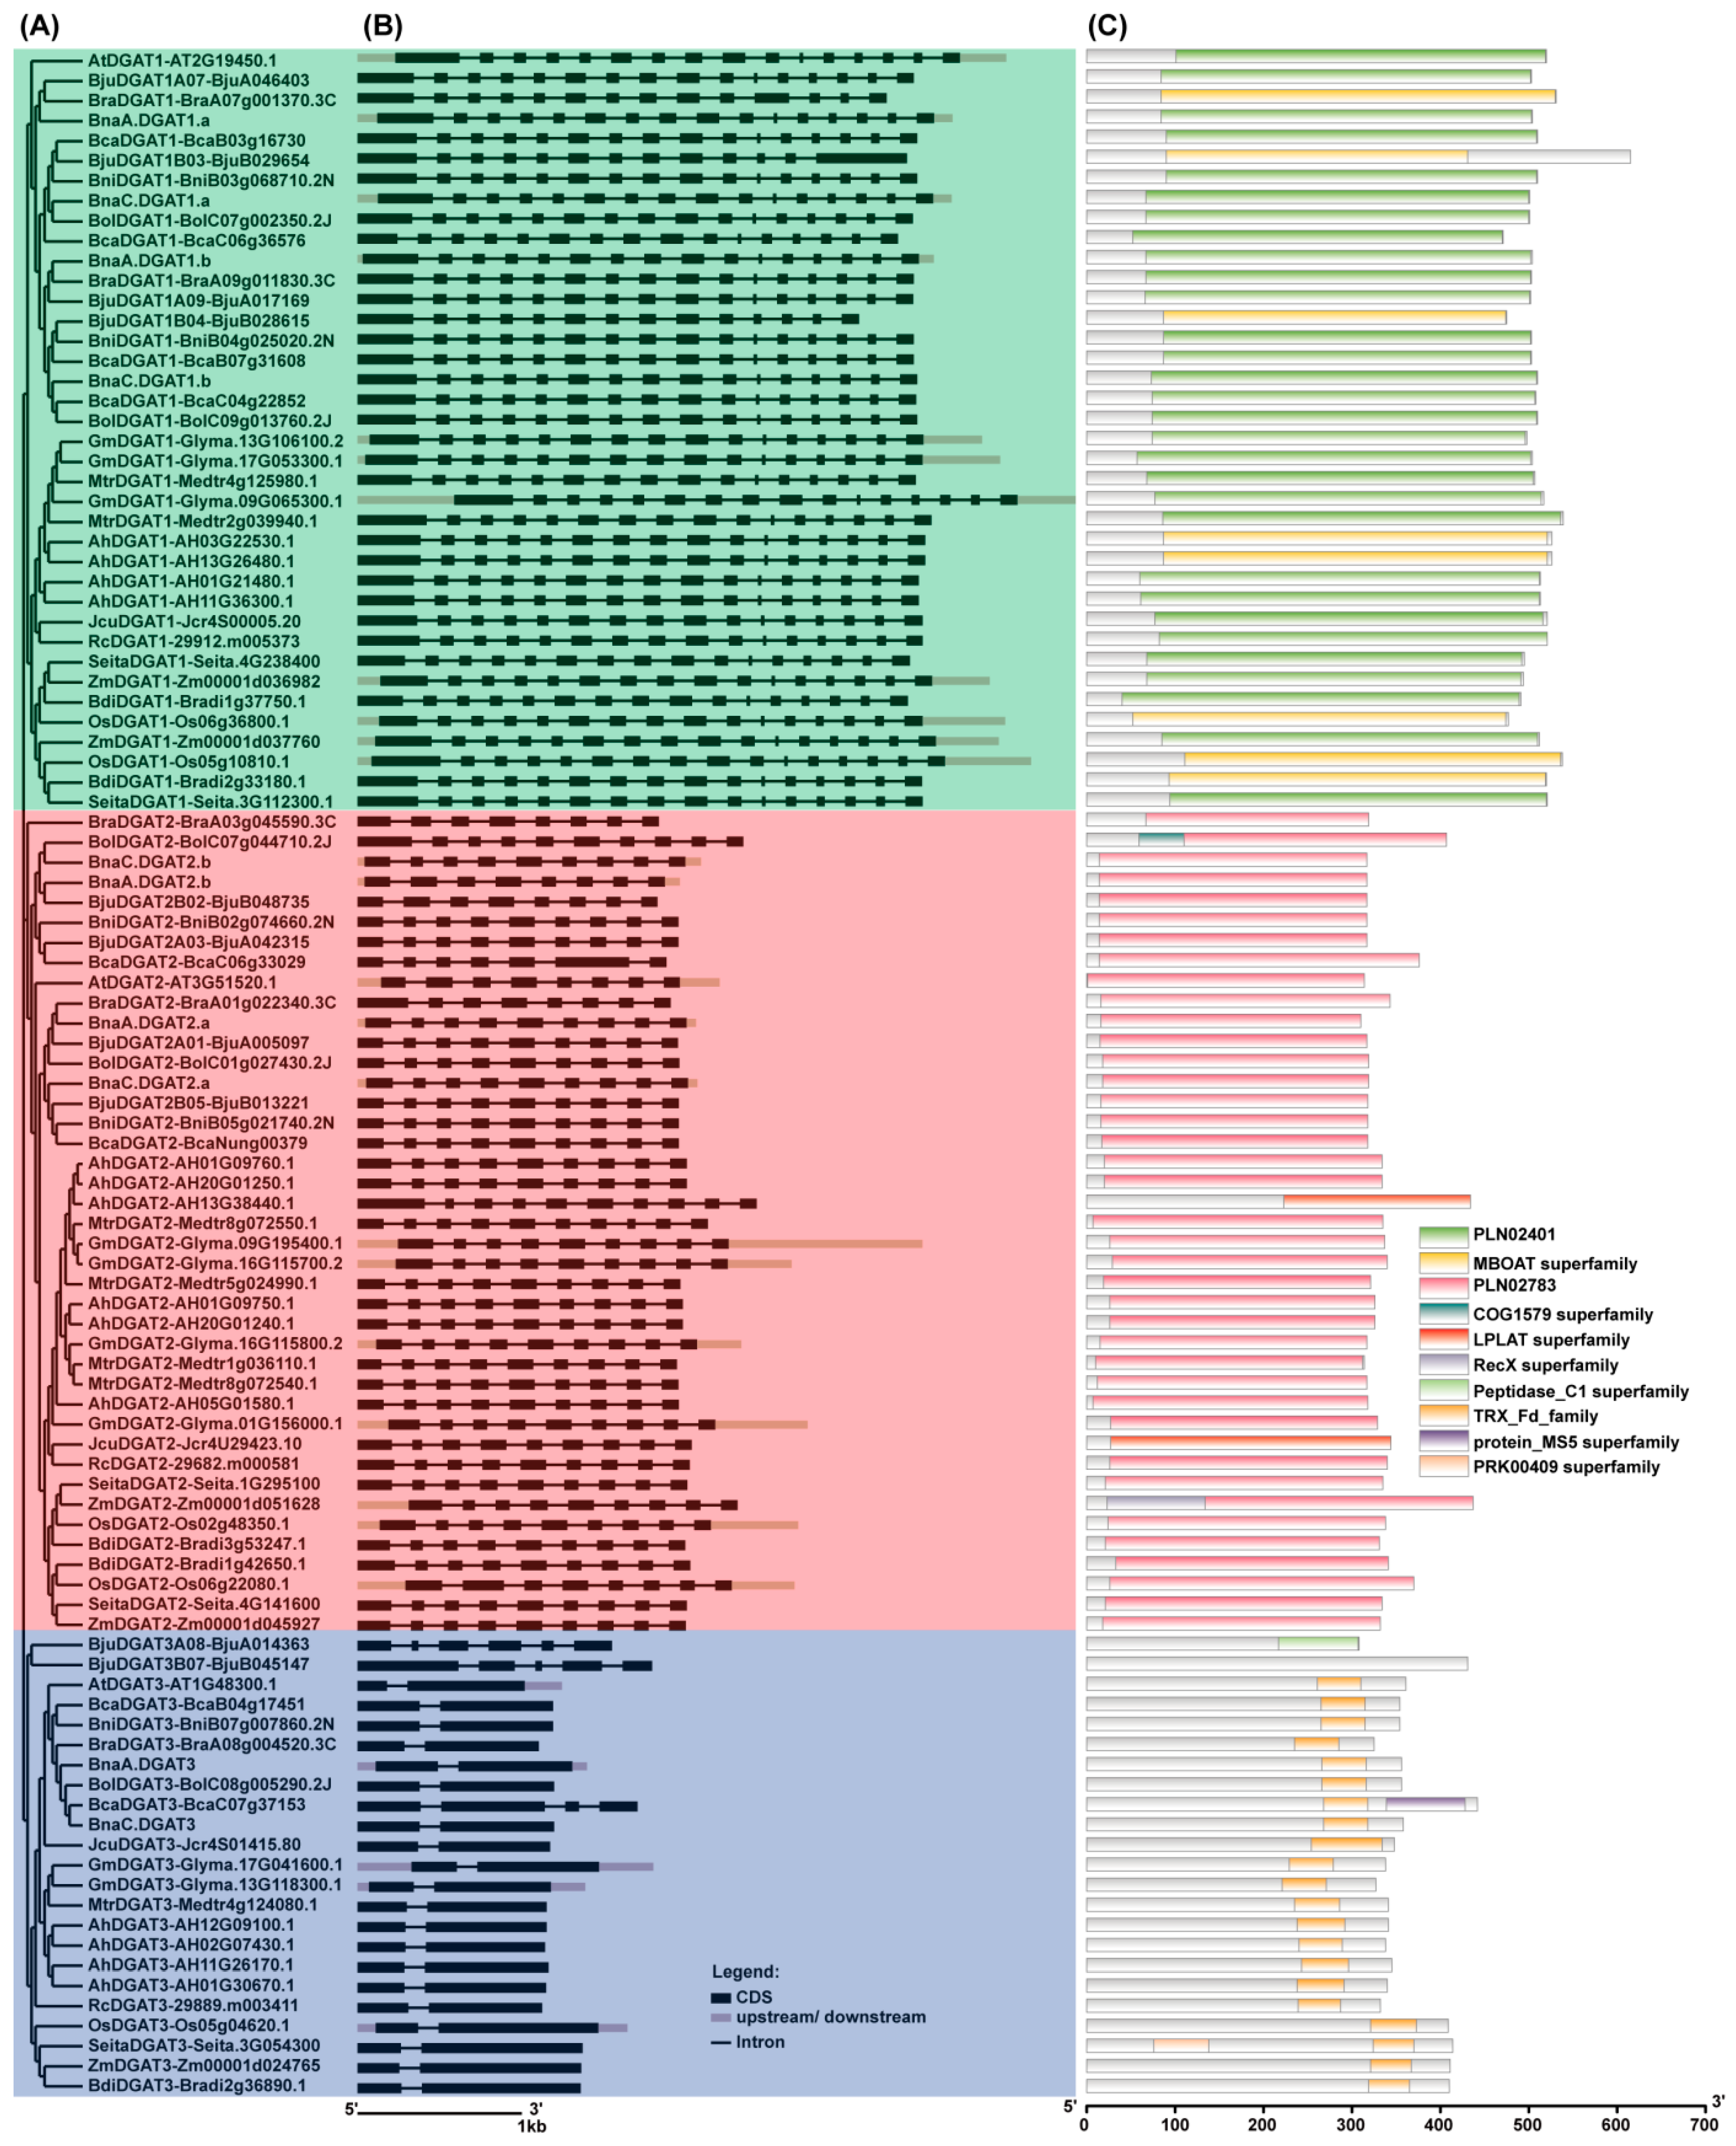
2.3. Evolutionary Relationship and Exon/Intron Gene Structure Analysis of BnaDGATs

The phylogenetic tree (Figure 2A) showed that three well-supported clades were grouped as the DGAT1 subfamily, DGAT2 subfamily and DGAT3 subfamily. Within the DGAT1 subfamily and DGAT2 subfamily, four BnaDGAT1s and four BnaDGAT2s, respectively, were grouped more closely with the corresponding DGAT subfamilies of the other five Brassica U’s triangle species (B. rapa, B. oleracea, B. nigra, B. juncea and B. carinata) and Arabidopsis than to those of the other dicot or monocot plants. Within the DGAT3 subfamily, two BnaDGAT3s were grouped more closely to those of B. oleracea, B. rapa, B. nigra, B. carinata and Arabidopsis than to the corresponding subfamilies of the other dicot or monocot plants. The DGAT1s, DGAT2s and DGAT3s of the four monocot plants were always grouped together, rather than with those of the twelve dicot plants. These results indicated that the duplication events of DGAT genes occurred after the divergence of dicot and monocot plants.
The results of the exon/intron gene structures (Figure 2B and Figure S2B and Table S7) revealed that the gene structures of most DGAT1s, DGAT2s and DGAT3s were highly and independently conserved during evolution but confirmed distinct differences among the three DGAT subfamilies, suggesting that the three DGAT subfamilies evolved separately from three different ancient genes. All four BnaDGAT1s have 16 exons as well as DGAT1s from most other plants, except BjuB029654 (13 exons), BjuB028615 (14 exons) and BraA07g001370.3C (14 exons). Most DGAT2s are generally composed of seven to ten exons. In addition, BnaA01G0206700ZS had seven exons and BnaA03G0420700ZS had six exons in the B. napus database BnPIR (Table S7), but we cloned these genes and confirmed that they (BnaA.DGAT2.a and BnaA.DGAT2.b) had nine and eight exons, respectively. Members of DGAT3s from B. napus and the selected plants in this paper contain two exons, except BcaC07g37153 (four exons), BjuA014363 (six exons) and BjuB045147 (five exons).

2.4. The Conserved Domains and Motif Analyses

To investigate the conserved motifs and domains, the DGAT proteins from B. napus and the other selected plants were predicted by both the Conserved Domain Database (CDD) with Batch CD-Search in NCBI [57] and the MEME program (https://meme-suite.org/meme/tools/meme (accessed on 21 October 2021)) (Bailey et al., 2009), as shown in Figure 2C and Figure S3. All DGAT1s contained the PLN02401 domain (diacylglycerol o-acyltransferase) or MBOAT domain (membrane-bound O-acyltransferase family). All DGAT2 homologues shared the PLN02783 domain (diacylglycerol o-acyltransferase), except AH13G38440.1 and Jcr4U29423.10, which had an LPLAT superfamily domain. All DGAT3 homologues shared the TRX_Fd_family domain, except BjuB045147 and BjuA014363.
Additionally, the top 20 conserved motifs were identified in the DGAT proteins (Figure S3). All the DGAT1 homologues shared one motif 2, one motif 3, one motif 7, one motif 8, one motif 9, one motif 12 and one motif 15. All DGAT1 homologues had one motif 1, except BjuB029654 and BjuB028615. All DGAT1 homologues had one motif 4, except BjuB029654 and 29912.m005373. All DGAT1 homologues had one motif 20, except BjuB029654 and Zm00001d036982. All DGAT1 homologues, except BjuA046403, had one motif 13. All DGAT1 homologues of six Brassica species, A. thaliana, and A. hypogaea shared one motif 19. All DGAT2 homologues had one motif 5, one motif 6, one motif 10, one motif 11, one motif 12 and one motif 14. All DGAT2 homologues had one motif 17, except BraA03g045590.3C, AH13G38440.1 and AH05G01580.1. All DGAT2 homologues had one motif 16, except BraA03g045590.3C and AH13G38440.1. All DGAT3 homologues had one motif 18 at their C-terminus, except BjuB045147 and BjuA014363. All DGAT3 homologues shared one or two motifs 15 at their C-terminus, except Os05g04620.1, Seita.3G054300.1 and Zm00001d024765. These results supported the hypothesis that the DGAT1, DGAT2 and DGAT3 subfamilies evolved separately during eukaryote evolution, as demonstrated by the phylogenetic tree and gene structure (Figure 2).

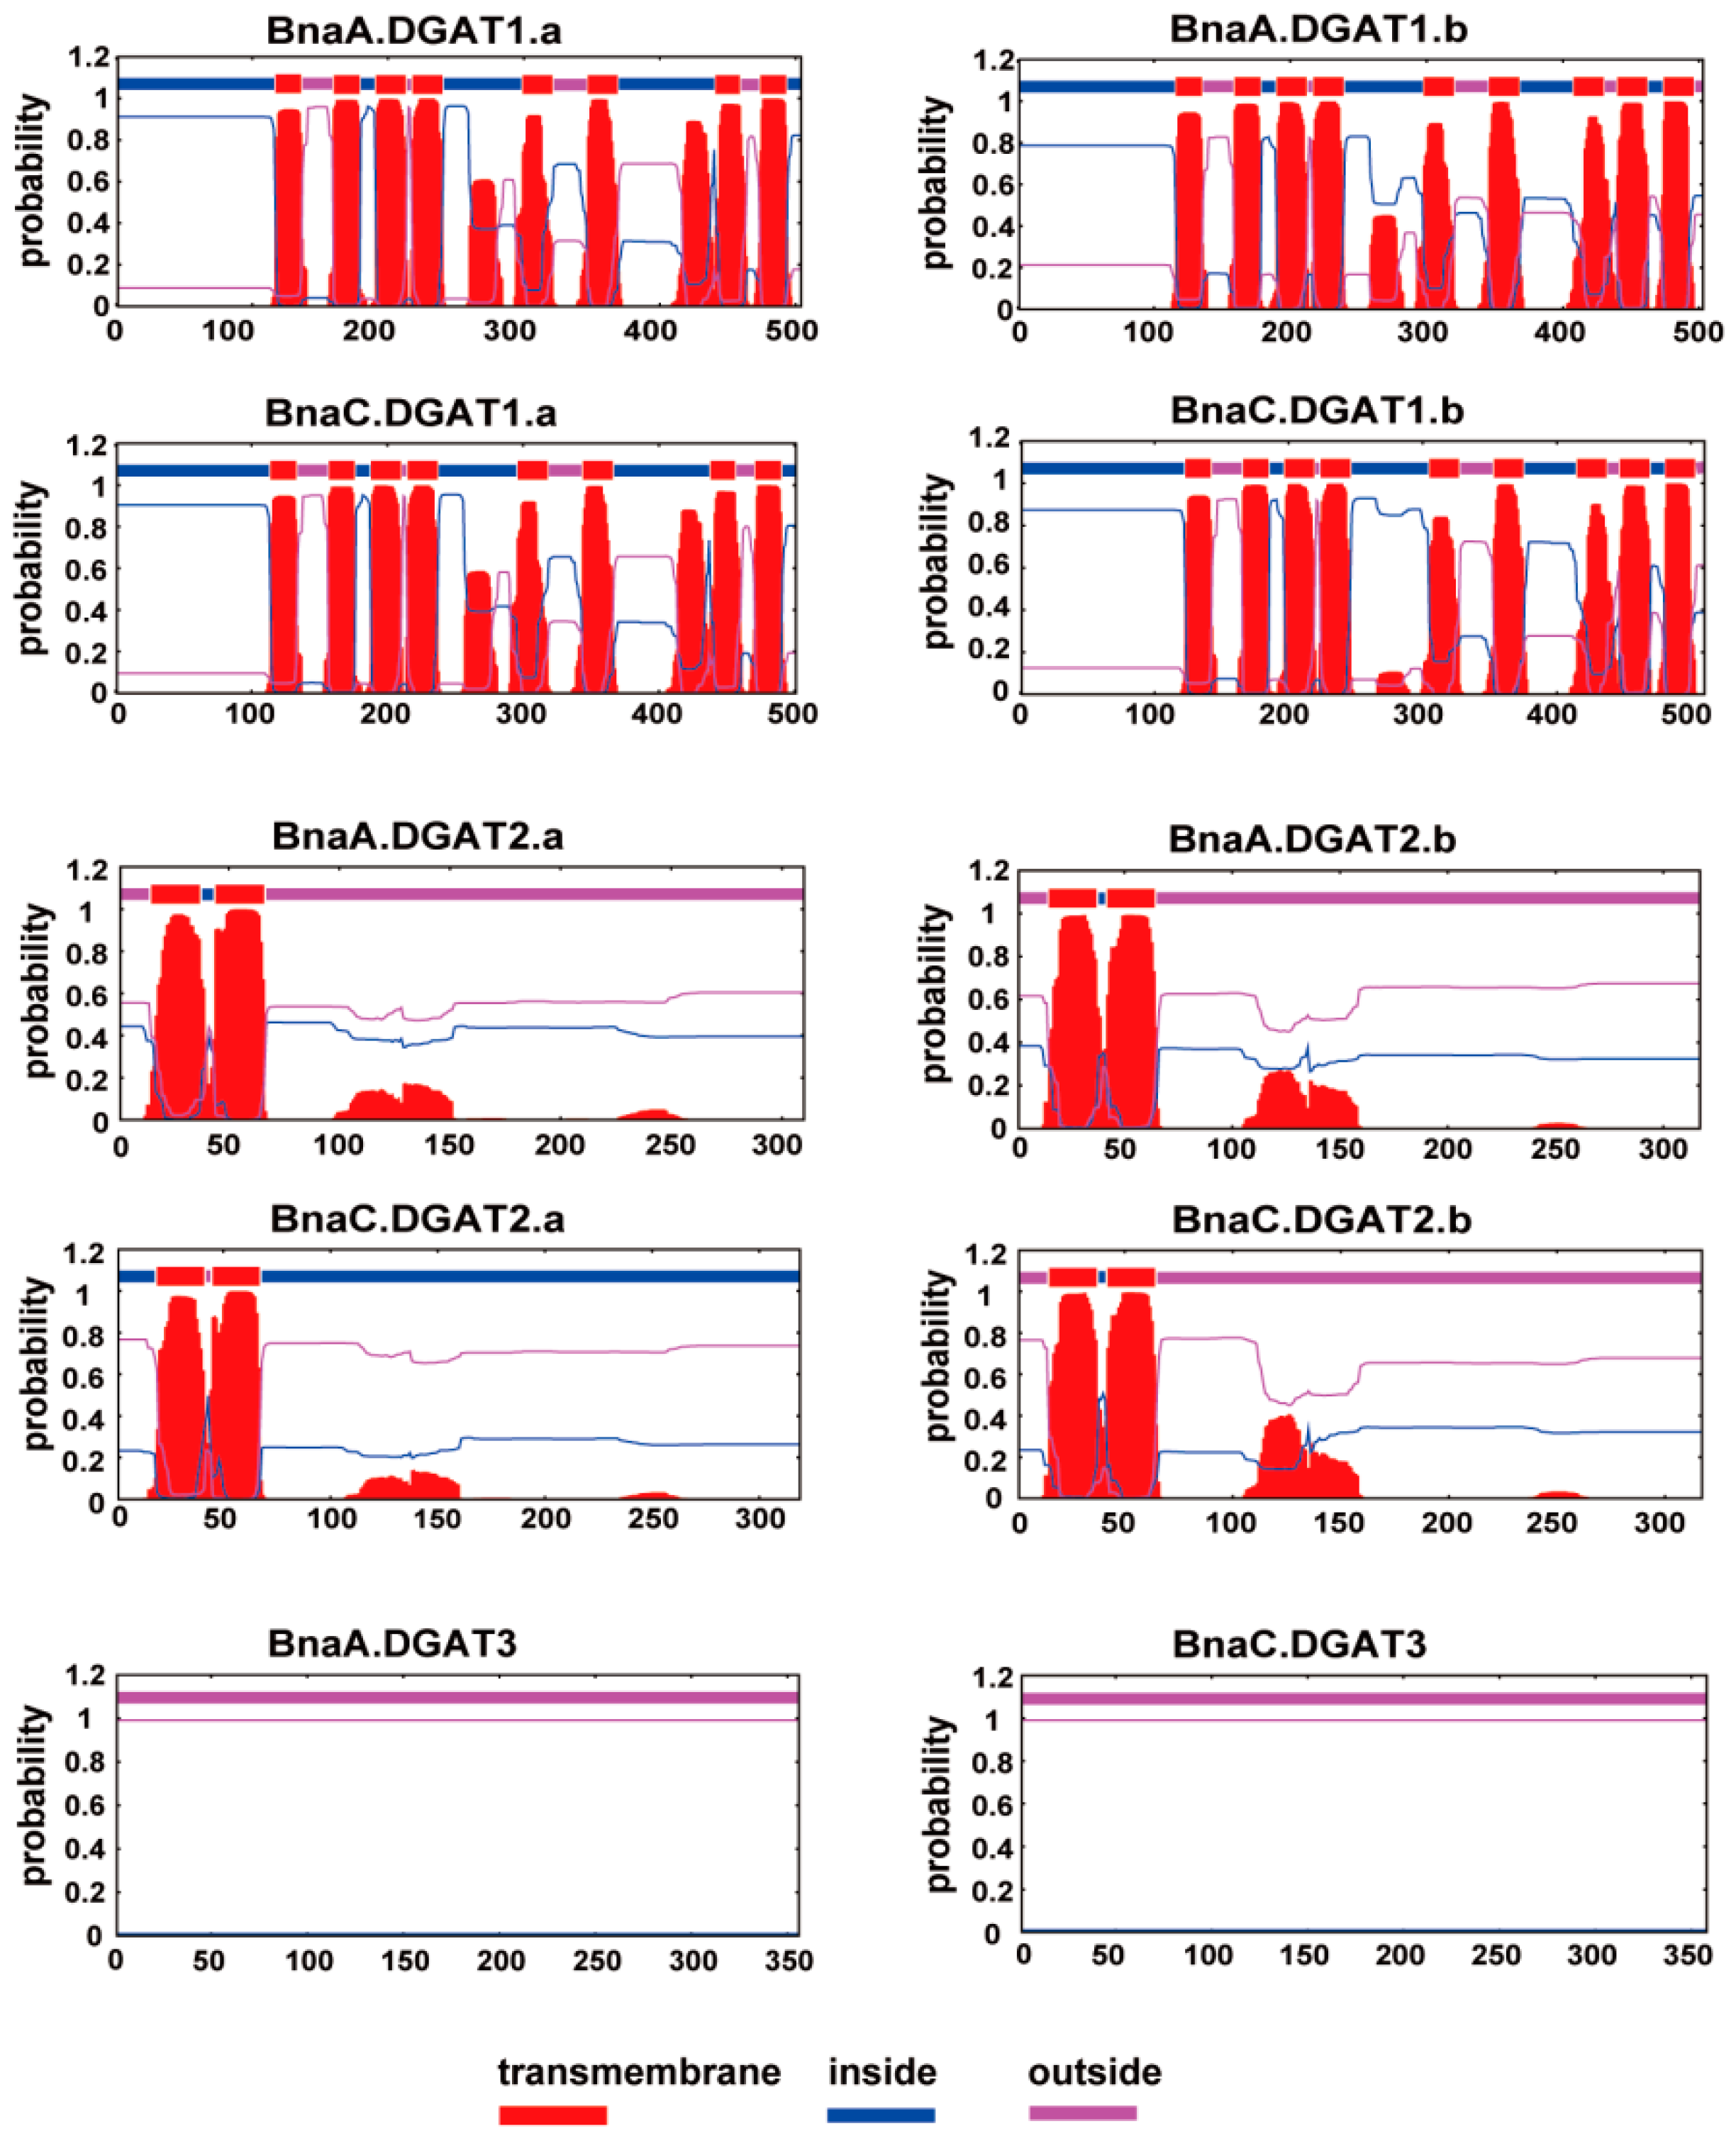
2.5. Putative Transmembrane Domains of DGAT Proteins

The putative transmembrane domains (TMDs) of DGAT proteins from B. napus and other plants were predicted by TMHMM (https://services.healthtech.dtu.dk/service.php?TMHMM-2.0 (accessed on 10 April 2021)) (Figure 3 and Table S7) [58]. Each of the DGAT1s was predicted to harbor seven to ten putative TMDs. For B. napus, BnaA.DGAT1.a and BnaC.DGAT1.a had eight putative TMDs, and BnaA.DGAT1.b and BnaC.DGAT1.b shared nine putative TMDs. For most DGAT2s, one to four putative TMDs were detected. Each of four BnaDGAT2s had two putative TMDs at the N-terminus with a large cytosolic C-terminal domain. There were no putative TMDs in any of the examined DGAT3s, consistent with their soluble nature.

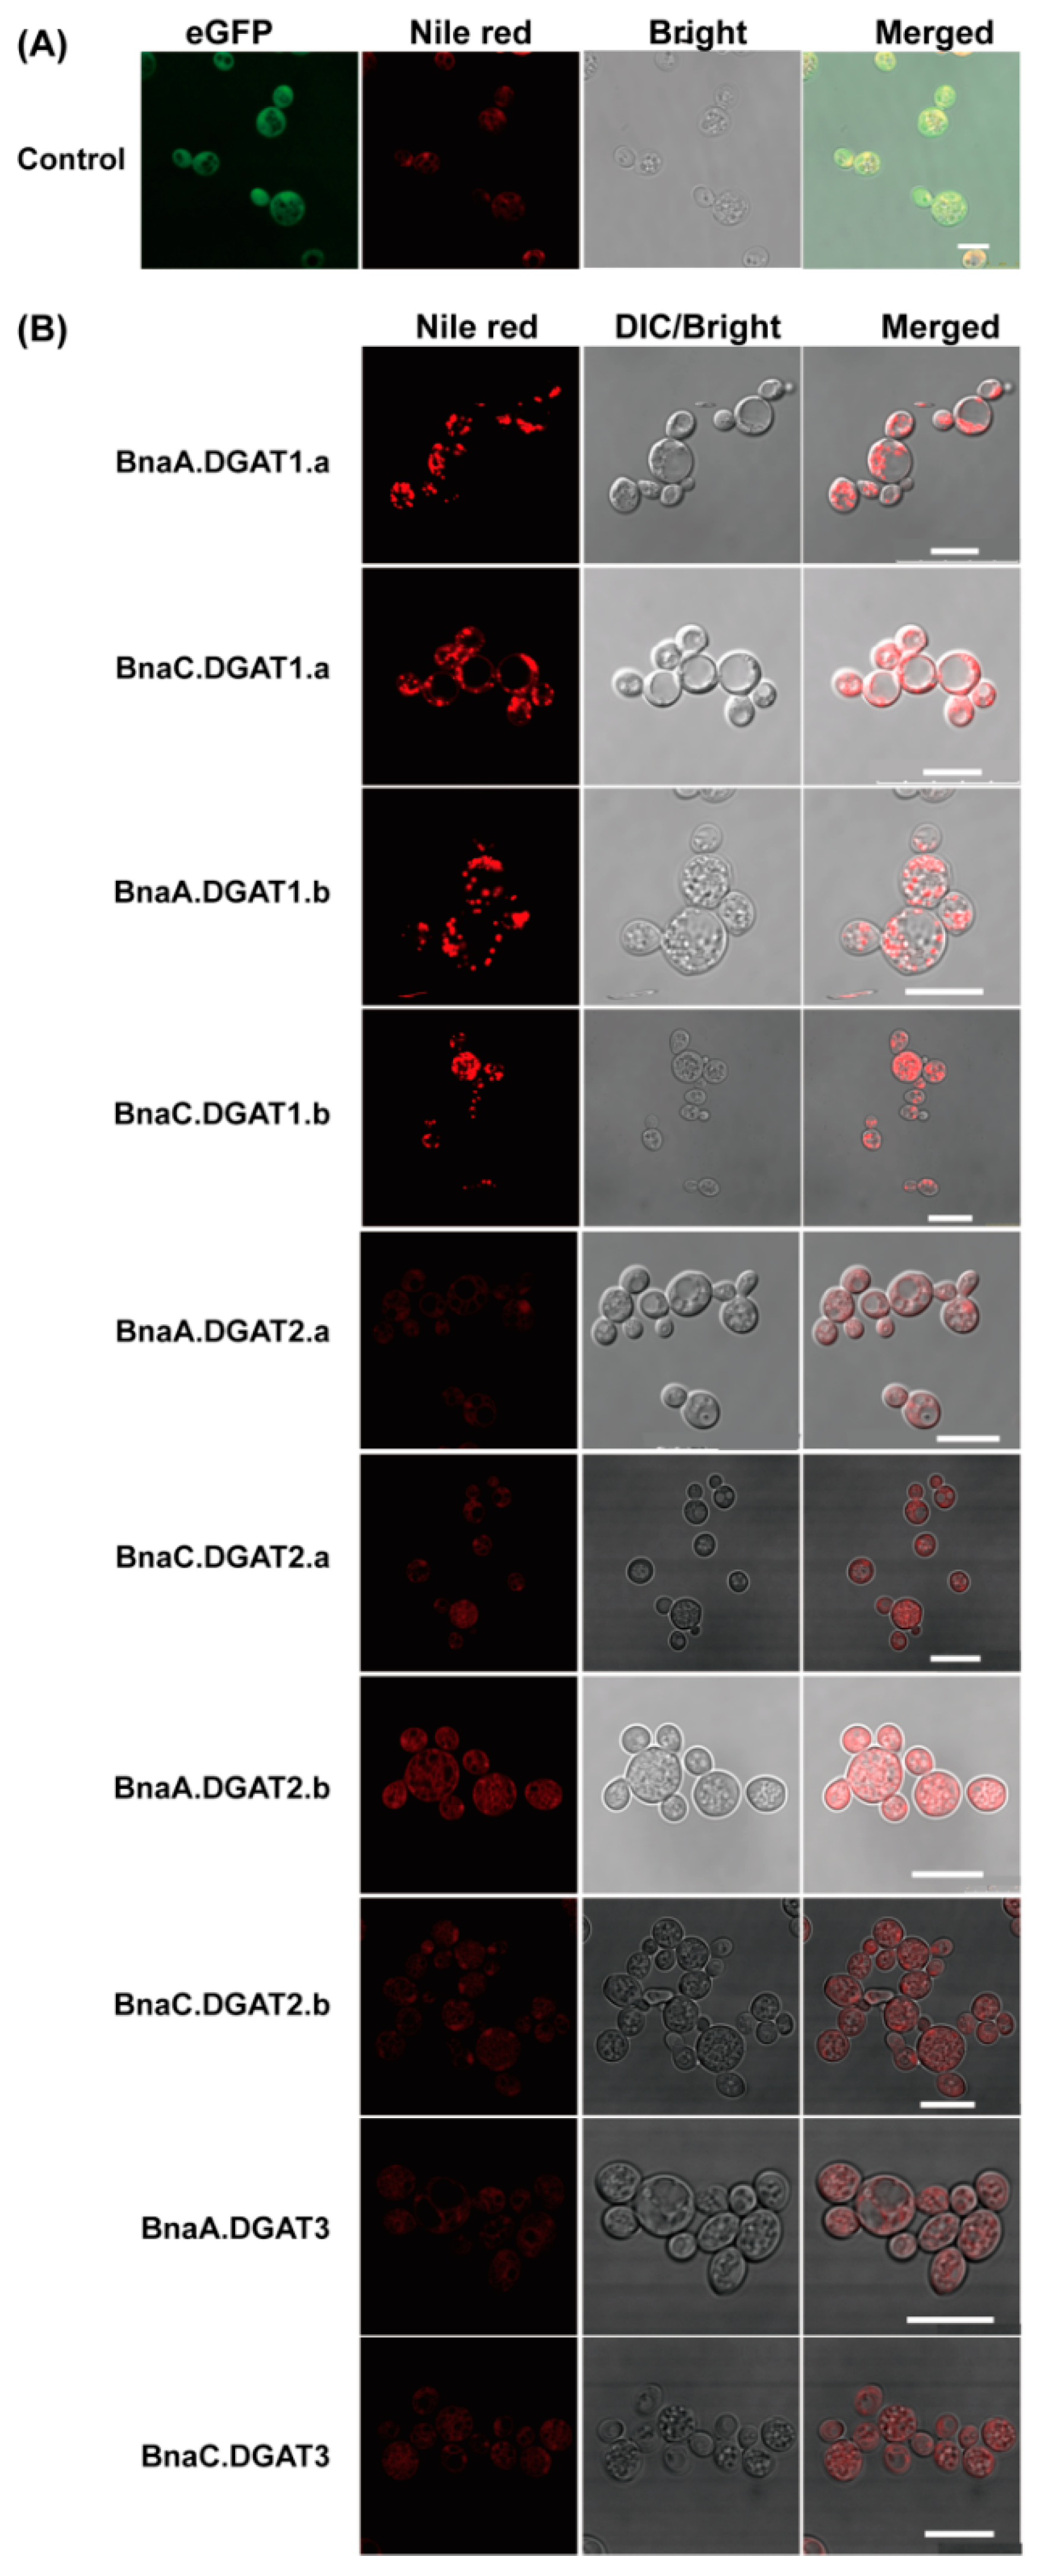
2.6. Oil Droplets in S. cerevisiae H1246 Overexpressing BnaDGATs

DGAT is the rate-limiting enzyme in the last step of TAG synthesis, and TAG is the main component of oil bodies. Therefore, the yeast mutant H1246 (MATα are1-Δ::HIS3, are2-Δ::LEU2, dga1-Δ::KanMX4, lro1-Δ::TRP1 ADE2) [59] that are defective in TAG biosynthesis were used to determine whether the ten BnaDGATs are able to complement the mutated enzymes and allow the synthesis and accumulation of TAG. As shown in Figure 4, many obvious oil bodies were detected in yeast H1246 overexpressing BnaDGAT1s, while no obvious oil bodies were detected in H1246 overexpressing BnaDGAT2s and BnaDGAT3s, suggesting that only the four BnaDGAT1s were able to re-establish TAG synthesis in yeast H1246.

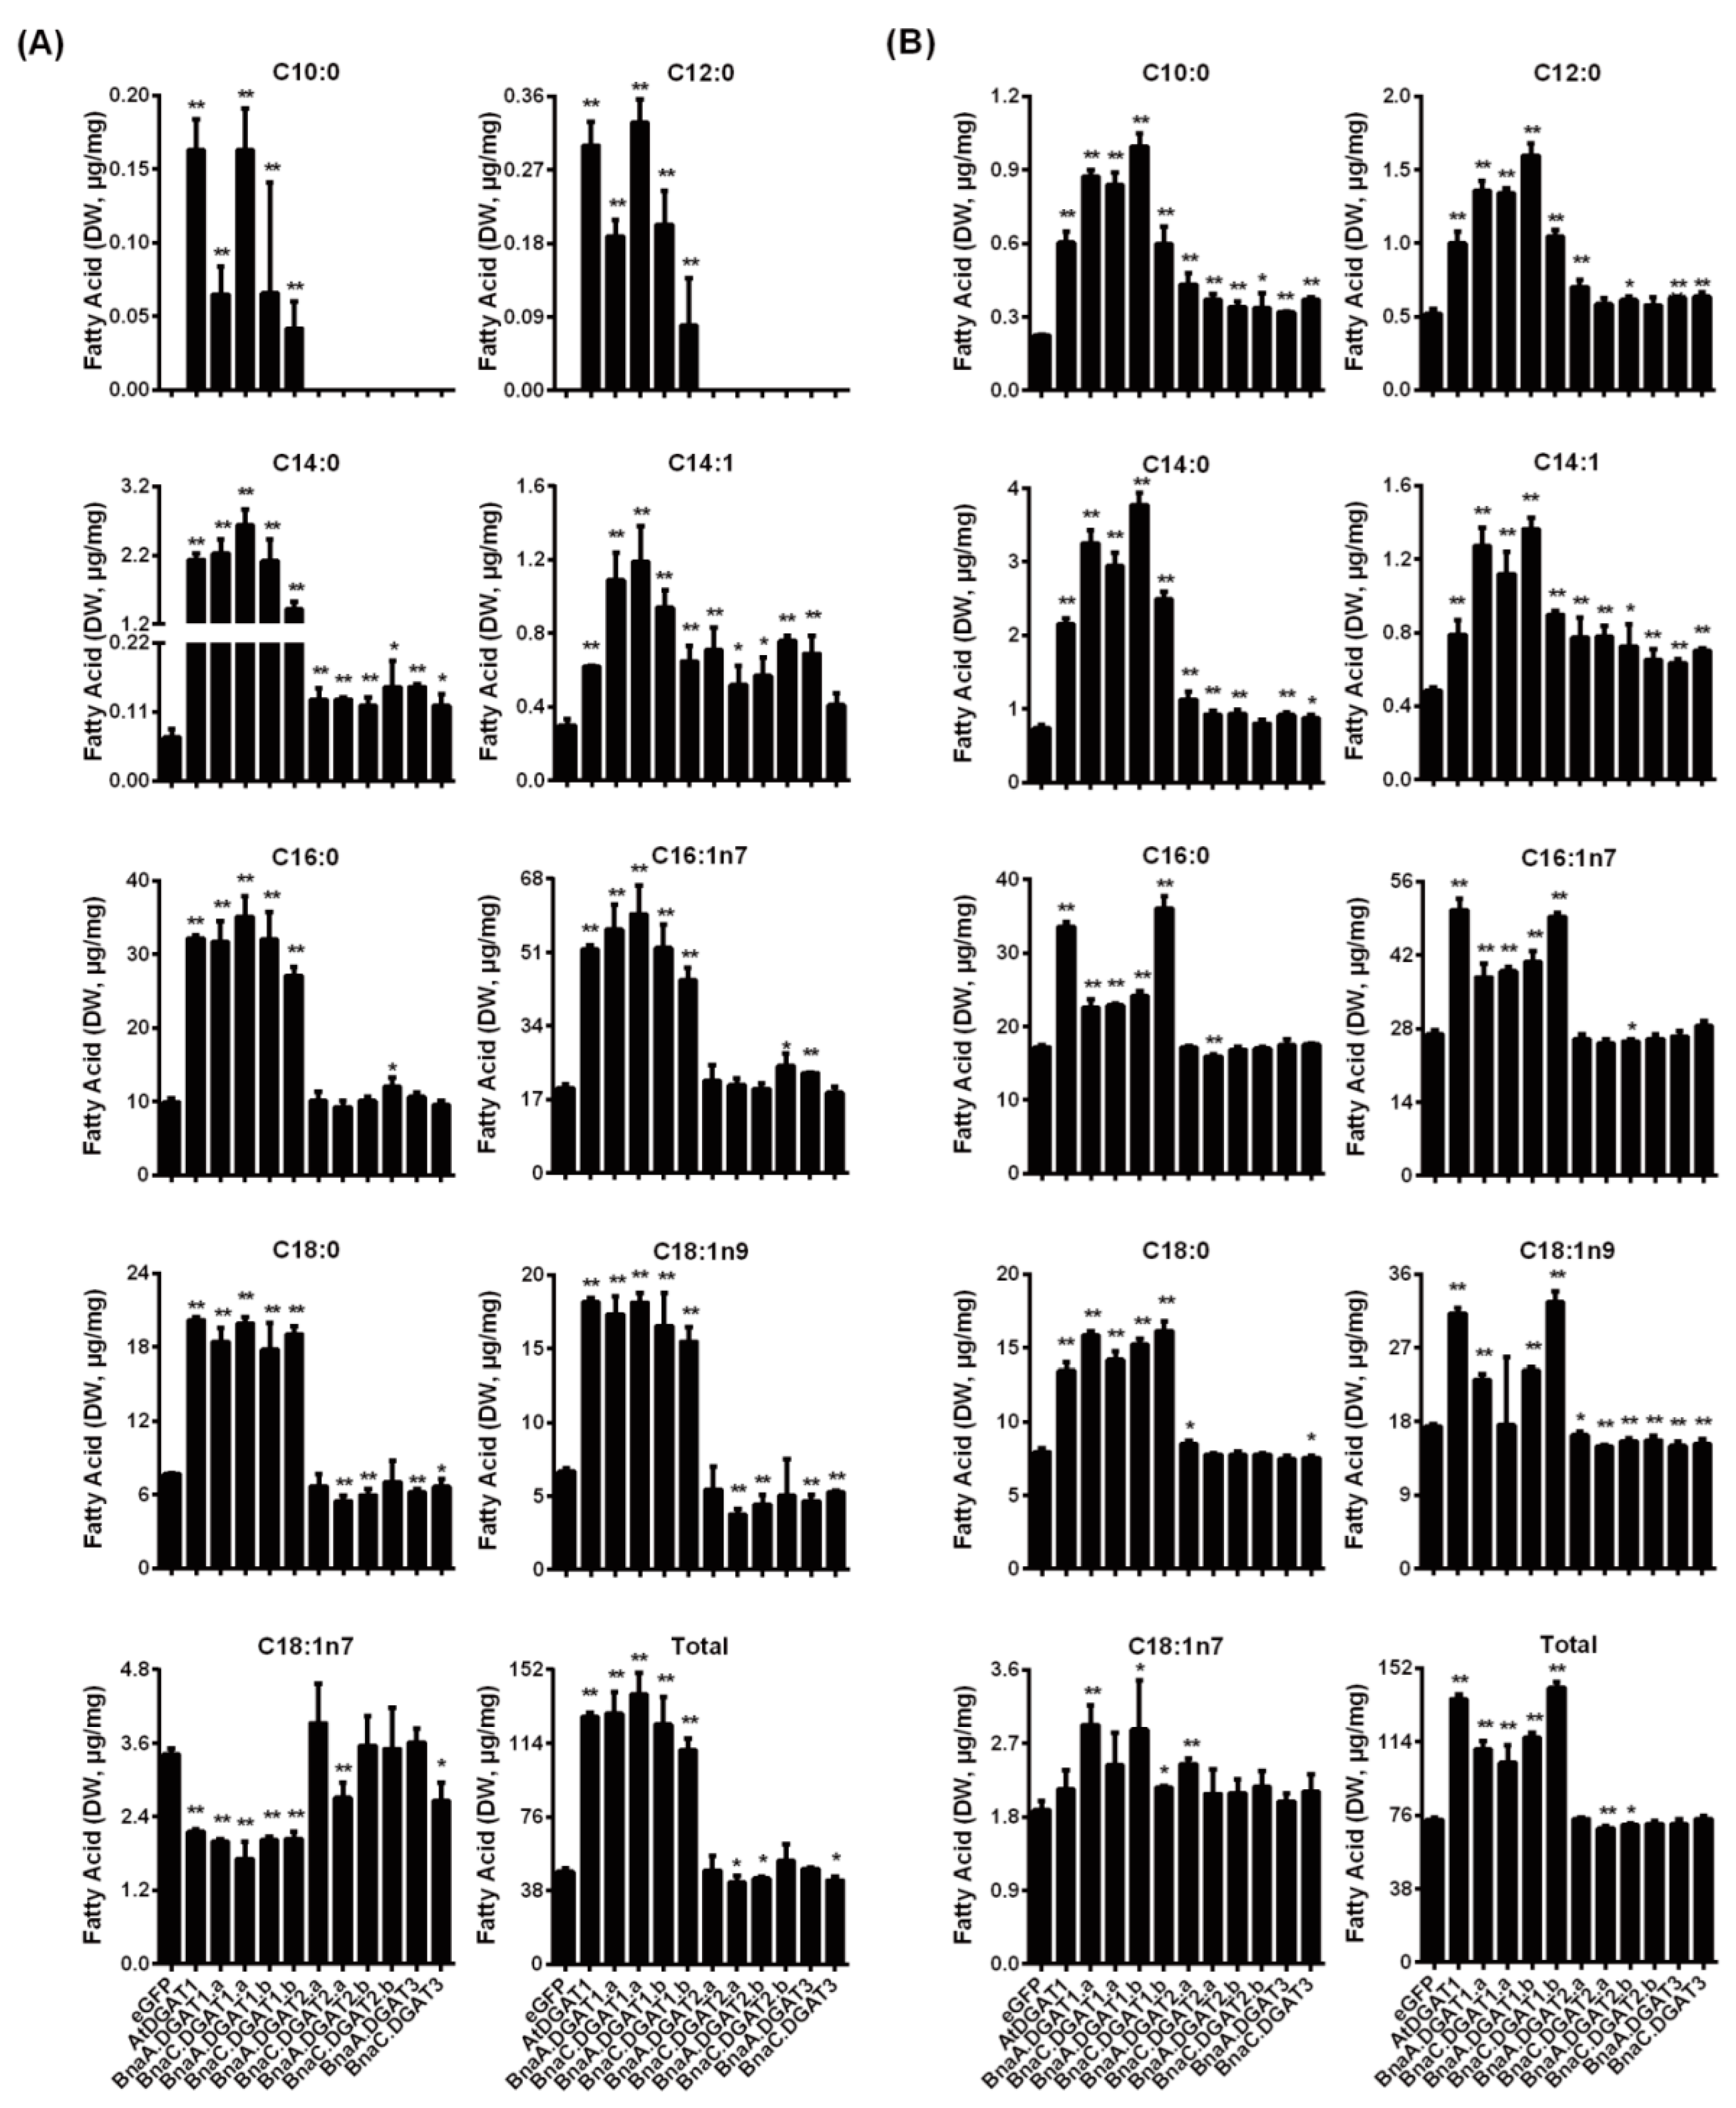
2.7. Fatty Acid Profiles in Yeast H1246 and INVSc1 Expressing BnaDGATs

In this study, the fatty acids in S. cerevisiae H1246 and INVSc1 (MATa his3Δ1 leu2 trp1-289 ura3-52/MATα his3Δ1 leu2 trp1-289 ura3-52) expressing BnaDGATs were quantitatively analyzed by GC–MS to evaluate the effect of BnaDGATs on the accumulation of fatty acids in B. napus (Figure 5). As shown in Figure 5A, in H1246, the expression of BnaDGAT1s resulted in a slight accumulation of C10:0 and C12:0 fatty acids and a significant accumulation of C14:0, C14:1, C16:0, C16:1n7, C18:0 and C18:1n9 fatty acids and increased the content of total fatty acids by one–two times but significantly decreased the content of C18:1n7 fatty acids. The expression of BnaDGAT2s and BnaDGAT3s promoted the accumulation of both C14:0 and C14:1 fatty acids. As shown in Figure 5B, in INVSc1, the expression of BnaDGAT1s resulted in the significant accumulation of C10:0, C12:0, C14:0, C14:1, C16:0, C16:1n7 and C18:0 and increased the total fatty acid content by approximately 0.23- to 1-fold; the expression of BnaA.DGAT2.a, BnaC.DGAT2.a, BnaA.DGAT2.b, BnaA.DGAT3 or BnaC.DGAT3 resulted in the accumulation of C10:0, C14:0 and C14:1. By comparing the effects of BnaDGATs on fatty acid accumulation in yeast H1246 and INVSc1, it was found that the expression of BnaDGAT1s could promote the accumulation of C10:0, C12:0, C14:0, C14:1, C16:0, C16:1n7, C18:0 and total fatty acids, while the expression of BnaDGAT2s and BnaDGAT3s could not promote the accumulation of total fatty acids in H1246 and INVSc1.

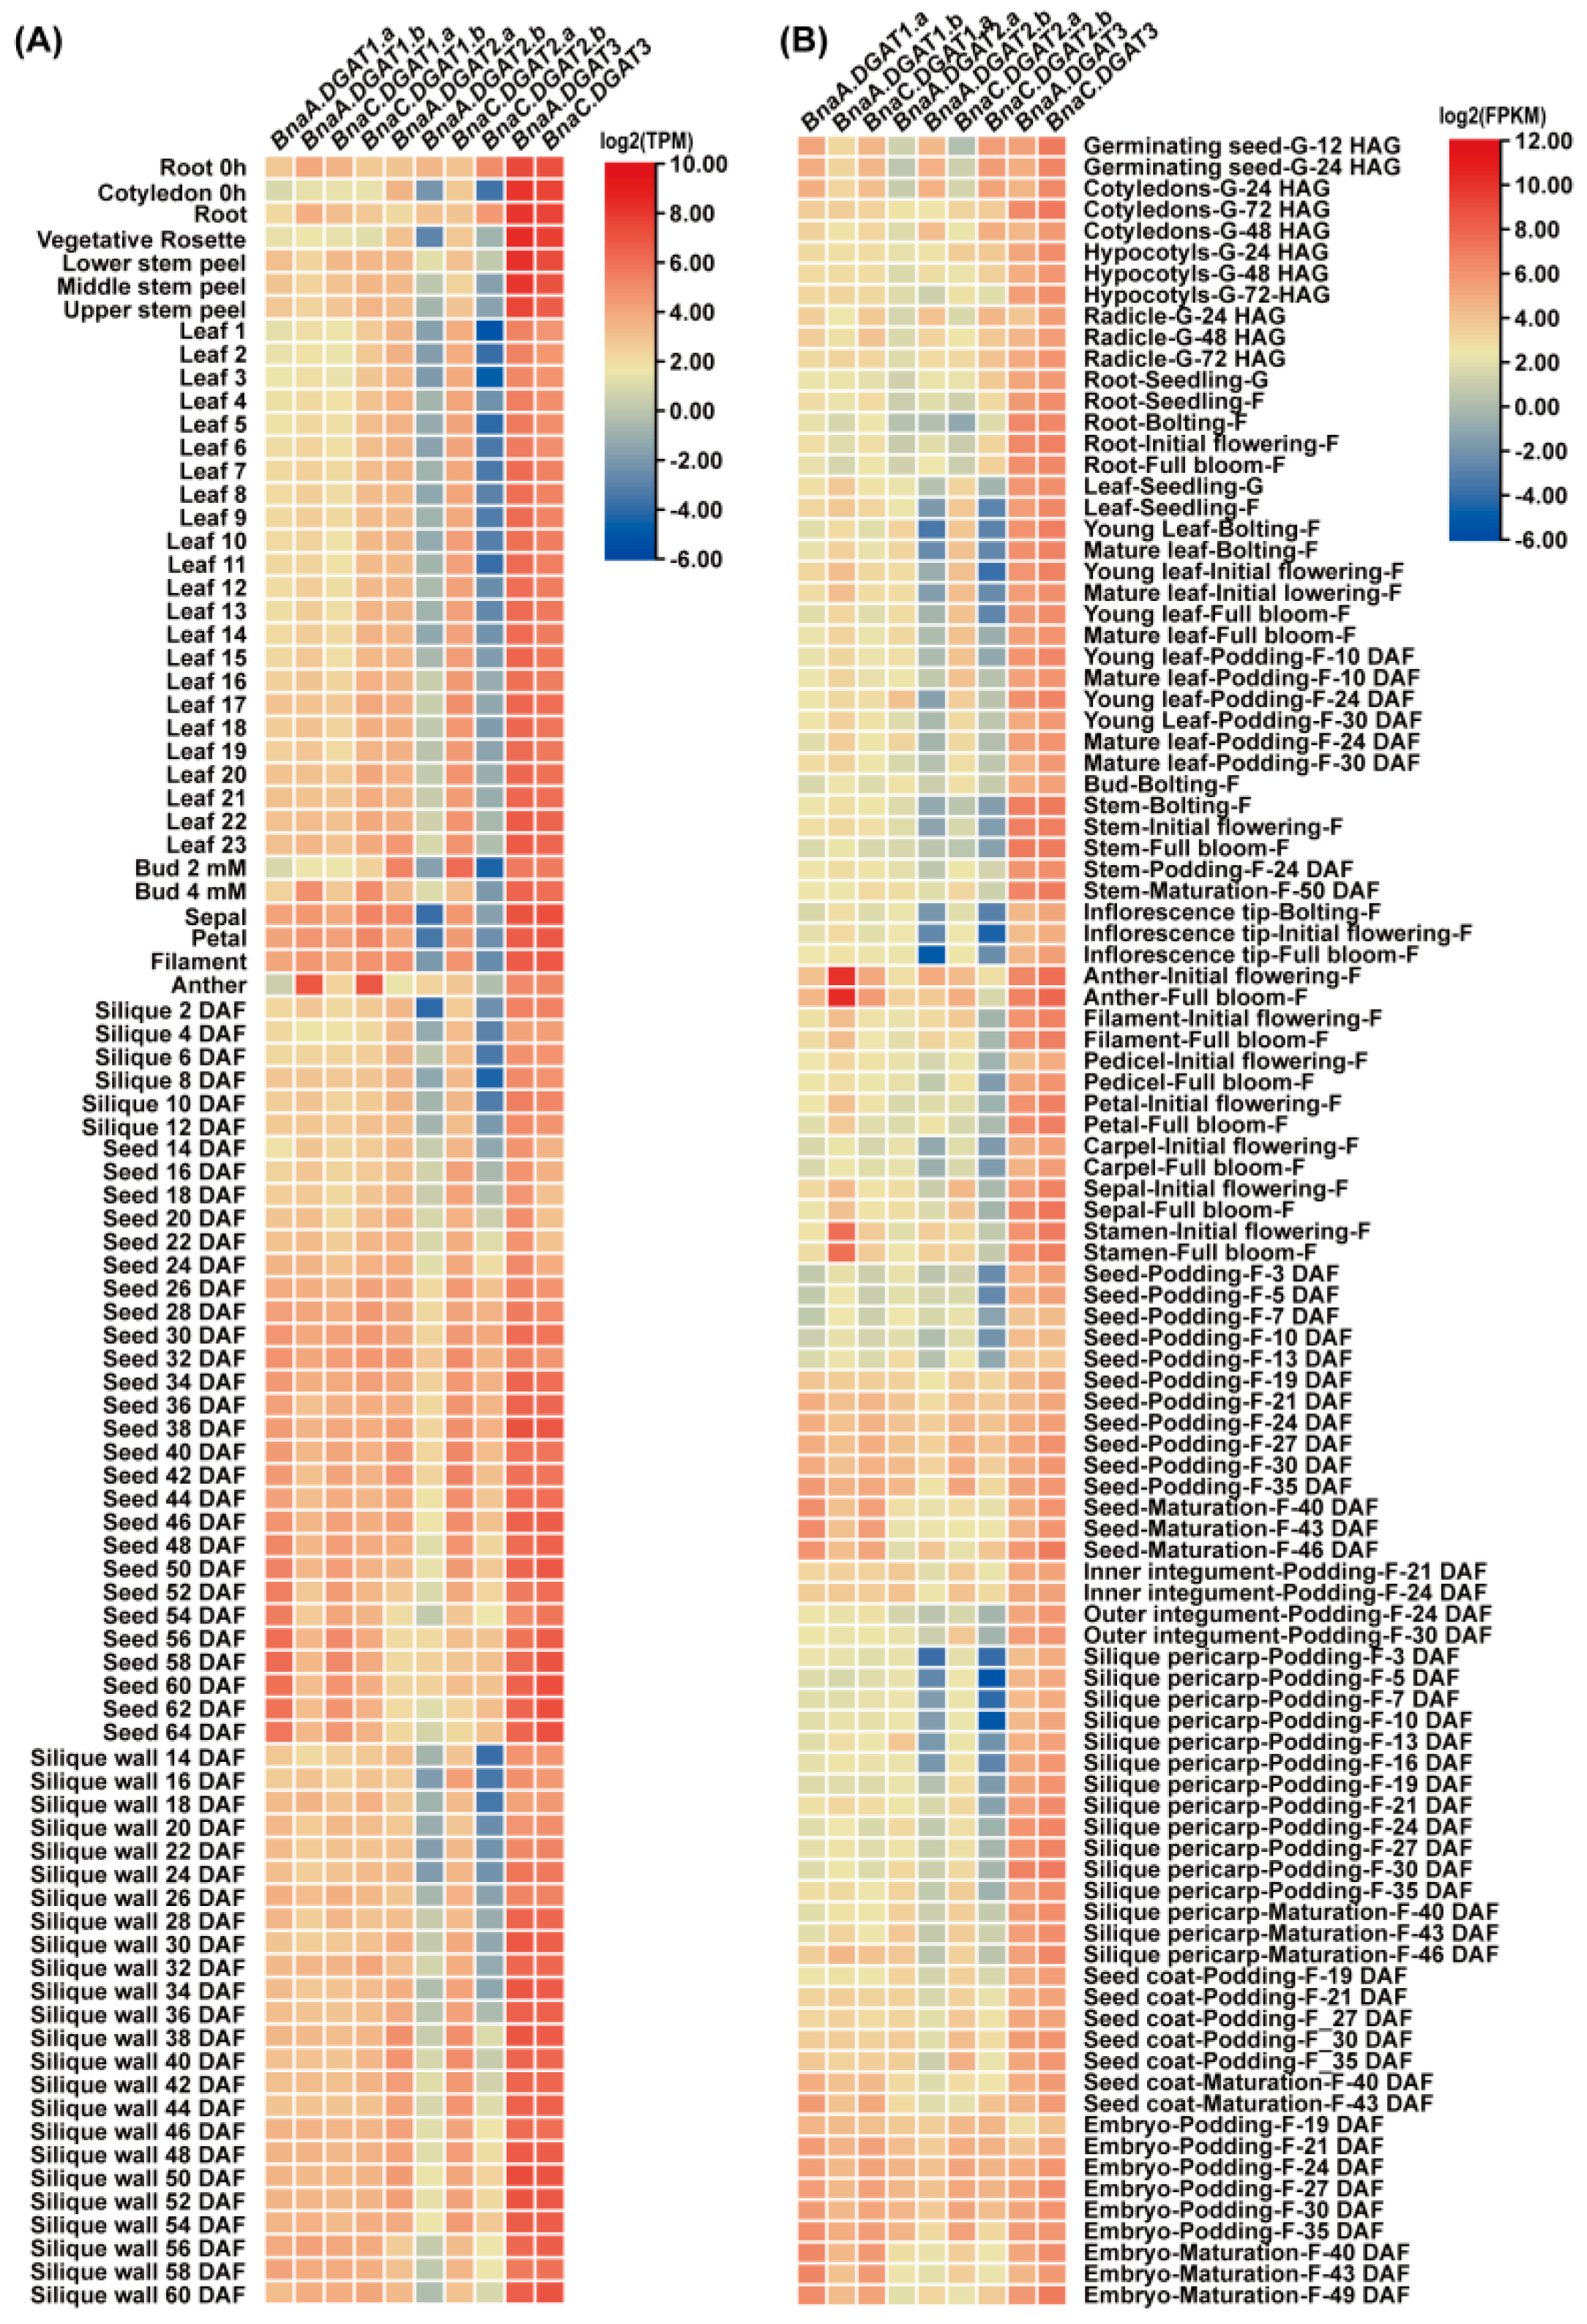
2.8. Transcriptomic and qRT-PCR Analysis of BnaDGATs in Different Tissues

The transcriptomic expression data of the BnaDGAT gene family from the different tissues of B. napus were obtained from BnTIR (http://yanglab.hzau.edu.cn/BnTIR (accessed on 10 November 2021)) [60] and BrassicaEDB (https://brassica.biodb.org/ (accessed on 10 November 2021)) [61]. The extracted data from BnTIR and BrassicaEDB were normalized by log2(TPM) and log2(FPKM), respectively, and the heatmaps were generated by TBtools (Figure 6). The results showed that the expression patterns of the three BnaDGAT gene families were different among diverse tissues. Every homologous pair of BnaA.DGAT1.a and BnaC.DGAT1.a, BnaA.DGAT1.b and BnaC.DGAT1.b, BnaA.DGAT2.a and BnaC.DGAT2.a, BnaA.DGAT2.b and BnaC.DGAT2.b, and BnaA.DGAT3 and BnaC.DGAT3 shared a similar expression pattern. The expression levels of BnaA.DGAT2.b and BnaC.DGAT2.b were lower than those of other BnaDGATs in most detected tissues, while the expression levels of BnaA.DGAT3 and BnaC.DGAT3 were higher than those of other BnaDGATs in most detected tissues. The expression levels of BnaA.DGAT1.a and BnaC.DGAT1.a in seeds and embryos gradually increased during seed and embryo development. The expression levels of BnaA.DGAT1.b and BnaC.DGAT1.b in seeds first gradually increased and then gradually decreased during seed development. The expression levels of BnaA.DGAT2.a and BnaC.DGAT2.a in seeds, silique walls and embryos first gradually increased and then gradually decreased during the development of seeds, silique walls and embryos. In particular, BnaA.DGAT1.b and BnaC.DGAT1.b were highly expressed in anthers and stamens.

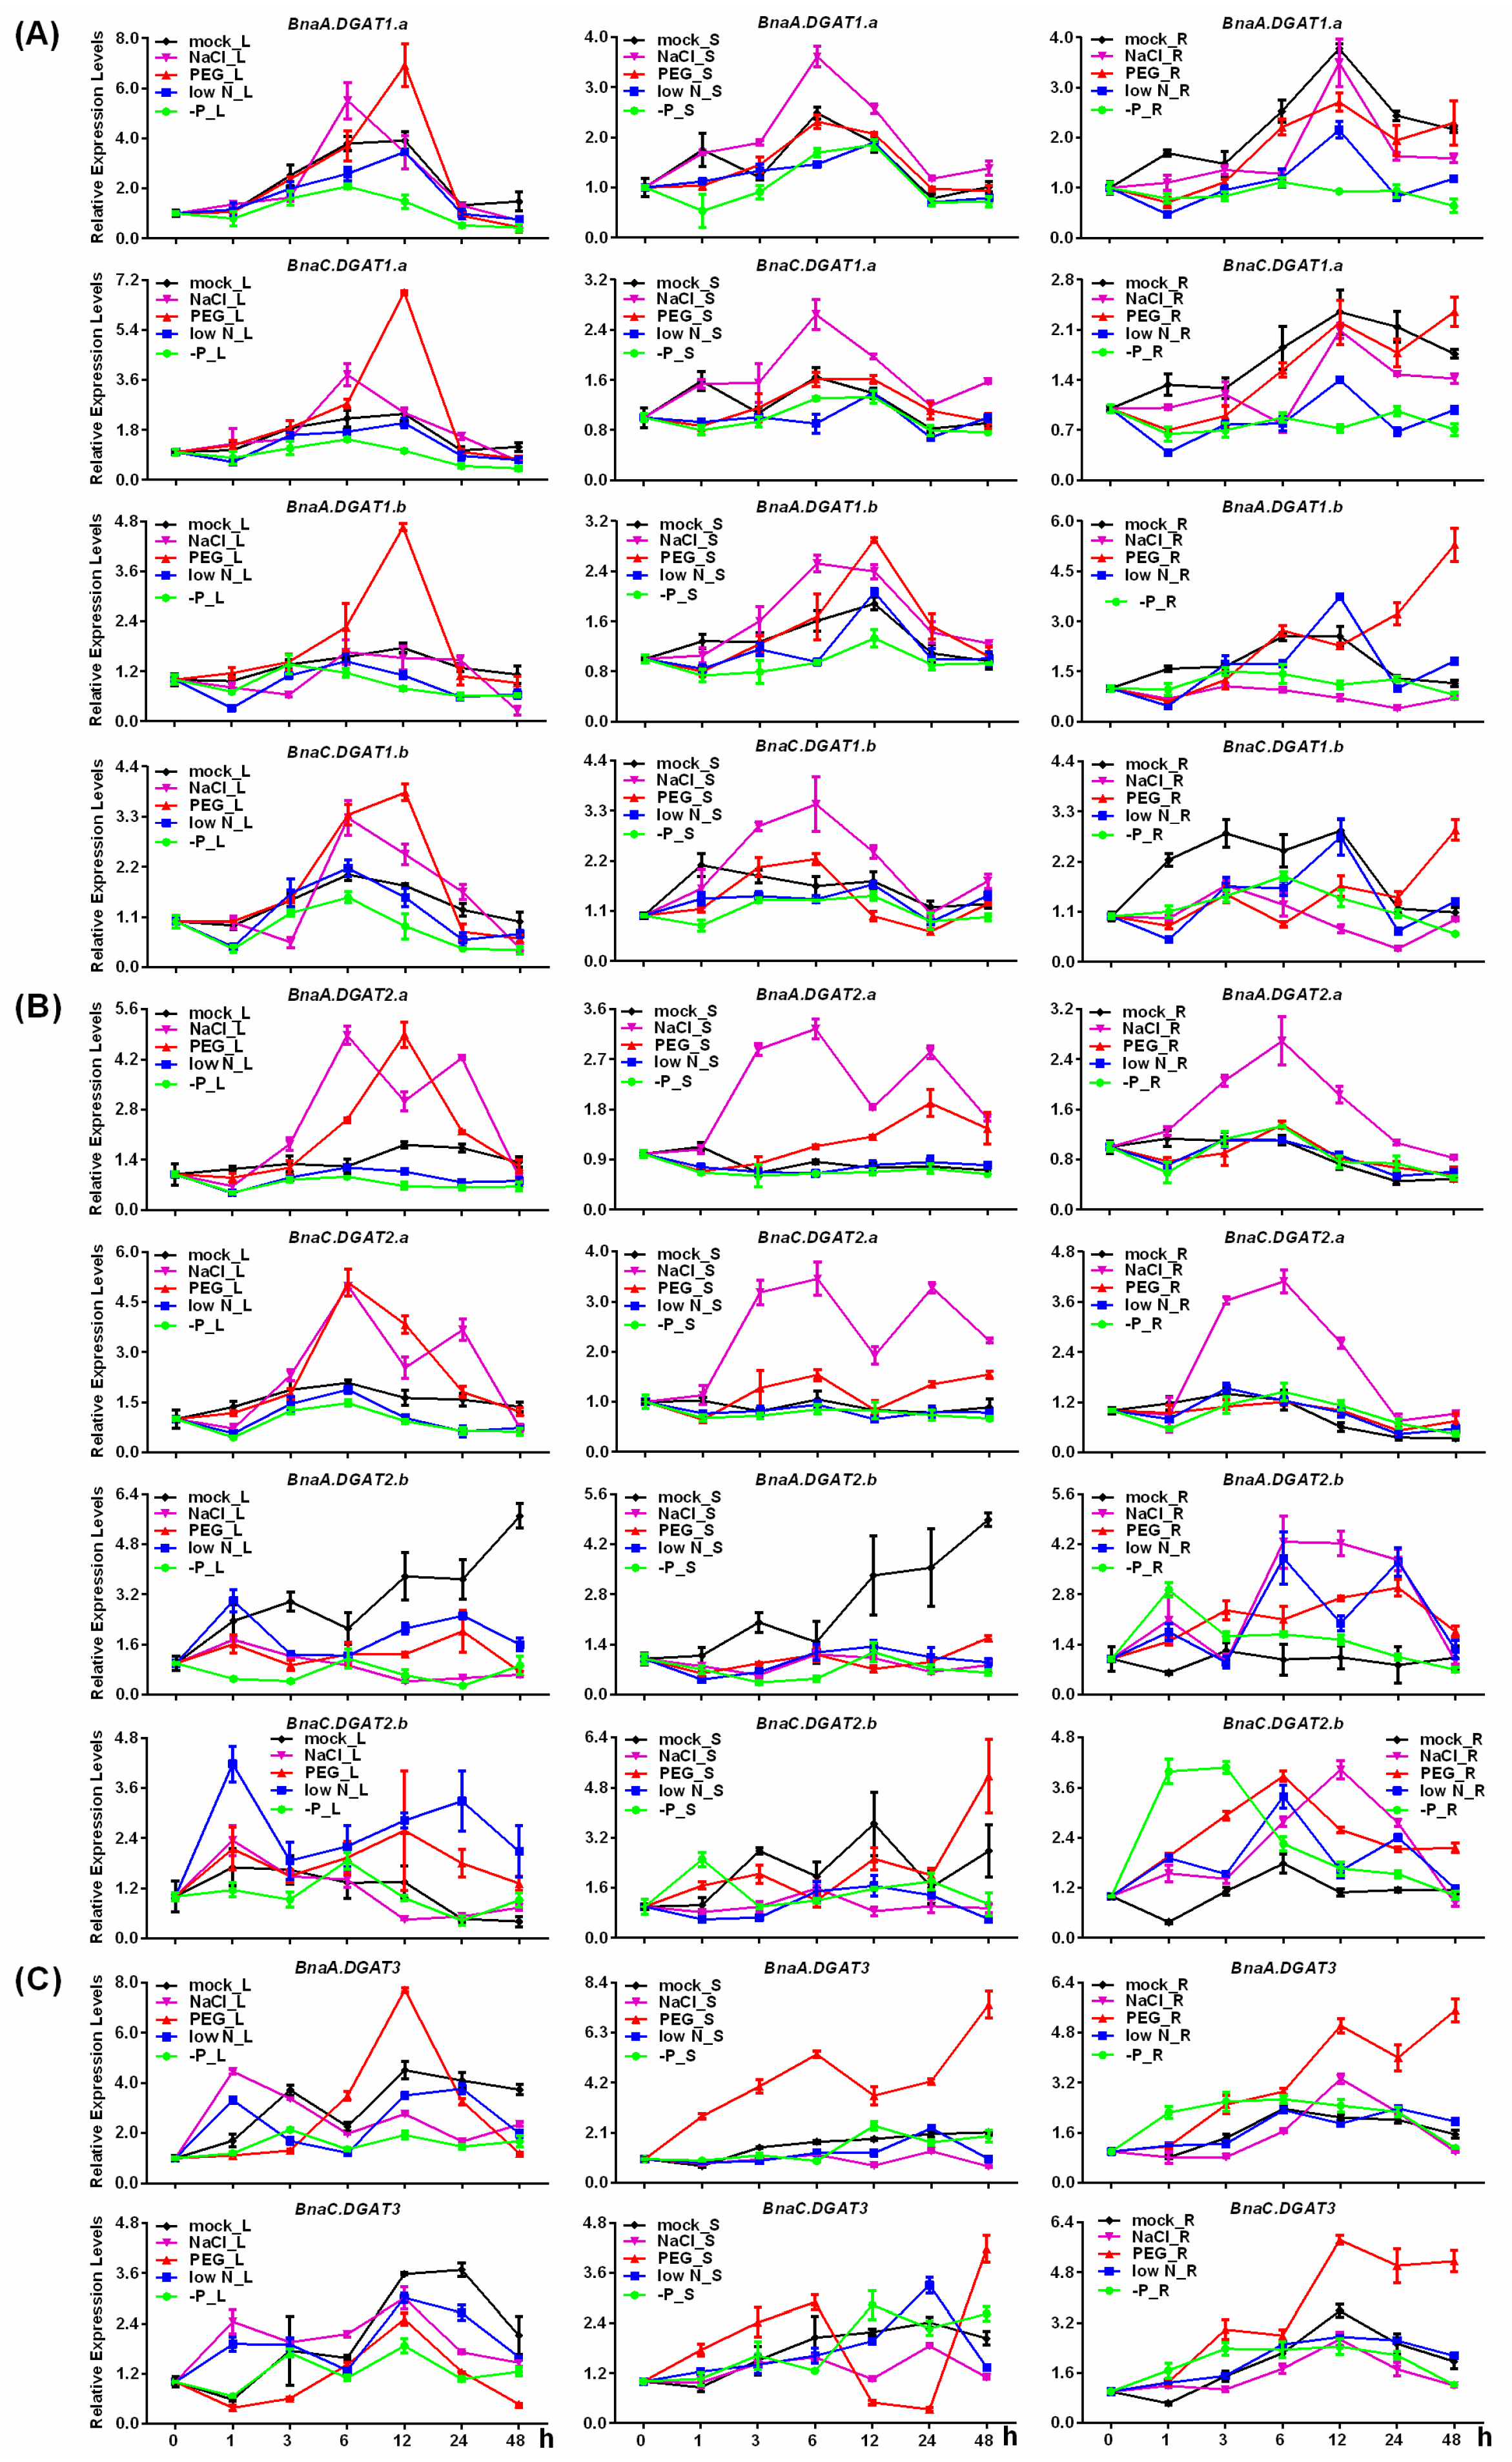
2.9. Expression Analysis of BnaDGATs under Different Stresses

Six-week-old B. napus seedlings were used to investigate the expression patterns of BnaDGATs in roots, stems and leaves under abiotic stresses, including P starvation, low N, drought and salinity, by qRT–PCR.
Under P starvation, compared with mock, the expression levels of BnaDGAT1s, BnaA.DGAT2.b and BnaC.DGAT2.b in roots, stems and leaves were lower; the expression patterns of BnaA.DGAT2.a and BnaC.DGAT2.a in roots, stems and leaves were not changed significantly; the expression levels of two BnaA.DGAT3s in leaves were decreased, while their expression levels in roots and stems were not changed significantly (Figure 7).
During low N, compared with mock, the expression patterns of four BnaDGAT1s in stems and leaves and BnaA.DGAT1.b in roots were not changed, while the expression levels of BnaA.DGAT1.a and BnaC.DGAT1.a in roots were lower. For BnaDGAT2s, the expression patterns of BnaA.DGAT2.a and BnaC.DGAT1.a in roots and stems under low N were not changed, while their expression levels in leaves were lower; the expression levels of BnaA.DGAT2.b in leaves and stems were lower, while its expression levels in roots were higher; the expression levels of BnaC.DGAT2.b in stems were lower, while its expression levels in leaves and roots were higher. For the two BnaDGAT3s, their expression patterns in roots and stems were quite consistent with those in mock, while their expression levels in leaves decreased at the late stages of low N treatment (Figure 7).
During salt stress, compared with mock, the expression levels of four BnaDGAT1s in the stems were higher, while their expression levels in roots were lower. For BnaDGAT2s, the expression levels of BnaA.DGAT2.a and BnaC.DGAT2.a in roots, stems and leaves were higher; the expression levels of BnaA.DGAT2.b in leaves and stems were lower, while its expression levels in roots were higher; the expression levels of BnaC.DGAT2.b in stems were lower, but its expression levels in roots were higher. For BnaDGAT3s, the expression levels of BnaA.DGAT3 in stems and leaves and BnaC.DGAT3 in roots, stems and leaves were lower than those in mock with 12–48 h stress (Figure 7).
During drought stress, compared with mock, the expression levels of four BnaDGAT1s in leaves at 12 h of treatment and BnaC.DGAT1.a BnaA.DGAT1.b and BnaC.DGAT1.b in roots at 48 h of treatment were higher, while the expression patterns of BnaA.DGAT1.a and BnaC.DGAT1.a in stems were quite consistent. For BnaDGAT2s, the expression levels of BnaA.DGAT2.a and BnaC.DGAT2.a in stems and leaves were higher; the expression levels of BnaA.DGAT2.b in leaves and stems were lower, while its expression levels in roots were higher; the expression patterns of BnaC.DGAT2.b in leaves and stems were quite consistent with those in mock, while its expression levels in roots were higher than those in mock. For BnaDGAT3s, the expression levels of BnaA.DGAT3 in stems and roots and BnaC.DGAT3 in roots were higher than those in mock, while the expression levels of BnaC.DGAT3 in leaves treated for 12–48 h were quite low (Figure 7).

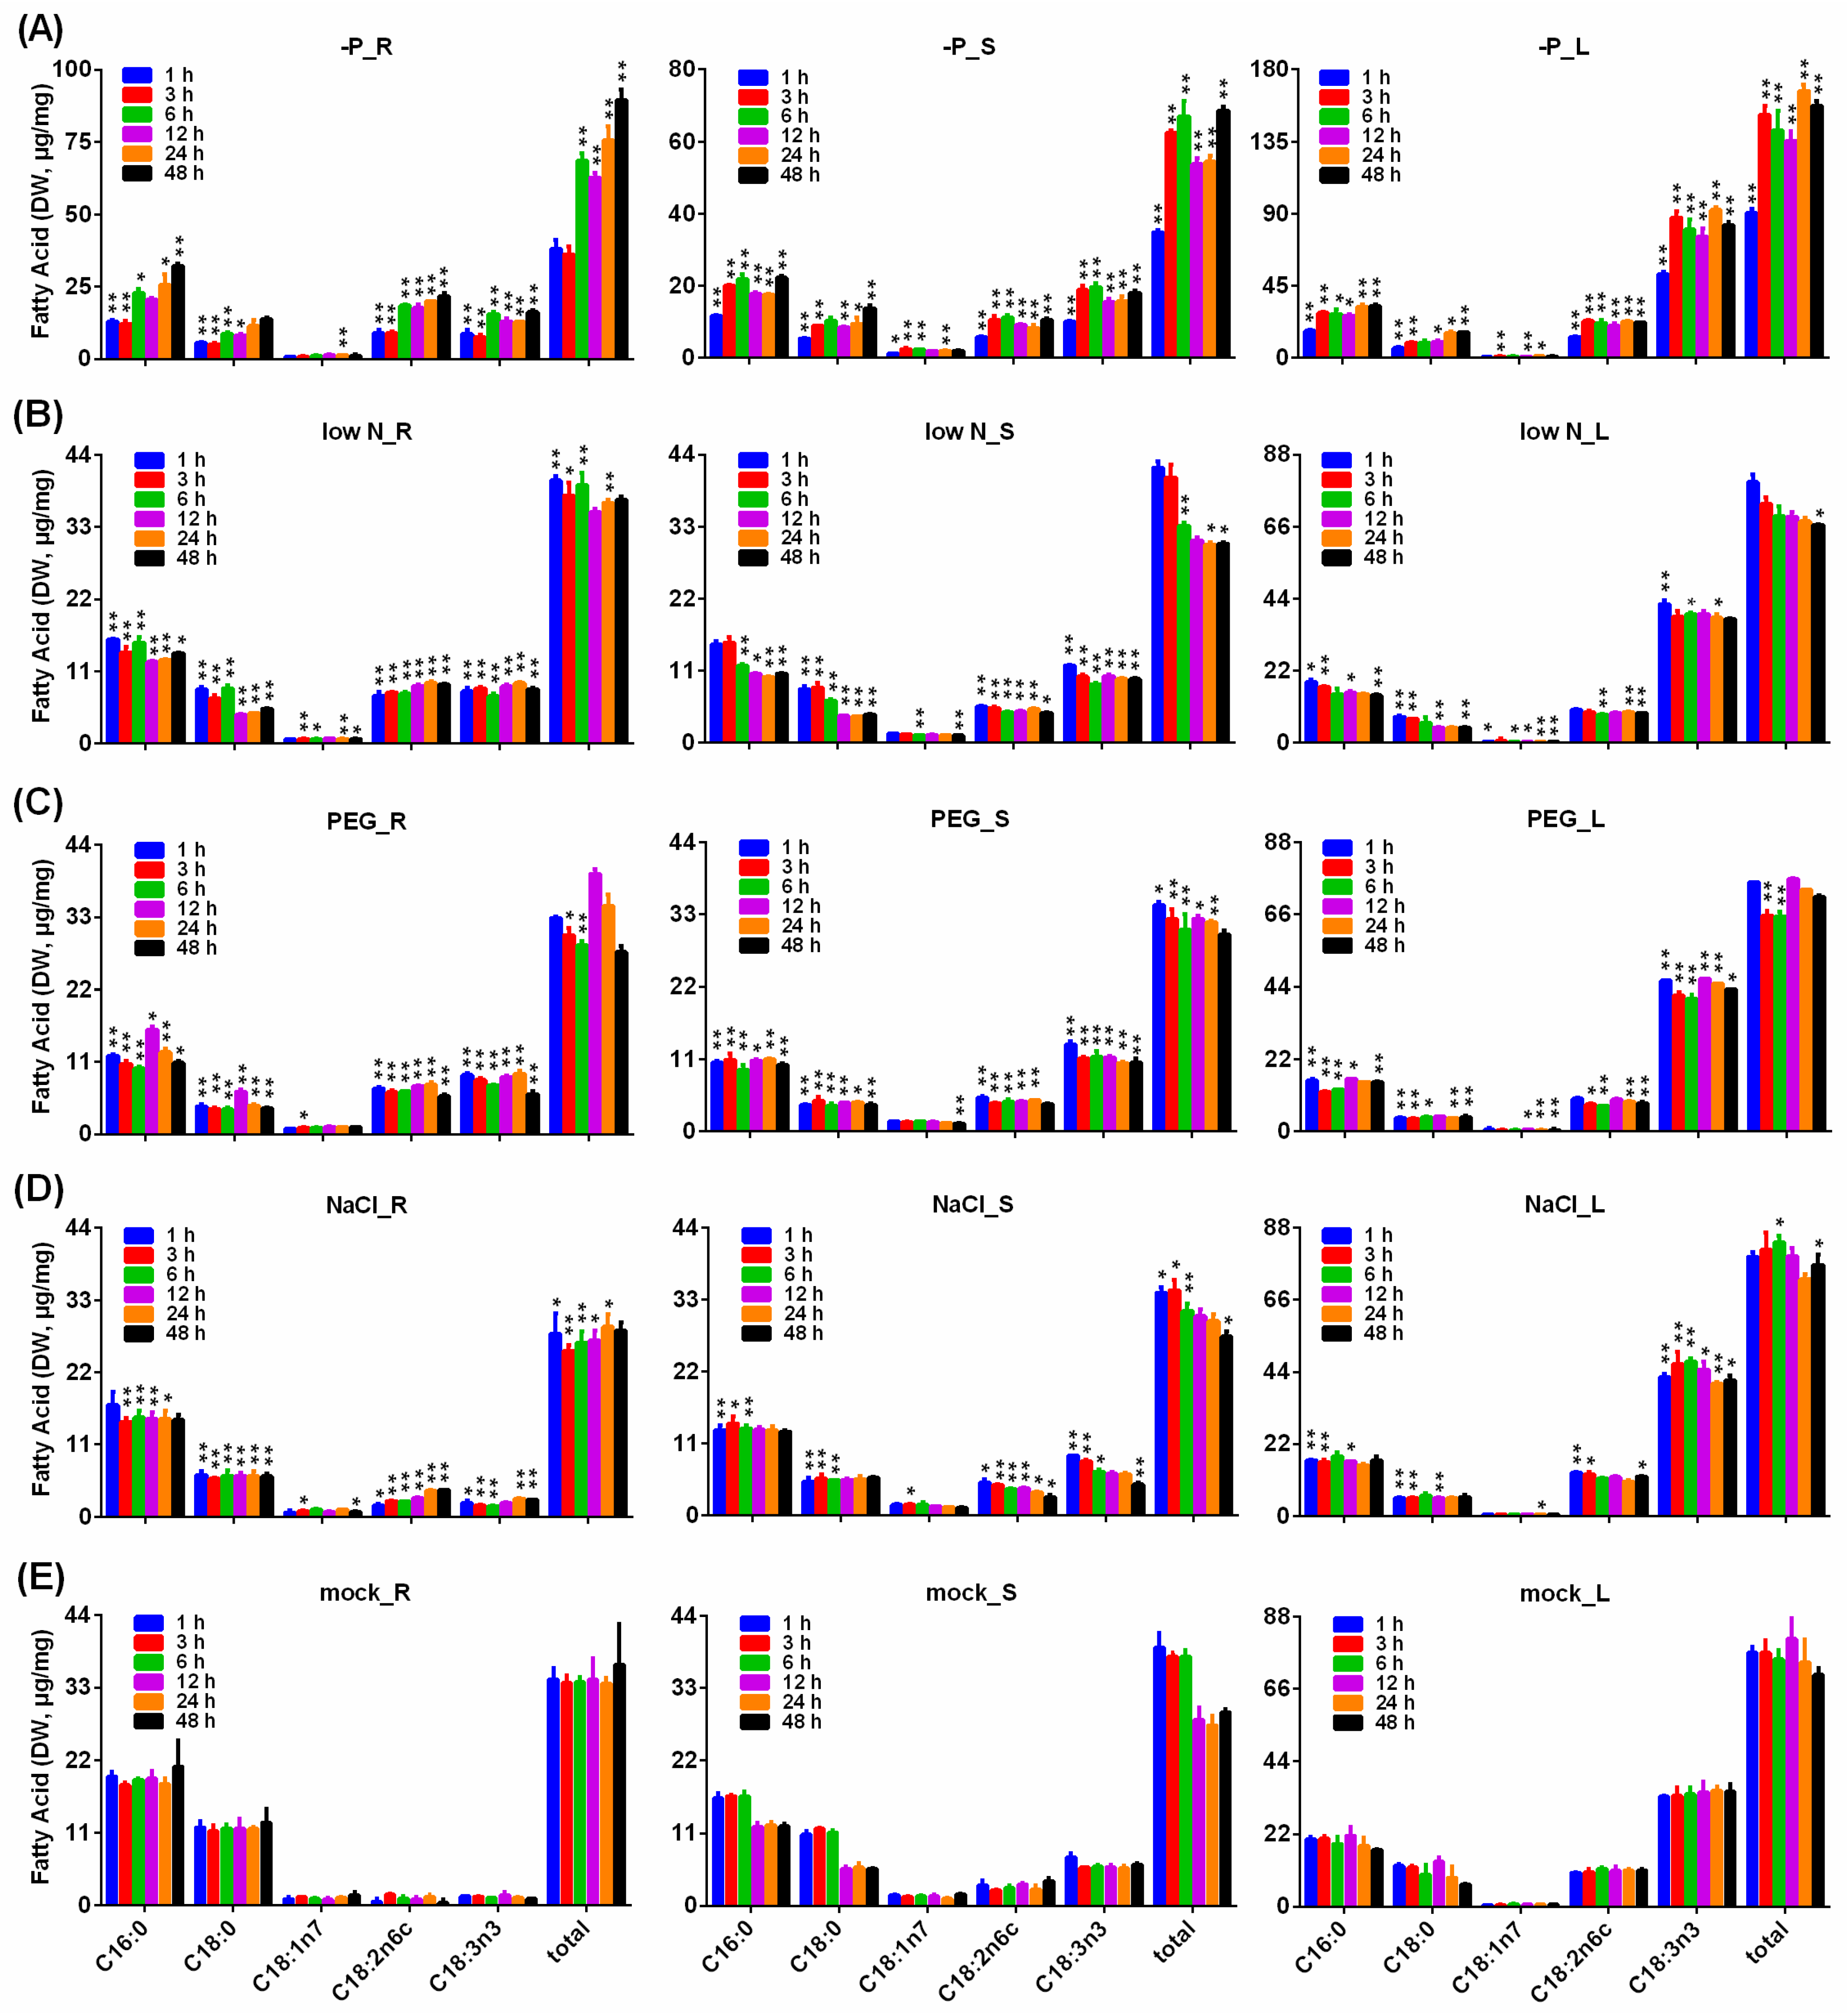
2.10. Analysis of Fatty Acids in B. napus Seedlings under P Starvation, Low N, Drought and Salinity Stresses

Under the stresses of P starvation, low N, drought and salinity, the contents of fatty acids in B. napus roots, stems and leaves were measured by GC–MS (Figure 8).
Under P starvation, compared with mock, the content of total fatty acids in roots at 6 h to 48 h, in stems at 3 h to 48 h and in leaves at 1 h to 48 h significantly increased, as well as the content of C18:2n6c and C18:3n3 in roots, stems and leaves at 1 h to 48 h; the content of 16:0 decreased in roots at 1 h and 3 h and in stems and in leaves at 1 h, whereas it increased in roots at 6 h, 24 h and 48 h and in stems and in leaves at 3 h to 48 h; the content of 18:0 decreased in roots at 1 h to 12 h, in stems at 1 h and 3 h and in leaves at 1 h, 3 h and 12 h, whereas it increased in stems at 12 h to 48 h and in leaves at 24 h and 48 h; the content of 18:1n7 decreased in stems at 1 h but increased in roots at 24 h, in stems at 3 h, 6 h and 24 h and in leaves at 3 h, 12 h and 24 h (Figure 8A).
Under low N stress, compared with mock, the accumulation of total fatty acids was promoted in roots at 1 h to 6 h and 24 h and in stems at 24 h and 48 h but inhibited in stems at 6 h and in leaves at 48 h; the content of 16:0 decreased in roots at 1 h to 48 h, in stems at 6 h to 48 h and in leaves at 1 h, 3 h, 12 h and 48 h; the content of 18:0 decreased in roots and stems at 1 h to 48 h and in leaves at 1 h, 3 h, 12 h and 48 h; the content of 18:1n7 decreased in roots at 3 h, 6 h, 24 h and 48 h, in stems at 6 h and 48 h and in leaves at 1 h and 6 h to 48 h; the accumulation of C18:2n6c increased in roots and stems at 1 h to 48 h but decreased in leaves at 6 h, 24 h and 48 h; the content of C18:3n3 increased in roots and stems at 1 h to 48 h and in leaves at 1 h, 6 h and 48 h (Figure 8B).
Under drought stress, compared with mock, the accumulation of total fatty acids was reduced in roots and leaves at 3 h and 6 h and in stems at 1 h to 6 h, while its accumulation in stems at 12 h and 24 h was elevated; the accumulation of 16:0 and 18:0 in roots and stems at 1 h to 48 h and in leaves at 1 h to 12 h and 48 h was reduced, as well as the accumulation of 18:1n7 in roots at 3 h, in stems at 48 h and in leaves at 12 h to 48 h; the accumulation of C18:3n3 in roots, stems and leaves at 1 h to 48 h was increased, as well as the content of C18:2n6c in roots at 1 h to 48 h and in stems at 1 h to 24 h, while the content of C18:2n6c in leaves at 3 h, 6 h, 24 h and 48 h was reduced (Figure 8C).
Under salt stress, compared with mock, the accumulation of total fatty acids was reduced in roots at 1 h to 24 h and in stems at 1 h to 6 h and 48 h, while its accumulation was elevated in leaves at 6 h and 48 h; the content of 16:0 was reduced in roots at 3 h to 24 h, in stems at 1 h to 6 h and in leaves at 1 h, 3 h and 12 h, as well as the content of 18:0 in roots at 1 h to 48 h, in stems at 1 h to 6 h and in leaves at 1 h, 3h and 12 h; the accumulation of C18:2n6c was increased in roots and stems at 1 h to 48 h and in leaves at 1 h, 3 h and 48 h, as well as the accumulation of C18:3n3 in roots at 1 h to 6 h, 24 h and 48 h, in stems at 1 h to 6 h and 48 h and in leaves at 1 h to 48 h. (Figure 8D).

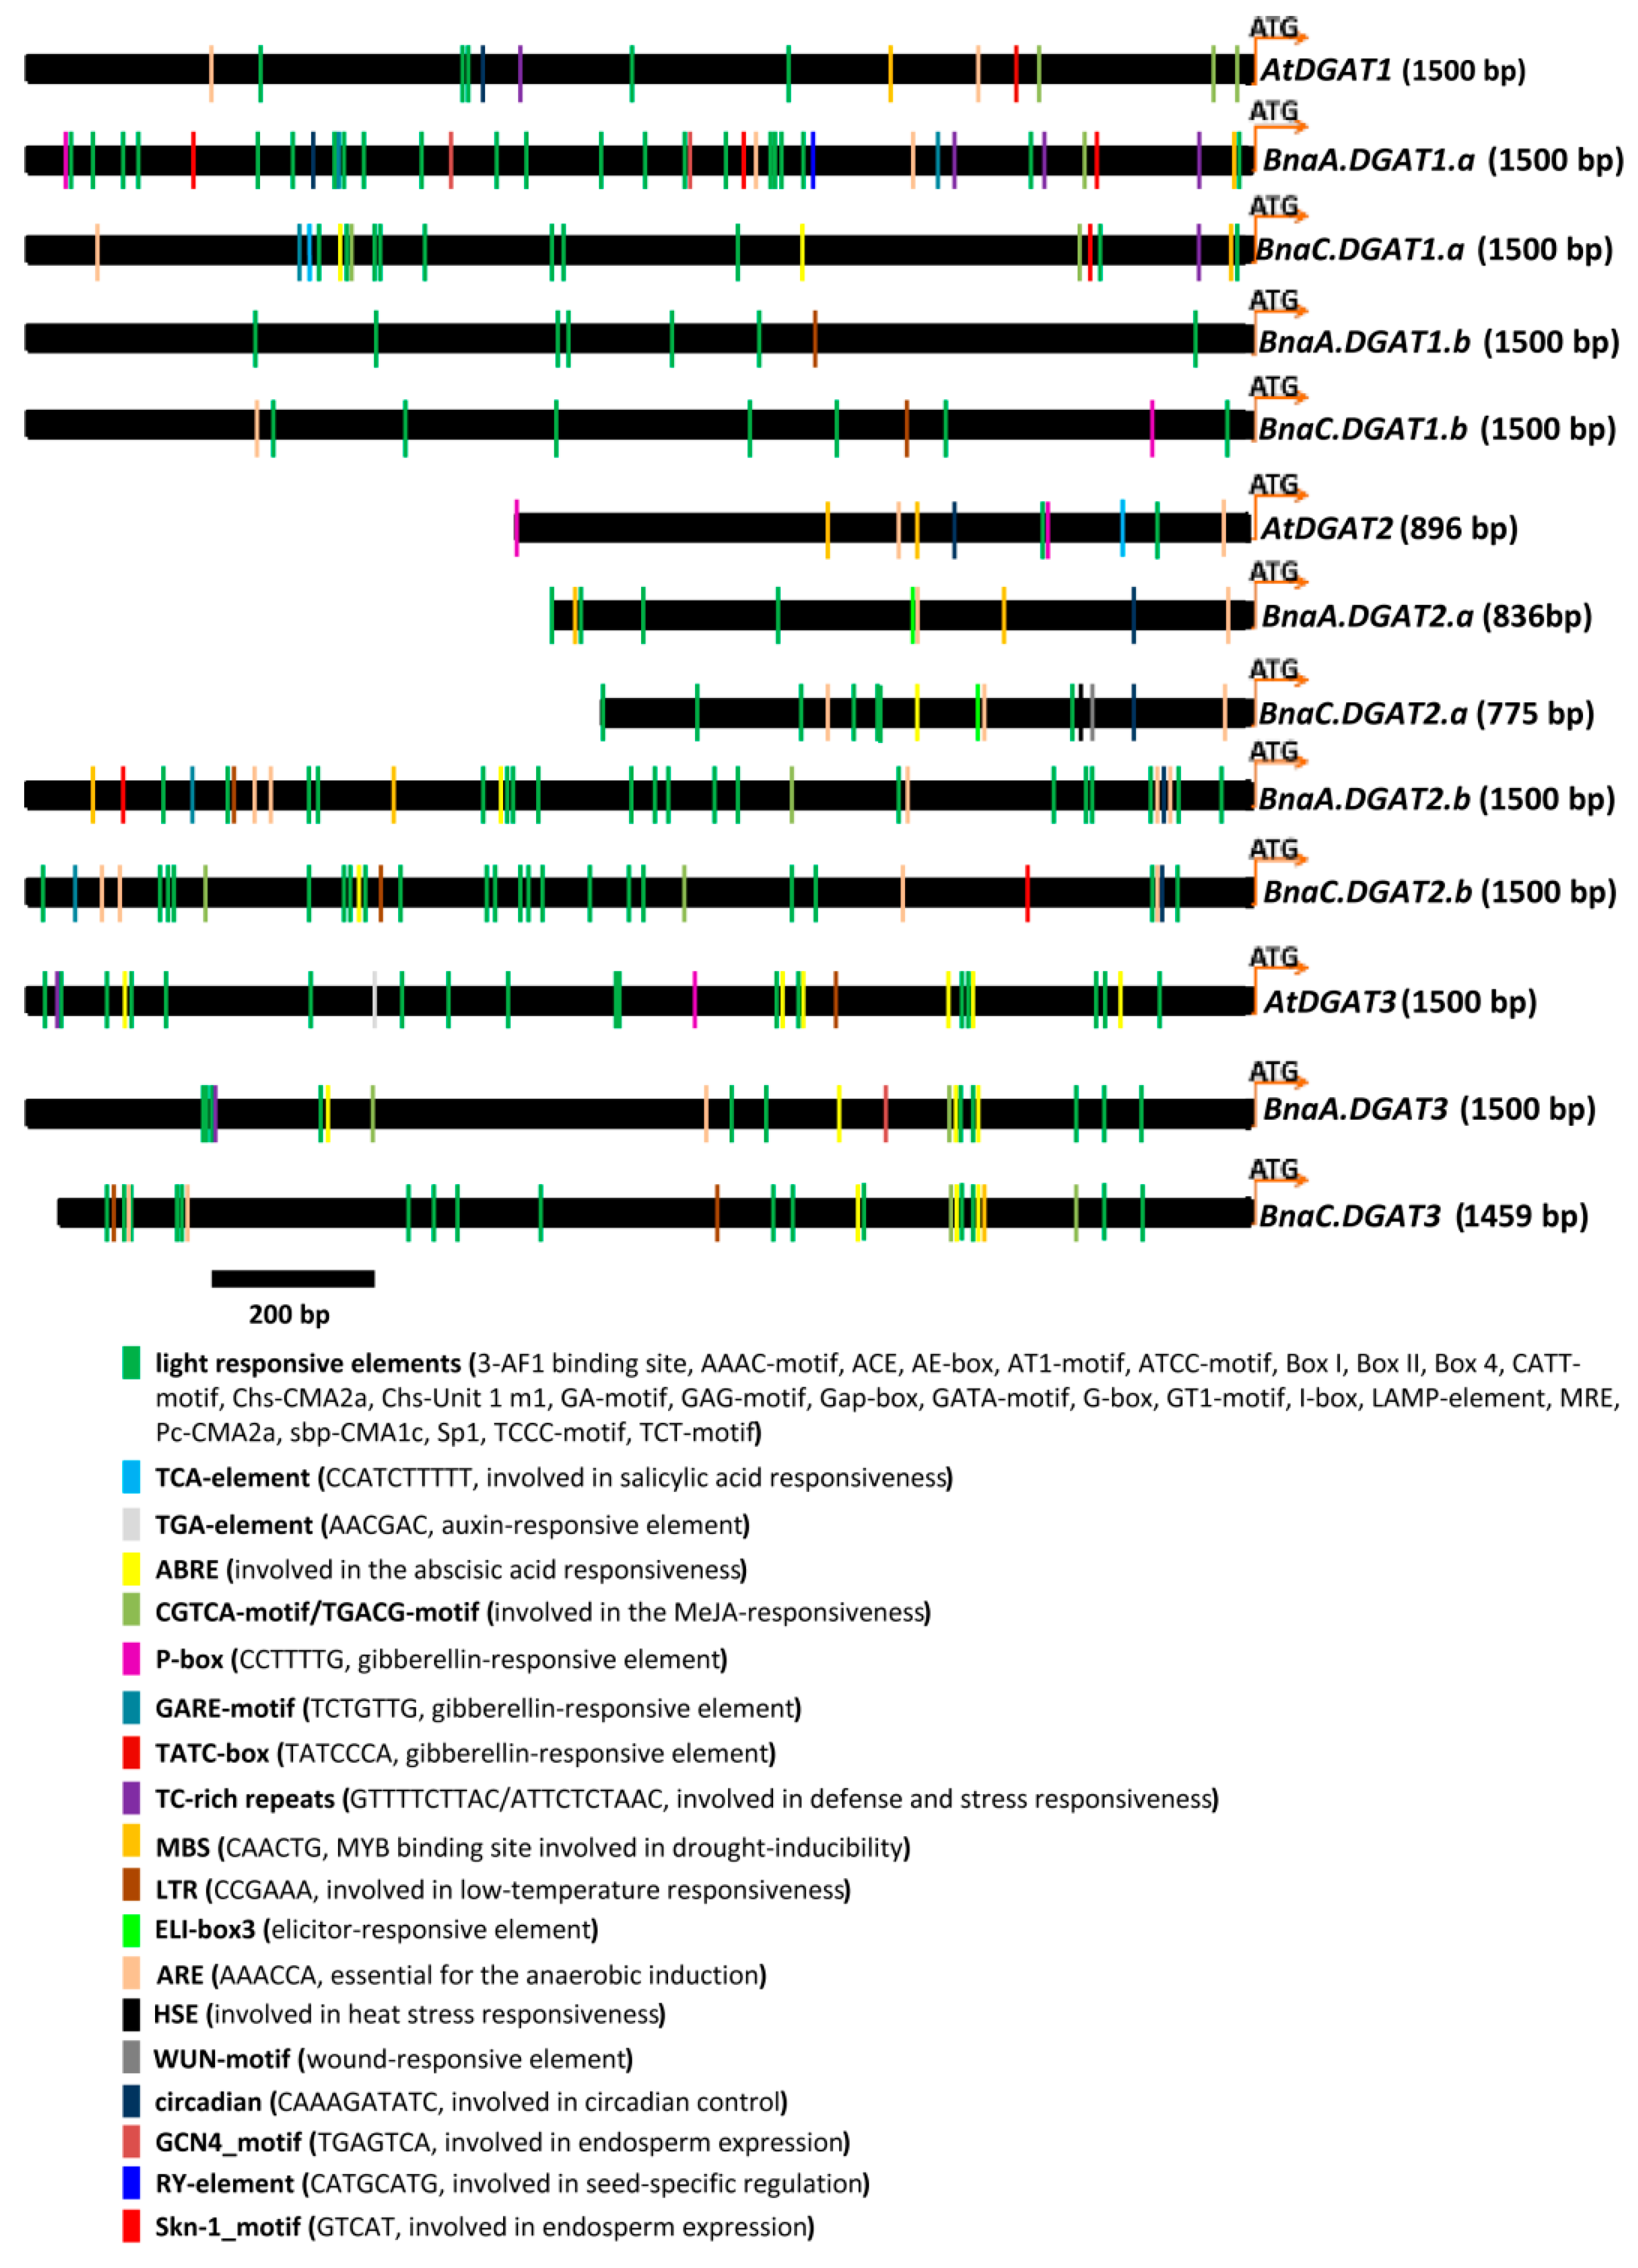
2.11. Cis-Elements in BnaDGAT Promoters and Transcription Factors and miRNA Regulating BnaDGATs

To gain more insights into the potential function and regulatory mechanism of ten BnaDGATs, we analyzed the cis-regulatory elements in their putative promoters by using the plantCARE database. The putative promoters of ten BnaDGATs were cloned as 1759 bp, 1488 bp, 1657 bp, 836 bp, 775 bp, 2151 bp, 1973 bp, 1660 bp and 1459 bp from ZS11 (Table 2 and Table S6). The putative promoters of three AtDGATs were derived from TAIR (Table S9). The cis-acting regulatory elements in the 776–1500 bp upstream promoter regions of BnaDGATs and AtDGATs were displayed (Figure 9 and Table S10).
As the putative promoters of DGAT1s, they all shared some light-responsive elements. All PAtDGAT1, PBnaA.DGAT1.a, PBnaC.DGAT1.a, and PBnaC.DGAT1.b shared anaerobic induction elements and gibberellin-responsive elements. PAtDGAT1, PBnaA.DGAT1.a and PBnaC.DGAT1.a possessed MeJA-responsive elements and defense and stress-responsive elements. Both PAtDGAT1 and PBnaA.DGAT1.a contained a circadian control element. Both PBnaA.DGAT1.b and PBnaC.DGAT1.b had a low-temperature-responsive element. PAtDGAT1 contained a drought-inducibility element. PBnaC.DGAT1.a contained an SA-responsive element. PBnaA.DGAT1.a contained two GCN4_motifs and three Skn-1_motifs, which are endosperm-expressive elements. In addition, PBnaA.DGAT1.a contained a seed-specific RY element. There was only one Skn-1_motif in PBnaC.DGAT1.a.
The putative promoters of AtDGAT2 and BnaDGAT2s also contained some light-responsive elements, anaerobic induction elements and circadian control elements. PAtDGAT2, PBnaA.DGAT2.a and PBnaA.DGAT2.b shared a drought-responsive element. PAtDGAT2, PBnaA.DGAT2.b and PBnaC.DGAT2.b contained gibberellin-responsive elements. PBnaC.DGAT2.a, PBnaA.DGAT2.b and PBnaC.DGAT2.b shared a Skn-1_motif and an ABA-responsive element. Both PBnaA.DGAT2.b and PBnaC.DGAT2.b had a low-temperature-responsive element. Both PBnaA.DGAT2.a and PBnaC.DGAT2.a shared an elicitor-responsive element. Both PBnaA.DGAT2.b and PBnaC.DGAT2.b contained one MeJA-responsive element. PAtDGAT2 contained an auxin-responsive element and an SA-responsive element. PBnaC.DGAT2.a contained a heat-stress-responsive element and a wound-responsive element.
PAtDGAT3, PBnaA.DGAT3 and PBnaC.DGAT3, also contained some light-responsive elements and ABA-responsive elements. Both PBnaA.DGAT3 and PBnaC.DGAT3 contained MeJA-responsive elements. Both PAtDGAT3 and PBnaA.DGAT3 shared a defense- and stress-responsive element. Both PAtDGAT3 and PBnaC.DGAT3 contained low-temperature-responsive elements. PAtDGAT3 contained a gibberellin-responsive element and an auxin-responsive element. PBnaA.DGAT3 contained an endosperm expression element and an anaerobic induction element. PBnaC.DGAT3 contained a drought-responsive element.
Transcription factors (TFs) regulate the precise initiation of gene transcription by binding the cis-acting elements of gene promoters. Therefore, we identified the target TFs putatively regulating the expression of BnaDGATs using the PlantRegMap server, and a total of 209 relationships were identified (Table S11). Three BnaDGAT gene families may be regulated by different TFs, such as the B3 family, dehydration-responsive element-binding protein (DREB), GATA, ethylene response factor (ERF), WRKY family, MYB and bZIP family, indicating that these TFs regulate plant development and stress responses.
miRNAs have been widely shown to play an important role at the transcriptional and posttranscriptional levels in regulating gene expression under stress [63,64]. Therefore, we predicted that the bna-miRNAs would target BnaDGATs using the psRNATarget website (www.zhaolab.org/psRNATarget/ (accessed on 25 November 2021)). The results showed that four miRNAs (bna-miR2111a-3p, bna-miR390a, bna-miR390b and bna-miR390c) only targeted BnaA.DGAT2.b and BnaC.DGAT2.b and that no miRNAs targeted BnaDGAT1s or BnaDGAT3s (Table S12). For B. rapa, bra-miR9562-5p was predicted to target BraDGAT1s (BraA07g001370.3C and BraA09g011830.3C), bra-miR2111a-3p to target one BraDGAT2 (BraA03g045590.3C) and bra-miR5721 to target BraDGAT2s (BraA01g022340.3C and BraA03g045590.3C) (Table S12). For B. oleracea, no miRNA was predicted to target the BolDGATs. In addition, six miRNAs (ath-miR3434-5p, ath-miR5020b, ath-miR5629, ath-miR5633, ath-miR5654-3p and ath-miR858a) were predicted to target AtDGAT1, six miRNAs (ath-miR2936, ath-miR390a-5p, ath-miR390b-5p, ath-miR5641, ath-miR835-5p and ath-miR847) to target AtDGAT2 and two miRNAs (ath-miR847 and ath-miR4221) to target AtDGAT3 (Table S12).

3. Discussion

B. napus is an allotetraploid (AACC) crop that originated from the hybridization of two diploid progenitors, B. rapa (AA) and B. oleracea (CC) [51,52]. In this study, ten BnaDGATs were cloned and identified from B. napus and grouped into three subfamilies—BnaDGAT1, BnaDGAT2 and BnaDGAT3—based on their homology. Systematic analyses of chromosome location, gene synteny, physicochemical properties, phylogenetic tree, exon/intron gene structure, conserved domain and motif compositions, TMDs and the distribution of cis-elements in the promoters were performed. The functions of BnaDGATs were detected in yeast H1246 and INVSc1. Moreover, qRT–PCR and prepublished RNA-seq data were analyzed to determine the expression patterns of BnaDGATs. These results provide an extensive evaluation of BnaDGATs and a useful foundation for dissecting the functions of BnaDGATs in biochemical and physiological processes.

3.1. Gene Duplication and Functional Diversification of DGAT Family Members

The phylogenetic tree showed that BnaDGATs were grouped into three well-supported clades: the DGAT1 subfamily, the DGAT2 subfamily and the DGAT3 subfamily (Figure 2A). Identity analysis showed that the three DGAT subfamilies shared very low identity with each other subfamily (Table S8). Gene synteny analysis showed that there was no gene synteny among the three DGAT subfamilies (Figure 1). The analysis of gene structures revealed distinct differences among the three DGAT subfamilies in exon/intron gene structure (Figure 2B and Figure S2B). Conserved domain and motif analyses showed that the three DGAT subfamilies had different conserved domains and motifs (Figure 2C and Figure S3B). Each DGAT1 was predicted to harbor seven to ten putative TMDs, one to four putative TMDs were detected in most DGAT2s and there were no putative TMDs in any of the examined DGAT3s (Figure 3 and Table S7). The expression patterns of the three BnaDGAT gene families were different among diverse tissues (Figure 6). All of these results showed that the DGAT1, DGAT2 and DGAT3 gene subfamilies showed apparent differences and indicated that they are divergent genes and may have a distinct origin, consistent with what is described in soybeans [65] and upland cotton [25]. In addition, the results of this study showed that three BnaDGAT gene subfamilies were frequently duplicated during the speciation and evolution of B. oleracea, B. rapa and B. napus and suggested that B. napus inherited and retained all the DGAT genes of B. rapa and B. oleracea (Figure 1 and Figure S1), consistent with what is described in tetraploid cotton [25].

3.2. Role of BnaDGATs in Oil Biosynthesis

DGAT1 has been functionally confirmed in oil biosynthesis in Arabidopsis, soybean, oilseed rape, and so on [3]. Expression analysis revealed that DGAT1 was abundantly expressed in the developing embryos in several oilseed crops, and its transcript level was correlated with oil accumulation in developing seeds [49]. Analysis of the putative promoters showed that PBnaA.DGAT1.a contained two GCN4 motifs (endosperm expressive elements), three Skn-1 motifs (endosperm expressive elements) and one seed-specific RY-element and that PBnaC.DGAT1.a possessed one Skn-1 motif (Figure 9). In this study, the expression levels of BnaA.DGAT1.a and BnaC.DGAT1.a in seeds and embryos gradually increased during seed and embryo development (Figure 6), which corresponded with the rapid oil accumulation stage in canola seeds, indicating that BnaA.DGAT1.a and BnaC.DGAT1.a were important in TAG biosynthesis in canola seeds. The expression levels of BnaA.DGAT1.b and BnaC.DGAT1.b in seeds first gradually increased and then gradually decreased during seed development, and the expression levels of BnaA.DGAT2.a and BnaC.DGAT2.a in seeds, silique walls and embryos first gradually increased and then gradually decreased during the development of seeds, silique walls and embryos (Figure 6), which implied that BnaA.DGAT1.b, BnaC.DGAT1.b, BnaA.DGAT2.a and BnaC.DGAT2.a may also play an important role in TAG biosynthesis in canola seeds. Moreover, there were high expression levels of BnaA.DGAT1.b and BnaC.DGAT1.b in the anthers and stamens of canola, indicating that BnaDGAT1 might be involved in the reproductive development of oilseed rape.
It was reported that tung tree TAG production via DGAT1 and DGAT2 occurs in a distinct ER subdomain and that DGAT1 and DGAT2 differ in substrate preference [9]. In this study, BnaDGAT1s and BnaDGAT2s were predicted to harbor putative TMDs and to be located in the ER (Table 2 and Figure 3). Then, we overexpressed BnaDGAT1s and BnaDGAT2s in yeast H1246 and INVSc1 and found that only four BnaDGAT1s were able to re-establish TAG synthesis in yeast H1246 (Figure 4) and could promote the accumulation of total fatty acids in H1246 and INVSc1 (Figure 5). In previous studies, 16:0-CoA and 18:1-CoA were the best substrates of BnaA.DGAT1.a, BnaC.DGAT1.a and BnaC.DGAT1.b with [14C]glycerol labelled di-6:0-DAG as an acyl acceptor and with either 16:0-CoA, 18:0-CoA, 18:1-CoA, 18:2-CoA, 18:3-CoA or 22:1-CoA as acyl donors [45], and the preference of four BnaDGAT1s for 16:0-CoA was four–seven times as high as that for 18:1-CoA when the ratio of 18:1-CoA to 16:0-CoA was 1:1, while their preference for 18:1-CoA was two–five times as high as that for 16:0-CoA when the ratio of 18:1-CoA to 16:0-CoA was 3:1 [20]. However, the N-terminus BnDGAT1(1-116) of BnDGAT1 (AF164434, BnaA.DGAT1.b) binds to 22:1cisΔ13-CoA more strongly than 18:1cisΔ9-CoA [66], and purified BnaC.DGAT1.a exhibited substrate preference for 18:3-CoA > 18:1-CoA = 16:0-CoA > 18:2-CoA > 18:0-CoA [67]. Here, BnaDGAT1s were found to prefer C16 (C16:0 and C16:1n7) and C18 (C18:0 and C18:1n9) as substrates instead of C10, C12 and C14 in yeast H1246 and INVSc1 (Figure 5). DGAT2s were previously found to prefer unusual or polyunsaturated fatty acids [8,9,43,44,68,69,70]. Unusual or polyunsaturated fatty acids were not detected in H1246 and INVSc1 in this study, which may be because saturated and monounsaturated fatty acids are the main components of the fatty acids in S. cerevisiae [71].
Some studies have focused on the role of DGAT3 in TAG biosynthesis [10,25,46,47,72]. In this study, almost all DGAT3 homologues were found to share the TRX_Fd_family domain (Figure 2C). To date, AtDGAT3 and CsDGAT3 have been confirmed as metalloproteins involved in TAG biosynthesis in plants [46,72]. DGAT3 homologues were not found in mossy or algal species [73], indicating that they may have arisen during plant evolution. The expression levels of BnaDGAT3s were significantly higher than those of BnaDGAT1s and BnaDGAT2s during canola seed development (Figure 6), consistent with what is described in upland cotton and soybean [65,74]. In this study, overexpressing BnaDGAT3s could not restore TAG synthesis in yeast H1246 and did not promote the accumulation of fatty acids (Figure 4 and Figure 5). Therefore, the function of BnaDGAT3s in synthesizing TAGs needs further testing using oilseed rape or other protein expression systems.

3.3. The Response of BnaDGATs to Abiotic Stresses

Phosphorus starvation can increase the accumulation of oils in most microalgae [75,76,77,78,79,80] as well as in the vegetative tissues of plants, such as Arabidopsis, tomato, tobacco and barnyard grass (Echinochloa crusgalli) [81,82]. In this study, we found that the accumulation of total fatty acids was greatly promoted (Figure 8A), but the expression levels of BnaDGAT1s, BnaDGAT2s and BnaDGAT3s were not enhanced in the roots, stems and leaves of B. napus seedlings under P starvation (Figure 7). In Arabidopsis, the expression of genes involved in TAG synthesis, such as AtDGAT1, AtDGAT2, AtPDAT1, AROD1, AtLPCAT2, AtBCCP2 and PDH-E1a, was not increased under P starvation [81,82]. The above studies showed that the expression levels of DGAT1s were not directly related to the increase in TAG accumulation under P starvation. In previous studies, a self-inhibiting motif in the N-terminal region of BnaDGAT1 bound PA and shifted BnaDGAT1 to a higher activity state [83,84]; PLDZ2 (phospholipase D Z2) degraded phospholipids into PA and was induced by P starvation [85,86]. SnRK1 (Snf1-related kinase 1) inhibited DGAT1 activities by phosphorylating S/T in the SnRK1 targeting motif [23,52,84], and the activity of Arabidopsis SnRK1 was reduced and its catalytic subunit AKIN11 was degraded under P starvation [87]. Therefore, the enhancement of TAG accumulation may be related to the higher activities of DGAT1s regulated by the increase in PA and the decrease in SnRK1 activity under P starvation. In addition to TAG, P starvation can also promote the accumulation of DAG, MGDG, DGDG and SQDG by inducing the expression of NPC4, NPC5, PLDZ2, PAH1, PAH2, MGD2, MGD3, DGD1, DGD2, SQD1 and SQD2 in Arabidopsis seedlings [81,82]. This result suggested that the increase in total fatty acids is a consequence of the accumulation of TAG, DAG, MGDG, DGDG and SQDG in B. napus seedlings under P starvation, which may be caused by gene expression changes similar to those in Arabidopsis.
Many studies have shown that most microalgae can accumulate high levels of oil under N starvation [75,88,89,90,91,92,93,94]. For plants, N and C are closely coordinated to affect chloroplast lipid metabolism and TAG content [36,95,96,97]. This study found that low N (5 mM) promoted the accumulation of total fatty acids in roots at 1 h to 6 h and 24 h and in stems at 24 h and 48 h, but inhibited the accumulation of total fatty acids in stems at 6 h and in leaves at 48 h (Figure 8B). In previous reports, low N (0.1 mM and 0.65 mM) promoted TAG accumulation, especially 0.1 mM N with 50 mM sucrose, by inducing the expression of AtDGAT1, AtDGAT2, AtPDAT1 and AtOLEOSIN1 in Arabidopsis seedlings [36,96]. In this study, low N (5 mM) did not induce the expression of four BnaDGAT1s, BnaA.DGAT2.a, BnaC.DGAT2.a and two BnaDGAT3s in roots, stems and leaves; BnaA.DGAT2.b in leaves and stems and BnaC.DGAT2.b in stems but promoted the expression of BnaA.DGAT2.b in roots and BnaC.DGAT2.b in leaves and roots (Figure 7). In previous studies, Arabidopsis seedlings were cultured under low N (0.1 mM) using Murashige and Skoog (MS) solid medium, while B. napus seedlings were cultured under low N (5 mM) in this study using Hoagland solution without carbon sources. In normal 1/2 Hoagland solution, the nitrogen content was 7.5 mM. Therefore, it may not be sufficient to induce the expression of BnaDGATs in B. napus under 5 mM N (50 times that under 0.1 mM).
In this study, the accumulation of total fatty acids in roots and leaves at 3 h and 6 h and in stems at 1 h to 6 h was reduced but was promoted in stems at 12 h and 24 h using 15% PEG for stress treatment (Figure 8C). Previous studies showed that drought stress reduced phospholipids (PC, PE, PG), glycolipids (MGDG and DGDG) and total fatty acids in B. napus and increased neutral lipids (mainly TAG) [98,99,100,101], which is consistent with maize [102], soybean [103] and cotton [104]. Therefore, the changes in total fatty acids in the roots, stems and leaves of B. napus seedlings under drought stress were the combined result of a decrease in phospholipids and an increase in neutral lipids. In this study, drought stress for 24 h increased the expression levels of four BnaDGAT1s in leaves, BnaA.DGAT2.a and BnaC.DGAT2.a in stems and leaves; BnaA.DGAT2.b and BnaC.DGAT2.b in roots; BnaA.DGAT3 in stems and roots and BnaC.DGAT3 in roots, but decreased the expression levels of BnaA.DGAT2.b in leaves and stems and BnaC.DGAT3 in leaves (Figure 7). A previous study showed that the expression of AtDGAT1 was promoted by ABI4 and ABI5 under drought stress [38]. Therefore, it is necessary to further test whether ABI4 and ABI5 participate in the regulation of BnaDGAT expression in B. napus under drought stress. Furthermore, drought-inducible elements (MBS) were found in the potential promoters of BnaA.DGAT2.a, BnaA.DGAT2.b, BnaC.DGAT2.b, BnaA.DGAT3 and BnaC.DGAT3 (Figure 9 and Table S10). In Arabidopsis, MBS is generally present in the promoter of drought-inducible genes and bound by AtMYB2 in response to drought stress [105,106,107]. The expression of AtMYB2 was induced by drought, salt or ABA treatment in Arabidopsis seedlings [105]. Therefore, the expression levels of BnaA.DGAT2.a, BnaA.DGAT2.b, BnaC.DGAT2.b, BnaA.DGAT3 and BnaC.DGAT3 may be regulated by BnaMYB2 under drought stress, which needs to be further tested.
For most microalgae, the appropriate salinity (20–40 g/L, i.e., 340–680 mM) can increase the accumulation of lipids, while lipid accumulation will be negatively affected when the salinity is excessive [75]. In Arabidopsis, TAG accumulation and the expression of DGAT1 were promoted by enhancing the expression of ABI4 and ABI5 under salt stress (100 mM NaCl) [38]. In this study, it was found that the accumulation of total fatty acids was reduced in roots at 1 h to 24 h and in stems at 1 h to 6 h and 48 h, while it was elevated in leaves at 6 h and 48 h under salt stress (150 mM NaCl; Figure 8D). Moreover, the expression levels of four BnaDGAT1s in stems; BnaA.DGAT2.a and BnaC.DGAT2.a in roots, stems and leaves and BnaA.DGAT2.b in roots were increased, but the expression levels of four BnaDGAT1s in roots; BnaA.DGAT2.b in leaves and stems; BnaC.DGAT2.b in stems; BnaA.DGAT3 in stems and leaves and BnaC.DGAT3 in roots, stems and leaves at 12–48 h of stress decreased (Figure 7). Therefore, it is necessary to further test and explore the relationship between the accumulation of fatty acids and the expression of BnaDGATs in B. napus under salt stress.

4. Materials and Methods

4.1. Identification of DGAT Family Members in B. napus and in Other Plants

To identify candidate DGAT family members in B. napus, the CDS and peptide sequences of the three AtDGATs from the A. thaliana genome database (http://www.arabidopsis.org/ (accessed on 25 March 2020)) with corresponding Gene IDs (At2G19450, At3G51520 and At1G48300) were retrieved and used as queries to perform BLAST searches in two B. napus Genome Databases (BnPIR, http://cbi.hzau.edu.cn/bnapus (accessed on 2 March 2021), and GENOSCOPE, https://www.genoscope.cns.fr/brassicanapus/ (accessed on 25 March 2020)) with the default parameters. The CDSs and genomic DNAs of BnaDGATs were cloned from B. napus ZS11 using primers (Table S1), designed according to the nucleotide sequences of BnaDGATs retrieved from the two B. napus genome databases. The DGATs of B. oleracea, B. rapa, B. juncea and B. nigra were downloaded from the Brassica Database (BRAD, http://brassicadb.cn/#/ (accessed on 11 October 2021)). B. carinata DGATs were derived from the Brassica Genomics Database (BGD, http://brassicadb.bio2db.com/ (accessed on 11 October 2021)). DGAT family members in A. hypogaea, G. max, R. communis, O. sativa, Z. mays, S. italica, M. truncatula, B. distachyon and J. curcas were blasted and selected from their corresponding genome databases (Table S2). Then, the theoretical molecular weight (MW) and isoelectric point (pI) were predicted using the ProtParam tool (https://web.expasy.org/protparam/ (accessed on 22 October 2021)) on the basis of their amino acid sequences. The subcellular location pattern of each BnaDGAT was evaluated via ProtComp v.9.0 in softberry (http://linux1.softberry.com/ (accessed on 22 October 2021)). Multiple sequence alignments of DGATs of B. napus, B. oleracea and B. rapa were performed based on full-length proteins and full-length CDSs by ClustalW, and their identities were evaluated by Sequence Distances in MegAlign software.

4.2. Chromosomal Location and Gene Synteny Analysis

The detailed chromosome locations of DGATs in B. napus, B. rapa and B. oleracea were acquired from the GFF genome files downloaded from the B. napus genomic database (BnPIR, http://cbi.hzau.edu.cn/bnapus (accessed on 11 October 2021)) and Brassica Database (BRAD, http://brassicadb.cn/#/ (accessed on 11 October 2021)), respectively, and the predicted locations on the chromosomes were mapped by using TBtools software [62], with red-colored gene names indicated as relative positions. Gene synteny analyses of DGATs in A. thaliana, B. oleracea, B. rapa, B. napus and B. nigra were carried out by using TBtools software [62]. In addition, we calculated the synonymous (Ks), nonsynonymous mutations (Ka) and Ka/Ks ratio at each codon by Tbtools [62]. In addition, the DGAT gene pair duplication time was presumed using the formula T = Ks/2R, with R (1.5 × 10⁻⁸) representing neutral substitution per site per year [108].

4.3. Phylogenetic, Gene Structure, Conserved Domain and Motif Analyses

The MUSCLE program in MEGA11 software was used to perform DGAT alignments with amino acid sequences by default parameters, and then the rectangular phylogenetic tree was constructed using the neighbor-joining (NJ) method with 2000 bootstrap replications. The rectangular phylogenetic tree Newick format was saved for constructing the gene structure, conserved domain and motifs. The genomic and coding sequences of DGAT genes were obtained from their corresponding genome databases (Table S2) and rendered in the Gene Structure Display Server (GSDS2.0; http://gsds.gao-lab.org/ (accessed on 20 October 2021)) [56] to construct their gene structures. Amino acid sequences of DGATs were submitted to the MEME program (Version 5.4.1, https://meme-suite.org/meme/tools/meme (accessed on 21 October 2021)) with the maximum motif search set to 20 and other parameters set to default to identify the conserved protein motifs [109]. A functional search of the conserved domains was performed using the Conserved Domain Database (CDD) with Batch CD-Search in NCBI. The conserved motifs and domains were visualized by using TBtools software [62]. The putative transmembrane domains of DGATs were predicted using TMHMM Server v. 2.0 (https://services.healthtech.dtu.dk/service.php?TMHMM-2.0 (accessed on 10 April 2021)). Multiple sequence alignments of DGATs were performed based on their full-length proteins by ClustalW in MegAlign software and then crested with CLC Sequence Viewer 6.8 software.

4.4. Yeast Expression Vector Construction and Transformation

First, the CDSs of ten BnaDGATs, one AtDGAT1 (as a positive control) and one eGFP (as a negative control) were cloned into the entry vector pGWC using the corresponding primers (Table S1) and then recombined into the Gateway vector pYES-DEST52 (Invitrogen). The constructs were introduced into yeast H1246 (MATα are1-Δ::HIS3, are2-Δ::LEU2, dga1-Δ::KanMX4, lro1-Δ::TRP1 ADE2) [59] and INVSc1 (MATα his3Δ1 leu2 trp1-289 ura3-52/MATα his3Δ1 leu2 trp1-289 ura3-52), according to the Yeast Protocols Handbook from Clontech Laboratories Inc. (Mountain View, CA, USA) Transformants were selected on synthetic complete medium lacking uracil (SC-ura).

4.5. Nile Red Staining and Microscopy

Lipid droplets in the transformants of yeast H1246 were stained with Nile Red and then visualized on a Leica TCS SP5 (Leica Microsystems, Wetzlar, Germany) laser scanning confocal microscope, as previously described [92].

4.6. Analysis of Fatty Acids in Yeast Transformants and B. napus Seedlings by GC–MS

The transformants of yeast H1246 and INVSc1 first cultured with liquid SC-ura medium containing 2% (w/v) glucose at 30 °C overnight were then diluted to OD600 = 0.1 with liquid SC-ura medium containing 2% (w/v) galactose and 1% (w/v) raffinose and shaken at 30 °C and 250 rpm for 72 h. The yeast cells were harvested by centrifugation and dried at 55 °C, and then the pellets were ground to a fine powder. For B. napus seedlings, samples of roots, stems and leaves were also ground to a fine powder under liquid nitrogen and then freeze-dried. For fatty acid extraction, 50 mg of yeast powder or 15 mg of freeze-dried powder of every B. napus sample was incubated in 3 mL of 7.5% (w/v) KOH in methanol for saponification at 70 °C for 5 h. Then, the pH was adjusted to 2.0 with HCl, and the fatty acid was subjected to methyl-esterification with 2 mL of 14% (w/v) boron trifluoride in methanol at 70 °C for 2 h. A phase separation was produced by adding 2 mL of 0.9% (w/v) NaCl and 4 mL of hexane. The upper phase was dried under a nitrogen gas flow and resuspended in acetic ether. Analysis of fatty acid methyl esters (FAMEs) was performed by GC–MS (GC-QQQ, 7890A-7001B, Agilent Technologies, Santa Clara, CA, USA) equipped with a capillary column (HP-FFAP, 30 mm × 0.25 mm ID, 0.25 μm; Agilent Technologies). Hydrogen was used as the carrier gas at a flow rate of 1.0 mL/min. The injection port, transmission line and ion source temperatures were held at 220 °C, 230 °C and 230 °C, respectively. The temperature of the column oven was programmed from 60 to 180 °C at 10 °C/min, then from 180 to 210 °C at 3 °C/min, and finally from 210 to 220 °C at 5 °C/min and held for 15 min. The FA content was quantified using heptadecanoic acid (C17:0, Sigma, St. Louis, MO, USA) as an internal standard added to samples prior to extraction. All experiments were performed in biological triplicates.

4.7. B. napus Seedling Treatments and Sampling

The seedlings of B. napus Westar were hydroponically cultured in 1/2 Hoagland solution [110] for six weeks with a 16 h day/8 h night cycle at 23 °C and then were used for the stresses of P starvation (KH2PO4 replaced by an equimolar amount of KCl), low N (KNO3 replaced with an equimolar amount of KCl), drought (15% w/v PEG6000) and salinity (150 mM NaCl). Seedlings cultured in normal 1/2 Hoagland solution were used as the control group (mock). Roots, stems and leaves of seedlings were sampled at seven time points: 0 h, 1 h, 3 h, 6 h, 12 h, 24 h and 48 h. The collected samples were immediately dipped in liquid nitrogen and then stored at −80 °C for the relative expression levels of BnaDGATs and fatty acid analysis. All experiments were performed in biological triplicates.

4.8. Genomic DNA Extraction, Total RNA Isolation, Primary cDNA Synthesis and qRT–PCR

Genomic DNA of B. napus ZS11 was extracted using a method modified from a CTAB-based protocol [111] for cloning genomic DNA of BnaDGATs. Total RNA of B. napus was extracted using an RNAprep Pure Plant Kit (DP432, TIANGEN BIOTECH Co., Ltd., Beijing, China), and B. napus complementary DNA was synthesized using TransScript One-Step gDNA Removal and cDNA Synthesis SuperMix (AT311-03, TransGen Biotech, Beijing, China), according to the manufacturer’s instructions. For qRT–PCR, 2 μg of total RNA was first used for the synthesis of first-strand cDNA using oligo(dT)18 as a primer, and then qRT–PCR was performed on a CFX ConnectTM Real-Time PCR system (Bio–Rad, Hercules, CA, USA) using EvaGreen 2× qPCR MasterMix (MasterMix-S, Abm, Vancouver, BC, Canada), according to the manufacturer’s instructions. The specificity of primers (Table S3) for qRT–PCR was confirmed by separating the products on agarose gels and clone sequencing. BnaACT7 was used as an internal reference gene, and the relative expression levels of each BnaDGAT to BnaACT7 in leaves, stems and roots at 0 h were set to 1. All qRT-PCRs were performed in biological triplicates.

4.9. Expression Pattern Analysis Based on RNA-Seq Datasets

The transcript level was calculated based on publicly released data. RNA-Seq datasets of different tissues at diverse stages of development were obtained from BnTIR (http://yanglab.hzau.edu.cn/BnTIR (accessed on 10 November 2021)) [60] and BrassicaEDB (https://brassica.biodb.org/ (accessed on 10 November 2021)) [61]. The extracted data from BnTIR and BrassicaEDB were normalized by log2(TPM) and log2(FPKM), respectively, and the heatmaps were generated by TBtools [62].

4.10. Analyses of Transcription Factors and miRNAs Targeting BnaDGATs and Cis-Acting Elements in BnaDGAT Promoters

Transcription factors regulating BnaDGATs were predicted using PlantRegMap [112], with B. napus as the target. The full-length cDNA sequences of BnaDGAT homologues were submitted to the psRNATarget website (https://www.zhaolab.org/psRNATarget/ (accessed on 25 November 2021)) [113] for a potential miRNA search against the B. napus miRNA database. For cis-element analysis, the regions 776–1500 bp upstream of the start codon of BnaDGATs and AtDGATs were subjected to the plantCARE database (http://bioinformatics.psb.ugent.be/webtools/plantcare/html/ (accessed on 20 September 2021)) [114] for cis-element searching.

5. Conclusions

In summary, ten BnaDGATs were identified and grouped into three different DGAT subfamilies. These BnaDGATs are derived from three different ancestors and evolved separately during plant evolution, as proposed by analyzing physicochemical properties, chromosome location, gene synteny, phylogenetic tree, exon/intron gene structure, conserved domain and motif compositions and TMDs. BnaDGAT1s possess the ability to introduce the fatty acids C10, C12, C14, C16 and C18 into TAG in S. cerevisiae and a higher preference for the fatty acids C16:0, C16:1n7, C18:0 and C18:1n9 than C10:0, C12:0, C14:0, C14:1 and C18:1n7. BnaDGAT1s are the main diacylglycerol acyltransferases that synthesize TAGs in B. napus. The role of BnaDGAT2s and BnaDGAT3s in TAG synthesis in B. napus needs to be further clarified. Some B3, bZIP, MYB-like transcription factors and other transcription factors involved in the response to light signals may regulate the expression of BnaDGATs. P starvation increased fatty acid accumulation in B. napus seedlings. The relationships between the expression of BnaDGATs and the accumulation of lipids in B. napus under low N, drought and salt conditions remain to be further confirmed. Overall, the findings of this study contribute to the understanding of BnaDGAT genes in fatty acid biosynthesis and abiotic stress responses in oilseed rape.

Supplementary Materials

The following supporting information can be downloaded at: https://www.mdpi.com/article/10.3390/plants11091156/s1, Figure S1: Schematic representation of DGAT gene distribution on Brassica napus, Brassica rapa, and Brassica oleracea chromosomes; Figure S2: Gene structures of DGAT family members in plants; Figure S3: The conserved motifs of DGAT family members in plants; Table S1: Primer sequences for PCR and RT–PCR analysis in this study; Table S2: The corresponding genome databases of B. napus and other plant species in this paper; Table S3: The sequences of DGAT proteins derived from the corresponding genome databases of B. napus and other plant species in this study; Table S4: The CDSs of DGAT1 genes downloaded from the corresponding genome databases of B. napus and other plant species in this study; Table S5: The genomic DNA sequences of DGAT1 genes downloaded from the corresponding genome databases of B. napus and other plant species in this study; Table S6: The sequences of the CDSs, genomic DNAs, proteins and putative promoters of BnaDGAT gene members cloned from B. napus ZS11 in this study; Table S7: Identification of DGAT1 subfamily genes in plants; Table S8: Identity matrix of DGATs in B. napus and three diploid Brassica species based on full-length proteins and CDSs; Table S9: The sequences of the putative promoters of AtDGAT1, AtDGAT2 and AtDGAT3; Table S10: The cis-acting regulatory elements in the putative promoters of BnaDGATs and AtDGATs were analyzed by PlantCARE; Table S11: Transcription factors regulating BnaDGATs were predicted using PlantRegMap; Table S12: miRNAs target B. napus, B. rapa and A. thaliana DGAT genes. References [115,116,117,118,119,120,121,122,123,124,125,126,127,128,129,130,131,132,133] are cited in the supplementary materials.

Author Contributions

Conceptualization, X.Y., X.G., L.H., C.F., R.R.-C.W. and Z.H.; methodology, X.Y., L.H., C.F. and Z.H.; software, X.Y. and C.F.; validation, X.Y., L.H. and C.F.; formal analysis, X.Y. and C.F.; investigation, X.Y., X.G. and L.H.; resources, J.W., C.F. and Z.H.; data curation, X.Y., and C.F.; writing—original draft preparation, X.Y. and X.G.; writing—review and editing, S.L., Y.C., C.F., J.W. and Z.H.; visualization, X.Y., X.G. and C.F.; supervision, R.R.-C.W., C.F. and Z.H.; project administration, X.Y. and C.F.; funding acquisition, Z.H. All authors have read and agreed to the published version of the manuscript.

Funding

This research was funded by the Key Research and Development Project from the Department of Science and Technology of China (2021YFF1000103-4), the Strategic Priority Research Program of the Chinese Academy of Sciences (Grant No. XDA24030502) and the Natural Science Foundation of China (32072095 and 31271755).

Institutional Review Board Statement

Not applicable.

Informed Consent Statement

Not applicable.

Data Availability Statement

Not applicable.

Acknowledgments

The authors thank Nali ZHU in the Laboratory of Proteomics, Institute of Biophysics, Chinese Academy of Sciences, for kindly helping us with GC–MS.

Conflicts of Interest

The authors declare no conflict of interest.

References

  1. Li, Y.H.; Beisson, F.; Pollard, M.; Ohlrogge, J. Oil content of Arabidopsis seeds: The influence of seed anatomy, light and plant-to-plant variation. Phytochemistry 2006, 67, 904–915. [Google Scholar] [CrossRef] [PubMed]
  2. Graham, I.A. Seed storage oil mobilization. Annu. Rev. Plant Biol. 2008, 59, 115–142. [Google Scholar] [CrossRef]
  3. Xu, Y.; Caldo, K.M.P.; Pal-Nath, D.; Ozga, J.; Lemieux, M.J.; Weselake, R.J.; Chen, G.Q. Properties and biotechnological applications of acyl-CoA:diacylglycerol acyltransferase and phospholipid:diacylglycerol acyltransferase from terrestrial plants and microalgae. Lipids 2018, 53, 663–688. [Google Scholar] [CrossRef]
  4. Liu, Q.; Siloto, R.M.P.; Lehner, R.; Stone, S.J.; Weselake, R.J. Acyl-CoA:diacylglycerol acyltransferase: Molecular biology, biochemistry and biotechnology. Prog. Lipid Res. 2012, 51, 350–377. [Google Scholar] [CrossRef]
  5. Kennedy, E.P.; Weiss, S.B. Function of cytidine coenzymes in the biosynthesis of phospholipides. J. Biol. Chem. 1956, 222, 193–214. [Google Scholar] [CrossRef]
  6. Marchive, C.; Nikovics, K.; To, A.; Lepiniec, L.; Baud, S. Transcriptional regulation of fatty acid production in higher plants: Molecular bases and biotechnological outcomes. Eur. J. Lipid Sci. Technol. 2014, 116, 1332–1343. [Google Scholar] [CrossRef]
  7. Hobbs, D.H.; Lu, C.F.; Hills, M.J. Cloning of a cDNA encoding diacylglycerol acyltransferase from Arabidopsis thaliana and its functional expression. FEBS Lett. 1999, 452, 145–149. [Google Scholar] [CrossRef] [Green Version]
  8. Kroon, J.T.M.; Wei, W.; Simon, W.J.; Slabas, A.R. Identification and functional expression of a type 2 acyl-CoA:diacylglycerol acyltransferase (DGAT2) in developing castor bean seeds which has high homology to the major triglyceride biosynthetic enzyme of fungi and animals. Phytochemistry 2006, 67, 2541–2549. [Google Scholar] [CrossRef] [PubMed]
  9. Shockey, J.M.; Gidda, S.K.; Chapital, D.C.; Kuan, J.-C.; Dhanoa, P.K.; Bland, J.M.; Rothstein, S.J.; Mullen, R.T.; Dyer, J.M. Tung tree DGAT1 and DGAT2 have nonredundant functions in triacylglycerol biosynthesis and are localized to different subdomains of the endoplasmic reticulum. Plant Cell 2006, 18, 2294–2313. [Google Scholar] [CrossRef] [Green Version]
  10. Saha, S.; Enugutti, B.; Rajakumari, S.; Rajasekharan, R. Cytosolic triacylglycerol biosynthetic pathway in oilseeds. Molecular cloning and expression of peanut cytosolic diacylglycerol acyltransferase. Plant Physiol. 2006, 141, 1533–1543. [Google Scholar] [CrossRef] [Green Version]
  11. Banilas, G.; Karampelias, M.; Makariti, I.; Kourti, A.; Hatzopoulos, P. The olive DGAT2 gene is developmentally regulated and shares overlapping but distinct expression patterns with DGAT1. J. Exp. Bot. 2011, 62, 521–532. [Google Scholar] [CrossRef] [PubMed] [Green Version]
  12. Giannoulia, K.; Haralampidis, K.; Poghosyan, Z.; Murphy, D.J.; Hatzopoulos, P. Differential expression of diacylglycerol acyltransferase (DGAT) genes in olive tissues. Biochem. Soc. Trans. 2000, 28, 695–697. [Google Scholar] [CrossRef] [PubMed]
  13. Bouvier-Nave, P.; Benveniste, P.; Oelkers, P.; Sturley, S.L.; Schaller, H. Expression in yeast and tobacco of plant cDNAs encoding acyl CoA:diacylglycerol acyltransferase. Eur. J. Biochem. 2000, 267, 85–96. [Google Scholar] [CrossRef] [PubMed]
  14. Chen, B.B.; Wang, J.J.; Zhang, G.Y.; Liu, J.Q.; Manan, S.; Hu, H.H.; Zhao, J. Two types of soybean diacylglycerol acyltransferases are differentially involved in triacylglycerol biosynthesis and response to environmental stresses and hormones. Sci. Rep. 2016, 6, 28541. [Google Scholar] [CrossRef] [PubMed] [Green Version]
  15. Li, R.Z.; Hatanaka, T.; Yu, K.S.; Wu, Y.M.; Fukushige, H.; Hildebrand, D. Soybean oil biosynthesis: Role of diacylglycerol acyltransferases. Funct. Integr. Genom. 2013, 13, 99–113. [Google Scholar] [CrossRef] [PubMed]
  16. Wang, H.W.; Zhang, J.S.; Gai, J.Y.; Chen, S.Y. Cloning and comparative analysis of the gene encoding diacylglycerol acyltransferase from wild type and cultivated soybean. Theor. Appl. Genet. 2006, 112, 1086–1097. [Google Scholar] [CrossRef]
  17. Chi, X.Y.; Hu, R.B.; Zhang, X.W.; Chen, M.N.; Chen, N.; Pan, L.J.; Wang, T.; Wang, M.A.; Yang, Z.; Wang, Q.F.; et al. Cloning and functional analysis of three diacylglycerol acyltransferase genes from peanut (Arachis hypogaea L.). PLoS ONE 2014, 9, e105834. [Google Scholar] [CrossRef]
  18. Peng, Z.Y.; Li, L.; Yang, L.Q.; Zhang, B.; Chen, G.; Bi, Y.P. Overexpression of peanut diacylglycerol acyltransferase 2 in Escherichia coli. PLoS ONE 2013, 8, e61363. [Google Scholar] [CrossRef]
  19. Nykiforuk, C.L.; Furukawa-Stoffer, T.L.; Huff, P.W.; Sarna, M.; Laroche, A.; Moloney, M.M.; Weselake, R.J. Characterization of cDNAs encoding diacylglycerol acyltransferase from cultures of Brassica napus and sucrose-mediated induction of enzyme biosynthesis. Biochim. Biophys. Acta Mol. Cell Biol. Lipids 2002, 1580, 95–109. [Google Scholar] [CrossRef]
  20. Aznar-Moreno, J.; Denolf, P.; Van Audenhove, K.; De Bodt, S.; Engelen, S.; Fahy, D.; Wallis, J.G.; Browse, J. Type 1 diacylglycerol acyltransferases of Brassica napus preferentially incorporate oleic acid into triacylglycerol. J. Exp. Bot. 2015, 66, 6497–6506. [Google Scholar] [CrossRef] [Green Version]
  21. Greer, M.S.; Truksa, M.; Deng, W.; Lung, S.C.; Chen, G.Q.; Weselake, R.J. Engineering increased triacylglycerol accumulation in Saccharomyces cerevisiae using a modified type 1 plant diacylglycerol acyltransferase. Appl. Microbiol. Biotechnol. 2015, 99, 2243–2253. [Google Scholar] [CrossRef] [PubMed]
  22. Sun, L.; Ouyang, C.; Kou, S.L.; Wang, S.H.; Yao, Y.Y.; Peng, T.; Xu, Y.; Tang, L.; Chen, F. Cloning and characterization of a cDNA encoding type 1 diacylglycerol acyltransferase from sunflower (Helianthus annuus L.). Z. Naturforsch. C J. Biosci. 2011, 66, 63–72. [Google Scholar] [CrossRef] [PubMed]
  23. Xu, J.Y.; Francis, T.; Mietkiewska, E.; Giblin, E.M.; Barton, D.L.; Zhang, Y.; Zhang, M.; Taylor, D.C. Cloning and characterization of an acyl-CoA-dependent diacylglycerol acyltransferase 1 (DGAT1) gene from Tropaeolum majus, and a study of the functional motifs of the DGAT protein using site-directed mutagenesis to modify enzyme activity and oil content. Plant Biotechnol. J. 2008, 6, 799–818. [Google Scholar] [CrossRef]
  24. Zheng, P.; Allen, W.B.; Roesler, K.; Williams, M.E.; Zhang, S.; Li, J.; Glassman, K.; Ranch, J.; Nubel, D.; Solawetz, W.; et al. A phenylalanine in DGAT is a key determinant of oil content and composition in maize. Nat. Genet. 2008, 40, 367–372. [Google Scholar] [CrossRef]
  25. Zhao, Y.P.; Wu, N.; Li, W.J.; Shen, J.L.; Chen, C.; Li, F.G.; Hou, Y.X. Evolution and characterization of acetyl coenzyme A: Diacylglycerol acyltransferase genes in cotton identify the roles of GhDGAT3D in oil biosynthesis and fatty acid composition. Genes 2021, 12, 1045. [Google Scholar] [CrossRef]
  26. Zhang, F.Y.; Yang, M.F.; Xu, Y.N. Silencing of DGAT1 in tobacco causes a reduction in seed oil content. Plant Sci. 2005, 169, 689–694. [Google Scholar] [CrossRef]
  27. Jako, C.; Kumar, A.; Wei, Y.; Zou, J.; Barton, D.L.; Giblin, E.M.; Covello, P.S.; Taylor, D.C. Seed-specific over-expression of an Arabidopsis cDNA encoding a diacylglycerol acyltransferase enhances seed oil content and seed weight. Plant Physiol. 2001, 126, 861–874. [Google Scholar] [CrossRef] [PubMed] [Green Version]
  28. Taylor, D.C.; Zhang, Y.; Kumar, A.; Francis, T.; Giblin, E.M.; Barton, D.L.; Ferrie, J.R.; Laroche, A.; Shah, S.; Zhu, W.; et al. Molecular modification of triacylglycerol accumulation by over-expression of DGAT1 to produce canola with increased seed oil content under field conditions. Botany 2009, 87, 533–543. [Google Scholar] [CrossRef] [Green Version]
  29. Maravi, D.K.; Kumar, S.; Sharma, P.K.; Kobayashi, Y.; Goud, V.V.; Sakurai, N.; Koyama, H.; Sahoo, L. Ectopic expression of AtDGAT1, encoding diacylglycerol O-acyltransferase exclusively committed to tag biosynthesis, enhances oil accumulation in seeds and leaves of jatropha. Biotechnol. Biofuels 2016, 9, 226. [Google Scholar] [CrossRef] [PubMed] [Green Version]
  30. Lock, Y.Y.; Snyder, C.L.; Zhu, W.M.; Siloto, R.M.P.; Weselake, R.J.; Shah, S. Antisense suppression of type 1 diacylglycerol acyltransferase adversely affects plant development in Brassica napus. Physiol. Plant. 2009, 137, 61–71. [Google Scholar] [CrossRef] [PubMed]
  31. Routaboul, J.M.; Benning, C.; Bechtold, N.; Caboche, M.; Lepiniec, L. The TAG1 locus of Arabidopsis encodes for a diacylglycerol acyltransferase. Plant Physiol. Biochem. 1999, 37, 831–840. [Google Scholar] [CrossRef]
  32. Kaup, M.T.; Froese, C.D.; Thompson, J.E. A role for diacylglycerol acyltransferase during leaf senescence. Plant Physiol. 2002, 129, 1616–1626. [Google Scholar] [CrossRef] [PubMed] [Green Version]
  33. Zhang, M.; Fan, J.; Taylor, D.C.; Ohlrogge, J.B. DGAT1 and PDAT1 acyltransferases have overlapping functions in Arabidopsis triacylglycerol biosynthesis and are essential for normal pollen and seed development. Plant Cell 2009, 21, 3885–3901. [Google Scholar] [CrossRef] [PubMed] [Green Version]
  34. Lu, C.; Hills, M.J. Arabidopsis mutants deficient in diacylglycerol acyltransferase display increased sensitivity to abscisic acid, sugars, and osmotic stress during germination and seedling development. Plant Physiol. 2002, 129, 1352–1358. [Google Scholar] [CrossRef] [PubMed] [Green Version]
  35. Weselake, R.J.; Shah, S.; Tang, M.; Quant, P.A.; Snyder, C.L.; Furukawastoffer, T.L.; Zhu, W.; Taylor, D.C.; Zou, J.; Kumar, A. Metabolic control analysis is helpful for informed genetic manipulation of oilseed rape (Brassica napus) to increase seed oil content. J. Exp. Bot. 2008, 59, 3543–3549. [Google Scholar] [CrossRef] [PubMed] [Green Version]
  36. Yang, Y.; Yu, X.C.; Song, L.F.; An, C.C. ABI4 activates DGAT1 expression in Arabidopsis seedlings during nitrogen deficiency. Plant Physiol. 2011, 156, 873–883. [Google Scholar] [CrossRef] [Green Version]
  37. Kelly, A.A.; van Erp, H.; Quettier, A.L.; Shaw, E.; Menard, G.; Kurup, S.; Eastmond, P.J. The SUGAR-DEPENDENT1 lipase limits triacylglycerol accumulation in vegetative tissues of arabidopsis. Plant Physiol. 2013, 162, 1282–1289. [Google Scholar] [CrossRef] [Green Version]
  38. Kong, Y.; Chen, S.; Yang, Y.; An, C. ABA-insensitive (ABI) 4 and ABI5 synergistically regulate DGAT1 expression in Arabidopsis seedlings under Stress. FEBS Lett. 2013, 587, 3076–3082. [Google Scholar] [CrossRef] [Green Version]
  39. Tjellstrom, H.; Strawsine, M.; Ohlrogge, J.B. Tracking synthesis and turnover of triacylglycerol in leaves. J. Exp. Bot. 2015, 66, 1453–1461. [Google Scholar] [CrossRef] [Green Version]
  40. Fan, J.L.; Yu, L.H.; Xu, C.C. A central role for triacylglycerol in membrane lipid breakdown, fatty acid beta-oxidation, and plant survival under extended darkness. Plant Physiol. 2017, 174, 1517–1530. [Google Scholar] [CrossRef] [PubMed] [Green Version]
  41. Arisz, S.A.; Heo, J.Y.; Koevoets, I.T.; Zhao, T.; van Egmond, P.; Meyer, A.J.; Zeng, W.Q.; Niu, X.M.; Wang, B.S.; Mitchell-Olds, T.; et al. Diacylglycerol acyltransferase1 contributes to freezing tolerance. Plant Physiol. 2018, 177, 1410–1424. [Google Scholar] [CrossRef] [PubMed] [Green Version]
  42. Tan, W.J.; Yang, Y.C.; Zhou, Y.; Huang, L.P.; Xu, L.; Chen, Q.F.; Yu, L.J.; Xiao, S. Diacylglycerol acyltransferase and diacylglycerol kinase modulate triacylglycerol and phosphatidic acid production in the plant response to freezing stress. Plant Physiol. 2018, 177, 1303–1318. [Google Scholar] [CrossRef] [PubMed] [Green Version]
  43. Burgal, J.; Shockey, J.; Lu, C.F.; Dyer, J.; Larson, T.; Graham, I.; Browse, J. Metabolic engineering of hydroxy fatty acid production in plants: RcDGAT2 drives dramatic increases in ricinoleate levels in seed oil. Plant Biotechnol. J. 2008, 6, 819–831. [Google Scholar] [CrossRef] [PubMed] [Green Version]
  44. Li, R.Z.; Yu, K.S.; Hatanaka, T.; Hildebrand, D.F. Vernonia DGATs increase accumulation of epoxy fatty acids in oil. Plant Biotechnol. J. 2010, 8, 184–195. [Google Scholar] [CrossRef] [PubMed]
  45. Demski, K.; Jeppson, S.; Lager, I.; Misztak, A.; Jasieniecka-Gazarkiewicz, K.; Waleron, M.; Stymne, S.; Banas, A. Isoforms of acyl-CoA:diacylglycerol acyltransferase2 differ Substantially in their specificities towards erucic acid. Plant Physiol. 2019, 181, 1468–1479. [Google Scholar] [CrossRef] [PubMed]
  46. Ayme, L.; Arragain, S.; Canonge, M.; Baud, S.; Touati, N.; Bimai, O.; Jagic, F.; Louis-Mondesir, C.; Briozzo, P.; Fontecave, M.; et al. Arabidopsis thaliana DGAT3 is a [2Fe-2S] protein involved in TAG biosynthesis. Sci. Rep. 2018, 8, 17254. [Google Scholar] [CrossRef] [PubMed] [Green Version]
  47. Hernandez, M.L.; Whitehead, L.; He, Z.S.; Gazda, V.; Gilday, A.; Kozhevnikova, E.; Vaistij, F.E.; Larson, T.R.; Graham, I.A. A cytosolic acyltransferase contributes to triacylglycerol synthesis in sucrose-rescued Arabidopsis seed oil catabolism mutants. Plant Physiol. 2012, 160, 215–225. [Google Scholar] [CrossRef] [PubMed] [Green Version]
  48. He, X.H.; Turner, C.; Chen, G.Q.; Lin, J.T.; McKeon, T.A. Cloning and characterization of a cDNA encoding diacylglycerol acyltransferase from castor bean. Lipids 2004, 39, 311–318. [Google Scholar] [CrossRef]
  49. Lu, C.F.L.; de Noyer, S.B.; Hobbs, D.H.; Kang, J.L.; Wen, Y.C.; Krachtus, D.; Hills, M.J. Expression pattern of diacylglycerol acyltransferase-1, an enzyme involved in triacylglycerol biosynthesis, in Arabidopsis thaliana. Plant Mol. Biol. 2003, 52, 31–41. [Google Scholar] [CrossRef]
  50. Zhao, C.Z.; Li, H.; Zhang, W.X.; Wang, H.L.; Xu, A.X.; Tian, J.H.; Zou, J.T.; Taylor, D.C.; Zhang, M. BnDGAT1s function similarly in oil deposition and are expressed with uniform patterns in tissues of Brassica napus. Front. Plant Sci. 2017, 8, 2205. [Google Scholar] [CrossRef] [PubMed] [Green Version]
  51. Uagaharu, N. Genomic analysis of Brassica with special reference to the experimental formation of B. napus and peculiar mode of fertilization. Jpn. J. Bot. 1935, 7, 389–452. [Google Scholar]
  52. Snowdon, R.J. Cytogenetics and genome analysis in Brassica crops. Chromosome Res. 2007, 15, 85–95. [Google Scholar] [CrossRef] [PubMed]
  53. Chalhoub, B.; Denoeud, F.; Liu, S.Y.; Parkin, I.A.P.; Tang, H.B.; Wang, X.Y.; Chiquet, J.; Belcram, H.; Tong, C.B.; Samans, B.; et al. Early allopolyploid evolution in the post-neolithic Brassica napus oilseed genome. Science 2014, 345, 950–953. [Google Scholar] [CrossRef] [Green Version]
  54. Ostergaard, L.; King, G.J. Standardized gene nomenclature for the Brassica genus. Plant Methods 2008, 4, 10. [Google Scholar] [CrossRef] [Green Version]
  55. Cheng, F.; Wu, J.; Wang, X.W. Genome triplication drove the diversification of Brassica plants. Hortic. Res. 2014, 1, 14024. [Google Scholar] [CrossRef] [Green Version]
  56. Hu, B.; Jin, J.P.; Guo, A.Y.; Zhang, H.; Luo, J.C.; Gao, G. GSDS 2.0: An upgraded gene feature visualization server. Bioinformatics 2015, 31, 1296–1297. [Google Scholar] [CrossRef] [Green Version]
  57. Lu, S.N.; Wang, J.Y.; Chitsaz, F.; Derbyshire, M.K.; Geer, R.C.; Gonzales, N.R.; Gwadz, M.; Hurwitz, D.I.; Marchler, G.H.; Song, J.S.; et al. CDD/SPARCLE: The conserved domain database in 2020. Nucleic Acids Res. 2020, 48, D265–D268. [Google Scholar] [CrossRef] [Green Version]
  58. Krogh, A.; Larsson, B.; von Heijne, G.; Sonnhammer, E.L.L. Predicting transmembrane protein topology with a hidden markov model: Application to complete genomes. J. Mol. Biol. 2001, 305, 567–580. [Google Scholar] [CrossRef] [Green Version]
  59. Sandager, L.; Gustavsson, M.H.; Stahl, U.; Dahlqvist, A.; Wiberg, E.; Banas, A.; Lenman, M.; Ronne, H.; Stymne, S. Storage lipid synthesis is non-essential in yeast. J. Biol. Chem. 2002, 277, 6478–6482. [Google Scholar] [CrossRef] [PubMed] [Green Version]
  60. Liu, D.; Yu, L.; Wei, L.; Yu, P.; Wang, J.; Zhao, H.; Zhang, Y.; Zhang, S.; Yang, Z.; Chen, G.; et al. BnTIR: An online transcriptome platform for exploring RNA-seq libraries for oil crop Brassica napus. Plant Biotechnol. J. 2021, 19, 1895–1897. [Google Scholar] [CrossRef]
  61. Chao, H.; Li, T.; Luo, C.; Huang, H.; Ruan, Y.; Li, X.; Niu, Y.; Fan, Y.; Sun, W.; Zhang, K.; et al. BrassicaEDB: A gene expression database for Brassica crops. Int. J. Mol. Sci. 2020, 21, 5831. [Google Scholar] [CrossRef] [PubMed]
  62. Chen, C.; Chen, H.; Zhang, Y.; Thomas, H.R.; Frank, M.H.; He, Y.; Xia, R. TBtools: An integrative toolkit developed for interactive analyses of big biological data. Mol. Plant 2020, 13, 1194–1202. [Google Scholar] [CrossRef] [PubMed]
  63. Noman, A.; Fahad, S.; Aqeel, M.; Ali, U.; Amanullah; Anwar, S.; Baloch, S.K.; Zainab, M. miRNAs: Major modulators for crop growth and development under abiotic stresses. Biotechnol. Lett. 2017, 39, 685–700. [Google Scholar] [CrossRef]
  64. Khraiwesh, B.; Zhu, J.K.; Zhu, J.H. Role of miRNAs and siRNAs in biotic and abiotic stress responses of plants. Biochim. Biophys. Acta Gene Regul. Mech. 2012, 1819, 137–148. [Google Scholar] [CrossRef] [Green Version]
  65. Turchetto-Zolet, A.C.; Christoff, A.P.; Kulcheski, F.R.; Loss-Morais, G.; Margis, R.; Margis-Pinheiro, M. Diversity and evolution of plant diacylglycerol acyltransferase (DGATs) unveiled by phylogenetic, gene structure and expression analyses. Genet. Mol. Biol. 2016, 39, 524–538. [Google Scholar] [CrossRef] [PubMed] [Green Version]
  66. Weselake, R.J.; Madhavji, M.; Szarka, S.J.; Patterson, N.A.; Wiehler, W.B.; Nykiforuk, C.L.; Burton, T.L.; Boora, P.S.; Mosimann, S.C.; Foroud, N.A.; et al. Acyl-CoA-binding and self-associating properties of a recombinant 13.3 kDa N-terminal fragment of diacylglycerol acyltransferase-1 from oilseed rape. BMC Biochem. 2006, 7, 24. [Google Scholar] [CrossRef] [PubMed] [Green Version]
  67. Caldo, K.M.P.; Greer, M.S.; Chen, G.Q.; Lemieux, M.J.; Weselake, R.J. Purification and properties of recombinant Brassica napus diacylglycerol acyltransferase 1. FEBS Lett. 2015, 589, 773–778. [Google Scholar] [CrossRef] [PubMed] [Green Version]
  68. Liu, D.; Ji, H.; Yang, Z. Functional characterization of three novel genes encoding diacylglycerol acyltransferase (DGAT) from oil-rich tubers of Cyperus esculentus. Plant Cell Physiol. 2020, 61, 118–129. [Google Scholar] [CrossRef] [PubMed]
  69. Zhou, X.R.; Shrestha, P.; Yin, F.; Petrie, J.R.; Singh, S.P. AtDGAT2 is a functional acyl-CoA:diacylglycerol acyltransferase and displays different acyl-CoA substrate preferences than AtDGAT1. FEBS Lett. 2013, 587, 2371–2376. [Google Scholar] [CrossRef] [PubMed] [Green Version]
  70. Chen, Y.; Cui, Q.; Xu, Y.; Yang, S.; Gao, M.; Wang, Y. Effects of tung oilseed FAD2 and DGAT2 genes on unsaturated fatty acid accumulation in Rhodotorula glutinis and Arabidopsis thaliana. Mol. Genet. Genom. 2015, 1605–1613. [Google Scholar] [CrossRef] [PubMed]
  71. Kainou, K.; Kamisaka, Y.; Kimura, K.; Uemura, H. Isolation of Δ12 and ω3-fatty acid desaturase genes from the yeast Kluyveromyces lactis and their heterologous expression to produce linoleic and α-linolenic acids in Saccharomyces cerevisiae. Yeast 2006, 23, 605–612. [Google Scholar] [CrossRef] [PubMed]
  72. Gao, H.; Gao, Y.; Zhang, F.; Liu, B.; Ji, C.; Xue, J.; Yuan, L.; Li, R. Functional characterization of an novel acyl-CoA:diacylglycerol acyltransferase 3-3 (CsDGAT3-3) gene from Camelina sativa. Plant Sci. 2021, 303, 110752. [Google Scholar] [CrossRef]
  73. Yan, B.W.; Xu, X.X.; Gu, Y.N.; Zhao, Y.; Zhao, X.C.; He, L.; Zhao, C.J.; Li, Z.T.; Xu, J.Y. Genome-wide characterization and expression profiling of diacylglycerol acyltransferase genes from maize. Genome 2018, 61, 735–743. [Google Scholar] [CrossRef] [PubMed]
  74. Zhao, Y.P.; Wang, Y.M.; Huang, Y.; Cui, Y.P.; Hua, J.P. Gene network of oil accumulation reveals expression profiles in developing embryos and fatty acid composition in upland cotton. J. Plant Physiol. 2018, 228, 101–112. [Google Scholar] [CrossRef] [PubMed]
  75. Sajjadi, B.; Chen, W.Y.; Raman, A.A.A.; Ibrahim, S. Microalgae lipid and biomass for biofuel production: A comprehensive review on lipid enhancement strategies and their effects on fatty acid composition. Renew. Sustain. Energy Rev. 2018, 97, 200–232. [Google Scholar] [CrossRef]
  76. Liang, K.H.; Zhang, Q.H.; Gu, M.; Cong, W. Effect of phosphorus on lipid accumulation in freshwater microalga Chlorella sp. J. Appl. Phycol. 2013, 25, 311–318. [Google Scholar] [CrossRef]
  77. Li, X.; Hu, H.Y.; Gan, K.; Sun, Y.X. Effects of different nitrogen and phosphorus concentrations on the growth, nutrient uptake, and lipid accumulation of a freshwater microalga Scenedesmus sp. Bioresour. Technol. 2010, 101, 5494–5500. [Google Scholar] [CrossRef]
  78. Khozin-Goldberg, I.; Cohen, Z. The effect of phosphate starvation on the lipid and fatty acid composition of the fresh water eustigmatophyte Monodus subterraneus. Phytochemistry 2006, 67, 696–701. [Google Scholar] [CrossRef]
  79. Guschina, I.A.; Dobson, G.; Harwood, J.L. Lipid metabolism in cultured lichen photobionts with different phosphorus status. Phytochemistry 2003, 64, 209–217. [Google Scholar] [CrossRef]
  80. Markou, G.; Chatzipavlidis, I.; Georgakakis, D. Carbohydrates production and bio-flocculation characteristics in cultures of Arthrospira (Spirulina) platensis: Improvements through phosphorus limitation process. Bioenergy Res. 2012, 5, 915–925. [Google Scholar] [CrossRef]
  81. Shimojima, M.; Madoka, Y.; Fujiwara, R.; Murakawa, M.; Yoshitake, Y.; Ikeda, K.; Koizumi, R.; Endo, K.; Ozaki, K.; Ohta, H. An engineered lipid remodeling system using a galactolipid synthase promoter during phosphate starvation enhances oil accumulation in plants. Front. Plant Sci. 2015, 6, 664. [Google Scholar] [CrossRef] [PubMed] [Green Version]
  82. Pant, B.D.; Burgos, A.; Pant, P.; Cuadros-Inostroza, A.; Willmitzer, L.; Scheible, W.R. The transcription factor PHR1 regulates lipid remodeling and triacylglycerol accumulation in Arabidopsis thaliana during phosphorus starvation. J. Exp. Bot. 2015, 66, 1907–1918. [Google Scholar] [CrossRef] [PubMed] [Green Version]
  83. Chen, G.Q.; Xu, Y.; Siloto, R.M.P.; Caldo, K.M.P.; Vanhercke, T.; El Tahchy, A.; Niesner, N.; Chen, Y.Y.; Mietkiewska, E.; Weselake, R.J. High-performance variants of plant diacylglycerol acyltransferase 1 generated by directed evolution provide insights into structure function. Plant J. 2017, 92, 167–177. [Google Scholar] [CrossRef] [Green Version]
  84. Caldo, K.M.P.; Shen, W.; Xu, Y.; Hanley-Bowdoin, L.; Chen, G.Q.; Weselake, R.J.; Lemieux, M.J. Diacylglycerol acyltransferase 1 is activated by phosphatidate and inhibited by SnRK1-catalyzed phosphorylation. Plant J. 2018, 96, 287–299. [Google Scholar] [CrossRef] [PubMed] [Green Version]
  85. Cruz-Ramirez, A.; Oropeza-Aburto, A.; Razo-Hernandez, F.; Ramirez-Chavez, E.; Herrera-Estrella, L. Phospholipase DZ2 plays an important role in extraplastidic galactolipid biosynthesis and phosphate recycling in Arabidopsis roots. Proc. Natl. Acad. Sci. USA 2006, 103, 6765–6770. [Google Scholar] [CrossRef] [PubMed] [Green Version]
  86. Oropeza-Aburto, A.; Cruz-Ramirez, A.; Acevedo-Hernandez, G.J.; Perez-Torres, C.A.; Caballero-Perez, J.; Herrera-Estrella, L. Functional analysis of the Arabidopsis PLDZ2 promoter reveals an evolutionarily conserved low-pi-responsive transcriptional enhancer element. J. Exp. Bot. 2012, 63, 2189–2202. [Google Scholar] [CrossRef] [PubMed] [Green Version]
  87. Fragoso, S.; Espindola, L.; Paez-Valencia, J.; Gamboa, A.; Camacho, Y.; Martinez-Barajas, E.; Coello, P. SnRK1 Isoforms AKIN10 and AKIN11 are differentially regulated in Arabidopsis plants under phosphate starvation. Plant Physiol. 2009, 149, 1906–1916. [Google Scholar] [CrossRef] [Green Version]
  88. Deng, X.D.; Li, Y.J.; Fei, X.W. The mRNA abundance of pepc2 gene is negatively correlated with oil content in Chlamydomonas reinhardtii. Biomass Bioenergy 2011, 35, 1811–1817. [Google Scholar] [CrossRef]
  89. Illman, A.M.; Scragg, A.H.; Shales, S.W. Increase in Chlorella strains calorific values when grown in low nitrogen medium. Enzym. Microb. Technol. 2000, 27, 631–635. [Google Scholar] [CrossRef]
  90. Rodolfi, L.; Zittelli, G.C.; Bassi, N.; Padovani, G.; Biondi, N.; Bonini, G.; Tredici, M.R. Microalgae for oil: Strain selection, induction of lipid synthesis and outdoor mass cultivation in a low-cost photobioreactor. Biotechnol. Bioeng. 2009, 102, 100–112. [Google Scholar] [CrossRef]
  91. Spoehr, H.A.; Milner, H.W. The chemical composition of chlorella; effect of environmental conditions. Plant Physiol. 1949, 24, 120–149. [Google Scholar] [CrossRef] [Green Version]
  92. Guo, X.J.; Fan, C.M.; Chen, Y.H.; Wang, J.Q.; Yin, W.B.; Wang, R.R.C.; Hu, Z.M. Identification and characterization of an efficient acyl-CoA: Diacylglycerol acyltransferase 1 (DGAT1) gene from the microalga Chlorella ellipsoidea. BMC Plant Biol. 2017, 17, 48. [Google Scholar] [CrossRef] [PubMed] [Green Version]
  93. Adams, C.; Godfrey, V.; Wahlen, B.; Seefeldt, L.; Bugbee, B. Understanding precision nitrogen stress to optimize the growth and lipid cross mark content tradeoff in oleaginous green microalgae. Bioresour. Technol. 2013, 131, 188–194. [Google Scholar] [CrossRef] [PubMed] [Green Version]
  94. Kumar, R.; Biswas, K.; Singh, P.K.; Singh, P.K.; Elumalai, S.; Shukla, P.; Pabbi, S. Lipid production and molecular dynamics simulation for regulation of accD gene in cyanobacteria under different N and P regimes. Biotechnol. Biofuels 2017, 10, 94. [Google Scholar] [CrossRef] [PubMed]
  95. Martin, T.; Oswald, O.; Graham, I.A. Arabidopsis seedling growth, storage lipid mobilization, and photosynthetic gene expression are regulated by carbon; nitrogen availability. Plant Physiol. 2002, 128, 472–481. [Google Scholar] [CrossRef] [PubMed]
  96. Gaude, N.; Brehelin, C.; Tischendorf, G.; Kessler, F.; Dormann, P. Nitrogen deficiency in Arabidopsis affects galactolipid composition and gene expression and results in accumulation of fatty acid phytyl esters. Plant J. 2007, 49, 729–739. [Google Scholar] [CrossRef] [Green Version]
  97. Eastmond, P.J.; Germain, V.; Lange, P.R.; Bryce, J.H.; Smith, S.M.; Graham, I.A. Postgerminative growth and lipid catabolism in oilseeds lacking the glyoxylate cycle. Proc. Natl. Acad. Sci. USA 2000, 97, 5669–5674. [Google Scholar] [CrossRef] [PubMed] [Green Version]
  98. Svenningsson, H.; Liljenberg, C. Membrane lipid changes in root cells of rape (Brassica napus) as a function of water-deficit stress. Physiol. Plant. 1986, 68, 53–58. [Google Scholar] [CrossRef]
  99. Dakhma, W.S.; Zarrouk, M.; Cherif, A. Effects of drought-stress on lipids in rape leaves. Phytochemistry 1995, 40, 1383–1386. [Google Scholar] [CrossRef]
  100. Aziz, A.; Larher, F. Osmotic stress induced changes in lipid composition and peroxidation in leaf discs of Brassica napus L. J. Plant Physiol. 1998, 153, 754–762. [Google Scholar] [CrossRef]
  101. Aslam, M.N.; Nelson, M.N.; Kailis, S.G.; Bayliss, K.L.; Speijers, J.; Cowling, W.A. Canola oil increases in polyunsaturated fatty acids and decreases in oleic acid in drought-stressed Mediterranean-type environments. Plant Breed. 2009, 128, 348–355. [Google Scholar] [CrossRef]
  102. Douglas, T.J.; Paleg, L.G. Lipid composition of Zea mays seedlings and water stress-induced changes. J. Exp. Bot. 1981, 32, 499–508. [Google Scholar] [CrossRef]
  103. Martin, B.A.; Schoper, J.B.; Rinne, R.W. Changes in soybean (Glycine max [L.] Merr) glycerolipids in response to water-stress. Plant Physiol. 1986, 81, 798–801. [Google Scholar] [CrossRef] [Green Version]
  104. Thi, A.T.P.; Borrelflood, C.; Dasilva, J.V.; Justin, A.M.; Mazliak, P. Effects of water stress on lipid metabolism in cotton leaves. Phytochemistry 1985, 24, 723–727. [Google Scholar] [CrossRef]
  105. Urao, T.; Yamaguchishinozaki, K.; Urao, S.; Shinozaki, K. An Arabidopsis myb homolog is induced by dehydration stress and its gene product binds to the conserved MYB recognition sequence. Plant Cell 1993, 5, 1529–1539. [Google Scholar] [CrossRef] [Green Version]
  106. Xu, Z.W.; Wang, M.P.; Guo, Z.T.; Zhu, X.F.; Xia, Z.L. Identification of a 119-bp promoter of the maize sulfite oxidase gene (ZmSO) that confers high-level gene expression and ABA or drought inducibility in transgenic plants. Int. J. Mol. Sci. 2019, 20, 3326. [Google Scholar] [CrossRef] [Green Version]
  107. Abe, H.; Urao, T.; Ito, T.; Seki, M.; Shinozaki, K.; Yamaguchi-Shinozaki, K. Arabidopsis AtMYC2 (bHLH) and AtMYB2 (MYB) function as transcriptional activators in abscisic acid signaling. Plant Cell 2003, 15, 63–78. [Google Scholar] [CrossRef] [Green Version]
  108. Wei, L.; Zhu, Y.; Liu, R.; Zhang, A.; Zhu, M.; Xu, W.; Lin, A.; Lu, K.; Li, J. Genome wide identification and comparative analysis of glutathione transferases (GST) family genes in Brassica napus. Sci. Rep. 2019, 9, 9196. [Google Scholar] [CrossRef] [Green Version]
  109. Bailey, T.L.; Boden, M.; Buske, F.A.; Frith, M.; Grant, C.E.; Clementi, L.; Ren, J.; Li, W.W.; Noble, W.S. MEME SUITE: Tools for motif discovery and searching. Nucleic Acids Res. 2009, 37, W202–W208. [Google Scholar] [CrossRef]
  110. Hoagland, D.R.; Arnon, D.I. The water culture method for growing plants without soil. Calif. Agric. Exp. Stn. Bull. 1938, 347, 36–39. [Google Scholar]
  111. Rogers, S.O.; Bendich, A.J. Extraction of DNA from milligram amounts of fresh, herbarium and mummified plant tissues. Plant Mol. Biol. 1985, 5, 69–76. [Google Scholar] [CrossRef] [PubMed]
  112. Tian, F.; Yang, D.C.; Meng, Y.Q.; Jin, J.; Gao, G. PlantRegMap: Charting functional regulatory maps in plants. Nucleic Acids Res. 2020, 48, D1104–D1113. [Google Scholar] [CrossRef] [PubMed]
  113. Dai, X.; Zhuang, Z.; Zhao, P.X. psRNATarget: A plant small RNA target analysis server (2017 release). Nucleic Acids Res. 2018, 46, W49–W54. [Google Scholar] [CrossRef] [PubMed] [Green Version]
  114. Lescot, M.; Dehais, P.; Thijs, G.; Marchal, K.; Moreau, Y.; Van de Peer, Y.; Rouze, P.; Rombauts, S. PlantCARE, a database of plant cis-acting regulatory elements and a portal to tools for in silico analysis of promoter sequences. Nucleic Acids Res. 2002, 30, 325–327. [Google Scholar] [CrossRef] [PubMed]
  115. Zhuang, W.J.; Chen, H.; Yang, M.; Wang, J.P.; Pandey, M.K.; Zhang, C.; Chang, W.C.; Zhang, L.S.; Zhang, X.T.; Tang, R.H.; et al. The genome of cultivated peanut provides insight into legume karyotypes, polyploid evolution and crop domestication. Nat. Genet. 2019, 51, 865–876. [Google Scholar] [CrossRef]
  116. Kaul, S.; Koo, H.L.; Jenkins, J.; Rizzo, M.; Rooney, T.; Tallon, L.J.; Feldblyum, T.; Nierman, W.; Benito, M.I.; Lin, X.Y.; et al. Analysis of the genome sequence of the flowering plant Arabidopsis thaliana. Nature 2000, 408, 796–815. [Google Scholar] [CrossRef] [Green Version]
  117. Huala, E.; Dickerman, A.W.; Garcia-Hernandez, M.; Weems, D.; Reiser, L.; LaFond, F.; Hanley, D.; Kiphart, D.; Zhuang, M.; Huang, W.; et al. The Arabidopsis Information Resource (TAIR): A comprehensive database and web-based information retrieval, analysis, and visualization system for a model plant. Nucleic Acids Res. 2001, 29, 102–105. [Google Scholar] [CrossRef] [Green Version]
  118. Vogel, J.P.; Garvin, D.F.; Mockler, T.C.; Schmutz, J.; Rokhsar, D.; Bevan, M.W.; Barry, K.; Lucas, S.; Harmon-Smith, M.; Lail, K.; et al. Genome sequencing and analysis of the model grass Brachypodium distachyon. Nature 2010, 463, 763–768. [Google Scholar] [CrossRef]
  119. Yang, J.; Liu, D.; Wang, X.; Ji, C.; Cheng, F.; Liu, B.; Hu, Z.; Chen, S.; Pental, D.; Ju, Y.; et al. The genome sequence of allopolyploid Brassica juncea and analysis of differential homoeolog gene expression influencing selection. Nat. Genet. 2016, 48, 1225–1232. [Google Scholar] [CrossRef] [PubMed]
  120. Rousseau-Gueutin, M.; Belser, C.; Da Silva, C.; Richard, G.; Istace, B.; Cruaud, C.; Falentin, C.; Boideau, F.; Boutte, J.; Delourme, R.; et al. Long-read assembly of the Brassica napus reference genome Darmor-bzh. GigaScience 2020, 9, 1–16. [Google Scholar] [CrossRef] [PubMed]
  121. Perumal, S.; Koh, C.S.; Jin, L.; Buchwaldt, M.; Higgins, E.; Zheng, C.; Sankoff, D.; Robinson, S.J.; Kagale, S.; Navabi, Z.-K.; et al. High contiguity long read assembly of Brassica nigra allows localization of active centromeres and provides insights into the ancestral Brassica genome. bioRxiv 2020. [Google Scholar] [CrossRef] [Green Version]
  122. Zhang, L.; Cai, X.; Wu, J.; Liu, M.; Grob, S.; Cheng, F.; Liang, J.; Cai, C.; Liu, Z.; Liu, B.; et al. Improved Brassica rapa reference genome by single-molecule sequencing and chromosome conformation capture technologies. Hortic. Res. 2018, 5, 50. [Google Scholar] [CrossRef] [PubMed] [Green Version]
  123. Cai, X.; Wu, J.; Liang, J.; Lin, R.; Zhang, K.; Cheng, F.; Wang, X. Improved Brassica oleracea JZS assembly reveals significant changing of LTR-RT dynamics in different morphotypes. Theor. Appl. Genet. 2020, 133, 3187–3199. [Google Scholar] [CrossRef] [PubMed]
  124. Schmutz, J.; Cannon, S.B.; Schlueter, J.; Ma, J.X.; Mitros, T.; Nelson, W.; Hyten, D.L.; Song, Q.J.; Thelen, J.J.; Cheng, J.L.; et al. Genome sequence of the palaeopolyploid soybean. Nature 2010, 463, 178–183. [Google Scholar] [CrossRef] [PubMed] [Green Version]
  125. Valliyodan, B.; Cannon, S.B.; Bayer, P.E.; Shu, S.Q.; Brown, A.V.; Ren, L.H.; Jenkins, J.; Chung, C.Y.L.; Chan, T.F.; Daum, C.G.; et al. Construction and comparison of three reference-quality genome assemblies for soybean. Plant J. 2019, 100, 1066–1082. [Google Scholar] [CrossRef] [PubMed]
  126. Sato, S.; Hirakawa, H.; Isobe, S.; Fukai, E.; Watanabe, A.; Kato, M.; Kawashima, K.; Minami, C.; Muraki, A.; Nakazaki, N.; et al. Sequence analysis of the genome of an oil-bearing tree, Jatropha curcas L. DNA Res. 2011, 18, 65–76. [Google Scholar] [CrossRef] [PubMed]
  127. Tang, H.B.; Krishnakumar, V.; Bidwell, S.; Rosen, B.; Chan, A.N.; Zhou, S.G.; Gentzbittel, L.; Childs, K.L.; Yandell, M.; Gundlach, H.; et al. An improved genome release (version Mt4.0) for the model legume Medicago truncatula. BMC Genom. 2014, 15, 312. [Google Scholar] [CrossRef] [PubMed] [Green Version]
  128. Ouyang, S.; Zhu, W.; Hamilton, J.; Lin, H.; Campbell, M.; Childs, K.; Thibaud-Nissen, F.; Malek, R.L.; Lee, Y.; Zheng, L.; et al. The TIGR Rice Genome Annotation Resource: Improvements and new features. Nucleic Acids Res. 2007, 35, D883–D887. [Google Scholar] [CrossRef] [PubMed] [Green Version]
  129. Chan, A.P.; Crabtree, J.; Zhao, Q.; Lorenzi, H.; Orvis, J.; Puiu, D.; Melake-Berhan, A.; Jones, K.M.; Redman, J.; Chen, G.; et al. Draft genome sequence of the oilseed species Ricinus communis. Nat. Biotechnol. 2010, 28, 951–956. [Google Scholar] [CrossRef] [PubMed] [Green Version]
  130. Xu, W.; Wu, D.; Yang, T.; Sun, C.; Wang, Z.; Han, B.; Wu, S.; Yu, A.; Chapman, M.A.; Muraguri, S.; et al. Genomic insights into the origin, domestication and genetic basis of agronomic traits of castor bean. Genome Biol. 2021, 22, 113. [Google Scholar] [CrossRef] [PubMed]
  131. Zhang, G.Y.; Liu, X.; Quan, Z.W.; Cheng, S.F.; Xu, X.; Pan, S.K.; Xie, M.; Zeng, P.; Yue, Z.; Wang, W.L.; et al. Genome sequence of foxtail millet (Setaria italica) provides insights into grass evolution and biofuel potential. Nat. Biotechnol. 2012, 30, 549–554. [Google Scholar] [CrossRef] [Green Version]
  132. Bennetzen, J.L.; Schmutz, J.; Wang, H.; Percifield, R.; Hawkins, J.; Pontaroli, A.C.; Estep, M.; Feng, L.; Vaughn, J.N.; Grimwood, J.; et al. Reference genome sequence of the model plant Setaria. Nat. Biotechnol. 2012, 30, 555–561. [Google Scholar] [CrossRef] [PubMed] [Green Version]
  133. Bornowski, N.; Michel, K.J.; Hamilton, J.P.; Ou, S.J.; Seetharam, A.S.; Jenkins, J.; Grimwood, J.; Plott, C.; Shu, S.Q.; Talag, J.; et al. Genomic variation within the maize stiff-stalk heterotic germplasm pool. Plant Genome 2021. [Google Scholar] [CrossRef] [PubMed]
Figure 1. Synteny analysis of DGATs in Arabidopsis thaliana, Brassica oleracea, Brassica rapa, Brassica napus and Brassica nigra. (A) Synteny analysis of the BnaDGAT family in B. napus. Red-, green- and blue-colored lines indicate the BnaDGAT1 subfamily, BnaDGAT2 subfamily and BnaDGAT3 subfamily genes, respectively; (B) Synteny analysis of DGATs between A. thaliana, B. oleracea, B. rapa, B. napus and B. nigra. Red, green and blue lines indicate the syntenic DGAT1, DGAT2 and DGAT3 gene pairs between the denoted species, respectively. In the background, the grey line represents collinear blocks.
Plants 11 01156 g001
Figure 2. Analyses of phylogenetic tree, gene structures and conserved domains of DGAT family members in Brassica napus and other plant species. (A) Phylogenetic tree. DGAT protein sequences were used to construct the phylogenetic tree by MEGA11 software with the neighbor-joining method and 2000 bootstrap replications; (B) Gene structures. The genomic DNA and CDSs of DGATs were used to construct the gene structures by the Gene Structure Display Serve (GSDS2.0; http://gsds.gao-lab.org/ (accessed on 20 October 2021)) [56]. Black boxes denote exons within coding regions, and the lines connecting exons represent introns. Grey boxes indicate the upstream or downstream regions of the CDS of DGAT genes. The length of the boxes represents the size of the corresponding exons; (C) Conserved domains. A functional search of the conserved domains was performed using the Conserved Domain Database (CDD) with Batch CD-Search in NCBI. BnaDGAT1s, BnaDGAT2s and BnaDGAT3s were cloned from B. napus ZS11. The protein, genomic DNA and CDSs of DGAT family members in B. oleracea, B. rapa, B. nigra, B. juncea, B. carinata, A. thaliana, A. hypogaea, G. max, R. communis, O. sativa, Z. mays, S. italica, M. truncatula, B. distachyon and J. curcas were blasted and selected from their corresponding genome databases (Table S2). All DGAT1s contained the PLN02401 domain (diacylglycerol o-acyltransferase) or the MBOAT domain (membrane-bound O-acyltransferase family). All DGAT2 homologues shared the PLN02783 domain (diacylglycerol o-acyltransferase), except AH13G38440.1 and Jcr4U29423.10, which had an LPLAT superfamily domain. All DGAT3 homologues shared the TRX_Fd_family domain, except BjuB045147 and BjuA014363.
Plants 11 01156 g002
Figure 3. Predicted transmembrane domains (TMDs) of BnaDGATs. Each BnaDGAT1s had eight or nine putative TMDs, and each BnaDGAT2s showed two putative TMDs. However, neither BnaDGAT3 had putative TMDs. The putative TMDs of BnaDGATs were predicted using TMHMM Server v. 2.0 (https://services.healthtech.dtu.dk/service.php?TMHMM-2.0 (accessed on 10 April 2021)). Regions of BnaDGATs predicted to be located inside or outside the membrane are shown in bold blue and pink lines, respectively.
Plants 11 01156 g003
Figure 4. Oil bodies in S. cerevisiae H1246 expressing BnaDGATs by Nile red staining. (A) Negative control. Yeast H1246 expressing eGFP; (B) Yeast H1246 expressing different BnaDGATs. Oil droplets were observed in yeast H1246 expressing BnaDGAT1s but were not detectable and/or were very weak in yeast H1246 expressing BnaDGAT2s and BnaDGAT3s. Bar = 10 μm.
Plants 11 01156 g004
Figure 5. Analysis of the fatty acid compositions and content in yeast H1246 and INVSc1 expressing different BnaDGATs. (A) Yeast H1246; (B) Yeast INVSc1. Yeast expressing eGFP was the negative control, and that expressing AtDGAT1 was the positive control. Data represent averages of three replicates ± SD. Statistical analysis was carried out by Student’s t test. Asterisks indicate the fatty acids with a significant difference from those in the negative control (* p < 0.05; ** p < 0.01).
Plants 11 01156 g005
Figure 6. Transcriptomic analysis of BnaDGATs in different tissues. (A) The analysis based on BnTIR; (B) The analysis based on BrassicaEDB. RNA-Seq datasets of different tissues at diverse stages of development were obtained from BnTIR (http://yanglab.hzau.edu.cn/BnTIR (accessed on 10 November 2021)) [60] and BrassicaEDB (https://brassica.biodb.org/ (accessed on 10 November 2021)) [61]. The extracted data from BnTIR and BrassicaEDB were normalized by log2(TPM) and log2(FPKM), respectively, and the heatmaps were generated by TBtools [62].
Plants 11 01156 g006
Figure 7. qRT–PCR analyses of different BnaDGATs under different stresses. (A) qRT–PCR analyses of BnaDGAT1s under different stresses; (B) qRT–PCR analyses of BnaDGAT2s under different stresses; (C) qRT–PCR analyses of BnaDGAT3s under different stresses. For dehydration and salt stress treatments, six-week-old seedlings of B. napus were grown hydroponically in solution containing 15% (w/v) PEG6000 and 150 mM NaCl plus 1/2 Hoagland solution. In the Pi-deficient treatment (-P), KH2PO4 in 1/2 Hoagland solution was replaced by equimolar amounts of KCl. In the low nitrogen treatment (low N), KNO3 in 1/2 Hoagland solution was replaced by equimolar amounts of KCl. Seedlings growing in 1/2 Hoagland solution for various periods of time were used as the mock. Tissues at 0 h, 1 h, 3 h, 6 h, 12 h, 24 h and 48 h were sampled. BnaACT7 was used as an internal control. The expression level of each gene at 0 h in leaves (L), stems (S) and roots (R) was arbitrarily set as 1. The data represent averages of three replicates ± SD.
Plants 11 01156 g007
Figure 8. Main fatty acid content in roots, stems and leaves under abiotic stresses. (A) Pi-deficient treatment (-P); (B) Low nitrogen treatment (low N). (C) Dehydration treatment (PEG); (D) Salt treatment (NaCl); (E) Mock. For dehydration and salt stress treatments, six-week-old seedlings of B. napus were grown hydroponically in solution containing 15% (w/v) PEG6000 and 150 mM NaCl plus 1/2 Hoagland solution. In the Pi-deficient treatment, KH2PO4 in 1/2 Hoagland solution was replaced by equimolar amounts of KCl. In the low nitrogen treatment, KNO3 in 1/2 Hoagland solution was replaced by equimolar amounts of KCl. Seedlings grown in 1/2 Hoagland solution for various periods of time were used as the mock. The FA content was quantified by GC–MS with heptadecanoic acid (C17:0) as an internal standard. The data represent averages of three replicates ± SD. Asterisks indicate the fatty acid content with a significant difference from those in the mock (* p < 0.05; ** p < 0.01).
Plants 11 01156 g008
Figure 9. Potential cis-acting regulatory elements upstream of the start codons of BnaDGATs and AtDGATs deduced by PlantCARE. PBnaA.DGAT1.a, PBnaC.DGAT1.a, PBnaA.DGAT1.b, PBnaA.DGAT2.a, PBnaC.DGAT2.a, PBnaA.DGAT2.b, PBnaC.DGAT2.b, PBnaA.DGAT3 and PBnaC.DGAT3 were cloned from B. napus ZS11. PAtDGAT1, PAtDGAT2 and PAtDGAT3 were derived from the Arabidopsis database (https://www.arabidopsis.org (accessed on 25 March 2020)). PBnaC.DGAT1.b was extracted from the ZS11 genome database (https://www.ncbi.nlm.nih.gov/assembly/GCF_000686985.2/ (accessed on 20 September 2021)). Black bar = 200 bp.
Plants 11 01156 g009
Table 1. Members of the DGAT family in A. thaliana and six Brassica species forming U’s triangle according to their genome databases.
Arabidopsis thalianaBrassica napusBrassica rapaBrassica oleraceaBrassica nigraBrassica junceaBrassica carinata
Brassica_napus_v4.1ZS11Brara_Chiifu_V3.0Braol_JZS_V2.0Brani_Ni100_V2Braju_tum_V1.5
AtDGAT1
At2G19450
BnaA07g36000DBnaA07G0011800ZSBraA07g001370.3CBjuA046403-A07
BnaAnng30990DBnaA09G0121200ZSBraA09g011830.3CBjuA017169-A09
BniB03g068710.2NBjuB029654-B03BcaB03g16730
BniB04g025020.2NBjuB028615-B04BcaB07g31608
BnaCnng52810DBnaC07G0026200ZSBolC07g002350.2JBcaC04g22852
BnaC09G0126800ZSBolC09g013760.2JBcaC06g36576
AtDGAT2
At3G51520
BnaA01g19390DBnaA01G0206700ZSBraA01g022340.3CBjuA005097-A01
BnaA03g41350DBnaA03G0420700ZSBraA03g045590.3CBjuA042315-A03
BniB02g074660.2NBjuB048735-B02BcaC06g33029
BniB05g021740.2NBjuB013221-B05BcaNung00379
BnaC01g23350DBnaC01G0259700ZSBolC01g027430.2J
BnaC07g32270DBnaC07G0393500ZSBolC07g044710.2J
AtDGAT3
At1G48300
BnaA08g03400DBnaA08G0039500ZSBraA08g004520.3CBjuA014363-A08
BniB07g007860.2NBjuB045147-B07BcaB04g17451
BnaC08g46660DBnaC08G0049200ZSBolC08g005290.2JBcaC07g37153
AtDGATs were extracted from the Arabidopsis database (TAIR, http://www.arabidopsis.org/ (accessed on 25 March 2020)); BnaDGATs in Brassica_napus_v4.1 were selected from Brassica napus Genome Browser (http://www.genoscope.cns.fr/brassicanapus/ (accessed on 25 March 2020)); ZS11 indicates the gene locus IDs of BnaDGATs in B. napus ZS11 genome database (BnPIR; http://cbi.hzau.edu.cn/bnapus/index.php (accessed on 2 March 2021)); B. rapa, B. oleracea, B. nigra and B. juncea DGATs were blasted in the Brassica database (BRAD, http://brassicadb.cn/#/ (accessed on 11 October 2021)); B. carinata DGATs were derived from the Brassica Genomics Database (BGD, http://brassicadb.bio2db.com/ (accessed on 11 October 2021)). The concept of U’s triangle described natural allopolyploidization events in Brassica using three diploids (B. rapa (A genome), B. nigra (B), and B. oleracea (C) and three derived allotetraploids (B. juncea (AB genome), B. napus (AC), and B. carinata (BC)) [51].
Table 2. Cloning and characterization of the members of BnaDGAT family.
SchemeGene NameGene Locus IDChromosome LocationProteinPutative Promoter
AApIMw (Da)Subcellular Location
DGAT1BnaA.DGAT1.aBnaA07G0011800ZSA07:935,937-939,4735048.7557,743.80E.R.1759 bp
BnaA.DGAT1.bBnaA09G0121200ZSA09:7,271,130-7,274,4775038.0957,241.36E.R.1488 bp
BnaC.DGAT1.aBnaC07G0026200ZSC07:4,705,347-4,708,6535018.4357,538.87E.R.1657 bp
BnaC.DGAT1.bBnaC09G0126800ZSC09:9,270,137-9,273,6445108.2057,958.08E.R.1500 bp
DGAT2BnaA.DGAT2.aBnaA01G0206700ZSA01:12,907,146-12,908,8533688.7741,813.30E.R.836 bp
BnaA.DGAT2.bBnaA03G0420700ZSA03:22,826,130-22,827,7593678.3241,280.40E.R.775 bp
BnaC.DGAT2.aBnaC01G0259700ZSC01:20,695,151-20,696,8703198.8836,103.24E.R.2151 bp
BnaC.DGAT2.bBnaC07G0393500ZSC07:51,188,778-51,190,5463177.7535,636.69E.R.1973 bp
DGAT3BnaA.DGAT3BnaA08G0039500ZSA08:3,290,776-3,291,9253568.9038,476.61None1660 bp
BnaA.DGAT3BnaC08G0049200ZSC08:4,709,675-4,710,8233568.8438,184.10None1459 bp
Gene Name shows the names of BnaDGATs annotated according to the nomenclature principles of Brassica genes (genus-species-genome-gene name-locus-allele) [54]. The gene locus IDs, chromosome locations and orientation of BnaDGATs were derived from the B. napus ZS11 genome database (BnPIR; http://cbi.hzau.edu.cn/bnapus/index.php (accessed on 2 March 2021)). The isoelectric point (pI) and molecular weight (Mw) of BnaDGAT proteins were predicted using the ProtParam tool (https://web.expasy.org/protparam/ (accessed on 22 October 2021)). Subcellular localization patterns of BnaDGAT1s and BnaDGAT2s were predicted, and the results showed that they were located in the endoplasmic reticulum (E.R.), whereas no BnaDGAT3s were evaluated using ProtComp v.9.0 in softberry (http://linux1.softberry.com/ (accessed on 22 October 2021)).
Table 3. Ks/Ka values between BnaDGAT and their paralogous gene pairs in Brassica napus and their orthologous gene pairs in Arabidopsis.
Gene_1Gene_2KaKsKa/KsDuplication Time (MYA)Average (MYA)
Orthologous gene pairsAtDGAT1BnaA.DGAT1.a0.0620.3200.19410.6715.06
AtDGAT1BnaA.DGAT1.b0.0640.4000.16113.33
AtDGAT1BnaC.DGAT1.a0.0640.3470.18411.56
AtDGAT1BnaC.DGAT1.b0.0600.4150.14513.82
AtDGAT2BnaA.DGAT2.a0.0980.4860.20116.21
AtDGAT2BnaA.DGAT2.b0.1230.4480.27514.92
AtDGAT2BnaC.DGAT2.a0.0990.4950.20016.51
AtDGAT2BnaC.DGAT2.b0.1240.4360.28414.55
AtDGAT3BnaA.DGAT30.0810.5680.14318.92
AtDGAT3BnaC.DGAT30.0860.6030.14220.11
Paralogous gene pairsBnaA.DGAT1.aBnaA.DGAT1.b0.0560.3460.16111.528.36
BnaA.DGAT1.aBnaC.DGAT1.a0.0030.0410.0641.37
BnaA.DGAT1.aBnaC.DGAT1.b0.0540.3290.16310.97
BnaA.DGAT1.bBnaC.DGAT1.a0.0580.3580.16211.92
BnaA.DGAT1.bBnaC.DGAT1.b0.0070.0970.0733.22
BnaC.DGAT1.aBnaC.DGAT1.b0.0560.3280.17010.95
BnaA.DGAT2.aBnaA.DGAT2.b0.1110.3470.32111.58
BnaA.DGAT2.aBnaC.DGAT2.a0.0090.0850.1072.83
BnaA.DGAT2.aBnaC.DGAT2.b0.1120.3720.30112.41
BnaA.DGAT2.bBnaC.DGAT2.a0.1110.3760.29612.52
BnaA.DGAT2.bBnaC.DGAT2.b0.0100.0920.1073.07
BnaC.DGAT2.aBnaC.DGAT2.b0.1110.3830.29012.78
BnaA.DGAT3BnaC.DGAT30.0190.1070.1793.57
Publisher’s Note: MDPI stays neutral with regard to jurisdictional claims in published maps and institutional affiliations.

