
The Dynamics of Phosphorus Uptake and Remobilization during the Grain Development Period in Durum Wheat Plants

 and
and
Abstract
:
1. Introduction
2. Results
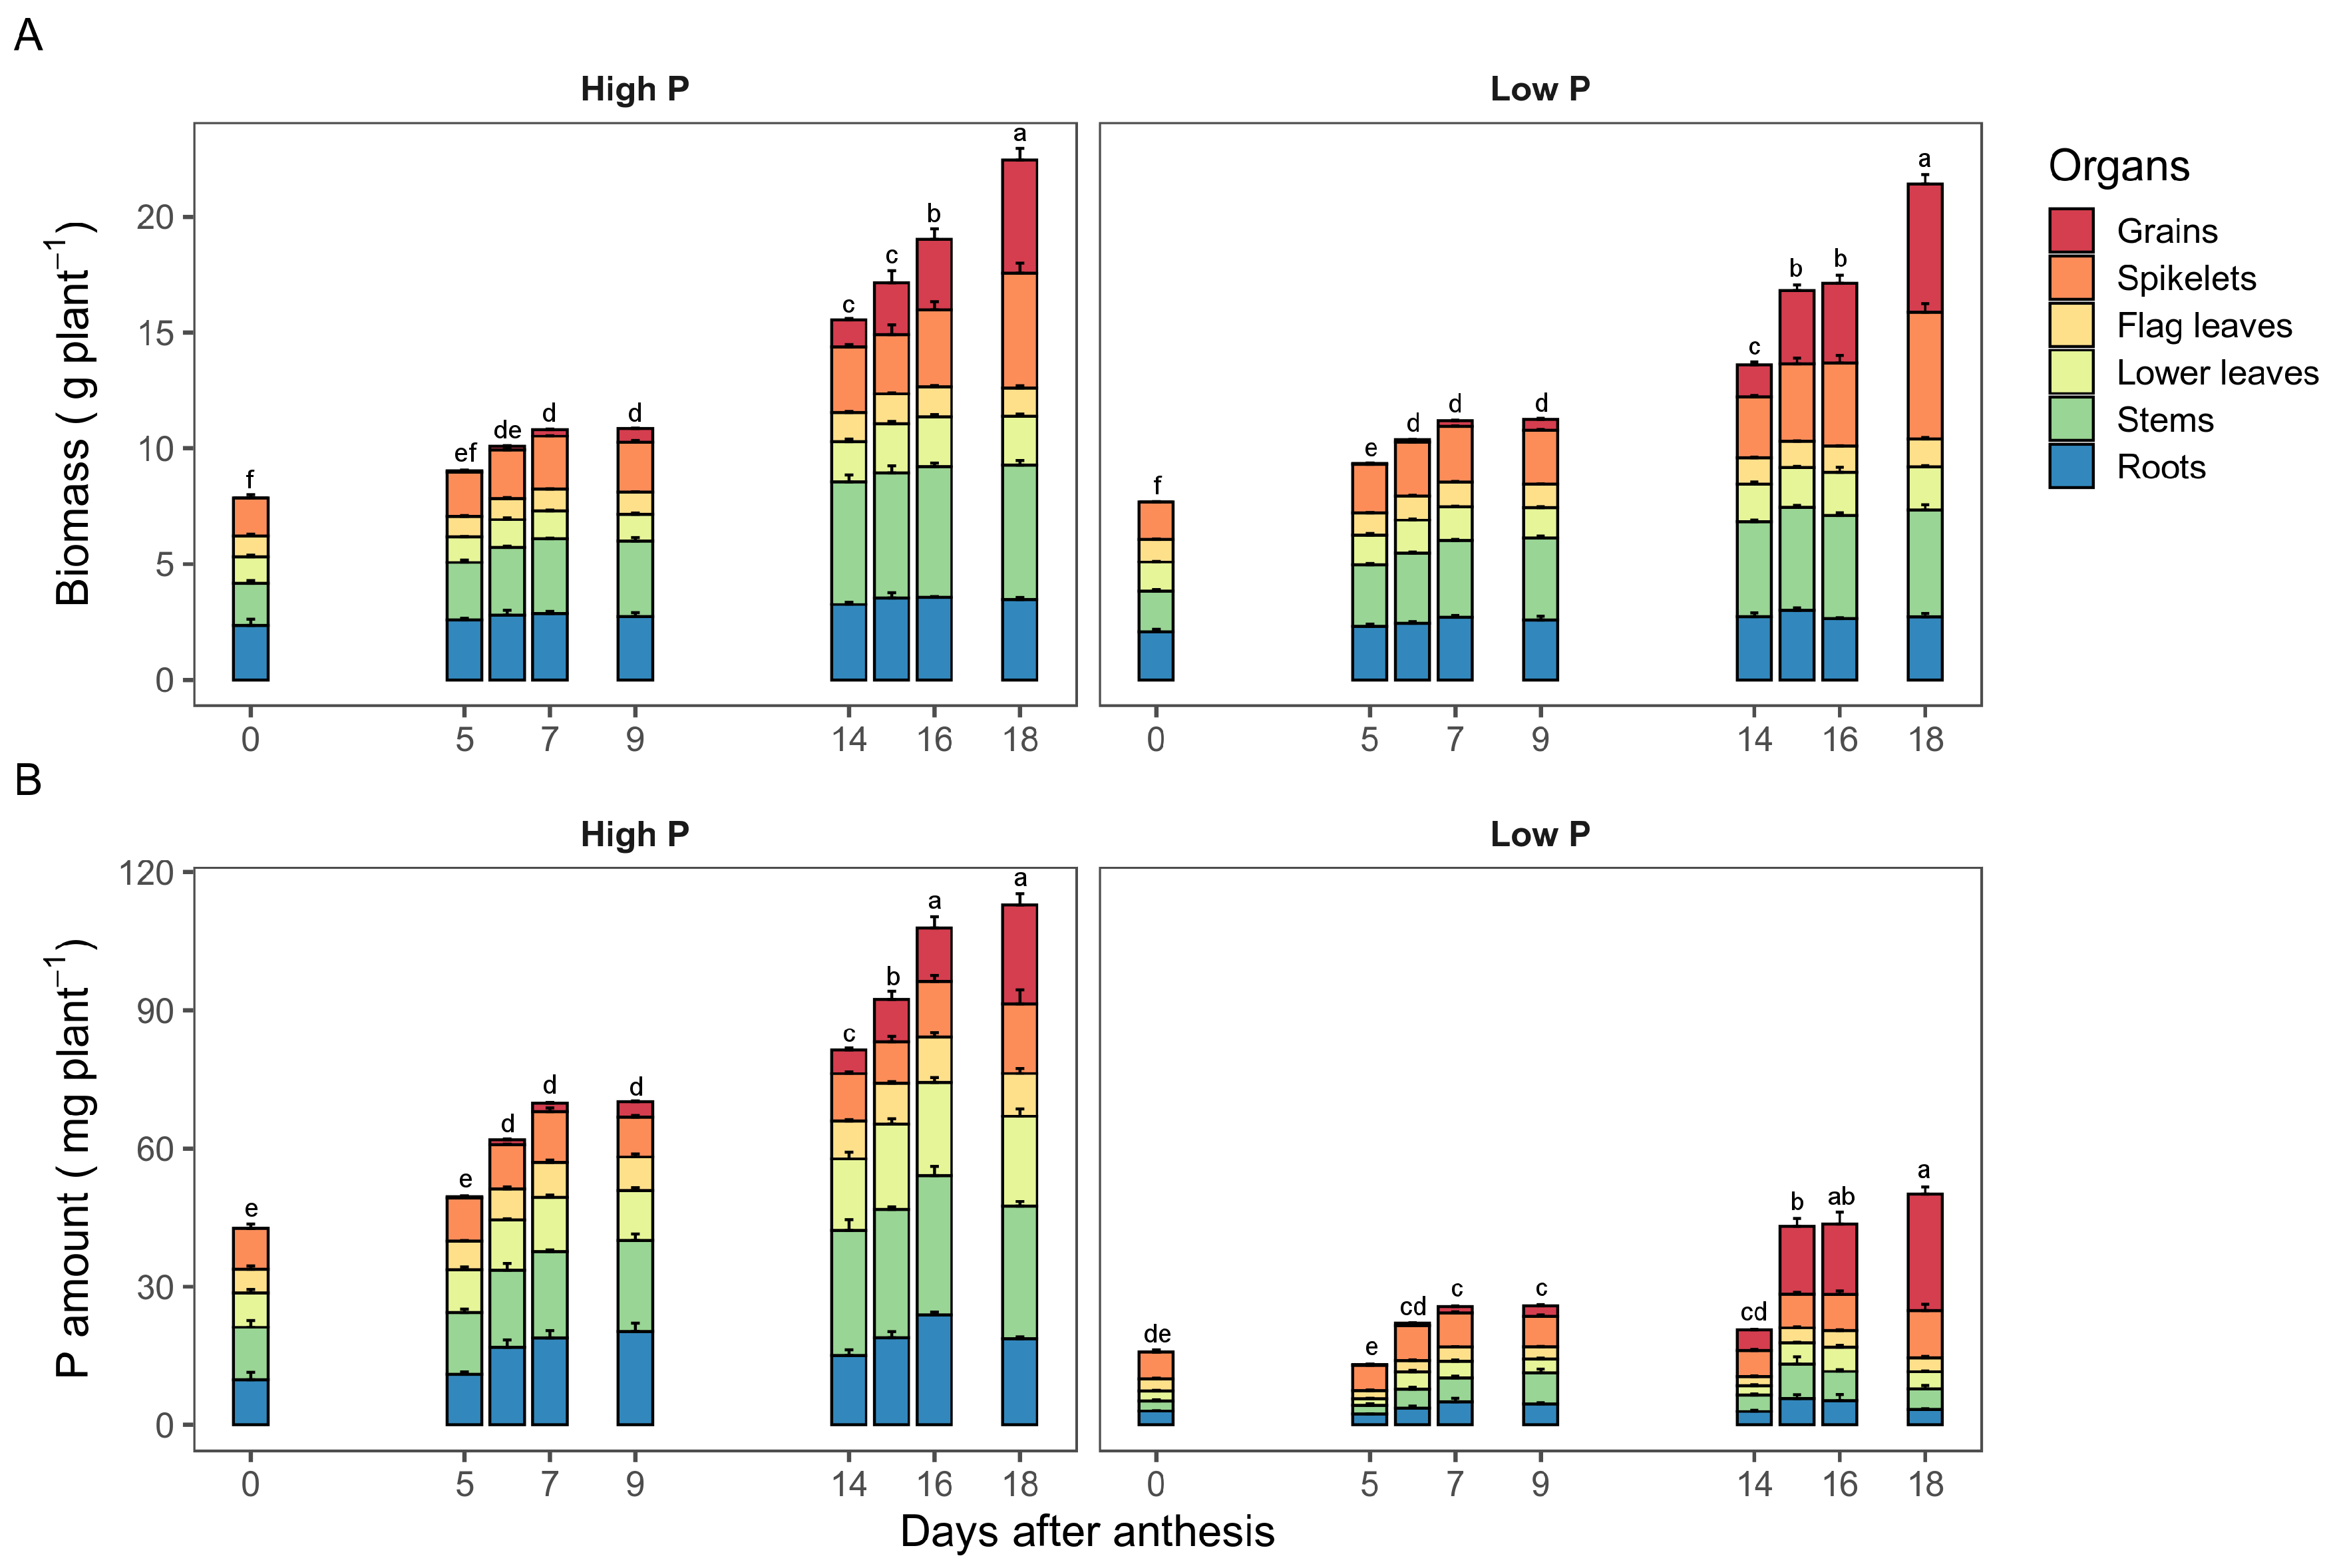
2.1. Plant Growth
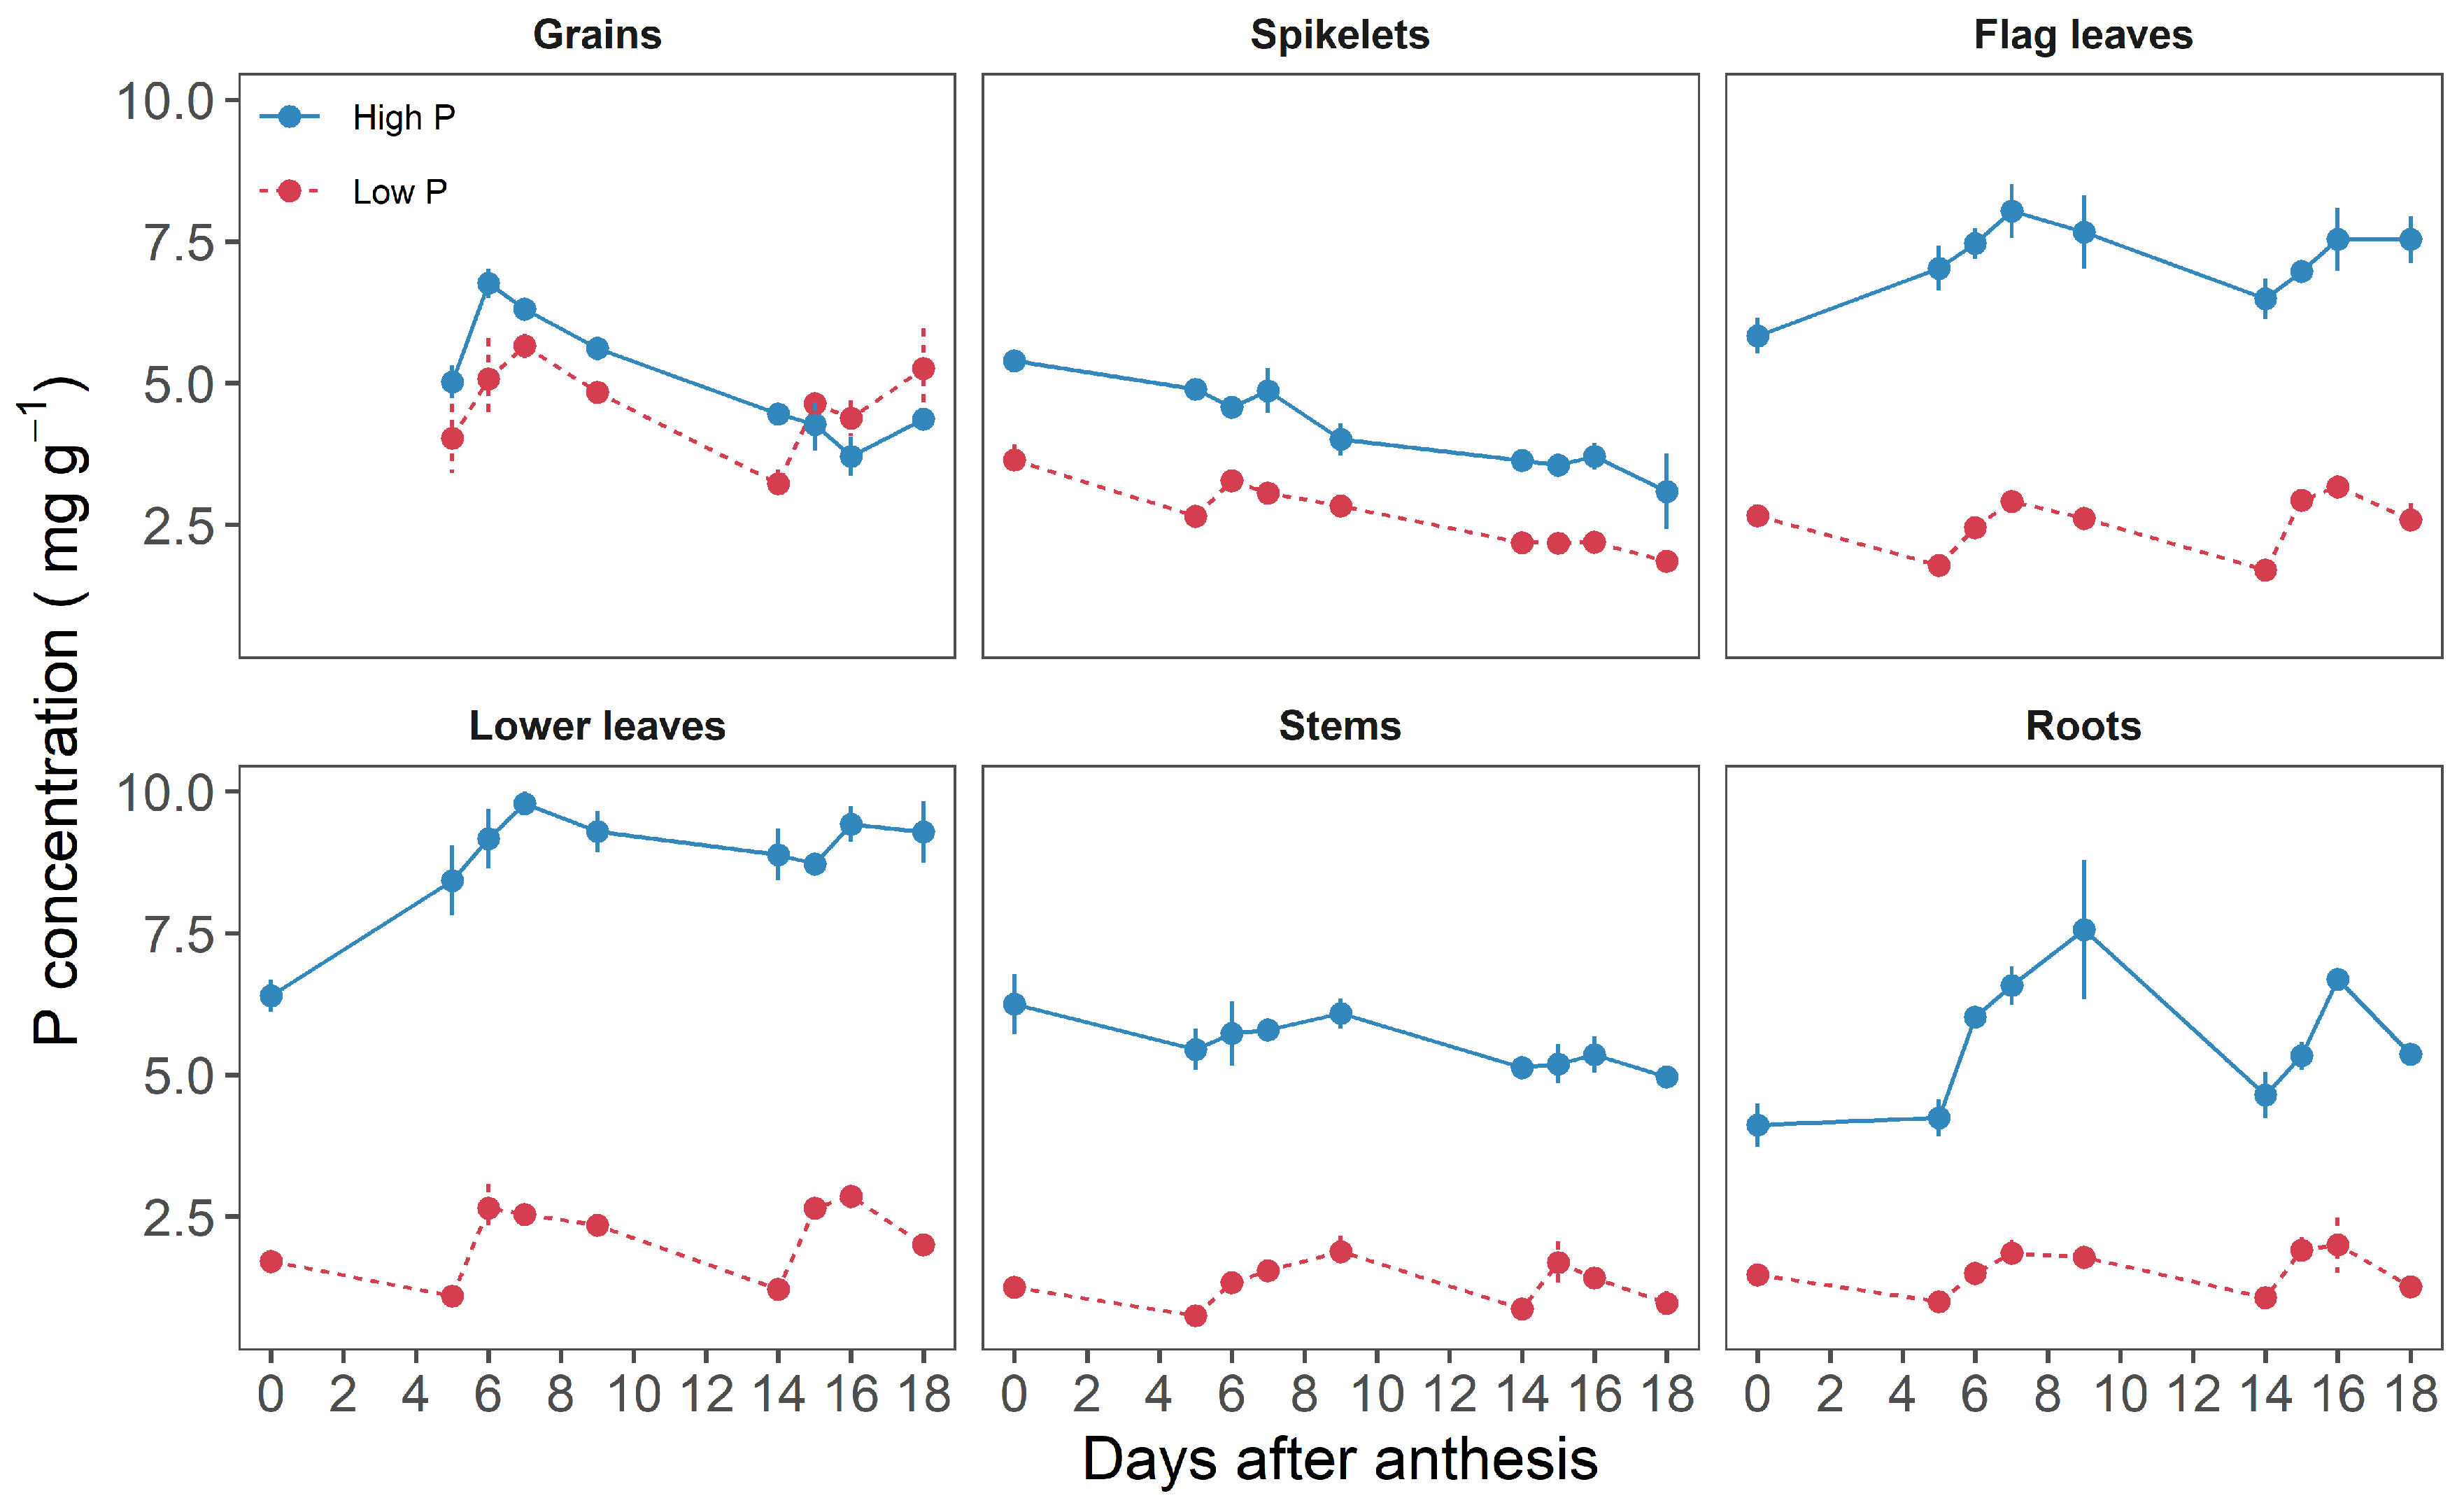
2.2. Dynamics of P Accumulation among Durum Wheat Organs
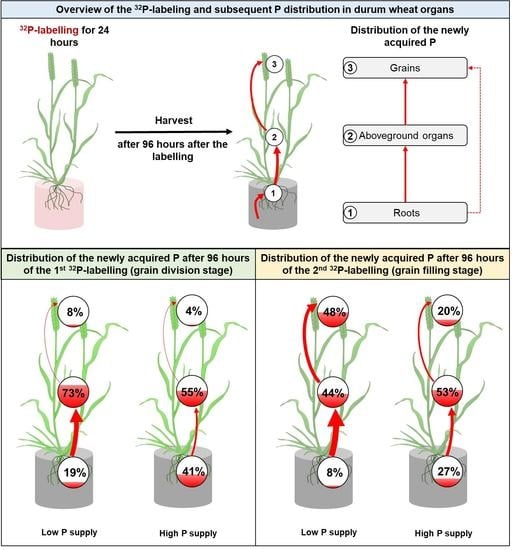
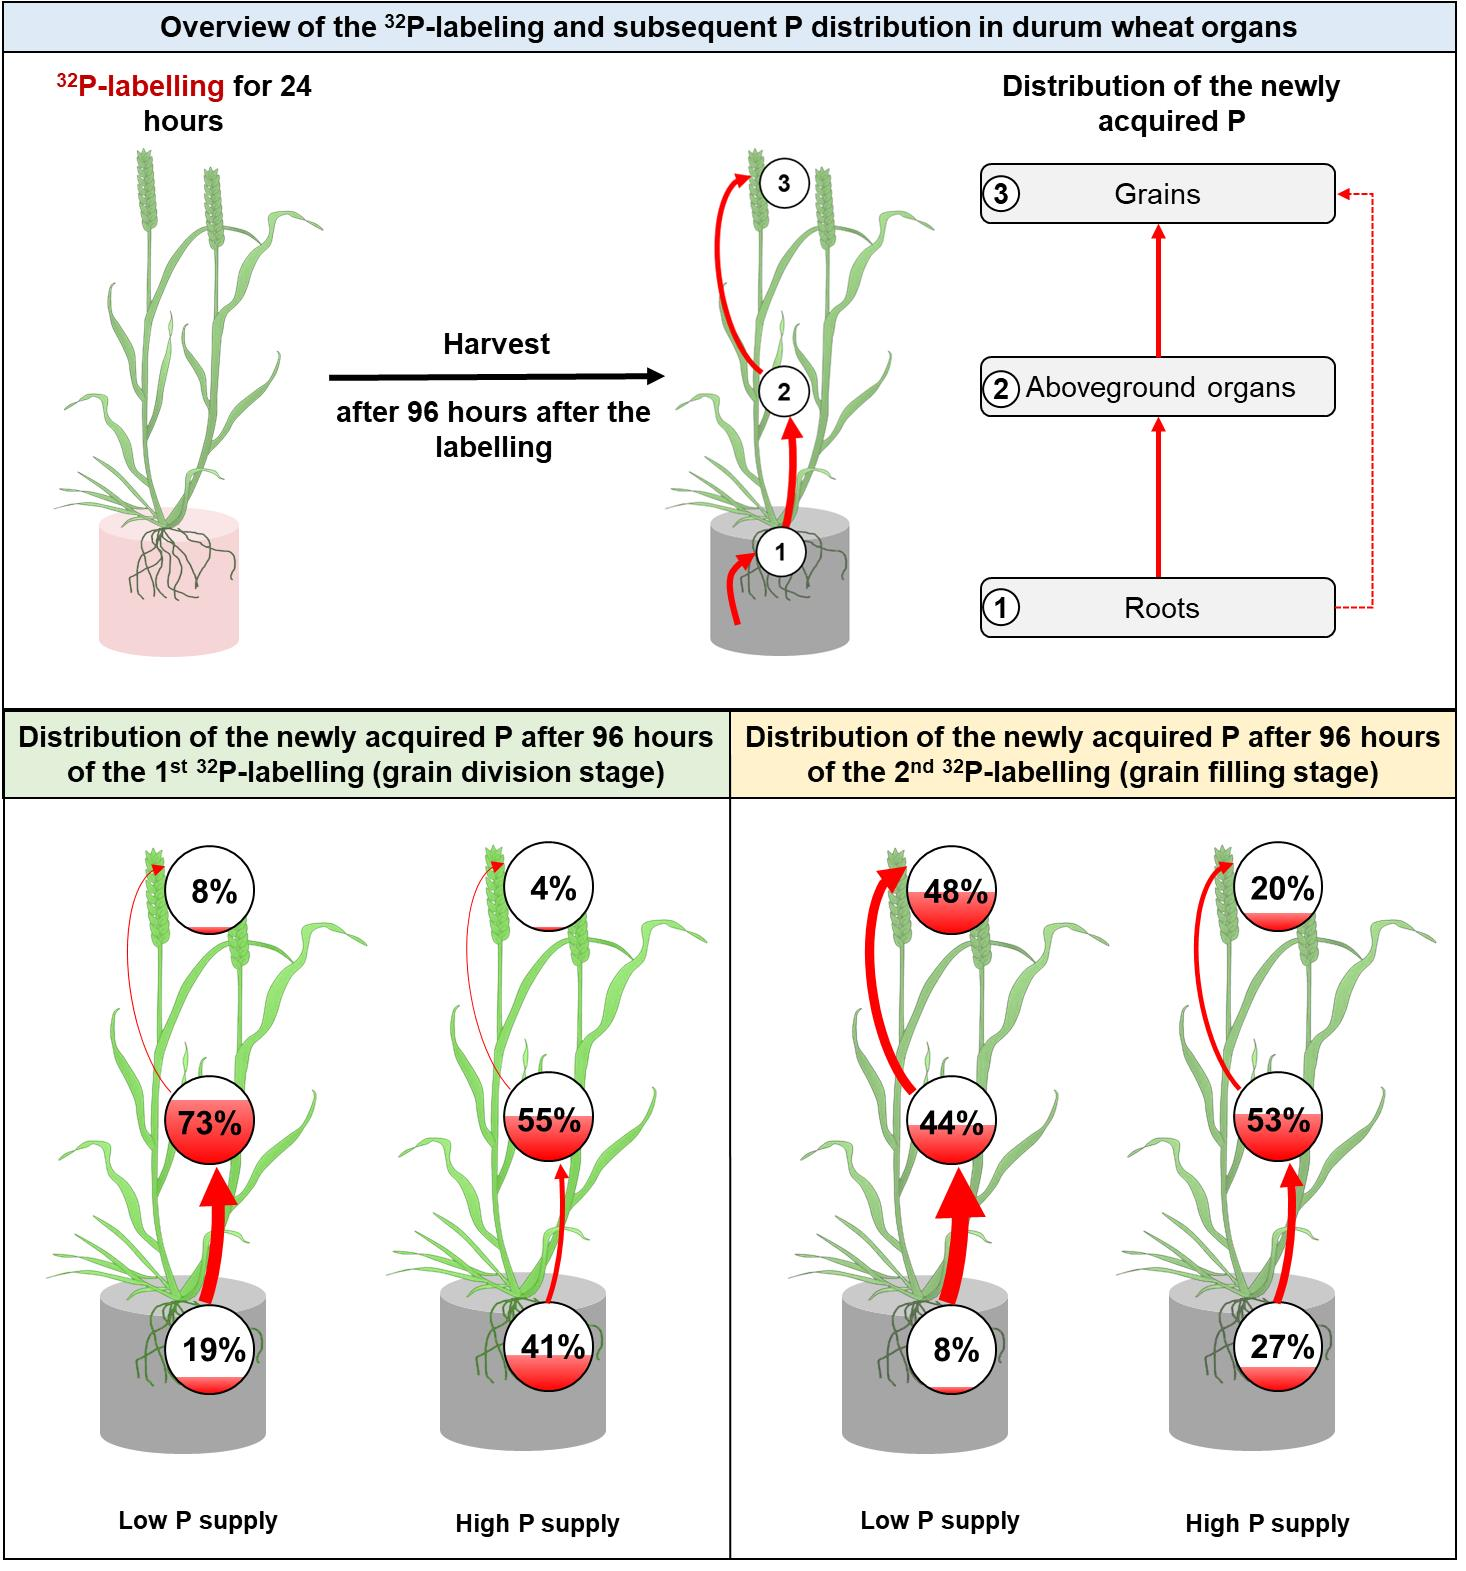
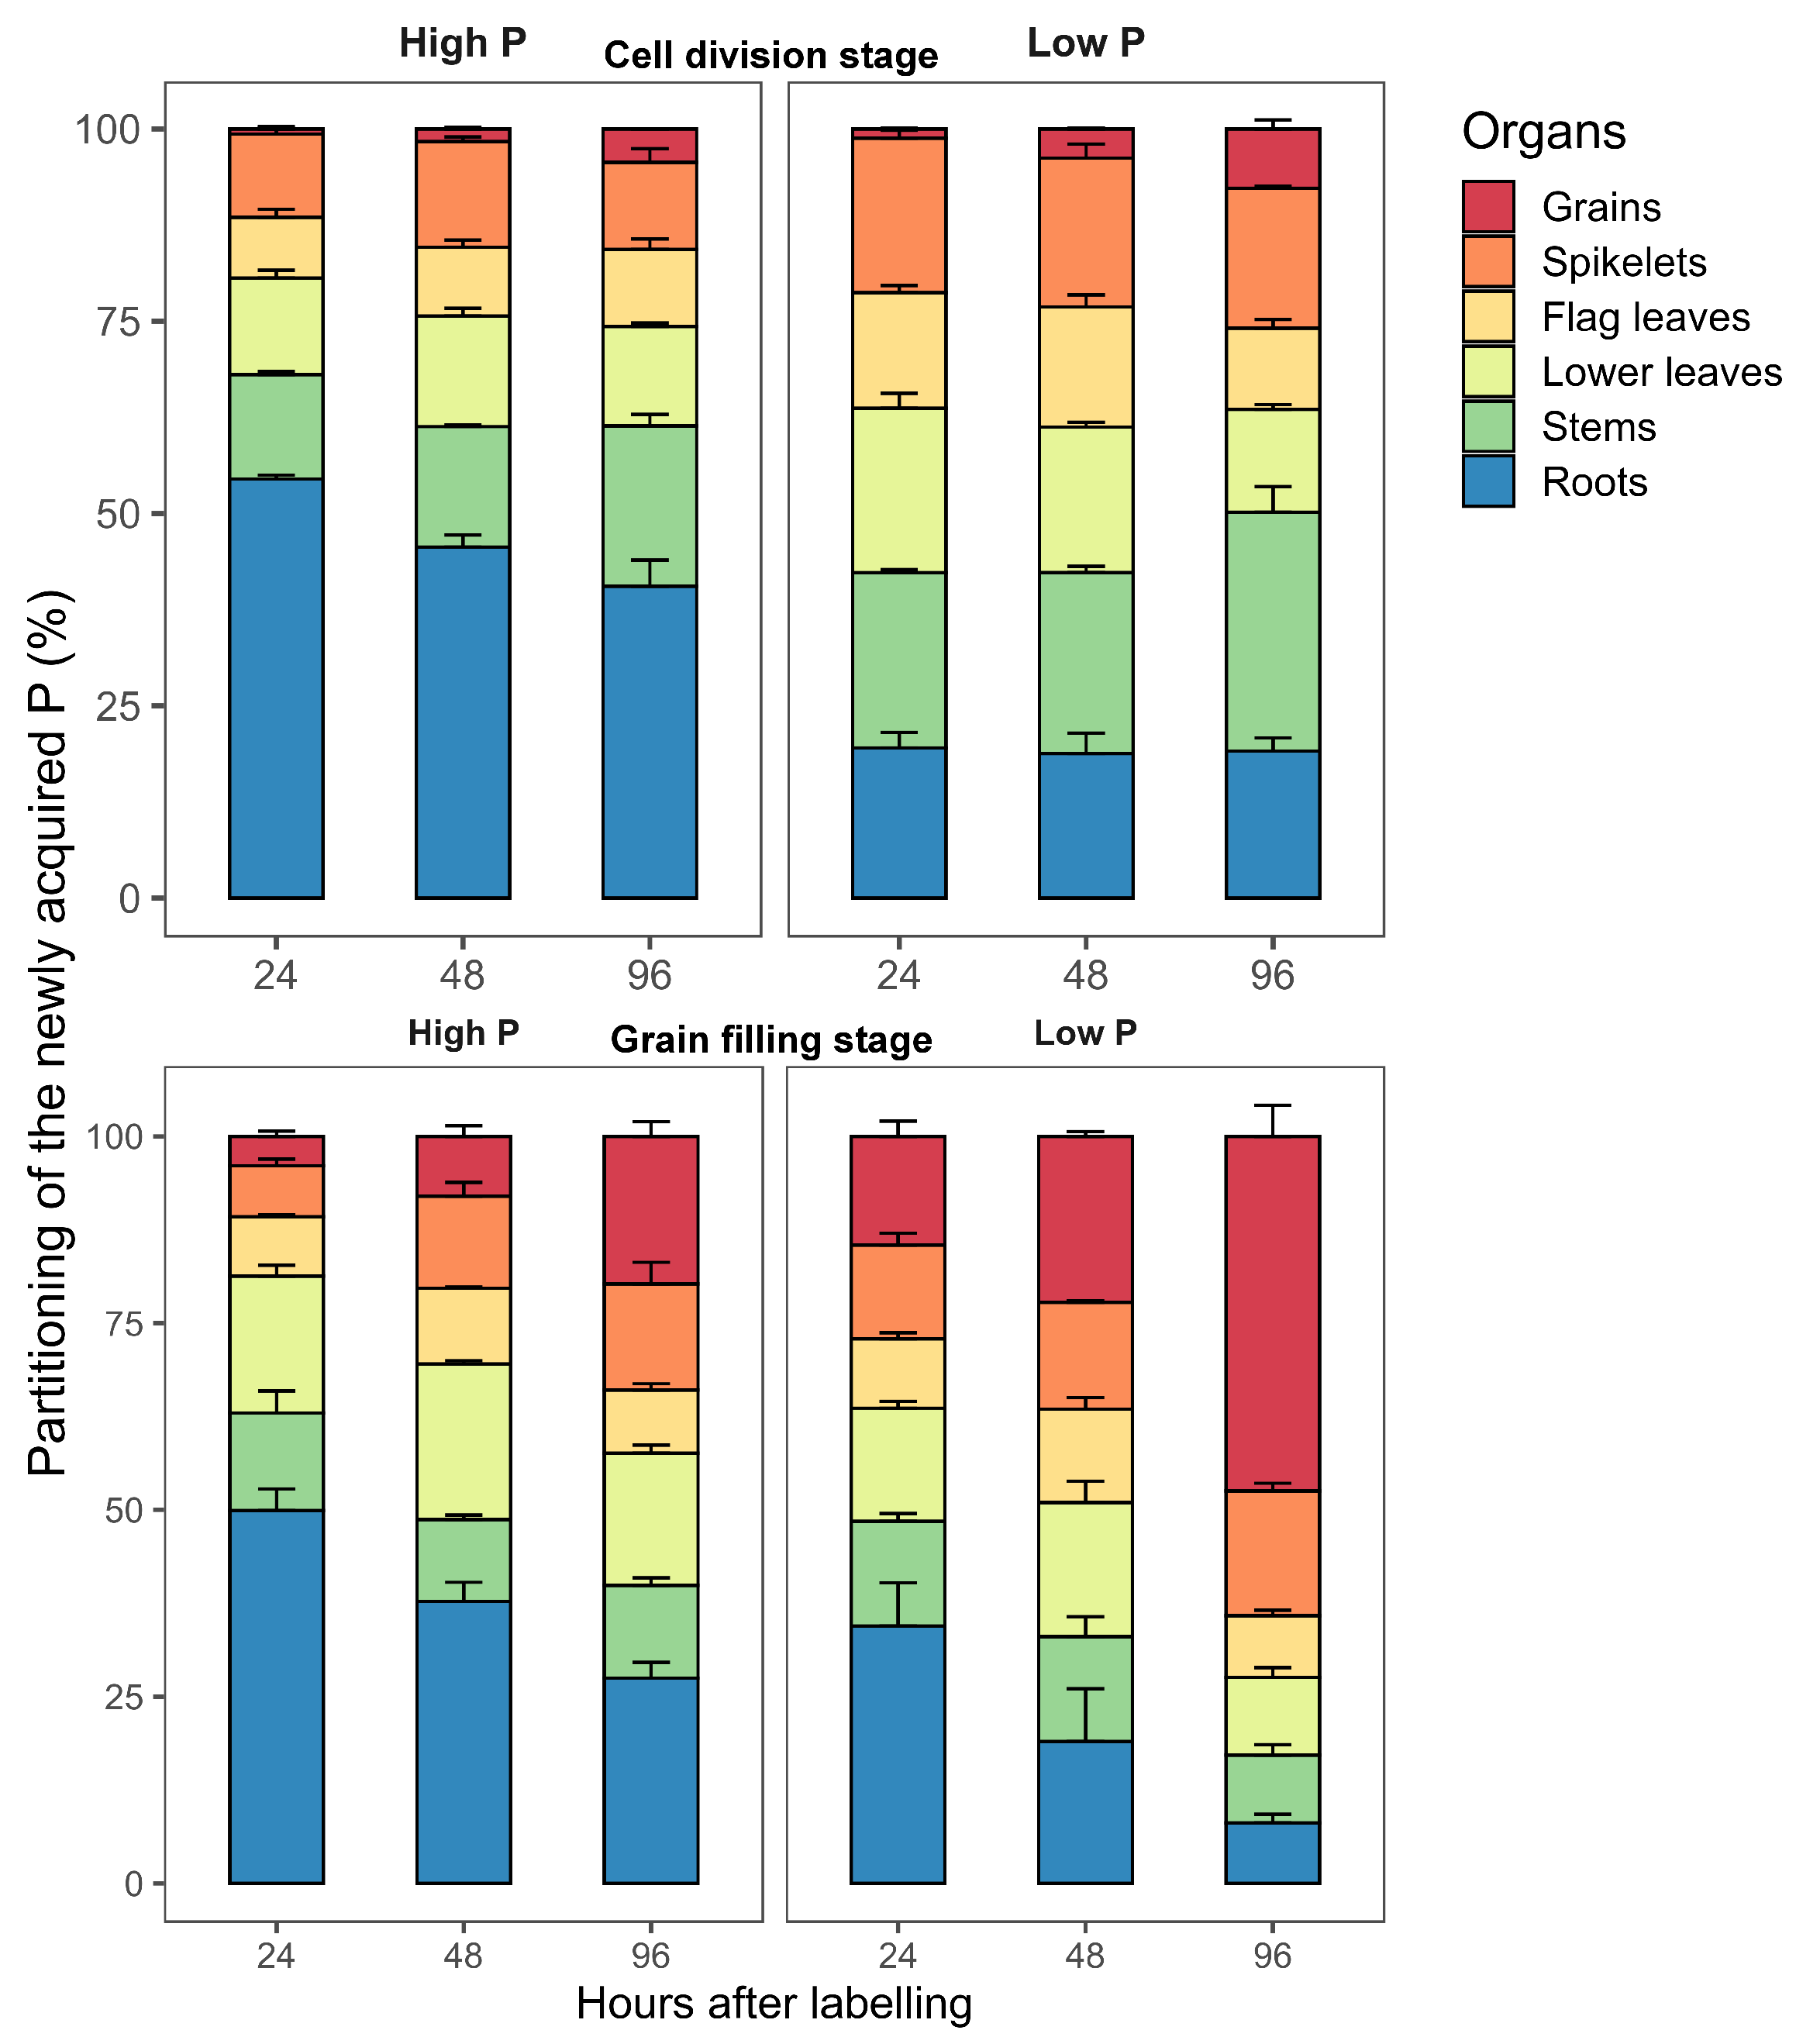
2.3. The Dynamics of the Newly Acquired P (P) during the Post-Anthesis Period
2.3.1. Partitioning of P during the Cell Division Stage
2.3.2. Partitioning of P P during the Grain Filling Stage
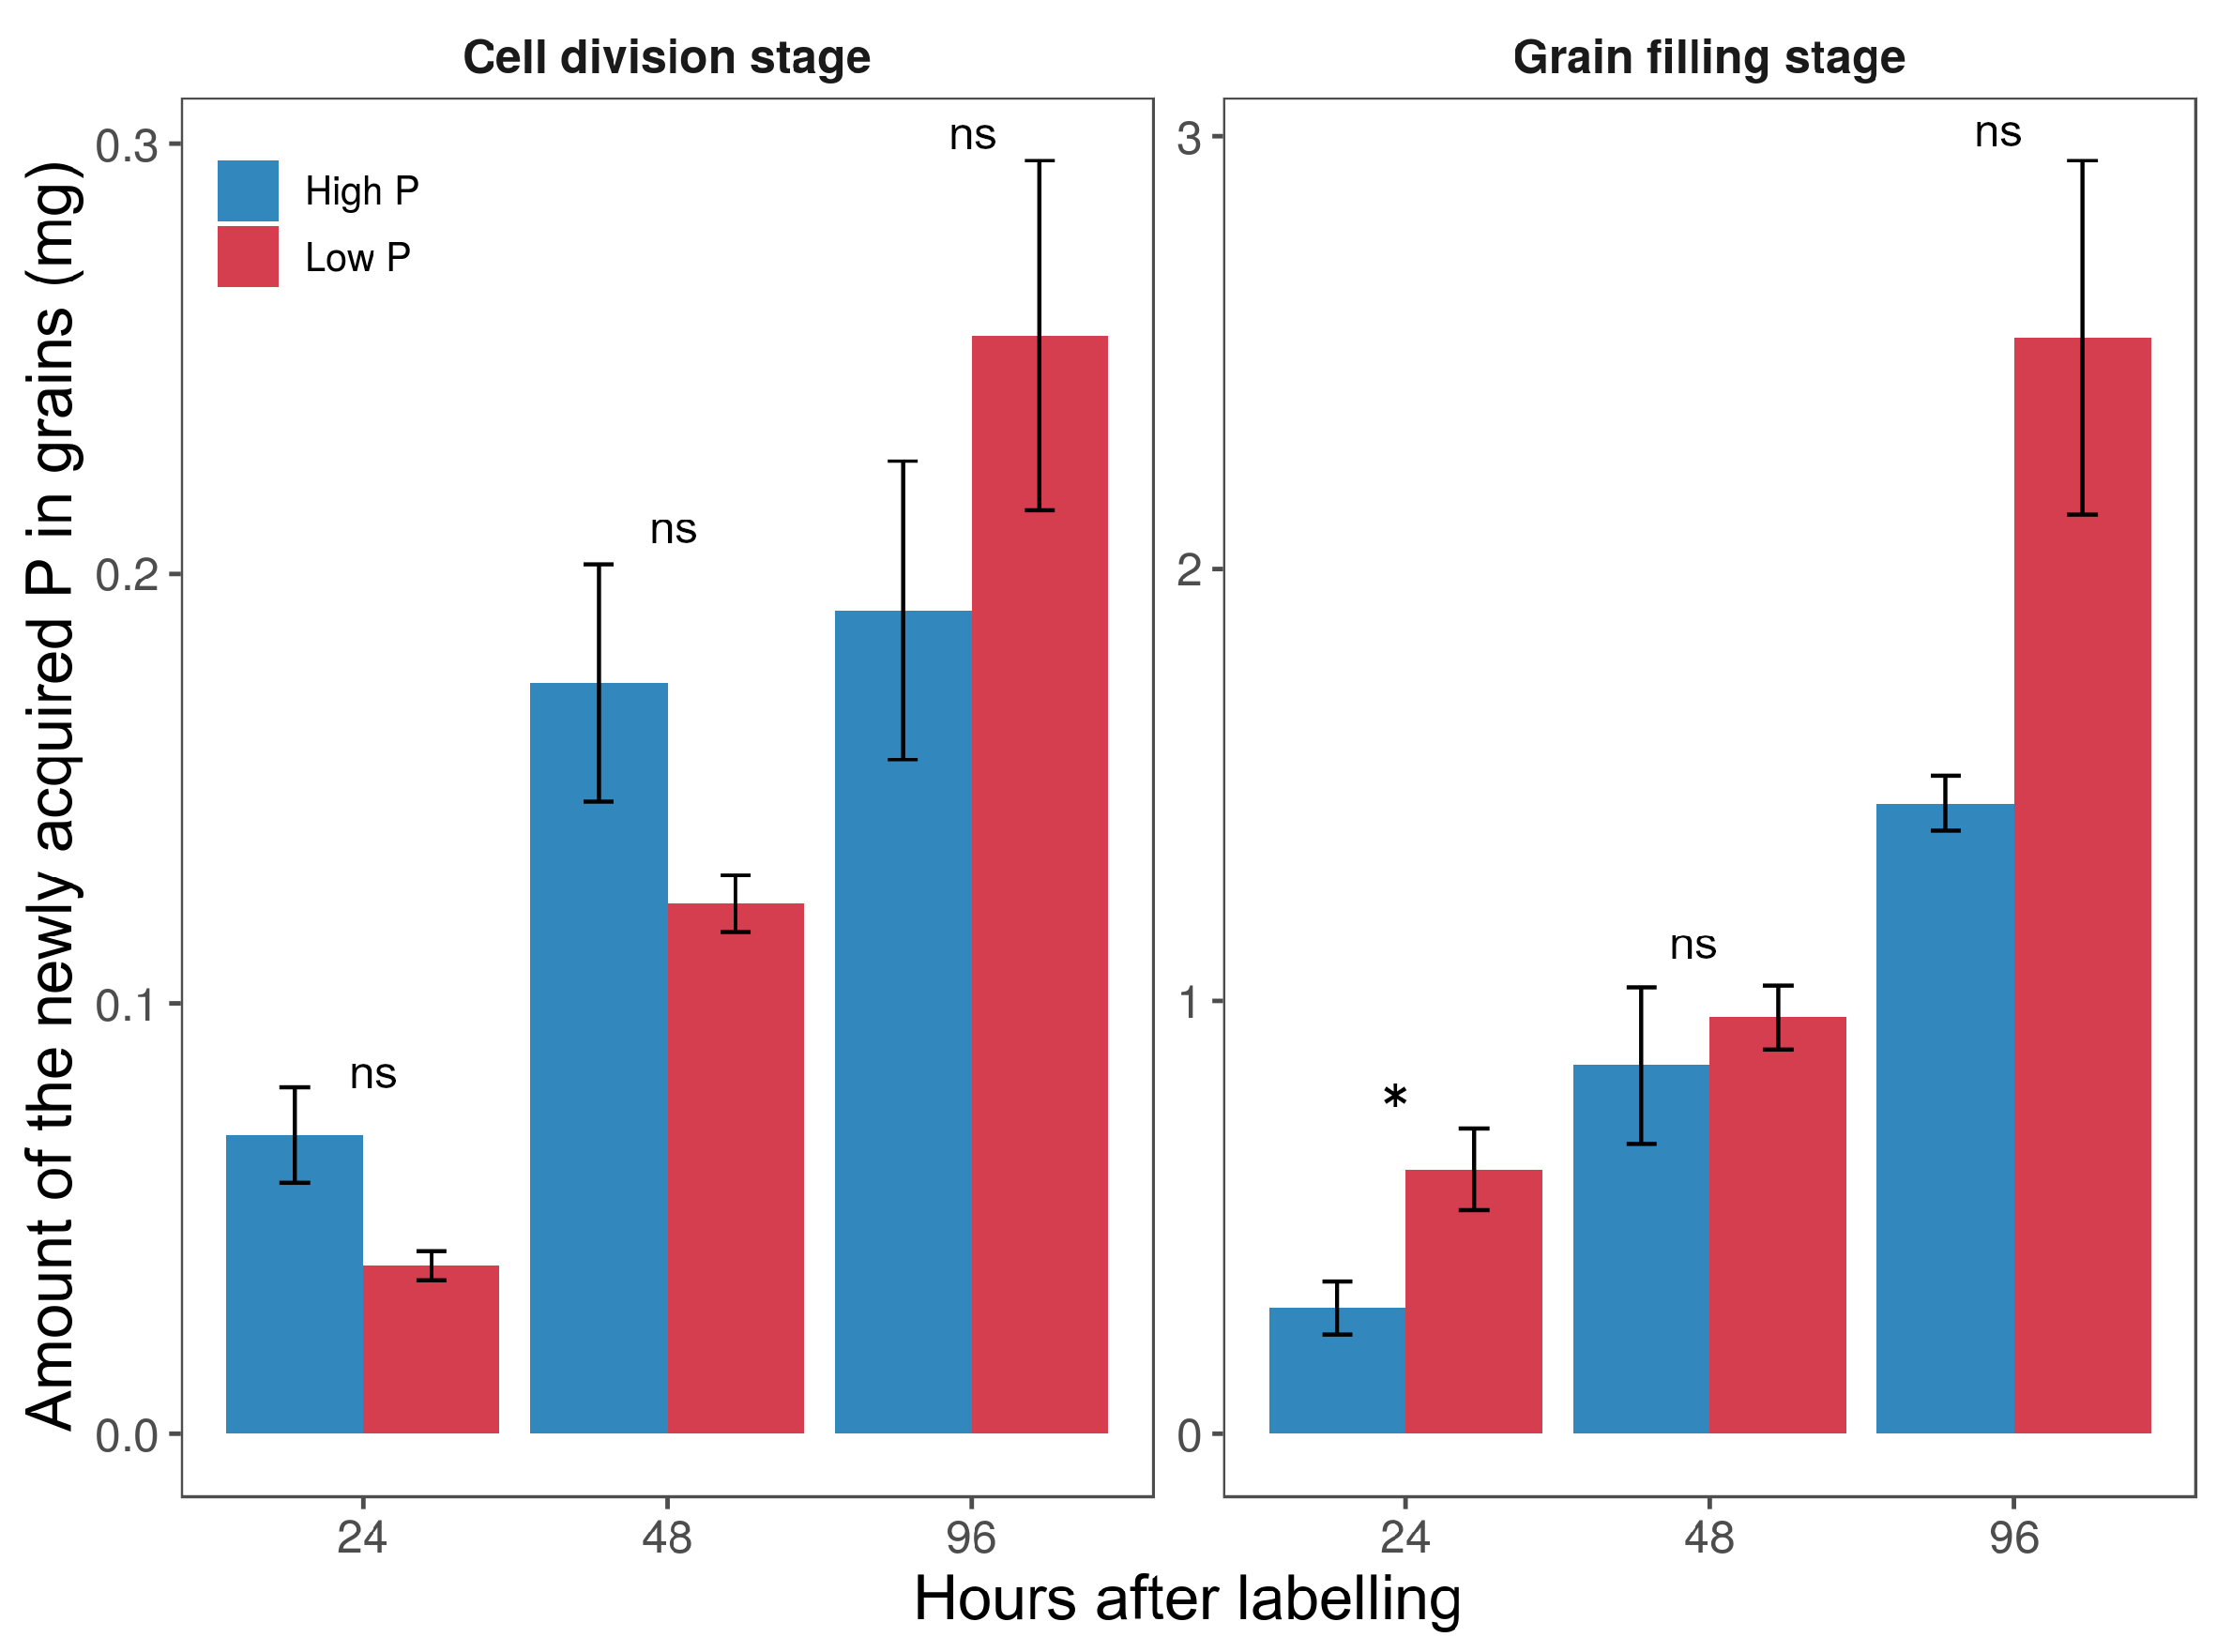
2.4. Phosphorus Fluxes into the Developing Grains
3. Discussion
3.1. Effects of P Status on the Partitioning of the Newly Acquired P among Plant Organs during Grain Development
3.2. The Fate of the Newly Acquired P and the Mechanisms Implicated in P Transport and Accumulation in the Grains
3.3. Routes for Lowering Grain P Accumulation in Durum Wheat and Future Perspectives
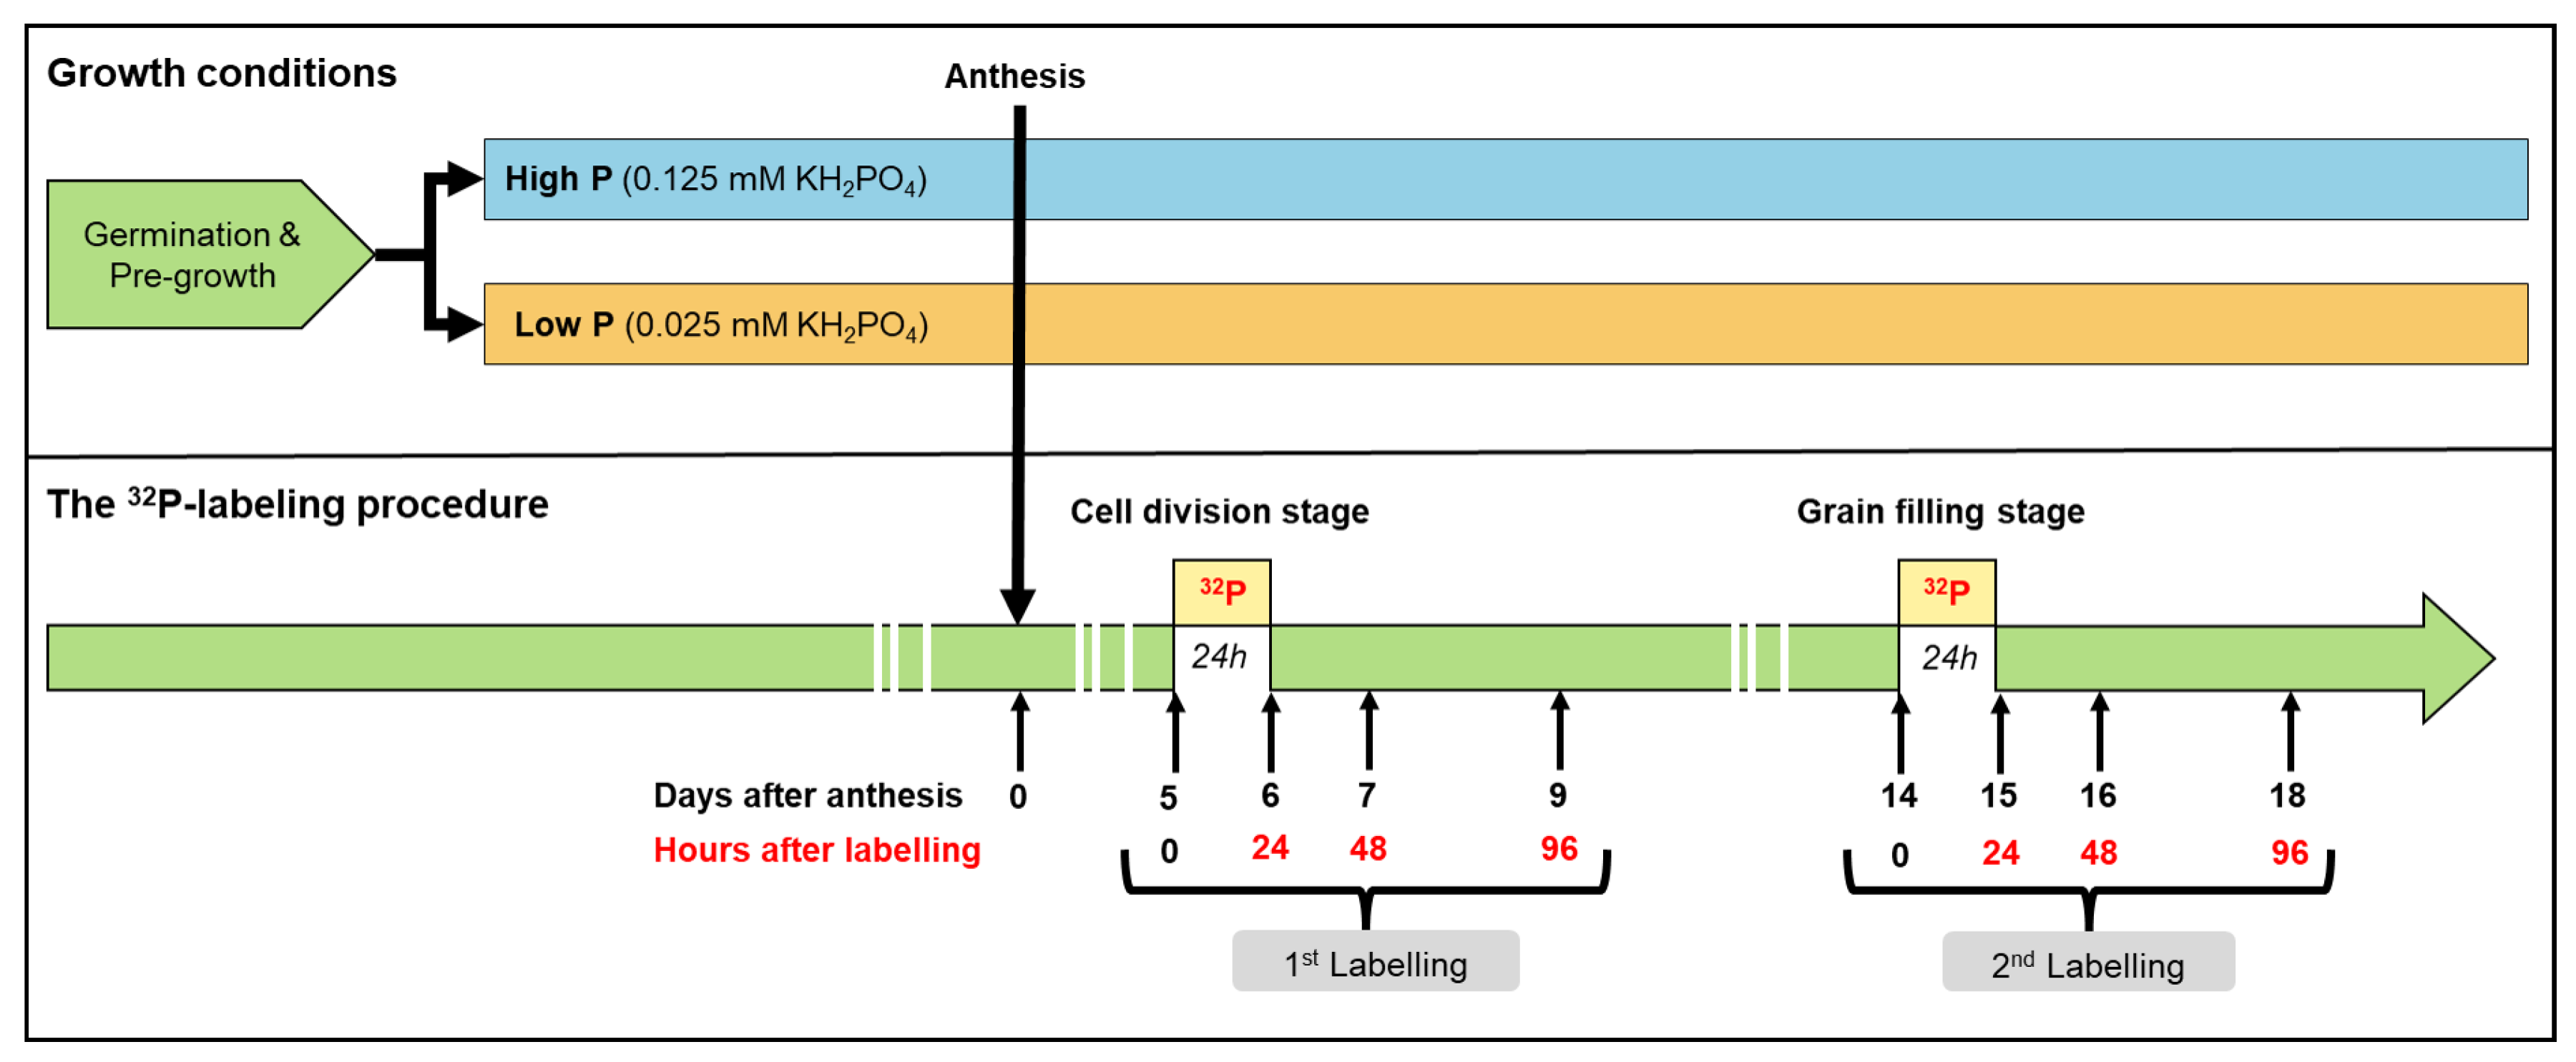
4. Materials and Methods
4.1. Plant Growth Conditions
4.2. Plant Sampling and Measurements
4.3. Plant Labeling with P
4.4. Phosphorus Concentration, P Analysis, and Partitioning Indices
4.5. Calculation of P Partitioning and Remobilization Indices
4.6. Statistical Analyses
5. Conclusions
Author Contributions
Funding
Data Availability Statement
Acknowledgments
Conflicts of Interest
References
- Marschner, H. Marschner’s Mineral Nutrition of Higher Plants; Academic Press: New York, NY, USA, 2011. [Google Scholar]
- Raghothama, K.G.; Karthikeyan, A.S. Phosphate acquisition. Plant Soil 2005, 274, 37. [Google Scholar] [CrossRef]
- Schachtman, D.P.; Reid, R.J.; Ayling, S.M. Phosphorus Uptake by Plants: From Soil to Cell. Plant Physiol. 1998, 116, 447–453. [Google Scholar] [CrossRef] [PubMed] [Green Version]
- Batten, G.D. A review of phosphorus efficiency in wheat. Plant Soil 1992, 146, 163–168. [Google Scholar] [CrossRef]
- Rose, T.J.; Pariasca-Tanaka, J.; Rose, M.T.; Fukuta, Y.; Wissuwa, M. Genotypic variation in grain phosphorus concentration, and opportunities to improve P-use efficiency in rice. Field Crops Res. 2010, 119, 154–160. [Google Scholar] [CrossRef]
- Raboy, V. Approaches and challenges to engineering seed phytate and total phosphorus. Plant Sci. 2009, 177, 281–296. [Google Scholar] [CrossRef]
- Rose, T.; Liu, L.; Wissuwa, M. Improving phosphorus efficiency in cereal crops: Is breeding for reduced grain phosphorus concentration part of the solution? Front. Plant Sci. 2013, 4, 444. [Google Scholar] [CrossRef] [PubMed] [Green Version]
- Cordell, D.; White, S. Life’s bottleneck: Sustaining the world’s phosphorus for a Food secure future. Annu. Rev. Environ. Resour. 2014, 39, 161–188. [Google Scholar] [CrossRef]
- Cong, W.F.; Suriyagoda, L.D.B.; Lambers, H. Tightening the Phosphorus Cycle through Phosphorus-Efficient Crop Genotypes. Trends Plant Sci. 2020, 25, 967–975. [Google Scholar] [CrossRef] [PubMed]
- Lott, J.N.; Bojarski, M.; Kolasa, J.; Batten, G.D.; Campbell, L.C. A review of the phosphorus content of dry cereal and legume crops of the world. Int. J. Agric. Resour. Gov. Ecol. 2009, 8, 351–370. [Google Scholar] [CrossRef]
- Wang, F.; Rose, T.; Jeong, K.; Kretzschmar, T.; Wissuwa, M. The knowns and unknowns of phosphorus loading into grains, and implications for phosphorus efficiency in cropping systems. J. Exp. Bot. 2016, 67, 1221–1229. [Google Scholar] [CrossRef] [PubMed] [Green Version]
- Veneklaas, E.J.; Lambers, H.; Bragg, J.; Finnegan, P.M.; Lovelock, C.E.; Plaxton, W.C.; Price, C.A.; Scheible, W.R.; Shane, M.W.; White, P.J.; et al. Opportunities for improving phosphorus-use efficiency in crop plants. New Phytol. 2012, 195, 306–320. [Google Scholar] [CrossRef] [PubMed]
- White, P.J.; Hammond, J.P. Phosphorus nutrition of terrestrial plants. In The Ecophysiology of Plant-Phosphorus Interactions; Plant Ecophysiology; Springer: Dordrecht, The Netherlands, 2008; pp. 51–81. [Google Scholar]
- Aziz, T.; Finnegan, P.M.; Lambers, H.; Jost, R. Organ-specific phosphorus-allocation patterns and transcript profiles linked to phosphorus efficiency in two contrasting wheat genotypes. Plant Cell Environ. 2014, 37, 943–960. [Google Scholar] [CrossRef] [Green Version]
- Grant, C.A.; Flaten, D.N.; Tomasiewicz, D.J.; Sheppard, S.C. The importance of early season phosphorus nutrition. Can. J. Plant Sci. 2001, 81, 211–224. [Google Scholar] [CrossRef]
- Shewry, P.R.; Mitchell, R.A.C.; Tosi, P.; Wan, Y.; Underwood, C.; Lovegrove, A.; Freeman, J.; Toole, G.A.; Mills, E.N.C.; Ward, J.L. An integrated study of grain development of wheat (cv. Hereward). J. Cereal. Sci. 2012, 56, 21–30. [Google Scholar] [CrossRef]
- Distelfeld, A.; Avni, R.; Fischer, A.M. Senescence, nutrient remobilization, and yield in wheat and barley. J. Exp. Bot. 2014, 65, 3783–3798. [Google Scholar] [CrossRef] [PubMed] [Green Version]
- Sabelli, P.A.; Larkins, B.A. The Development of Endosperm in Grasses. Plant Physiol. 2009, 149, 14–26. [Google Scholar] [CrossRef] [Green Version]
- Masoni, A.; Ercoli, L.; Mariotti, M.; Arduini, I. Post-anthesis accumulation and remobilization of dry matter, nitrogen and phosphorus in durum wheat as affected by soil type. Eur. J. Agron. 2007, 26, 179–186. [Google Scholar] [CrossRef]
- El Mazlouzi, M.; Morel, C.; Robert, T.; Yan, B.; Mollier, A. Phosphorus uptake and partitioning in two durum wheat cultivars with contrasting biomass allocation as affected by different P supply during grain filling. Plant Soil 2020, 449, 179–192. [Google Scholar] [CrossRef]
- Manske, G.G.B.; Ortiz-Monasterio, J.I.; van Ginkel, M.; González, R.M.; Fischer, R.A.; Rajaram, S.; Vlek, P.L.G. Importance of P uptake efficiency versus P utilization for wheat yield in acid and calcareous soils in Mexico. Eur. J. Agron. 2001, 14, 261–274. [Google Scholar] [CrossRef]
- Etienne, P.; Diquelou, S.; Prudent, M.; Salon, C.; Maillard, A.; Ourry, A. Macro and micronutrient storage in plants and their remobilization when facing scarcity: The case of drought. Agriculture 2018, 8, 14. [Google Scholar] [CrossRef] [Green Version]
- Maillard, A.; Diquélou, S.; Billard, V.; Laîné, P.; Garnica, M.; Prudent, M.; Garcia-Mina, J.M.; Yvin, J.C.; Ourry, A. Leaf mineral nutrient remobilization during leaf senescence and modulation by nutrient deficiency. Front. Plant Sci. 2015, 6, 317. [Google Scholar] [CrossRef] [PubMed] [Green Version]
- Julia, C.C.; Rose, T.J.; Pariasca-Tanaka, J.; Jeong, K.; Matsuda, T.; Wissuwa, M. Phosphorus uptake commences at the earliest stages of seedling development in rice. J. Exp. Bot. 2018, 69, 5233–5240. [Google Scholar] [CrossRef] [PubMed]
- Nadeem, M.; Mollier, A.; Morel, C.; Vives, A.; Prud’homme, L.; Pellerin, S. Relative contribution of seed phosphorus reserves and exogenous phosphorus uptake to maize (Zea mays L.) nutrition during early growth stages. Plant Soil 2011, 346, 231–244. [Google Scholar] [CrossRef]
- White, P.J.; Veneklaas, E.J. Nature and nurture: The importance of seed phosphorus content. Plant Soil 2012, 357, 1–8. [Google Scholar] [CrossRef]
- Pariasca-Tanaka, J.; Vandamme, E.; Mori, A.; Segda, Z.; Saito, K.; Rose, T.J.; Wissuwa, M. Does reducing seed-P concentrations affect seedling vigor and grain yield of rice? Plant Soil 2015, 392, 253–266. [Google Scholar] [CrossRef]
- Rose, T.J.; Pariasca-Tanaka, J.; Rose, M.T.; Mori, A.; Wissuwa, M. Seeds of doubt: Re-assessing the impact of grain P concentrations on seedling vigor. J. Plant. Nutr. Soil Sci. 2012, 175, 799–804. [Google Scholar] [CrossRef]
- Guttieri, M.; Bowen, D.; Dorsch, J.A.; Raboy, V.; Souza, E. Identification and Characterization of a Low Phytic Acid Wheat. Crop Sci. 2004, 44, 418–424. [Google Scholar] [CrossRef]
- Vandamme, E.; Wissuwa, M.; Rose, T.; Dieng, I.; Drame, K.N.; Fofana, M.; Senthilkumar, K.; Venuprasad, R.; Jallow, D.; Segda, Z.; et al. Genotypic Variation in Grain P Loading across Diverse Rice Growing Environments and Implications for Field P Balances. Front. Plant Sci. 2016, 7, 1435. [Google Scholar] [CrossRef] [PubMed] [Green Version]
- Lorenz, A.J.; Scott, M.P.; Lamkey, K.R. Genetic Variation and Breeding Potential of Phytate and Inorganic Phosphorus in a Maize Population. Crop Sci. 2008, 48, 79–84. [Google Scholar] [CrossRef] [Green Version]
- Dissanayaka, D.M.S.B.; Plaxton, W.C.; Lambers, H.; Siebers, M.; Marambe, B.; Wasaki, J. Molecular mechanisms underpinning phosphorus-use efficiency in rice. Plant Cell Environ. 2018, 41, 1483–1496. [Google Scholar] [CrossRef] [PubMed]
- Raboy, V. Low phytic acid Crops: Observations Based On Four Decades of Research. Plants 2020, 9, 140. [Google Scholar] [CrossRef] [PubMed] [Green Version]
- Yamaji, N.; Takemoto, Y.; Miyaji, T.; Mitani-Ueno, N.; Yoshida, K.T.; Ma, J.F. Reducing phosphorus accumulation in rice grains with an impaired transporter in the node. Nature 2017, 541, 92–95. [Google Scholar] [CrossRef]
- Julia, C.; Wissuwa, M.; Kretzschmar, T.; Jeong, K.; Rose, T. Phosphorus uptake, partitioning and redistribution during grain filling in rice. Ann. Bot. 2016, 118, 1151–1162. [Google Scholar] [CrossRef] [PubMed] [Green Version]
- Havé, M.; Marmagne, A.; Chardon, F.; Masclaux-Daubresse, C. Nitrogen remobilization during leaf senescence: Lessons from Arabidopsis to crops. J. Exp. Bot. 2017, 68, 2513–2529. [Google Scholar] [CrossRef] [PubMed]
- Salon, C.; Avice, J.C.; Colombié, S.; Dieuaide-Noubhani, M.; Gallardo, K.; Jeudy, C.; Ourry, A.; Prudent, M.; Voisin, A.S.; Rolin, D. Fluxomics links cellular functional analyses to whole-plant phenotyping. J. Exp. Bot. 2017, 68, 2083–2098. [Google Scholar] [CrossRef] [PubMed]
- Dubousset, L.; Etienne, P.; Avice, J.C. Is the remobilization of S and N reserves for seed filling of winter oilseed rape modulated by sulphate restrictions occurring at different growth stages? J. Exp. Bot. 2010, 61, 4313–4324. [Google Scholar] [CrossRef]
- Schiltz, S.; Munier-Jolain, N.; Jeudy, C.; Burstin, J.; Salon, C. Dynamics of Exogenous Nitrogen Partitioning and Nitrogen Remobilization from Vegetative Organs in Pea Revealed by 15N in Vivo Labeling throughout Seed Filling. Plant Physiol. 2005, 137, 1463–1473. [Google Scholar] [CrossRef] [Green Version]
- Hawkesford, M.J.; Buchner, P.; Riche, A.B. Nutrient Dynamics in Wheat. In Annual Plant Reviews Online; John Wiley & Sons, Ltd.: New York, NY, USA, 2018; pp. 705–718. [Google Scholar]
- El Mazlouzi, M.; Morel, C.; Chesseron, C.; Robert, T.; Mollier, A. Contribution of External and Internal Phosphorus Sources to Grain P Loading in Durum Wheat (Triticum durum L.) Grown Under Contrasting P Levels. Front. Plant Sci. 2020, 11, 870. [Google Scholar] [CrossRef]
- Harris, N.S.; Taylor, G.J. Cadmium uptake and partitioning in durum wheat during grain filling. BMC Plant Biol. 2013, 13, 103. [Google Scholar] [CrossRef] [Green Version]
- Jeong, K.; Baten, A.; Waters, D.L.E.; Pantoja, O.; Julia, C.C.; Wissuwa, M.; Heuer, S.; Kretzschmar, T.; Rose, T.J. Phosphorus remobilization from rice flag leaves during grain filling: An RNA-seq study. Plant Biotechnol. J. 2017, 15, 15–26. [Google Scholar] [CrossRef] [Green Version]
- Sanchez-Bragado, R.; Molero, G.; Reynolds, M.P.; Araus, J.L. Photosynthetic contribution of the ear to grain filling in wheat: A comparison of different methodologies for evaluation. J. Exp. Bot. 2016, 67, 2787–2798. [Google Scholar] [CrossRef] [PubMed]
- Wang, L.; Chen, F.; Zhang, F.; Mi, G. Two strategies for achieving higher yield under phosphorus deficiency in winter wheat grown in field conditions. Field Crops Res. 2010, 118, 36–42. [Google Scholar] [CrossRef]
- Jeong, K.; Julia, C.C.; Waters, D.L.E.; Pantoja, O.; Wissuwa, M.; Heuer, S.; Liu, L.; Rose, T.J. Remobilisation of phosphorus fractions in rice flag leaves during grain filling: Implications for photosynthesis and grain yields. PLoS ONE 2017, 12, e0187521. [Google Scholar] [CrossRef] [PubMed]
- Lyu, Y.; Tang, H.; Li, H.; Zhang, F.; Rengel, Z.; Whalley, W.R.; Shen, J. Major Crop Species Show Differential Balance between Root Morphological and Physiological Responses to Variable Phosphorus Supply. Front. Plant Sci. 2016, 7, 1939. [Google Scholar] [CrossRef] [PubMed]
- Marschner, H.; Kirkby, E.A.; Cakmak, I. Effect of mineral nutritional status on shoot-root partitioning of photoassimilates and cycling of mineral nutrients. J. Exp. Bot. 1996, 47, 1255–1263. [Google Scholar] [CrossRef]
- Wissuwa, M.; Gamat, G.; Ismail, A.M. Is root growth under phosphorus deficiency affected by source or sink limitations? J. Exp. Bot. 2005, 56, 1943–1950. [Google Scholar] [CrossRef] [Green Version]
- Snapp, S.S.; Lynch, J.P. Phosphorus distribution and remobilization in bean plants as influenced by phosphorus nutrition. Crop Sci. 1996, 36, 929–935. [Google Scholar] [CrossRef]
- Palmer, L.J.; Stangoulis, J.C.R. Changes in the Elemental and Metabolite Profile of Wheat Phloem Sap during Grain Filling Indicate a Dynamic between Plant Maturity and Time of Day. Metabolites 2018, 8, 53. [Google Scholar] [CrossRef] [Green Version]
- Stomph, T.; Jiang, W.; Struik, P.C. Zinc biofortification of cereals: Rice differs from wheat and barley. Trends Plant Sci. 2009, 14, 123–124. [Google Scholar] [CrossRef]
- Hüve, K.; Merbach, W.; Remus, R.; Lüttschwager, D.; Wittenmayer, L.; Hertel, K.; Schurr, U. Transport of phosphorus in leaf veins of Vicia faba L. J. Plant Nutr. Soil Sci. 2007, 170, 14–23. [Google Scholar] [CrossRef]
- Rausch, C.; Bucher, M. Molecular mechanisms of phosphate transport in plants. Planta 2002, 216, 23–37. [Google Scholar] [CrossRef] [PubMed]
- Salon, C.; Avice, J.C.J.C.; Larmure, A.; Ourry, A.; Prudent, M.; Voisin, A.S. Plant N Fluxes and Modulation by Nitrogen, Heat and Water Stresses. In Abiotic Stress in Plants: Mechanisms and Adaptations; IntechOpen: London, UK, 2011; pp. 80–98. [Google Scholar] [CrossRef] [Green Version]
- Yamaji, N.; Ma, J.F. The node, a hub for mineral nutrient distribution in graminaceous plants. Trends Plant Sci. 2014, 19, 556–563. [Google Scholar] [CrossRef]
- Irfan, M.; Aziz, T.; Maqsood, M.A.; Bilal, H.M.; Siddique, K.H.M.; Xu, M. Phosphorus (P) use efficiency in rice is linked to tissue-specific biomass and P allocation patterns. Sci. Rep. 2020, 10, 4278. [Google Scholar] [CrossRef] [PubMed] [Green Version]
- Peng, Z.; Li, C. Transport and partitioning of phosphorus in wheat as affected by P withdrawal during flag-leaf expansion. Plant Soil 2005, 268, 1–11. [Google Scholar] [CrossRef]
- Rose, T.J.; Rengel, Z.; Ma, Q.; Bowden, J.W. Differential accumulation patterns of phosphorus and potassium by canola cultivars compared to wheat. J. Plant Nutr. Soil Sci. 2007, 170, 404–411. [Google Scholar] [CrossRef]
- Yang, S.Y.; Huang, T.K.; Kuo, H.F.; Chiou, T.J. Role of vacuoles in phosphorus storage and remobilization. J. Exp. Bot. 2017, 68, 3045–3055. [Google Scholar] [CrossRef]
- Kisko, M.; Shukla, V.; Kaur, M.; Bouain, N.; Chaiwong, N.; Lacombe, B.; Pandey, A.K.; Rouached, H. Phosphorus Transport in Arabidopsis and Wheat: Emerging Strategies to Improve P Pool in Seeds. Agriculture 2018, 8, 27. [Google Scholar] [CrossRef] [Green Version]
- Stigter, K.A.; Plaxton, W.C. Molecular Mechanisms of Phosphorus Metabolism and Transport during Leaf Senescence. Plants 2015, 4, 773–798. [Google Scholar] [CrossRef] [Green Version]
- Iwai, T.; Takahashi, M.; Oda, K.; Terada, Y.; Yoshida, K.T. Dynamic changes in the distribution of minerals in relation to phytic acid accumulation during rice seed development. Plant Physiol. 2012, 160, 2007–2014. [Google Scholar] [CrossRef] [Green Version]
- Kutman, U.B.; Kutman, B.Y.; Ceylan, Y.; Ova, E.A.; Cakmak, I. Contributions of root uptake and remobilization to grain zinc accumulation in wheat depending on post-anthesis zinc availability and nitrogen nutrition. Plant Soil 2012, 361, 177–187. [Google Scholar] [CrossRef]
- Kichey, T.; Hirel, B.; Heumez, E.; Dubois, F.; Le Gouis, J. In winter wheat (Triticum aestivum L.), post-anthesis nitrogen uptake and remobilisation to the grain correlates with agronomic traits and nitrogen physiological markers. Field Crops Res. 2007, 102, 22–32. [Google Scholar] [CrossRef]
- Waters, B.M.; Uauy, C.; Dubcovsky, J.; Grusak, M.A. Wheat (Triticum aestivum) NAM proteins regulate the translocation of iron, zinc, and nitrogen compounds from vegetative tissues to grain. J. Exp. Bot. 2009, 60, 4263–4274. [Google Scholar] [CrossRef] [PubMed] [Green Version]
- Pearce, S.; Tabbita, F.; Cantu, D.; Buffalo, V.; Avni, R.; Vazquez-Gross, H.; Zhao, R.; Conley, C.J.; Distelfeld, A.; Dubcovksy, J. Regulation of Zn and Fe transporters by the GPC1gene during early wheat monocarpic senescence. BMC Plant Biol. 2014, 14, 368. [Google Scholar] [CrossRef] [PubMed] [Green Version]
- Baxter, I. Ionomics: Studying the social network of mineral nutrients. Curr. Opin. Plant Biol. 2009, 12, 381–386. [Google Scholar] [CrossRef] [Green Version]
- Van Veldhoven, P.P.; Mannaerts, G.P. Inorganic and organic phosphate measurements in the nanomolar range. Anal. Biochem. 1987, 161, 45–48. [Google Scholar] [CrossRef]
- Morel, C.; Fardeau, J.C. Uptake of phosphate from soils and fertilizers as affected by soil P availability and solubility of phosphorus fertilizers. Plant Soil 1990, 121, 217–224. [Google Scholar] [CrossRef]
- R Core Team. R: A Language and Environment for Statistical Computing; R Core Team: Vienna, Austria, 2018. [Google Scholar]


| Total Amount of Exogenous P (mg plant) | |||
|---|---|---|---|
| Labeling | HAL | High P | Low P |
| First P-labeling (grain division stage) | 24 h | 11.3 ± 2.5 | 3.2 ± 0.1 * |
| 48 h | 11.3 ± 2.5 | 3.2 ± 0.1 * | |
| 96 h | 4.4 ± 0.8 | 3.3 ± 0.1 | |
| Second P-labeling (grain filling stage) | 24 h | 8 ± 2.7 | 4.2 ± 0.1 |
| 48 h | 11.2 ± 2.5 | 4.3 ± 0.2 | |
| 96 h | 7.6 ± 1.2 | 5.3 ± 0.4 | |
| Labeling | P Indexes | DAA (HAL) | High P | Low P |
|---|---|---|---|---|
| First P-labeling (grain division stage) | PHI (%) | 6 (24 h) | 1.7 | 2.4 |
| 7 (48 h) | 2.6 | 5.3 ** | ||
| 9 (96 h) | 4.9 | 8.7 * | ||
| PHI (%) | 6 (24 h) | 0.6 | 1.2 * | |
| 7 (48 h) | 1.5 | 3.7 ** | ||
| 9 (96 h) | 4.3 | 7.9 * | ||
| Contribution of the P to total grain P (%) | 6 (24 h) | 6.6 | 7.5 | |
| 7 (48 h) | 9.7 | 9.1 | ||
| 9 (96 h) | 5.6 | 11.4 ** | ||
| Second P-labeling (grain filling stage) | PHI (%) | 15 (24 h) | 10 | 34.3 ** |
| 16 (48 h) | 10.7 | 35.1 ** | ||
| 18 (96 h) | 19 | 50.5 ** | ||
| PHI (%) | 15 (24 h) | 3.6 | 14.6 ** | |
| 16 (48 h) | 7.6 | 22.2 *** | ||
| 18 (96 h) | 19.2 | 48.0 ** | ||
| Contribution of the P to total grain P (%) | 15 (24 h) | 3.2 | 4.1 | |
| 16 (48 h) | 7.4 | 6.3 | ||
| 18 (96 h) | 6.8 | 10.0 |
Publisher’s Note: MDPI stays neutral with regard to jurisdictional claims in published maps and institutional affiliations. |
© 2022 by the authors. Licensee MDPI, Basel, Switzerland. This article is an open access article distributed under the terms and conditions of the Creative Commons Attribution (CC BY) license (https://creativecommons.org/licenses/by/4.0/).
Share and Cite
El Mazlouzi, M.; Morel, C.; Robert, T.; Chesseron, C.; Salon, C.; Cornu, J.-Y.; Mollier, A. The Dynamics of Phosphorus Uptake and Remobilization during the Grain Development Period in Durum Wheat Plants. Plants 2022, 11, 1006. https://doi.org/10.3390/plants11081006
El Mazlouzi M, Morel C, Robert T, Chesseron C, Salon C, Cornu J-Y, Mollier A. The Dynamics of Phosphorus Uptake and Remobilization during the Grain Development Period in Durum Wheat Plants. Plants. 2022; 11(8):1006. https://doi.org/10.3390/plants11081006
Chicago/Turabian StyleEl Mazlouzi, Mohamed, Christian Morel, Thierry Robert, Coralie Chesseron, Christophe Salon, Jean-Yves Cornu, and Alain Mollier. 2022. "The Dynamics of Phosphorus Uptake and Remobilization during the Grain Development Period in Durum Wheat Plants" Plants 11, no. 8: 1006. https://doi.org/10.3390/plants11081006