Article

Deciphering the Genetic Inheritance of Tocopherols in Indian Mustard (Brassica juncea L. Czern and Coss)

1
Division of Genetics, ICAR—Indian Agricultural Research Institute, New Delhi 110012, India
2
Division of Seed Science and Technology, ICAR—Indian Agricultural Research Institute, New Delhi 110012, India
*
Author to whom correspondence should be addressed.
Plants 2022, 11(13), 1779; https://doi.org/10.3390/plants11131779
Submission received: 7 March 2022 / Revised: 15 June 2022 / Accepted: 30 June 2022 / Published: 5 July 2022
(This article belongs to the Special Issue Development and Genetic Improvement in Brassica Crops)

Abstract

:
Tocopherol is vital for the nutritional value and stability of Indian mustard (Brassica juncea L. Czern and Coss) oil; nonetheless, the lack of information on genetic control is hampering its improvement. In this study, six populations (P1, P2, F1, F2, BC1P1, and BC1P2) of RLC3 × NPJ203 were evaluated in a family block design to evaluate the inheritance pattern, gene effects, and various other genetic parameters of tocopherol content (α, γ, and total), using generation mean analysis. The comparison of direct and reciprocal crosses indicated that the tocopherol content was not influenced by maternal inheritance. Negative directional heterosis showed that ATC, GTC, and TTC are governed by recessive genes. Potence ratio and degree of dominance highlighted an over-dominance type of gene interaction for GTC and TTC, whereas ATC was governed by epistatic interactions. Furthermore, the six-parameter model revealed a duplicate gene action for α-tocopherol content. Broad and narrow sense heritability coupled with genetic advances were high.

1. Introduction

Tocopherols are essential micronutrients for humans and mammals [1] that are synthesized only by plants, a few cyanobacteria, and green algae [2]. Oilseed crops are the richest source of naturally occurring tocopherols [1]. The most potent fat-soluble antioxidants existing in nature, tocopherols, occur in four naturally occurring forms (α, β, γ, and δ), varying in the number and position of methyl groups on the chromanol ring [2]. The most abundant tocopherols (vitamin E) in Brassica oil are α-tocopherol (ATC) and γ-tocopherol (GTC), as well as a small proportion of δ-tocopherol (DTC) [3,4,5]. The ATC is considered to have the highest nutritional value for humans and livestock [6,7]. Owing to its health benefits, improving the composition of vitamin E and increasing the ATC in staple crops, including oilseed crops, has been a major crop breeding objective [8]. Seeds of rapeseed vary widely in terms of their tocopherol content, ranging from 182 to 367 ppm, and tocopherol composition [1]. Fritsche et al. [9] reported an even broader range of variation (197.5 to 460.1 ppm) for total tocopherol content (TTC) in the seeds of B. napus germplasm. This prevailing genetic variation incentivizes plant breeders to develop genotypes with an improved tocopherol content; however, the genetic mechanisms underlying this large variation remain unclear.
Tocopherol content is a complex trait governed by several genetic loci [10]. The phenotypic variation in content and composition of tocopherol is primarily due to genetic effects, especially additive gene effects; however, environmental factors also contribute to variations [10]. Goffman et al. [11] described a highly significant general combining ability (GCA) effect for ATC, GTC, and TTC composition; and a significant specific combining ability (SCA) effect for ATC employing diallel analysis in rapeseed. Transgressive segregants and high heritability, ranging from 0.65 to 0.78, were also observed [10].
Tocopherol biosynthesis is initiated in the plant’s cytoplasm and finally processed in the plastids [12]. There are seven genes involved in the biosynthesis of tocopherol pathways, and two genes, VTE3 and VTE4, encoding methyltransferase enzymes are responsible for the different methylation patterns on the aromatic ring [2]. The VTE3 gene encodes for 2-methyl-6-phytyl-1, 4-benzoquinone methyltransferase (MPBQ MT) that catalyzes the methylation of MPBQ, resulting in 2,3-dimethyl-5-phytyl-1, 4-benzoquinone (DMPBQ). This is an important step in the tocopherol synthesis, finally leading to the production of ATC and GTC [10,13]. The VTE4 gene encoding for γ-tocopherol methyltransferase (gTMT) catalyzes the conversion from δ- to β- and γ- to α-tocopherol [14]. The genes encoding for the key enzymes (VTE, loci 1–6; PDS1) have been characterized in model plant species Arabidopsis thaliana and are highly conserved among other oilseeds [8,15].
Most tocopherol content and composition research has been conducted on Brassica napus [9,10,11,16]. In India, Indian mustard is the predominant species of oilseed brassicas, occupying more than 90% area under cultivation [17]. Despite being a predominant crop, the lack of in-depth knowledge of the genetic control of tocopherols has hampered the improvement of the nutritional value and stability features of Indian mustard seed oil. Therefore, in the present study, generation mean analysis was used to understand the inheritance pattern and the gene actions governing tocopherol content for the development of suitable breeding programs to enhance the quality and quantity of tocopherol in Indian mustard.

2. Results and Discussion

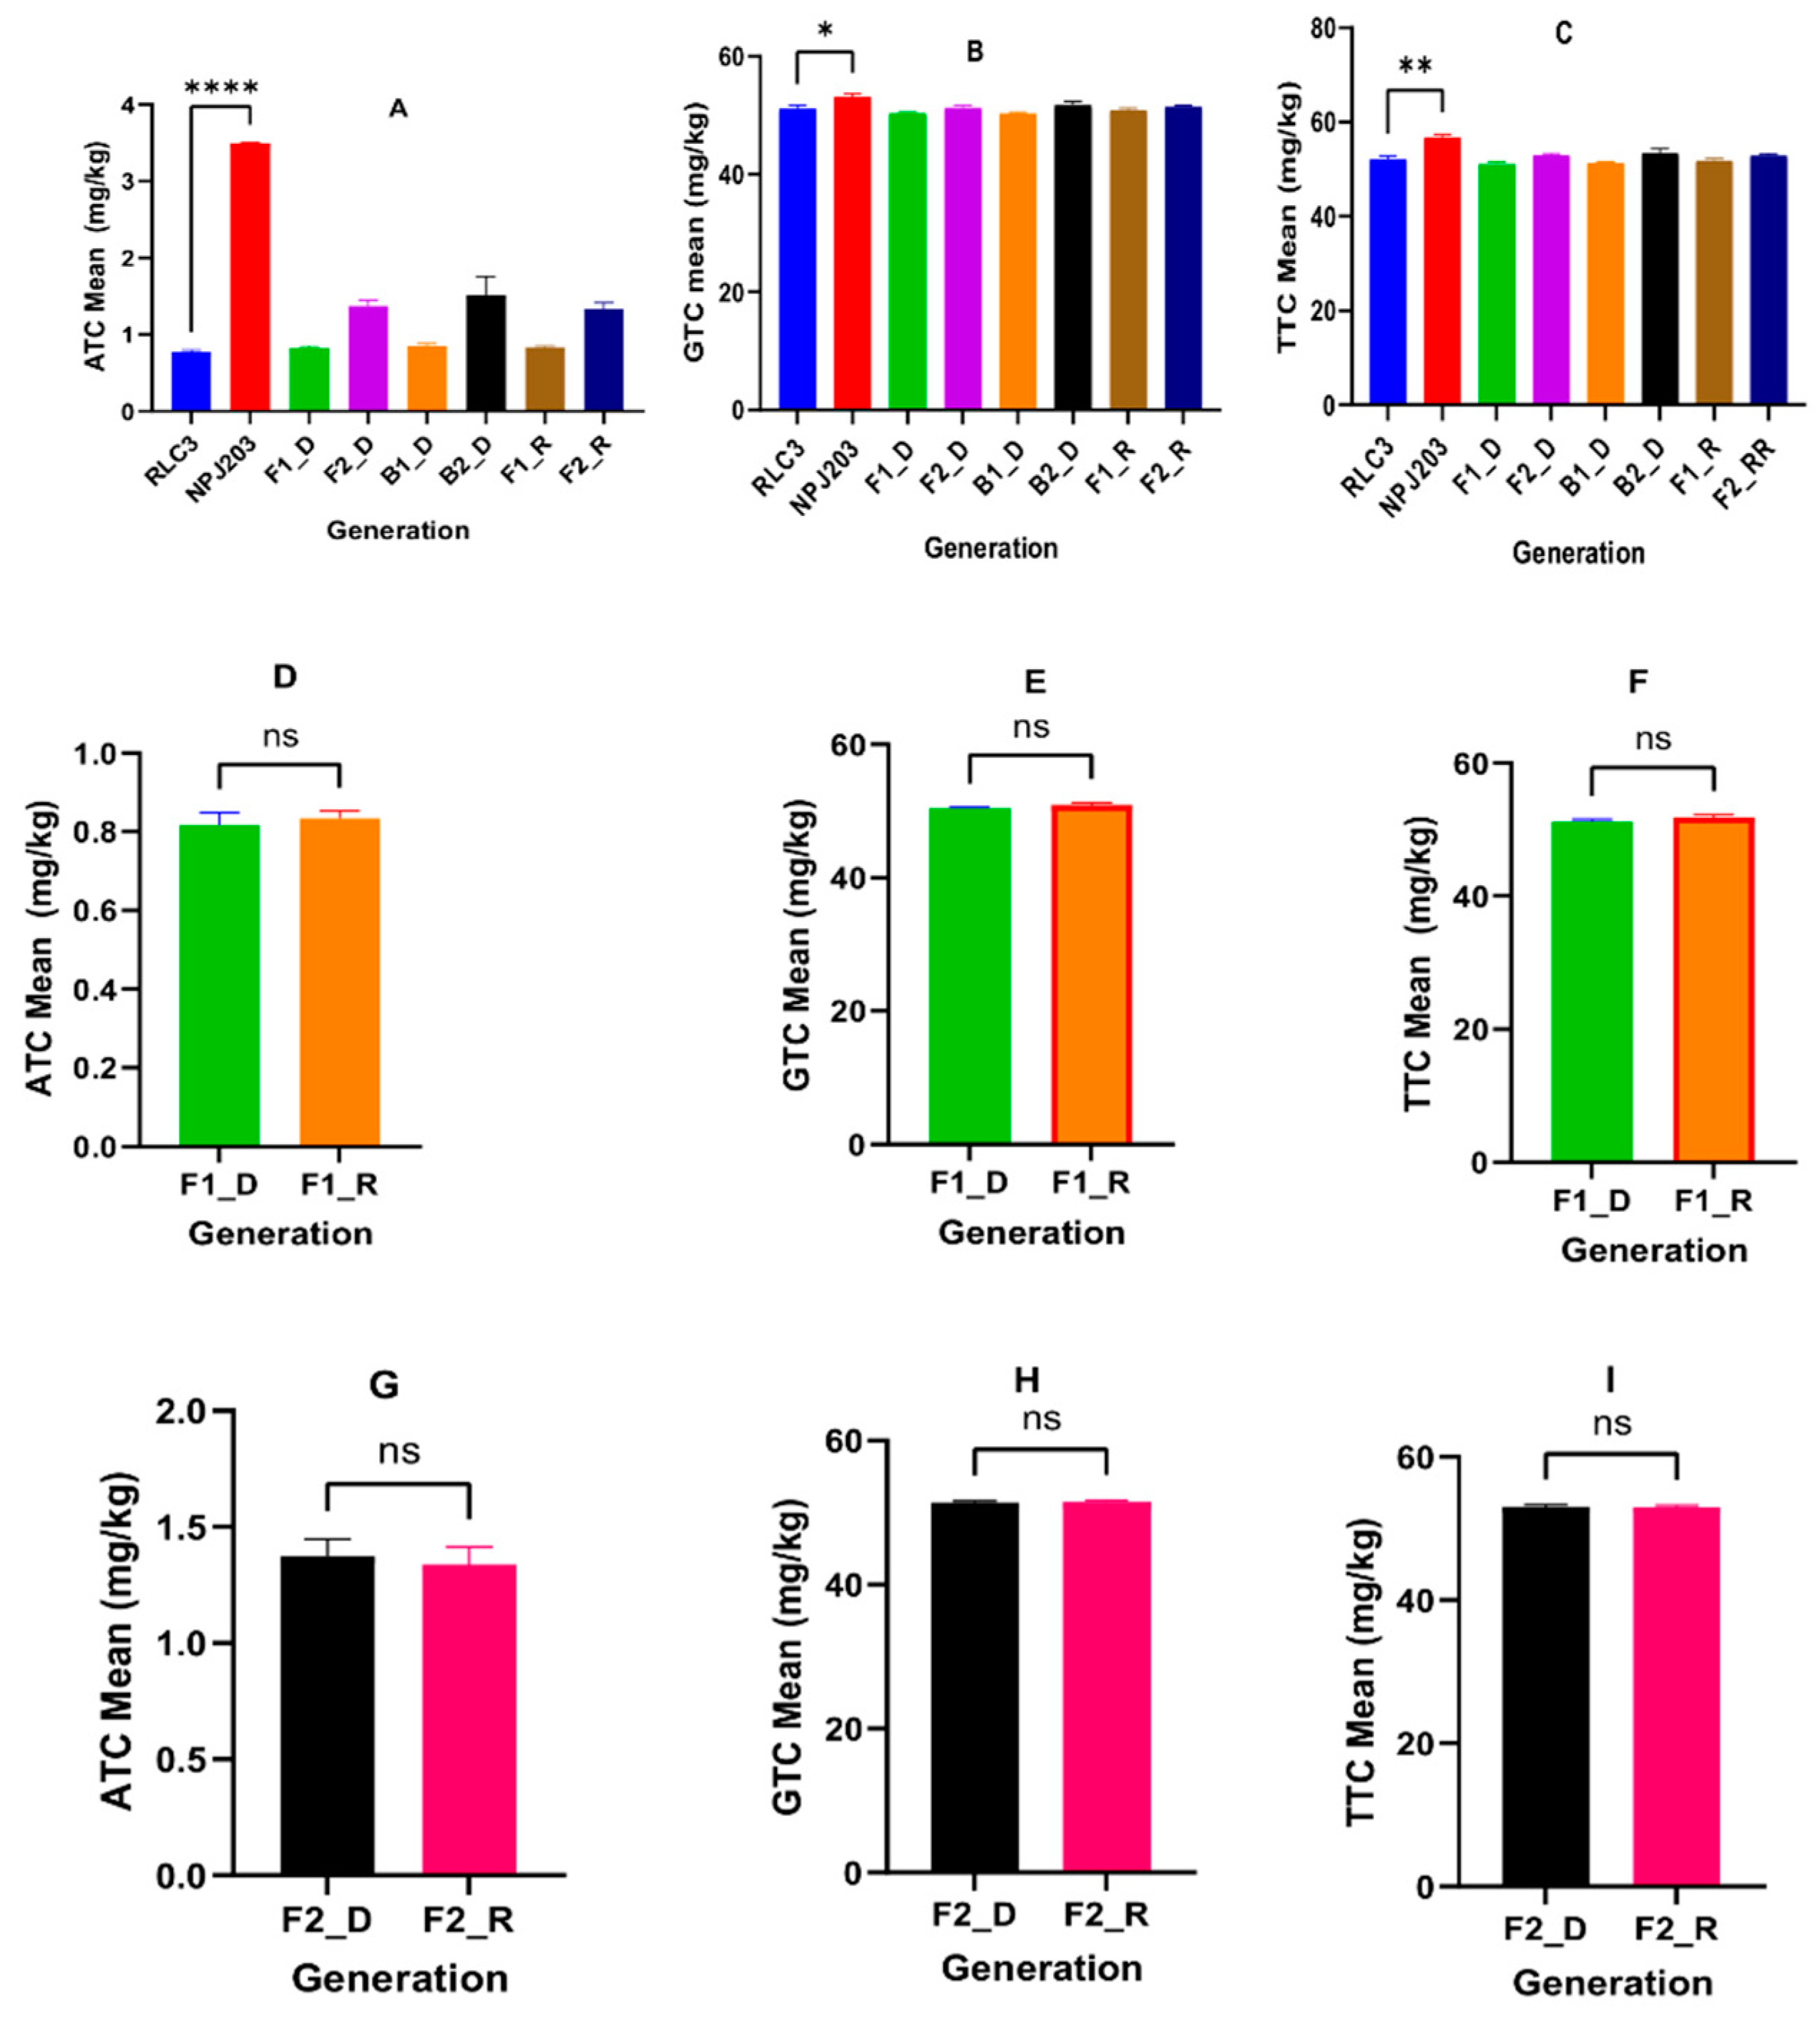
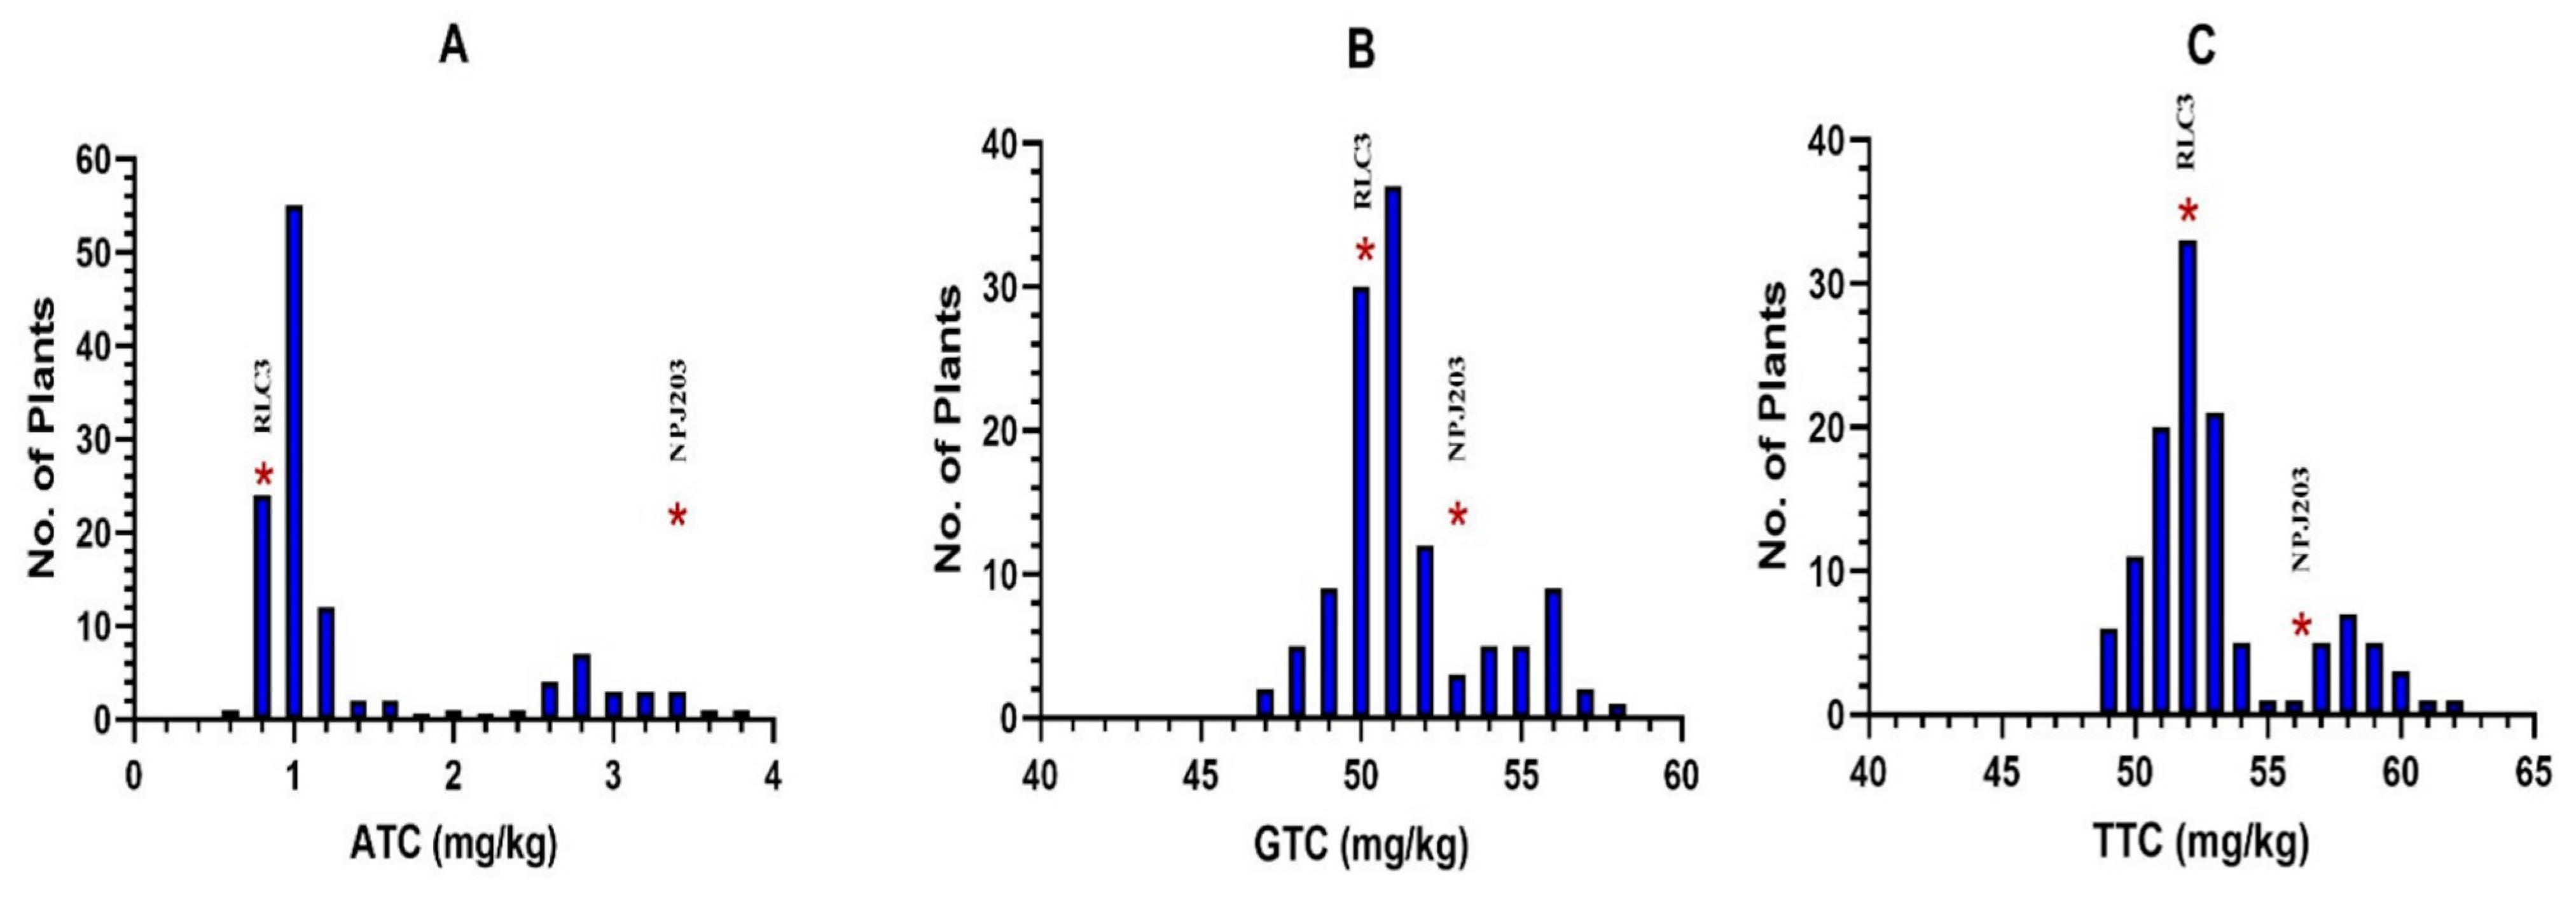
2.1. The Inheritance Pattern of Tocopherol Contents

The inheritance pattern of ATC, GTC, and TTC was estimated, and a paired t-test (Supplementary Table S1) was employed to assess the significance of various means of different tocopherol traits. Only the direct cross (RLC3 × NPJ203) was used further as the reciprocal cross (NPJ203 × RLC3), and its developed populations (F1, B1, B2, and F2) were not significantly different from earlier ones (Table 1).
The tocopherol content in the present study showed no differences in the F1s of direct and reciprocal crosses, clearly suggesting that these are not influenced by maternal inheritance and follow Mendelian inheritance (Figure 1).
Previously, the absence of maternal inheritance for tocopherol content (ATC and GTC) was reported in B. napus using diallel analysis [11] and genotype × environment interaction study [3]. For direct cross, parents RLC3 and NPJ203 were statistically significant for mean values of ATC (p < 0.001), GTC (p < 0.05), and TTC (p < 0.01) (Table 1; Supplementary Table S1). The α and γ tocopherol content ratio (AGR) ranged between 1% and 2% in RLC3 and 5–6% in NPJ203. The low AGR value suggested that Indian mustard genotypes are rich in GTC and TTC but possess very low ATC due to the low expression of the VTE4 (gamma-tocopherol methyltransferase) gene responsible for the conversion of GTC to ATC [18]. To study the nature of the gene’s action for tocopherol content, the means of parents were compared with F1 (ATC: 0.815 mg/kg, GTC: 50.418 mg/kg, and TTC: 51.188 mg/kg), and results indicated that F1 was significantly different from NPJ203 and non-significant with RLC3 (Figure 1). In BC1P1, selected and analyzed plants were similar to the RLC3 parent; in BC1P2, 6 out of 15 plants were NPJ203 type for ATC, GTC, and TTC, and the rest were similar to RLC3. The study, therefore, highlighted that high ATC, GTC, and TTC in Indian mustard are governed by recessive genes. This is the first report on the inheritance pattern of different tocopherol forms in Indian mustard. Previously, the recessive nature of alleles was also reported in B. carinata [19] and a single recessive locus Tph2 for high GTC in sunflower [20]. The frequency distribution of tocopherol content of different forms in the F2 population developed by RLC3 × NPJ203 (Figure 2) highlighted a skewed distribution pattern by ATC towards the parent RLC3; however, GTC and TTC showed a near-normal distribution. The higher values for different classes of tocopherol content were reported in B. juncea (ATC-51.48, GTC-496.61, and TTC-572 ng/mg of seed) [21]. In our findings, low tocopherol content was observed. The reason may be that the freshly harvested seeds were stored for three months before estimation. The reduction during storage in the seed tocopherols has been reported earlier [22], and seed storage time was negatively associated with tocopherol content in rapeseed. Marzena et al. [23,24] reported a 14.4% reduction in TTC after 18 days of storage in B. napus. Similarly, a 35% reduction in ATC and a 65% reduction in TTC were reported in wheat after 35 days of storage [25]. Another study reported a 35% reduction in TTC in walnut [26].

2.2. Estimation of Genetic Parameters

The genetic parameters, such as broad-sense heritability (H2b), narrow-sense heritability (H2n), genetic advance (GA), degree of dominance [h/d], additive variance [D], dominance variance [H], environmental variance [E], and correlation between additive and dominance components [F], were estimated for tocopherol content traits; Table 2.
The prevailing genetic variation between genotypes indicated that direct selection might be effective for the improvement of tocopherol content. Selection efficiency is highly related to the heritability and genetic advance of the trait of interest [27,28]. The broad-sense and narrow-sense heritability were found to be very high for GTC (0.932, 0.938) and TTC (0.949, 0.806). Similarly, broad-sense heritability (0.997) was very high for ATC; however, narrow-sense heritability (0.677) was relatively low. The genetic advance was highest for TTC (6.533), followed by GTC (4.764) and ATC (1.724). The predicted genetic gain under selection depends on heritability and genetic advance rather than heritability alone [29]. The heritability of traits could be influenced by the nature of genetic material, sample size, sampling method, experimental design, linkage effect, and calculation method. The genetic advance refers to the improvement in the mean genotypic value of selected individuals over the parental population and is directly influenced by the genetic variability, selection intensity, and heritability [30,31]. Studied tocopherol traits showed very high broad and narrow-sense heritability (except ATC) and genetic advance, indicating that these traits could be improved by employing direct selection [10]. Marwede et al. [16] earlier reported low broad-sense heritability for ATC (0.23), 0.41 (TTC), and 0.5 (GTC) resulting from significant genotype-by-environment interactions in rapeseed.
The [h/d] ratio calculates the degree of dominance [32,33]. A zero value of the [h/d] ratio represents no dominance, whereas a value equal to one shows complete dominance. Values more than one signify over-dominance, and less than one signifies incomplete dominance. In our findings, the value of the degree of dominance was greater than one for all the studied traits (ATC: 3.10, GTC: 2.219, TTC: 2.702), indicating the over-dominance type of gene action in the inheritance of all studied traits and highlighting that heterozygote has genetic value better than the better parent. Therefore, the preponderance of non-additive genetic control suggested that delaying selection in later generations would be rewarding in improving these traits. A relationship between [D] and [H] over all the loci can be calculated by employing the F value [33,34]. F value equal to zero indicates that all the dominant genes are clustered into the high-performing parent; however, a negative value indicates dominant genes are inculcated into the low-performing parent. In our finding, the F value was negative for all the studied traits (ATC: −0.87, GTC: −4.69, TTC: −10.06), suggesting that dominant genes are present in the low-performing parent, i.e., RLC3. Thus, we conclude that these traits are controlled by recessive genes. The √H/D value was highest for ATC (0.972), followed by TTC (0.595) and GTC (0.576).
The ratio of F/√D × H estimates the magnitude and sign of the direction of dominance. A value close to one indicates that the magnitude and the sign of dominance for all the genes governing the trait of interest are equal, but a value near zero implies that the magnitude and sign of the genes are not equal. Therefore, √H/D is a good estimator of dominance and verifies the average dominance of traits. The F/√H×D values were −0.941, −0.838, and −0.942 for ATC, GTC, and TTC, respectively. For all the studied traits, the ratio of F/√H × D was closed to 1 in the negative direction. Therefore, the ratio √H × D and degree of dominance indicated an over-dominance gene action [33,34].
The phenomenon of heterosis and inbreeding depression underlines the type of gene actions that regulate the different quantitative traits, including tocopherol content. The prevailing genetic variation in the population decides the potential use of selection and beneficial utilization in heterosis breeding [28,32]. Heterosis percentage, for instance, for high parent (HP), mid parent (MP), and inbreeding depression (ID), demonstrated that heterosis for all studied tocopherol forms was in the negative direction (Figure 3). The negative direction heterosis for ATC, GTC, and TTC also strongly supports that these traits are governed by recessive genes. Further, selection for high tocopherol traits must be delayed till F3 or F4 generations to exploit recessive genes and non-segregating lines for the trait of interest. The biparental mating system is very useful for genetic improvement by increasing the genetic recombination frequencies that fasten genetic improvement rates and provide alternative routes to heterosis breeding [34,35].
The potence ratio is principally used to detect the type of dominance [34]. The p-value of ±1 denotes complete dominance, values between −1 and +1 represent partial dominance, ≥1 represents over-dominance, and a value of 0 denotes the absence of any type of dominance. The positive and negative signs highlight the direction of the dominance of either parent [36,37]. In our findings, the potence ratio was highest for GTC (−1.749), followed by TTC (−1.403) and ATC (−0.965) (Table 2). The potence ratio for ATC was close to −1, indicating complete dominance, whereas its value surpassed −1 for GTC and TTC, demonstrating an over-dominance type of inheritance. The negative values of the potence ratio sign posted the occurrence of various degrees of recessiveness [38].

2.3. Estimation of Scaling Test and Genes Effects

The various scaling tests and gene effects were estimated using means of different generations and are presented in Table 3.
For the absence of non-allelic interactions, the value of A, B, C, and D scaling tests should be equal to zero within the limits of their standard error. Non-allelic interaction is considered a trait if any scale shows a significant difference. Scales C and D provide [l] and [i] gene interaction types, respectively. Furthermore, the [j] type of interaction does not affect C and D, but affects A and B. A and B tests provide information on [i], [j], and [l]-type interactions [36,39]. The six-parameter model was developed by Hayman [40] and Jinks and Jones [41] to estimate genetic components. The significance of [m], [d], [h], [i], [j], and [l] shows the presence of the mean effect, additive effect, dominance effect, additive × additive, additive × dominance and dominance × dominance effects of the gene/s, respectively. All scaling tests were non-significant for the studied traits except scale B, which was statistically significant for ATC. Non-significant scaling tests for GTC and TTC indicate that both traits are controlled by a single gene (intra-allelic interaction). In contrast, the significance of the B test for ATC suggests that the trait is under the influence of epistatic interaction.
Gene effects from the six-parameter model revealed that mean [m] and additive effects [d] were significant for all studied traits. Earlier, tocopherol content was also reported with the predominance of an additive effect in rapeseed [1,3,11,19]. Other gene effects such as dominance effect [h], additive × additive [i], additive × dominance [j], and dominance × dominance [l] were non-significant for GTC and TTC. However, [h], [j], and [l] types of gene effects were significant for ATC. The absence of non-allelic interactions (epistatic interaction) has positive implications for GTC and TTC in their breeding program management. These interactions can impede the identification of suitable genotypes and hinder genetic mapping [42]. For ATC, genetic parameters such as [m], [d], [h], [j], and [l] were significant. The negative sign of [j] suggested the dispersion of genes in both parents [43]. The positive or negative sign of [d] depends on which parent has been chosen as P1 [44,45]. Besides, the opposite signs of [h] and [l] were an indicator of the duplicate gene interaction, whereas signs in the same direction indicated complementary interaction [46]. In this study, [h] and [l] had the opposite signs for ATC, indicating duplicate gene action. However, recent reports indicated that ATC is governed by a major gene, i.e., VTE4, that converts GTC into ATC. Contemporary studies have shown that the loss of function of VTE4 has completely replaced ATC with GTC, both in safflower [47] and sunflower [48]. Similarly, increased ATC and reduced GTC has been testified by increasing activity of VTE4 promoter in soybean [49], insertion of additional copies of VTE4 in sunflower [20], and overexpression of VTE4 in other plant species viz., Arabidopsis, soybean, and Indian mustard [2,14,21,50].

3. Materials and Methods

3.1. Selection of Genotypes

Contrasting genotypes (RLC3 and NPJ203) for tocopherol traits were selected as parents and were raised at the experimental farm (latitude 28°38′ N; altitude 77°09′ E and 228.61 m amsl) of the Division of Genetics, ICAR-Indian Agricultural Research Institute (IARI), New Delhi, India, during rabi 2017–2018 (Table 4).

3.2. Development of Different Breeding Populations

The direct and reciprocal crosses were attempted using RLC3 (P1) and NPJ203 (P2) genotypes at the experimental farm of the Division of Genetics, ICAR-IARI during rabi 2018–2019, and F1s seeds were harvested. The F2, BC1P1 (B1: F1 backcrossed with RLC3) and BC1P2 (B2; F1 backcrossed with NPJ203) populations were developed at ICAR-IARI regional station, Wellington, Tamil Nadu (off-season nursery; 11.37° N, 76.8° E; 1855 m amsl) during kharif 2019. The F2:F3, BC1P1:F2, and BC1P2:F2 were developed by selfing of F2, BC1P1, and BC1P2 populations, respectively, at the experimental farm of the Division of Genetics, ICAR-IARI during rabi 2019–2020.

3.3. Experimental Design and Crop Maintenance

The developed six generations (P1, P2, F1, F2, B1, and B2) were raised at the experimental farm of ICAR-IARI, New Delhi, during rabi 2020–2021 for the estimation of ATC, GTC, and TTC. The parents, F1 and backcross generations (B1 and B2) were sown in two rows and F2 populations in 9 rows, each 5 m in length. The row-to-row and plant-to-plant spacing were kept at 45 cm and 15 cm, respectively. These six generations were replicated twice, employing the family block design. All the recommended agricultural practices, from sowing to harvesting, were followed to raise a healthy crop. Three random plants were selected from each P1, P2, and F1 population, 15 plants each from B1 and B2, and 120 plants from the F2 population of each replication were harvested individually and were used for the estimation of tocopherol traits.

3.4. Estimation of Tocopherol Contents

The seeds’ ATC, GTC, and DTC were estimated using high-performance liquid chromatography (HPLC) [9,51,52,53]. Freshly harvested seeds were stored for three months at 4 °C before analyses; 50 mg seeds were ground in 1500 μL n-heptane to extract tocopherols. Further, the solution was incubated at −20 °C for 2 h, and 20 μL was used for HPLC analysis. A silica gel column (5 μM LiChrospher® Si 60, Merck, Darmstadt, Germany) was used to extract tocopherols employing a mobile phase consisting of an n-heptane/isopropanol-mixture (99 + 1; v + v). The fluorescence detection (excitation at λ = 290 nm and emission at λ = 328 nm) method was used for tocopherol quantification. The retention times were compared with Merck’s tocopherol kit (Merck, Darmstadt, Germany) to identify specific tocopherol forms (DTC: 7.9 min; GTC: 8.9 min; BTC: 9.9 min, and ATC: 10.6 min), and the concentration of single forms was correlated with signal output to calibrate each tocopherol form (Supplementary Figures S1–S11). Additionally, a linear calibration range was obtained for the concentration of the analyzed samples under this study. However, the concentration of β-tocopherol was the lowest; hence, it was not analyzed in this study further. The TTC was estimated by summing up ATC, GTC, and DTC, whereas the tocopherol composition was expressed as the ratio of ATC and GTC, i.e., AGR.

3.5. Statistical Analysis

3.5.1. Estimation of Scaling Test

To study gene effects, a scaling test was used to assess the adequacy of an additive-dominance model [54]. As suggested by Singh and Chaudhary [55], four scales (A, B, C, and D) were used to obtain information on the presence or absence of allelic interactions. Scales A and D denote the presence of additive × additive [i] gene action, whereas scales B and C represent additive × dominance [j] and dominance × dominance [l] gene interactions, respectively. In addition, scaling tests were calculated with the following equations:
A = 2 B 1 ¯ P 1 ¯ F 1 ¯
B = 2 B 2 ¯ P 2 ¯ F 1 ¯    
C = 4 F 2 ¯ 2 F 1 ¯ P 1 ¯ P 2 ¯  
D = 2 F 2 ¯ B 1 ¯ B 2 ¯
where P 1 ¯ ,   P 2   ¯ ,   F 1 ¯ ,   F 2 ¯ ,   B 1 ¯ ,   and   B 2 ¯ represent the mean value of P1, P2, F1, F2, B1, and B2, respectively. If any of the scales were significant (non-zero), it indicates the presence of non-allelic interaction (epistasis) and vice versa [39,54]. Furthermore, the three-parameter model [41] is used for the estimation of gene effects if the additive–dominance model is acceptable (absence of non-allelic interactions); however, non-adequacy (presence of non-allelic interactions) results in the use of a six-parameter model [40,56].

3.5.2. Components of Generation Means

In compliance with the additive–dominance model, the mean effect [m], additive effect [d], and dominance effect [h] could be calculated with the following equations [41,54]:
m = 1 2 P 1 ¯ + 1 2   P 2 ¯ + 4 F 2 ¯ 2 B 1 ¯ 2 B 2 ¯
d = 1 2 P 1 ¯ 1 2 P 2 ¯
h = 6 B 1 ¯ + 6 B 2 ¯ 8 F 2 ¯   F 1 ¯ 3 2 P 1 ¯ 3 2 P 2 ¯
However, interactions were calculated separately in the presence of epistatic effects, and the following equations were used for the analysis of each gene effect employing the mean value of each generation [41]:
m = F 2 ¯
d = B 1 ¯ B 2 ¯
i = 2 B 1 ¯ + 2 B 2 ¯ 4 F 2 ¯
j = B 1 ¯ 1 2 P 1 ¯ B 2 ¯ + 1 2   ( P 2 ¯ )
  l = P 1 ¯ + P 2 ¯ + 2 F 1 ¯ + 4 ( F 2 ) ¯ 4 B 1 ¯ 4 B 2 ¯
where [m], [d], [h], [i], [j], and [l] represented mean effect, additive gene effect, dominance gene effect, additive × additive, additive × dominance, and dominance × dominance gene effects, respectively.

3.5.3. Estimation of Various Genetic Parameters

The different components of variation in six populations were analyzed as per Mather and Jinks [29], and the following formulae were used based on F2 variances:
E = 1 3 V P 1 + V P 2 + V F 1
D = 4 V F 2 2 V B 1 + V B 2
H = 4   V F 2   1 2 V D ( V E )
  F   = V B 1 V B 2
where E, D, H, and F represented an environmental component of variance, additive genetic variance, dominance genetic variance, and correlation between D and H, overall loci, respectively. Broad-sense (H2b) and narrow-sense (H2n) heritability were calculated by employing the following formulae [57]:
H b 2 = V F 2 V P 1 + V P 2 + V F 1 3 V F 2
H n 2 = 2   V F 2 V B 1 + V B 2 V F 2  
Genetic advance (GA) was calculated as per Johnson et al. [27] by employing the following formula:
G A = i . H b 2 . V F 2
where selection intensity was i = 5% for the studied traits. Potence ratio (P) was calculated to determine the degree of dominance employing the following formula [37]:
P = F 1 ¯ M P 1 2 P 2 ¯ P 1 ¯ × 100
where P is the relative potence ratio of the gene set; F1 is the first-generation mean; P1 is the mean of the lower parent; P2 is the mean of the higher parent; and MP is the mid-parental value [(P1 + P2)/2].

4. Conclusions

Although the tocopherol biosynthesis pathway has been elucidated in model organisms such as Arabidopsis thaliana and Synechocystis sp. PCC6803, information on tocopherol inheritance in Indian mustard is inadequate. The present investigation highlighted that tocopherol content and composition are controlled by recessive nuclear genes and are not affected by maternal effects in seeds of Indian mustard. High heritability coupled with genetic advances for the studied traits indicated that direct selection could improve these traits. The potence ratio and degree of dominance highlighted that GTC and TTC showed an over-dominance gene interaction, whereas ATC showed an epistatic interaction. This is the first study on Indian mustard that elucidated the nature of inheritance and gene effects of tocopherol traits employing generation mean analysis. This study has potential applications for enhancing tocopherol content in the seed oil of Indian mustard for enhancing oil quality by incorporating genes, especially for ATC, into exiting elite lines.

Supplementary Materials

The following supporting information can be downloaded at: https://www.mdpi.com/article/10.3390/plants11131779/s1. Table S1: Paired t-test between different breeding generations for tocopherol content traits.

Author Contributions

Conceptualization, D.K.Y. and N.S.; methodology, V.K.M. and Y.T.; software, V.K.M. and V.M.; validation, V.K.M., R.C., S.C. and M.K.P.; formal analysis, V.K.M. and S.C.; investigation, V.K.M. and Y.T.; resources, D.K.Y. and N.S.; data curation, V.K.M. and S.Y.; writing—V.K.M.; writing—review and editing, S.C., R.C. and S.V.; visualization, N.S.; supervision, N.S.; project administration, S.V.; funding acquisition, D.K.Y. All authors have read and agreed to the published version of the manuscript.

Funding

The research was supported by ICAR-IARI-CRPMB-12-143E-Mustard and NAHEP-CAAST.

Institutional Review Board Statement

Not applicable.

Informed Consent Statement

Not applicable.

Data Availability Statement

All the data are included within the manuscript and the supplementary table.

Acknowledgments

The first author is grateful to CSIR, New Delhi, for providing a Senior Research Fellowship for the PhD program.

Conflicts of Interest

The authors declare no conflict of interest.

References

  1. Goffman, F.D.; Becker, H.C. Genetic variation of tocopherol content in a germplasm collection of Brassica napus L. Euphytica 2002, 125, 189–196. [Google Scholar] [CrossRef]
  2. Endrigkeit, J.; Wang, X.; Cai, D.; Zhang, C.; Long, Y.; Meng, J.; Jung, C. Genetic mapping, cloning, and functional characterization of the BnaX.VTE4 gene encoding a γ-tocopherol methyltransferase from oilseed rape. Theor. Appl. Genet. 2009, 119, 567–575. [Google Scholar] [CrossRef] [PubMed]
  3. Marwede, V.; Schierholt, A.; Möllers, C.; Becker, H.C. Genotype × Environment interactions and heritability of tocopherol contents in Canola. Crop Sci. 2004, 44, 728–731. [Google Scholar] [CrossRef]
  4. Kamal-Eldin, A.; Andersson, R. A multivariate study of the correlation between tocopherol content and fatty acid composition in vegetable oils. J. Am. Oil Chem. Soc. 1997, 74, 375–380. [Google Scholar] [CrossRef]
  5. Goffman, F.D.; Thies, W.; Velasco, L. Chemotaxonomic value of tocopherols in Brassicaceae. Phytochemistry 1999, 50, 793–798. [Google Scholar] [CrossRef]
  6. DellaPenna, D. A decade of progress in understanding vitamin E synthesis in plants. J. Plant Physiol. 2005, 162, 729–737. [Google Scholar] [CrossRef]
  7. Valentin, H.E.; Lincoln, K.; Moshiri, F.; Jensen, P.K.; Qi, Q.; Venkatesh, T.V.; Karunanandaa, B.; Baszis, S.R.; Norris, S.R.; Savidge, B.; et al. The Arabidopsis vitamin E pathway gene5-1 mutant reveals a critical role for phytol kinase in seed tocopherol biosynthesis. Plant Cell 2006, 18, 212–224. [Google Scholar] [CrossRef] [Green Version]
  8. Hunter, S.C.; Cahoon, E.B. Enhancing vitamin E in oilseeds: Unraveling tocopherol and tocotrienol biosynthesis. Lipids 2007, 42, 97–108. [Google Scholar] [CrossRef]
  9. Fritsche, S.; Wang, X.; Li, J.; Stich, B.; Kopisch-Obuch, F.J.; Endrigkeit, J.; Leckband, G.; Dreyer, F.; Friedt, W.; Meng, J.; et al. A candidate gene-based association study of tocopherol content and composition in rapeseed (Brassica napus). Front. Plant Sci. 2012, 3, 129. [Google Scholar] [CrossRef] [Green Version]
  10. Wang, X.; Zhang, C.; Li, L.; Fritsche, S.; Endrigkeit, J.; Zhang, W.; Long, Y.; Jung, C.; Meng, J. Unraveling the genetic basis of seed tocopherol content and composition in rapeseed (Brassica napus L.). PLoS ONE 2012, 7, e50038. [Google Scholar] [CrossRef] [Green Version]
  11. Goffman, F.D.; Becker, H.C. Diallel analysis for tocopherol contents in seeds of rapeseed. Crop Sci. 2001, 41, 1072–1079. [Google Scholar] [CrossRef]
  12. Soll, J.; Douce, R.; Schultz, G. Site of biosynthesis of a-tocopherol in spinach chloroplasts. FEBS Lett. 1980, 112, 243–246. [Google Scholar] [CrossRef] [Green Version]
  13. Fritsche, S.; Wang, X.; Nichelmann, L.; Suppanz, I.; Hadenfeldt, S.; Endrigkeit, J.; Meng, J.; Jung, C. Genetic and functional analysis of tocopherol biosynthesis pathway genes from rapeseed (Brassica napus L.). Plant Breed. 2014, 133, 470–479. [Google Scholar] [CrossRef]
  14. Van Eenennaam, A.; Lincoln, K.; Durrett, T.P.; Valentin, H.E.; Shewmaker, C.K.; Thorne, G.M.; Jiang, J.; Baszis, S.R.; Levering, C.K.; Aasen, E.D.; et al. Engineering vitamin e content: From arabidopsis mutant to soy oil. Plant Cell 2003, 15, 3007–3019. [Google Scholar] [CrossRef] [Green Version]
  15. Li, Y.; Wang, Z.; Sun, X.; Tang, K. Current opinions on the functions of tocopherol based on the genetic manipulation of tocopherol biosynthesis in plants. J. Integr. Plant Biol. 2008, 50, 1057–1069. [Google Scholar] [CrossRef]
  16. Marwede, V.; Gul, M.K.; Becker, H.C.; Ecke, W. Mapping of QTL controlling tocopherol content in winter oilseed rape. Plant Breed. 2005, 124, 20–26. [Google Scholar] [CrossRef]
  17. Chand, S.; Patidar, O.P.; Chaudhary, R.; Saroj, R.; Chandra, K.; Meena, V.K.; Limbalkar, O.M.; Patel, M.K.; Pardeshi, P.; Vasisth, P. Rapeseed-mustard breeding in India: Scenario, achievements and research needs. In Brassica Breeding and Biotechnology; IntechOpen: London, UK, 2021; p. 174. ISBN 9781839686986. [Google Scholar]
  18. Yusuf, M.A.; Kumar, D.; Rajwanshi, R.; Strasser, R.J.; Tsimilli-Michael, M.; Govindjee; Sarin, N.B. Overexpression of γ-tocopherol methyl transferase gene in transgenic Brassica juncea plants alleviates abiotic stress: Physiological and chlorophyll a fluorescence measurements. Biochim. Biophys. Acta-Bioenergy 2010, 1797, 1428–1438. [Google Scholar] [CrossRef] [Green Version]
  19. García-Navarro, E.; Fernández-Martínez, J.M.; Pérez-Vich, B.; Velasco, L. Genetic analysis of reducedγ-tocopherol content in ethiopian mustard seeds. Sci. World J. 2016, 2016, 7392603. [Google Scholar] [CrossRef] [Green Version]
  20. García-Moreno, M.J.; Fernández-Martínez, J.M.; Velasco, L.; Pérez-Vich, B. Genetic basis of unstable expression of high gamma-tocopherol content in sunflower seeds. BMC Plant Biol. 2012, 12, 71. [Google Scholar] [CrossRef] [Green Version]
  21. Yusuf, M.A.; Sarin, N.B. Antioxidant value addition in human diets: Genetic transformation of Brassica juncea with γ-TMT gene for increased α-tocopherol content. Transgenic Res. 2007, 16, 109–113. [Google Scholar] [CrossRef]
  22. Siger, A.; Michalak, M.; Cegielska-Taras, T.; Szała, L.; Lembicz, J.; Nogala-Kałucka, M. Genotype and environment effects on tocopherol and plastochromanol-8 contents of winter oilseed rape doubled haploid lines derived from F1 plants of the cross between yellow and black seeds. Ind. Crop. Prod. 2015, 65, 134–141. [Google Scholar] [CrossRef]
  23. Gawrysiak-Witulska, M.; Siger, A.; Wawrzyniak, J.; Nogala-Kalucka, M. Changes in tocochromanol content in seeds of Brassica napus L. during adverse conditions of storage. J. Am. Oil Chem. Soc. 2011, 88, 1379–1385. [Google Scholar] [CrossRef]
  24. Gawrysiak-Witulska, M.; Siger, A.; Rusinek, R. Degradation of tocopherols during rapeseed storage in simulated conditions of industrial silos. Int. Agrophysics 2016, 30, 39–45. [Google Scholar] [CrossRef]
  25. Capitani, M.; Mateo, C.M.; Nolasco, S.M. Effect of temperature and storage time of wheat germ on the oil tocopherol concentration. Braz. J. Chem. Eng. 2011, 28, 243–250. [Google Scholar] [CrossRef] [Green Version]
  26. Lavedrine, F.; Ravel, A.; Poupard, A.; Alary, J. Effect of geographic origin, variety and storage on tocopherol concentrations in walnuts by HPLC. Food Chem. 1997, 58, 135–140. [Google Scholar] [CrossRef]
  27. Johnson, H.W.; Robinson, H.F.; Comstock, R.E. Estimates of genetic and environmental variability in Soybeans 1. Agron. J. 1955, 47, 314–318. [Google Scholar] [CrossRef]
  28. Singh, P.; Narayanan, S.S. Biometrical Techniques in Plant Breeding, 1st ed.; Kayani Publishers: Ludhiyana, India, 1993; ISBN 741339390. [Google Scholar]
  29. Mather, K.; Jinks, J.L. Biometrical Genetics: The Study of Continuous Variation, 3rd ed.; Chapman and Hall: London, UK, 1982; ISBN 0412228904. [Google Scholar]
  30. Alza, J.; Fernandez-Martinez, J. Genetic analysis of yield and related traits in sunflower (Helianthus annuus L.) in dryland and irrigated environments. Euphytica 1997, 95, 243–251. [Google Scholar] [CrossRef]
  31. Sharma, S.; Sain, R.; Sharma, R. Genetics of spike length in durum wheat. Euphytica 2003, 130, 155–161. [Google Scholar] [CrossRef]
  32. Singh, R.K.; Chaudhary, B.D. Biometrical Methods in Quantitative Genetic Analysis, 1st ed.; Kalyani Publishers: New Delhi, India, 1999; ISBN 8176633070. [Google Scholar]
  33. Kearsey, M.J.; Pooni, H.S. The Genetical Analysis of Quantitative Traits, 2nd ed.; Chapman and Hall: London, UK, 2004; ISBN 0748740821. [Google Scholar]
  34. Said, A. Generation mean analysis in wheat (Triticum aestivum L.) under drought stress conditions. Ann. Agric. Sci. 2014, 59, 177–184. [Google Scholar] [CrossRef] [Green Version]
  35. Amin, I.A. Genetic behaviour of some agronomic traits in two durum wheat crosses under heat stress. J. Agric. Res. 2013, 58, 53–66. [Google Scholar]
  36. Mather, K. Biometrical Genetics: The Study of Continuous Variation; Methuen: London, UK, 1949. [Google Scholar]
  37. Smith, H. Fixing transgressive vigor in Nicotiana rustica. In Heterosis; Gowen, J.W., Ed.; Iowa State College Press: Ames, IA, USA, 1952; pp. 161–174. ISBN 19531603834. [Google Scholar]
  38. El-Tahawey, M.A.F.A.; Kandeel, A.M.; Youssef, S.M.S.; El-Salam, M.M.M.A. Heterosis, potence ratio, combining ability and correlation of some economic traits in diallel crosses of pumpkins. Egypt. J. Plant Breed. 2015, 19, 419–439. [Google Scholar] [CrossRef]
  39. Hayman, B.I.; Mather, K. The description of genic interactions in continuous variation. Biometrics 1955, 11, 69. [Google Scholar] [CrossRef]
  40. Hayman, B.I. The separation of epistatic from additive and dominance variation in generation means. Heredity 1958, 12, 371–390. [Google Scholar] [CrossRef] [Green Version]
  41. Jinks, J.L.; Jones, R.M. Estimation of the components of heterosis. Genetics 1958, 43, 223–224. [Google Scholar] [CrossRef] [PubMed]
  42. Phillips, P.C. Epistasis—The essential role of gene interactions in the structure and evolution of genetic systems. Nat. Rev. Genet. 2008, 9, 855–867. [Google Scholar] [CrossRef] [Green Version]
  43. Khattab, S.A.M.; Esmail, R.M.; Al-Ansary, A.E.M.F. Genetical analysis of some quantitative traits in bread wheat (Triticum aestivum L.). New York Sci. J. 2010, 3, 152–157. [Google Scholar]
  44. Shahrokhi, M.; Khorasani, S.K.; Ebrahimi, A. Generation mean analysis: A case study of yield and yield components in ksc704 maize (Zea mays L.). Generations 2013, 4, 2686–2693. [Google Scholar]
  45. Cukadar-Olmedo, B.; Miller, J.F. Inheritance of the Stay Green Trait in Sunflower. Crop Sci. 1997, 37, 150–153. [Google Scholar] [CrossRef]
  46. Kearsey, M.J. Biometrical genetics in breeding. Plant Breed 1993, 163–183. [Google Scholar] [CrossRef]
  47. García-Moreno, M.J.; Fernández-Martínez, J.M.; Velasco, L.; Pérez-Vich, B. Molecular tagging and candidate gene analysis of the high gamma-tocopherol trait in safflower (Carthamus tinctorius L.). Mol. Breed. 2010, 28, 367–379. [Google Scholar] [CrossRef]
  48. Hass, C.G.; Tang, S.; Leonard, S.; Traber, M.G.; Miller, J.F.; Knapp, S.J. Three non-allelic epistatically interacting methyltransferase mutations produce novel tocopherol (vitamin E) profiles in sunflower. Theor. Appl. Genet. 2006, 113, 767–782. [Google Scholar] [CrossRef] [PubMed]
  49. Dwiyanti, M.S.; Yamada, T.; Sato, M.; Abe, J.; Kitamura, K. Genetic variation of γ-tocopherol methyltransferase gene contributes to elevated α-tocopherol content in soybean seeds. BMC Plant Biol. 2011, 11, 152. [Google Scholar] [CrossRef] [PubMed] [Green Version]
  50. Shintani, D.; DellaPenna, D. Elevating the vitamin e content of plants through metabolic engineering. Science 1998, 282, 2098–2100. [Google Scholar] [CrossRef]
  51. Schledz, M.; Seidler, A.; Beyer, P.; Neuhaus, G. A novel phytyltransferase from Synechocystis sp. PCC 6803 involved in tocopherol biosynthesis. FEBS Lett. 2001, 499, 15–20. [Google Scholar] [CrossRef] [Green Version]
  52. Dähnhardt, D.; Falk, J.; Appel, J.; van der Kooij, T.A.; Schulz-Friedrich, R.; Krupinska, K. The hydroxyphenylpyruvate dioxygenase from Synechocystis sp. PCC 6803 is not required for plastoquinone biosynthesis. FEBS Lett. 2002, 523, 177–181. [Google Scholar] [CrossRef] [Green Version]
  53. Falk, J.; Andersen, G.; Kernebeck, B.; Krupinska, K. Constitutive overexpression of barley 4-hydroxyphenylpyruvate dioxygenase in tobacco results in elevation of the vitamin E content in seeds but not in leaves. FEBS Lett. 2003, 540, 35–40. [Google Scholar] [CrossRef] [Green Version]
  54. Kearsey, M.J.; Pooni, H.S. The Genetical Analysis of Quantitative Traits; Chapman and Hall, Stanley Thornes: London, UK, 1996; ISBN 0412609800. [Google Scholar]
  55. Singh, R.K.; Chaudhary, B.D. Biometrical Methods in Quantitative Genetic Analysis; Kalyani Publishers: Ludhiyana, India, 1977; ISBN 19801689021. [Google Scholar]
  56. Ramli, A.B.; Rafii, M.Y.; Latif, M.A.; Saleh, G.B.; Omar, O.B.; Puteh, A.B. Generation mean analysis of grain quality traits in selected rice populations derived from different amylose characteristics. J. Sci. Food Agric. 2016, 96, 1593–1600. [Google Scholar] [CrossRef]
  57. Warner, J.N. A method for estimating heritability. Agron. J. 1952, 44, 427–430. [Google Scholar] [CrossRef] [Green Version]
Figure 1. Mean comparison of tocopherol content in various populations developed by crossing between RLC3 and NPJ203 in both directions. Mean comparison of six generations of the direct cross for ATC (A), GTC (B), and TTC (C). Mean comparison of F1s of the direct (F1_D) and reciprocal (F1_R) crosses for ATC (D), GTC (E), and TTC (F). Mean comparison of F2 population of direct (F2_D) and reciprocal (F2_R) cross for ATC (G), GTC (H), and TTC (I). * Significant at 5% level of significance (p < 0.05); ** highly significant at 1% level of significance (p < 0.01); **** highly significant (p < 0.0001); ns, non-significant difference.
Plants 11 01779 g001
Figure 2. Frequency distribution of tocopherol content of different forms in the F2 population developed by RLC3 × NPJ203. Skewed frequency distribution was observed for ATC (A), whereas there was a near-normal distribution for GTC (B) and TTC (C).
Plants 11 01779 g002
Figure 3. Heterosis and inbreeding depression for all forms of tocopherol content. Mid-parental heterosis (MP), high-parental heterosis (HP), and inbreeding depression (ID) for contents of different tocopherol forms were in the negative direction, suggesting that these traits are governed by recessive genes.
Plants 11 01779 g003
Table 1. Comparison of means of tocopherol content between various generations of the direct (RLC3 × NPJ203) and the reciprocal (NPJ203 × RLC3) crosses. Where, ATC, GTC, TTC (mean ± standard error) were presented in mg/kg, whereas AGR (ATC/GTC Ratio) in percentage.
Generations RLC3 × NPJ203 (Direct Cross)NPJ203 × RLC3 (Reciprocal Cross)
ATCGTCTTCAGR%ATCGTCTTCAGR%
RLC3 (P1)0.768 ± 0.03551.182 ± 0.51552.138 ± 0.5391.500.788 ± 0.03951.097 ± 0.34652.037 ± 0.3631.54
NPJ203 (P2)3.492 ± 0.00853.223 ± 0.42556.848 ± 0.4326.563.327 ± 0.09454.47 ± 0.37257.947 ± 0.4146.11
F10.815 ± 0.03150.418 ± 0.17451.188 ± 0.2931.620.833 ± 0.03550.903 ± 0.35851.883 ± 0.3631.64
F21.371 ± 0.07751.396 ± 0.24153.03 ± 0.3042.671.338 ± 0.07751.48 ± 0.20552.979 ± 0.2722.60
B10.853 ± 0.04550.366 ± 0.30251.373 ± 0.3281.691.626 ± 0.28552.527 ± 0.65554.287 ± 0.9111.72
B21.511 ± 0.24551.766 ± 0.63653.486 ± 0.8822.920.863 ± 0.04750.278 ± 0.24351.282 ± 0.2663.10
Table 2. Genetic parameters and components of variation for tocopherol content of different forms in RLC3 × NPJ203 cross.
Character $Genetic Parameters and Variation Components #
H2bH2nGA[h/d][E][D][H][F]√H/DF/√H×D[P]
ATC0.9970.6771.7243.1400.0020.9520.899−0.870.972−0.941−0.965
GTC0.9320.9384.7642.2190.4769.7143.227−4.690.576−0.838−1.749
TTC0.9490.8066.5332.7020.56317.9466.360−10.060.595−0.942−1.403
# H2b: broad-sense heritability, H2n: narrow-sense heritability, GA: genetic advance, [h/d]: degree of dominance, [D]: additive variance, [H]: dominance variance, [E]: environmental variance, [F]: correlation between additive and dominance components, [P]: potence ratio. $ ATC: alpha-tocopherol content, GTC: Gamma tocopherol content, TTC: total tocopherol content. Where h/d, D, H, E, and F denote the degree of dominance, additive, dominance, environmental components, and an indicator of correlation between D and H over all loci, respectively.
Table 3. Estimates of scaling test and types of gene action using generation means of tocopherol content traits in the cross RLC3 × NPJ203.
CharacterScaling TestGene Effects by Six Parameter Model
ABCD[m][d][h][i][j][l]Epistasis
ATC−0.1221.284 **0.4080.3771.371 **−0.659 **−2.069 **−0.7541.406 **1.916 **Duplicate
GTC0.8690.11−0.3430.66151.396 **−1.4 **−3.106−1.321−0.7592.3Absent
TTC0.5811.065−0.7581.20253.03 **−2.113 **−5.709−2.4040.4854.05Absent
Where [m], [d], [h], [i], [j], and [l] denote; mean, additive effect, dominance effect, additive × additive, additive × dominance, and dominance × dominance, respectively. ** Significant at 1%.
Table 4. Details of the parents used in the estimation of tocopherol content traits.
S.N.GenotypesPedigree/SourceOriginTocopherol Content Traits (mg/kg)
ATCGTCDTCAGRTTC
1RLC3JM06003 × JM06020PAU, Ludhiana, Indian0.7451.170.190.0152.10
2NPJ203(EJ9913 × SEJ8) × LaxmiIARI, New Delhi, Indian3.4953.140.150.0756.78
RLC3 is a canola-quality variety; NPJ203 is an elite breeding line of Indian mustard.
Publisher’s Note: MDPI stays neutral with regard to jurisdictional claims in published maps and institutional affiliations.

