
Extreme Precipitation and Flooding Contribute to Sudden Vegetation Dieback in a Coastal Salt Marsh

Abstract
:
1. Introduction
2. Methods
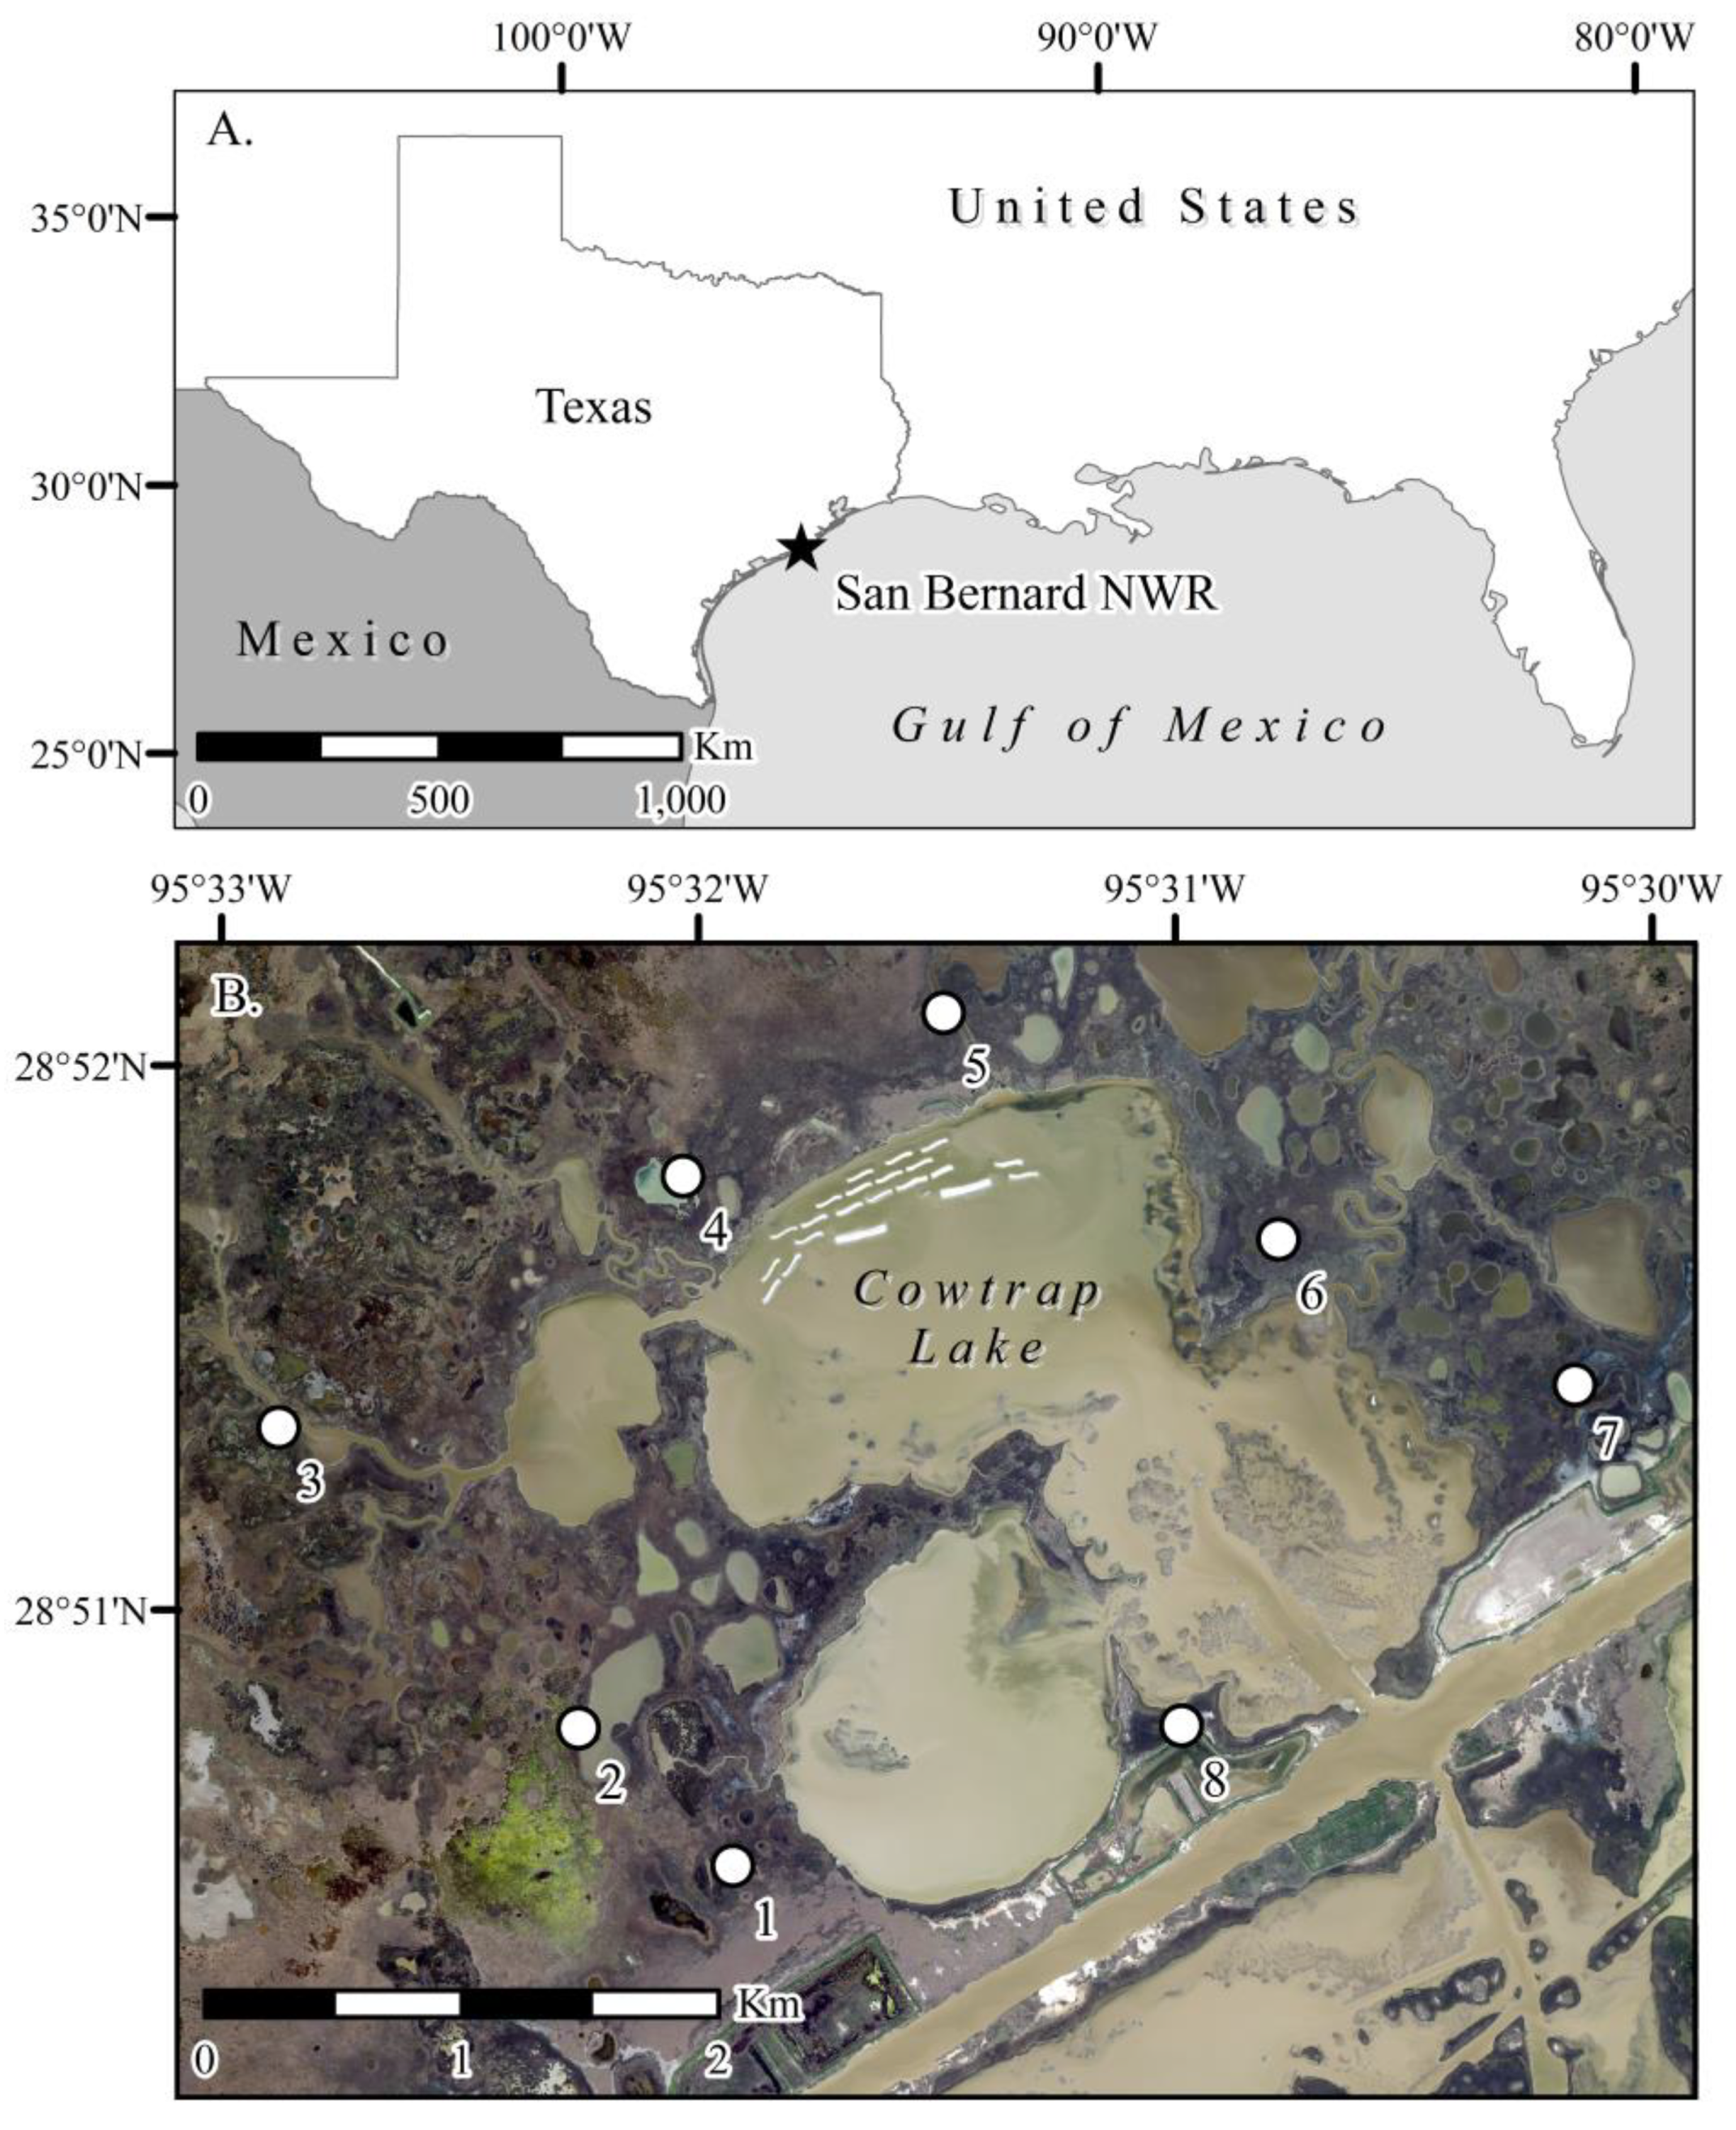
2.1. Study Location and Experimental Design
2.2. Remote Data Collection
2.3. Field Data Collection
2.4. Data Analyses
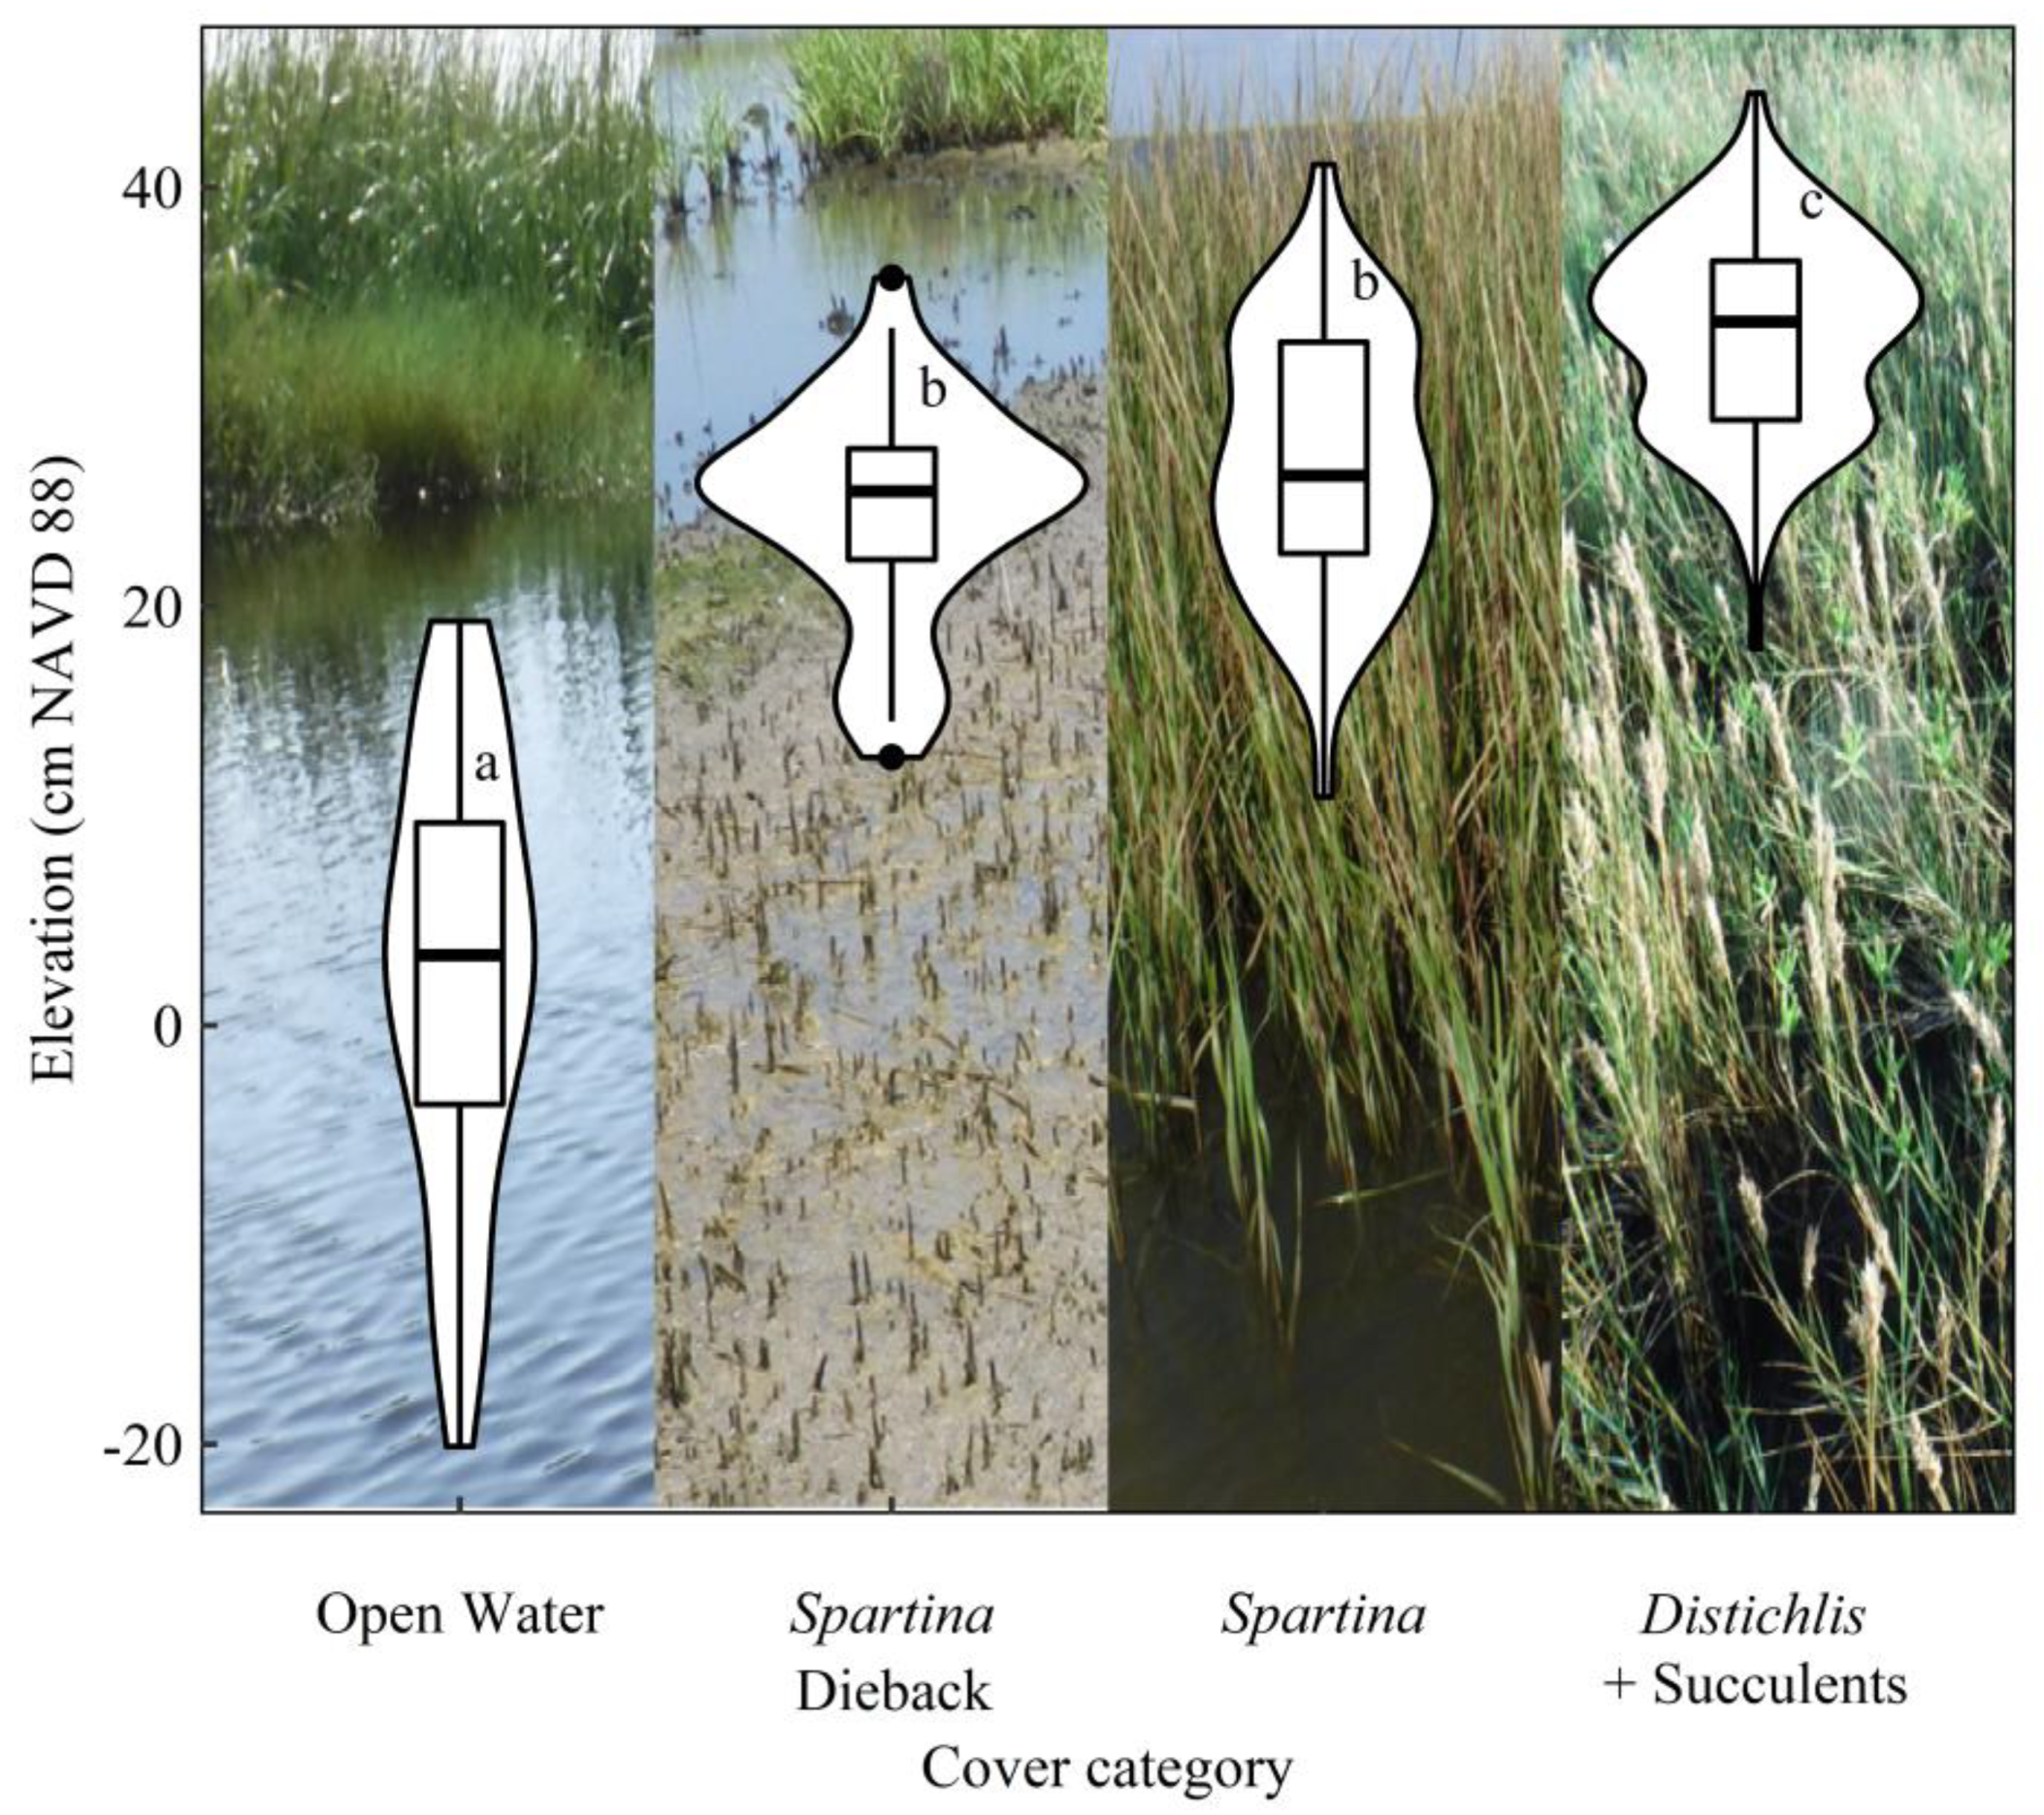
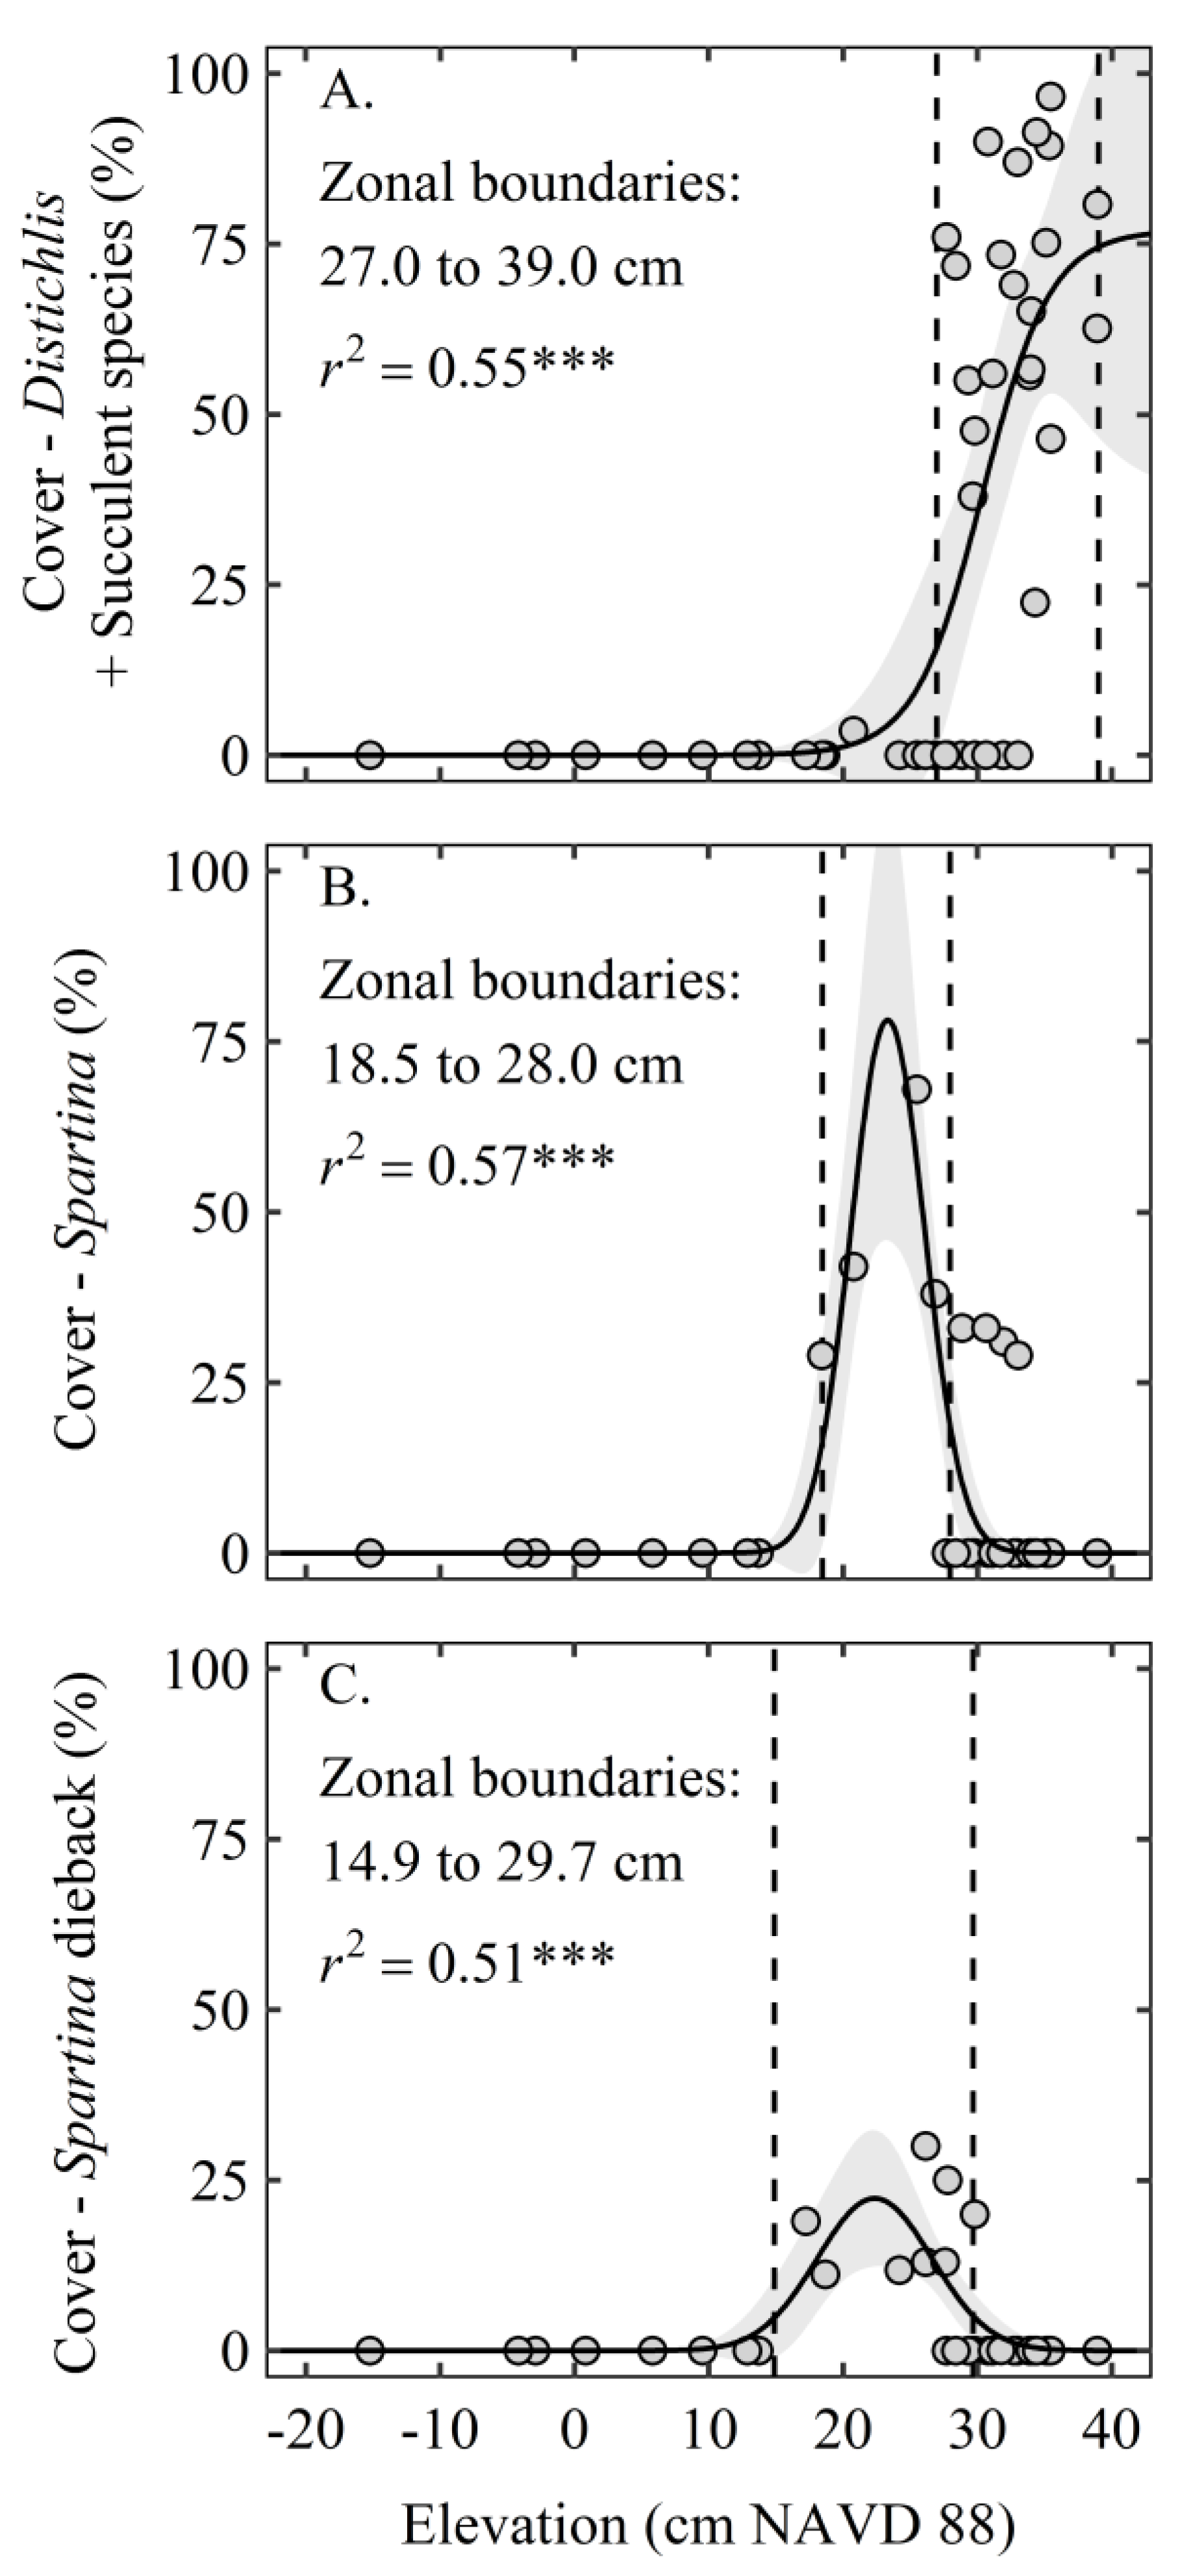
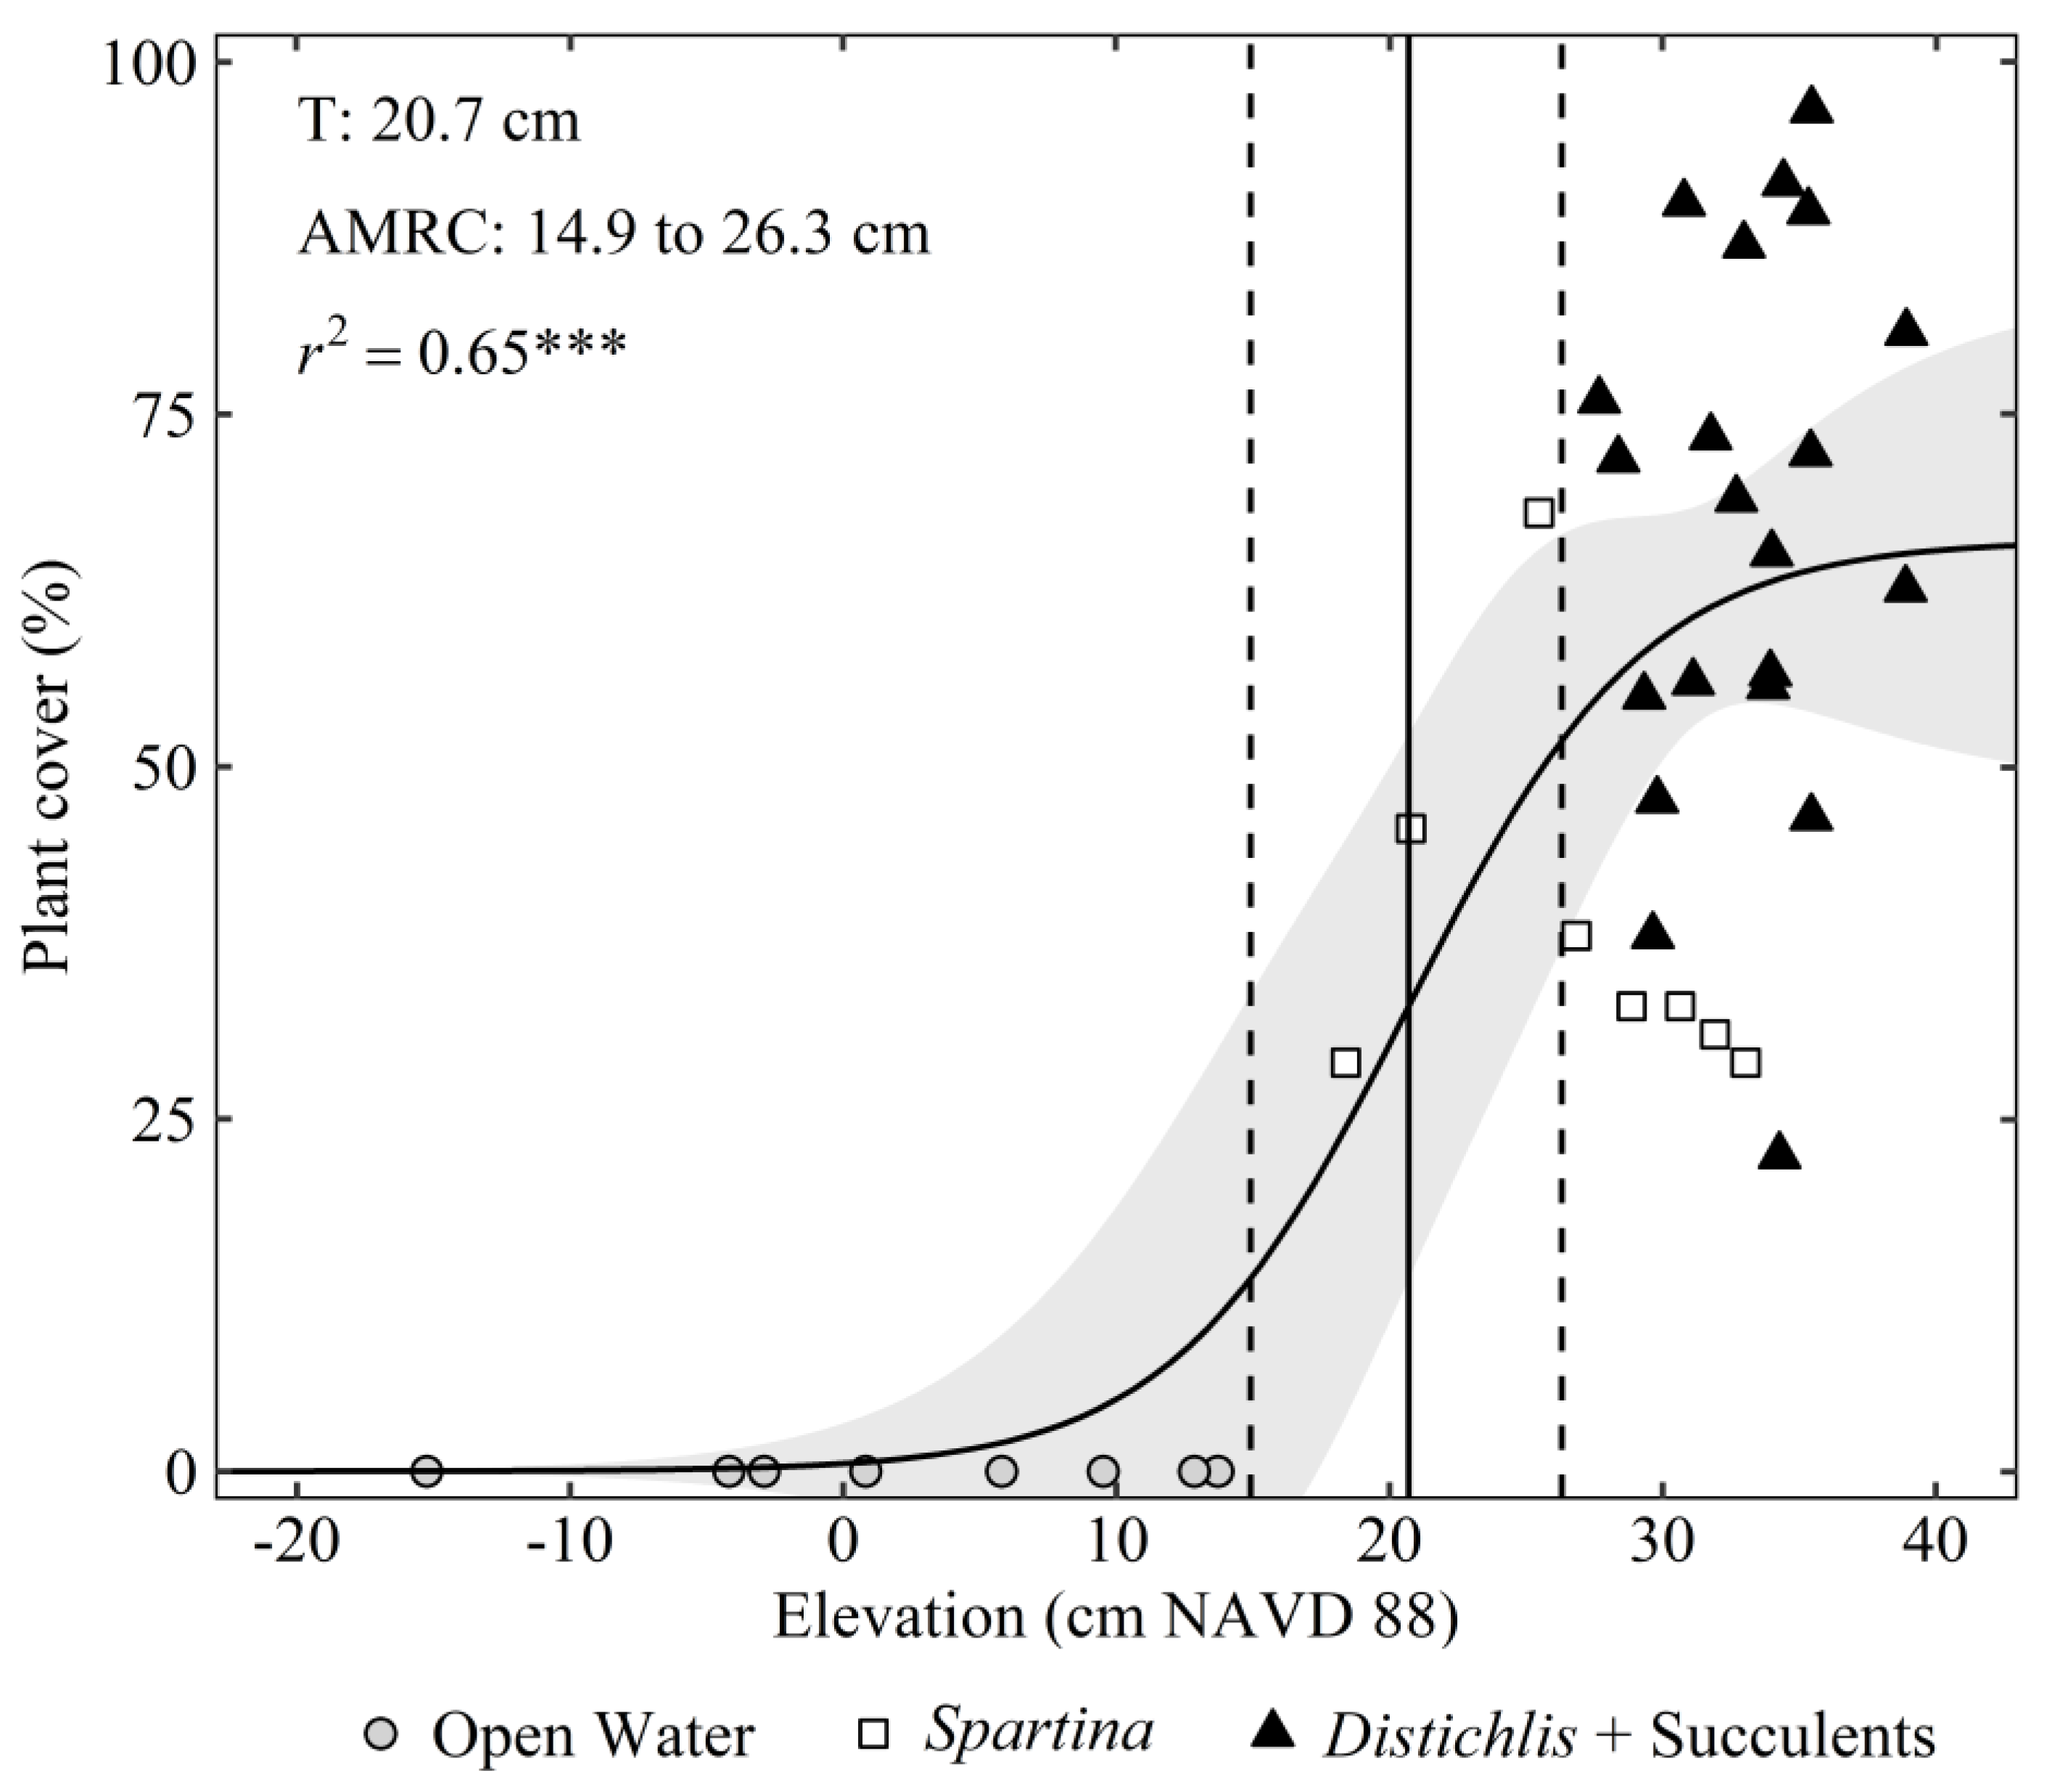
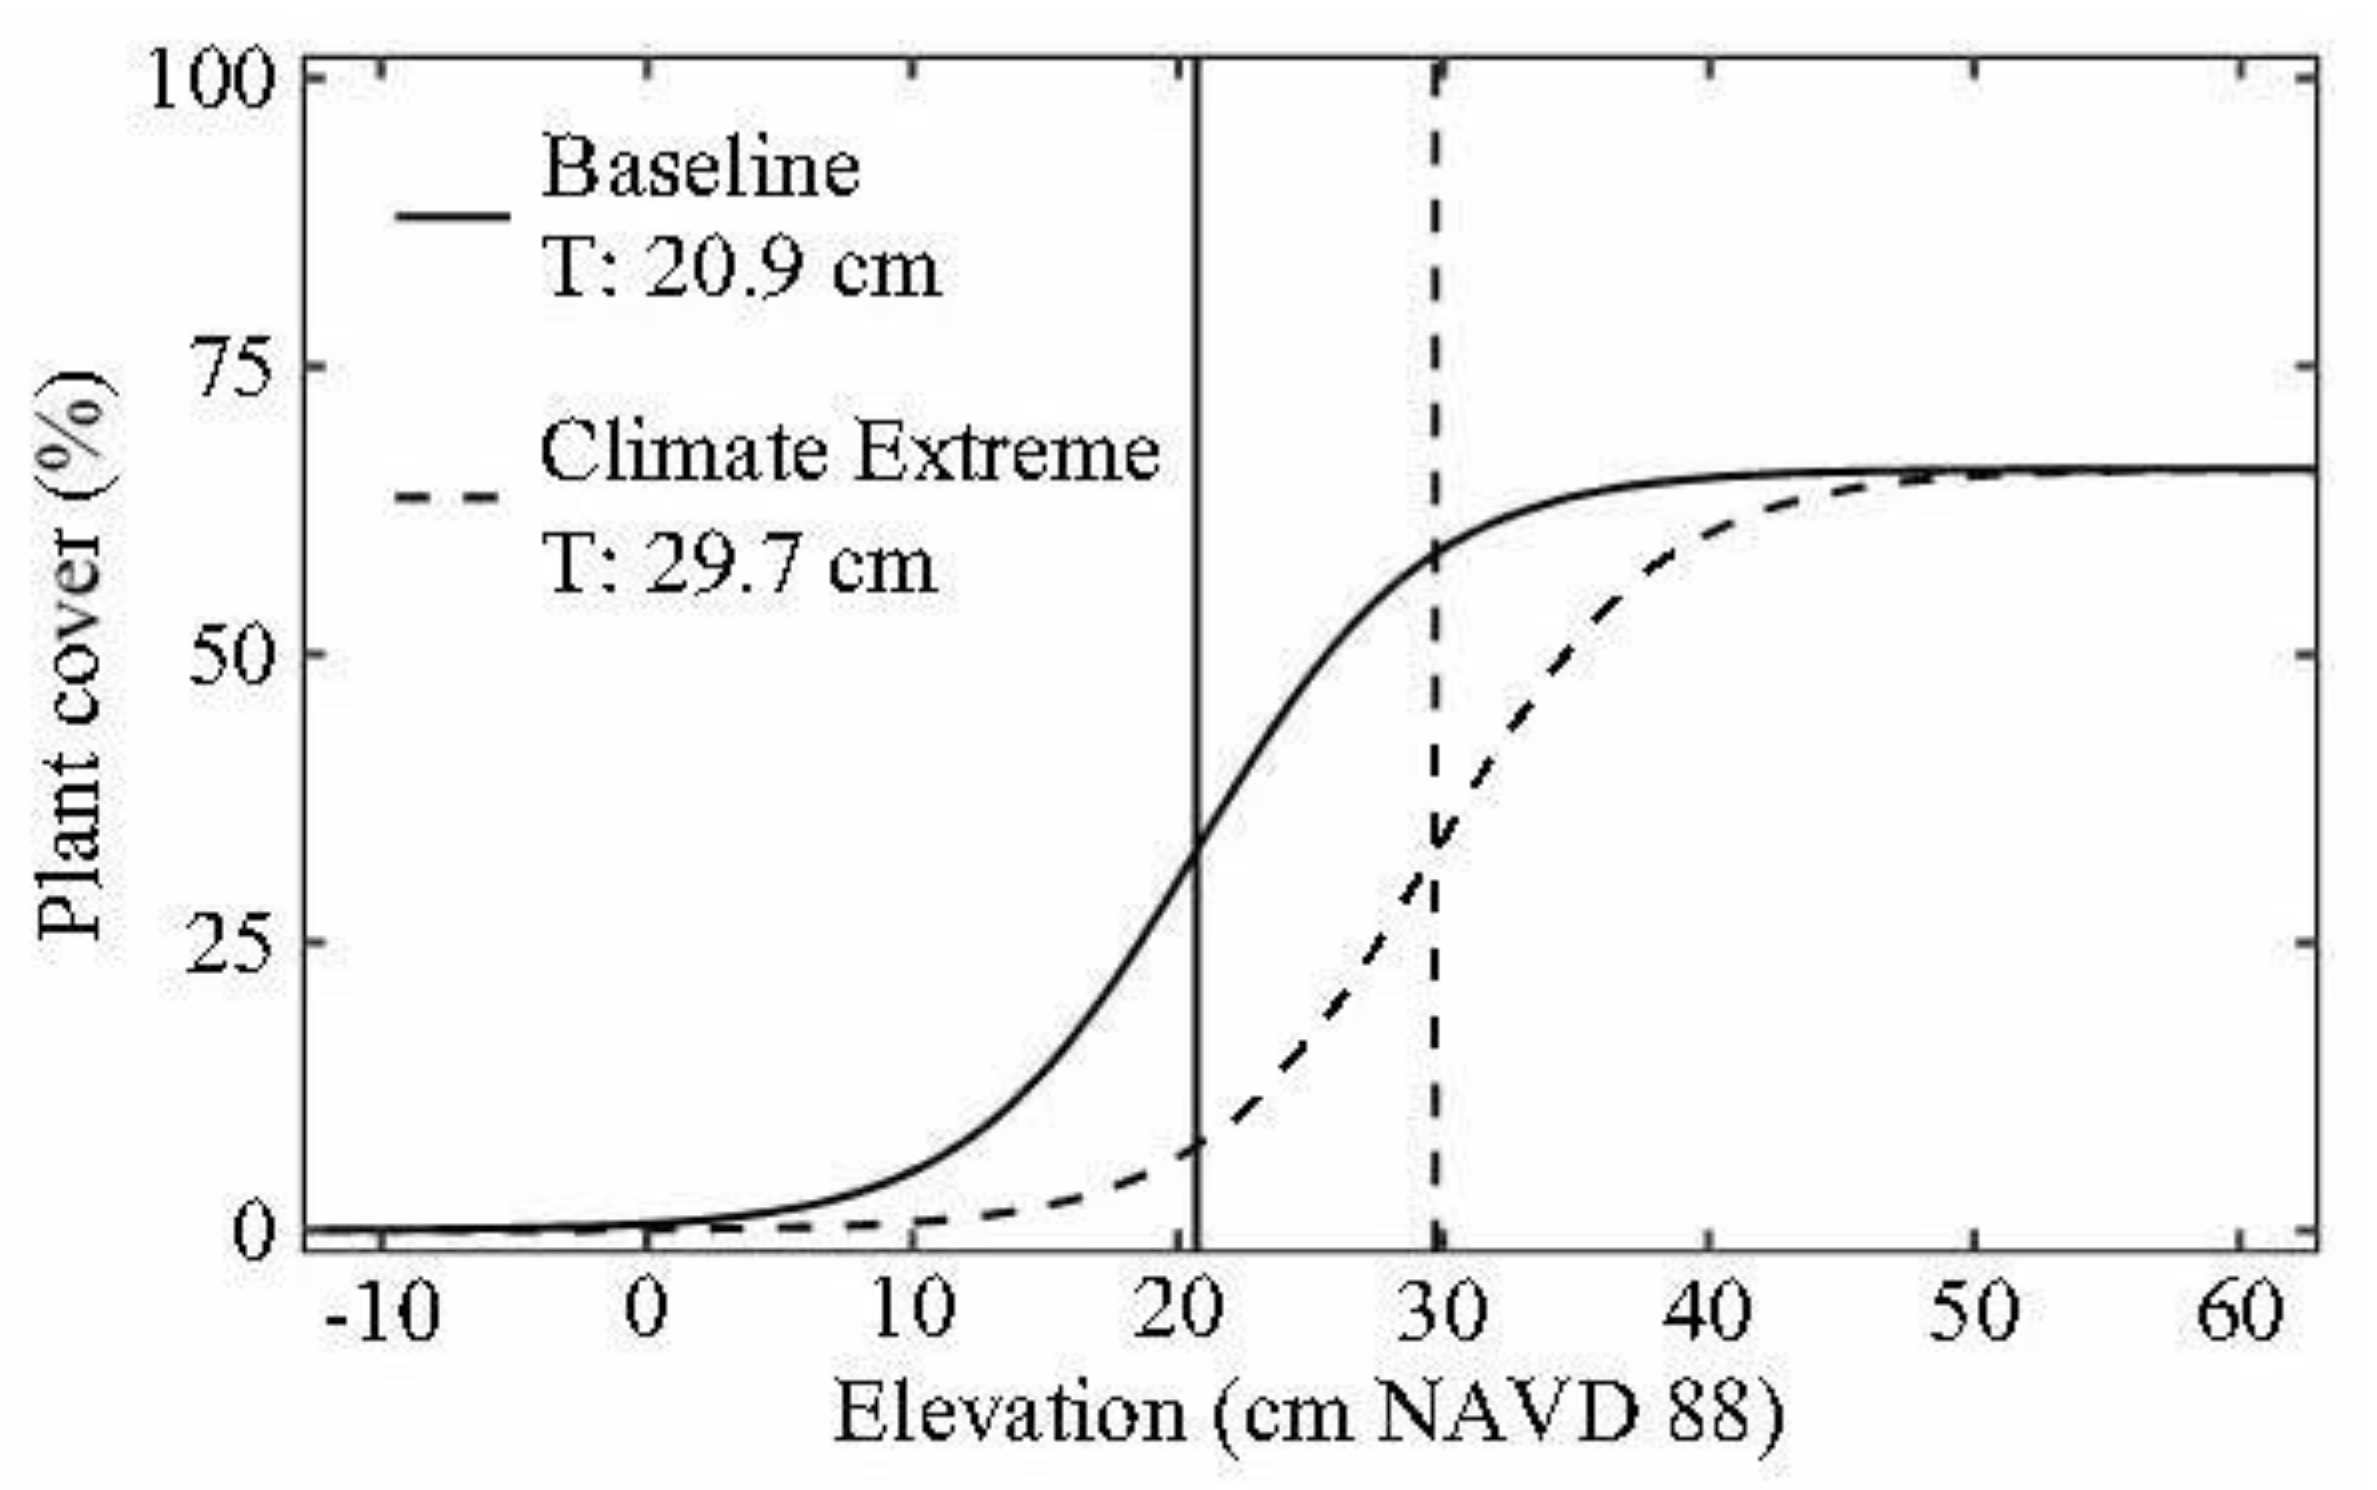
3. Results
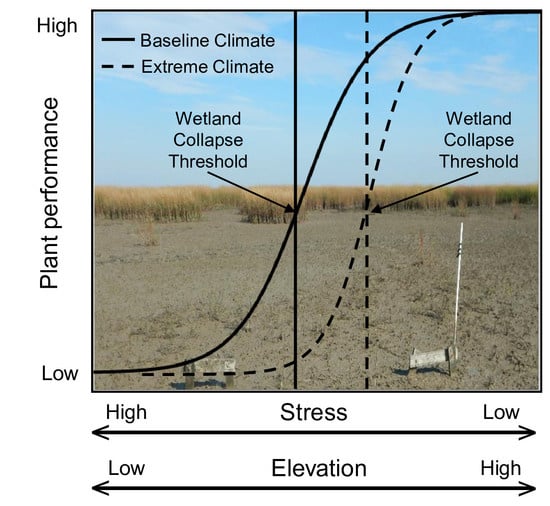
4. Discussion
Supplementary Materials
Author Contributions
Funding
Data Availability Statement
Acknowledgments
Conflicts of Interest
References
- Allen, M.R.; Dube, O.P.; Solecki, W.; Aragón-Durand, F.; Cramer, W.; Humphreys, S.; Kainuma, M.; Kala, J.; Mahowald, N.; Mulugetta, Y.; et al. Framing and Context. In Global Warming of 1.5 °C; An IPCC Special Report on the impacts of global warming of 1.5 °C above pre-industrial levels and related global greenhouse gas emission pathways, in the context of strengthening the global response to the threat of climate change, sustainable development, and efforts to eradicate poverty; Masson-Delmotte, V., Zhai, P., Pörtner, H.-O., Roberts, D., Skea, J., Shukla, P.R., Pirani, A., Moufouma-Okia, W., Péan, C., Pidcock, R., et al., Eds.; IPCC: Geneva, Switzerland, 2018; in press. [Google Scholar]
- Pörtner, H.O.; Roberts, D.C.; Masson-Delmotte, V.; Zhai, P.; Tignor, M.; Poloczanska, E.; Mintenbeck, K.; Alegría, A.; Nicolai, M.; Okem, A.; et al. IPCC Special Report on the Ocean and Cryosphere in a Changing Climate; IPCC: Geneva, Switzerland, 2019; in press. [Google Scholar]
- Kossin, J.; Hall, T.; Knutson, T.; Kunkel, K.; Trapp, R.; Waliser, D.; Wehner, M. Extreme storms. In Climate Science Special Report: A Sustained Assessment Activity of the U.S. Global Change Research Program; Wuebbles, D.J., Fahey, D.W., Hibbard, K.A., Dokken, D.J., Stewart, B.C., Maycock, T.K., Eds.; U.S. Global Change Research Program: Washington, DC, USA, 2017; pp. 375–404. [Google Scholar]
- Brown, V.M.; Keim, B.D.; Black, A.W. Climatology and trends in hourly precipitation for the southeast United States. J. Hydrometeorol. 2019, 20, 1737–1755. [Google Scholar] [CrossRef]
- Knutson, T.R.; McBride, J.L.; Chan, J.; Emanuel, K.; Holland, G.; Landsea, C.; Held, I.; Kossin, J.P.; Srivastava, A.K.; Sugi, M. Tropical cyclones and climate change. Nat. Geosci. 2010, 3, 157–163. [Google Scholar] [CrossRef]
- Sobel, A.H.; Camargo, S.J.; Hall, T.M.; Lee, C.-Y.; Tippett, M.K.; Wing, A.A. Human influence on tropical cyclone intensity. Science 2016, 353, 242–246. [Google Scholar] [CrossRef] [PubMed]
- Gutmann, E.D.; Rasmussen, R.M.; Liu, C.; Ikeda, K.; Bruyere, C.L.; Done, J.M.; Garrè, L.; Friis-Hansen, P.; Veldore, V. Changes in hurricanes from a 13-yr convection-permitting pseudo–global warming simulation. J. Clim. 2018, 31, 3643–3657. [Google Scholar] [CrossRef]
- Scoccimarro, E.; Gualdi, S.; Villarini, G.; Vecchi, G.A.; Zhao, M.; Walsh, K.; Navarra, A. Intense precipitation events associated with landfalling tropical cyclones in response to a warmer climate and increased CO2. J. Clim. 2014, 27, 4642–4654. [Google Scholar] [CrossRef]
- Jentsch, A.; Kreyling, J.; Beierkuhnlein, C. A new generation of climate-change experiments: Events, not trends. Front. Ecol. Environ. 2007, 5, 365–374. [Google Scholar] [CrossRef]
- Smith, M.D. The ecological role of climate extremes: Current understanding and future prospects. J. Ecol. 2011, 99, 651–655. [Google Scholar] [CrossRef]
- Fraser, M.W.; Kendrick, G.A.; Statton, J.; Hovey, R.K.; Zavala-Perez, A.; Walker, D.I. Extreme climate events lower resilience of foundation seagrass at edge of biogeographical range. J. Ecol. 2014, 102, 1528–1536. [Google Scholar] [CrossRef]
- Godfree, R.C.; Knerr, N.; Godfree, D.; Busby, J.; Robertson, B.; Encinas-Viso, F. Historical reconstruction unveils the risk of mass mortality and ecosystem collapse during pancontinental megadrought. Proc. Natl. Acad. Sci. 2019, 116, 15580–15589. [Google Scholar] [CrossRef] [PubMed]
- Babcock, R.C.; Bustamante, R.H.; Fulton, E.A.; Fulton, D.J.; Haywood, M.D.; Hobday, A.J.; Kenyon, R.; Matear, R.J.; Plagányi, E.E.; Richardson, A.J.; et al. Severe continental-scale impacts of climate change are happening now: Extreme climate events impact marine habitat forming communities along 45% of Australia’s coast. Front. Mar. Sci. 2019, 6, 411. [Google Scholar] [CrossRef]
- Sippo, J.Z.; Lovelock, C.E.; Santos, I.R.; Sanders, C.J.; Maher, D.T. Mangrove mortality in a changing climate: An overview. Estuar. Coast. Shelf Sci. 2018, 215, 241–249. [Google Scholar] [CrossRef]
- Alber, M.; Swenson, E.M.; Adamowicz, S.C.; Mendelssohn, I.A. Salt marsh dieback: An overview of recent events in the US. Estuar. Coast. Shelf Sci. 2008, 80, 1–11. [Google Scholar] [CrossRef]
- Allen, C.D.; Breshears, D.D.; McDowell, N.G. On underestimation of global vulnerability to tree mortality and forest die-off from hotter drought in the Anthropocene. Ecosphere 2015, 6, 129. [Google Scholar] [CrossRef]
- U.S. Geological Survey. Flood Event Viewer, Hurricane Harvey August 2017. Available online: https://stn.wim.usgs.gov/fev/#HarveyAug2017 (accessed on 25 August 2021).
- Wing, O.E.; Sampson, C.C.; Bates, P.D.; Quinn, N.; Smith, A.M.; Neal, J.C. A flood inundation forecast of Hurricane Harvey using a continental-scale 2D hydrodynamic model. J. Hydrol. 2019, X, 100039. [Google Scholar] [CrossRef]
- NOAA. Tides and Currents, Sargent, TX- Station ID: 8772985. Available online: https://tidesandcurrents.noaa.gov/stationhome.html?id=8772985 (accessed on 25 August 2021).
- Warren, R.S.; Niering, W.A. Vegetation change on a Northeast tidal marsh: Interaction of sea-level rise and marsh accretion. Ecology 1993, 74, 96–103. [Google Scholar] [CrossRef]
- Pennings, S.C.; Grant, M.B.; Bertness, M.D. Plant zonation in low-latitude salt marshes: Disentangling the roles of flooding, salinity and competition. J. Ecol. 2005, 93, 159–167. [Google Scholar] [CrossRef]
- Gabler, C.A.; Osland, M.J.; Grace, J.B.; Stagg, C.L.; Day, R.H.; Hartley, S.B.; Enwright, N.M.; From, A.S.; McCoy, M.L.; McLeod, J.L. Macroclimatic change expected to transform coastal wetland ecosystems this century. Nat. Clim. Chang. 2017, 7, 142–147. [Google Scholar] [CrossRef]
- Dunton, K.H.; Hardegree, B.; Whitledge, T.E. Response of estuarine marsh vegetation to interannual variations in precipitation. Estuaries 2001, 24, 851–861. [Google Scholar] [CrossRef]
- Alexander, H.D.; Dunton, K.H. Freshwater inundation effects on emergent vegetation of a hypersaline salt marsh. Estuar. Coasts 2002, 25, 1426–1435. [Google Scholar] [CrossRef]
- Forbes, M.G.; Dunton, K.H. Response of a subtropical estuarine marsh to local climatic change in the southwestern Gulf of Mexico. Estuar. Coasts 2006, 29, 1242–1254. [Google Scholar] [CrossRef]
- Beisner, B.E.; Haydon, D.T.; Cuddington, K. Alternative stable states in ecology. Front. Ecol. Environ. 2003, 1, 376–382. [Google Scholar] [CrossRef]
- Gorelick, N.; Hancher, M.; Dixon, M.; Ilyushchenko, S.; Thau, D.; Moore, R. Google Earth Engine: Planetary-scale geospatial analysis for everyone. Remote Sens. Environ. 2017, 202, 18–27. [Google Scholar] [CrossRef]
- Dwyer, J.L.; Roy, D.P.; Sauer, B.; Jenkerson, C.B.; Zhang, H.K.; Lymburner, L. Analysis ready data: Enabling analysis of the Landsat archive. Remote Sens. 2018, 10, 1363. [Google Scholar] [CrossRef]
- Vermote, E.; Justice, C.; Claverie, M.; Franch, B. Preliminary analysis of the performance of the Landsat 8/OLI land surface reflectance product. Remote Sens. Environ. 2016, 185, 46–56. [Google Scholar] [CrossRef] [PubMed]
- Gao, Y.; Abdel-Salam, M.; Chen, K.; Wojciechowski, A. Point real-time kinematic positioning. In A Window on the Future of Geodesy; Sansò, F., Ed.; Springer: Berlin/Heidelberg, Germany, 2005; pp. 77–82. [Google Scholar]
- Chen, X.; Allison, T.; Cao, W.; Ferguson, K.; Grünig, S.; Gomez, V.; Kipka, A.; Köhler, J.; Landau, H.; Leandro, R.; et al. Trimble RTX, an innovative new approach for network RTK. In Proceedings of ION GNSS-2011; Institute of Navigation: Portland, OR, USA, 2011; pp. 2214–2219. [Google Scholar]
- National Geodetic Survey. NGS Data Sheet, PID DP0702. Available online: https://geodesy.noaa.gov/cgi-bin/ds_pid.prl/2 (accessed on 25 August 2021).
- Li, P.; Jiang, L.; Feng, Z. Cross-Comparison of Vegetation Indices Derived from Landsat-7 Enhanced Thematic Mapper Plus (ETM+) and Landsat-8 Operational Land Imager (OLI) Sensors. Remote Sens. 2014, 6, 310–329. [Google Scholar] [CrossRef]
- Hufkens, K.; Ceulemans, R.; Scheunders, P. Estimating the ecotone width in patchy ecotones using a sigmoid wave approach. Ecol. Inform. 2008, 3, 97–104. [Google Scholar] [CrossRef]
- Frazier, A.E.; Wang, L. Modeling landscape structure response across a gradient of land cover intensity. Landsc. Ecol. 2013, 28, 233–246. [Google Scholar] [CrossRef]
- R Core Team 2020. R: A language and environment for statistical computing. R Foundation for Statistical Computing. Vienna, Austria. Available online: https://www.R-project.org/ (accessed on 1 May 2021).
- NOAA National Weather Service. Record-Breaking Atlantic Hurricane Season Draws to an End. News and Features. 2021. Available online: https://www.noaa.gov/media-release/record-breaking-atlantic-hurricane-season-draws-to-end (accessed on 2 January 2021).
- Van Oldenborgh, G.J.; Van Der Wiel, K.; Sebastian, A.; Singh, R.; Arrighi, J.; Otto, F.; Haustein, K.; Li, S.; Vecchi, G.; Cullen, H. Attribution of Extreme Rainfall from Hurricane Harvey, August 2017. Environ. Res. Lett. 2017, 12, 124009. [Google Scholar] [CrossRef]
- Aryal, Y.N.; Villarini, G.; Zhang, W.; Vecchi, G.A. Long term changes in flooding and heavy rainfall associated with North Atlantic tropical cyclones: Roles of the North Atlantic Oscillation and El Niño-Southern Oscillation. J. Hydrol. 2018, 559, 698–710. [Google Scholar] [CrossRef]
- Khouakhi, A.; Villarini, G.; Vecchi, G.A. Contribution of tropical cyclones to rainfall at the global scale. J. Clim. 2017, 30, 359–372. [Google Scholar] [CrossRef]
- Kunkel, K.E.; Easterling, D.R.; Kristovich, D.A.; Gleason, B.; Stoecker, L.; Smith, R. Recent increases in US heavy precipitation associated with tropical cyclones. Geophys. Res. Lett. 2010, 37. [Google Scholar] [CrossRef]
- McKee, K.L.; Cherry, J.A. Hurricane Katrina sediment slowed elevation loss in subsiding brackish marshes of the Mississippi River delta. Wetlands 2009, 29, 2–15. [Google Scholar] [CrossRef]
- Lugo, A.E.; Snedaker, S.C. The ecology of mangroves. Annu. Rev. Ecol. Syst. 1974, 5, 39–64. [Google Scholar] [CrossRef]
- Michener, W.K.; Blood, E.R.; Bildstein, K.L.; Brinson, M.M.; Gardner, L.R. Climate change, hurricanes and tropical storms, and rising sea level in coastal wetlands. Ecol. Appl. 1997, 7, 770–801. [Google Scholar] [CrossRef]
- Pennings, S.C.; Bertness, M.D. Salt Marsh Communities. In Marine Community Ecology; Bertness, M.D., Gaines, S.D., Hay, M., Eds.; Sinauer Associates: Sunderland, MA, USA, 2001. [Google Scholar]
- Feher, L.C.; Osland, M.J.; Anderson, G.H.; Vervaeke, W.C.; Krauss, K.W.; Whelan, K.R.T.; Balentine, K.M.; Tiling-Range, G.; Smith, T.J., III; Cahoon, D.R. The long-term effects of hurricanes Wilma and Irma on soil elevation change in Everglades mangrove forests. Ecosystems 2020, 23, 917–931. [Google Scholar] [CrossRef]
- Krauss, K.; Osland, M.J. Tropical cyclones and the organization of mangrove forests: A review. Ann. Bot. 2020, 125, 213–234. [Google Scholar] [CrossRef] [PubMed]
- Cahoon, D.R.; Hensel, P.; Rybczyk, J.; McKee, K.L.; Proffitt, C.E.; Perez, B.C. Mass tree mortality leads to mangrove peat collapse at Bay Islands, Honduras after Hurricane Mitch. J. Ecol. 2003, 91, 1093–1105. [Google Scholar] [CrossRef]
- Wanless, H.R.; Vlaswinkel, B.M. Coastal Landscape and Channel Evolution Affecting Critical Habitats at Cape Sable, Everglades National Park, Florida; Final Report to Everglades National Park; University of Miami: Coral Gables, FL, USA.
- Osland, M.J.; Feher, L.C.; Anderson, G.H.; Vervaeke, W.C.; Krauss, K.W.; Whelan, K.R.T.; Balentine, K.M.; Tiling-Range, G.; Smith, T.J., III; Cahoon, D.R. A tropical cyclone-induced ecological regime shift: Mangrove conversion to mudflat in Florida’s Everglades National Park (Florida, USA). Wetlands 2020, 40, 1445–1458. [Google Scholar] [CrossRef]
- Stagg, C.L.; Osland, M.J.; Moon, J.A.; Hall, C.T.; Feher, L.C.; Jones, W.R.; Couvillion, B.R.; Hartley, S.B.; Vervaeke, W.C. Quantifying hydrologic controls on local-and landscape-scale indicators of coastal wetland loss. Ann. Bot. 2020, 125, 365–376. [Google Scholar] [CrossRef] [PubMed]
- Elmer, W.H.; Useman, S.; Schneider, R.W.; Marra, R.E.; LaMondia, J.A.; Mendelssohn, I.A.; Jiménez-Gasco, M.M.; Caruso, F.L. Sudden vegetation dieback in Atlantic and Gulf Coast salt marshes. Plant Dis. 2013, 97, 436–445. [Google Scholar] [CrossRef] [PubMed]
- McKee, K.L.; Mendelssohn, I.A.; Materne, M.D. Acute salt marsh dieback in the Mississippi River deltaic plain: A drought-induced phenomenon? Glob. Ecol. Biogeogr. 2004, 13, 65–73. [Google Scholar] [CrossRef]
- Mendelssohn, I.A.; McKee, K.L.; Patrick, W.H. Oxygen deficiency in Spartina alterniflora roots: Metabolic adaptation to anoxia. Science 1981, 214, 439–441. [Google Scholar] [CrossRef] [PubMed]
- Jones, S.F.; Stagg, C.L.; Krauss, K.W.; Hester, M.W. Flooding alters plant-mediated carbon cycling independently of elevated atmospheric CO2 concentrations. J. Geophys. Res. Biogeosci. 2018, 123, 1976–1987. [Google Scholar]
- Feher, L.C.; Osland, M.J.; Griffith, K.T.; Grace, J.B.; Howard, R.J.; Stagg, C.L.; Enwright, N.M.; Krauss, K.W.; Gabler, C.A.; Day, R.H.; et al. Linear and nonlinear effects of temperature and precipitation on ecosystem properties in tidal saline wetlands. Ecosphere 2017, 8, e01956. [Google Scholar] [CrossRef]
- Bender, E.A.; Case, T.J.; Gilpin, M.E. Perturbation experiments in community ecology: Theory and practice. Ecology 1984, 65, 1–13. [Google Scholar] [CrossRef]
- Harris, R.M.B.; Beaumont, L.J.; Vance, T.R.; Tozer, C.R.; Remenyi, T.A.; Perkins-Kirkpatrick, S.E.; Mitchell, P.J.; Nicotra, A.B.; McGregor, S.; Andrew, N.R.; et al. Biological responses to the press and pulse of climate trends and extreme events. Nat. Clim. Chang. 2018, 8, 579–587. [Google Scholar] [CrossRef]
- Thompson, J.N.; Reichman, O.J.; Morin, P.J.; Polis, G.A.; Power, M.E.; Sterner, R.W.; Couch, C.A.; Gough, L.; Holt, R.; Hooper, D.U.; et al. Frontiers of Ecology: As ecological research enters a new era of collaboration, integration, and technological sophistication, four frontiers seem paramount for understanding how biological and physical processes interact over multiple spatial and temporal scales to shape the earth’s biodiversity. BioScience 2001, 51, 15–24. [Google Scholar]
- He, Q.; Silliman, B.R.; Liu, Z.; Cui, B. Natural enemies govern ecosystem resilience in the face of extreme droughts. Ecol. Lett. 2017, 20, 194–201. [Google Scholar] [CrossRef] [PubMed]
- Jones, S.F.; Stagg, C.L.; Yando, E.; James, R.W.; Buffington, K.; Hester, M. Stress gradients interact with disturbance to reveal alternative states in salt marsh: Multivariate resilience at the landscape scale. J. Ecol. 2020. [Google Scholar] [CrossRef]
- Holdredge, C.; Bertness, M.D.; Altieri, A.H. Role of crab herbivory in die-off of New England salt marshes. Conserv. Biol. 2020, 23, 672–679. [Google Scholar] [CrossRef]
- Silliman, B.R.; Van De Koppel, J.; Bertness, M.D.; Stanton, L.E.; Mendelssohn, I.A. Drought, snails, and large-scale die-off of southern US salt marshes. Science 2005, 310, 1803–1806. [Google Scholar] [CrossRef] [PubMed]
- Elmer, W.H.; Marra, R.E. New species of Fusarium associated with dieback of Spartina alterniflora in Atlantic salt marshes. Mycologia 2011, 103, 806–819. [Google Scholar] [CrossRef] [PubMed]
- Silliman, B.R.; McCoy, M.W.; Angelini, C.; Holt, R.D.; Griffin, J.N.; van de Koppel, J. Consumer fronts, global change, and runaway collapse in ecosystems. Annu. Rev. Ecol. Evol. Syst. 2013, 44, 503–538. [Google Scholar] [CrossRef]


Publisher’s Note: MDPI stays neutral with regard to jurisdictional claims in published maps and institutional affiliations. |
© 2021 by the authors. Licensee MDPI, Basel, Switzerland. This article is an open access article distributed under the terms and conditions of the Creative Commons Attribution (CC BY) license (https://creativecommons.org/licenses/by/4.0/).
Share and Cite
Stagg, C.L.; Osland, M.J.; Moon, J.A.; Feher, L.C.; Laurenzano, C.; Lane, T.C.; Jones, W.R.; Hartley, S.B. Extreme Precipitation and Flooding Contribute to Sudden Vegetation Dieback in a Coastal Salt Marsh. Plants 2021, 10, 1841. https://doi.org/10.3390/plants10091841
Stagg CL, Osland MJ, Moon JA, Feher LC, Laurenzano C, Lane TC, Jones WR, Hartley SB. Extreme Precipitation and Flooding Contribute to Sudden Vegetation Dieback in a Coastal Salt Marsh. Plants. 2021; 10(9):1841. https://doi.org/10.3390/plants10091841
Chicago/Turabian StyleStagg, Camille LaFosse, Michael J. Osland, Jena A. Moon, Laura C. Feher, Claudia Laurenzano, Tiffany C. Lane, William R. Jones, and Stephen B. Hartley. 2021. "Extreme Precipitation and Flooding Contribute to Sudden Vegetation Dieback in a Coastal Salt Marsh" Plants 10, no. 9: 1841. https://doi.org/10.3390/plants10091841