

Exploring Spatiotemporal Patterns of Expressway Traffic Accidents Based on Density Clustering and Bayesian Network

Abstract
:1. Introduction
2. Literature Review
3. Materials and Methods
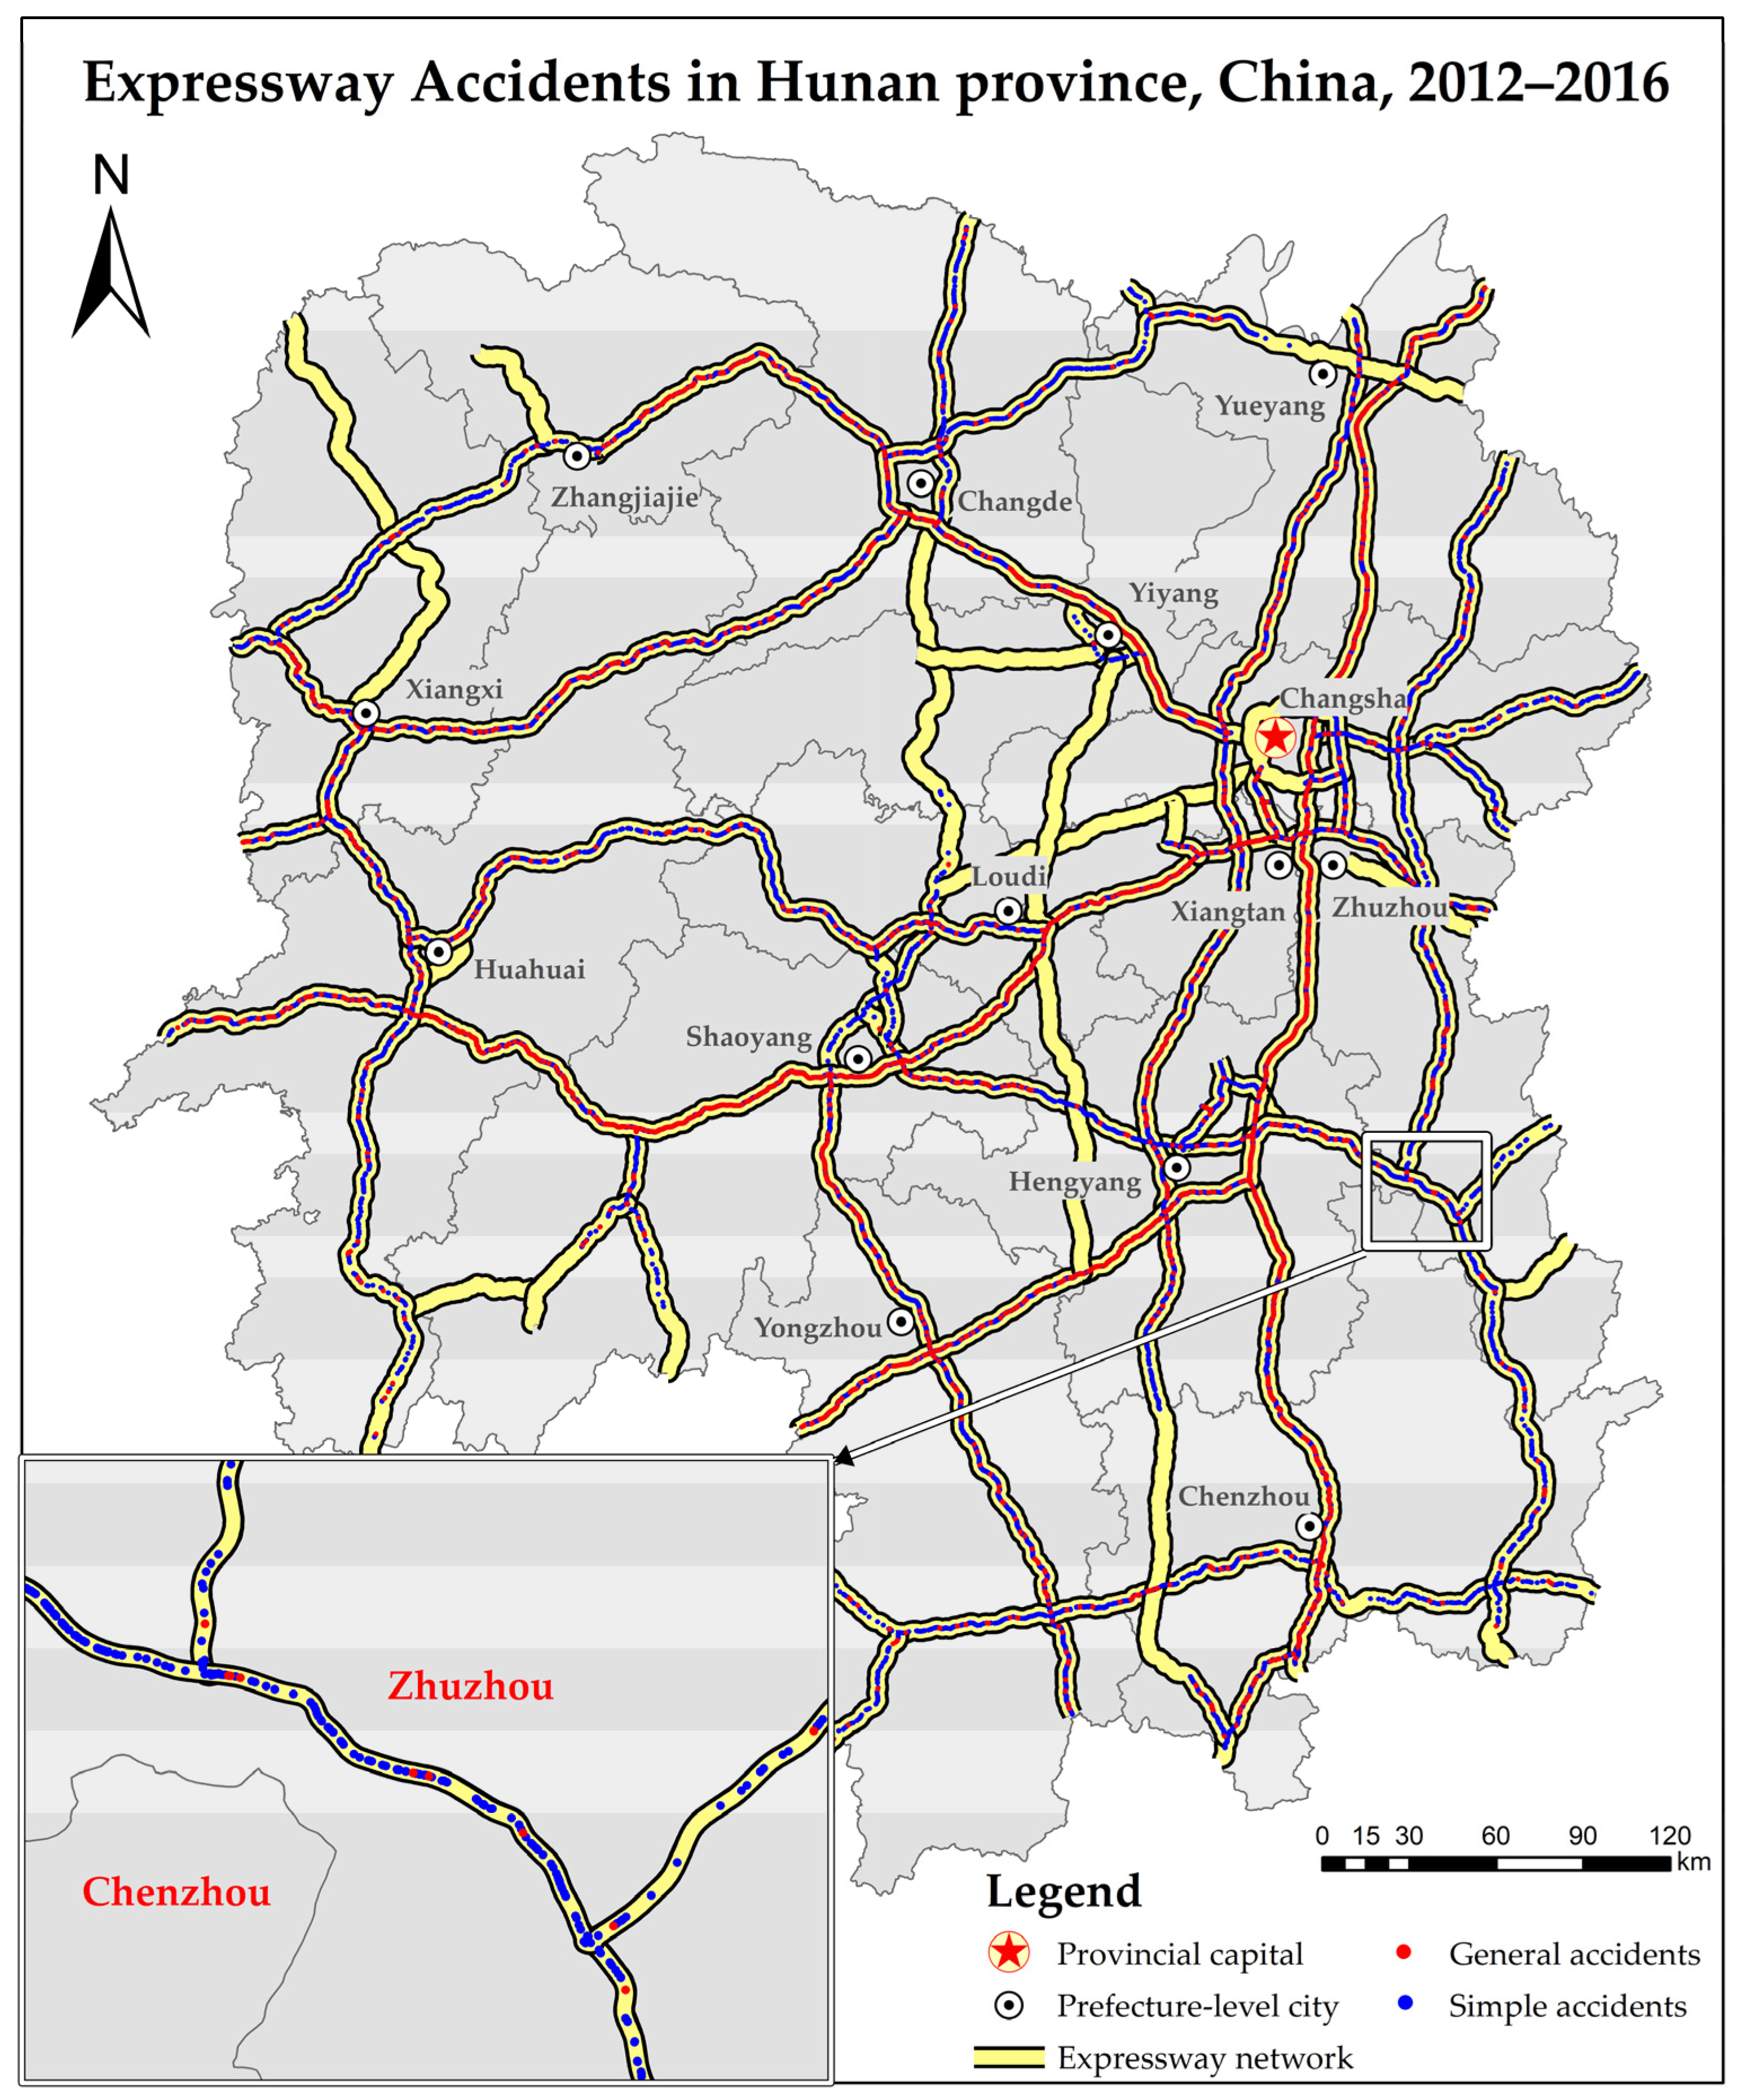
3.1. Study Area and Data Preprocessing
3.2. Spatiotemporal Density-Based Accident Clustering for Black Spot Identification
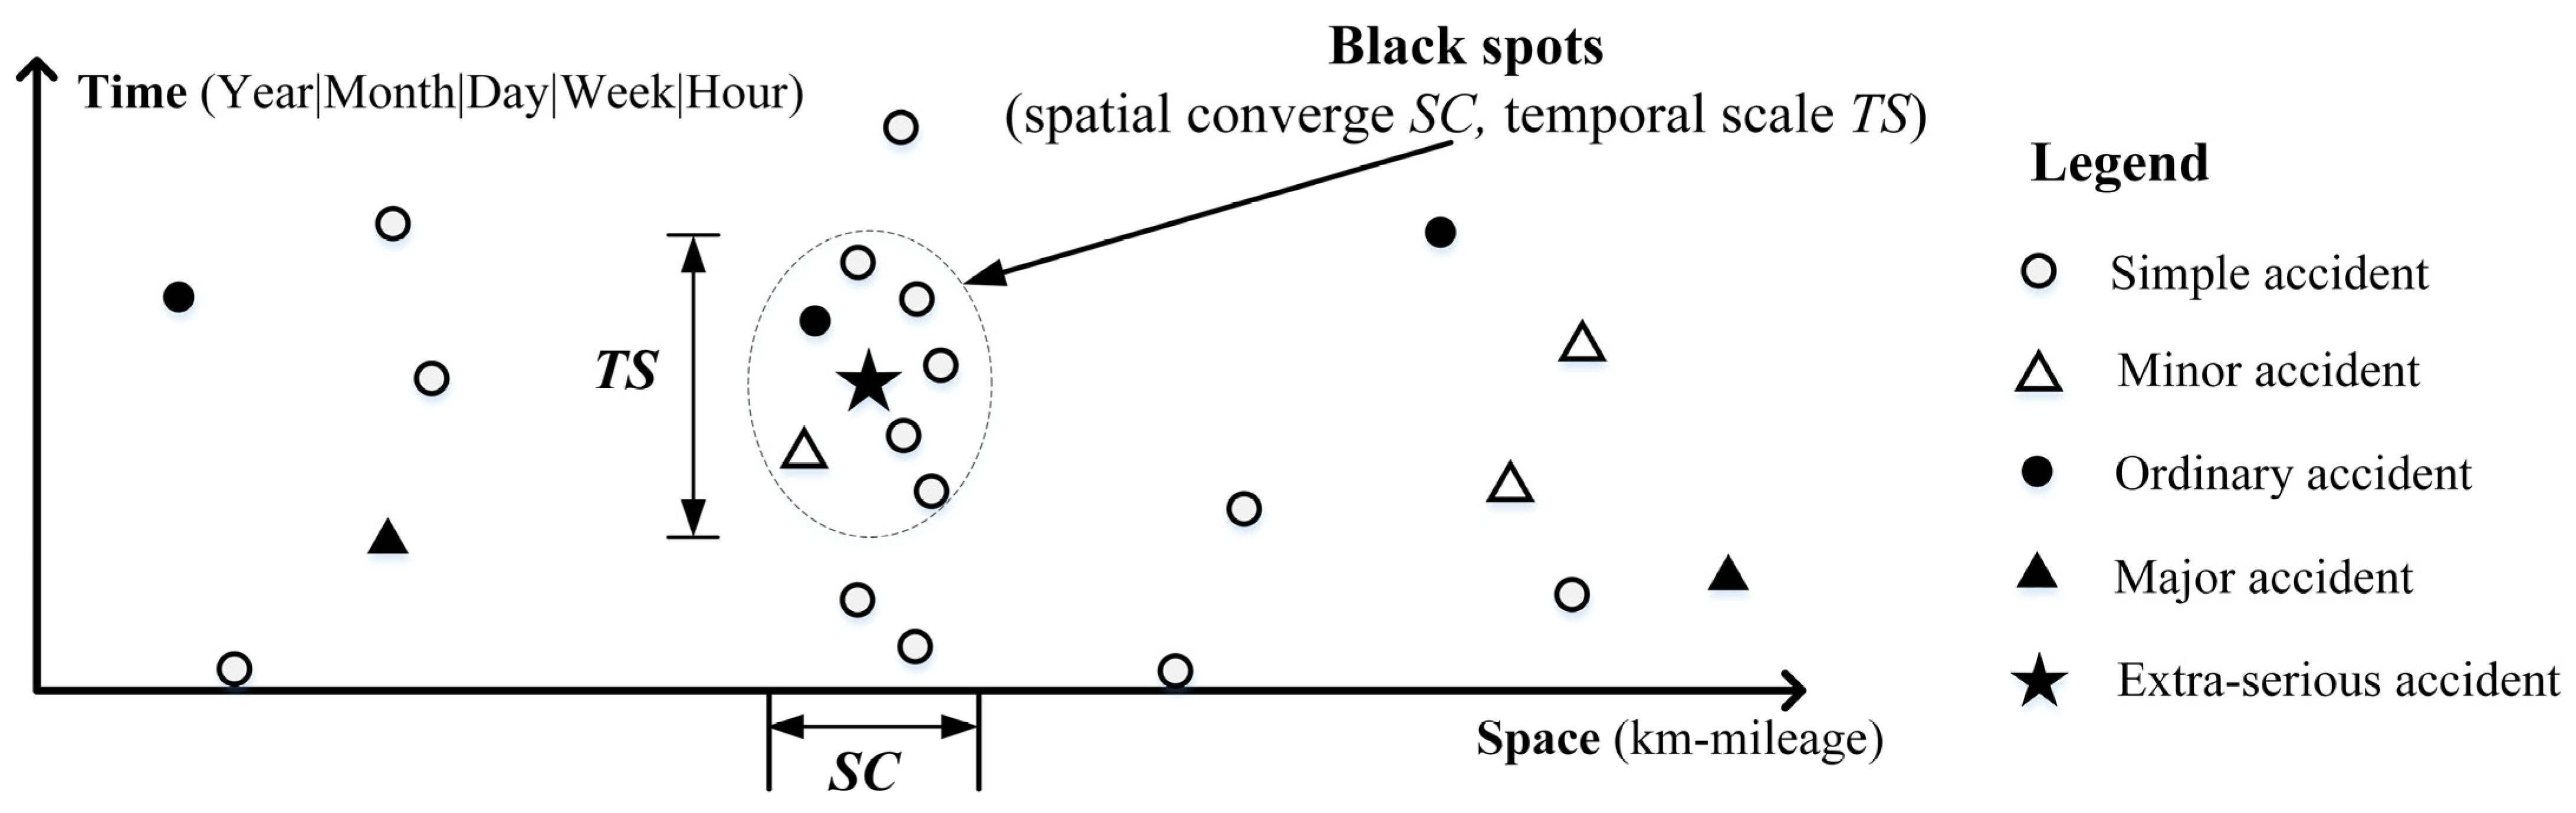
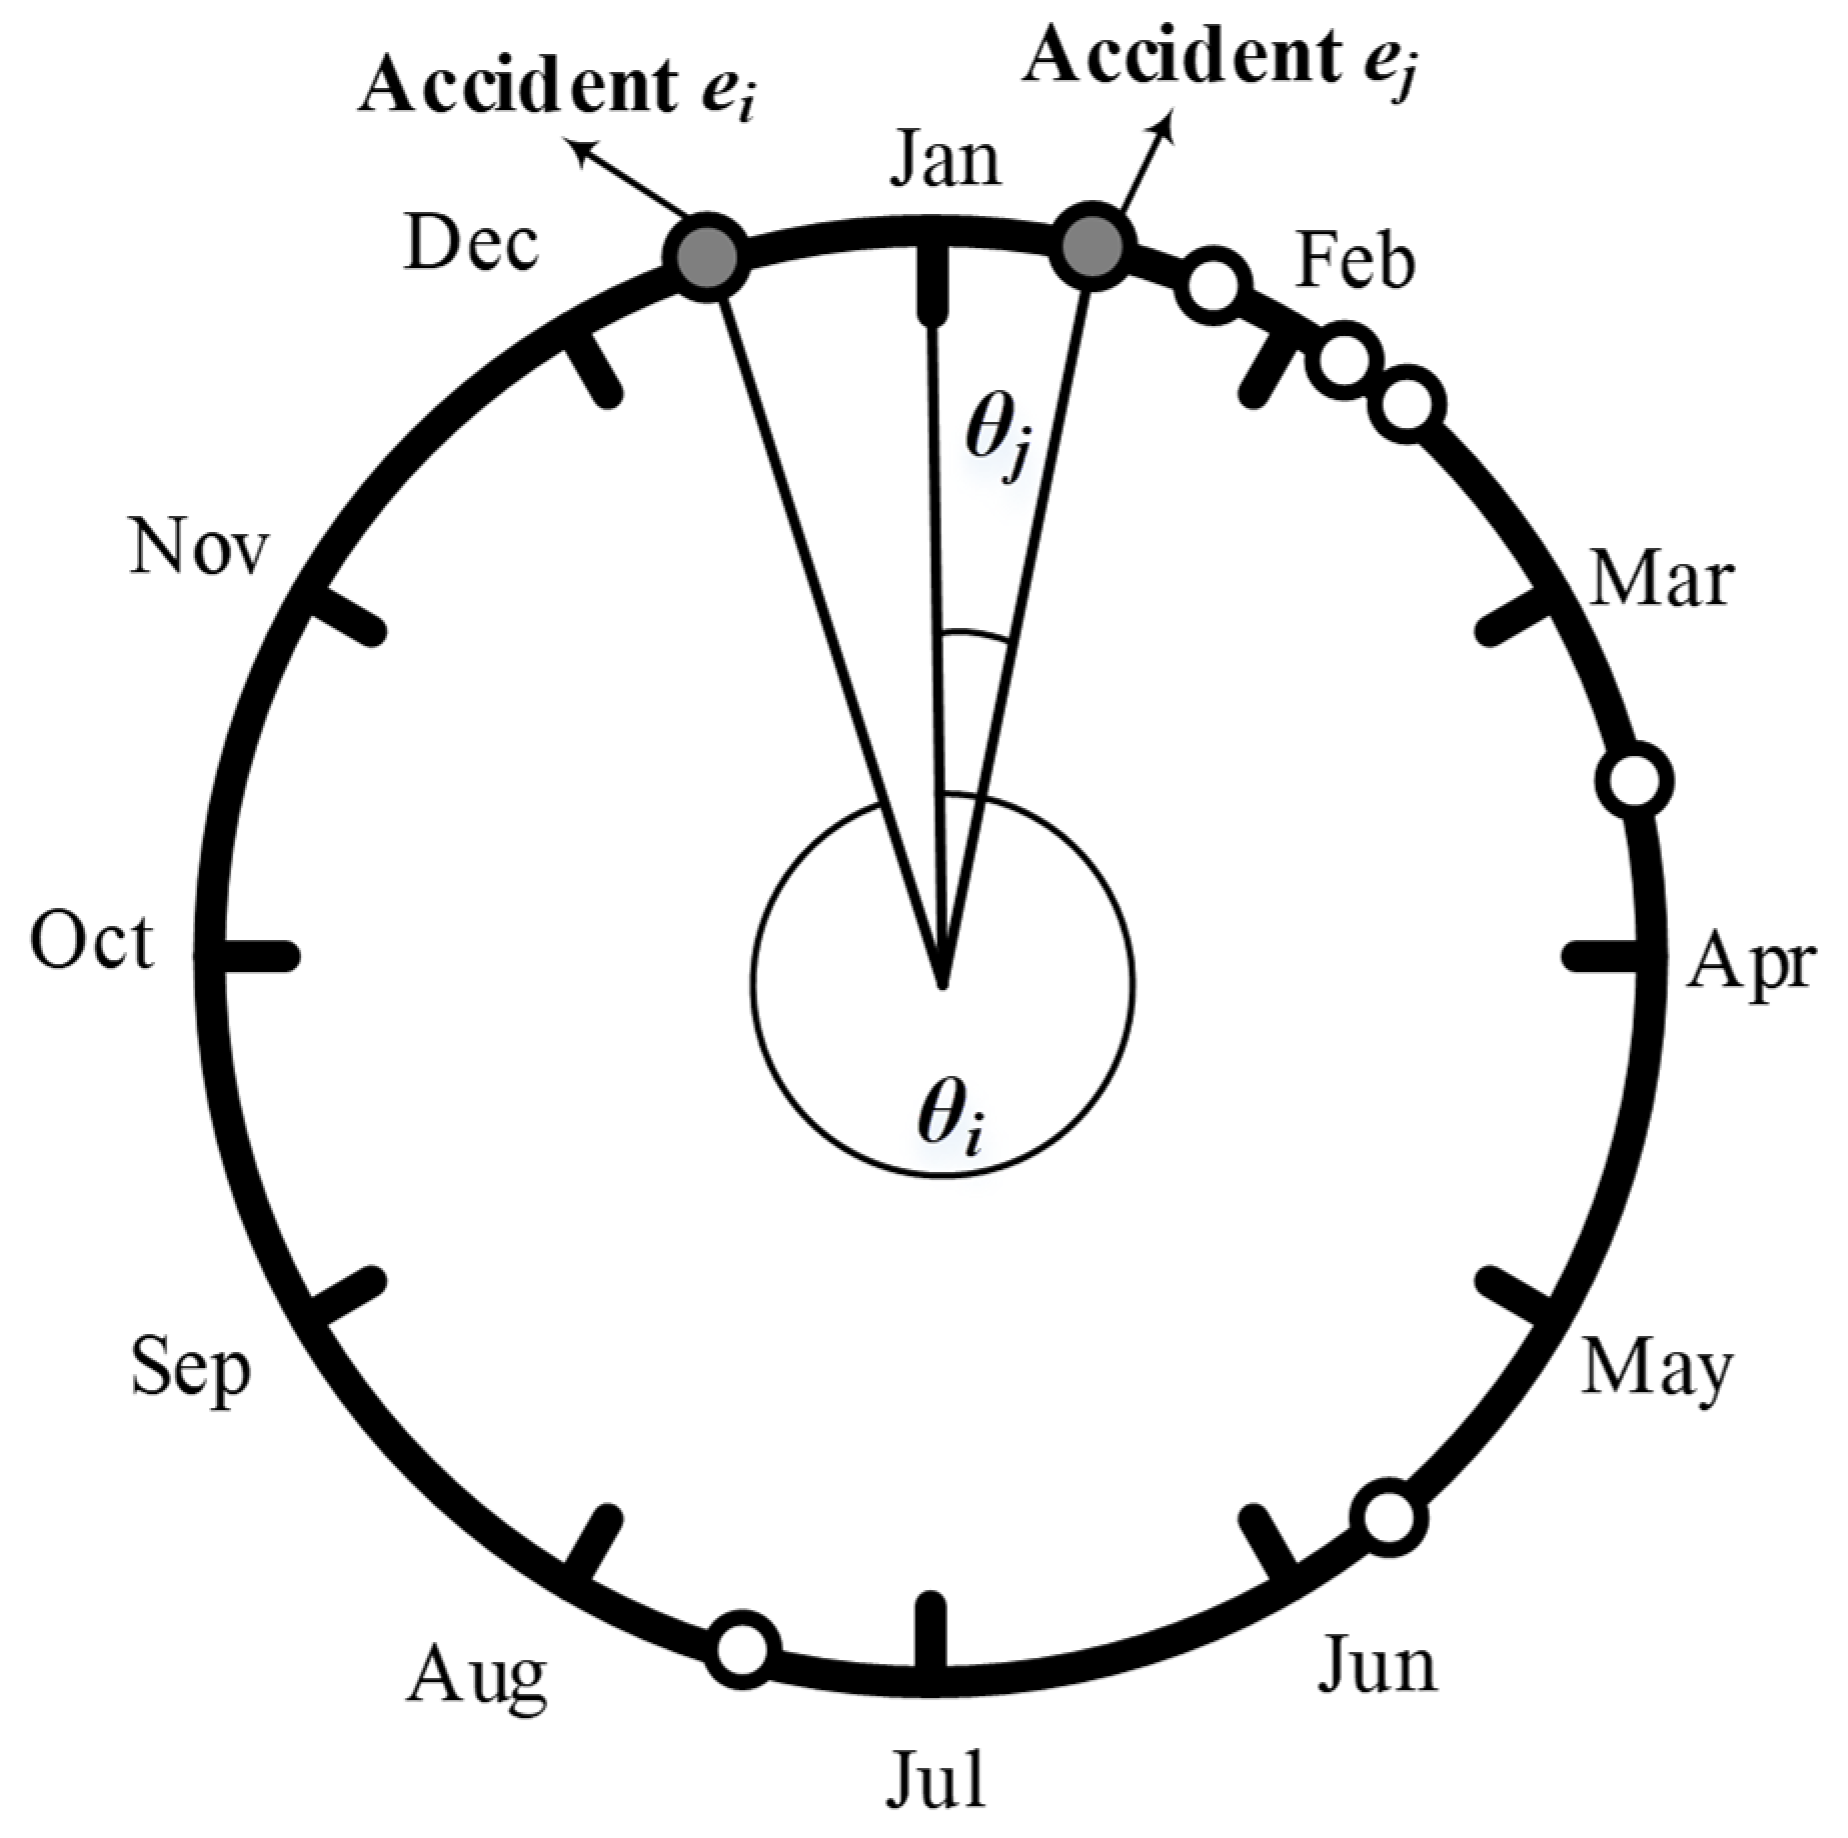
3.2.1. Definition of Spatiotemporal Neighborhood Accidents
3.2.2. Counting of Spatiotemporal Neighborhood Accidents
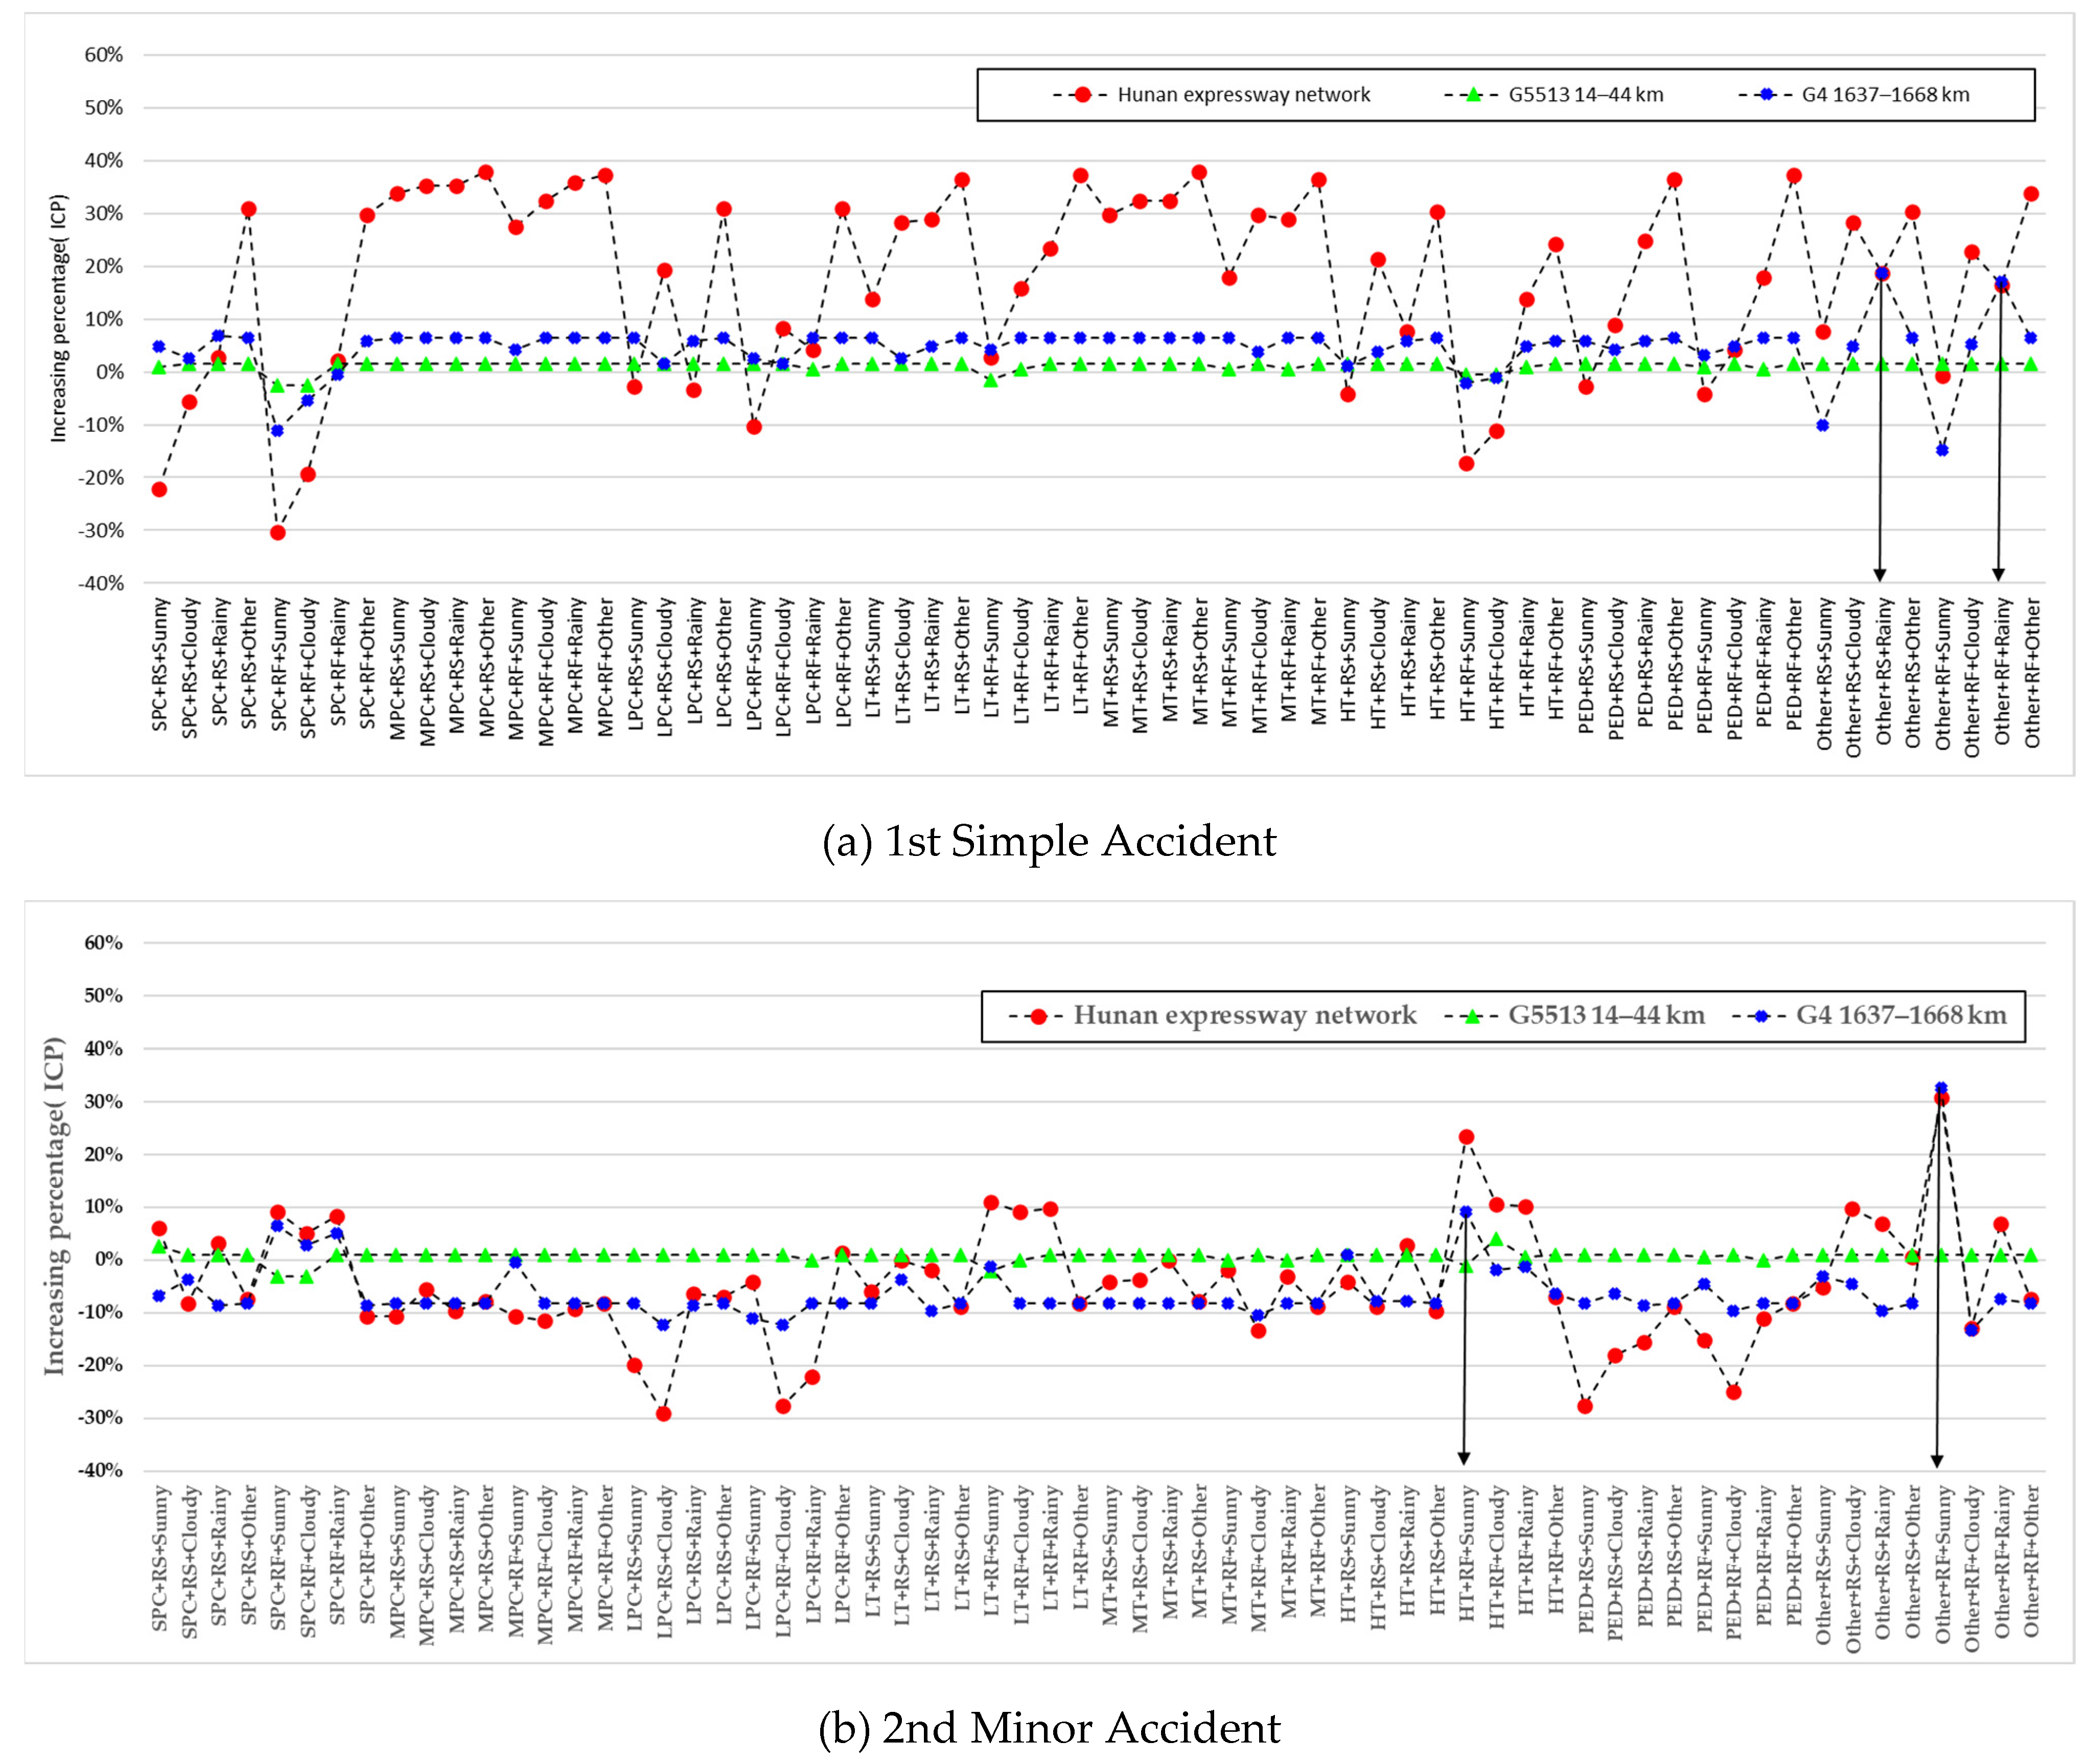
- 1st Simple accident: Accidents without injuries (i.e., simple accident dataset) are marked as simple accidents, of which the accident weight is uniformly assigned to w1 = 1/3;
- 2nd Minor accident: Accidents with 1–2 slight injuries are marked as minor accidents, of which the accident weight is uniformly assigned to w2 = 1;
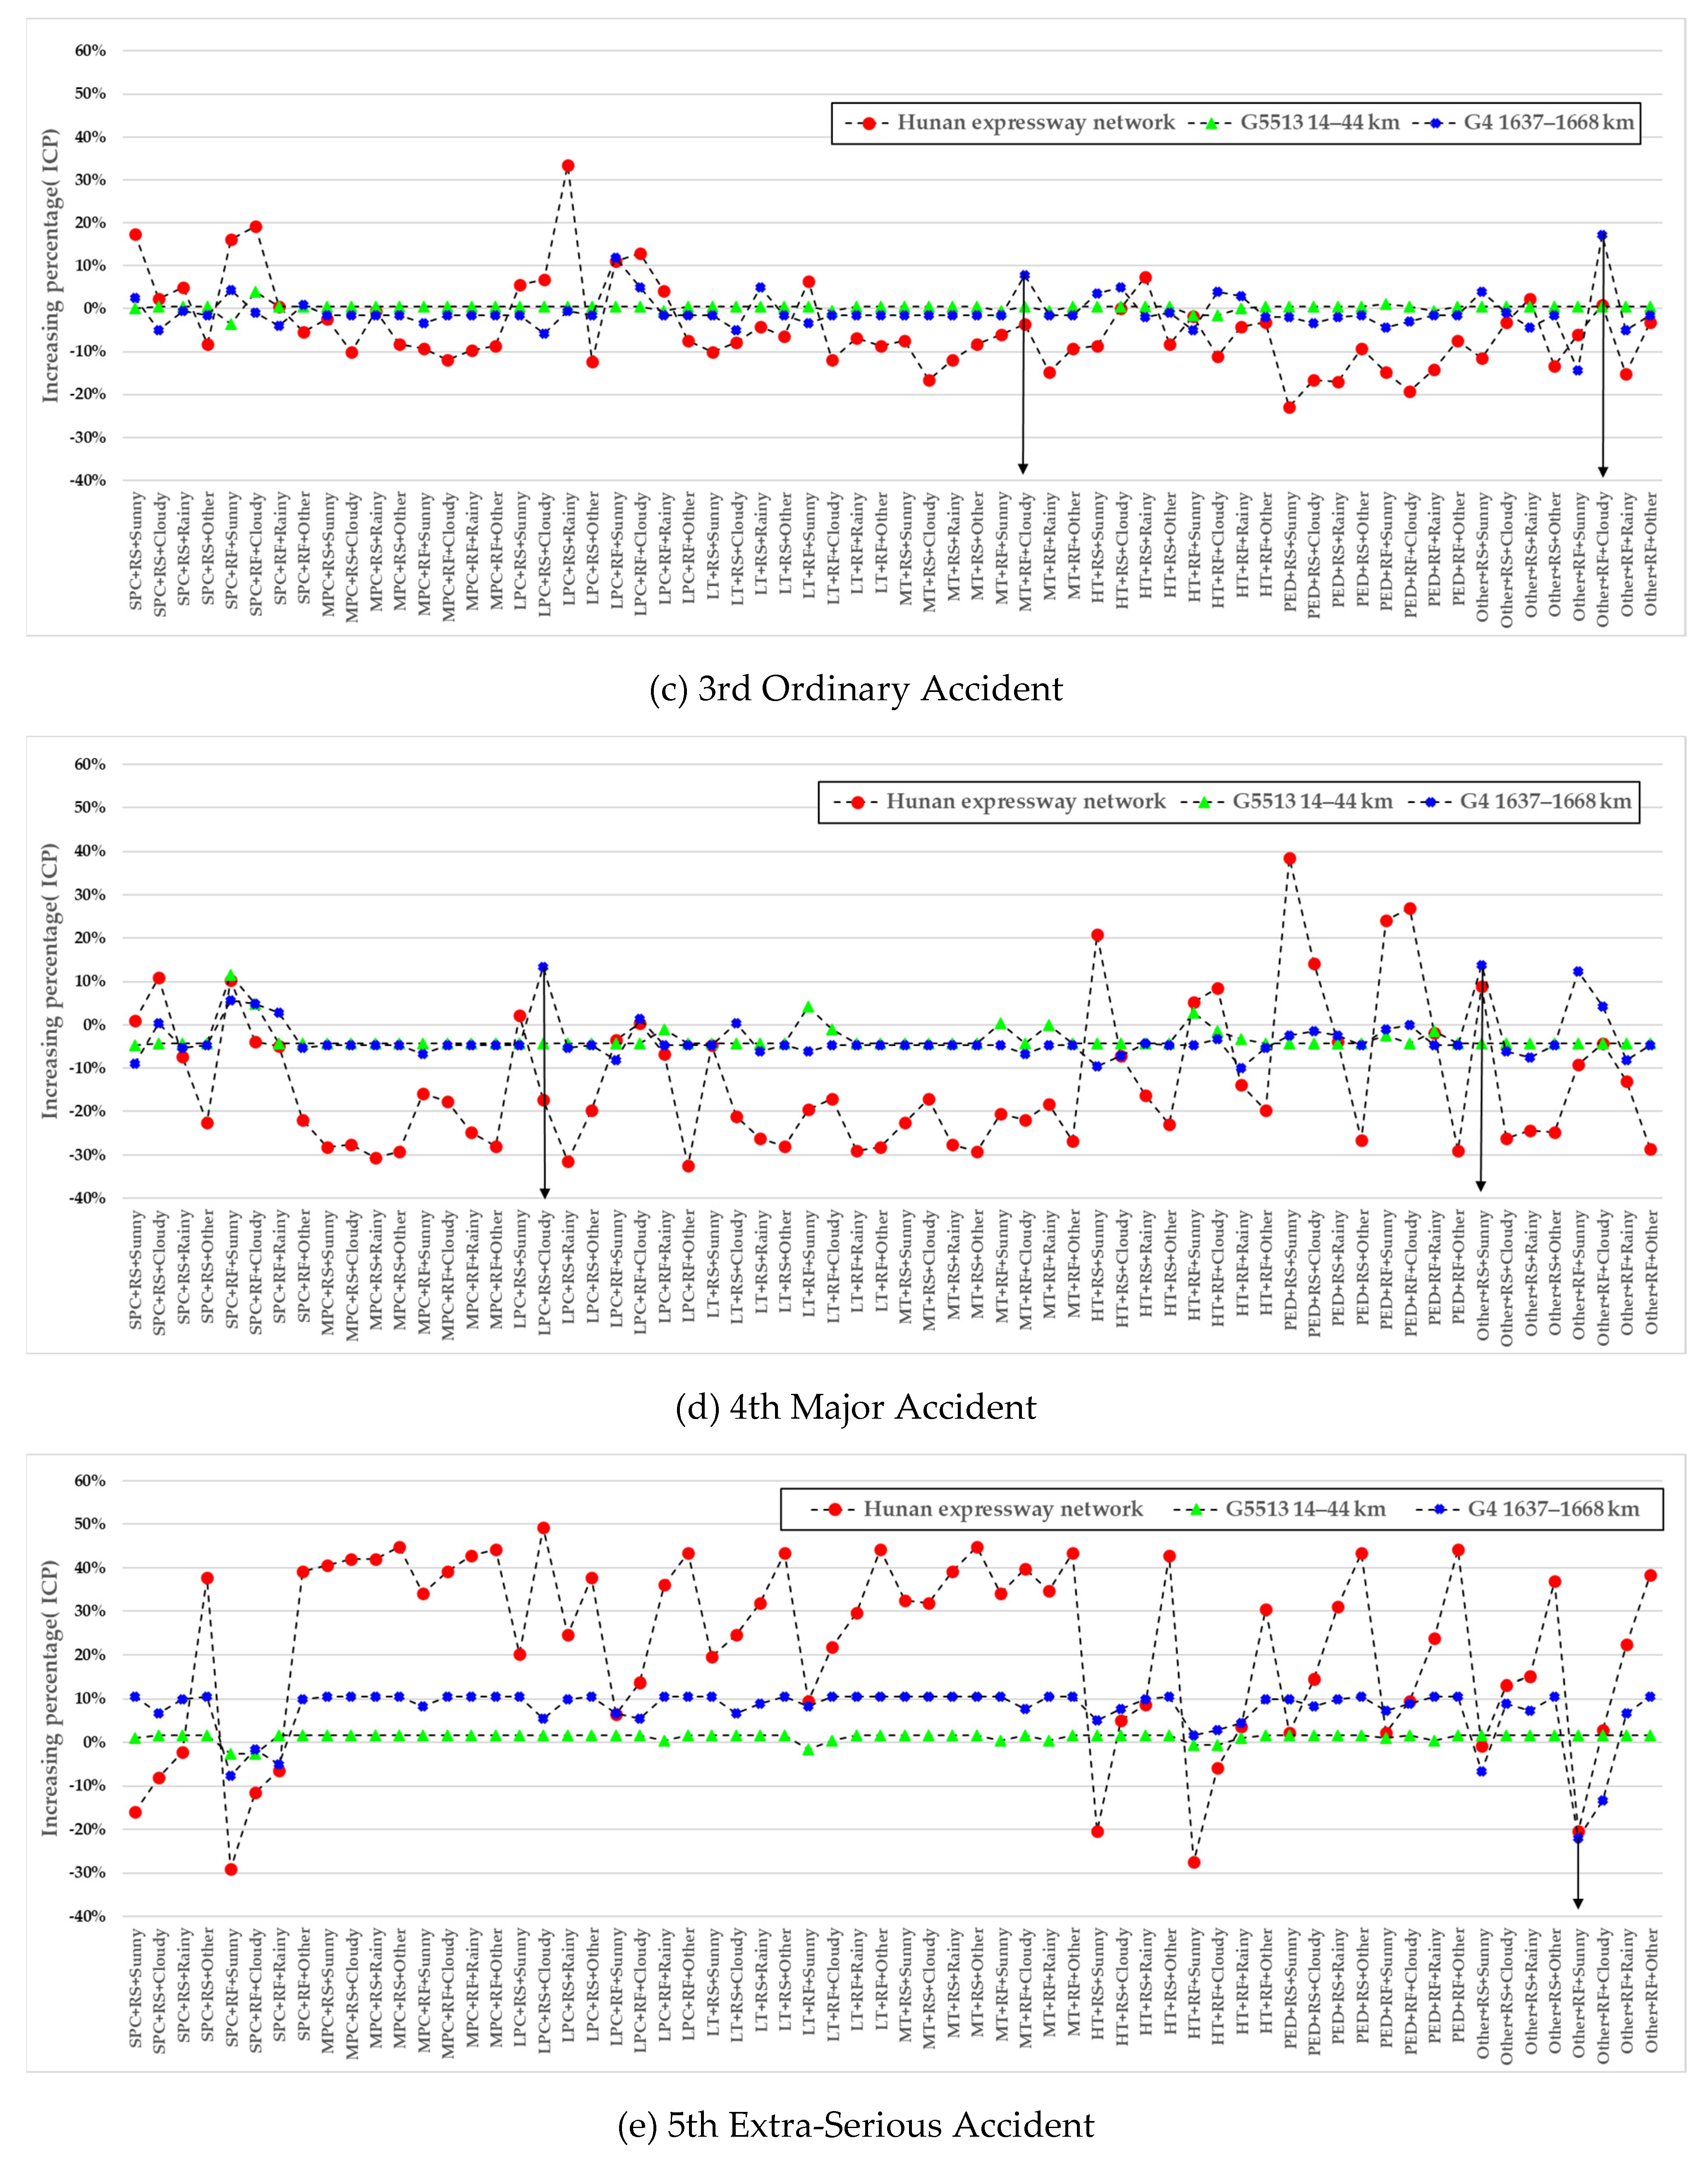
- 3rd Ordinary accident: Accidents with 1–2 serious injuries or more than 3 slight injuries are marked as general accidents, of which the accident weight is uniformly assigned to w3 = 3;
- 4th Major accident: Accidents with 1–2 deaths or 3–10 serious injuries are marked as major accidents, of which the accident weight is uniformly assigned to w4 = 5;
- 5th Extra-serious accident: Accidents with more than 3 deaths, or more than 11 serious injuries, or 1 death and meanwhile more than 8 serious injuries, or more than 2 deaths and meanwhile more than 5 serious injuries are marked as Extra-serious accidents, of which the accident weight is uniformly assigned to w5 = 7.
3.2.3. Identification of Accident-Prone Black Spots Based on DBSCAN
3.3. Divide-and-Conquer Accident Causal Analysis Based on Bayesian Network
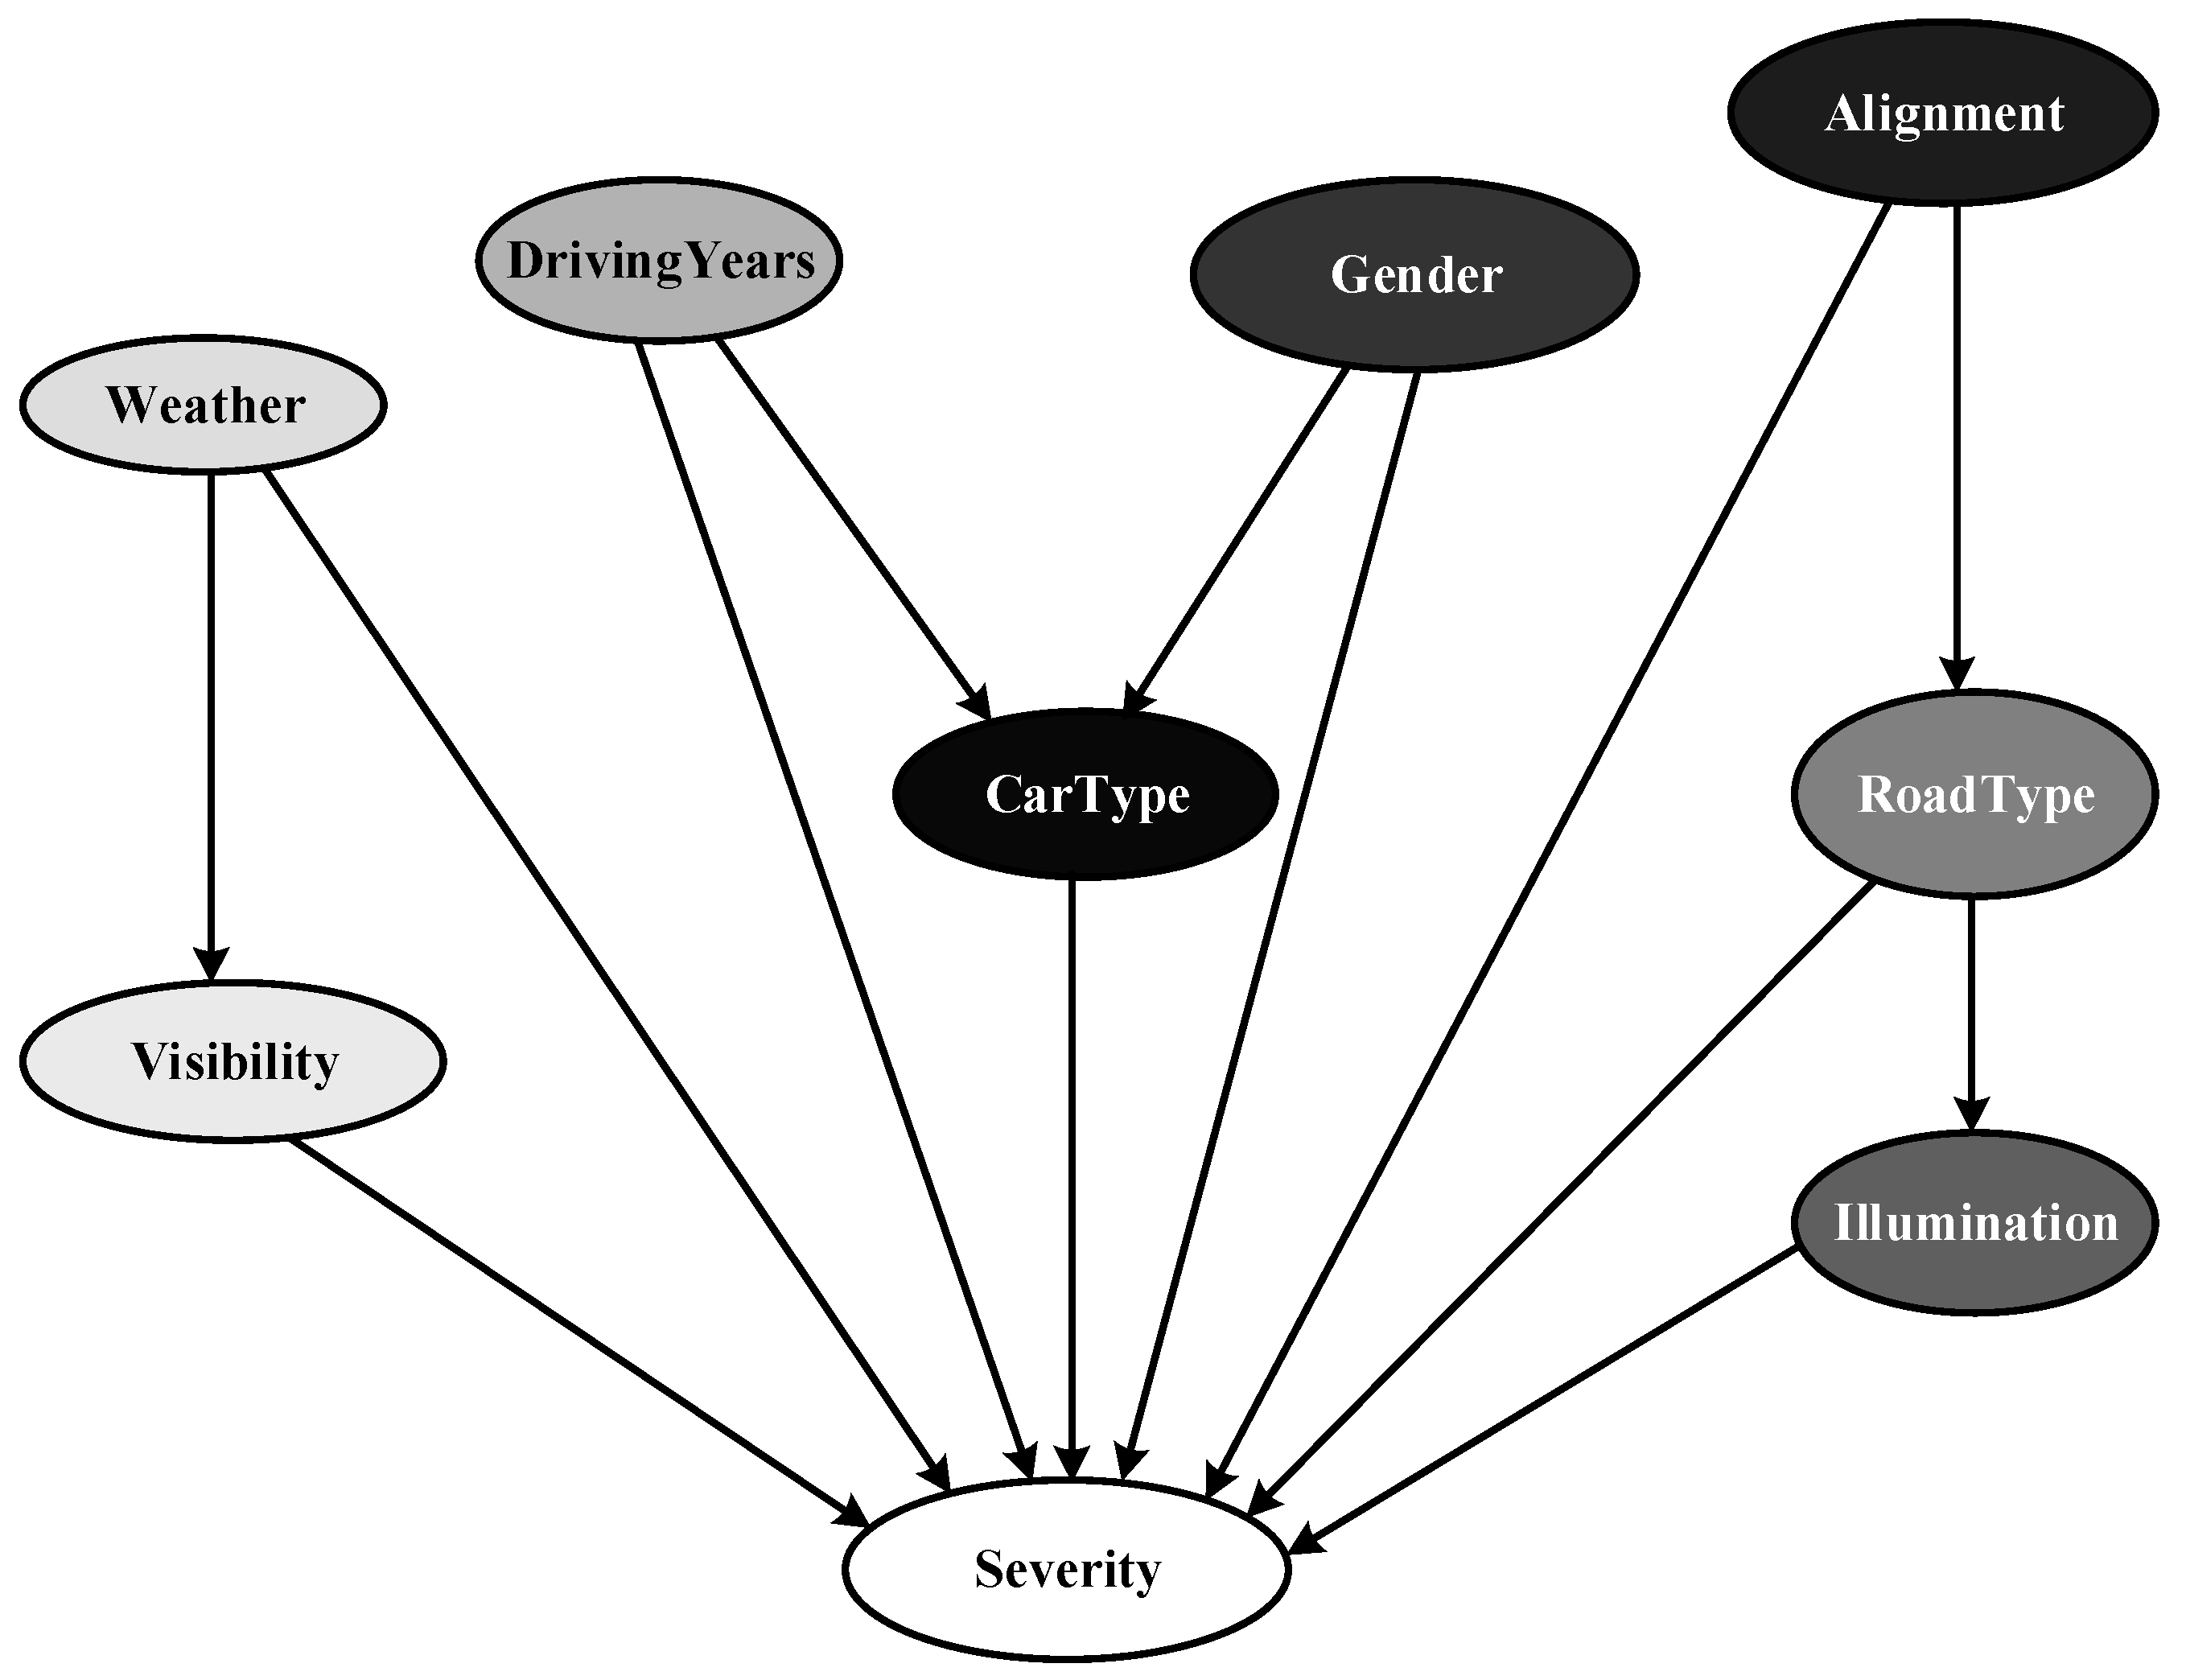
3.3.1. Structure Learning of Accident Bayesian Network
3.3.2. Parameter Learning of Accident Bayesian Network
4. Results
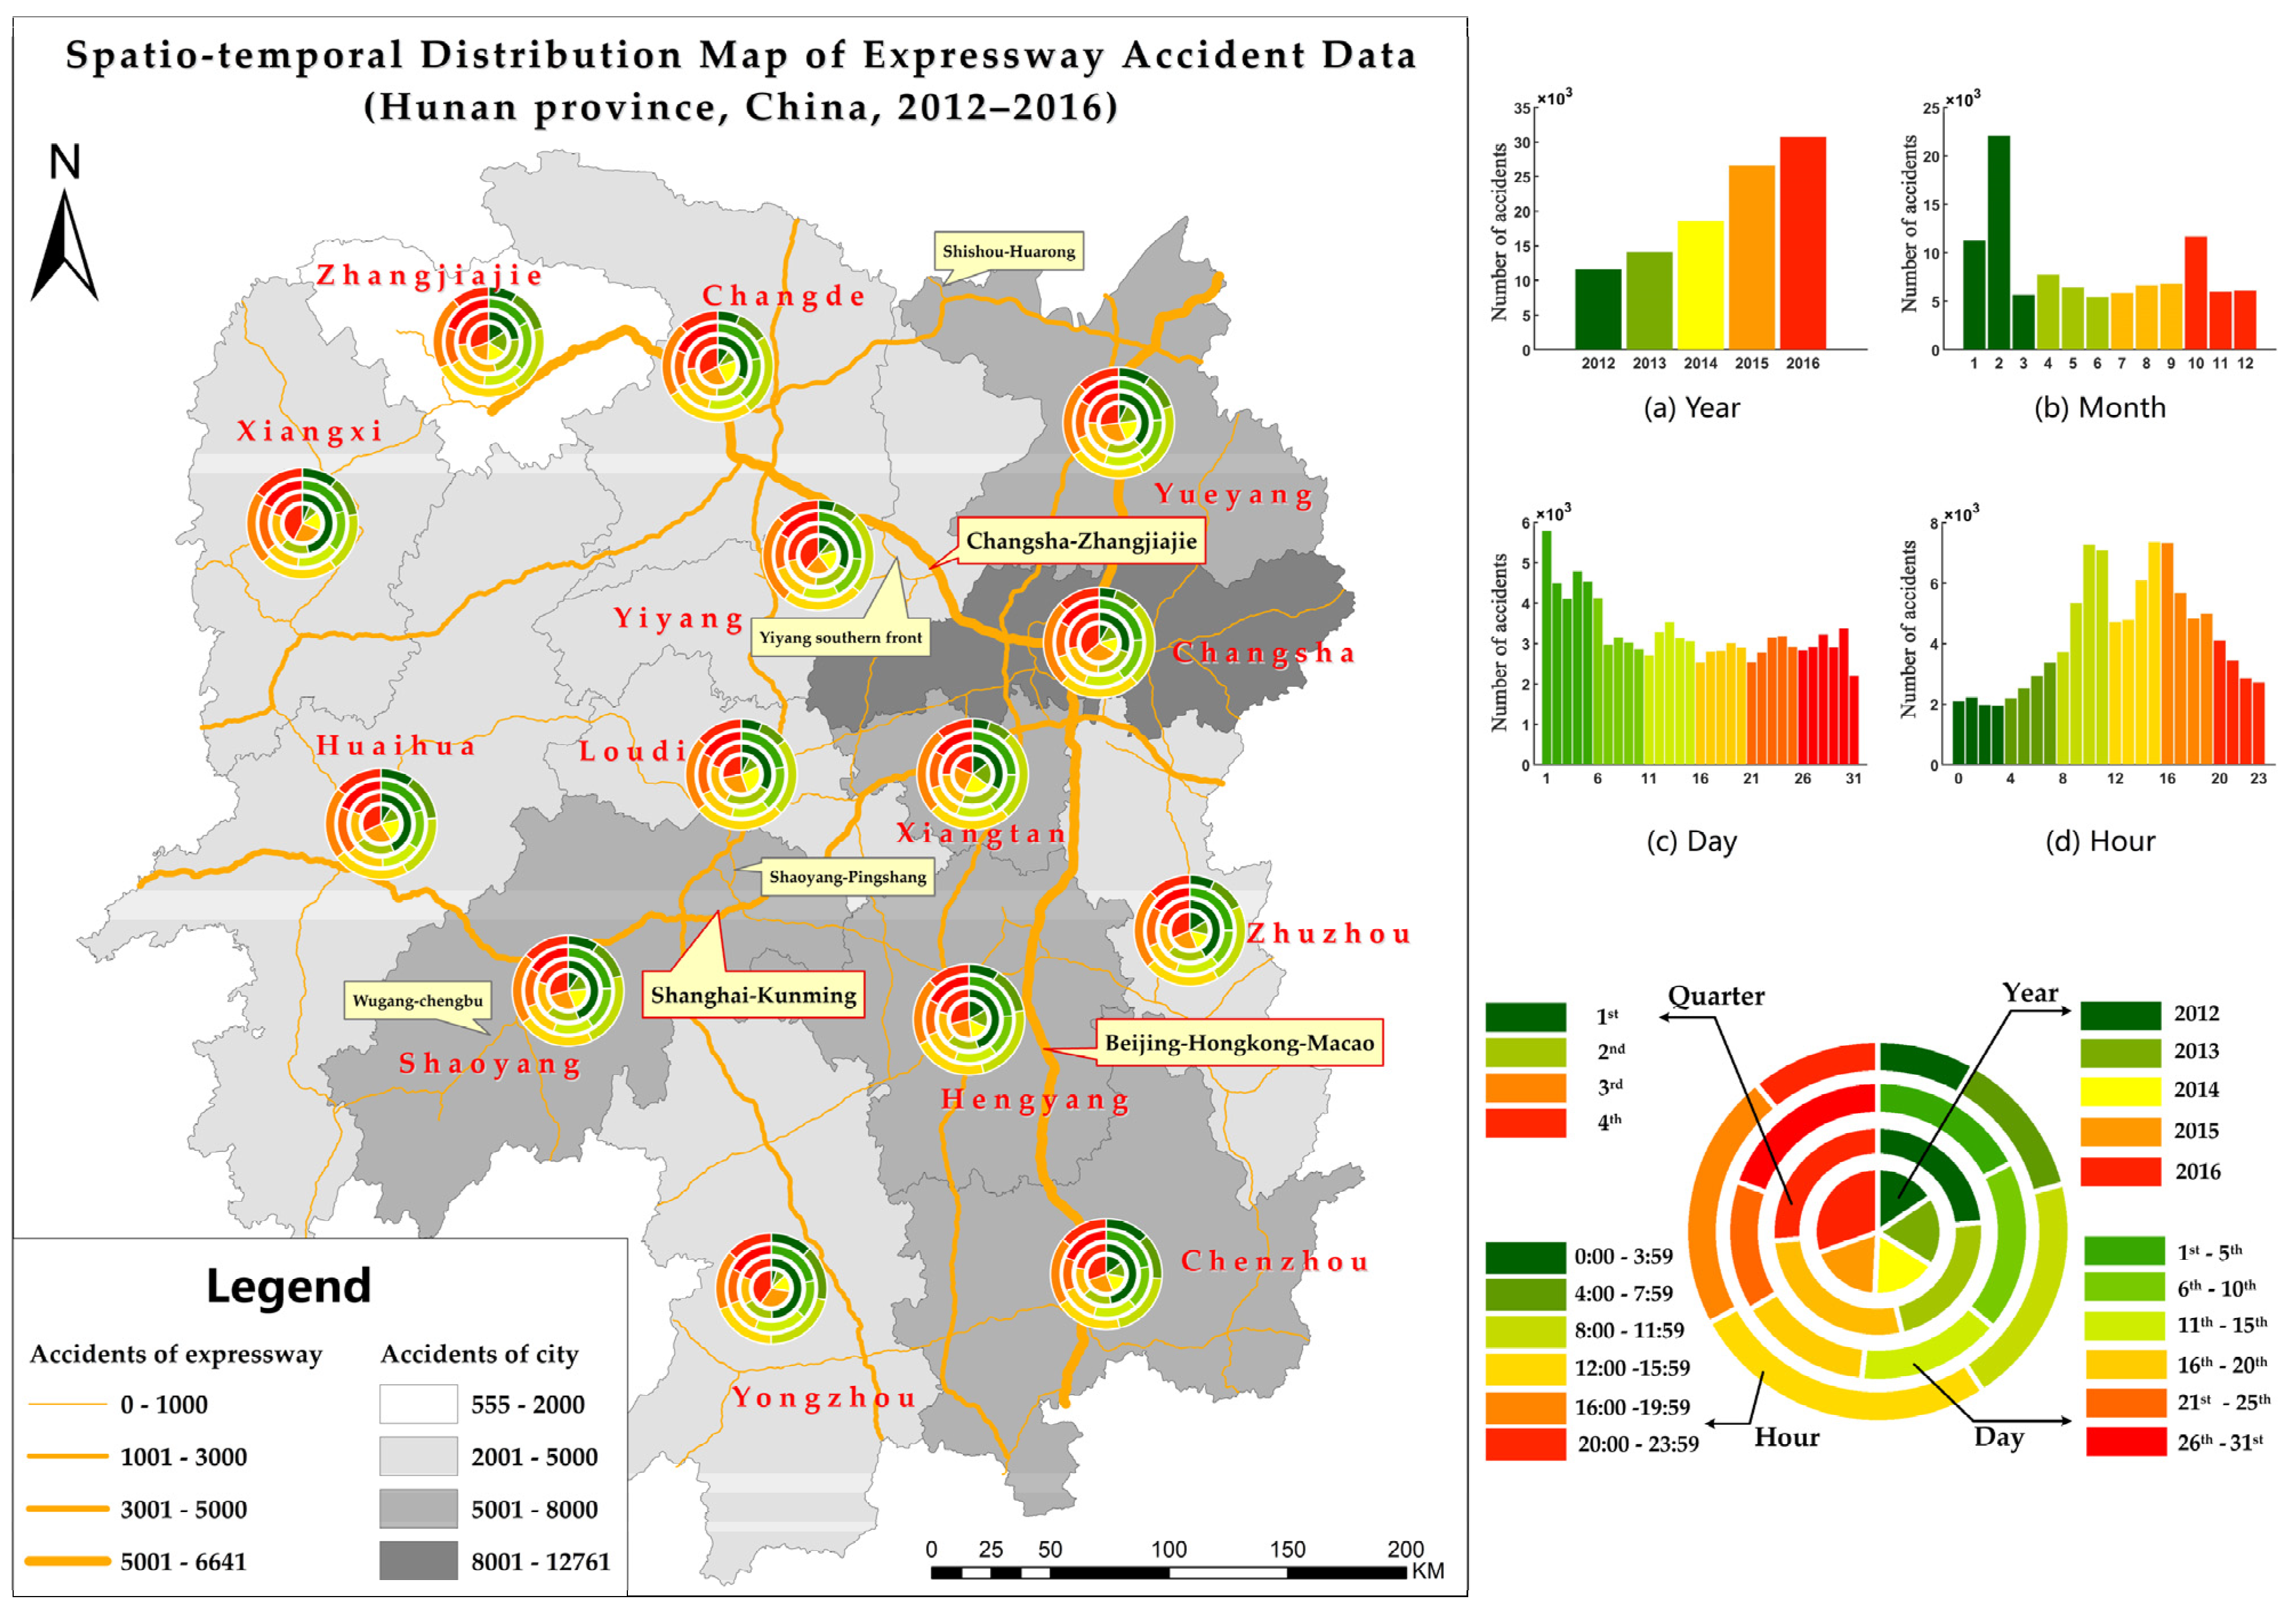
4.1. Exploratory Analysis of Expressway Accident Data
- (1)
- At the yearly granularity (shown as the innermost layer of the pie chart), some prefecture-level cities (Zhangjiajie, Hengyang, Zhuzhou, etc.) had relatively similar accident volumes in the observed 5 years but some other prefecture-level cities (Changsha, Loudi, Yongzhou, etc.) manifested a significant accident increase in the latter 3 years.
- (2)
- At the quarterly granularity (shown in the second layer of the pie chart), the quarterly expressway accident proportions in most prefecture-level cities were roughly similar but the expressway accidents of some special prefecture-level cities (e.g., Xiangxi, Huaihua, Yongzhou, and Chenzhou) mainly concentrated on the first quarter (nearly account for 50%).
- (3)
- At the daily granularity (shown in the third layer of the pie chart), the daily expressway accidents of most prefecture-level cities were nearly similar to each other, which also coincided with the daily distribution of Hunan province.
- (4)
- At the hourly granularity (shown in the outermost layer of the pie chart), the hourly expressway accidents were conformably displayed as daytime-dominant distributions for most prefecture-level cities.
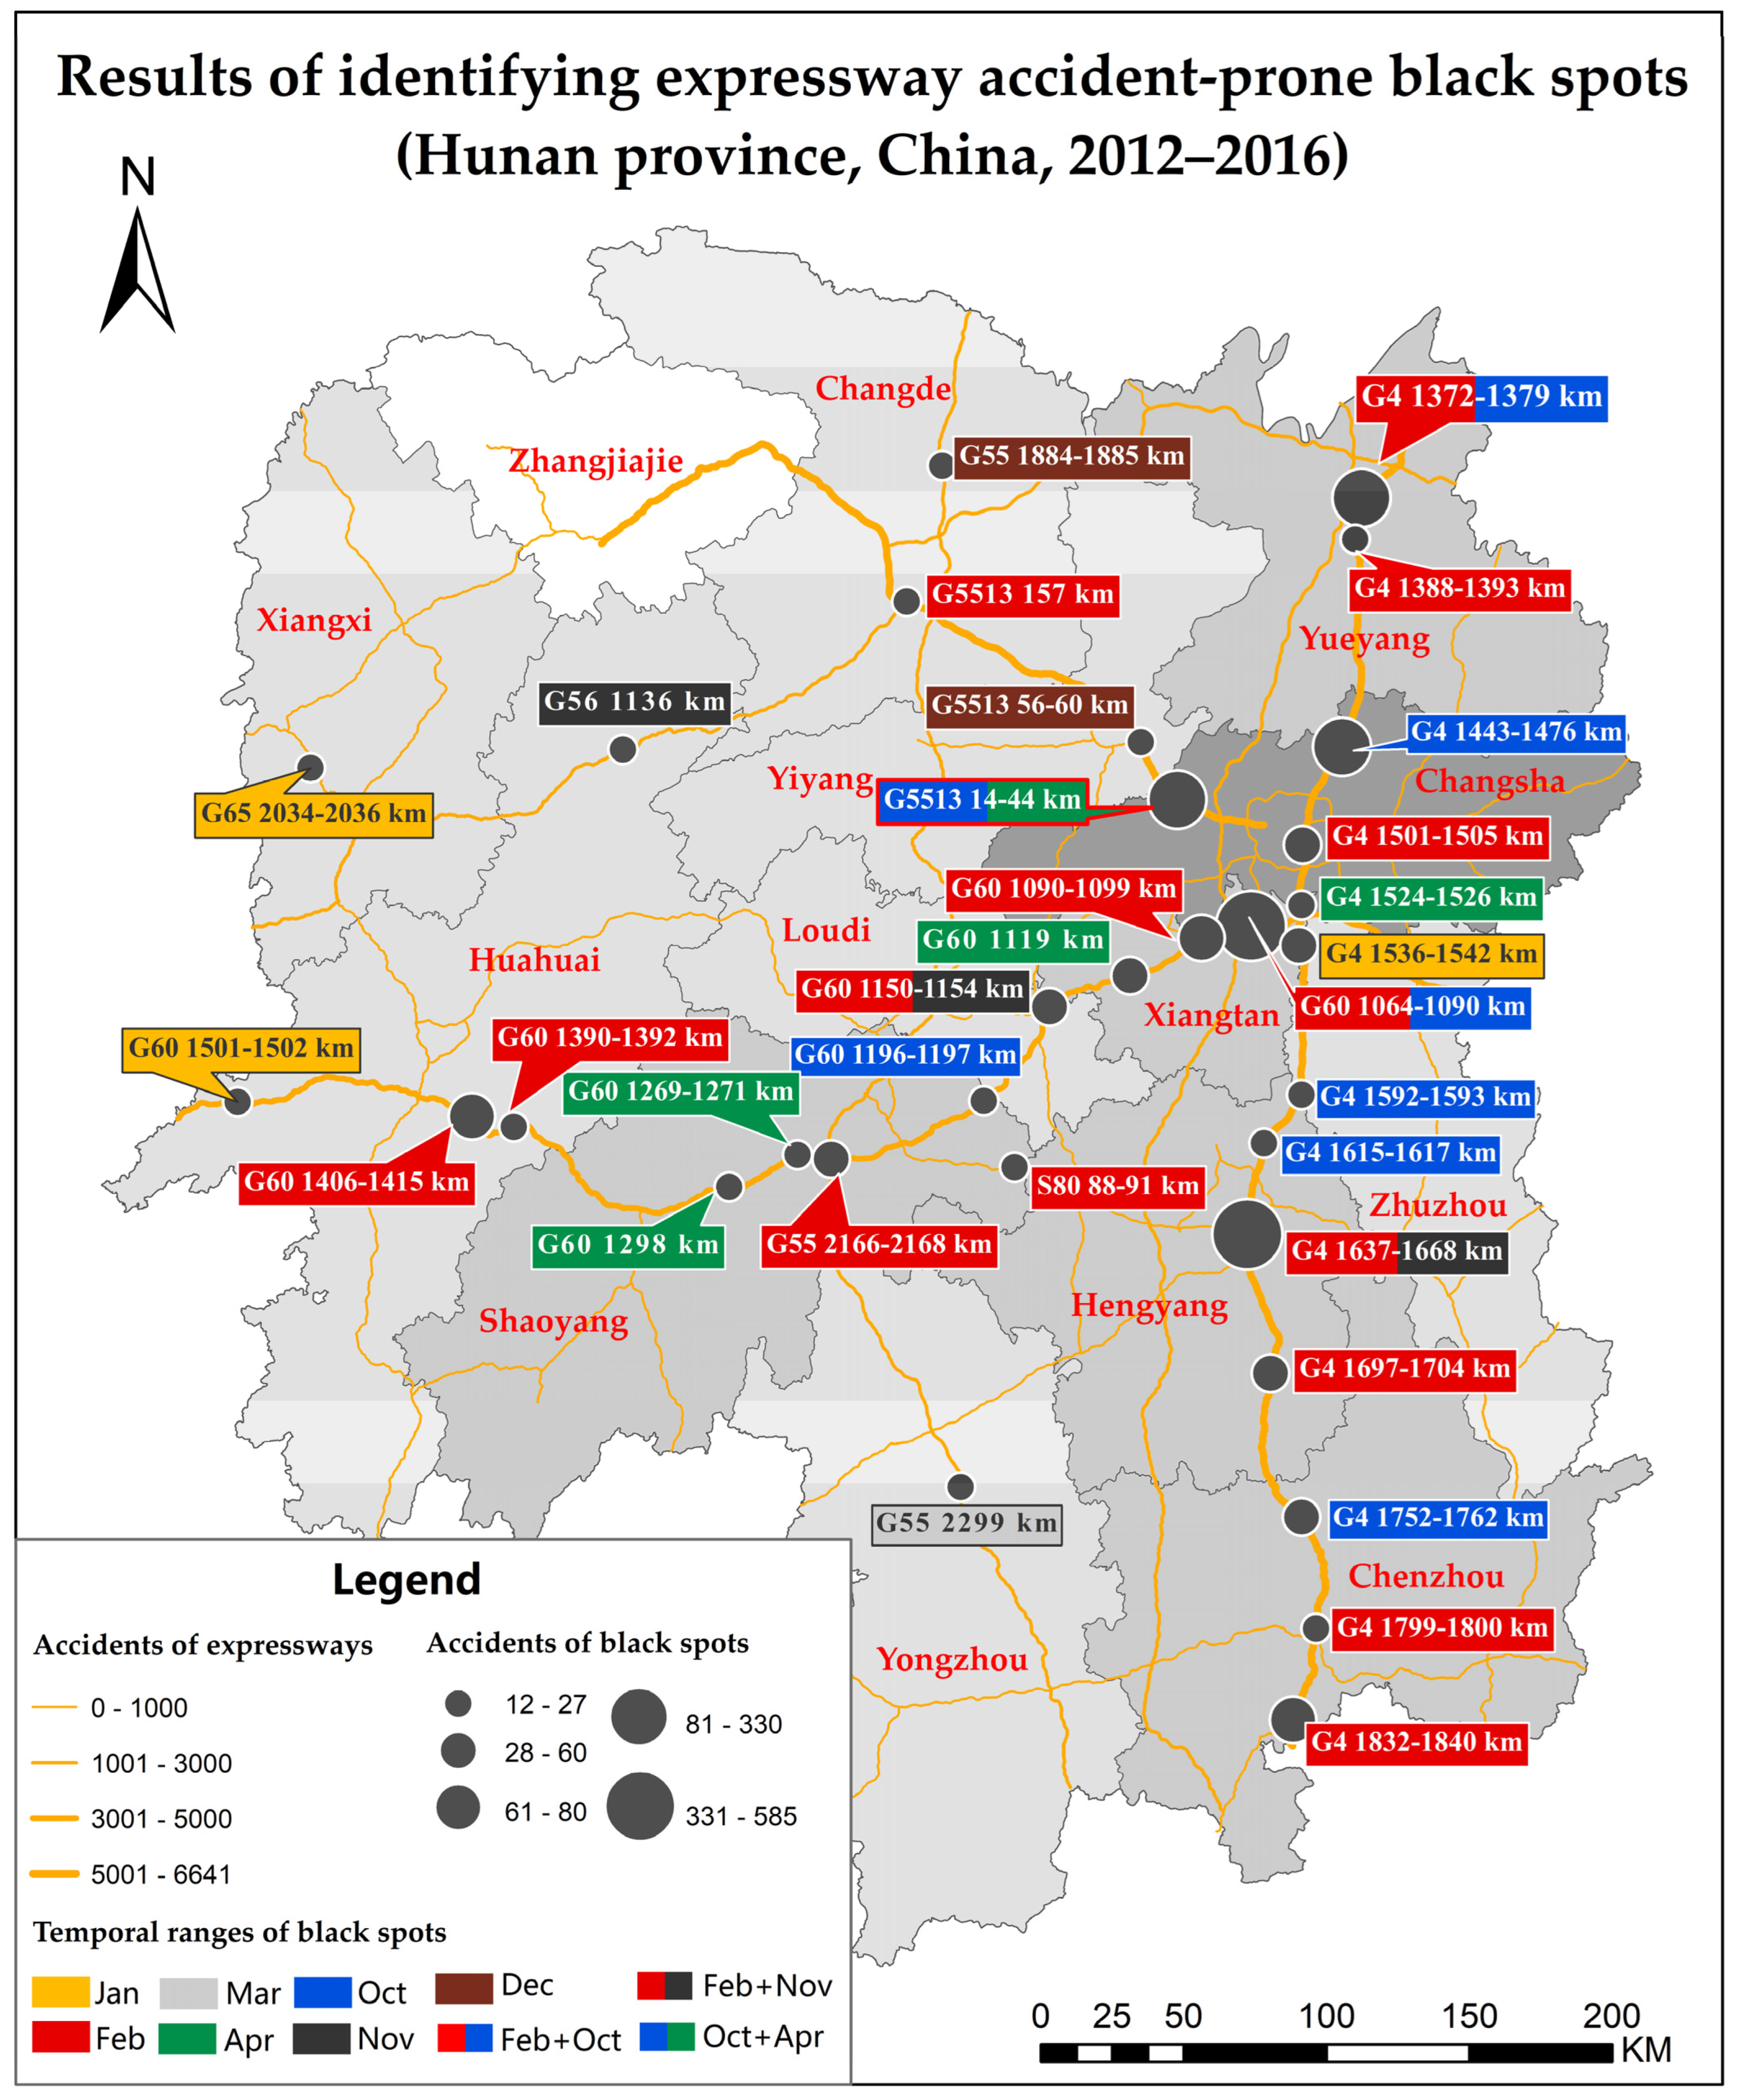
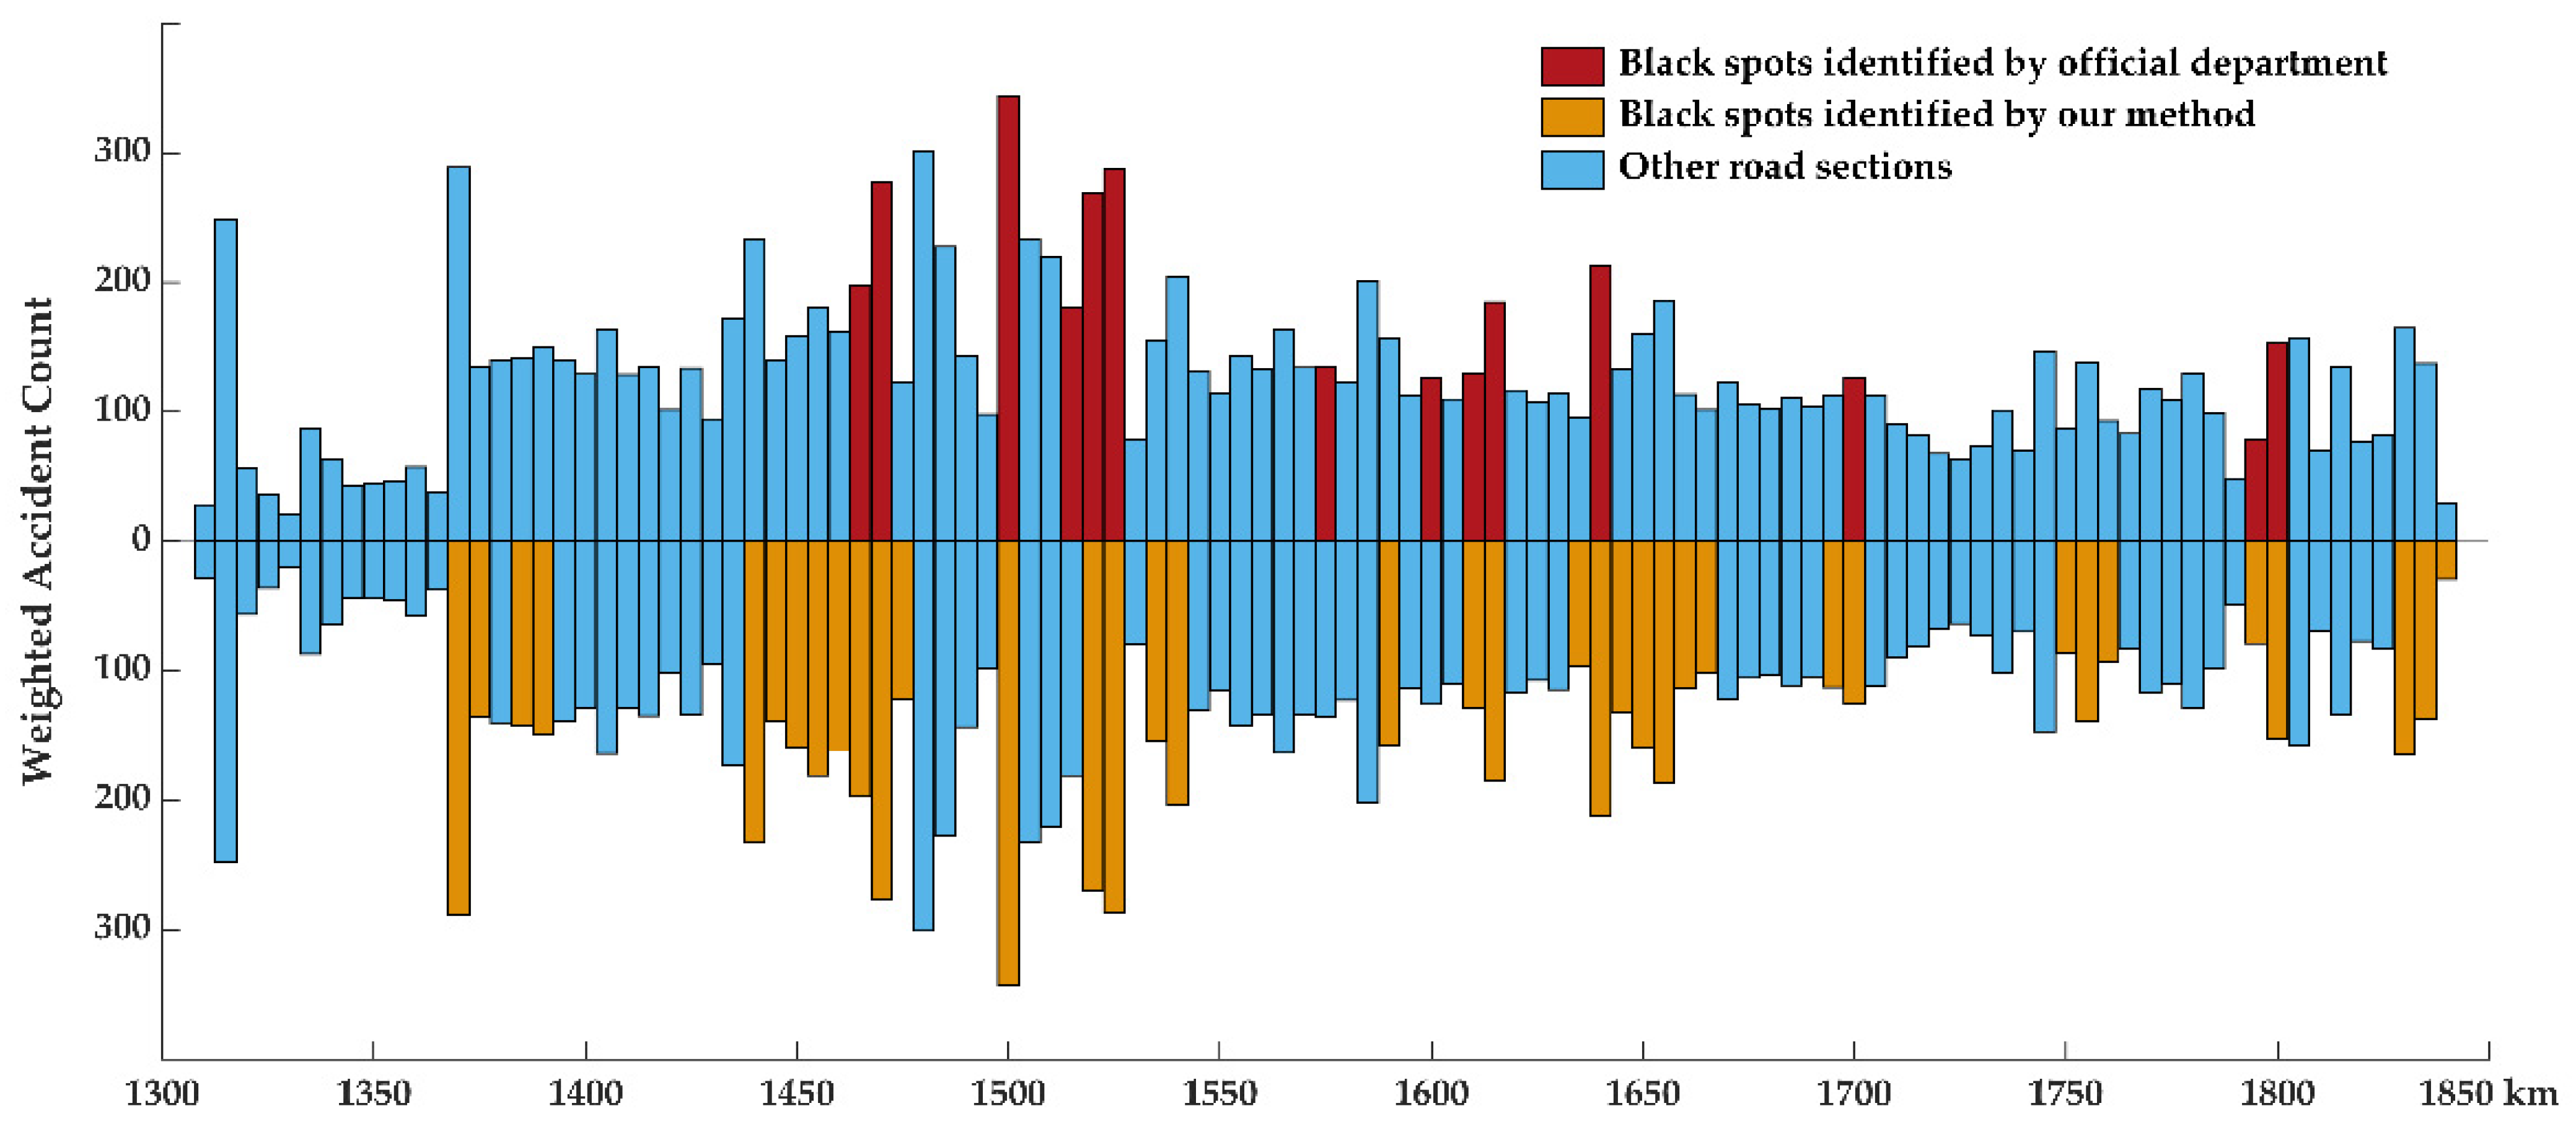
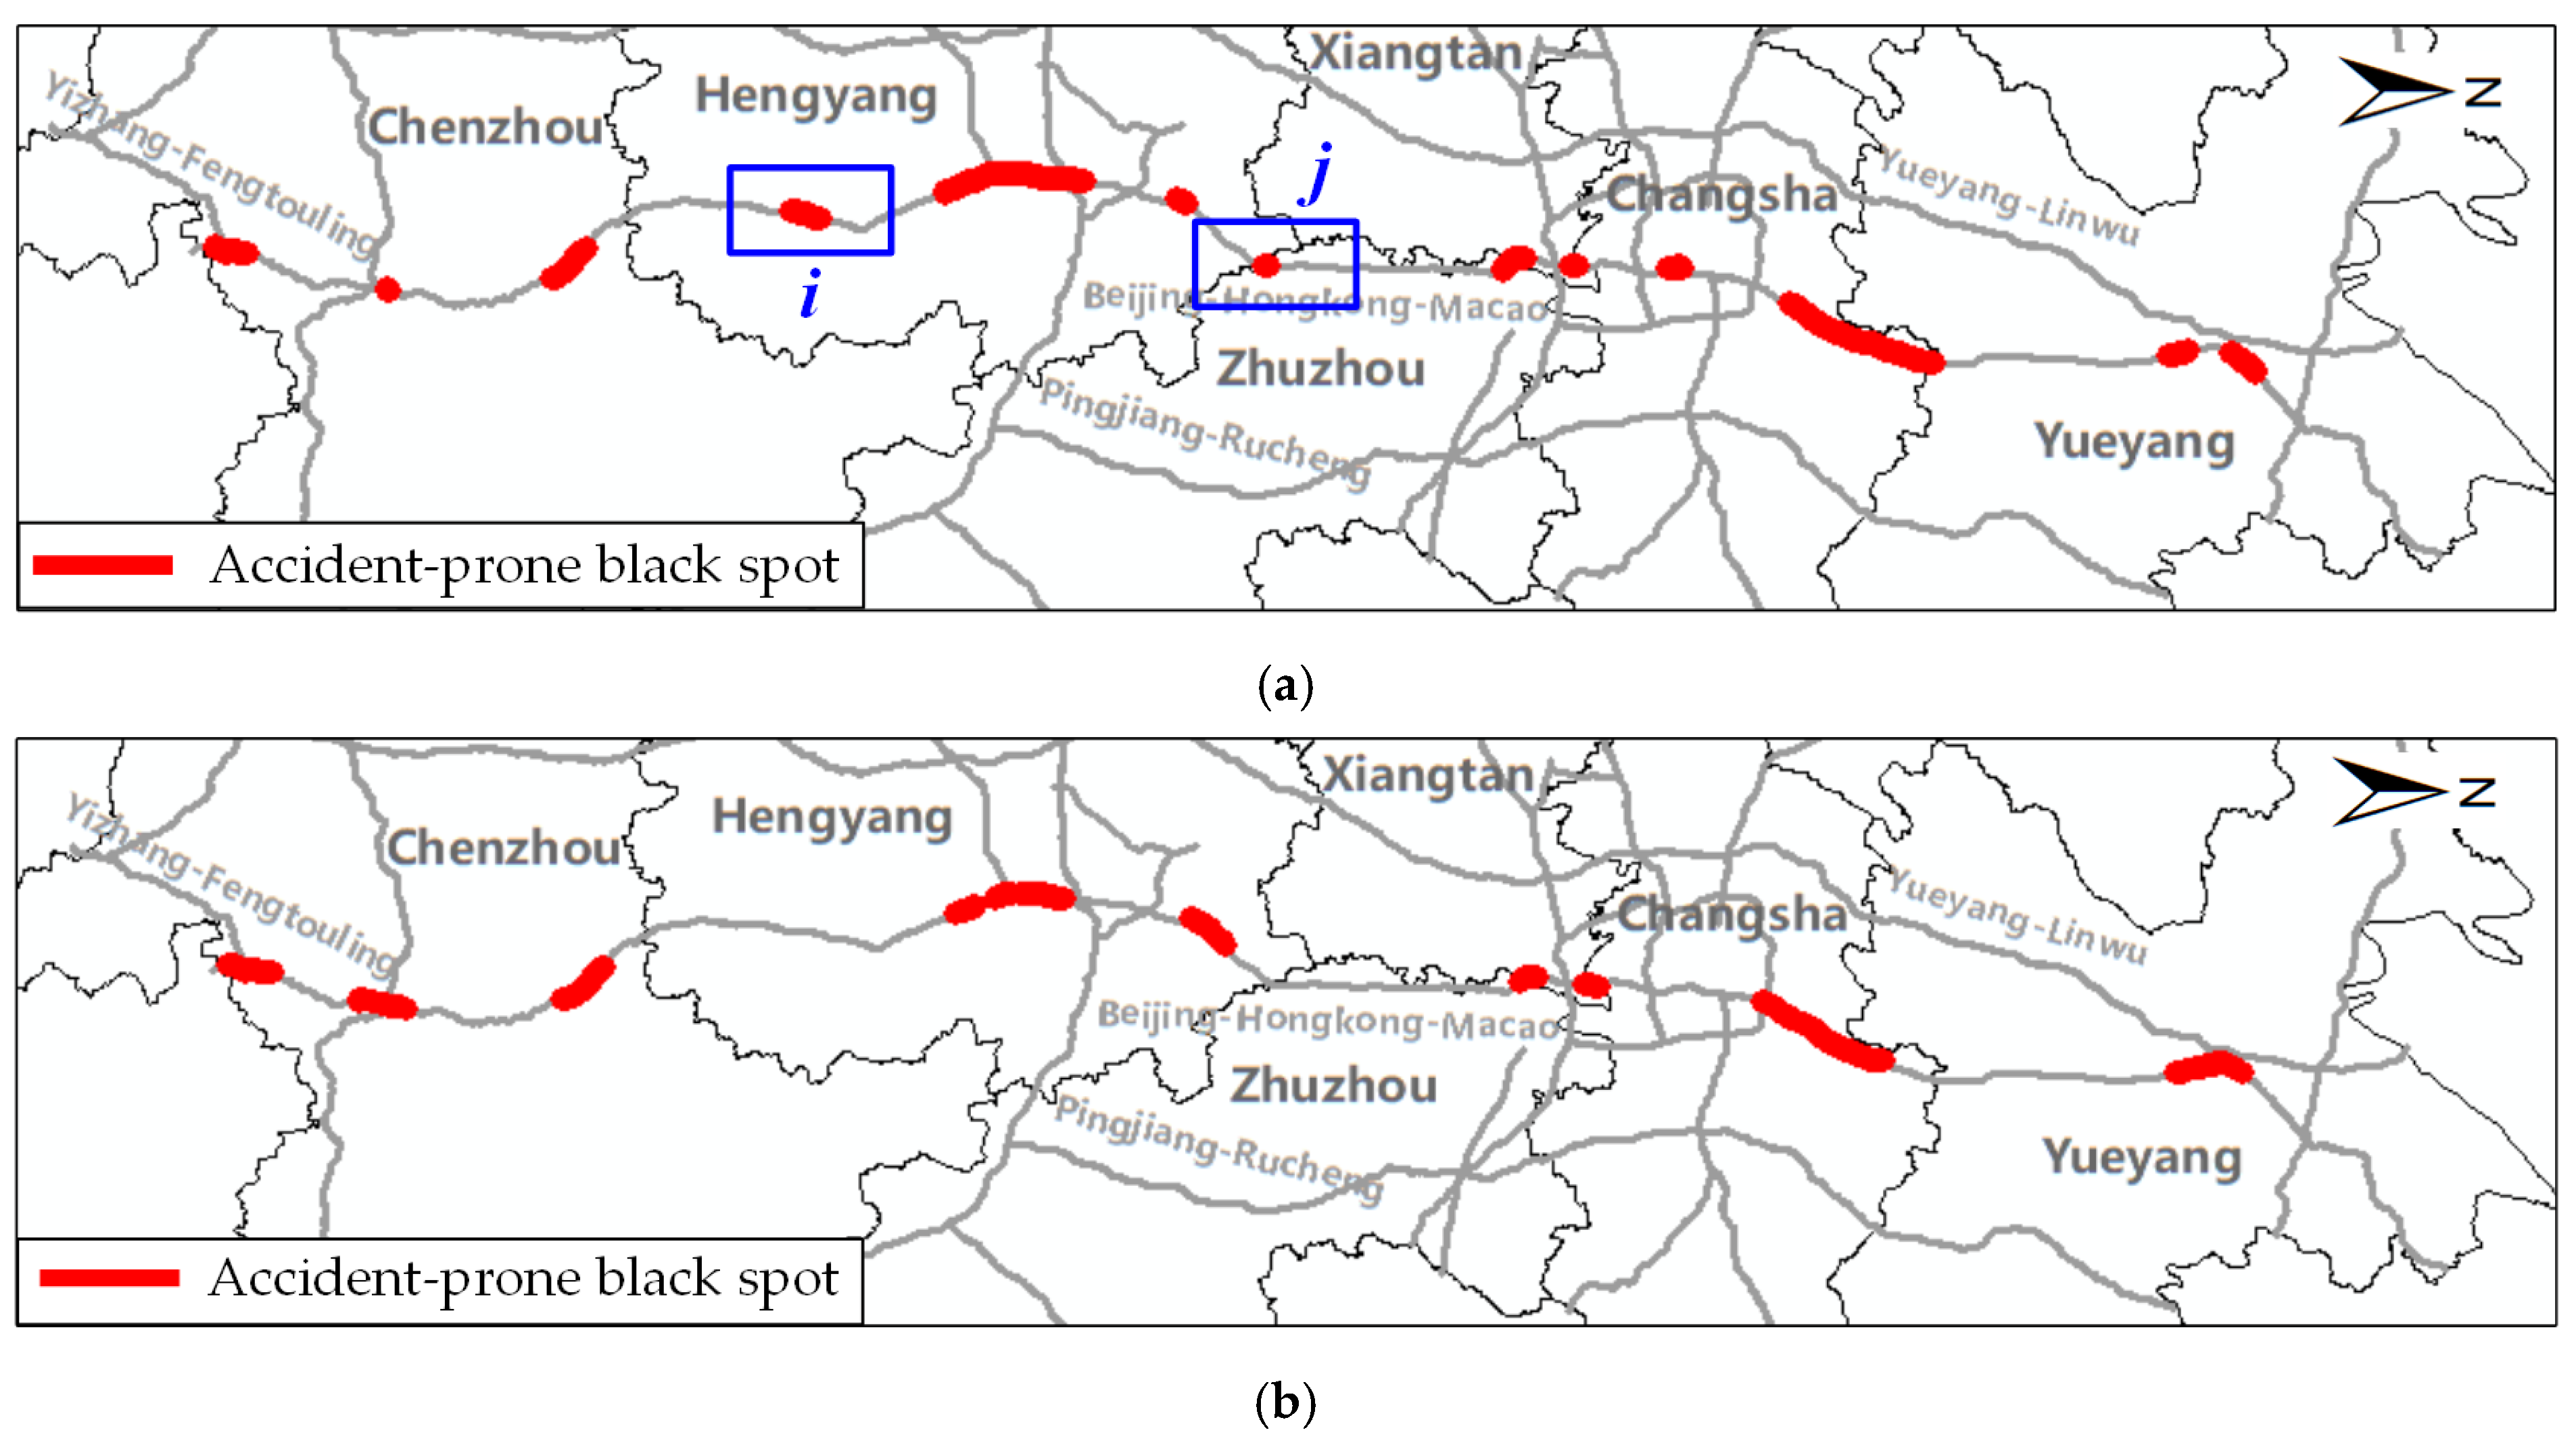
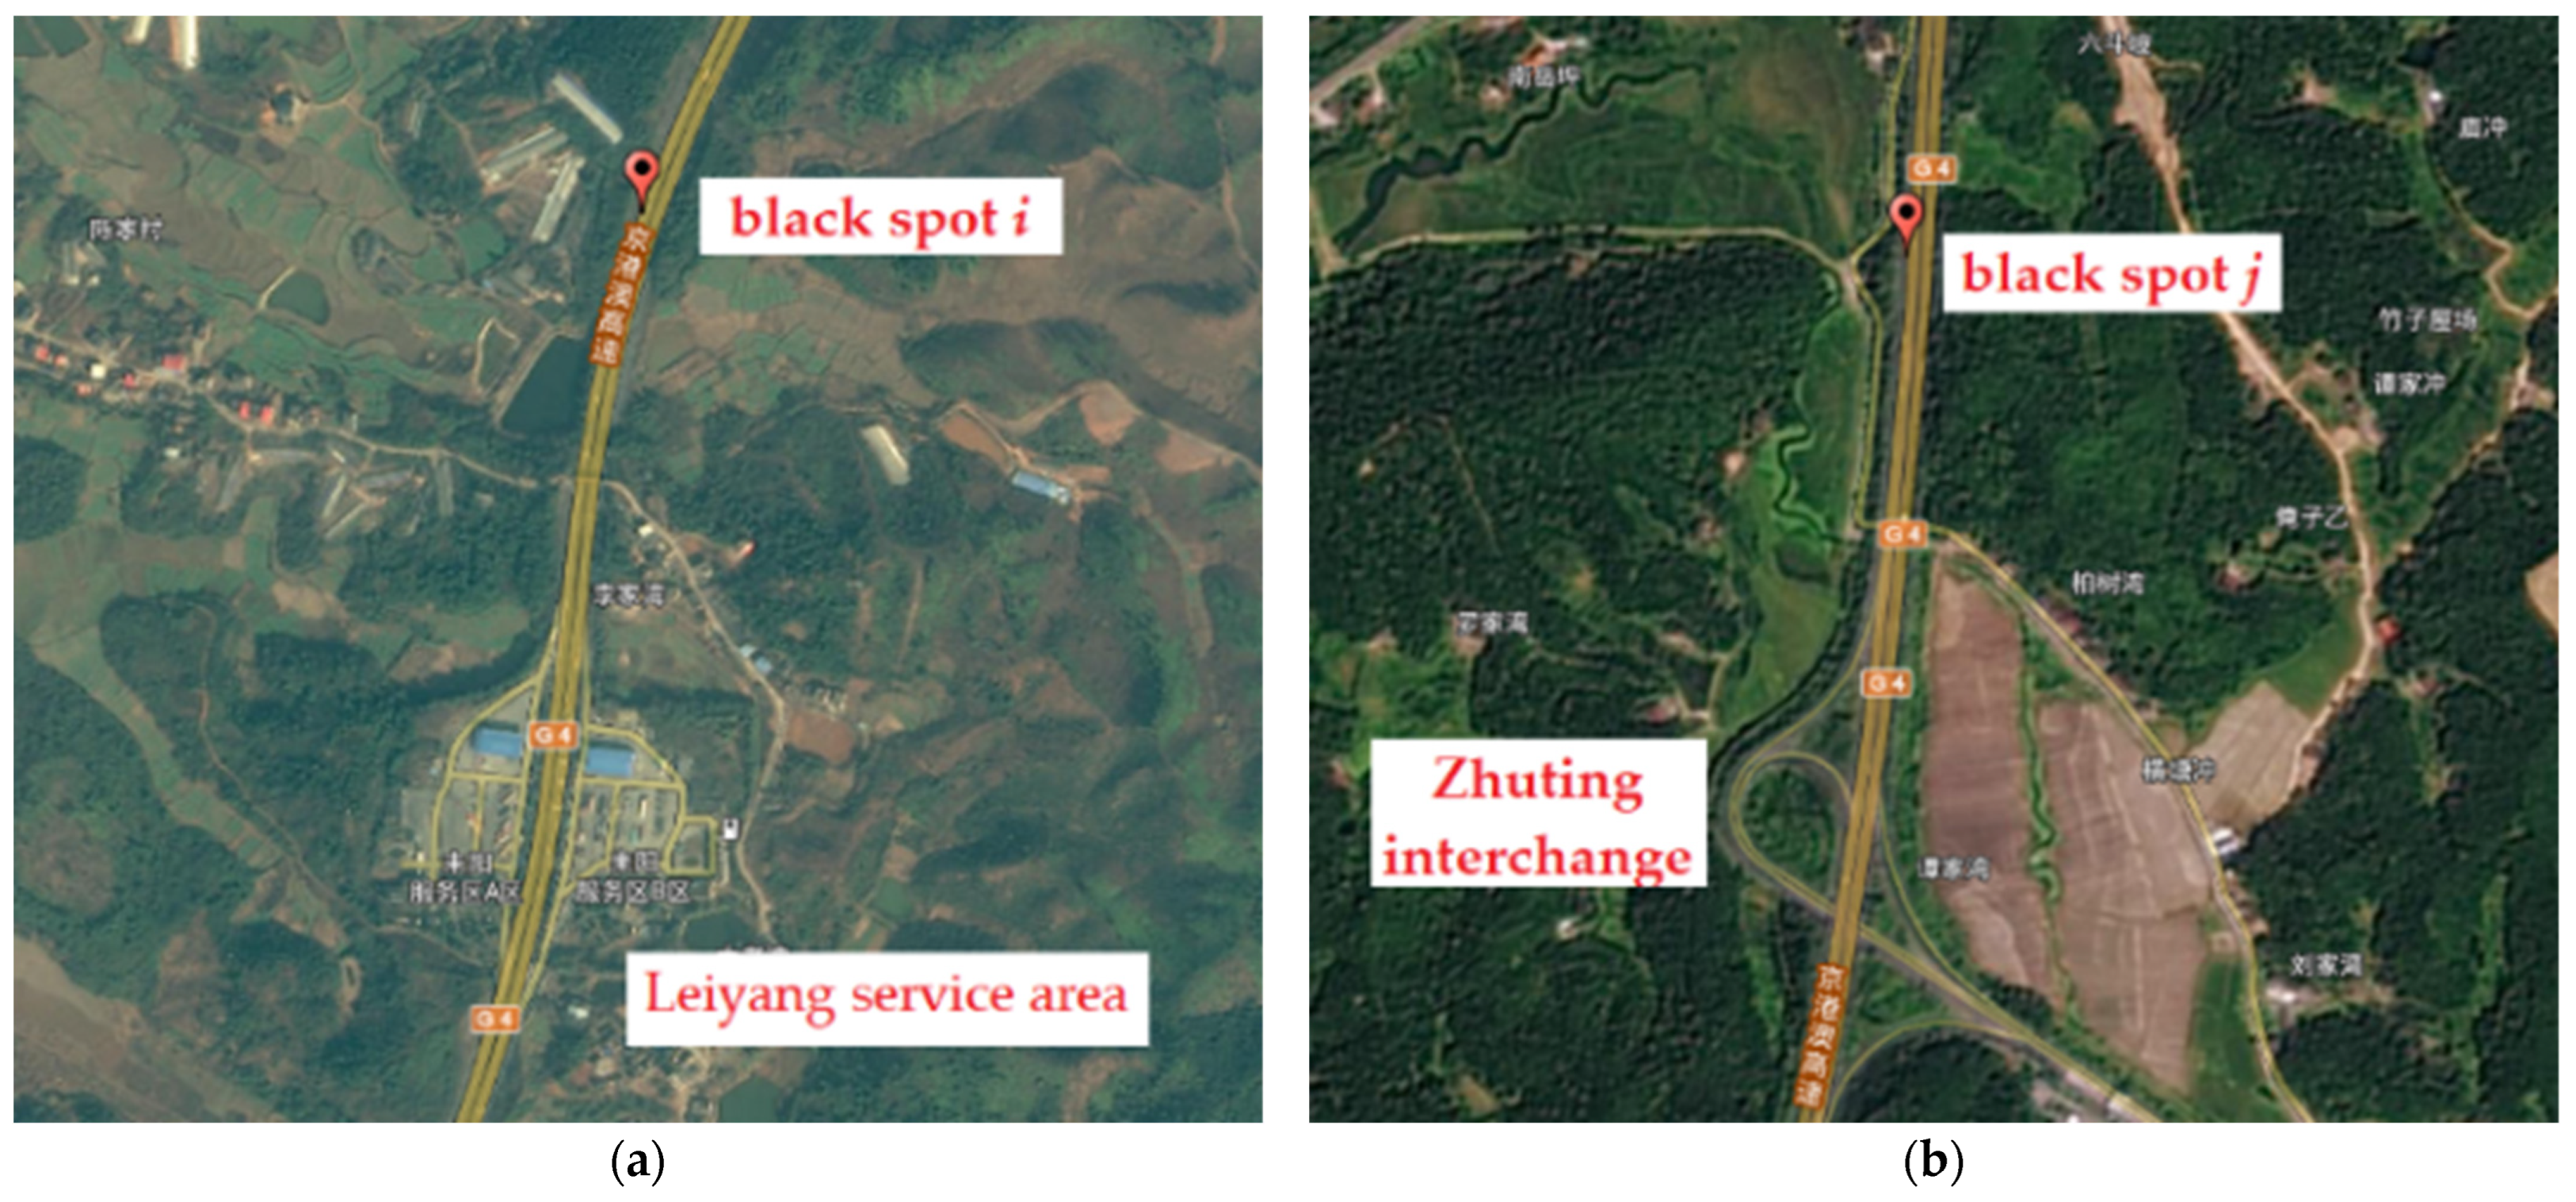
4.2. Results Analysis of Identifying Accident-Prone Black Spots
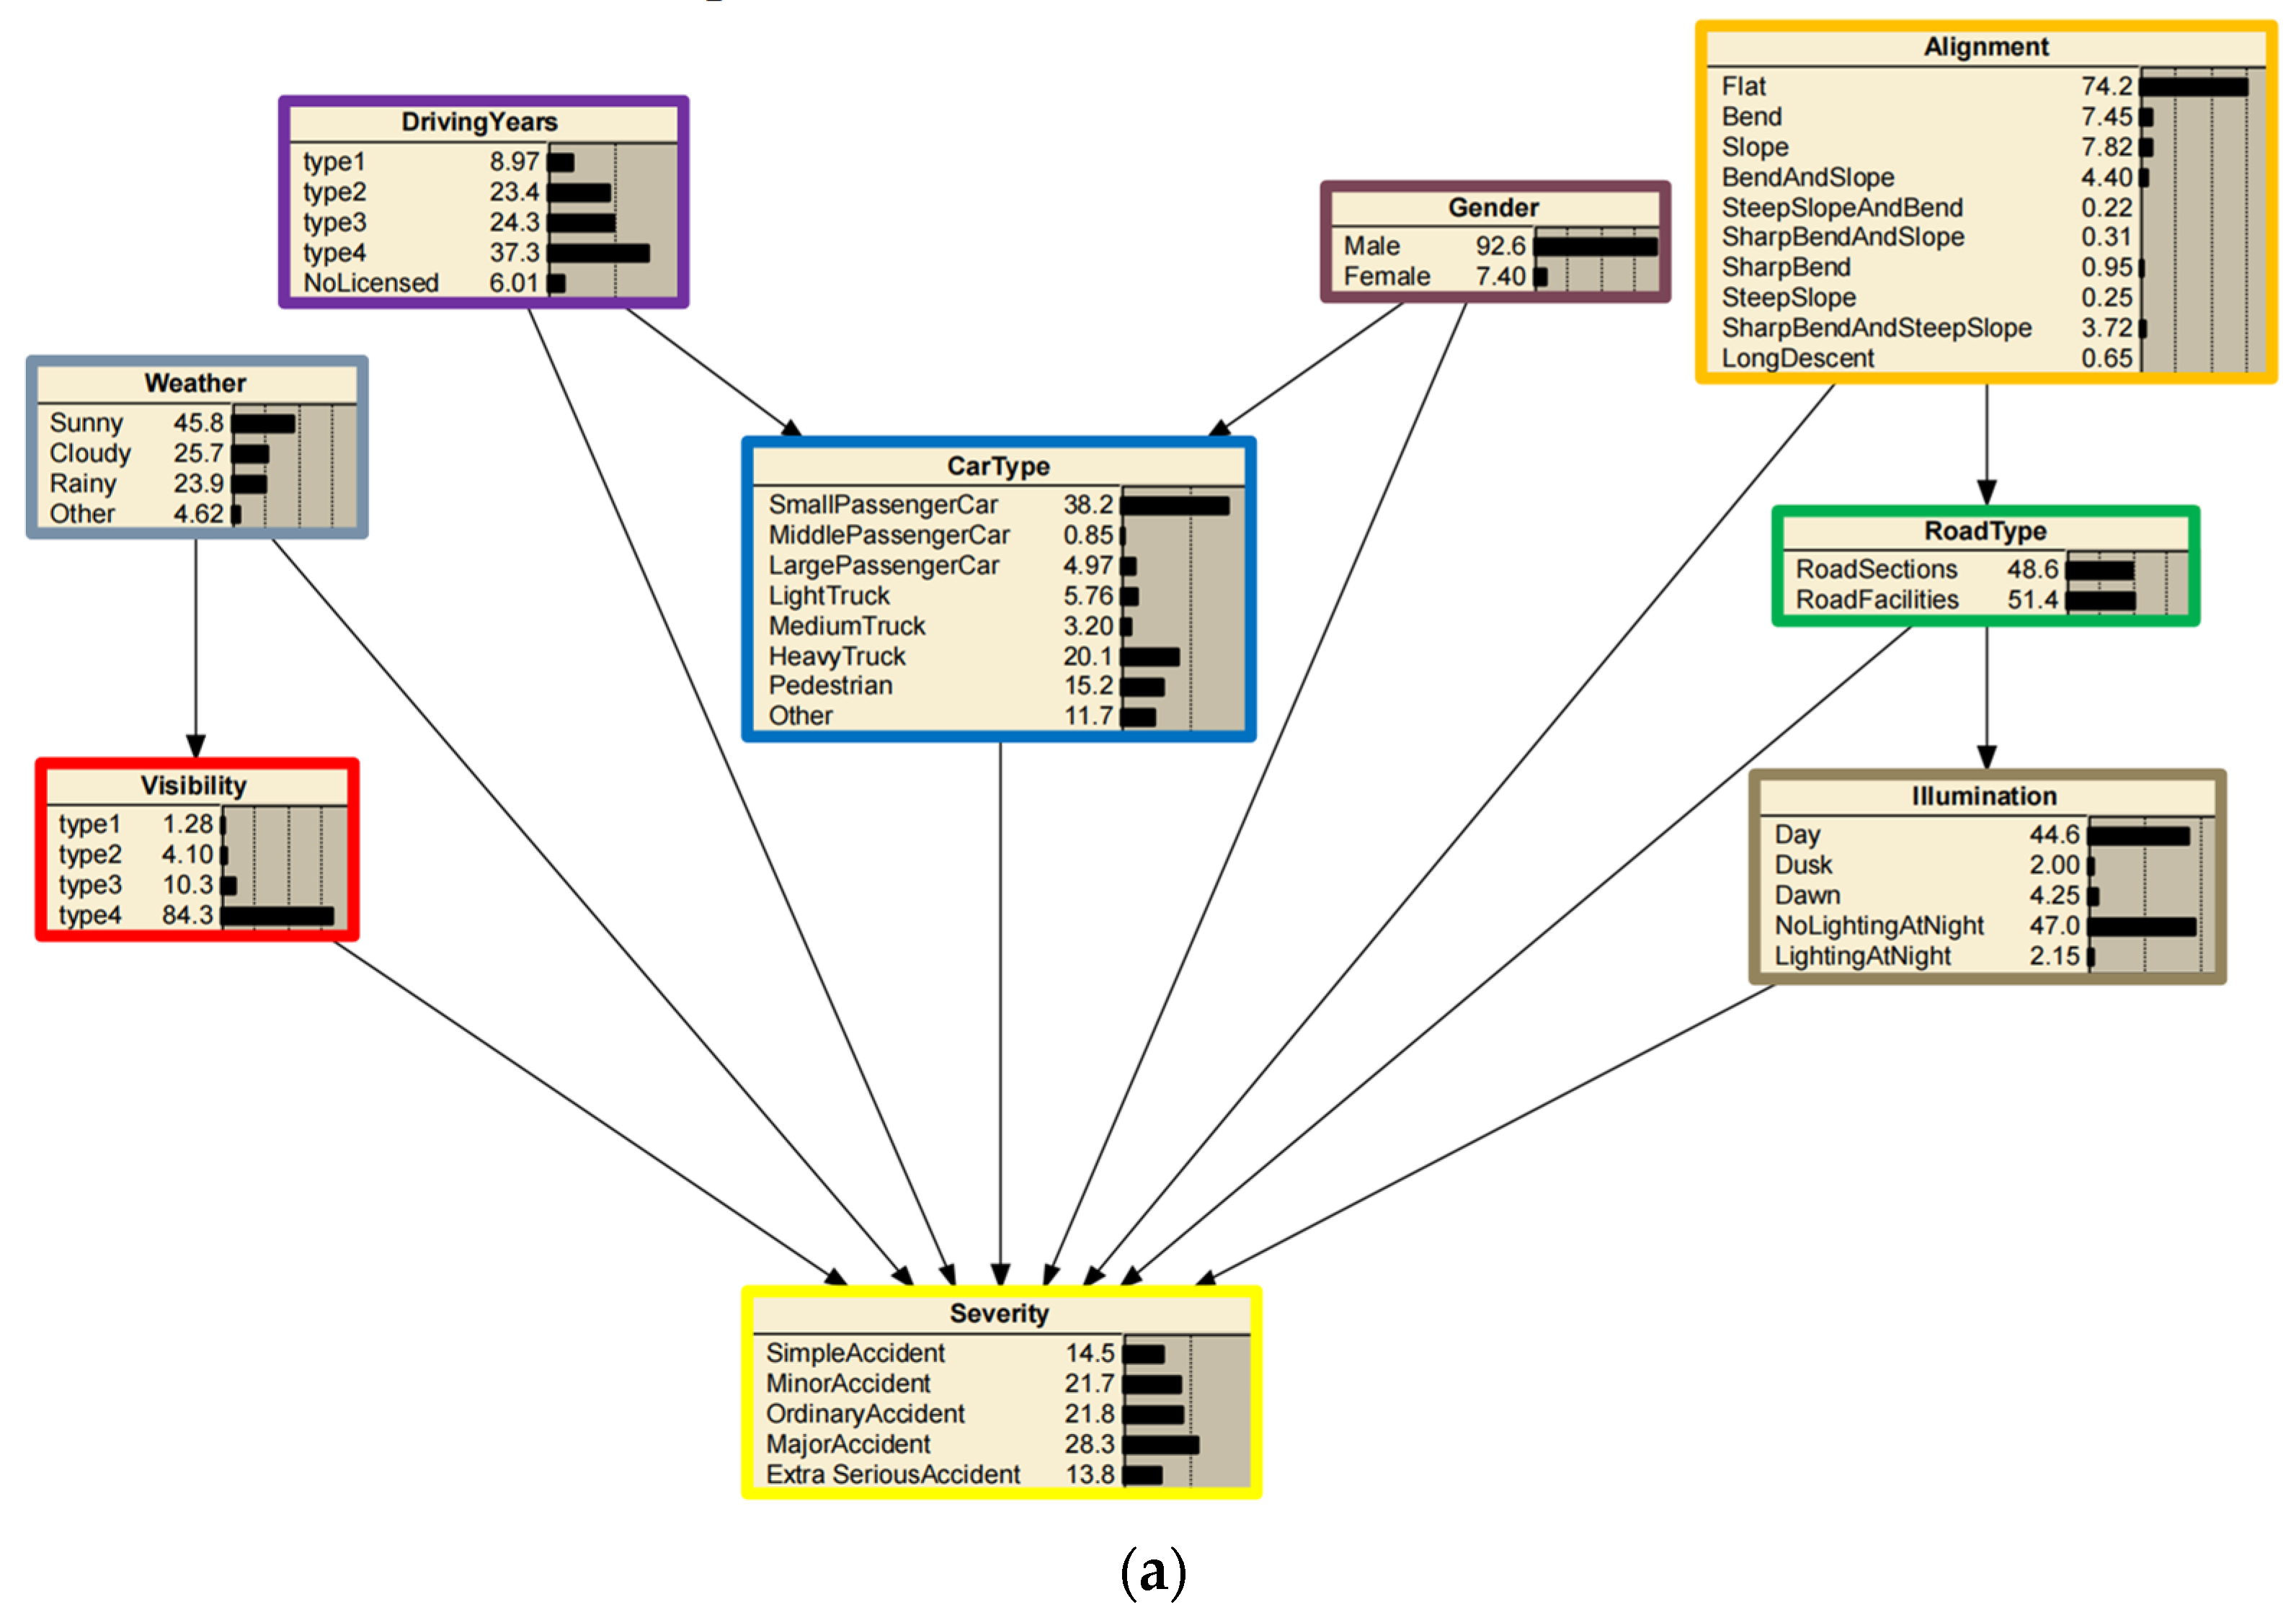
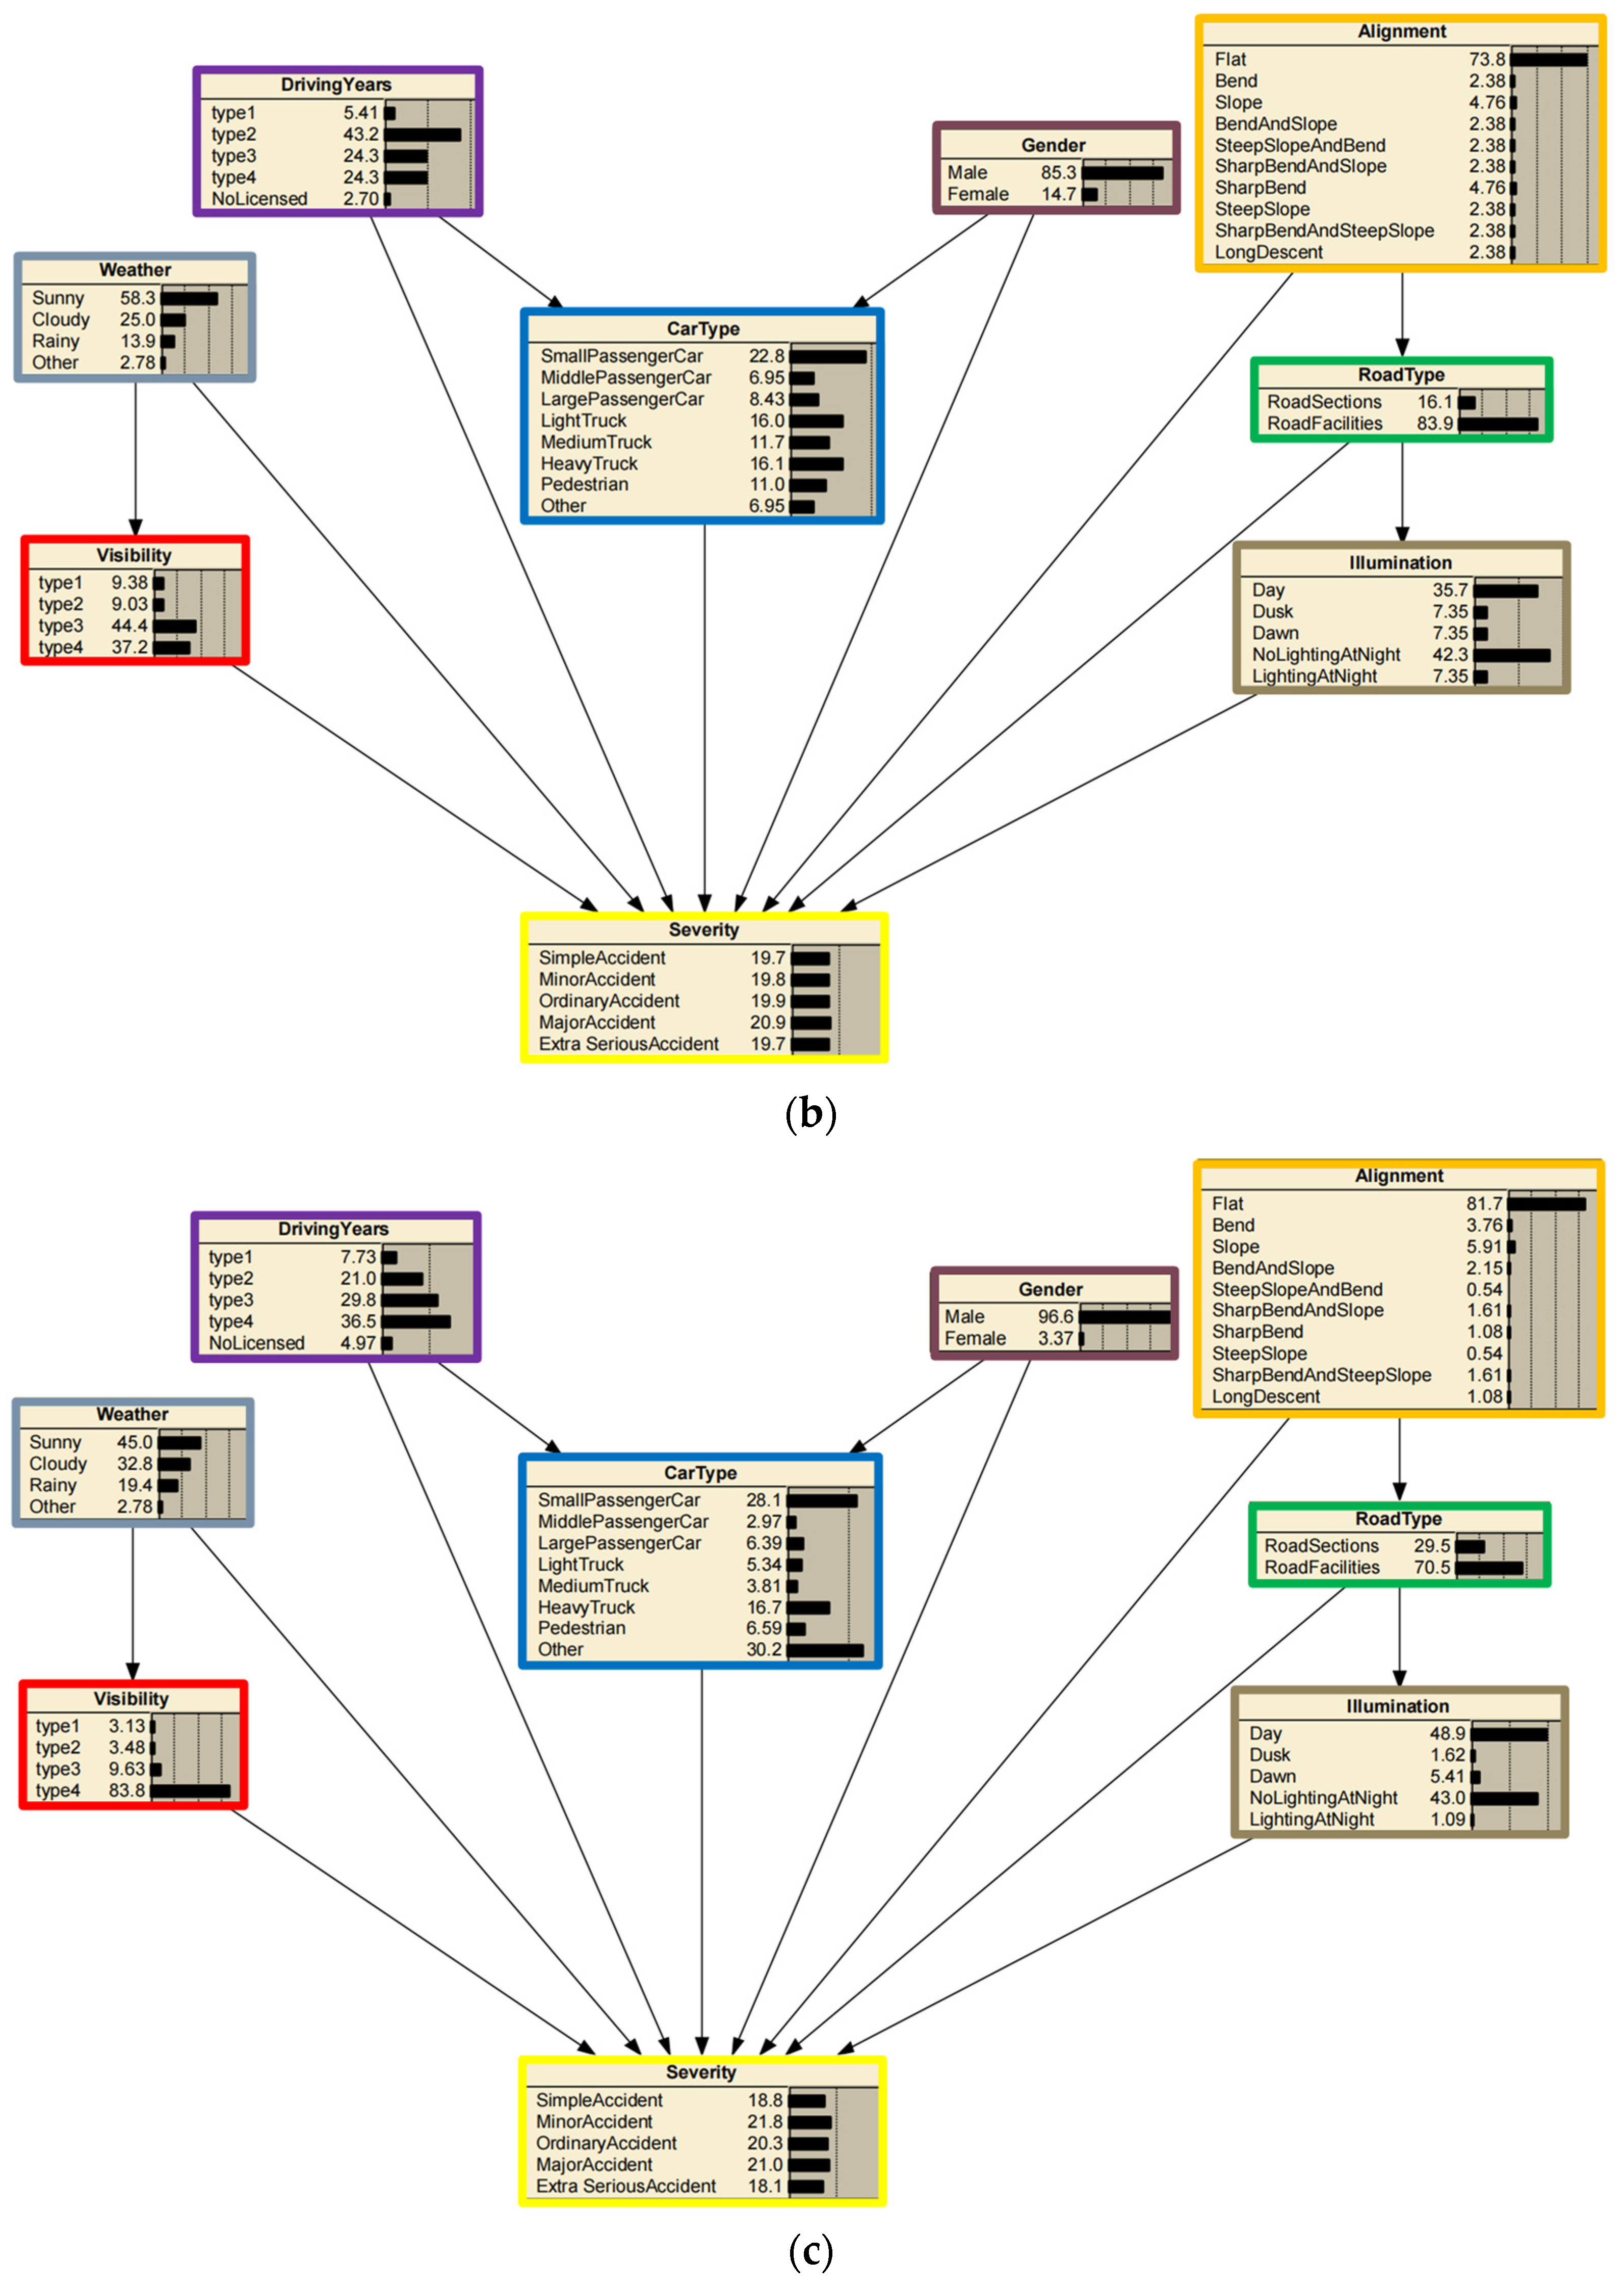
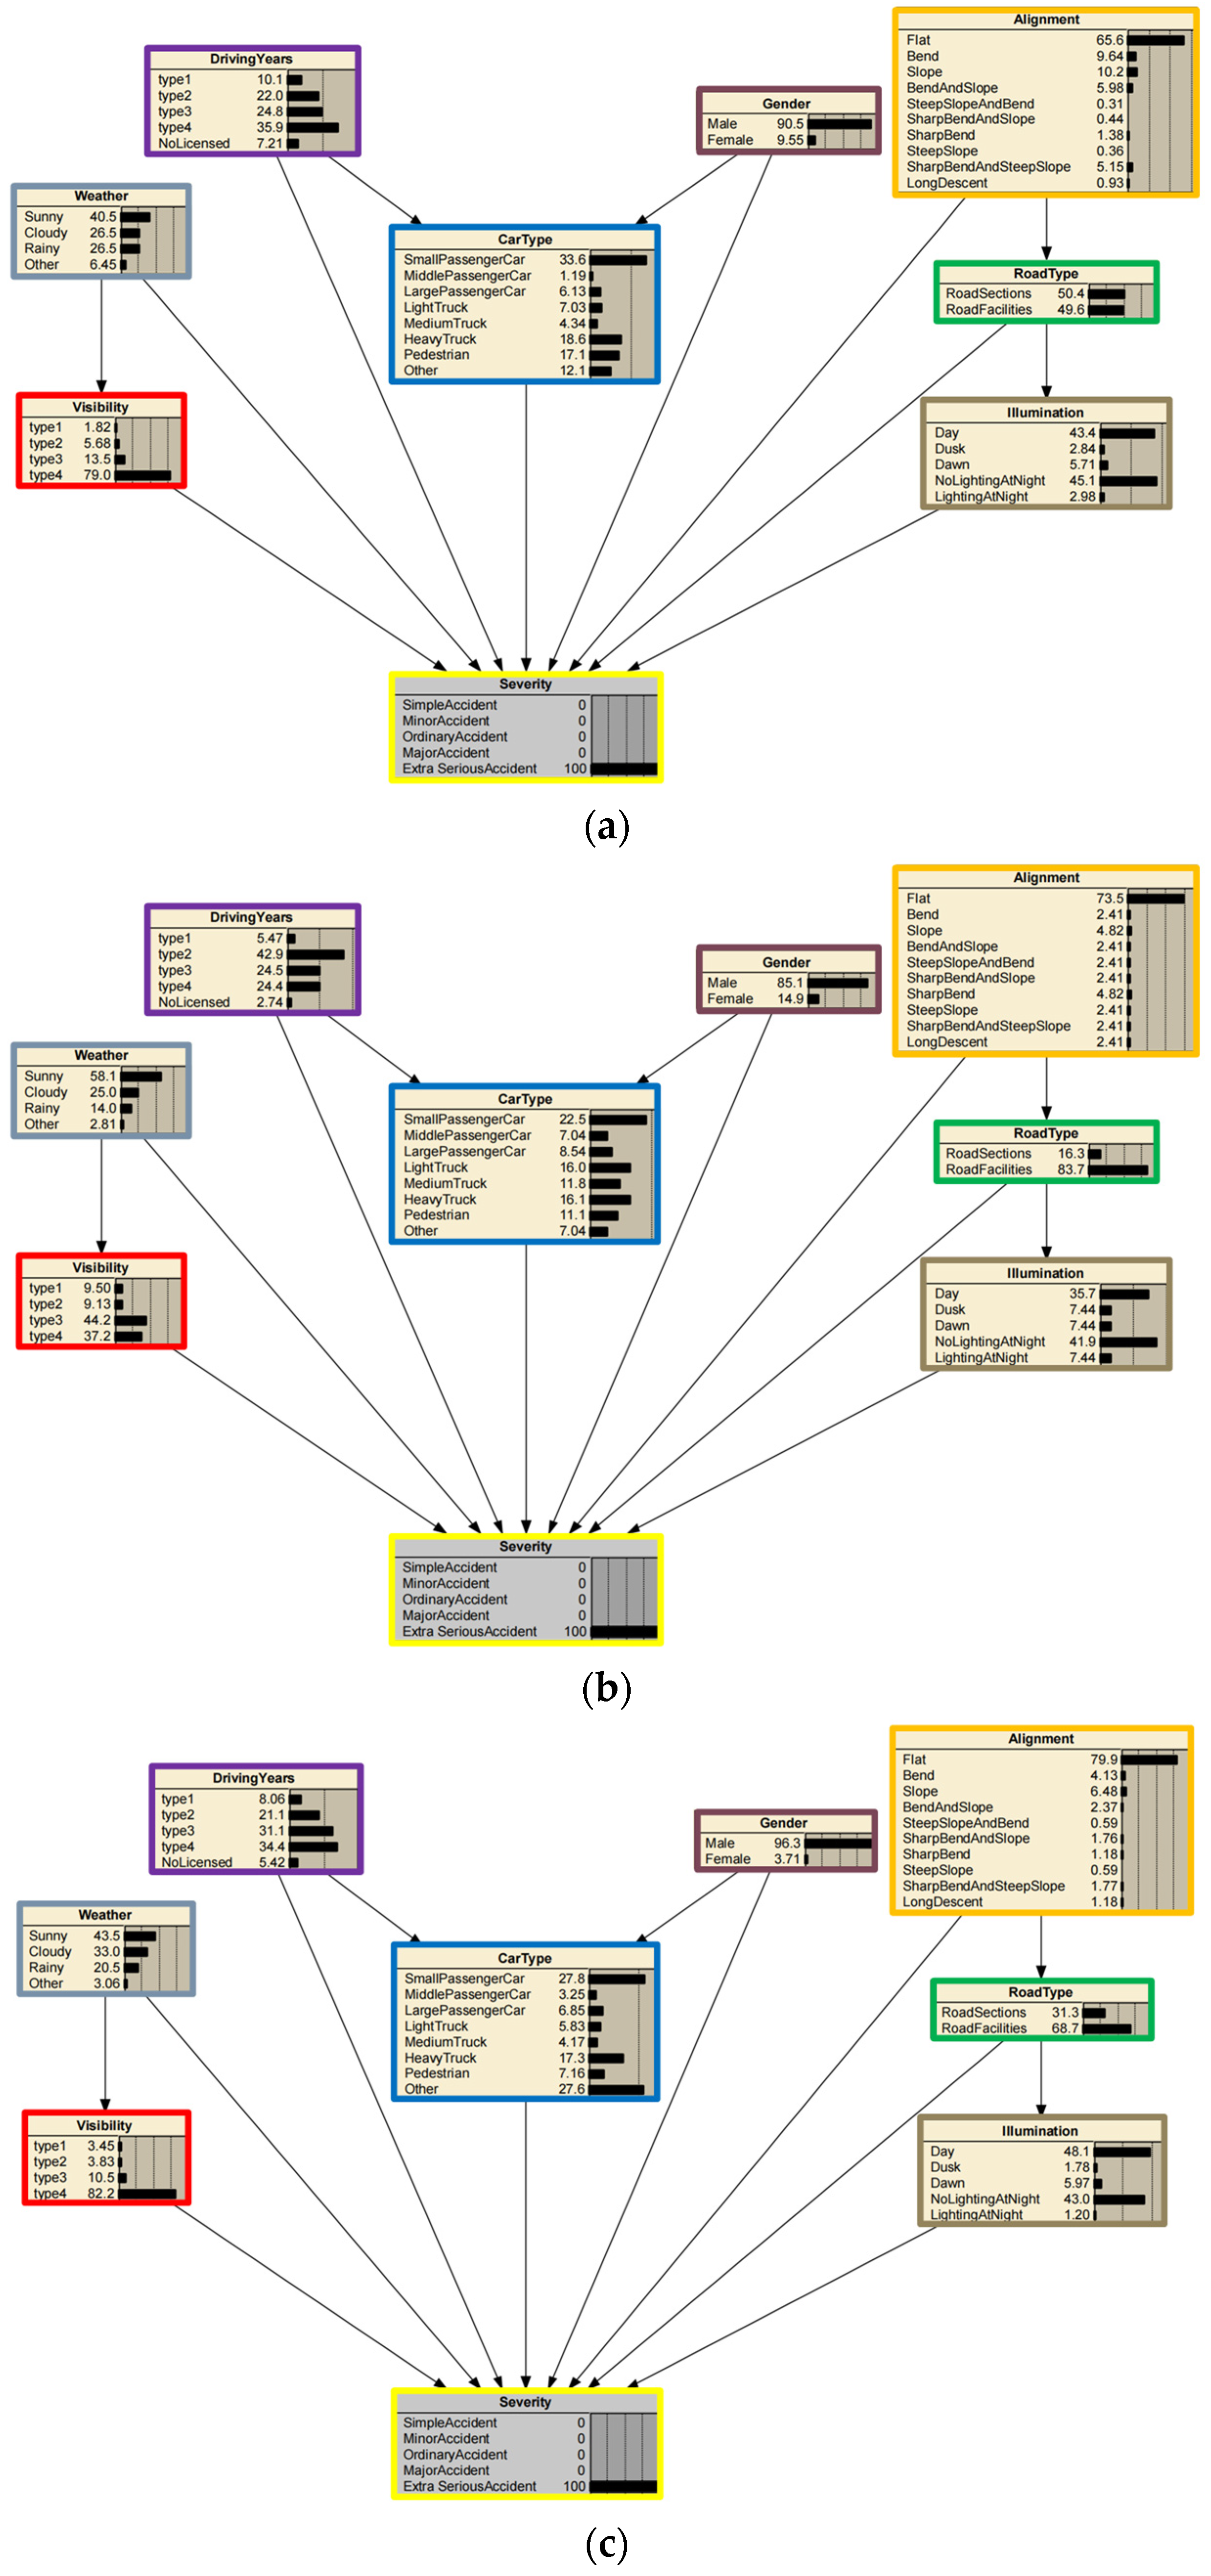
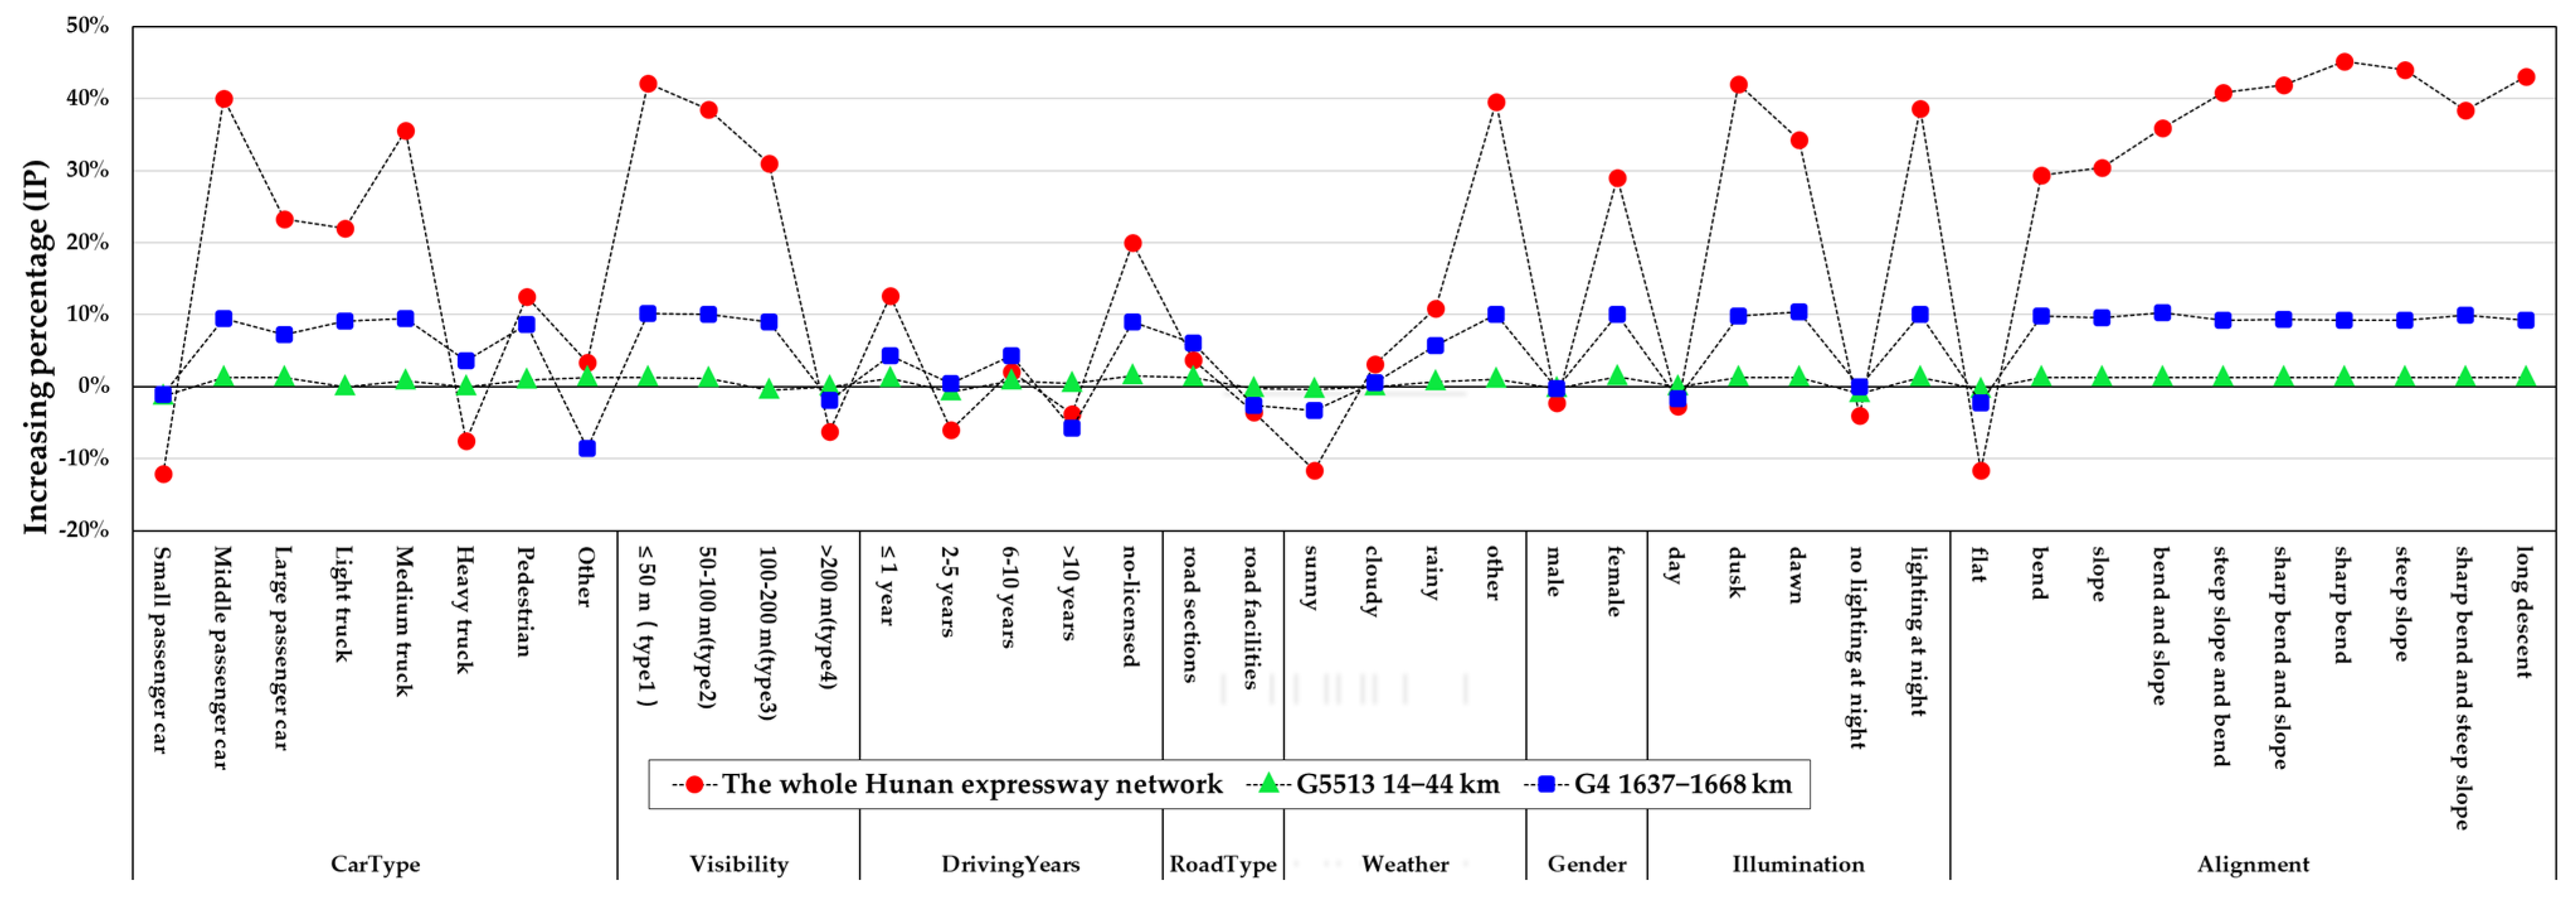
4.3. Results Analysis of Exploring Accident-Prone Causal Factors
5. Conclusions
Author Contributions
Funding
Data Availability Statement
Conflicts of Interest
References
- Hazaymeh, K.; Almagbile, A.; Alomari, A.H. Spatiotemporal Analysis of Traffic Accidents Hotspots Based on Geospatial Techniques. ISPRS Int. J. Geo-Inf. 2022, 11, 260. [Google Scholar] [CrossRef]
- Road Traffic Injuries. Available online: https://www.who.int/news-room/fact-sheets/detail/road-traffic-injuries (accessed on 12 December 2022).
- China Statistical Yearbook. Available online: http://www.stats.gov.cn/tjsj/ndsj/2021/indexeh.htm (accessed on 12 December 2022).
- Zheng, Z.; Wang, Z.; Zhu, L.; Jiang, H. Determinants of the congestion caused by a traffic accident in urban road networks. Accid. Anal. Prev. 2020, 136, 105327. [Google Scholar] [CrossRef]
- Marshall, W.E.; Garrick, N.W. Does street network design affect traffic safety? Accid. Anal. Prev. 2011, 43, 769–781. [Google Scholar] [CrossRef]
- Ulak, M.B.; Ozguven, E.E.; Vanli, O.A.; Horner, M.W. Exploring alternative spatial weights to detect crash hotspots. Comput. Environ. Urban Syst. 2019, 78, 101398. [Google Scholar] [CrossRef]
- Li, Y.; Bai, Y. Comparison of characteristics between fatal and injury accidents in the highway construction zones. Saf. Sci. 2008, 46, 646–660. [Google Scholar] [CrossRef]
- Traffic Management Bureau of the Ministry of Public Security. Statistical Annual Report of Road Traffic Accidents of the People’s Republic of China in 2016; Traffic Management Bureau of the Ministry of Public Security: Beijing, China, 2017. [Google Scholar]
- Fang, S.E.; Guo, Z.Y.; Yang, Z. A new identification method for accident prone location on highway. J. Traffic Transp. Eng. 2001, 1, 90. [Google Scholar]
- Ouni, F.; Belloumi, M. Pattern of road traffic crash hot zones versus probable hot zones in Tunisia: A geospatial analysis. Accid. Anal. Prev. 2019, 128, 185. [Google Scholar] [CrossRef]
- Jorgensen, R.; Research, I. Evaluation of Criteria for Safety Improvements on the Highway; Report to the Bureau of Public Roads: Washington, DC, USA, 1966. [Google Scholar]
- Hauer, E. Observational Before—After Studies in Road Safety: Estimating the Effect of Highway and Traffic Engineering Measures on Road Safety; Pergamon Press (Elsevier Science): Oxford, UK, 1997. [Google Scholar]
- Deacon, J.A.; Zeeger, C.V.; Deen, R.C. Identification of hazardous rural highway locations. Transp. Res. Rec. 1975, 543, 16–33. [Google Scholar]
- Thomas, I. Spatial data aggregation: Exploratory analysis of road accidents. Accid. Anal. Prev. 1996, 28, 251–264. [Google Scholar] [CrossRef] [PubMed]
- Steenberghen, T.; Dufays, T.; Thomas, I.; Flahaut, B. Intra-urban location and clustering of road accidents using GIS: A Belgian example. Int. J. Geogr. Inf. Sci. 2004, 18, 169–181. [Google Scholar] [CrossRef]
- Lipovac, K.; Jovanovi, D.; Bai, S. Mapping of risks on the main road network of Serbia. Ann. Fac. Eng. Hunedoara 2009, 7, 125. [Google Scholar]
- Bíl, M.; Andrášik, R.; Sedoník, J. Which curves are dangerous? A network-wide analysis of traffic crash and infrastructure data. Transp. Res. Part A Policy Pract. 2019, 120, 252–260. [Google Scholar] [CrossRef]
- Krueger, R.; Bansal, P.; Buddhavarapu, P. A new spatial count data model with Bayesian additive regression trees for accident hot spot identification. Accid. Anal. Prev. 2020, 144, 105623. [Google Scholar] [CrossRef]
- Debrabant, B.; Halekoh, U.; Bonat, W.H.; Hansen, D.L.; Hjelmborg, J.; Lauritsen, J. Identifying traffic accident black spots with Poisson-Tweedie models. Accid. Anal. Prev. 2018, 111, 147–154. [Google Scholar] [CrossRef] [PubMed]
- Li, L.; Zhu, L.; Sui, D.Z. A GIS-based Bayesian approach for analyzing spatial–temporal patterns of intra-city motor vehicle crashes. J. Transp. Geogr. 2007, 15, 274–285. [Google Scholar] [CrossRef]
- Ramírez, A.F.; Valencia, C. Spatiotemporal correlation study of traffic accidents with fatalities and injuries in Bogota (Colombia). Accid. Anal. Prev. 2021, 149, 105848. [Google Scholar] [CrossRef]
- Anderson, T.K. Kernel density estimation and K-means clustering to profile road accident hotspots. Accid. Anal. Prev. 2009, 41, 359–364. [Google Scholar] [CrossRef] [PubMed]
- Eckley, D.C.; Curtin, K.M. Evaluating the spatiotemporal clustering of traffic incidents. Comput. Environ. Urban Syst. 2013, 37, 70–81. [Google Scholar] [CrossRef]
- Blazquez, C.A.; Picarte, B.; Calderón, J.F.; Losada, F. Spatial autocorrelation analysis of cargo trucks on highway crashes in Chile. Accid. Anal. Prev. 2018, 120, 195–210. [Google Scholar] [CrossRef]
- Harirforoush, H.; Bellalite, L. A new integrated GIS-based analysis to detect hotspots: A case study of the city of Sherbrooke. Accid. Anal. Prev. 2019, 130, 62–74. [Google Scholar] [CrossRef]
- Holmgren, J.; Knapen, L.; Olsson, V.; Masud, A.P. On the use of clustering analysis for identification of unsafe places in an urban traffic network. Procedia Comput. Sci. 2020, 170, 187–194. [Google Scholar] [CrossRef]
- Xu, P.; Huang, H.; Dong, N. The modifiable areal unit problem in traffic safety: Basic issue, potential solutions and future research. J. Traffic Transp. Eng. (Engl. Ed.) 2018, 5, 73–82. [Google Scholar] [CrossRef]
- Ghadi, M.; Török, Á. A comparative analysis of black spot identification methods and road accident segmentation methods. Accid. Anal. Prev. 2019, 128, 1–7. [Google Scholar] [CrossRef]
- Black, W.R. Highway accidents: A spatial and temporal analysis. Transp. Res. Rec. 1991, 1318, 75–82. [Google Scholar]
- Golze, J.; Feuerhake, U.; Koetsier, C.; Sester, M. Impact analysis of accidents on the traffic flow based on massive floating car data. Int. Arch. Photogramm. Remote Sens. Spat. Inf. Sci. 2021, XLIII-B4-202, 95–102. [Google Scholar] [CrossRef]
- Zhang, G.; Yau, K.K.W.; Zhang, X.; Li, Y. Traffic accidents involving fatigue driving and their extent of casualties. Accid. Anal. Prev. 2016, 87, 34–42. [Google Scholar] [CrossRef]
- Thiffault, P.; Bergeron, J. Monotony of road environment and driver fatigue: A simulator study. Accid. Anal. Prev. 2003, 35, 381–391. [Google Scholar] [CrossRef]
- Pervez, A.; Huang, H.; Lee, J.; Han, C.; Wang, J.; Zhang, X. Crash analysis of expressway long tunnels using a seven-zone analytic approach. J. Transp. Saf. Secur. 2021, 13, 108–122. [Google Scholar] [CrossRef]
- Qu, X.; Zhu, X.; Xiao, X.; Wu, H.; Guo, B.; Li, D. Exploring the Influences of Point-of-Interest on Traffic Crashes during Weekdays and Weekends via Multi-Scale Geographically Weighted Regression. ISPRS Int. J. Geo-Inf. 2021, 10, 791. [Google Scholar] [CrossRef]
- Hong, J.; Tamakloe, R.; Park, D. Application of association rules mining algorithm for hazardous materials transportation crashes on expressway. Accid. Anal. Prev. 2020, 142, 105497. [Google Scholar] [CrossRef]
- Karimnezhad, A.; Moradi, F. Road accident data analysis using Bayesian networks. Transp. Lett. 2017, 9, 12–19. [Google Scholar] [CrossRef]
- Hwang, S.; Boyle, L.N.; Banerjee, A.G. Identifying characteristics that impact motor carrier safety using Bayesian networks. Accid. Anal. Prev. 2019, 128, 40–45. [Google Scholar] [CrossRef] [PubMed]
- 2021 Hunan Statistical Yearbook. Available online: http://222.240.193.190/2021tjnj/indexeh.htm (accessed on 12 December 2022).
- Bíl, M.; Andrášik, R.; Sedoník, J. A detailed spatiotemporal analysis of traffic crash hotspots. Appl. Geogr. 2019, 107, 82–90. [Google Scholar] [CrossRef]
- Deng, M.; Liu, Q.; Cheng, T.; Shi, Y. An adaptive spatial clustering algorithm based on Delaunay triangulation. Comput. Environ. Urban Syst. 2011, 35, 320–332. [Google Scholar] [CrossRef]
- Ester, M.; Kriegel, H.-P.; Sander, J.; Xu, X. A density-based algorithm for discovering clusters in large spatial databases with Noise. In Proceedings of the 2nd International Conference on Knowledge Discovery and Data Mining, Portland, OR, USA, 2–4 August 1996; pp. 226–231. [Google Scholar]
- Geng, C.; Peng, Y. Identification method of traffic accident black spots based on dynamic segmentation and DBSCAN algorithm. J. Chang. Univ. Nat. Sci. Ed. 2018, 38, 131–138. [Google Scholar]
- Shinde, P.; Kudalkar, G.; Pawar, S.; Tiwari, H.; Khairnar, H. Khairnar Accident Hotspot Detection by DB-Scan Clustering. In ICT Analysis and Applications; Lecture Notes in Networks and Systems; Fong, S., Dey, N., Joshi, A., Eds.; Springer: Singapore; Volume 314.
- Notice of the Ministry of Public Security on Revising the Classification Standards for Road Traffic Accidents. Available online: http://fgcx.bjcourt.gov.cn:4601/law?fn=chl026s135.txt (accessed on 10 January 2023).
- Antão, P.; Soares, C.G. Analysis of the influence of human errors on the occurrence of coastal ship accidents in different wave conditions using Bayesian Belief Networks. Accid. Anal. Prev. 2019, 133, 105262. [Google Scholar] [CrossRef]
- Friedman, N.; Dan, G.; Goldszmidt, M. Bayesian Network Classifiers. Mach. Learn. 1997, 29, 131–163. [Google Scholar] [CrossRef] [Green Version]
- Ni, P.; Yu, W. A Victim-Based Framework for Telecom Fraud Analysis: A Bayesian Network Model. Comput. Intell. Neurosci. 2022, 2022, 7937355. [Google Scholar] [CrossRef]
- The Ministry of Public Security Announced the Top 10 Black Spots in 2017. Available online: http://www.gov.cn/xinwen/2018-02/02/content_5263057.htm (accessed on 12 December 2022).
- 33 Accident-Prone Sections for Hunan Expressway, See Where Are All? Available online: https://www.sohu.com/a/195396550_99977726 (accessed on 16 January 2023).


| Accident Attribute Name | Accident Attribute Name | |||
|---|---|---|---|---|
| General Accident | 1 | Accident number | 14 | Weather |
| 2 | Accident time | 15 | Visibility | |
| 3 | Route number | 16 | Illumination | |
| 4 | Road name | 17 | Road type | |
| 5 | Kilometers | 18 | Road alignment | |
| 6 | Meters | 19 | Gender | |
| 7 | Accident place | 20 | Age | |
| 8 | Accident reason | 21 | Traffic mode | |
| 9 | Accident situation | 22 | Driving years | |
| 10 | Multi-vehicles accident | 23 | Blood alcohol content | |
| 11 | Single vehicle accident | 24 | Main illegal act | |
| 12 | Carrying Hazardous goods | 25 | Accident liability | |
| 13 | Consequence of carrying hazardous goods | 26 | Injury degree | |
| Simple Accident | 1 | Accident number | 10 | Multi-vehicles accident |
| 2 | Accident time | 11 | Weather | |
| 3 | Route number | 12 | Road type | |
| 4 | Road name | 13 | Traffic mode | |
| 5 | Kilometers | 14 | Driving years | |
| 6 | Meters | 15 | Traffic mode class | |
| 7 | Accident place | 16 | Motor vehicle class | |
| 8 | Accident reason | 17 | Accident liability | |
| 9 | Accident situation | 18 | Car number |
| No. | Node | Variable |
|---|---|---|
| 1 | CarType | Small Passenger Car; Middle Passenger Car; Large Passenger Car; |
| Light Truck; Medium Truck; Heavy Truck; Pedestrian; Other | ||
| 2 | Weather | Sunny; Rainy; Cloudy; Other |
| 3 | RoadType | Road Sections; |
| Road Facilities (e.g., junctions, service zones, tollgates) | ||
| 4 | Gender | Male; Female |
| 5 | DrivingYears | type1: ≤1 year; type2: 2–5 years; |
| type3: 6–10 years; type4: >10 years; no-licensed | ||
| 6 | Visibility | type1: ≤50 m; type2: 50–100 m; type3: 100–200 m; type4: >200 m |
| 7 | Illumination | Day; Dusk; Dawn; No Lighting at Night; Lighting at Night |
| 8 | Alignment | Flat; Bend; Slope; Sharp Bend; Steep Slope; Bend and Slope; |
| Sharp Bend and Slope; Steep Slope and Bend; | ||
| Sharp Bend and Steep Slope; Long Descent | ||
| 9 | Severity | Simple Accident; Minor Accident; Ordinary Accident; |
| Major Accident; Extra-serious Accident |
| Mileage Range of Accident-Prone Black Spots | Weighted Accident Count | Accident Proportion of Typical Month(s) | |
|---|---|---|---|
| Shanghai-kunming (G60) | 1064–1090 km | 558 | Feb (32.69%) + Oct (31.08%) = 63.77% |
| Beijing-Hongkong-Macao (G4) | 1637–1668 km | 335 | Feb: 68.22% |
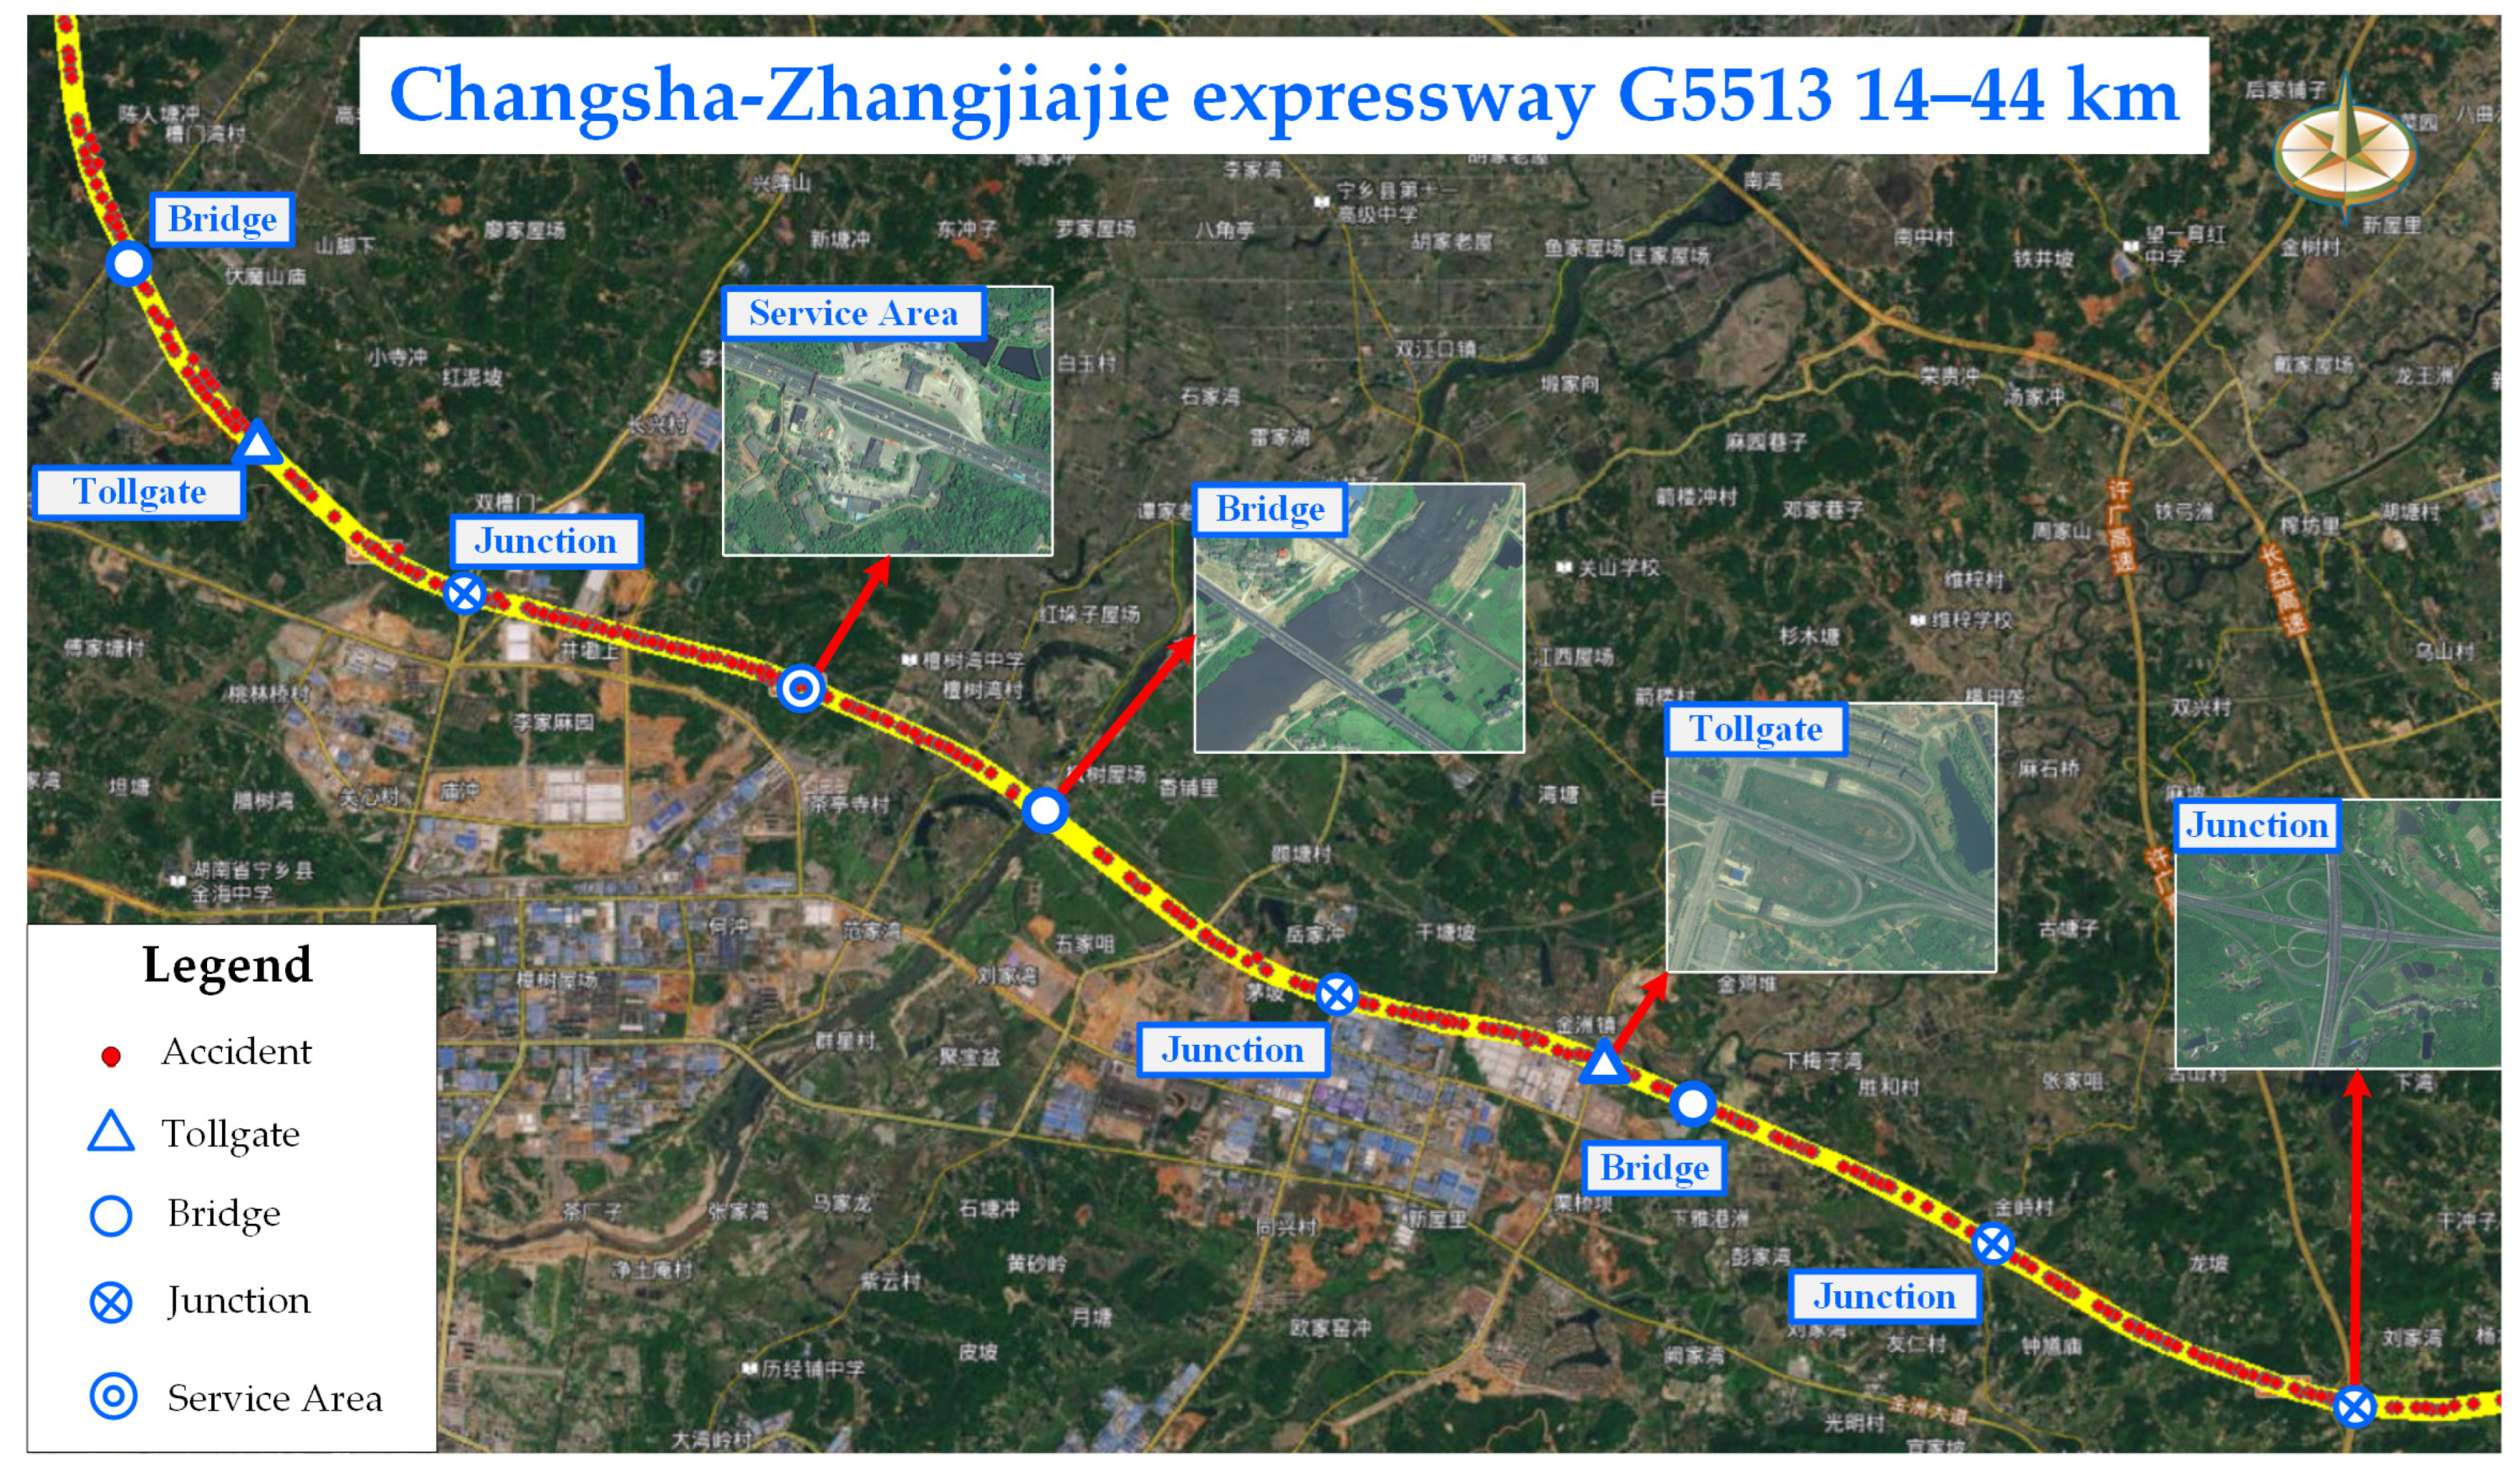
| Changsha-Zhangjiajie (G5513) | 14–44 km | 283.7 | Oct: 59.97% |
| Beijing-Hongkong-Macao (G4) | 1443–1476 km | 193.3 | Oct: 87.68% |
Disclaimer/Publisher’s Note: The statements, opinions and data contained in all publications are solely those of the individual author(s) and contributor(s) and not of MDPI and/or the editor(s). MDPI and/or the editor(s) disclaim responsibility for any injury to people or property resulting from any ideas, methods, instructions or products referred to in the content. |
© 2023 by the authors. Licensee MDPI, Basel, Switzerland. This article is an open access article distributed under the terms and conditions of the Creative Commons Attribution (CC BY) license (https://creativecommons.org/licenses/by/4.0/).
Share and Cite
Zhang, Y.; Zhu, F.; Li, Q.; Qiu, Z.; Xie, Y. Exploring Spatiotemporal Patterns of Expressway Traffic Accidents Based on Density Clustering and Bayesian Network. ISPRS Int. J. Geo-Inf. 2023, 12, 73. https://doi.org/10.3390/ijgi12020073
Zhang Y, Zhu F, Li Q, Qiu Z, Xie Y. Exploring Spatiotemporal Patterns of Expressway Traffic Accidents Based on Density Clustering and Bayesian Network. ISPRS International Journal of Geo-Information. 2023; 12(2):73. https://doi.org/10.3390/ijgi12020073
Chicago/Turabian StyleZhang, Yunfei, Fangqi Zhu, Qiuping Li, Zehang Qiu, and Yajun Xie. 2023. "Exploring Spatiotemporal Patterns of Expressway Traffic Accidents Based on Density Clustering and Bayesian Network" ISPRS International Journal of Geo-Information 12, no. 2: 73. https://doi.org/10.3390/ijgi12020073