
Developing and Disseminating a New Historical Geospatial Database from Kitchener’s 19th Century Map of Cyprus


 , ,
, ,  ,
,  ,
,
Abstract
:1. Introduction
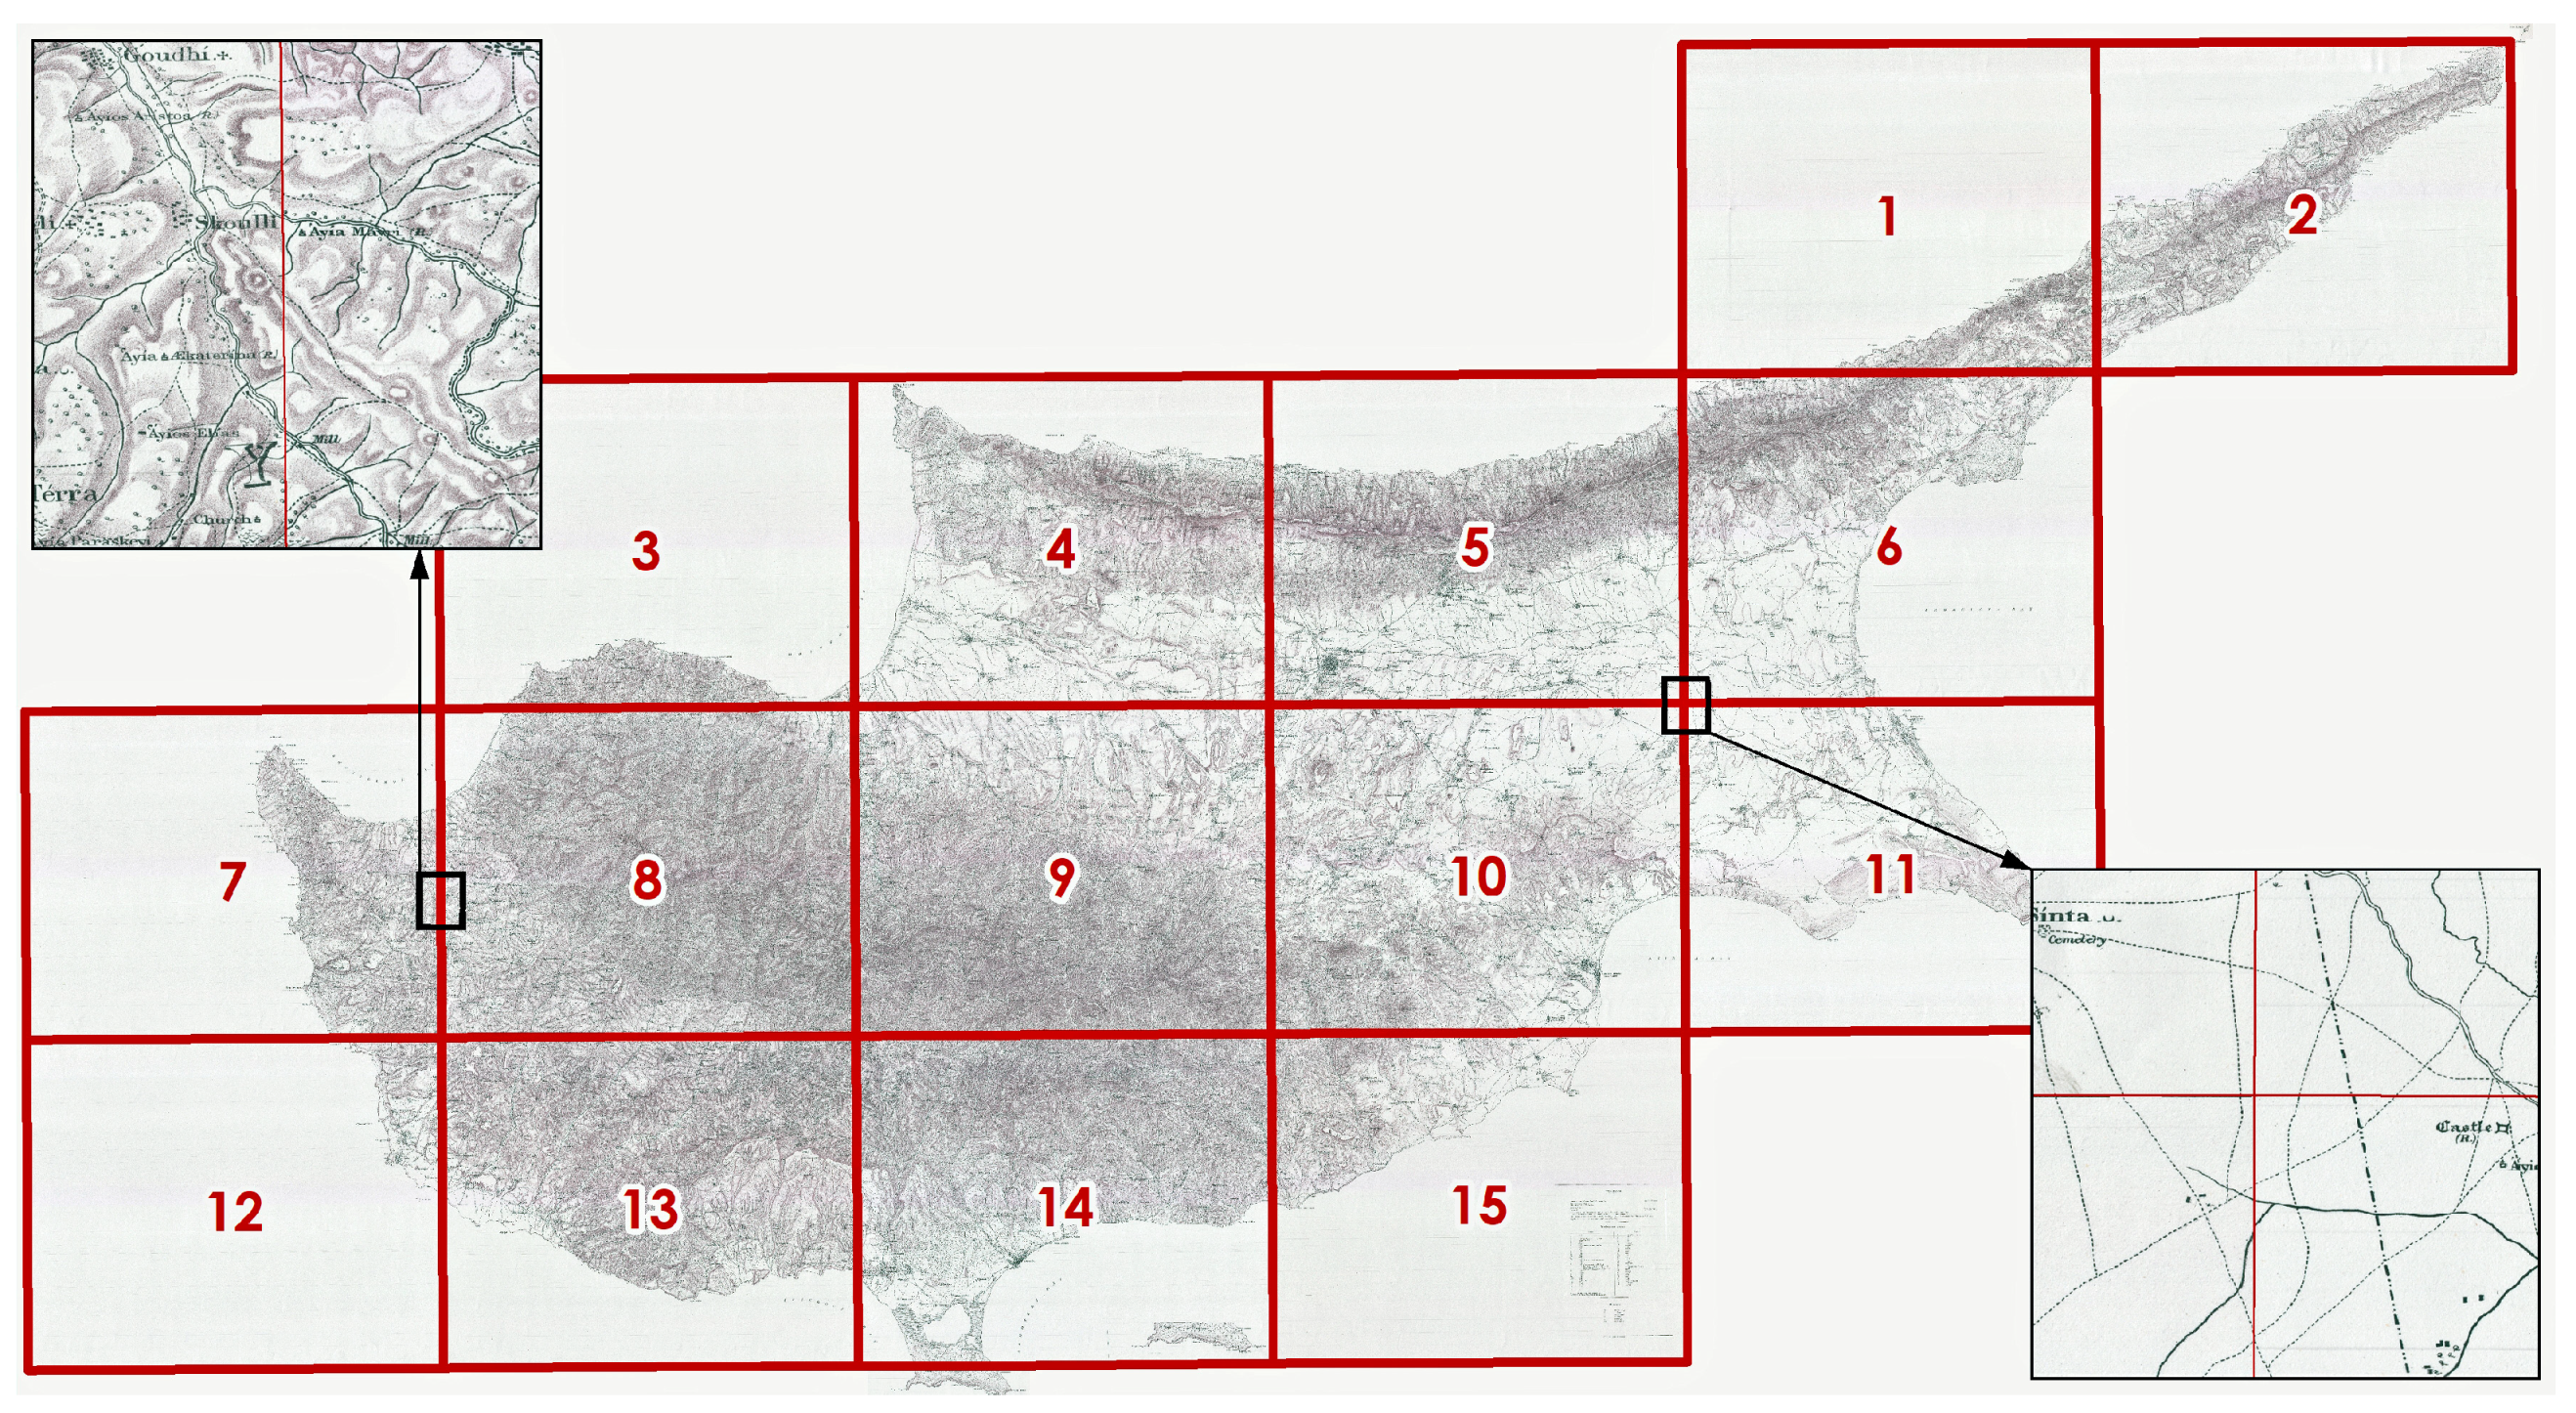
2. Material
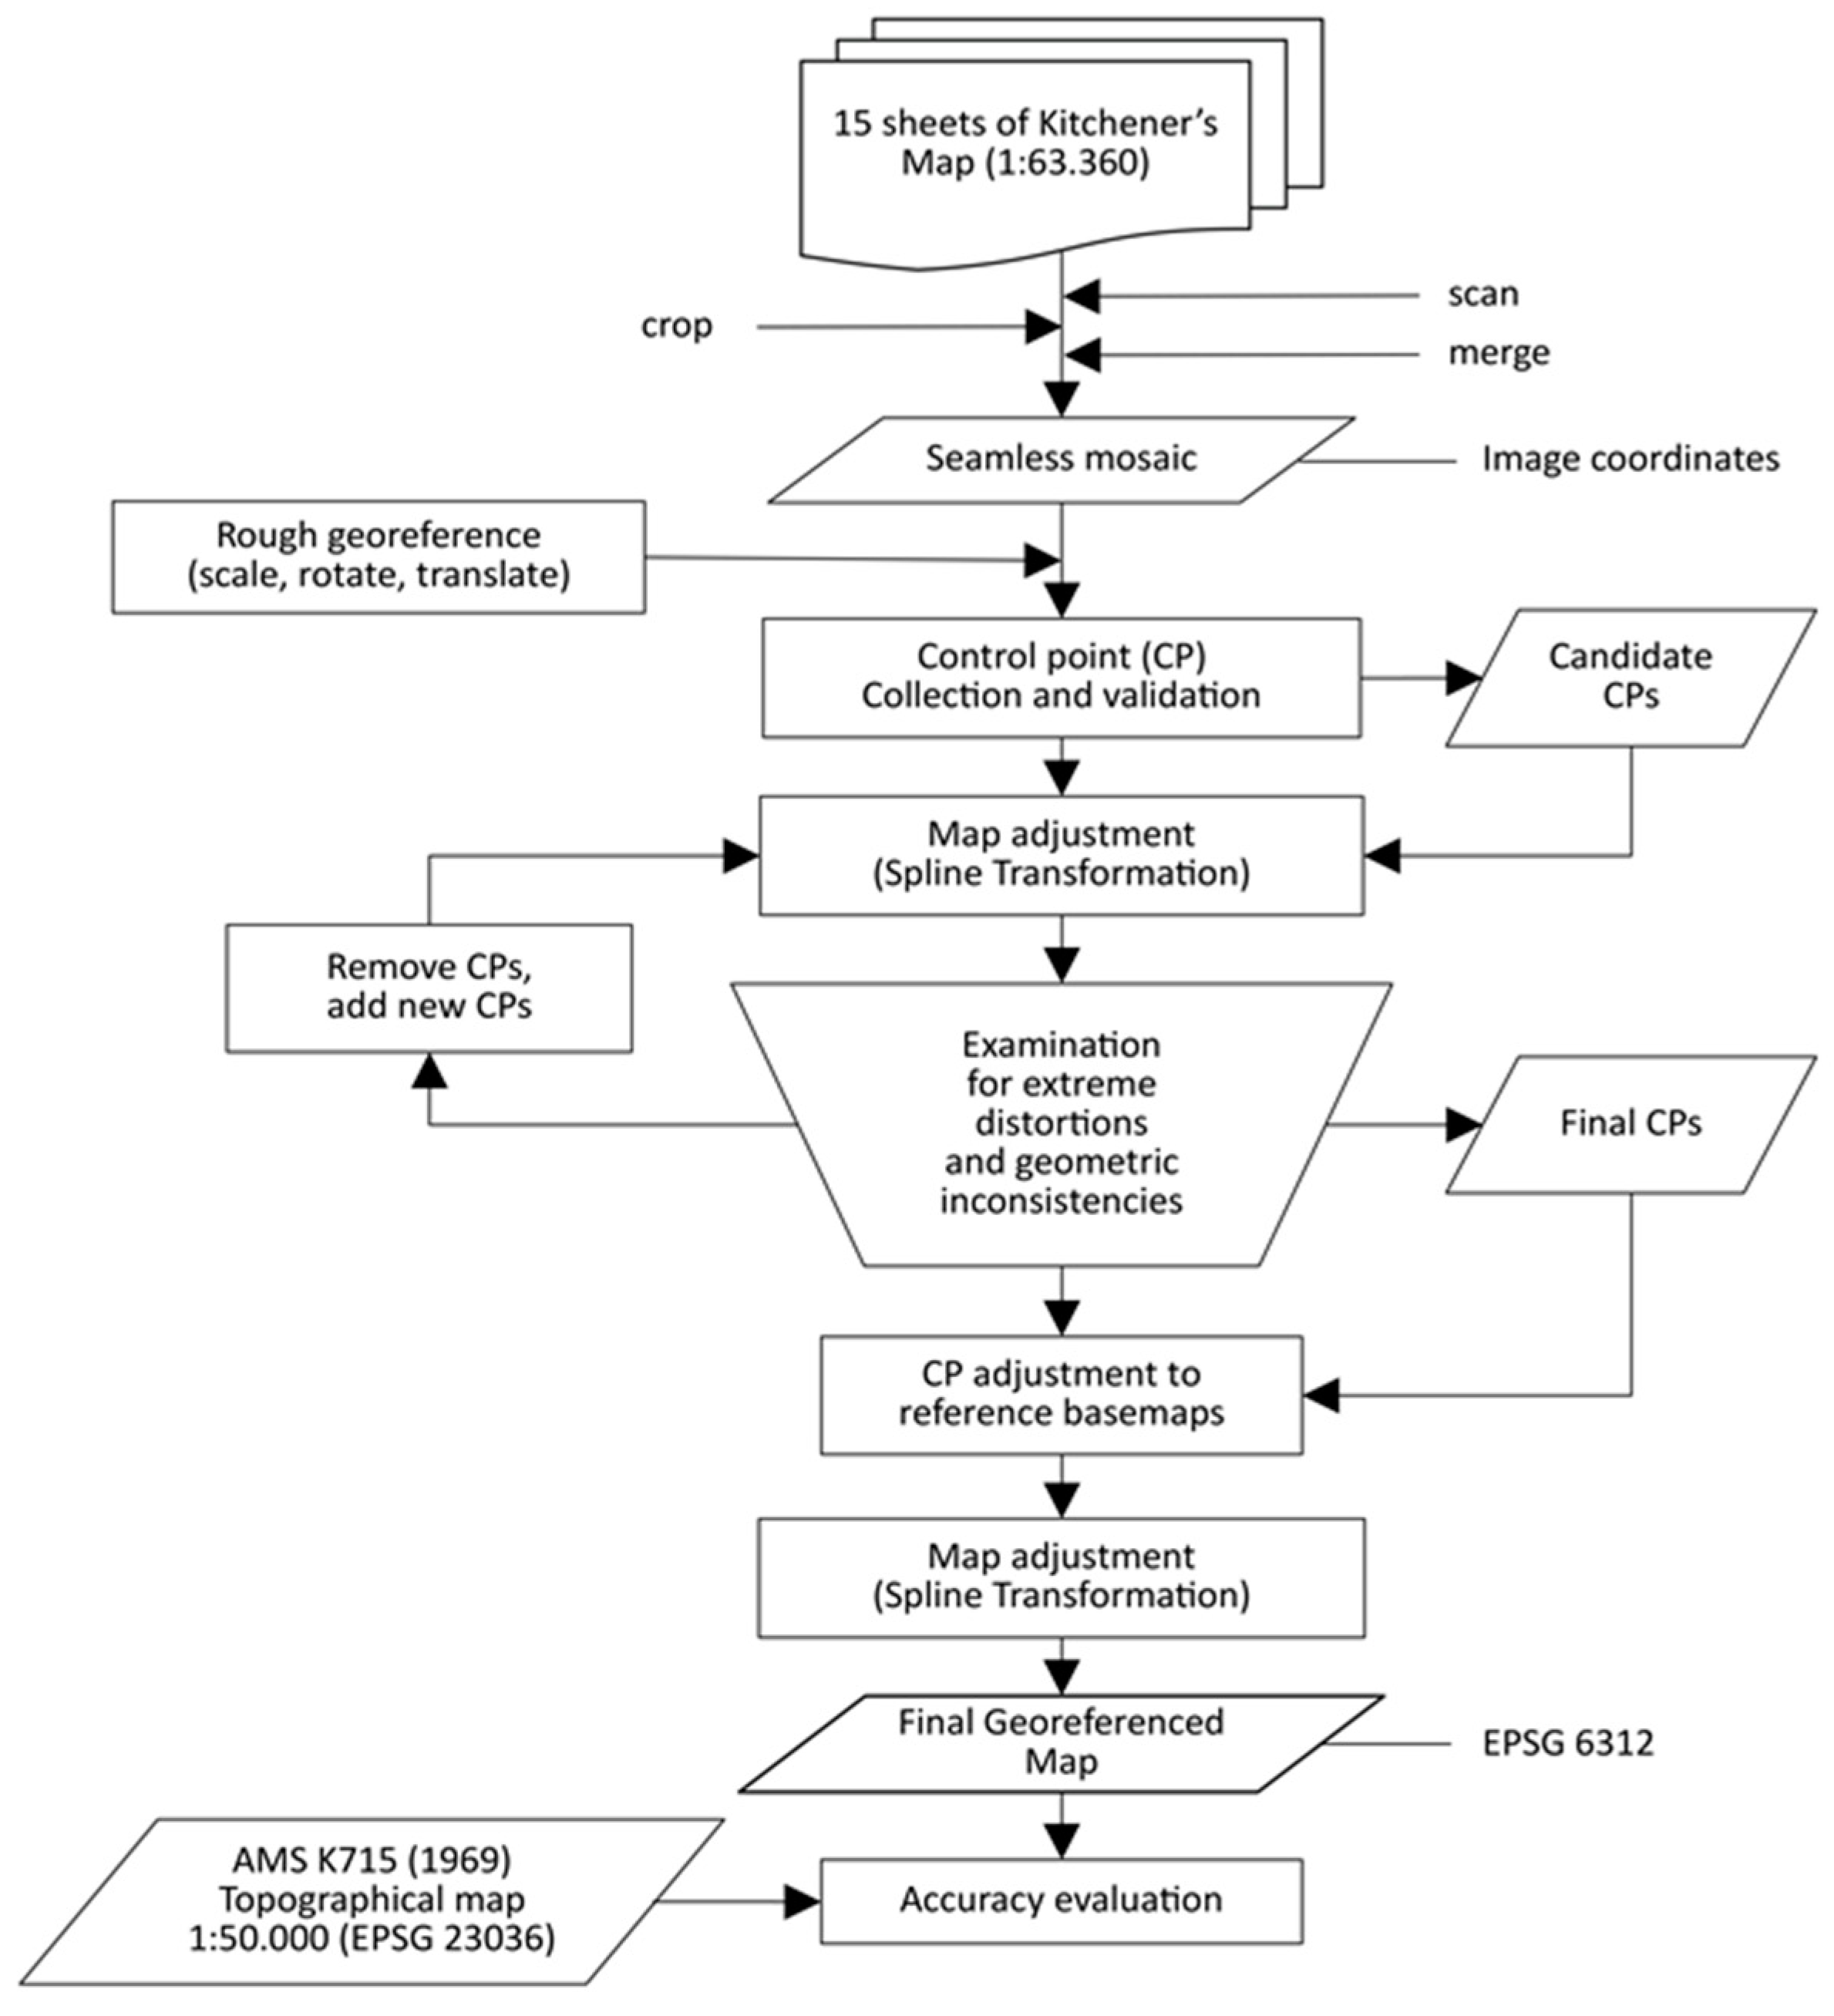
3. Methodology
- Merging and georeferencing of the 15 sheets of the K-map. The result of this phase was the creation of a georeferenced mosaic basemap, which was then used in all subsequent phases;
- Interpretation of the geographic content of the K-map and creation of the geodatabase. In this phase, the historical geographic content of the map was identified and digitized in a GIS environment. This phase also included the digitization of all place names on the map;
- Design and creation of the digital map and associated Web application. This step involved the creation and implementation of the interactive Web application that used and presented all of the information generated in the previous phases.
3.1. Mosaicking and Georeferencing of the K-Map
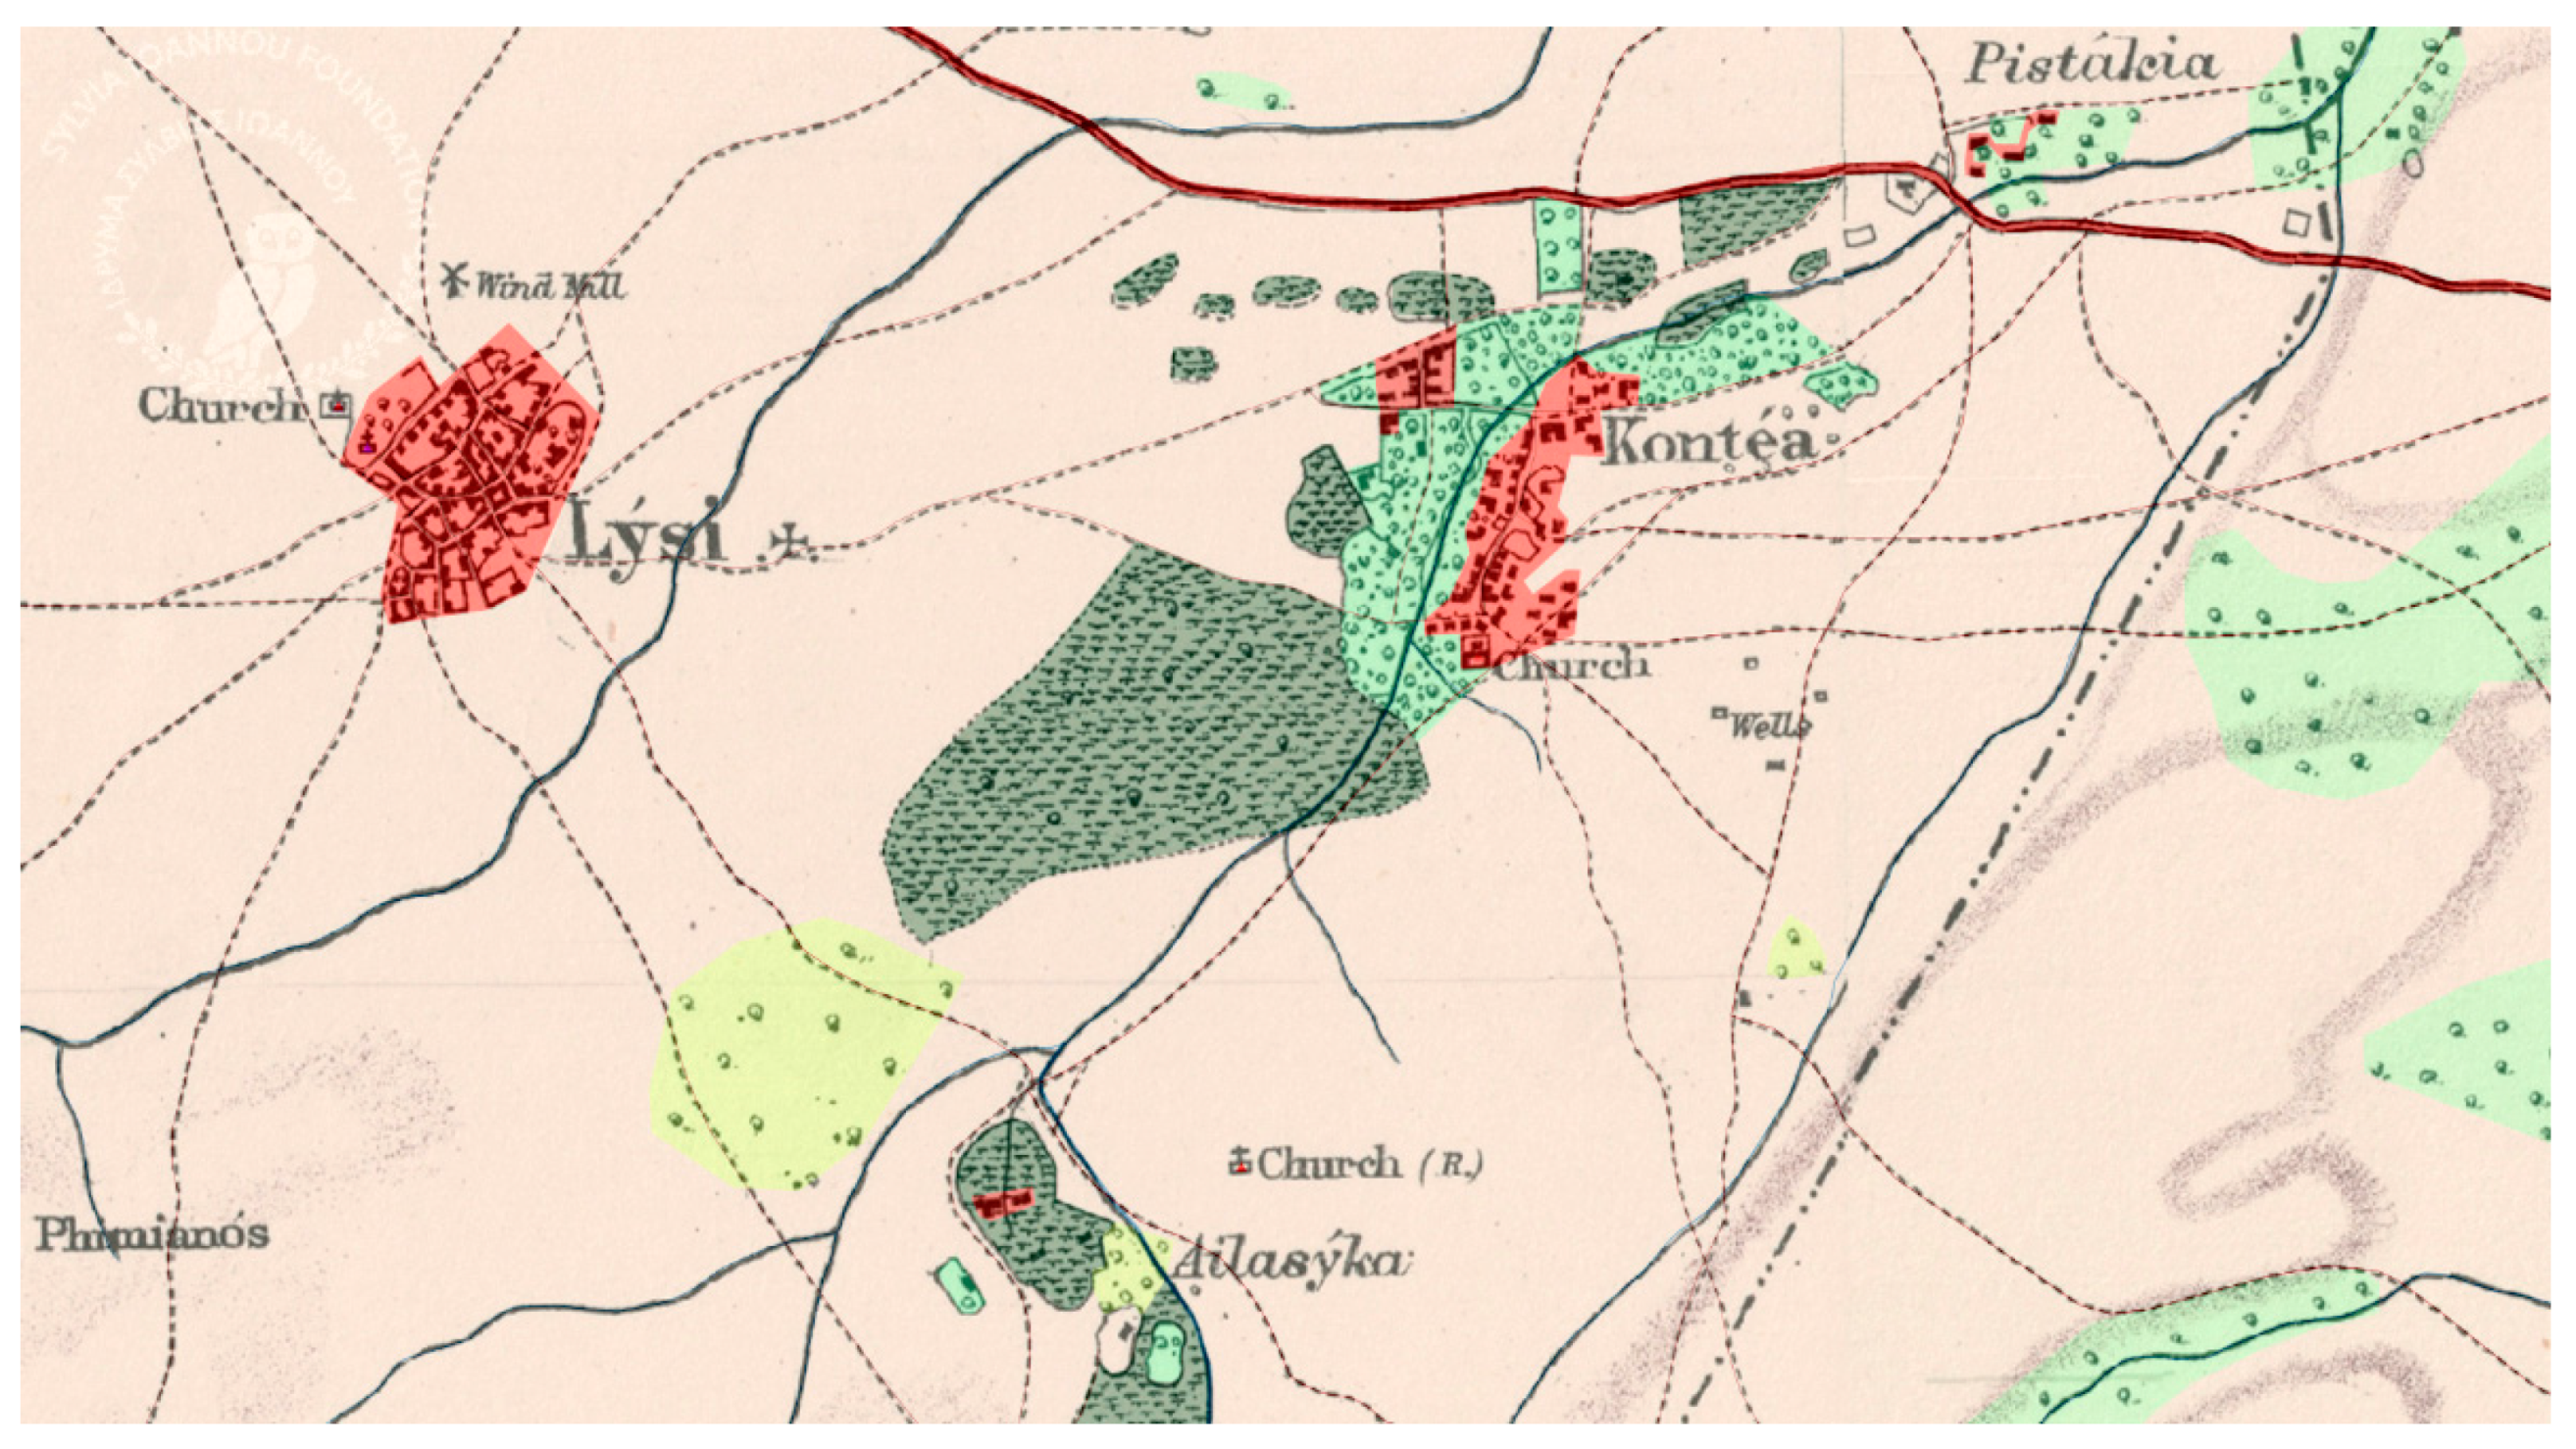
3.2. Interpretation and Classification of the Geospatial Content of the K-Map
3.3. Geodatabase Creation
3.3.1. Raster Data
3.3.2. Vector Data
- Administrative divisions:
- -
- District and sub-district boundaries (linear geometry);
- -
- District polygons;
- -
- Sub-district polygons;
- Annotations not associated with any geographic feature depicted in the map:
- -
- Curved or tilted text (linear geometry);
- -
- Horizontally placed text (point geometry);
- Points of interest:
- -
- Settlements (towns, villages, small villages, and chiftliks) (point geometry);
- -
- All other types of points of interest (point geometry), classified into 35 classes;
- Water bodies/hydrographic network:
- -
- Rivers, streams, and canals, classified into five classes;
- -
- Lakes;
- -
- Coastlines;
- Land cover:
- -
- Polygons with different types of land cover, classified into 19 classes;
- Technical infrastructure:
- -
- Road networks (linear geometry), classified in four classes;
- -
- Telegraph lines.
3.3.3. Map Annotation
3.3.4. Database Automation
3.4. Dissemination through the Web
4. Results
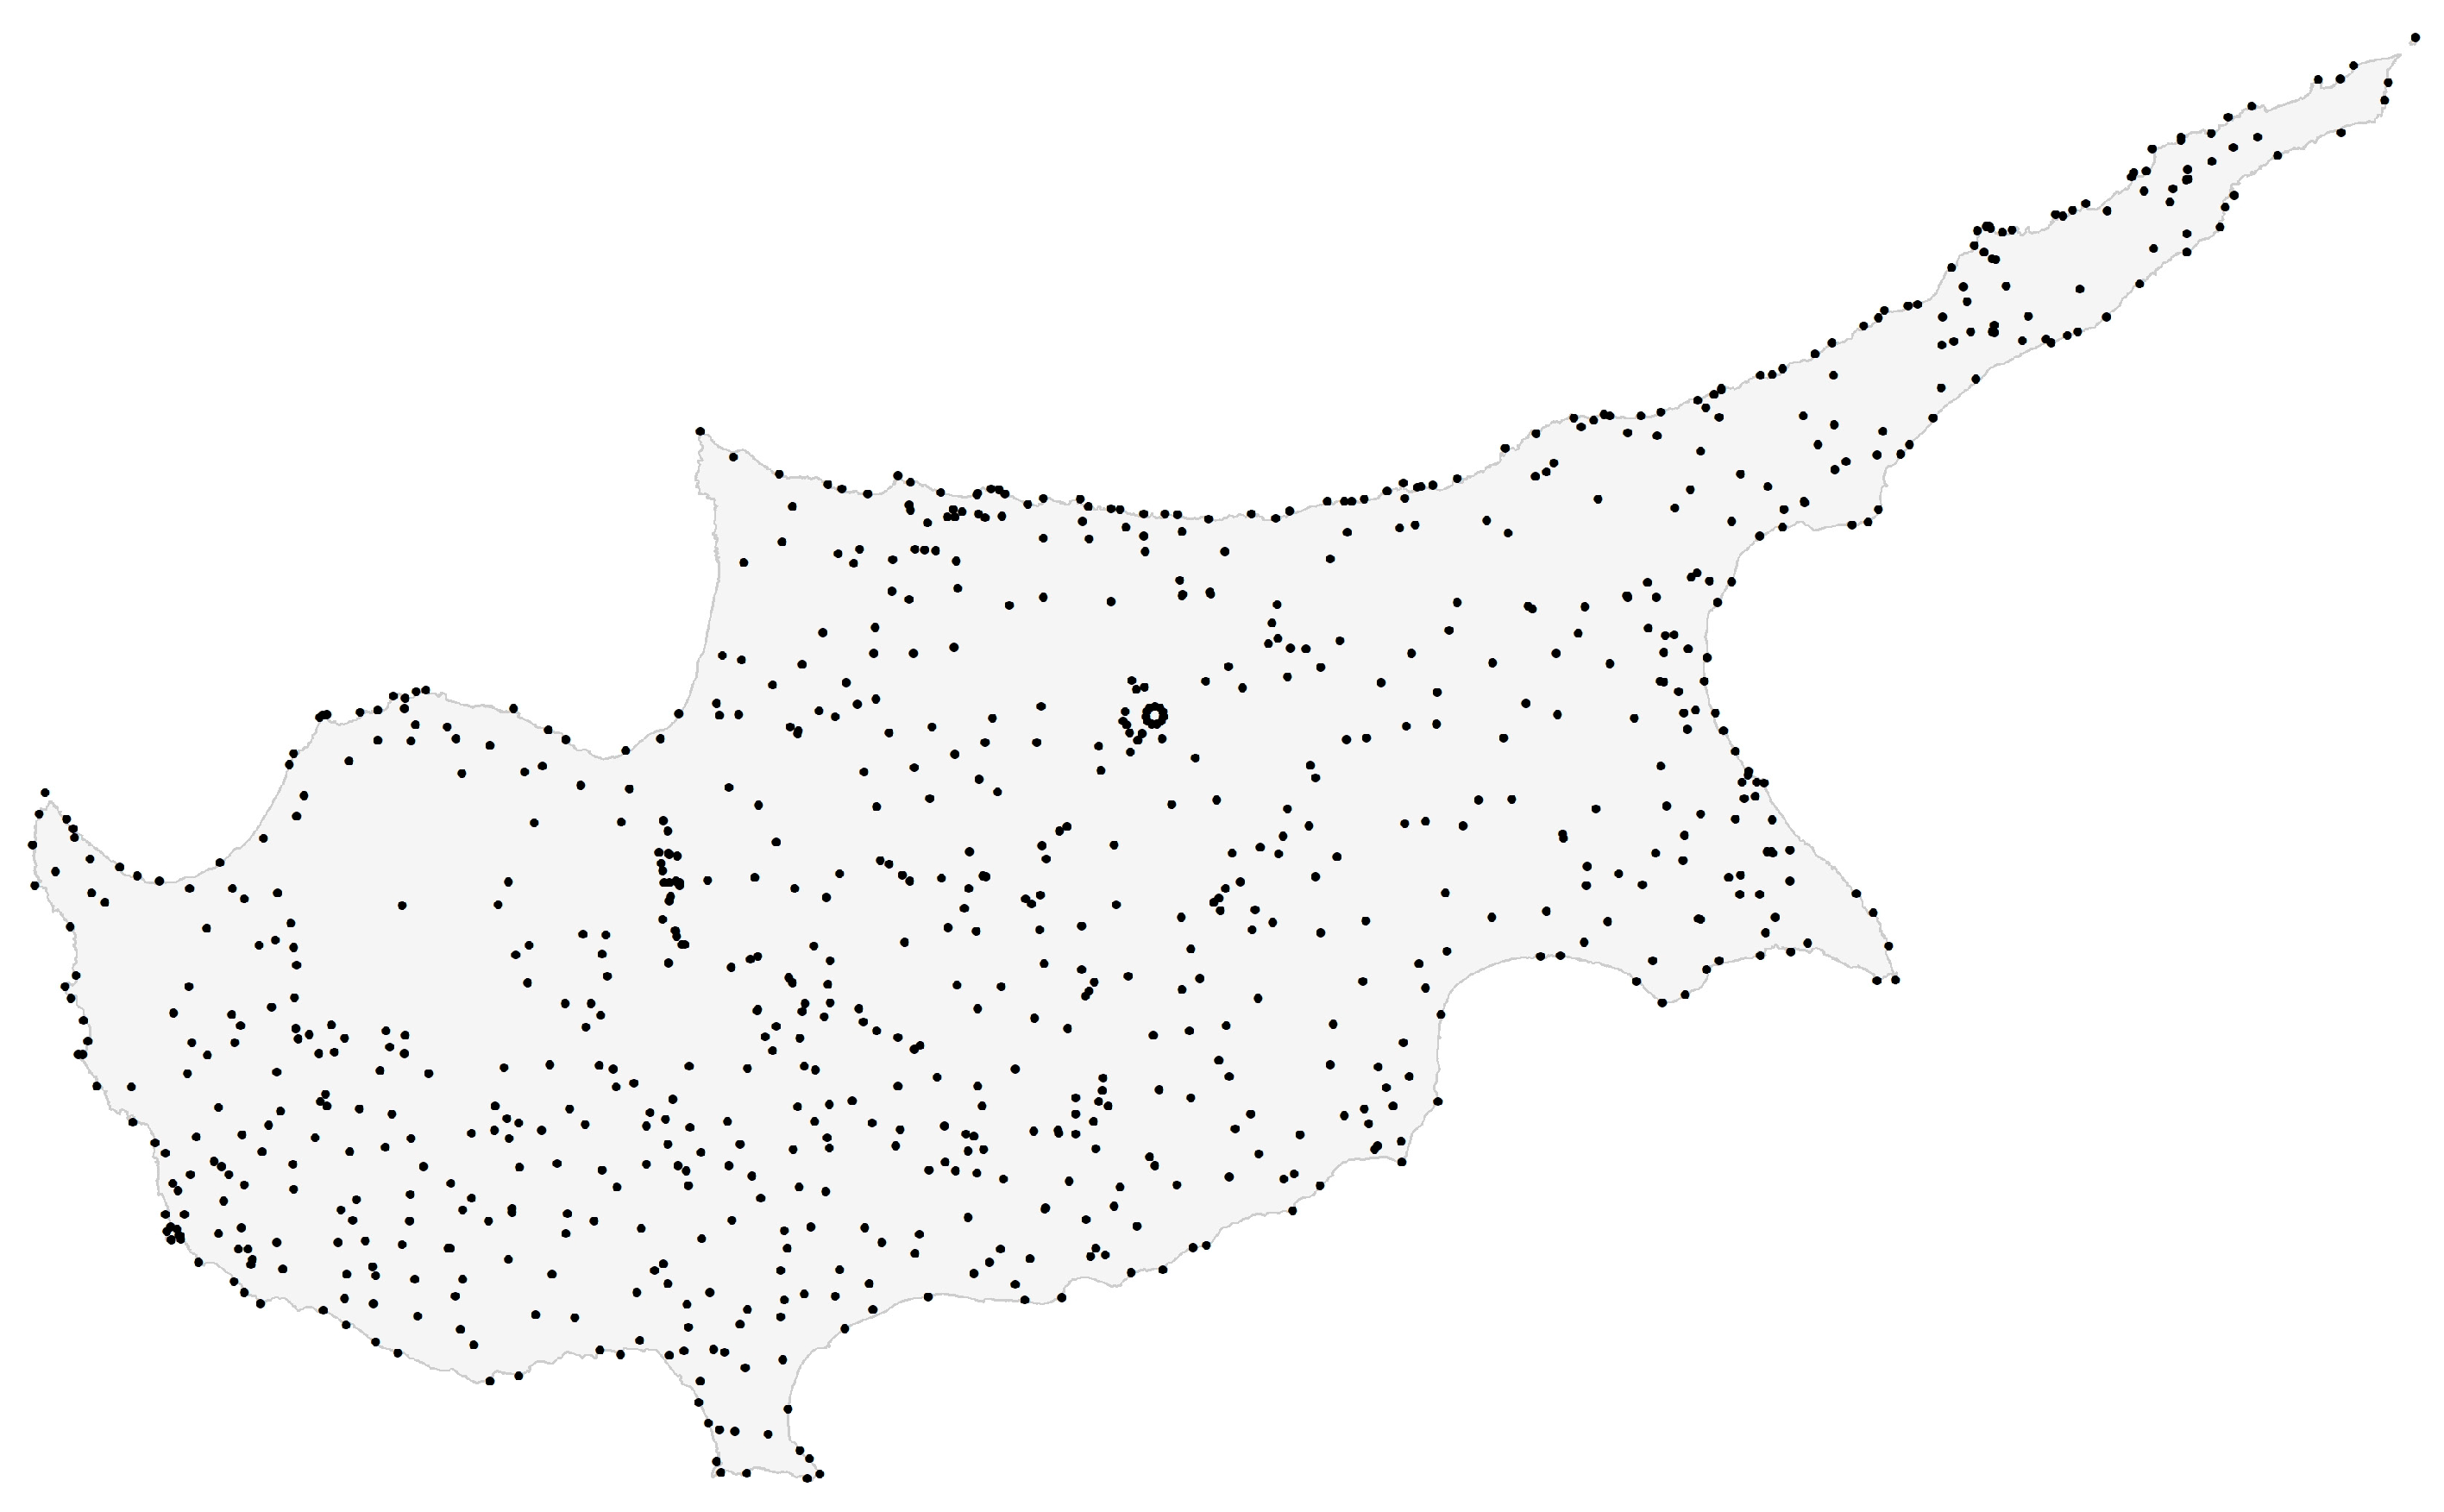
4.1. Assessing the Accuracy of the Georeferenced K-Map
4.2. The Geospatial Content of the K-Map
4.2.1. Settlements
4.2.2. Land Cover
4.2.3. Road Network/Hydrographic Network
4.2.4. Telegraph
4.2.5. Landmarks
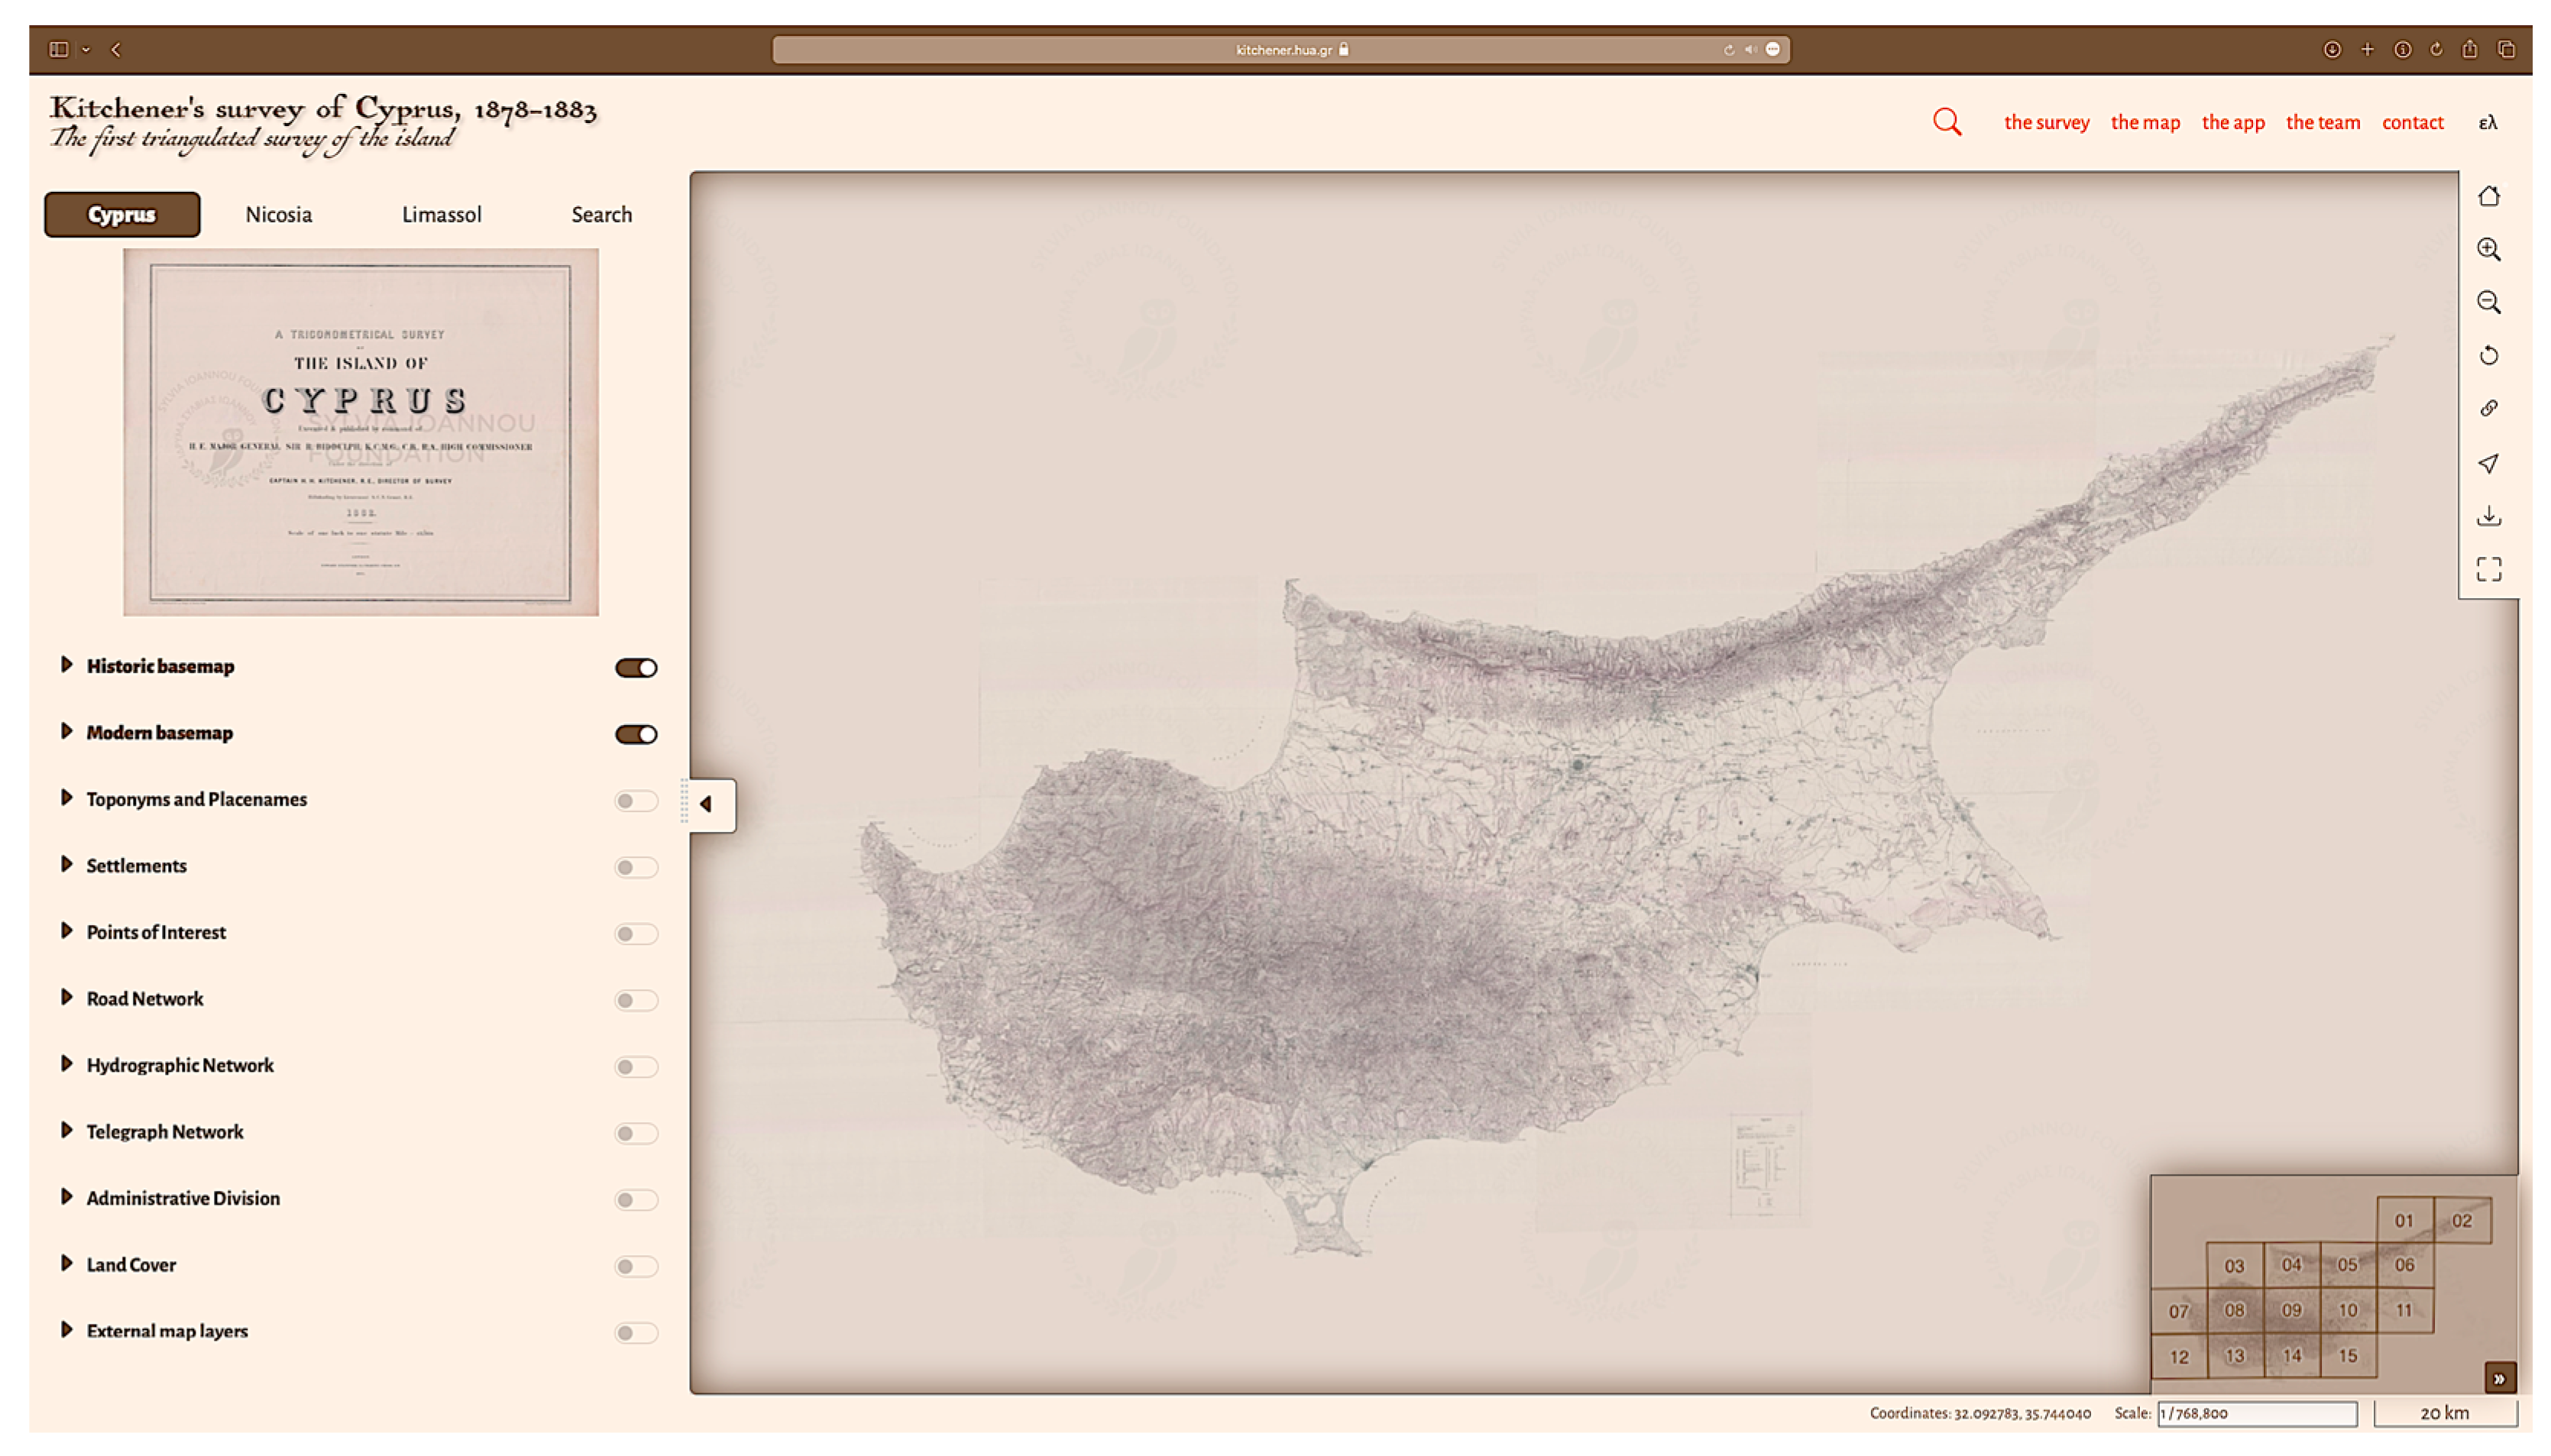
4.3. The Web Application
- The main map, consisting of the basemaps—i.e., the georeferenced raster K-map as tiles (Slippy map) and a set of modern basemaps (OpenStreetMap, Stamen, etc.)—and the vectorized thematic layers presented as a single WMS overlay;
- Tools to enable/disable thematic and basemap layers;
- Navigation tools (zooming and panning the map);
- Tools for identifying the properties of individual map features in a pop-up window;
- Tools for searching for names found in the original map;
- Informative text about the map itself, the topographic survey, the Web application, and the research project.
5. Discussion
6. Conclusions
Author Contributions
Funding
Data Availability Statement
Acknowledgments
Conflicts of Interest
References
- Rumsey, D.; Williams, M. Past Time, Past Place: GIS for History; Knowles, A.K., Ed.; ESRI Press: Redlands, CA, USA, 2002. [Google Scholar]
- Edney, M. Cartography’s “Scientific Reformation” and the Study of Topographical Mapping in the Modern Era. In History of Cartography; Liebenberg, E., Demhardt, I.J., Eds.; Springer: Berlin/Heidelberg, Germany, 2012; pp. 287–303. [Google Scholar] [CrossRef]
- Monmonier, M. The History of Cartography, Volume 6: Cartography in the Twentieth Century; Monmonier, M., Ed.; University of Chicago Press: Chicago, IL, USA, 2015. [Google Scholar]
- Turnbull, D. Cartography and Science in Early Modern Europe: Mapping the Construction of Knowledge Spaces. Imago Mundi 1996, 48, 5–24. [Google Scholar] [CrossRef]
- Kaim, D.; Kozak, J.; Kolecka, N.; Ziółkowska, E.; Ostafin, K.; Ostapowicz, K.; Gimmi, U.; Munteanu, C.; Radeloff, V.C. Broad Scale Forest Cover Reconstruction from Historical Topographic Maps. Appl. Geogr. 2016, 67, 39–48. [Google Scholar] [CrossRef]
- Murrieta-Flores, P.; Donaldson, C.; Gregory, I. GIS and Literary History: Advancing Digital Humanities Research through the Spatial Analysis of Historical Travel Writing and Topographical Literature. Digit. Humanit. Q. 2017, 11. Available online: http://www.digitalhumanities.org/dhq/vol/11/1/000283/000283.html (accessed on 10 October 2022).
- Sweeny, R.C.H. Placing History: How Maps, Spatial Data and GIS Are Changing Historical Scholarship. Can. Geogr. / Le Géographe Can. 2010, 54, 129–130. [Google Scholar] [CrossRef]
- Roberts, L.; Thevenin, T.; Hallam, J.; Beveridge, A.; Mostern, R.; Southall, H.; Cunningham, N.; Schwartz, R.; Meeks, E. Toward Spatial Humanities; Gregory, I., Geddes, A., Eds.; Indiana University Press: Bloomington, IN, USA, 2014. [Google Scholar]
- Dear, M.; Ketchum, J.; Luria, S.; Richardson, D. GeoHumanities: Art, History, Text at the Edge of Place; Routledge: London, UK, 2011. [Google Scholar] [CrossRef]
- Vuorela, N.; Alho, P.; Kalliola, R. Systematic Assessment of Maps as Source Information in Landscape-Change Research. Landsc. Res. 2002, 27, 141–166. [Google Scholar] [CrossRef]
- Harvey, J.T. Locating the Eureka Stockade: Use of a Geographical Information System (GIS) in a Historiographical Research Context. Comput. Humanit. 2003, 37, 229–234. [Google Scholar] [CrossRef]
- Levin, N. The Palestine Exploration Fund Map (1871–1877) of the Holy Land as a Tool for Analysing Landscape Changes: The Coastal Dunes of Israel as a Case Study. Cartogr. J. 2006, 43, 45–67. [Google Scholar] [CrossRef]
- Fensham, R.J. Leichhardt’s Maps: 100 Years of Change in Vegetation Structure in Inland Queensland. J. Biogeogr. 2008, 35, 141–156. [Google Scholar] [CrossRef]
- Levin, N.; Kark, R.; Galilee, E. Maps and the Settlement of Southern Palestine, 1799–1948: An Historical/GIS Analysis. J. Hist. Geogr. 2010, 36, 1–18. [Google Scholar] [CrossRef]
- Schaffer, G.; Levin, N. Mapping Human Induced Landscape Changes in Israel Between the End of the 19Th Century and the Beginning of the 21Th Century. J. Landsc. Ecol. 2014, 7, 110–145. [Google Scholar] [CrossRef] [Green Version]
- Schaffer, G.; Peer, M.; Levin, N. Quantifying the Completeness of and Correspondence between Two Historical Maps: A Case Study from Nineteenth-Century Palestine. Cartogr. Geogr. Inf. Sci. 2016, 43, 154–175. [Google Scholar] [CrossRef]
- Fuchs, R.; Verburg, P.H.; Clevers, J.G.P.W.; Herold, M. The Potential of Old Maps and Encyclopaedias for Reconstructing Historic European Land Cover/Use Change. Appl. Geogr. 2015, 59, 43–55. [Google Scholar] [CrossRef] [Green Version]
- Skaloš, J.; Weber, M.; Lipský, Z.; Trpáková, I.; Šantrůčková, M.; Uhlířová, L.; Kukla, P. Using Old Military Survey Maps and Orthophotograph Maps to Analyse Long-Term Land Cover Changes—Case Study (Czech Republic). Appl. Geogr. 2011, 31, 426–438. [Google Scholar] [CrossRef]
- Zohar, M. A Land without People? The GIScience Approach to Estimating the Population of Ottoman Palestine towards the End of the 19th-Century. Appl. Geogr. 2022, 141, 102672. [Google Scholar] [CrossRef]
- Zohar, M. Follow the Road: Historical GIS for Evaluating the Development of Routes in the Negev Region during the Twentieth Century. Cartogr. Geogr. Inf. Sci. 2019, 46, 532–546. [Google Scholar] [CrossRef]
- Southall, H. Rebuilding the Great Britain Historical GIS, Part 1: Building an Indefinitely Scalable Statistical Database. Hist. Methods: A J. Quant. Interdiscip. Hist. 2011, 44, 149–159. [Google Scholar] [CrossRef] [Green Version]
- Southall, H. Rebuilding the Great Britain Historical GIS, Part 2: A Geo-Spatial Ontology of Administrative Units. Hist. Methods: A J. Quant. Interdiscip. Hist. 2012, 45, 119–134. [Google Scholar] [CrossRef]
- Southall, H. Rebuilding the Great Britain Historical GIS, Part 3:Integrating Qualitative Content for a Sense of Place. Hist. Methods: A J. Quant. Interdiscip. Hist. 2014, 47, 31–44. [Google Scholar] [CrossRef]
- Given, M. Agriculture, Settlement and Landscape in Ottoman Cyprus. Levant 2000, 32, 209–230. [Google Scholar] [CrossRef] [Green Version]
- Papadopoulos, T. Social and Historical Data on Population (1570–1881); Cyprus Research Centre: Nicosia, Cyprus, 1965. [Google Scholar]
- Inalcık, H. A note on the population of cyprus. Percept. J. Int. Aff. 1997, 2. [Google Scholar]
- Hill, G. A History of Cyprus. Volume 4: The Ottoman Province. The British Colony, 1571-1948; Cambridge University Press: Cambridge, UK, 1952. [Google Scholar]
- Harrop, J.R.G. Cyprus survey centenary, 1878–1978. Surv. Rev. 1979, 25, 86–88. [Google Scholar] [CrossRef]
- Conder, C.R.; Kitchener, H.H. The Survey of Western Palestine 1882-1888; Committee of the Palestine Exploration Fund: London, UK, 1881; Volume 1. [Google Scholar]
- Navari, L. Maps of Cyprus, From the Collection of the Bank of Cyprus Cultural Foundation; Bank of Cyprus Cultural Foundation: Nicosia, Cyprus, 2003. [Google Scholar]
- Stylianou, A.; Stylianou, J. The History of the Cartography of Cyprus; Cyprus Research Centre: Nicosia, Cyprus, 1980. [Google Scholar]
- Baynton-Williams, A. Cyprus: The Book of Maps. Annotated Catalogue of the PrintedMaps of Cyprus, Volume 1: 15th-16th Centuries; Scutari, A., Ed.; AdVenture SA: Athens, Greece, 2016. [Google Scholar]
- Baynton-Williams, A. Cyprus: The Book of Maps. Annotated Catalogue of the Printed Maps of Cyprus, Volume 2: 17th Century, Scutari, A., Ed.; AdVenture SA: Athens, Greece, 2020. [Google Scholar]
- Shirley, R. Kitchener’s Survey of Cyprus 1878-1883: The Full Triangulated Survey and Mapping of The Island; The Bank of Cyprus Cultural Foundation: Nicosia, Cyprus, 2001. [Google Scholar]
- Jeffery, G. A Description of the Historic Monuments of Cyprus: Studies in the Archaeology and Architecture of the Island; Archer, W.J., Ed.; government printer at the G.P.O.: Nicosia, Cyprus, 1918. [Google Scholar]
- Gunnis, R. Historic Cyprus; a Guide to Its Towns and Villages, Monasteries and Castles; The Orage Press: Mitcham, England, 2014. [Google Scholar]
- Kitchener, H. Notes from Cyprus. Blackwood’s Edinb. Mag. 1879, 126, 150–157. [Google Scholar]
- Wiki, O. Slippy Map Tilenames. Available online: https://wiki.openstreetmap.org/wiki/Slippy_map_tilenames (accessed on 30 August 2022).
- Christodoulou, M.; Konstantinidis, K. A Complete Gazetteer of Cyprus; Cyprus Permanent Committee for the Standardization of Geographical Names: Nicosia, Cyprus, 1987. [Google Scholar]
- Cyprus Permanent Committee for the Standardization of Geographical Names. Gazetteer of Sea Geographical Names of Cyprus; Kostas Epifaniou Publishers: Nicosia, Cyprus, 2017. [Google Scholar]
- Berners-Lee, T. Linked Data–Design Issues. W3C 2006, No. 09/20. Available online: https://www.w3.org/DesignIssues/LinkedData.html (accessed on 12 October 2022).
- Holborn, T. What is 5 Star Linked Data? Available online: https://www.w3.org/community/webize/2014/01/17/what-is-5-star-linked-data/ (accessed on 22 October 2022).
- Wilkinson, M.D.; Dumontier, M.; Aalbersberg, I.J.; Appleton, G.; Axton, M.; Baak, A.; Blomberg, N.; Boiten, J.-W.; da Silva Santos, L.B.; Bourne, P.E. The FAIR Guiding Principles for Scientific Data Management and Stewardship. Sci. Data 2016, 3, 1–9. [Google Scholar] [CrossRef] [PubMed] [Green Version]
- Xiao, G.; Lanti, D.; Kontchakov, R.; Sarah, K.-E.; Güzel-Kalayci, E.; Ding, L.; Julien, C.; Cogrel, B.; Calvanese, D.; Botoeva, E. The Virtual Knowledge Graph System Ontop. In Proceedings of the International Semantic Web Conference (ISWC 2020); Athens, Greece, 2–6 November 2020, Lecture Notes in Computer Science; Springer: Berlin/Heidelberg, Germany, 2020; Volume 12507, pp. 259–277. [Google Scholar] [CrossRef]
- United States Army Map Service, Cartographer. Cyprus 1:50,000. [Washington, D.C.: Army Map Service, Army Corps of Engineers, to 1969 Washington: Printed by Army Map Service, Corps of Engineers, 1969], Map. Available online: https://www.loc.gov/item/2017588191/ (accessed on 10 October 2022).
- Schaffer, G.; Levin, N. Reconstructing Nineteenth Century Landscapes from Historical Maps—The Survey of Western Palestine as a Case Study. Landsc. Res. 2016, 41, 360–379. [Google Scholar] [CrossRef]
- Hadjikyriacou, A.; Papadias, E.; Vradis, C.; Chalkias, C. Combining Historical Maps and Censuses of Cyprus from the Sixteenth to the Twentieth Century: A Geospatial Approach. Proc. ICA 2021, 3, 7. [Google Scholar] [CrossRef]
- Plewe, B. The Nature of Uncertainty in Historical Geographic Information. Trans. GIS 2002, 6, 431–456. [Google Scholar] [CrossRef]
- Leyk, S.; Zimmermann, N.E. A Predictive Uncertainty Model for Field-Based Survey Maps Using Generalized Linear Models. In Geographic Information Science; Egenhofer, M.J., Freksa, C., Miller, H.J., Eds.; Springer: Berlin/Heidelberg, Germany, 2004; pp. 191–205. [Google Scholar]
- Lukas, M.C. Cartographic Reconstruction of Historical Environmental Change. Cartogr. Perspect. 2014, 78, 5–24. [Google Scholar] [CrossRef]
- Edney, M. Mapping an Empire: The Geographical Construction of British India, 1765–1843; University of Chicago Press: Chicago, IL, USA, 2009. [Google Scholar]
- Hopkins, D.; Morgan, P.; Roberts, J. The Application of GIS to the Reconstruction of the Slave-Plantation Economy of St. Croix, Danish West Indies. Hist. Geogr. 2011, 39, 85–104. [Google Scholar]
- Keates, J.S. Understanding Maps, 2.; Routledge: London, UK, 1996. [Google Scholar] [CrossRef]
- Smith, C.D. Cartographic Signs on European Maps and Their Explanation before 1700. Imago Mundi 1985, 37, 9–29. [Google Scholar] [CrossRef]


| Layer Name | Entities | Type | Length (km)/Area (km2) |
|---|---|---|---|
| Hydrographic networks | Line | 16,727 | |
| Road networks/coastlines | Line | 15,423/759 | |
| Land cover | Polygon | 9253 | |
| Points of interest | 3281 | Point | |
| Place names | 1080 | Point/line | |
| Settlements | 791 | Point | |
| Elevation points | 369 | Point | |
| Milestones | 25 | Point | |
| Telegraph networks | Line | 335 | |
| Subdistricts | 15 | Polygon | 9253 |
| Districts | 6 | Polygon | 9253 |
| Sheet | CPs | Validation CPs | RMSE |
|---|---|---|---|
| 1 | 22 | 2 | 73.62 |
| 2 | 63 | 20 | 65.18 |
| 3 | 22 | 3 | 116.79 |
| 4 | 75 | 18 | 70.14 |
| 5 | 85 | 28 | 60.89 |
| 6 | 73 | 36 | 74.52 |
| 7 | 32 | 6 | 93.79 |
| 8 | 62 | 26 | 87.03 |
| 9 | 102 | 42 | 91.07 |
| 10 | 62 | 25 | 63.93 |
| 11 | 54 | 33 | 28.45 |
| 12 | 22 | 4 | 38.95 |
| 13 | 87 | 40 | 66.48 |
| 14 | 98 | 45 | 47.85 |
| 15 | 32 | 12 | 73.35 |
| Total | 891 | 340 | 68.76 |
| Natural Vegetation | Cropland | Artificial Surfaces | Unclassified | Landforms | Water Bodies | ||
|---|---|---|---|---|---|---|---|
| District | Ammochostos | 5.69 | 1.27 | 0.19 | 14.08 | 0.04 | 0.14 |
| Keryneia | 4.61 | 0.28 | 0.04 | 2.02 | 0.01 | 0 | |
| Larnaka | 2.03 | 1.61 | 0.08 | 8.24 | 0.06 | 0.11 | |
| Lefkosia | 10.48 | 2 | 0.24 | 16.56 | 0.01 | 0.07 | |
| Lemesos | 7.3 | 2.08 | 0.09 | 5.08 | 0.24 | 0.27 | |
| Pafos | 5.81 | 0.93 | 0.09 | 8.16 | 0.1 | 0 | |
| Elevation zone (asl) | 0–400 | 19.74 | 5.12 | 0.6 | 46.54 | 0.35 | 0.59 |
| 400–800 | 10.87 | 2.03 | 0.07 | 6.49 | 0.11 | 0 | |
| 800+ | 5.3 | 1.01 | 0.03 | 1.12 | 0.01 | 0 |
| Ammochostos | Keryneia | Larnaka | Lefkosia | Lemesos | Pafos | Total | |
|---|---|---|---|---|---|---|---|
| Well | 127 | 19 | 145 | 884 | 20 | 17 | 1212 |
| Church | 164 | 45 | 80 | 176 | 157 | 120 | 742 |
| Ruin | 53 | 17 | 30 | 74 | 52 | 58 | 284 |
| Sheepfold | 16 | 12 | 16 | 71 | 53 | 100 | 268 |
| Water mill | 3 | 5 | 22 | 56 | 21 | 42 | 149 |
| Trig. station | 9 | 5 | 8 | 52 | 25 | 22 | 121 |
| Spring | 11 | 12 | 8 | 29 | 14 | 32 | 106 |
| Bridge | 7 | 5 | 51 | 20 | 10 | 93 | |
| Monastery | 8 | 8 | 7 | 20 | 10 | 14 | 67 |
| Kiln | 44 | 7 | 4 | 1 | 56 | ||
| Other | 6 | 5 | 6 | 11 | 11 | 6 | 45 |
| Mandra | 1 | 6 | 21 | 28 | |||
| Cemetery | 4 | 1 | 2 | 8 | 3 | 2 | 20 |
| Tank | 8 | 4 | 6 | 2 | 20 | ||
| Quarry | 2 | 9 | 3 | 14 | |||
| Cave | 7 | 2 | 2 | 11 | |||
| Tomb | 5 | 4 | 1 | 1 | 11 | ||
| Grave | 6 | 4 | 1 | 11 | |||
| Slag | 8 | 1 | 9 | ||||
| Mosque | 1 | 4 | 2 | 7 | |||
| Windmill | 5 | 2 | 7 |
Disclaimer/Publisher’s Note: The statements, opinions and data contained in all publications are solely those of the individual author(s) and contributor(s) and not of MDPI and/or the editor(s). MDPI and/or the editor(s) disclaim responsibility for any injury to people or property resulting from any ideas, methods, instructions or products referred to in the content. |
© 2023 by the authors. Licensee MDPI, Basel, Switzerland. This article is an open access article distributed under the terms and conditions of the Creative Commons Attribution (CC BY) license (https://creativecommons.org/licenses/by/4.0/).
Share and Cite
Chalkias, C.; Papadias, E.; Vradis, C.; Polykretis, C.; Kalogeropoulos, K.; Psarogiannis, A.; Chalkias, G. Developing and Disseminating a New Historical Geospatial Database from Kitchener’s 19th Century Map of Cyprus. ISPRS Int. J. Geo-Inf. 2023, 12, 74. https://doi.org/10.3390/ijgi12020074
Chalkias C, Papadias E, Vradis C, Polykretis C, Kalogeropoulos K, Psarogiannis A, Chalkias G. Developing and Disseminating a New Historical Geospatial Database from Kitchener’s 19th Century Map of Cyprus. ISPRS International Journal of Geo-Information. 2023; 12(2):74. https://doi.org/10.3390/ijgi12020074
Chicago/Turabian StyleChalkias, Christos, Evangelos Papadias, Christoforos Vradis, Christos Polykretis, Kleomenis Kalogeropoulos, Athanasios Psarogiannis, and Georgios Chalkias. 2023. "Developing and Disseminating a New Historical Geospatial Database from Kitchener’s 19th Century Map of Cyprus" ISPRS International Journal of Geo-Information 12, no. 2: 74. https://doi.org/10.3390/ijgi12020074