

Potential Loss of Ecosystem Service Value Due to Vessel Activity Expansion in Indonesian Marine Protected Areas
 , , , , and
Abstract
:1. Introduction
2. Materials and Methods
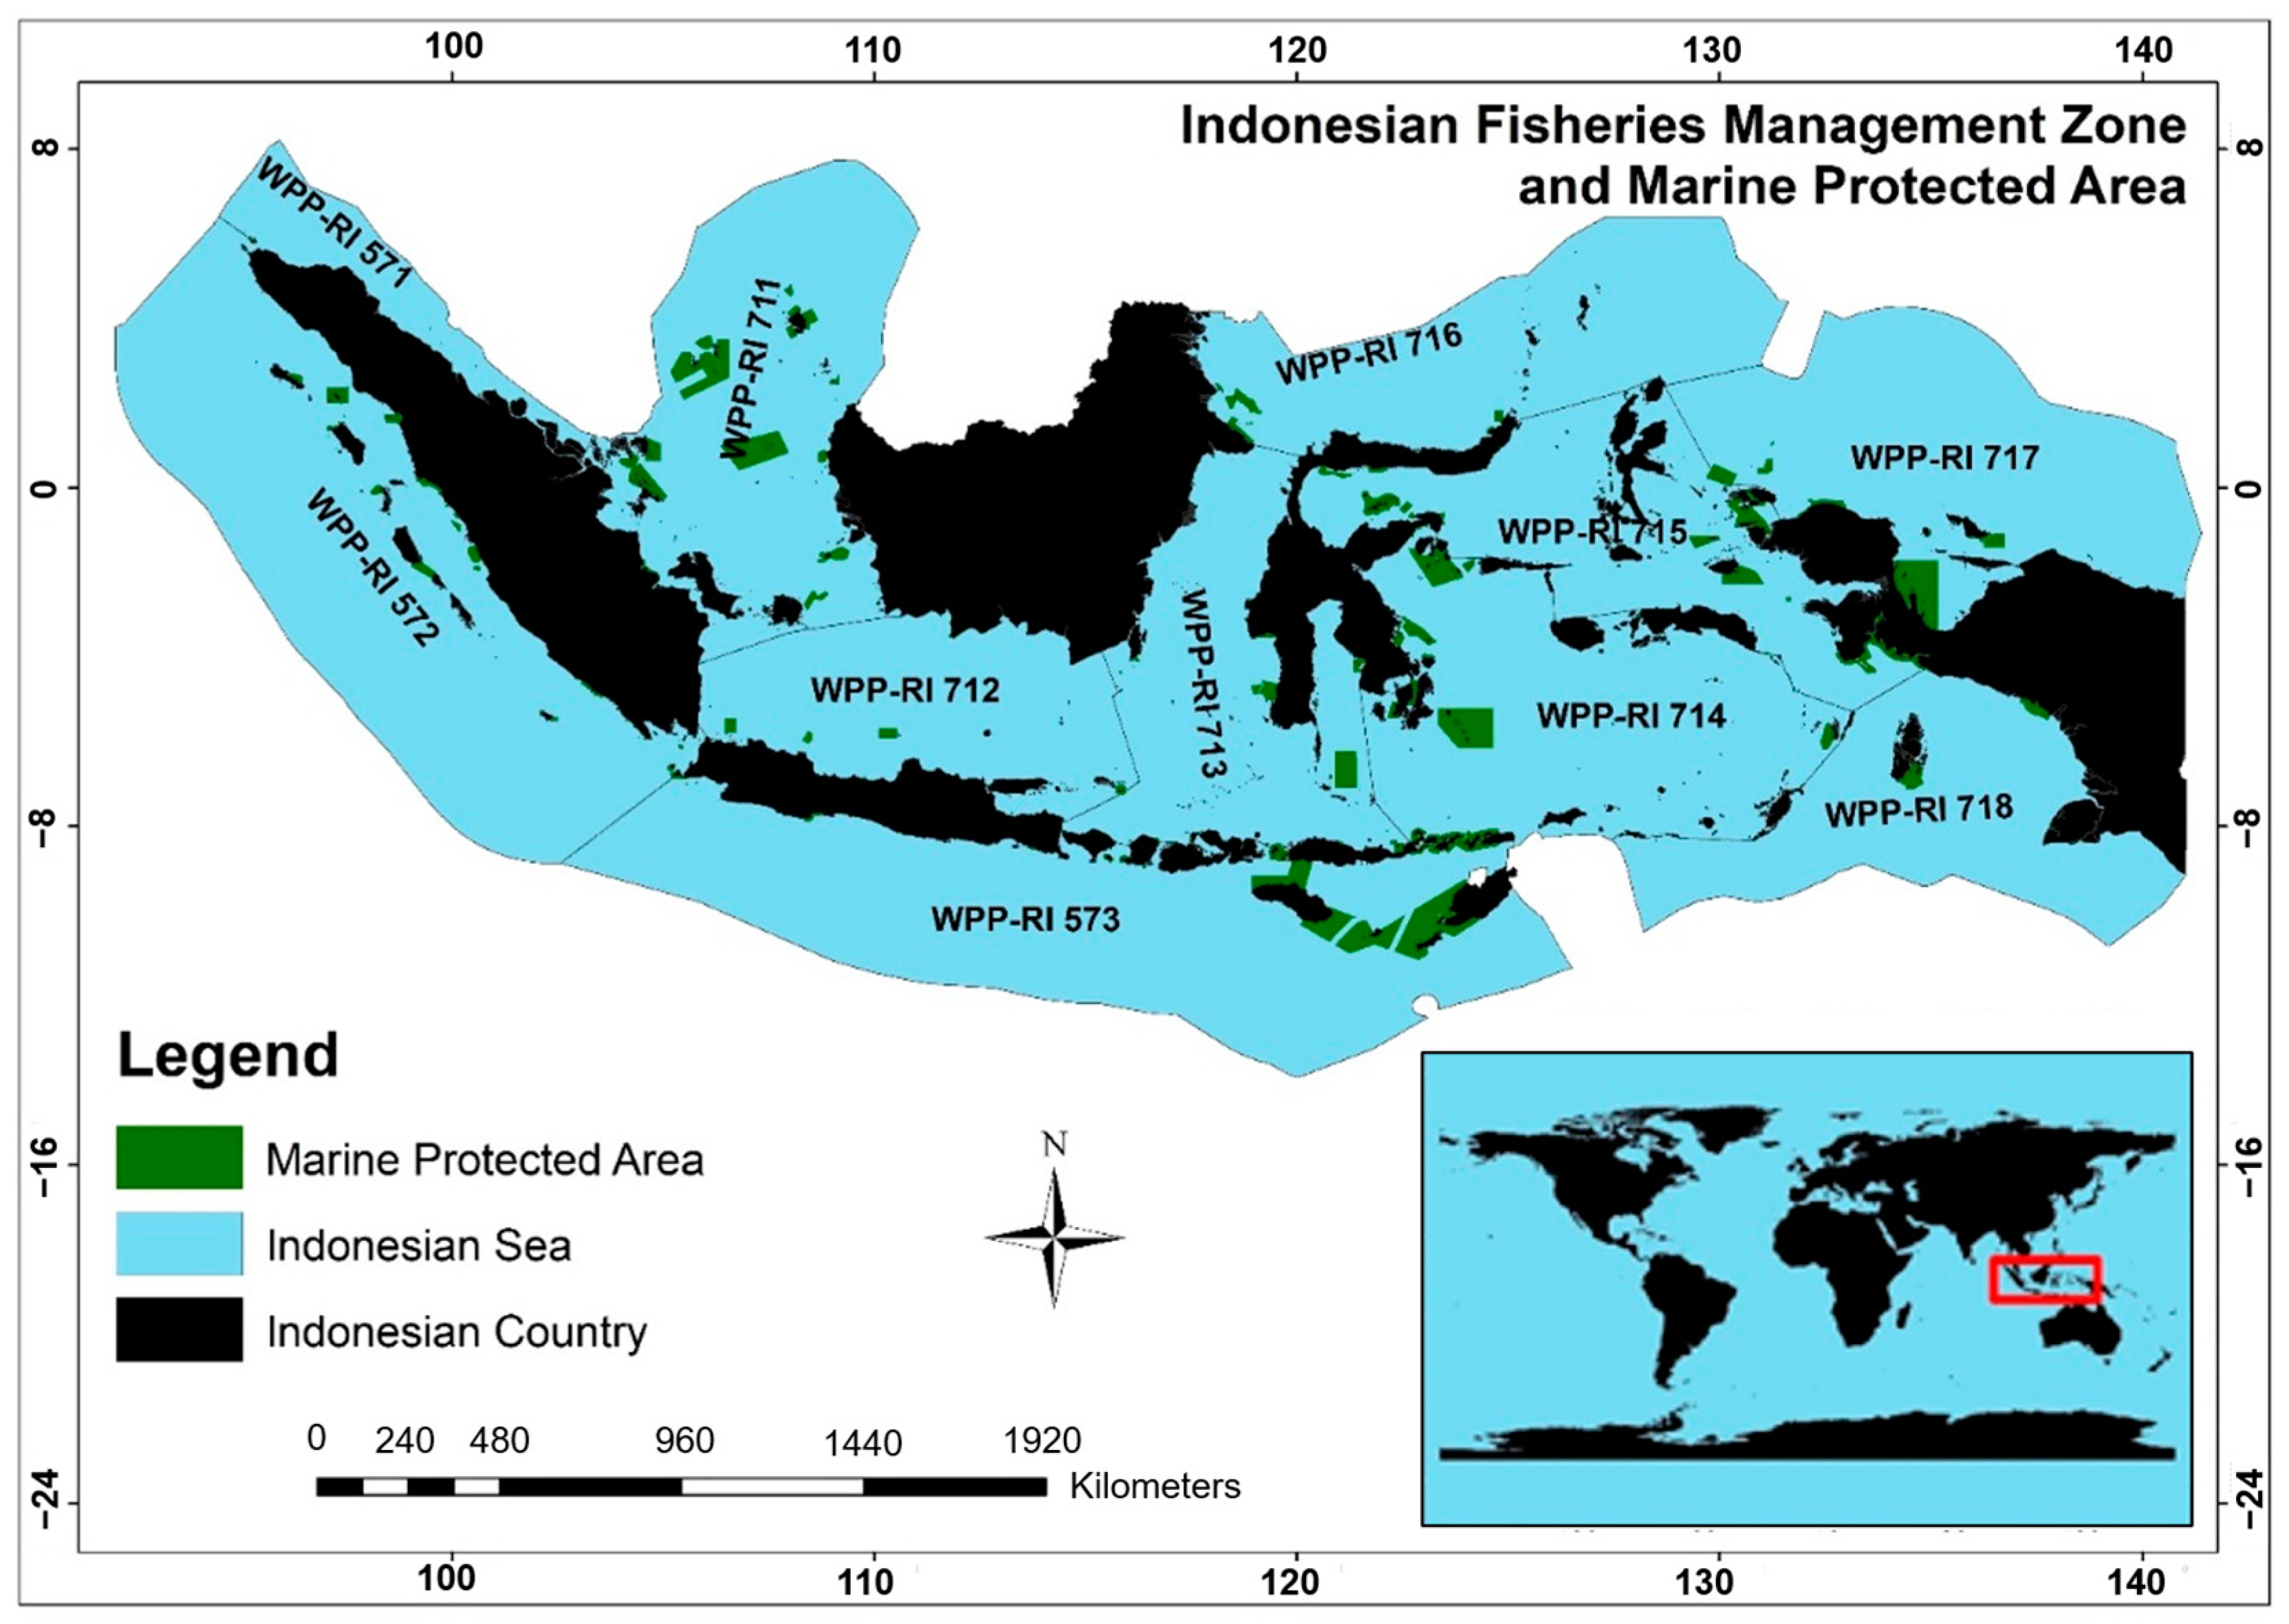
2.1. Study Area
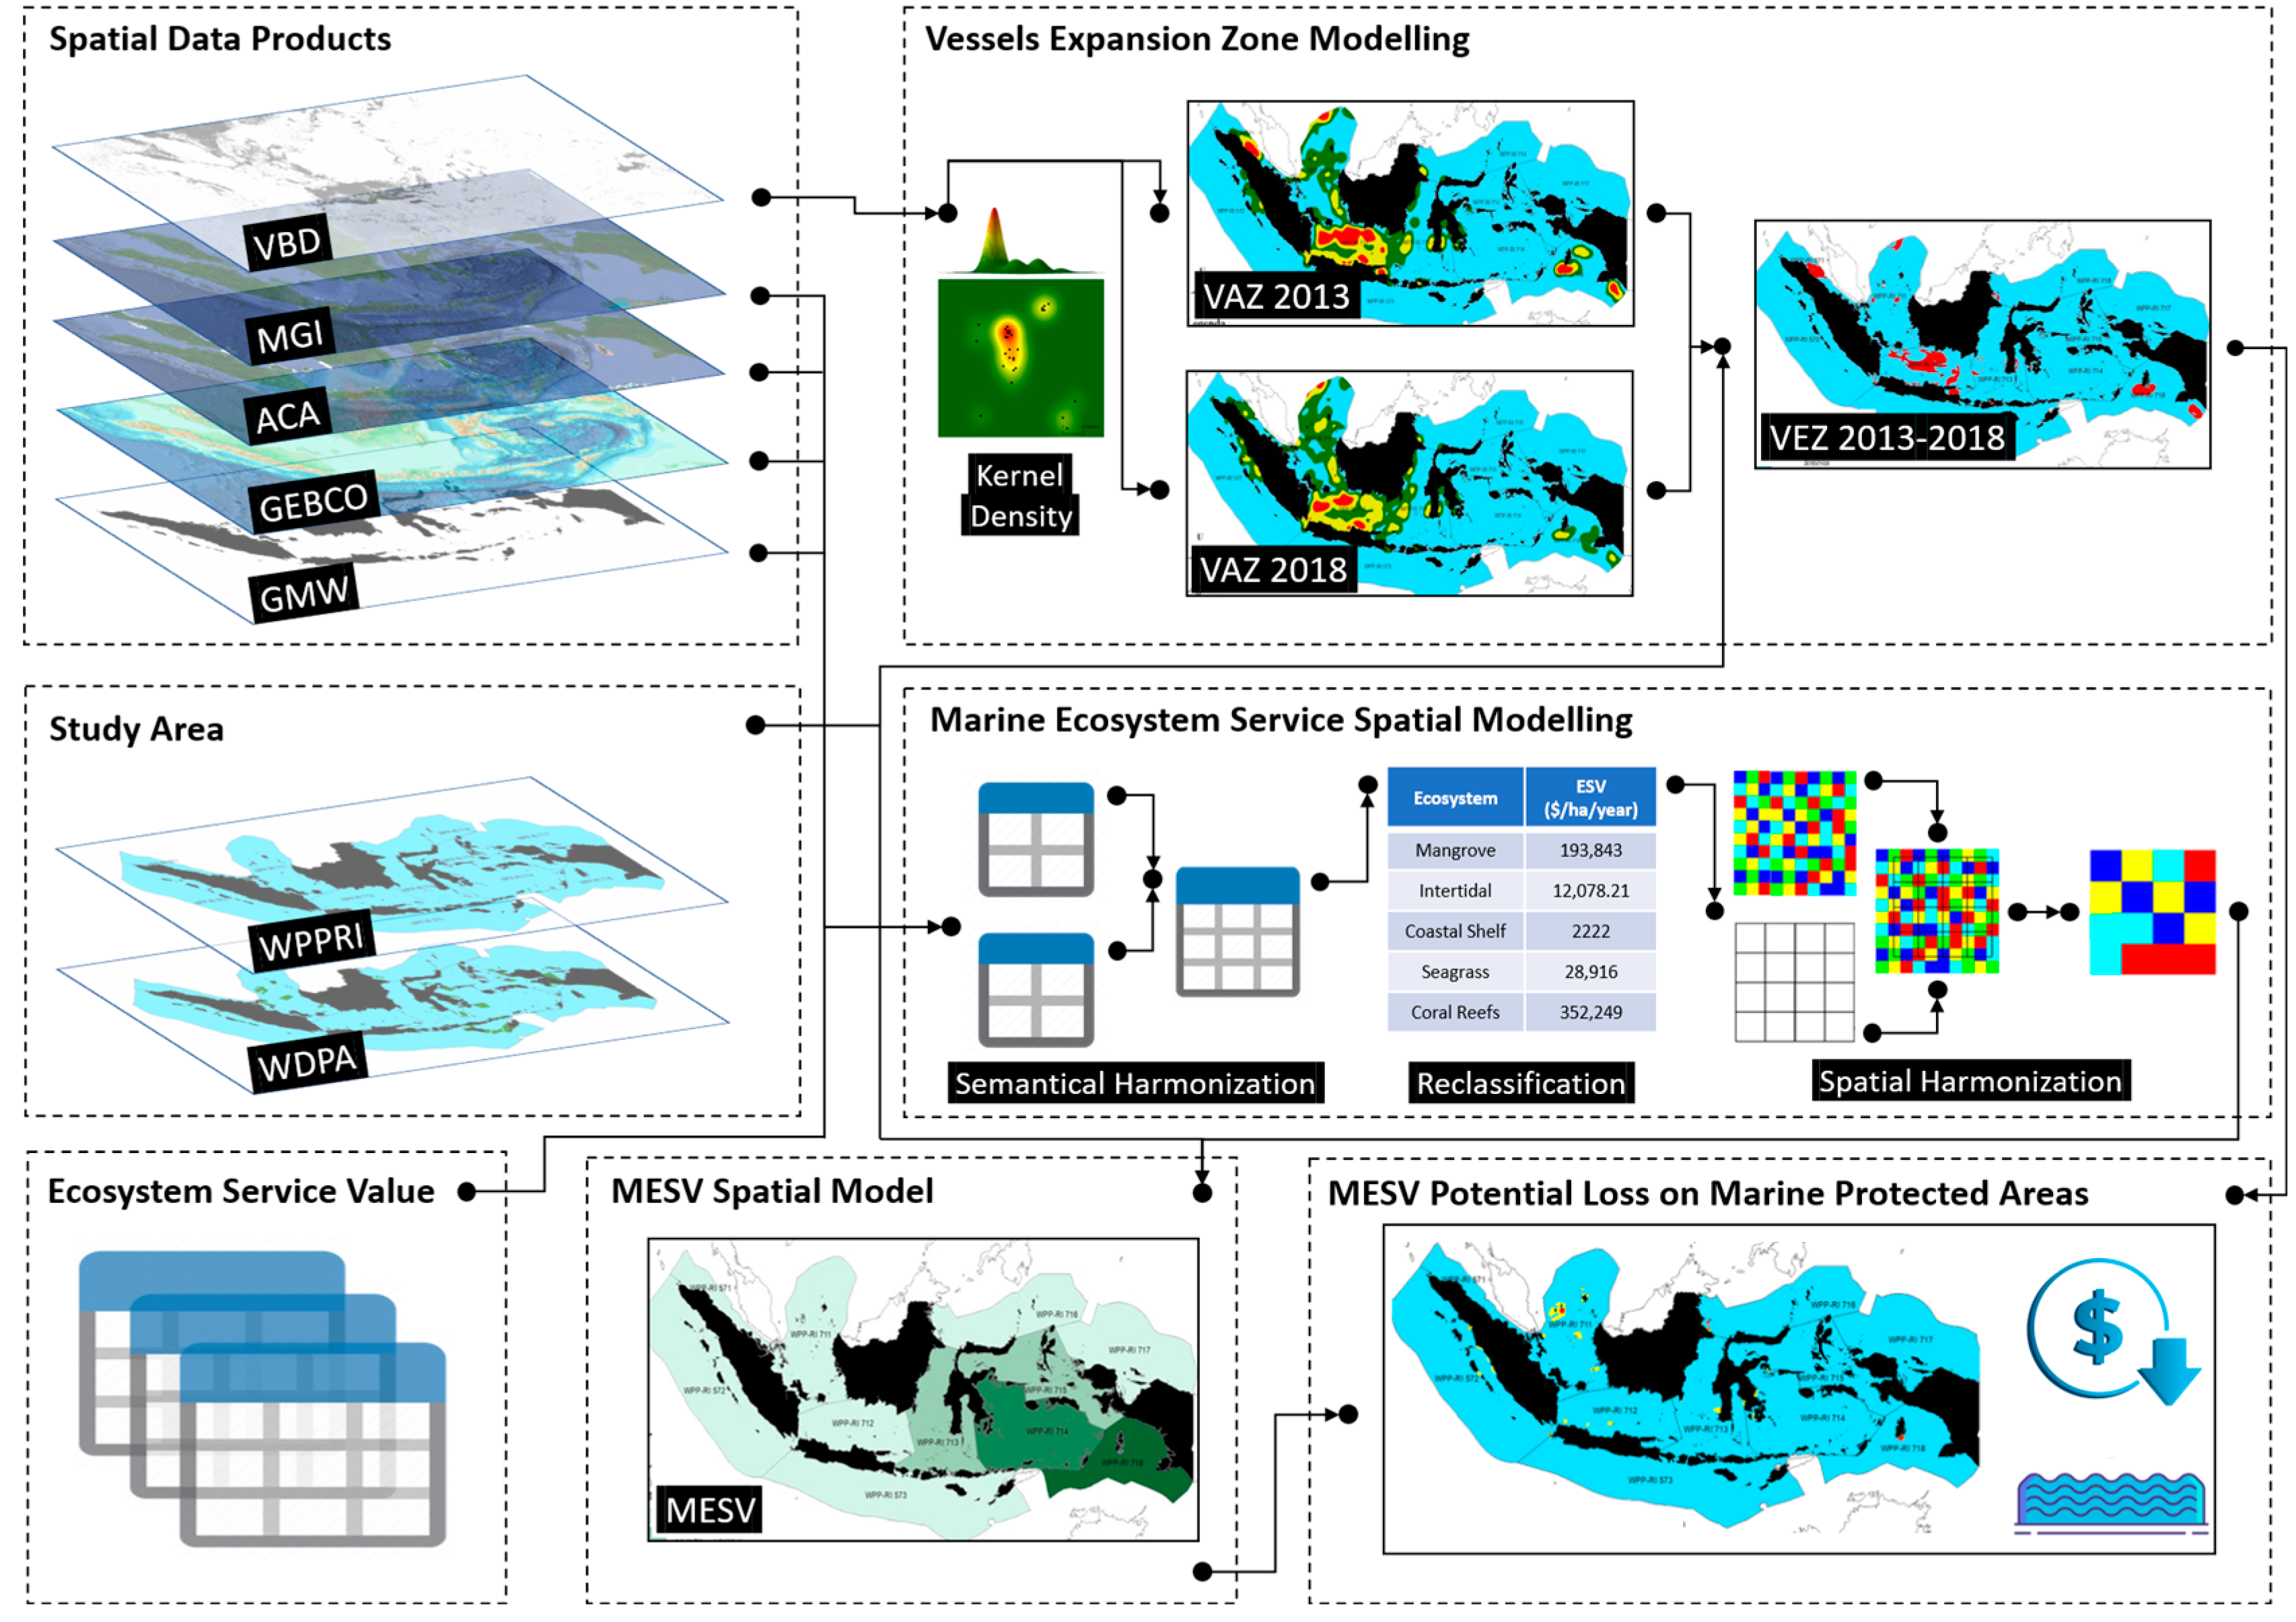
2.2. Methodology
2.2.1. Vessels Expansion Zone (VEZ) Modeling
2.2.2. Marine Ecosystem Service Value (MESV) Modeling
2.2.3. MESV Potential Loss on Indonesian MPAs
2.3. Data
2.3.1. Global Mangrove Watch (GMW)
2.3.2. Allen Coral Atlas (ACA)
2.3.3. Murray Global Intertidal (MGI)
2.3.4. General Bathymetric Chart of the Oceans (GEBCO)
2.3.5. VIIRS Boat Detection (VBD)
2.3.6. World Database on Protected Areas (WDPA)
3. Results
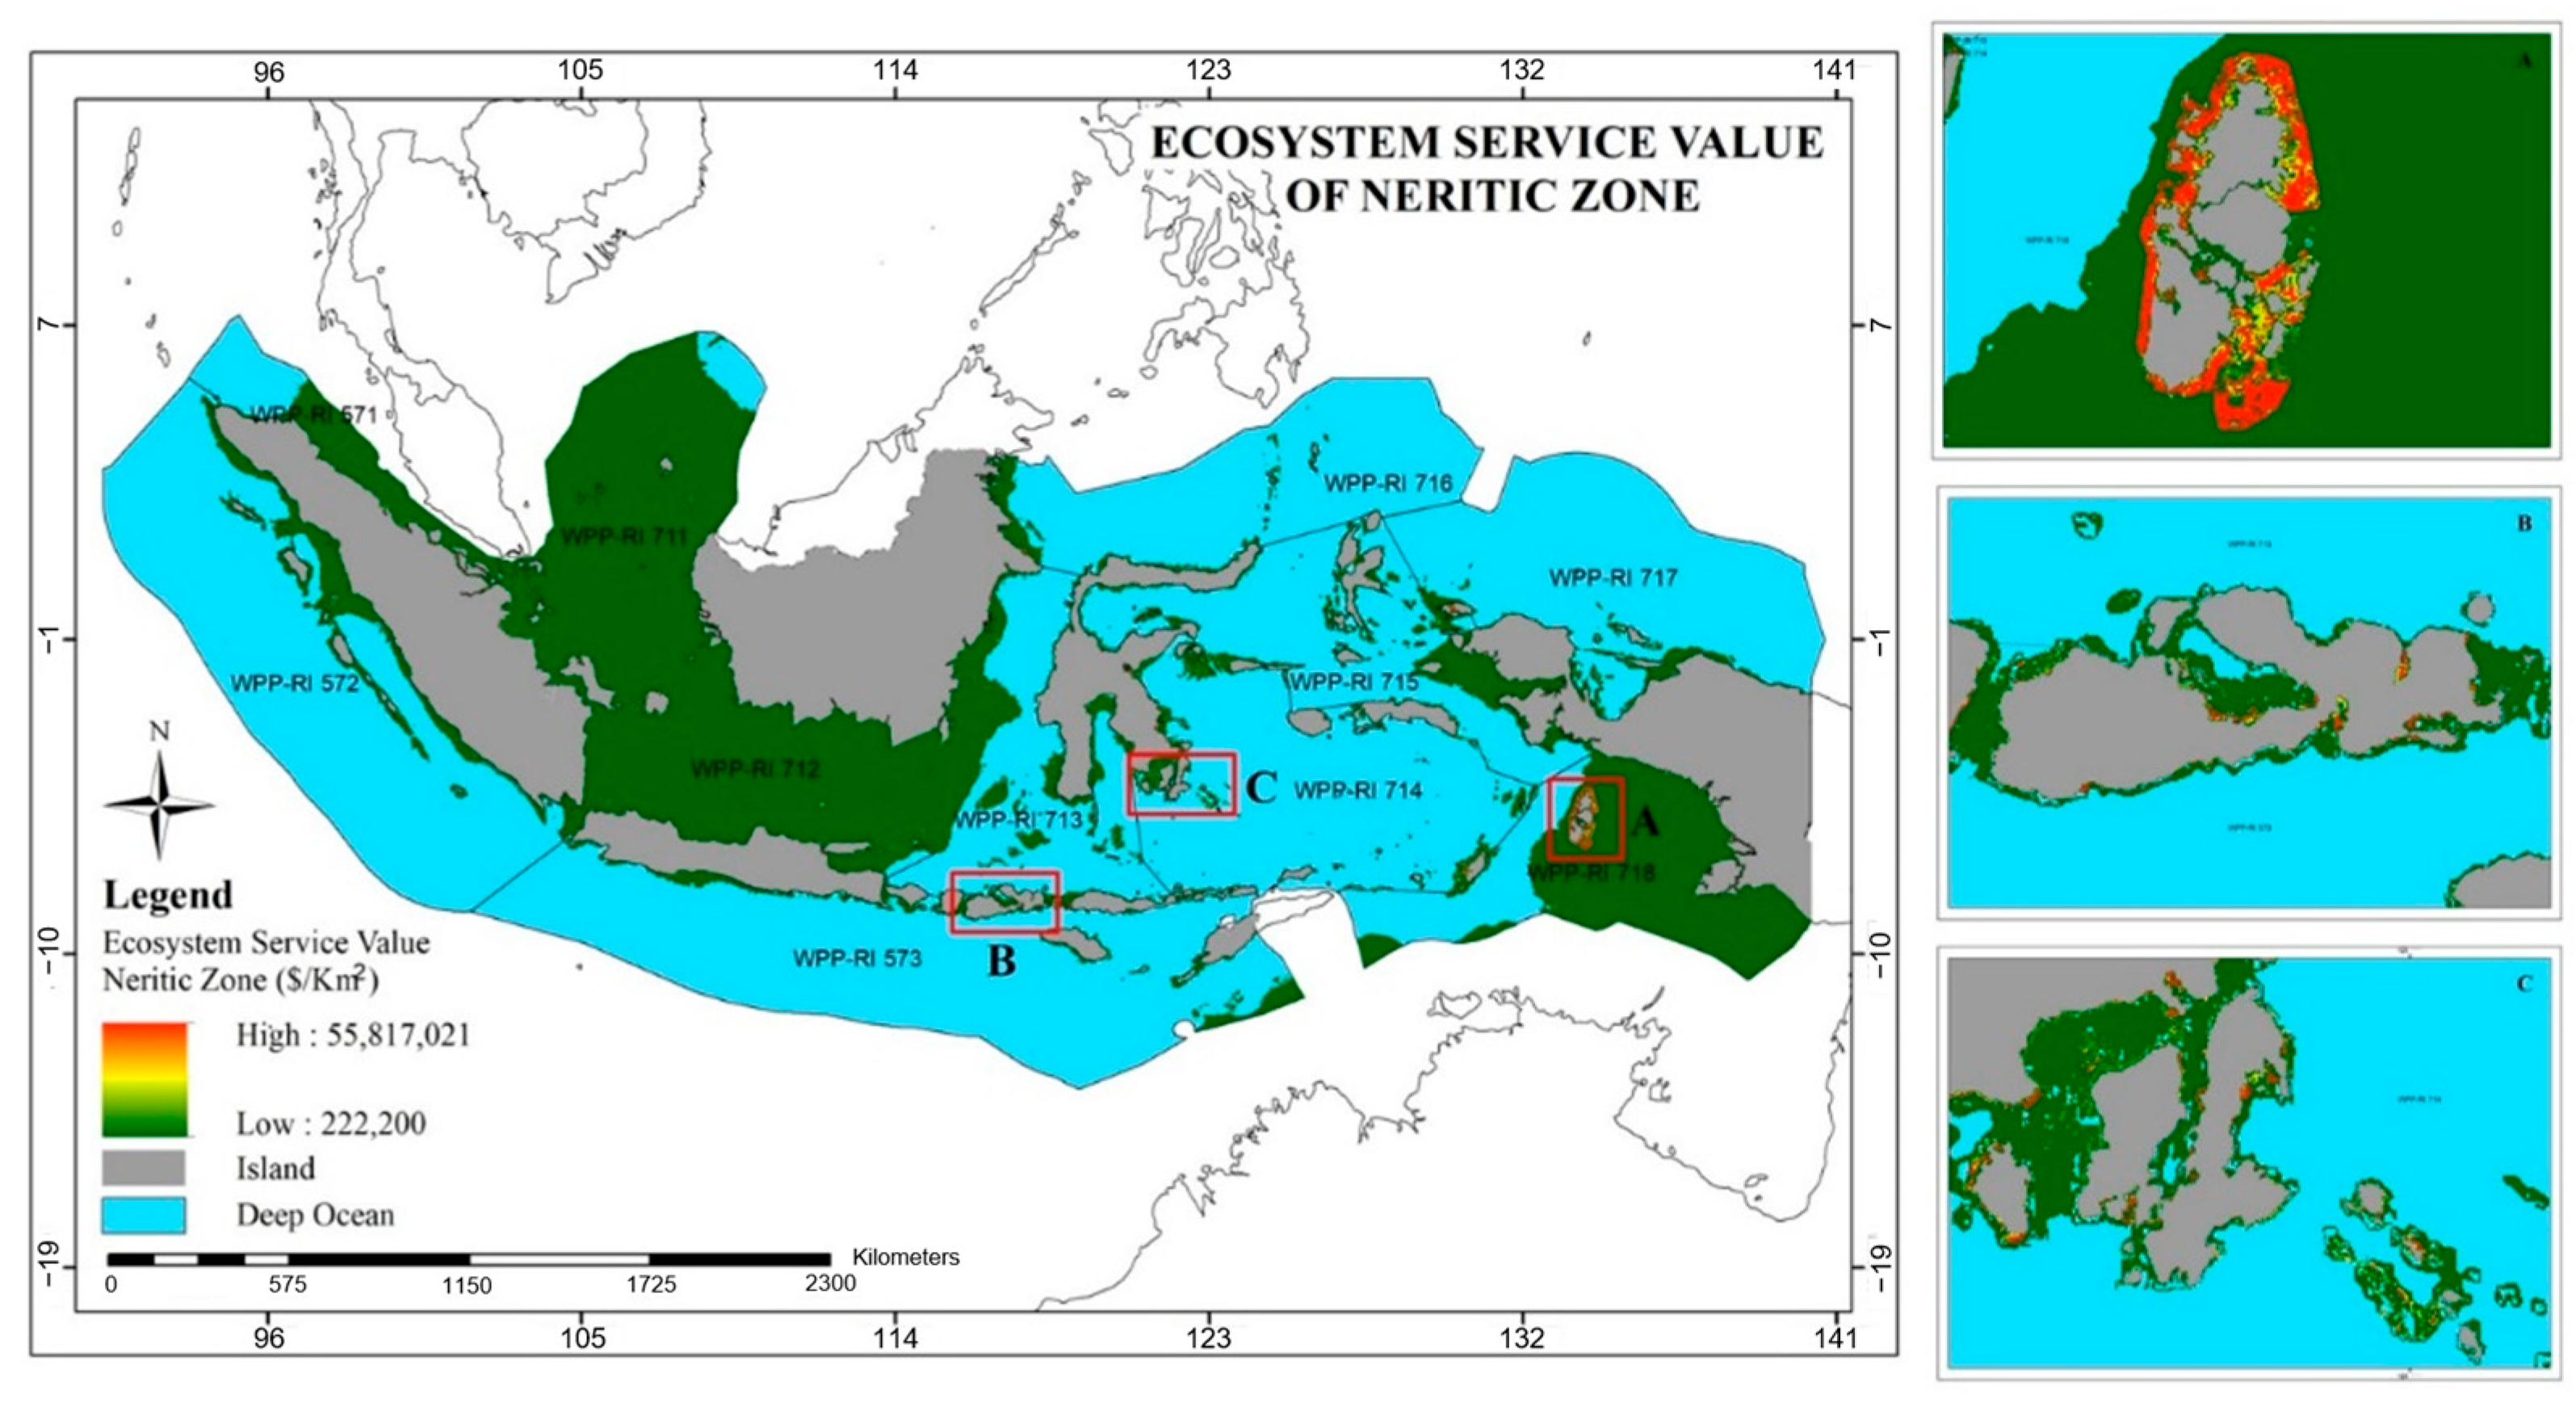
3.1. Marine Ecosystem Service Value Model in the Indonesian Neritic Zone
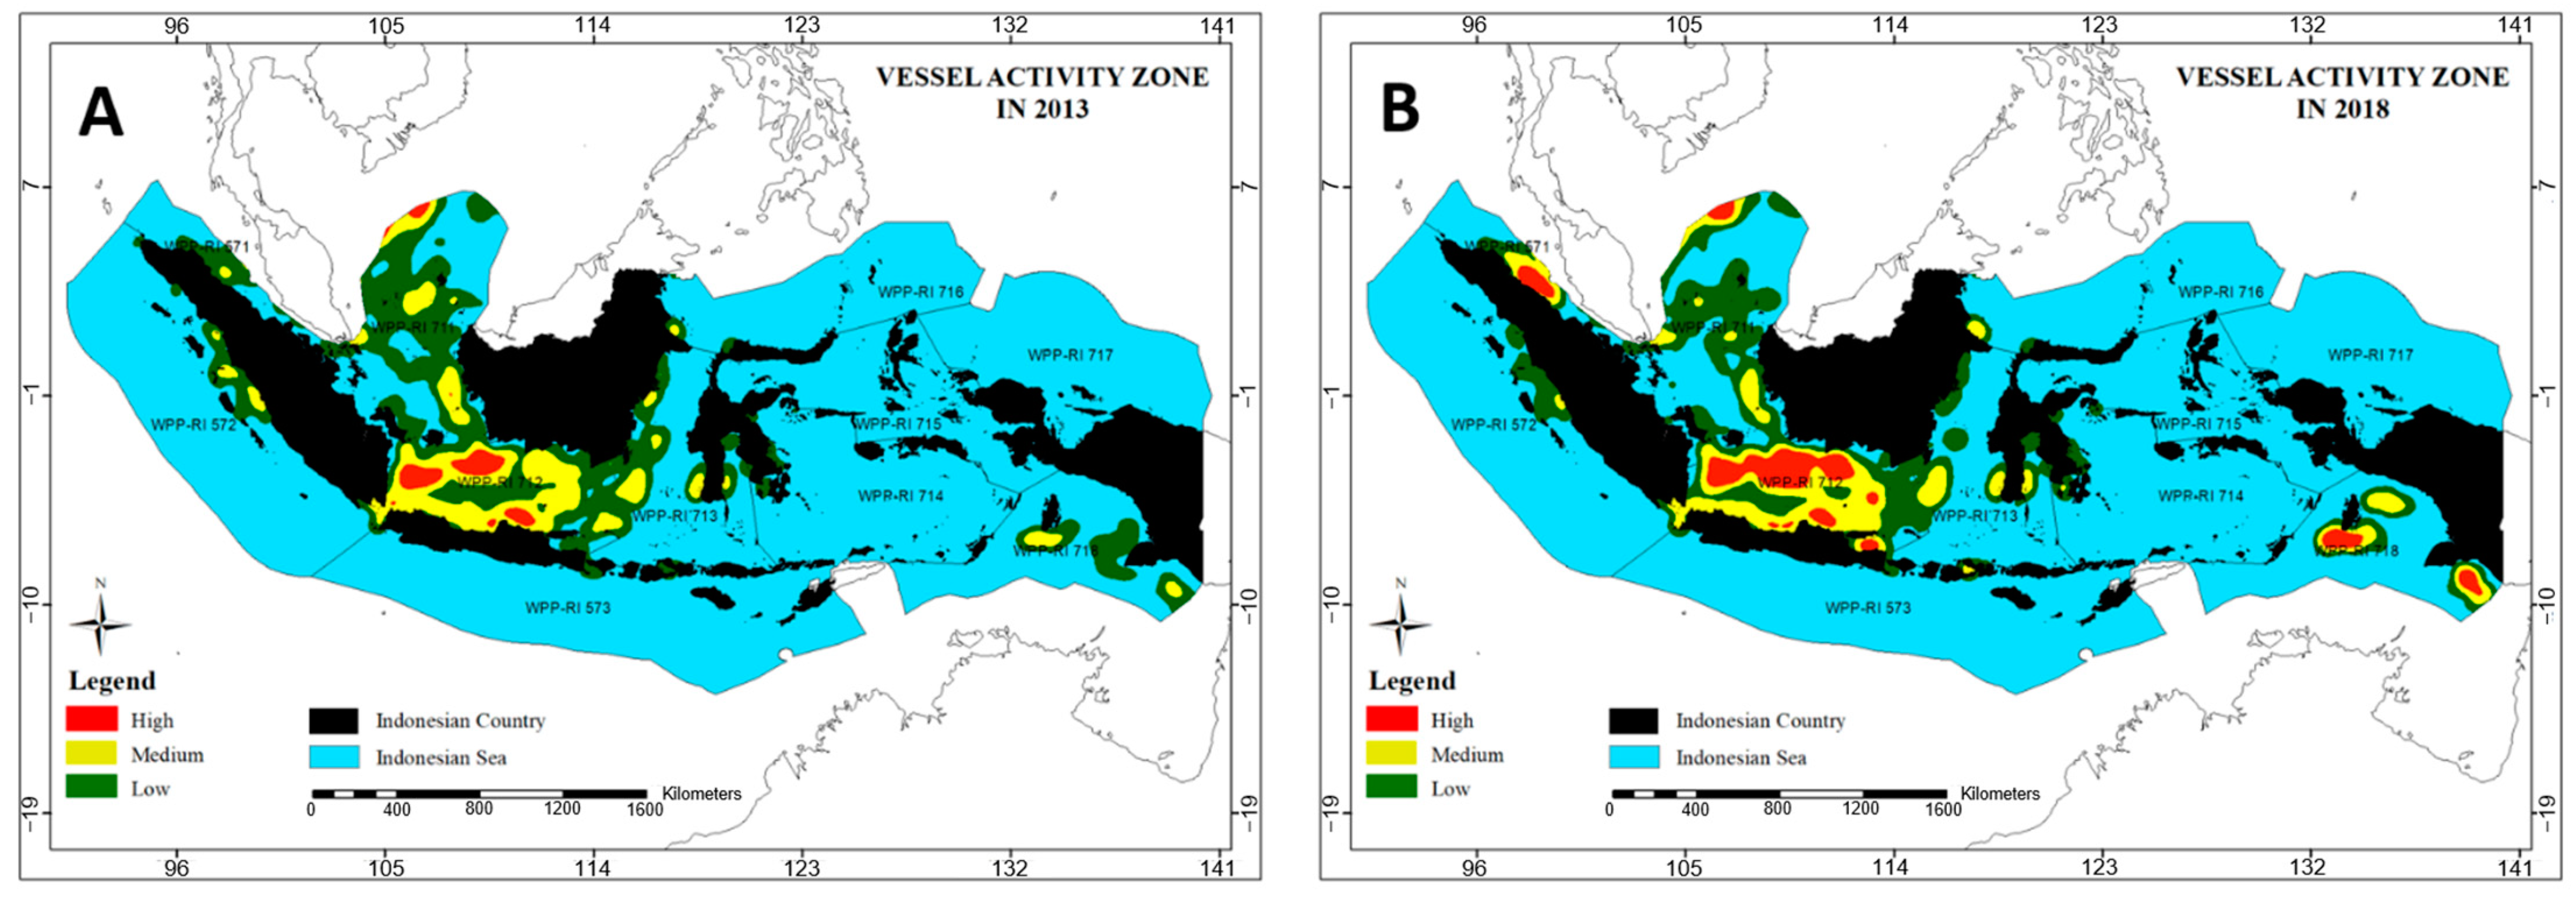
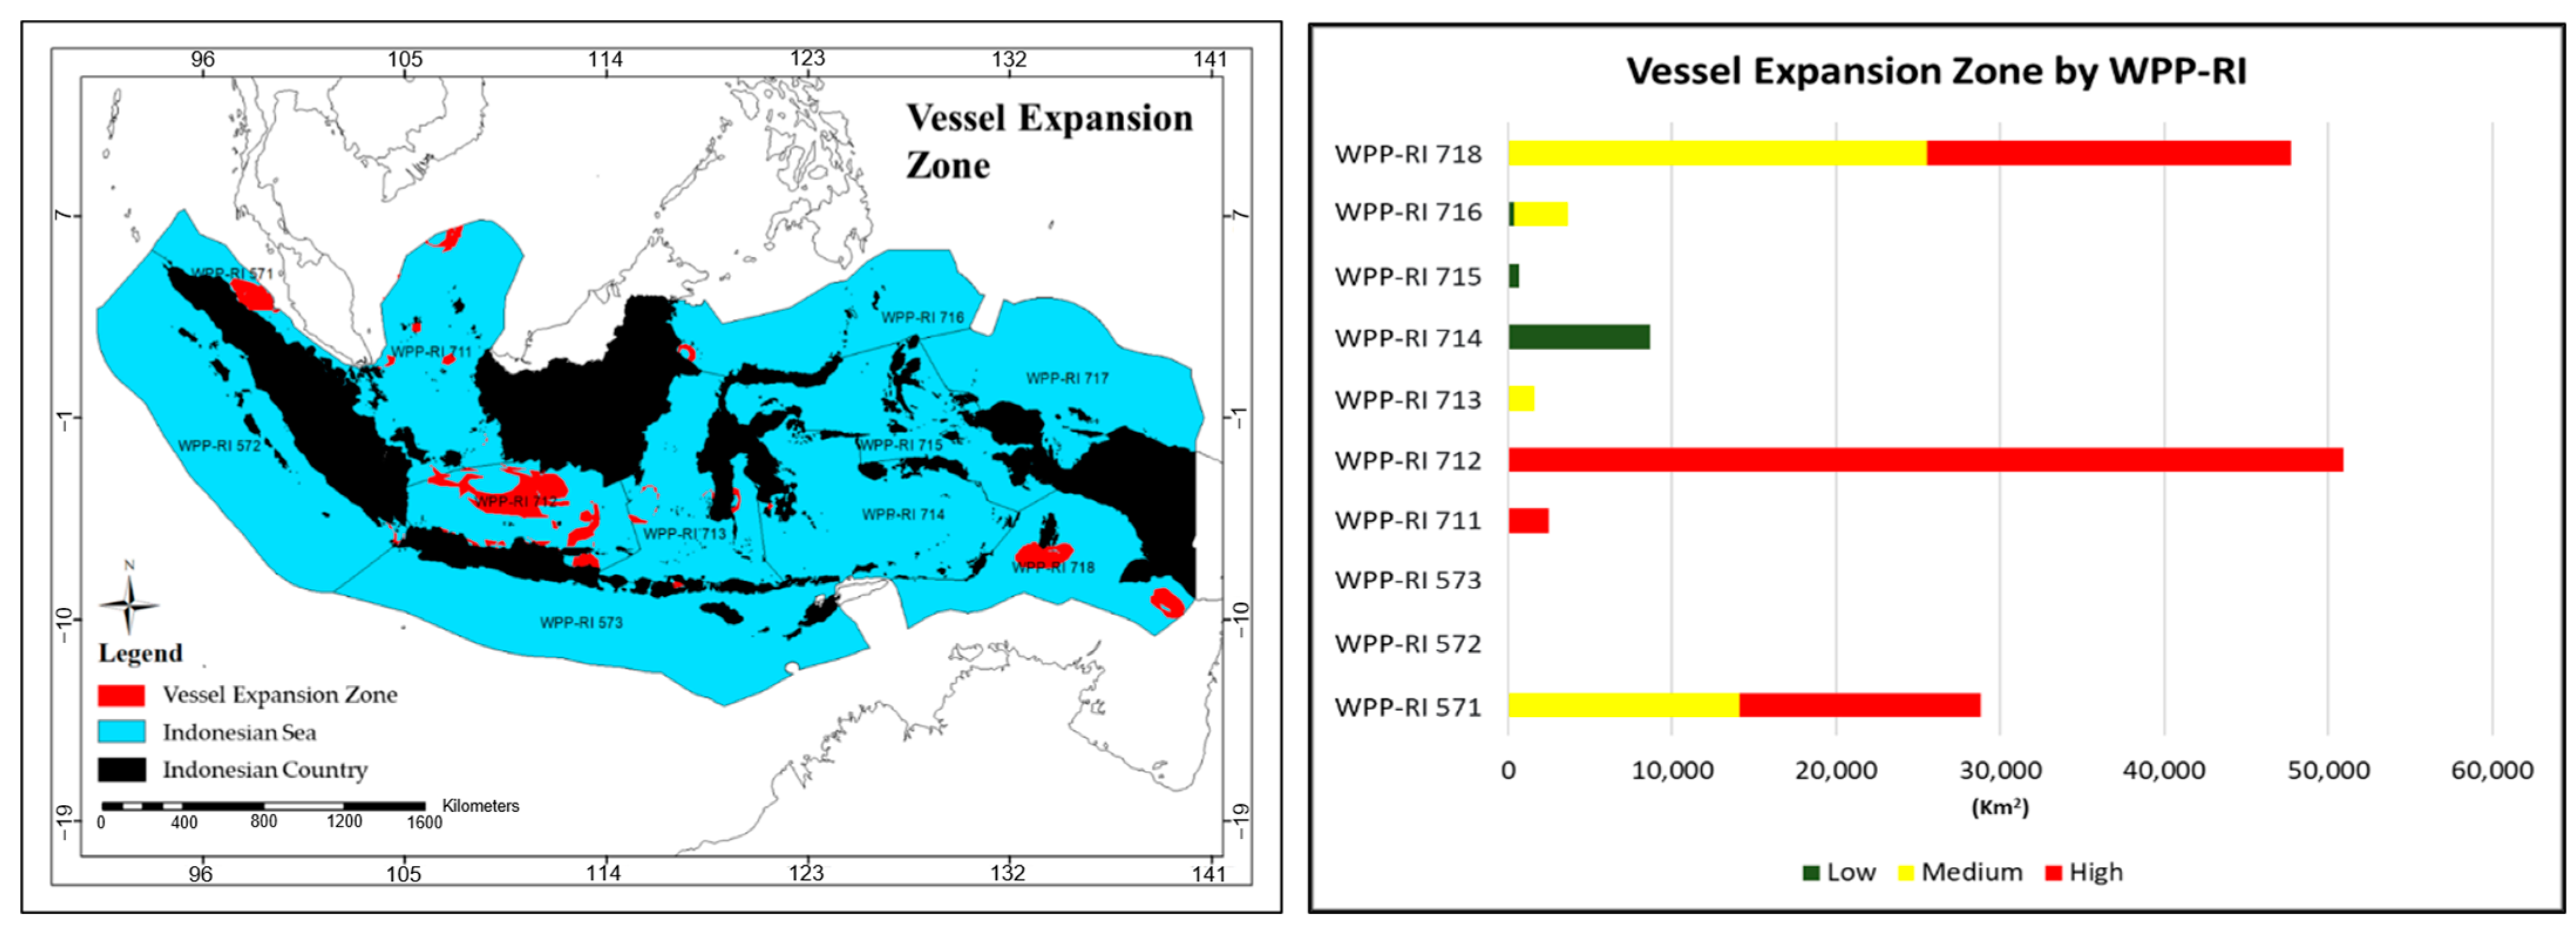
3.2. Vessel Expansion Zone Model in Indonesia
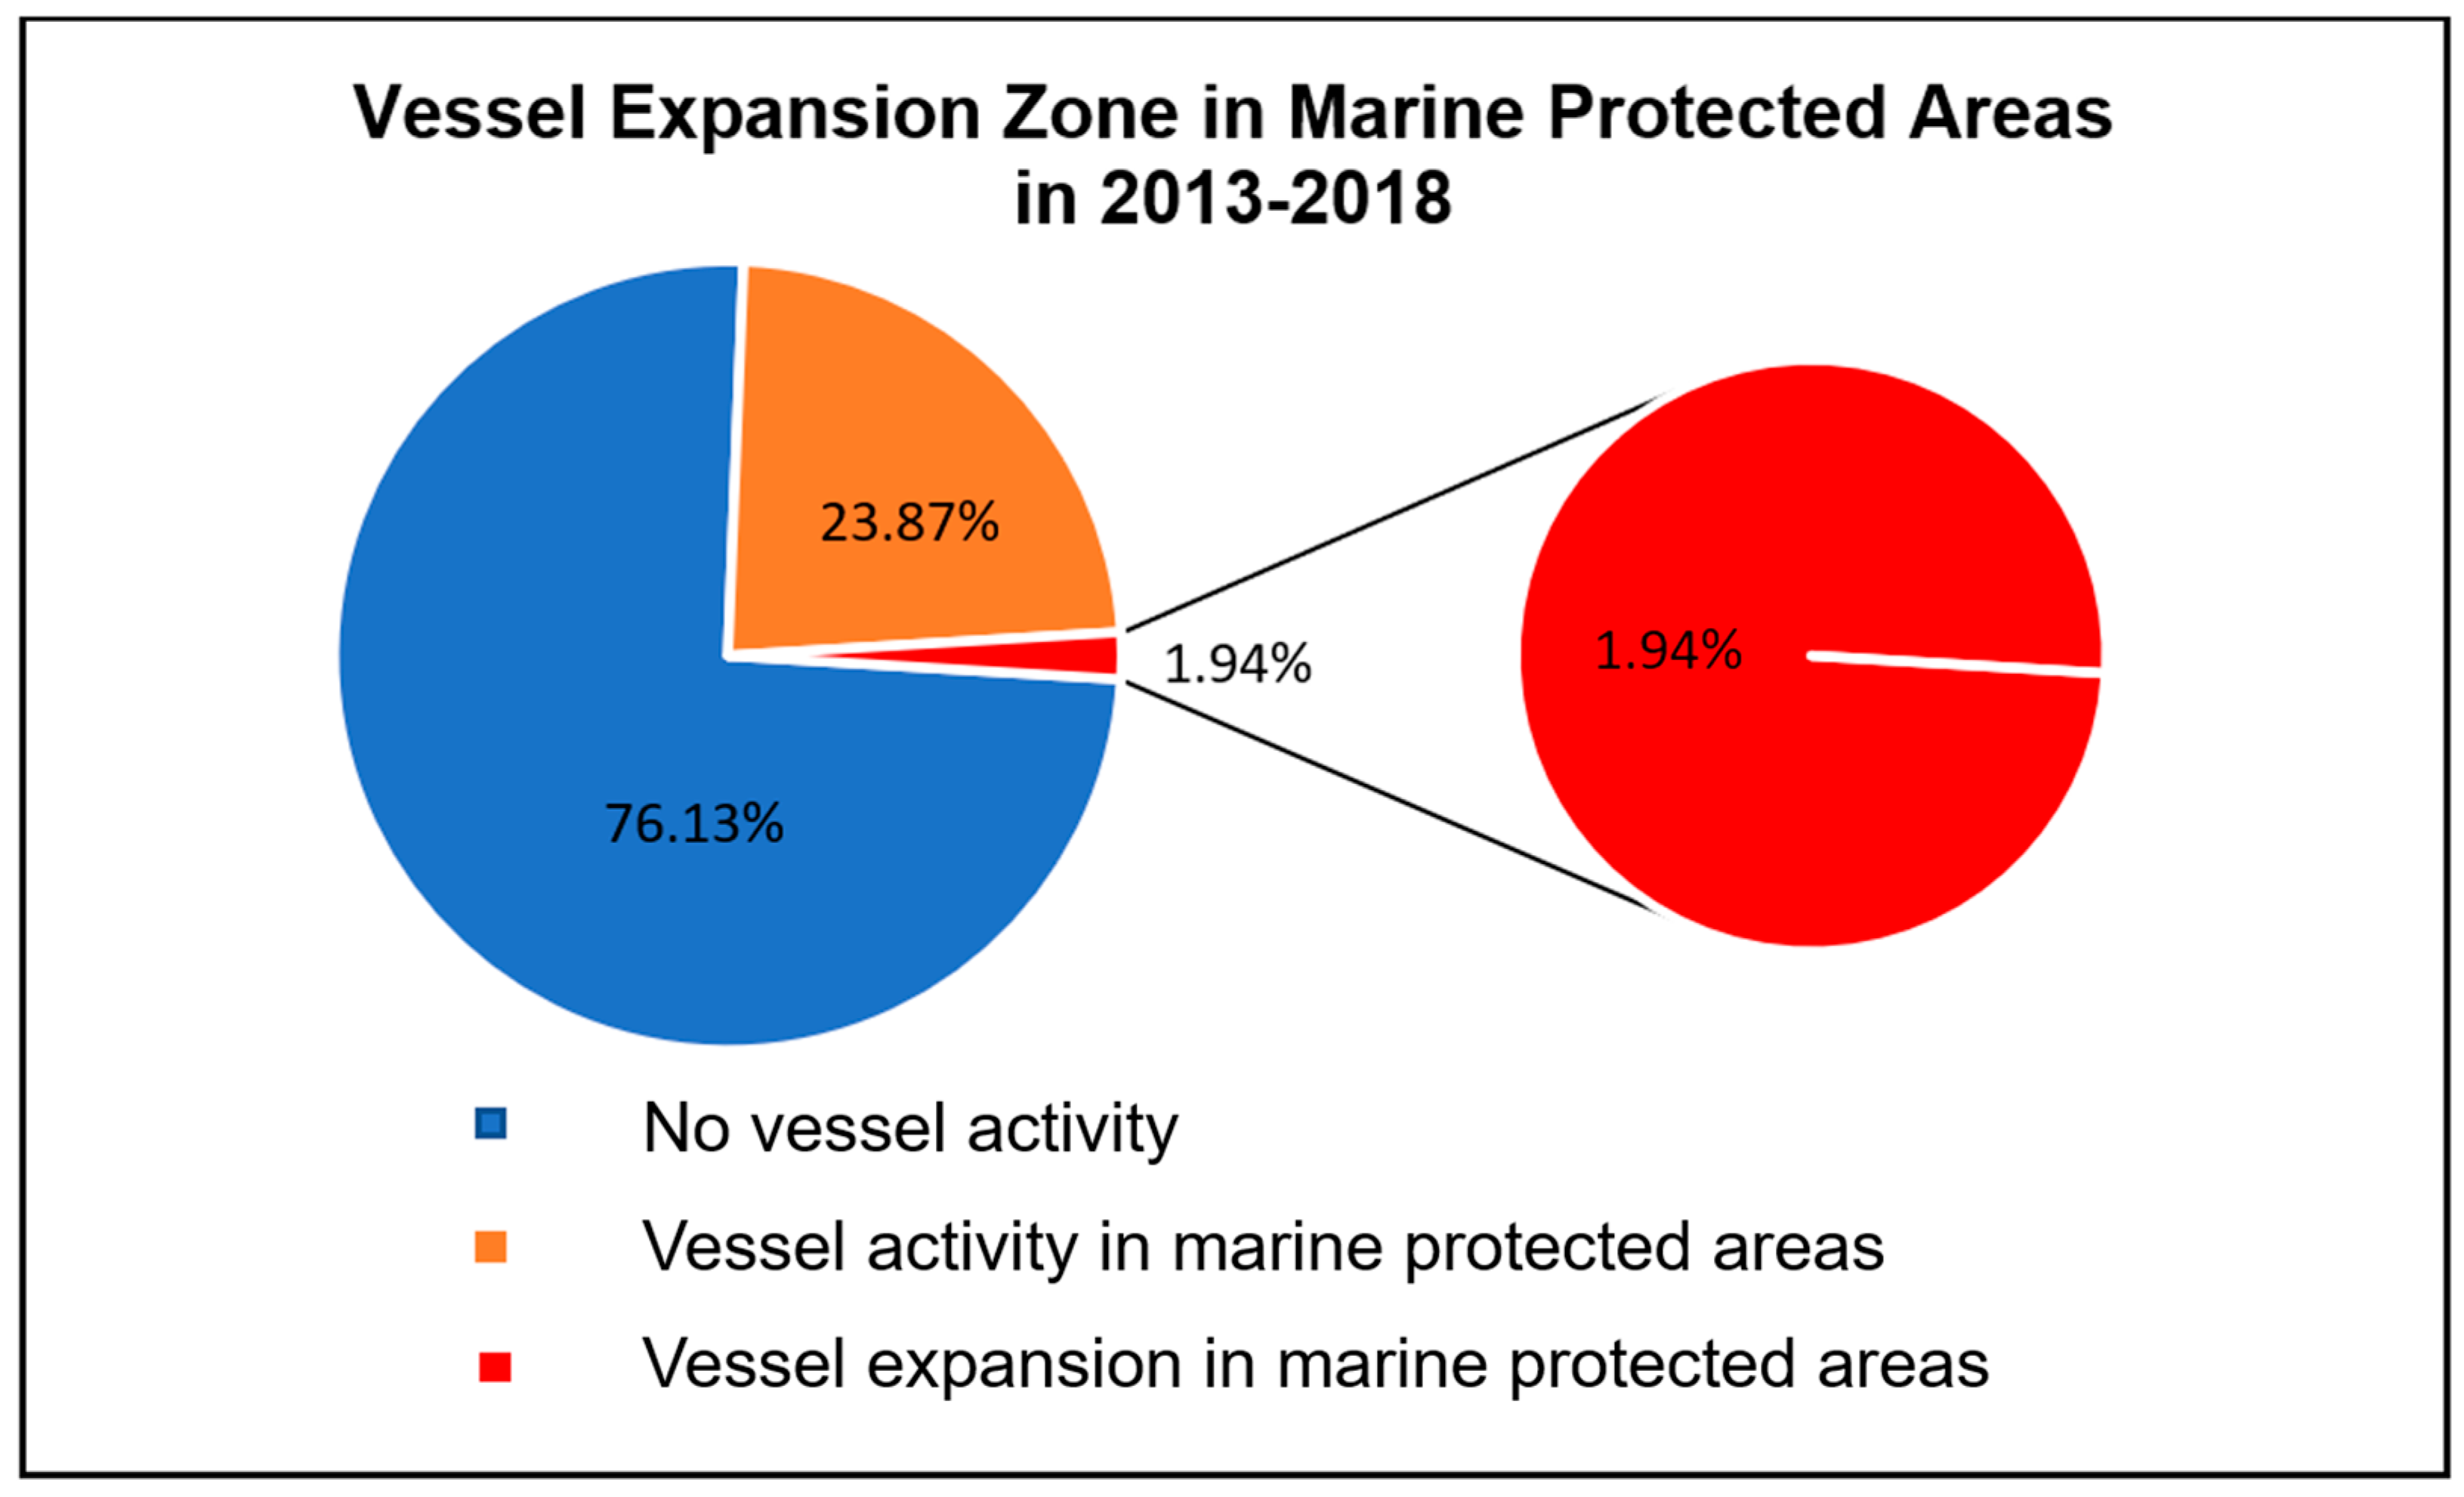
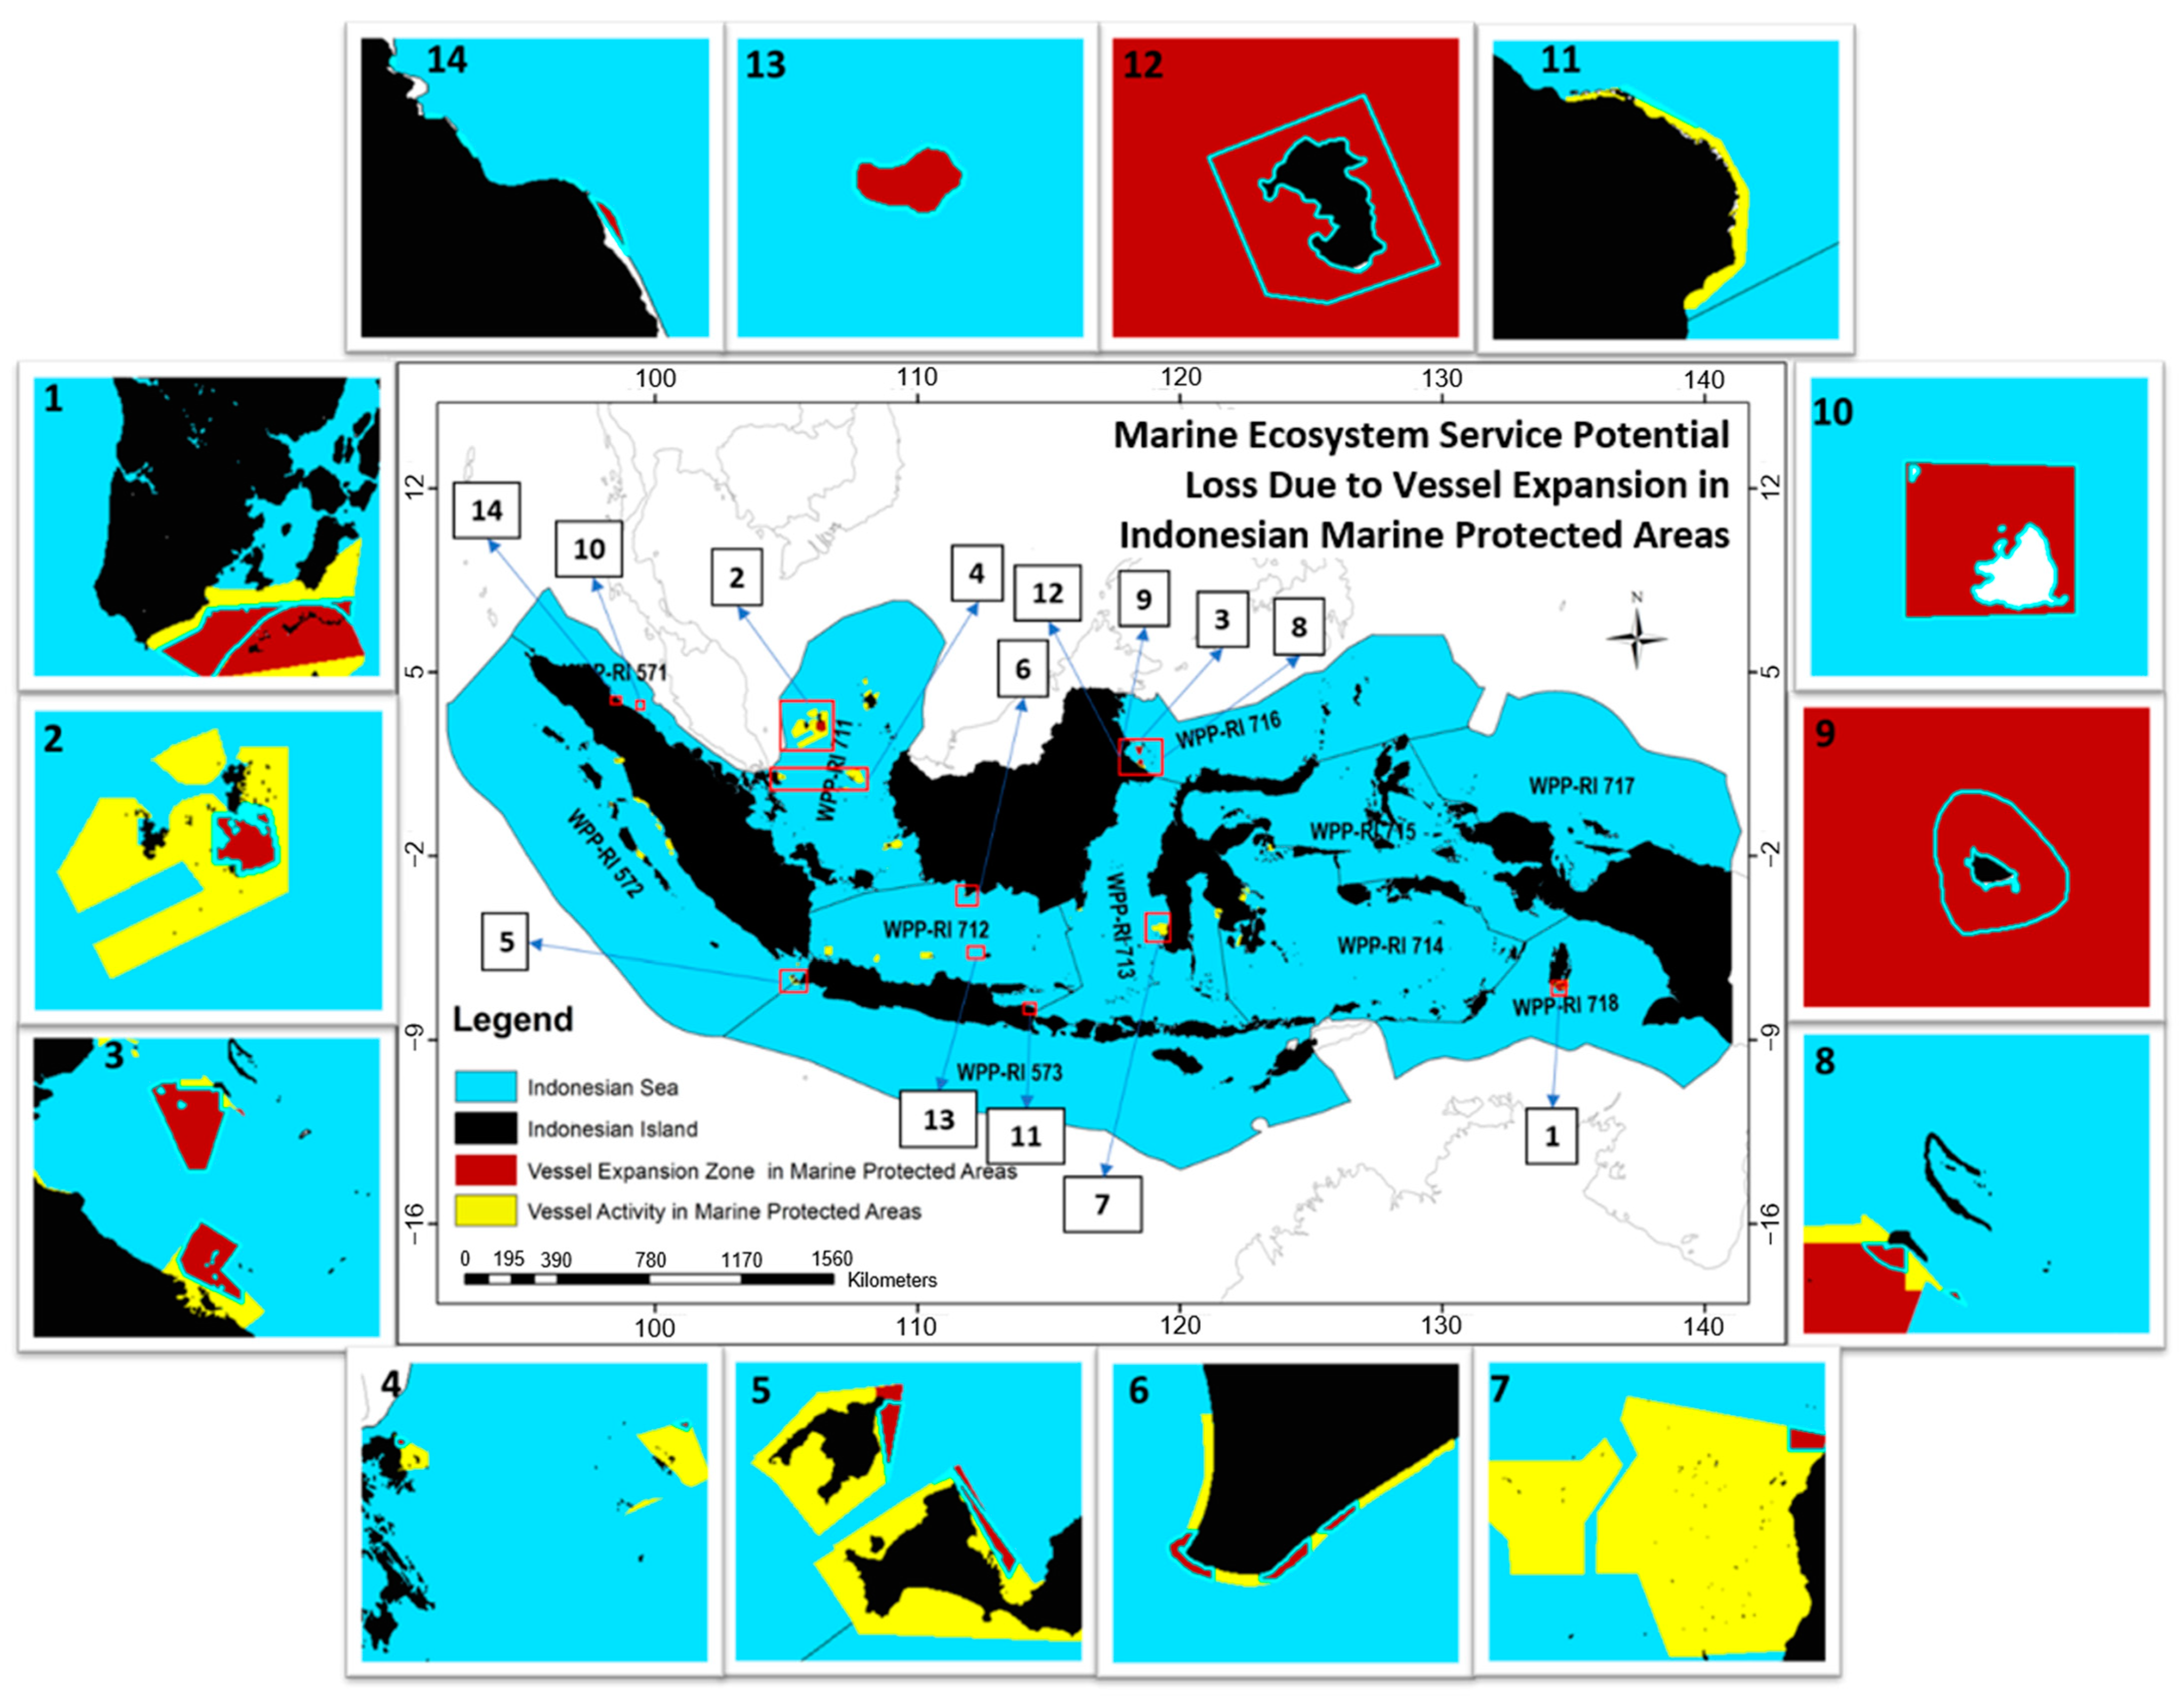
3.3. Potential Loss of MESV Due to Vessel Activity Expansion
4. Discussion
4.1. Vessel Activity Impacts on Indonesian Marine Ecosystems
4.2. Current Status of Threatened MPAs Based on Fauzi et al., 2021 [23]
- Over-exploitation and high blue carbon risk: These sites are overexploited and cause significant levels of harm to the blue carbon ecosystem because they have low to moderate levels of fisheries potential, but high levels of ship activity.
- Over-exploitation and medium blue carbon risk: These sites are overexploited and have moderate levels of harm to the blue carbon ecosystem because they have poor fisheries potential, but moderate levels of ship activity.
- Low productivity and low blue carbon risk: These regions have low levels of ship activity and fisheries potential, which results in low levels of fishery production yields and low levels of blue carbon ecological impacts.
- Under-exploitation and low blue carbon risk: These areas are less utilized and cause lower levels of harm to the blue carbon ecosystem because they contain a modest level of fisheries potential, but less ship activity.
- Under-exploitation and sustainable blue carbon: These places are less fished and the blue carbon ecosystem is more resilient since they contain a low to high level of fisheries potential, but little ship activity.
- Sustainable blue carbon: The potential for fishing and the degree of ship activity in these areas are quite low. Consequently, the blue carbon ecosystems are largely preserved.
4.3. Limitations
4.4. Future Possible Directions
5. Conclusions
Supplementary Materials
Author Contributions
Funding
Data Availability Statement
Acknowledgments
Conflicts of Interest
References
- Frederick Grassle, J. Marine Ecosystems. Encycl. Biodivers. Second Ed. 2013, 5, 45–55. [Google Scholar] [CrossRef]
- Barbier, E.B. Marine ecosystem services. Curr. Biol. 2017, 27, R507–R510. [Google Scholar] [CrossRef] [Green Version]
- Millenium Ecosystem Assessment. Ecosystem and Human Well Being; Island Press: Washington, DC, USA, 2005; ISBN 1597260401. [Google Scholar]
- Austen, M.C.; Andersen, P.; Armstrong, C.; Döring, R.; Hynes, S.; Levrel, H.; Oinonen, S.; Ressurreição, A.; Coopman, J. Valuing Marine Ecosystems – Taking into account the value of ecosystems benefits in the Blue Economy; Future Science Brief 5 of the European Marine Board: Ostend, Belgium, 2019; ISBN 9789492043696. [Google Scholar]
- Fisher, B.; Turner, R.K.; Morling, P. Defining and classifying ecosystem services for decision making. Ecol. Econ. 2009, 68, 643–653. [Google Scholar] [CrossRef] [Green Version]
- Salcone, J.; Brander, L.; Seidl, A. Economic Valuation of Marine and Coastal Ecosystem Services in the Pacific Guidance Manual; Report to the MACBIO Project (GIZ, IUCN, SPREP): Suva, Fuji, 2016; Volume 46. [Google Scholar]
- Tianhong, L.; Wenkai, L.; Zhenghan, Q. Variations in ecosystem service value in response to land use changes in Shenzhen. Ecol. Econ. 2010, 69, 1427–1435. [Google Scholar] [CrossRef]
- Su, S.; Xiao, R.; Jiang, Z.; Zhang, Y. Characterizing landscape pattern and ecosystem service value changes for urbanization impacts at an eco-regional scale. Appl. Geogr. 2012, 34, 295–305. [Google Scholar] [CrossRef]
- Alleway, H.K.; Gillies, C.L.; Bishop, M.J.; Gentry, R.R.; Theuerkauf, S.J.; Jones, R. The Ecosystem Services of Marine Aquaculture: Valuing Benefits to People and Nature. Bioscience 2019, 69, 59–68. [Google Scholar] [CrossRef]
- Tolessa, T.; Senbeta, F.; Kidane, M. The impact of land use/land cover change on ecosystem services in the central highlands of Ethiopia. Ecosyst. Serv. 2017, 23, 47–54. [Google Scholar] [CrossRef]
- Jiang, W.; Lü, Y.; Liu, Y.; Gao, W. Ecosystem service value of the Qinghai-Tibet Plateau significantly increased during 25 years. Ecosyst. Serv. 2020, 44, 101146. [Google Scholar] [CrossRef]
- Riqqi, A.; Hendaryanto, H.; Safitri, S.; Mashita, N.; Sulistyawati, E.; Norvyani, D.A.; Afriyanie, D. Pemetaan Jasa Ekosistem. Semin. Nas. Geomatika 2019, 3, 237–246. [Google Scholar] [CrossRef]
- Brierley, A.S.; Kingsford, M.J. Impacts of Climate Change on Marine Organisms and Ecosystems. Curr. Biol. 2009, 19, R602–R614. [Google Scholar] [CrossRef] [Green Version]
- Gallardo, B.; Aldridge, D.C.; González-Moreno, P.; Pergl, J.; Pizarro, M.; Pyšek, P.; Thuiller, W.; Yesson, C.; Vilà, M. Protected areas offer refuge from invasive species spreading under climate change. Glob. Chang. Biol. 2017, 23, 5331–5343. [Google Scholar] [CrossRef] [PubMed] [Green Version]
- Bates, A.E.; Cooke, R.S.C.; Duncan, M.I.; Edgar, G.J.; Bruno, J.F.; Benedetti-Cecchi, L.; Côté, I.M.; Lefcheck, J.S.; Costello, M.J.; Barrett, N.; et al. Climate resilience in marine protected areas and the ‘Protection Paradox’. Biol. Conserv. 2019, 236, 305–314. [Google Scholar] [CrossRef]
- He, Q.; Silliman, B.R. Climate Change, Human Impacts, and Coastal Ecosystems in the Anthropocene. Curr. Biol. 2019, 29, R1021–R1035. [Google Scholar] [CrossRef] [PubMed]
- Tulloch, V.J.D.; Turschwell, M.P.; Giffin, A.L.; Halpern, B.S.; Connolly, R.; Griffiths, L.; Frazer, M.; Brown, C.J. Linking threat maps with management to guide conservation investment. Biol. Conserv. 2020, 245, 108527. [Google Scholar] [CrossRef]
- Fauzi, A.I.; Sakti, A.D.; Yayusman, L.F.; Harto, A.B.; Prasetyo, L.B.; Irawan, B.; Wikantika, K. Evaluating mangrove forest deforestation causes in Southeast Asia by analyzing recent environment and socio-economic data products. In Proceedings of the 39th Asian Conference on Remote Sensing Remote Sensing Enabling Prosperity ACRS 2018, Kuala Lumpur, Malaysia, 15–19 October 2018; Volume 2, pp. 880–889. [Google Scholar]
- Fauzi, A.; Sakti, A.; Yayusman, L.; Harto, A.; Prasetyo, L.; Irawan, B.; Kamal, M.; Wikantika, K. Contextualizing mangrove forest deforestation in southeast asia using environmental and socio-economic data products. Forests 2019, 10, 952. [Google Scholar] [CrossRef] [Green Version]
- Goldberg, L.; Lagomasino, D.; Thomas, N.; Fatoyinbo, T. Global declines in human-driven mangrove loss. Glob. Chang. Biol. 2020, 26, 5844–5855. [Google Scholar] [CrossRef]
- Wang, Y.S.; Gu, J.D. Ecological responses, adaptation and mechanisms of mangrove wetland ecosystem to global climate change and anthropogenic activities. Int. Biodeterior. Biodegrad. 2021, 162, 105248. [Google Scholar] [CrossRef]
- Unsworth, R.K.F.; Ambo-Rappe, R.; Jones, B.L.; La Nafie, Y.A.; Irawan, A.; Hernawan, U.E.; Moore, A.M.; Cullen-Unsworth, L.C. Indonesia’s globally significant seagrass meadows are under widespread threat. Sci. Total Environ. 2018, 634, 279–286. [Google Scholar] [CrossRef] [PubMed]
- Fauzi, A.I.; Sakti, A.D.; Robbani, B.F.; Ristiyani, M.; Agustin, R.T.; Yati, E.; Nuha, M.U.; Anika, N.; Putra, R.; Siregar, D.I.; et al. Assessing potential climatic and human pressures in indonesian coastal ecosystems using a spatial data-driven approach. ISPRS Int. J. Geo-Inf. 2021, 10, 778. [Google Scholar] [CrossRef]
- Brodie, G.; De Ramon N’yeurt, A. Effects of Climate Change on Seagrasses and Seagrass Habitats Relevant to the Pacific Islands. PACIFIC Mar. Clim. Chang. Rep. CARD Sci. Rev. 2018, 112–131. [Google Scholar]
- Doney, S.C.; Ruckelshaus, M.; Emmett Duffy, J.; Barry, J.P.; Chan, F.; English, C.A.; Galindo, H.M.; Grebmeier, J.M.; Hollowed, A.B.; Knowlton, N.; et al. Climate change impacts on marine ecosystems. Ann. Rev. Mar. Sci. 2012, 4, 11–37. [Google Scholar] [CrossRef] [PubMed] [Green Version]
- The Organisation for Economic Co-operation and Development (OECD). Marine Protected Areas|Marine Conservation Society. Explor. Mar. Prot. Areas UK 2016, 14. [Google Scholar]
- Wells, S.; Ray, G.C.; Gjerde, K.M.; White, A.T.; Muthiga, N.; Bezaury Creel, J.E.; Causey, B.D.; McCormick-Ray, J.; Salm, R.; Gubbay, S.; et al. Building the future of MPAs—Lessons from history. Aquat. Conserv. Mar. Freshw. Ecosyst. 2016, 26, 101–125. [Google Scholar] [CrossRef] [Green Version]
- The International Union for Conservation of Nature (IUCN). Marine Protected Areas and Climate Change. Iucn 2017, 1–2. [Google Scholar]
- Balbar, A.C.; Metaxas, A. The current application of ecological connectivity in the design of marine protected areas. Glob. Ecol. Conserv. 2019, 17, e00569. [Google Scholar] [CrossRef]
- Cabral, R.B.; Bradley, D.; Mayorga, J.; Goodell, W.; Friedlander, A.M.; Sala, E.; Costello, C.; Gaines, S.D. A global network of marine protected areas for food. Proc. Natl. Acad. Sci. USA 2020, 117, 28134–28139. [Google Scholar] [CrossRef]
- UNEP With 15% of Terrestrial and 7% of Marine Areas Now Protected, World on Track to Meet Conservation Targets. Available online: https://www.unep.org/news-and-stories/press-release/15-terrestrial-and-7-marine-areas-now-protected-world-track-meet (accessed on 8 July 2022).
- The United Nations Convention on Biological Diversity (CBD). Report of the Open-Ended Working Group on the Post-2020 Global Biodiversity Framework on Its Second Meeting. Conv. Biol. Divers. 2020, 5, 248–253. [Google Scholar]
- Rusandi, A.; Hakim, A.; Wiryawan, B.; Sarmintohadi; Yulianto, I. Pengembangan Kawasan Konservasi Untuk Mendukung Pengelolaan Perikanan yang Berkelanjutan di Indonesia. Mar. Fish. J. Mar. Fish. Technol. Manag. 2021, 12, 137–147. [Google Scholar] [CrossRef]
- Susanto, H.A. Development and Progress of Marine Protected Area Systems in Indonesia. Usaid 2011, 1, 58. [Google Scholar]
- Nanda Magfiroh, A.; Zairon; Fahrudin, A. Strategi Peningkatan Efektivitas Pengelolaan Kawasan Konservasi Taman Nasional Karimunjawa. J. Ilmu dan Teknol. Kelaut. Trop. 2020, 12, 369–383. [Google Scholar] [CrossRef]
- Rees, S.E.; Mangi, S.C.; Hattam, C.; Gall, S.C.; Rodwell, L.D.; Peckett, F.J.; Attrill, M.J. The socio-economic effects of a Marine Protected Area on the ecosystem service of leisure and recreation. Mar. Policy 2015, 62, 144–152. [Google Scholar] [CrossRef]
- Mahabror, D.; Zaky, A.R. Analisis spasial dan temporal aktivitas kapal ikan di perairan selatan aru menggunakan citra modis dan radarsat-2. J. Kelaut. Indones. J. Mar. Sci. Technol. 2016, 9, 155–163. [Google Scholar] [CrossRef] [Green Version]
- Nugroho, U.A.; Budianto, F. Perspektif Eksploitasi dan Konservasi dalam Pengelolaan Sumber Daya Perikanan Indonesia. Maj. Media Perencana 2021, 2, 51–67. [Google Scholar]
- Arkham, M.N.; Wahyudin, Y.; Pahlevi, M.R.; Hutapea, R.Y.F. Jasa Penyedia Ekosistem Terumbu Karang Di Kawasan Suaka Alam Perairan Kepulauan Raja Ampat Dari Perspektif Valuasi Ekonomi. J. Kelaut. Indones. J. Mar. Sci. Technol. 2020, 13, 239–248. [Google Scholar] [CrossRef]
- Hadiyanto, H. Pemanasan Global, Eksploitasi Sumberdaya Perikanan, dan Pencemaran Pesisir Sebagai Penyebab Utama Perubahan Ekologi Laut di Indonesia. OSEANA 2018, 42, 1–11. [Google Scholar]
- Longépé, N.; Mouche, A.A.; Goacolou, M.; Granier, N.; Carrere, L.; Lebras, J.Y.; Lozach, P.; Besnard, S. Polluter identi fi cation with spaceborne radar imagery, AIS and forward drift modeling. MPB 2015, 101, 4–11. [Google Scholar] [CrossRef]
- Tichavska, M.; Tovar, B. Environmental cost and eco-efficiency from vessel emissions in Las Palmas Port. Transp. Res. Part E Logist. Transp. Rev. 2015, 83, 126–140. [Google Scholar] [CrossRef]
- Chen, D.; Wang, X.; Nelson, P.; Li, Y.; Zhao, N.; Zhao, Y.; Lang, J.; Zhou, Y.; Guo, X. Ship emission inventory and its impact on the PM2.5 air pollution in Qingdao Port, North China. Atmos. Environ. 2017, 166, 351–361. [Google Scholar] [CrossRef]
- Direktorat Jenderal Pengelolaan Ruang Laut KKP|Kementerian Kelautan dan Perikanan. Available online: https://kkp.go.id/djprl/artikel/23631-pencemaran-laut (accessed on 19 October 2022).
- Fudjaja, L.; Viantika, N.M.; Rani, C.; Nurdin, N.; Priosambodo, D.; Tenriawaru, A.N. Anthropogenic activity and the destruction of coral reefs in the waters of small islands Anthropogenic activity and the destruction of coral reefs in the waters of small islands. IOP Conf. Ser. Earth Environ. Sci. 2020, 575, 12057. [Google Scholar] [CrossRef]
- Liu, B.; Wu, X.; Liu, X.; Gong, M. Assessment of ecological stress caused by maritime vessels based on a comprehensive model using AIS data: Case study of the Bohai Sea, China. Ecol. Indic. 2021, 126, 107592. [Google Scholar] [CrossRef]
- Robards, M.D.; Silber, G.K.; Adams, J.D.; Arroyo, J.; Lorenzini, D.; Schwehr, K.; Amos, J. Conservation science and policy applications of the marine vessel Automatic Identification System (AIS)-A review. Bull. Mar. Sci. 2016, 92, 75–103. [Google Scholar] [CrossRef]
- Metcalfe, K.; Bréheret, N.; Chauvet, E.; Collins, T.; Curran, B.K.; Parnell, R.J.; Turner, R.A.; Witt, M.J.; Godley, B.J. Using satellite AIS to improve our understanding of shipping and fill gaps in ocean observation data to support marine spatial planning. J. Appl. Ecol. 2018, 55, 1834–1845. [Google Scholar] [CrossRef]
- Moore, T.J.; Redfern, J.V.; Carver, M.; Hastings, S.; Adams, J.D.; Silber, G.K. Exploring ship traffic variability off California. Ocean Coast. Manag. 2018, 163, 515–527. [Google Scholar] [CrossRef]
- Rahardi, W.; Suhardi, R.M. Keanekaragaman Hayati dan Jasa Ekosistem Mangrove di Indonesia. In Proceedings of the Prosiding Symbion (Symposium on Biology Education), Yogyakarta, Indonesia, 24 August 2016. [Google Scholar]
- Dharmawan, I.W.E. Pramudji Panduan Pemantauan Komunitas Mangrove; Pusat Penelitian Oseanografi, LIPI: Jakarta, Indonesia, 2017; ISBN 978-602-6504-13-5. [Google Scholar]
- Yudi, W.; Dadan, M.; Agus, R.; Novit, R.; Donny, S.; Arif, T.K. The Economic Value of Coastal and Marine Biodiversity in Indonesia. J. Cendekia Ihya 2019, 2, 37–51. [Google Scholar]
- Rosyada, K.; Trismadi; Ras, A.R. Potensi Blue Carbon dalam Penanganan Perubahan Iiklim Guna Menunjang Keamanan Maritim Indonesia. J. Marit. Indones. 2021, 9, 299–311. [Google Scholar]
- Miteva, D.A.; Murray, B.C.; Pattanayak, S.K. Do protected areas reduce blue carbon emissions? A quasi-experimental evaluation of mangroves in Indonesia. Ecol. Econ. 2015, 119, 127–135. [Google Scholar] [CrossRef]
- Adi, N.S.; Paputungan, M.S.; Rustam, A.; Haditomo, A.H.C. Medrilzam Estimating carbon emission and baseline for blue carbon ecosystems in indonesia. In Proceedings of the IOP Conference Series: Earth and Environmental Science, Changchun, China, 21–23 August 2020; Volume 530. [Google Scholar]
- Syahid, L.N.; Sakti, A.D.; Virtriana, R.; Windupranata, W.; Sudhana, S.A.; Wilwatikta, F.N.; Fauzi, A.I.; Wikantika, K. Land suitability analysis for global mangrove rehabilitation in Indonesia. IOP Conf. Ser. Earth Environ. Sci. 2020, 500, 012010. [Google Scholar] [CrossRef]
- Hernawan, U.E.; Rahmawati, S.; Ambo-Rappe, R.; Sjafrie, N.D.M.; Hadiyanto, H.; Yusup, D.S.; Nugraha, A.H.; La Nafie, Y.A.; Adi, W.; Prayudha, B.; et al. The first nation-wide assessment identifies valuable blue-carbon seagrass habitat in Indonesia is in moderate condition. Sci. Total Environ. 2021, 782, 146818. [Google Scholar] [CrossRef]
- Scott, A.L.; York, P.H.; Duncan, C.; Macreadie, P.I.; Connolly, R.M.; Ellis, M.T.; Jarvis, J.C.; Jinks, K.I.; Marsh, H.; Rasheed, M.A. The role of herbivory in structuring tropical seagrass ecosystem service delivery. Front. Plant Sci. 2018, 9, 127. [Google Scholar] [CrossRef]
- Nordlund, L.M.; Koch, E.W.; Barbier, E.B.; Creed, J.C. Seagrass ecosystem services and their variability across genera and geographical regions. PLoS ONE 2016, 11, e0163091. [Google Scholar] [CrossRef] [Green Version]
- Eddy, S.; Mulyana, A.; Ridho, M.R.; Iskandar, I. Dampak Aktivitas Antropogenik Terhadapn Degradasi Hutan Mangrove Di Indonesia. J. Lingkung. dan Pembang. 2015, 1, 292–306. [Google Scholar]
- Sakti, A.D.; Fauzi, A.I.; Wilwatikta, F.N.; Rajagukguk, Y.S.; Sudhana, S.A.; Yayusman, L.F.; Syahid, L.N.; Sritarapipat, T.; Principe, J.A.; Quynh Trang, N.T.; et al. Multi-source remote sensing data product analysis: Investigating anthropogenic and naturogenic impacts on mangroves in southeast asia. Remote Sens. 2020, 12, 2720. [Google Scholar] [CrossRef]
- Tahir, A. Kualitas Kesehatan Ekosistem Benua Maritim Indonesia untuk Keberlanjutan Sumber Daya Ikan. Prosiding Simposium Nasional Kelautan Dan Perikanan. 2018, 4, 1–8. [Google Scholar]
- Dianovita, C. Jasa Ekosistem Lamun di Pulau Panjang, Serang, Banten. IJEEM Indones. J. Environ. Educ. Manag. 2019, 4, 95–106. [Google Scholar] [CrossRef] [Green Version]
- Lukman, K.M.; Uchiyama, Y.; Quevedo, J.M.D.; Kohsaka, R. Local awareness as an instrument for management and conservation of seagrass ecosystem: Case of Berau Regency, Indonesia. Ocean Coast. Manag. 2021, 203, 105451. [Google Scholar] [CrossRef]
- Onrizal Mangrove, Ekosistem Penting Langka yang Semakin Terancam. Available online: https://www.mongabay.co.id/2018/08/13/mangrove-ekosistem-penting-langka-yang-semakin-terancam/ (accessed on 19 October 2022).
- Sofian, A.; Kusmana, C.; Fauzi, A.; Rusdiana, O. Evaluasi Kondisi Ekosistem Mangrove Angke Kapuk Teluk Jakarta Dan Konsekuensinya Terhadap Jasa Ekosistem. J. Kelaut. Nas. 2019, 15, 1–12. [Google Scholar] [CrossRef]
- UNEP-WCMC Explore the World’s Protected Areas. Available online: https://www.protectedplanet.net/country/IDN (accessed on 19 October 2022).
- Elvidge, C.D.; Zhizhin, M.; Baugh, K.; Hsu, F.C. Automatic boat identification system for VIIRS low light imaging data. Remote Sens. 2015, 7, 3020–3036. [Google Scholar] [CrossRef] [Green Version]
- Costanza, R.; de Groot, R.; Sutton, P.; van der Ploeg, S.; Anderson, S.J.; Kubiszewski, I.; Farber, S.; Turner, R.K. Changes in the global value of ecosystem services. Glob. Environ. Chang. 2014, 26, 152–158. [Google Scholar] [CrossRef]
- Cao, L.; Li, J.; Ye, M.; Pu, R.; Liu, Y.; Guo, Q.; Feng, B.; Song, X. Changes of ecosystem service value in a coastal zone of Zhejiang province, China, during rapid urbanization. Int. J. Environ. Res. Public Health 2018, 15, 1301. [Google Scholar] [CrossRef] [Green Version]
- Gabel, F.; Lorenz, S.; Stoll, S. Science of the Total Environment Effects of ship-induced waves on aquatic ecosystems. Sci. Total Environ. 2017, 601–602, 926–939. [Google Scholar] [CrossRef]
- Thomas, N.; Lucas, R.; Bunting, P.; Hardy, A.; Rosenqvist, A.; Simard, M. Distribution and drivers of global mangrove forest change, 1996–2010. PLoS ONE 2017, 12, e0179302. [Google Scholar] [CrossRef] [Green Version]
- Bunting, P.; Rosenqvist, A.; Lucas, R.M.; Rebelo, L.-M.; Hilarides, L.; Thomas, N.; Hardy, A.; Itoh, T.; Shimada, M.; Finlayson, C.M. The Global Mangrove Watch—A New 2010 Global Baseline of Mangrove Extent. Remote Sens. 2018, 10, 1669. [Google Scholar] [CrossRef] [Green Version]
- Li, J.; Knapp, D.E.; Fabina, N.S.; Kennedy, E.V.; Larsen, K.; Lyons, M.B.; Murray, N.J.; Phinn, S.R.; Roelfsema, C.M.; Asner, G.P. A global coral reef probability map generated using convolutional neural networks. Coral Reefs 2020, 39, 1805–1815. [Google Scholar] [CrossRef]
- Lyons, M.B.; Roelfsema, C.M.; Kennedy, E.V.; Kovacs, E.M.; Borrego-Acevedo, R.; Markey, K.; Roe, M.; Yuwono, D.M.; Harris, D.L.; Phinn, S.R.; et al. Mapping the world’s coral reefs using a global multiscale earth observation framework. Remote Sens. Ecol. Conserv. 2020, 6, 557–568. [Google Scholar] [CrossRef] [Green Version]
- Allen Coral Atlas Allen Coral Atlas|FAQ. Available online: https://www.allencoralatlas.org/resources/ (accessed on 19 October 2022).
- Murray, N.J.; Phinn, S.R.; Dewitt, M.; Ferrari, R.; Johnston, R.; Lyons, M.B.; Clinton, N.; Thau, D.; Fuller, R.A. The global distribution and trajectory of tidal flats. Nature 2018, 565, 222–225. [Google Scholar] [CrossRef]
- IHO-UNESCO GEBCO Gridded Bathymetry Data. Available online: https://www.gebco.net/data_and_products/gridded_bathymetry_data/ (accessed on 19 October 2022).
- Juffe-Bignoli, D.; Bingham, H.; MacSharry, B.; Deguignet, M.; Lewis, E.; Milam, A.; Kingston, N. World Database on Protected Areas User Manual 1.3; UNEP-WCMC: Cambridge, UK, 2016; p. 70. Available online: http://wcmc.io/WDPA_Manual (accessed on 19 October 2022).
- UNEP-WCMC World Database of Protected Areas. Available online: https://www.fao.org/land-water/land/land-governance/land-resources-planning-toolbox/category/details/zh/c/1236440/ (accessed on 19 October 2022).
- Faizal, I.; Kristiadhi, F.; Nurrahman, Y.A.; Purba, N.P.; Prasetiya, F.S. Coral Reef Distribution around Bakauheni Sea-port, South Lampung, Indonesia. Akuatek 2020, 1, 94–103. [Google Scholar]
- Krisnafi, Y.; Hakim, M.R.; Prayitno, M.R.E.; Maturbongs, M.W. Penentuan Prioritas Pangkalan Utama Kapal Pengawas Perikanan Untuk Pencegahan Illegal Fishing Di WPP NRI-715. Mar. Fish. 2021, 12, 59–71. [Google Scholar] [CrossRef]
- Tri, H.M. Sahara Pengaruh Investasi terhadap Pertumbuhan Ekonomi Regional di Indonesia. J. Ekon. dan Kebijak. Pembang. Desember 2019, 8, 163–181. [Google Scholar] [CrossRef]
- Pujiastuti, R.R. Pemanfaatan transportasi laut untuk meningkatkan pertumbuhan sektor pariwisata. J. Saintek Marit. 2019, 19, 151–164. [Google Scholar]
- Kkp. Laporan Tahunan Kementrian Kelautan dan Perikanan; Kementrian Kelautan dan Perikanan: Jakarta, Indonesia, 2016; ISBN 9786025219504. [Google Scholar]
- Umamah, M.; Wisudo, S.H.; Wahyu, R.I. Pengelolaan sumberdaya udang yang berkelanjutan di laut aru dan arafura. ALBACORE J. Penelit. Perikan. Laut 2018, 1, 245–255. [Google Scholar] [CrossRef]
- Wahyudin, Y. Status Perikanan di Wilayah Pengelolaan Perikanan (WPP RI 571—Laut Andaman dan Selat Malaka) (Fisheries Status of Indonesian Fisheries Management Zone (WPP RI 571- Andaman Sea and Malacca Strait)). SSRN Electron. J. 2013, 5, 1–7. [Google Scholar] [CrossRef]
- Marpaung, B.S.M.; Sitanggang, E.P.; Masengi, K.W.A.; Kaparang, F.E.; Pamikiran, R.D.C.; Sitanggang, D.F.D.; Kalalo, F.F. Pelanggaran Kapal Perikanan di Wilayah Pengelolaan Perikanan Negara Republik Indonesia 571. J. ILMU DAN Teknol. Perikan. TANGKAP 2022, 7, 141. [Google Scholar] [CrossRef]
- Safitri, S.N.; Yustitianingtyas, L. Dampak Kerusakan Lingkungan Laut Akibat Penggunaan Jaring Trawl (Kasus: Penggunaan Jaring Trawl oleh Nelayan Jawa Timur di Perairan Lamongan dan Gresik). J. Huk. 2022, 2, 9–21. [Google Scholar]
- Lubis, M.S.N. Pengelolaan, Model Terluar, Pulau-pulau Kecil Pada, Berbasis Sistem, Pendekatan Sosioekonomi, Sistem Sistem. Ringkasan Desertasi 2014, 1, 1–74. [Google Scholar]
- Krisnafi, Y.; Iskandar, B.H.; Wisudo, S.H.; Haluan, J. Penentuan Prioritas Wilayah Kerja Untuk Peningkatan Pengawasan Perikanan di WPP NRI 711. Mar. Fish. 2017, 8, 211–221. [Google Scholar]
- Hermanto, D. Maximum Economic Yield Perikanan Tangkap (Studi Manajemen Perikanan Tangkap di WPPNRI 711). J. Fish. Mar. Res. 2018, 2, 17–24. [Google Scholar]
- Darma, A. Strategi Pengamanan ALKI-I dalam Penegakan Kedaulatan Hukum Laut Indonesia sebagai Poros Maritim Dunia. LITIGASI 2018, 19, 37–51. [Google Scholar] [CrossRef]
- Adhityatama, S.; Sulistyarto, P.H. Bukti langsung interaksi perdagangan di kepulauan riau: Studi pada situs arkeologi bawah air di pulau natuna dan pulau bintan. J. Segara 2018, 14, 127–135. [Google Scholar] [CrossRef] [Green Version]
- Fan, C.; Hsu, C.; Lin, J.; Kuan, Y.; Yang, C.; Liu, J.; Yeh, J. Taiwan’s legal framework for marine pollution control and responses to marine oil spills and its implementation on T. S. Taipei cargo shipwreck salvage. Mar. Pollut. Bull. 2018, 136, 84–91. [Google Scholar] [CrossRef] [PubMed]
- Zhang, B.; Matchinski, E.J.; Chen, B.; Ye, X.; Jing, L.; Lee, K. Marine Oil Spills—Oil Pollution, Sources and Effects, 2nd ed.; Elsevier Ltd.: Amsterdam, The Netherlands, 2019; ISBN 9780128050521. [Google Scholar]
- Vina, A.; Liu, J. Hidden roles of protected areas in the conservation of biodiversity and ecosystem services. Ecosphere 2017, 8, 1–16. [Google Scholar] [CrossRef] [Green Version]
- Liu, P.; Jiang, S.; Zhao, L.; Li, Y.; Zhang, P.; Zhang, L. What are the benefits of strictly protected nature reserves ? Rapid assessment of ecosystem service values in Wanglang Nature Reserve. Ecosyst. Serv. 2017, 26, 70–78. [Google Scholar] [CrossRef]
- Sannigrahi, S.; Chakraborti, S.; Kumar, P.; Keesstra, S. Ecosystem service value assessment of a natural reserve region for strengthening protection and conservation. J. Environ. Manag. 2019, 244, 208–227. [Google Scholar] [CrossRef]
- Dangeubun, F.D.W.; Wiryawan, B.; Mustaruddin; Purbayanto, A. Management effectiveness of southeast aru islands marine conservation area. J. Manaj. Hutan Trop. 2013, 19, 119–127. [Google Scholar] [CrossRef] [Green Version]
- Xu, W.; Xiao, Y.; Zhang, J.; Yang, W.; Zhang, L.; Hull, V.; Wang, Z.; Zheng, H.; Liu, J.; Polasky, S.; et al. Strengthening protected areas for biodiversity and ecosystem services in China. Proc. Natl. Acad. Sci. USA 2017, 114, 1601–1606. [Google Scholar] [CrossRef] [Green Version]
- Benetti, S.; Langemeyer, J. Ecosystem services and justice of protected areas: The case of Circeo National Park, Italy. Ecosyst. People 2021, 17, 411–431. [Google Scholar] [CrossRef] [PubMed]
- Townsend, M.; Davies, K.; Hanley, N.; Hewitt, J.E.; Lundquist, C.J.; Lohrer, A.M. The challenge of implementing the marine ecosystem service concept. Front. Mar. Sci. 2018, 5, 1–13. [Google Scholar] [CrossRef] [Green Version]
- Schuhmann, P.W.; Mahon, R. The valuation of marine ecosystem goods and services in the Caribbean: A literature review and framework for future valuation efforts. Ecosyst. Serv. 2015, 11, 56–66. [Google Scholar] [CrossRef]
- Schaafsma, M.; Turner, R.K. Valuation of Coastal and Marine Ecosystem Services: A Literature Review. In Coastal Zones Ecosystem Services: From Science to Values and Decision Making; Springer: Cham, Switzerland, 2015; pp. 103–125. [Google Scholar] [CrossRef]
- Milon, J.W.; Alvarez, S. The Elusive Quest for Valuation of Coastal and Marine Ecosystem Services. Water 2019, 11, 1518. [Google Scholar] [CrossRef] [Green Version]
- Steenbeek, J.; Buszowski, J.; Chagaris, D.; Christensen, V.; Coll, M.; Fulton, E.A.; Katsanevakis, S.; Lewis, K.A.; Mazaris, A.D.; Macias, D.; et al. Making spatial-temporal marine ecosystem modelling better—A perspective. Environ. Model. Softw. 2021, 145, 105209. [Google Scholar] [CrossRef] [PubMed]
- Carrasco De La Cruz, P.M. The Knowledge Status of Coastal and Marine Ecosystem Services—Challenges, Limitations and Lessons Learned From the Application of the Ecosystem Services Approach in Management. Front. Mar. Sci. 2021, 8, 1–28. [Google Scholar] [CrossRef]
- Furlan, E.; Torresan, S.; Critto, A.; Marcomini, A. Spatially explicit risk approach for multi-hazard assessment and management in marine environment: The case study of the Adriatic Sea. Sci. Total Environ. 2018, 618, 1008–1023. [Google Scholar] [CrossRef]
- Nugraha, A.H.; Tasabaramo, I.A.; Hernawan, U.E.; Rahmawati, S.; Putra, R.D.; Darus, R.F. Diversity, coverage, distribution and ecosystem services of seagrass in three small islands of northern Papua, Indonesia: Liki island, Meossu island and Befondi island. Biodiversitas 2021, 22, 5544–5549. [Google Scholar] [CrossRef]
- Tussadiah, A.; Sujiwo, A.S.; Andesta, I.; Daeli, W. Assessment of coastal ecosystem services and its condition for policy management plan in East Nusa Tenggara, Indonesia. Reg. Stud. Mar. Sci. 2021, 47, 101941. [Google Scholar] [CrossRef]
- Costanza, R.; D’Arge, R.; De Groot, R.; Farber, S.; Grasso, M.; Hannon, B.; Limburg, K.; Naeem, S.; O’Neill, R.V.; Paruelo, J.; et al. The value of the world’s ecosystem services and natural capital. Nature 1997, 387, 253–260. [Google Scholar] [CrossRef]
- Yao, X.; Li, G.; Xia, J.; Ben, J.; Cao, Q.; Zhao, L.; Ma, Y.; Zhang, L.; Zhu, D. Enabling the Big Earth Observation Data via Cloud Computing and DGGS: Opportunities and Challenges. Remote Sens. 2020, 12, 62. [Google Scholar] [CrossRef] [Green Version]
- Guerry, A.D.; Ruckelshaus, M.H.; Arkema, K.K.; Bernhardt, J.R.; Guannel, G.; Kim, C.K.; Marsik, M.; Papenfus, M.; Toft, J.E.; Verutes, G.; et al. Modeling benefits from nature: Using ecosystem services to inform coastal and marine spatial planning. Int. J. Biodivers. Sci. Ecosyst. Serv. Manag. 2012, 8, 107–121. [Google Scholar] [CrossRef] [Green Version]
- Kanah Arieska, P. Studi partisipasi stakeholder dalam penguatan status kawasan cagar alam pulau enu pulau karang kabupaten kepulauan aru. J Stat. J. Ilm. Teor. dan Apl. Stat. 2011, 3. [Google Scholar] [CrossRef]
- Mahabror, D.; Hidayat, J.J. Analisis Kerugian Ekonomi Akibat Illegal Fishing Di Zona Ekonomi Eksklusif Perairan Natuna. In Proceedings of the Prosiding Seminar Nasional Kelautan dan Perikanan IV, Tunjangan, Surabaya, 5 September 2018. [Google Scholar]
- Hsu, F.C.; Elvidge, C.D.; Baugh, K.; Zhizhin, M.; Ghosh, T.; Kroodsma, D.; Susanto, A.; Budy, W.; Riyanto, M.; Nurzeha, R.; et al. Cross-matching VIIRS boat detections with vessel monitoring system tracks in Indonesia. Remote Sens. 2019, 11, 995. [Google Scholar] [CrossRef] [Green Version]
- Joshi, R. Smart Ship Detection using Transfer Learning with ResNet. Int. Res. J. Eng. Technol. 2019, 6, 1870–1874. [Google Scholar]
- Truong, T.N.; Do Ngoc, T.; Quang, B.N.; Tran, S. Le Combining Multi-Threshold Saliency with Transfer Learning for Ship Detection and Information Extraction from Optical Satellite Images. In Proceedings of the Proceedings of IEEE 14th International Conference on Intelligent Systems and Knowledge Engineering, ISKE, Dalian, China, 14–16 November 2019. [Google Scholar]
- Heiselberg, H. Aircraft and ship velocity determination in sentinel-2 multispectral images. Sensors 2019, 19, 2873. [Google Scholar] [CrossRef] [Green Version]
- Kim, S.; Shin, J.; Ahn, J.; Kim, S. Extremely robust remote-target detection based on carbon dioxide-double spikes in midwave spectral imaging. Sensors 2020, 20, 2896. [Google Scholar] [CrossRef] [PubMed]
- Kamiński, Ł.; Kulawiak, M.; Cizmowski, W.; Chybicki, A.; Stepnowski, A.; Orłowski, A. Web-based GIS dedicated for marine environment surveillance and monitoring. In Proceedings of the OCEANS’09 IEEE Bremen: Balancing Technology with Future Needs, Bremen, Germany, 12 May 2009. [Google Scholar]
- Sprovieri, M.; Cucco, A.; Budillon, F.; Manta, D.S.; Trincardi, F.; Passaro, S. Large-Scale Mercury Dispersion at Sea: Modelling a Multi-Hazard Case Study from Augusta Bay (Central Mediterranean Sea). Int. J. Environ. Res. Public Health 2022, 19, 3956. [Google Scholar] [CrossRef] [PubMed]
- Visalli, M.E.; Best, B.D.; Cabral, R.B.; Cheung, W.W.L.; Clark, N.A.; Garilao, C.; Kaschner, K.; Kesner-Reyes, K.; Lam, V.W.Y.; Maxwell, S.M.; et al. Data-driven approach for highlighting priority areas for protection in marine areas beyond national jurisdiction. Mar. Policy 2020, 122, 103927. [Google Scholar] [CrossRef]
- Palacio, R.D.; Negret, P.J.; Velásquez-Tibatá, J.; Jacobson, A.P. A data-driven geospatial workflow to map species distributions for conservation assessments. Divers. Distrib. 2021, 27, 2559–2570. [Google Scholar] [CrossRef]
- Sakti, A.D.; Fauzi, A.I.; Takeuchi, W.; Pradhan, B.; Yarime, M.; Vega-Garcia, C.; Agustina, E.; Wibisono, D.; Anggraini, T.S.; Theodora, M.O.; et al. Spatial Prioritization for Wildfire Mitigation by Integrating Heterogeneous Spatial Data: A New Multi-Dimensional Approach for Tropical Rainforests. Remote Sens. 2022, 14, 543. [Google Scholar] [CrossRef]
- Estradivari; Agung, M.F.; Adhuri, D.S.; Ferse, S.C.A.; Sualia, I.; Andradi-Brown, D.A.; Campbell, S.J.; Iqbal, M.; Jonas, H.D.; Lazuardi, M.E.; et al. Marine conservation beyond MPAs: Towards the recognition of other effective area-based conservation measures (OECMs) in Indonesia. Mar. Policy 2022, 137, 104939. [Google Scholar] [CrossRef]
- Su, Q.; Li, Z.; Li, G.; Zhu, D.; Hu, P. Application of the coastal hazard wheel for coastal multi-hazard assessment and management in the Guang-Fong-Hongkong-Macao greater bay area. Sustainability 2021, 13, 12623. [Google Scholar] [CrossRef]


| No. | Ecosystem | Ecosystem Service Value USD/Ha/Year | Reference |
|---|---|---|---|
| 1 | Coral | 352,249 | [69] |
| 2 | Seagrass | 28,916 | [69] |
| 3 | Mangrove | 193,843 | [69] |
| 4 | Continental Shelf | 2222 | [69] |
| 5 | Intertidal | 12,078.21 | [70] |
| No. | Data Products | Data Information | Spatial Resolution | Data Format | Temporal Range | Reference |
|---|---|---|---|---|---|---|
| 1. | Global Mangrove Watch (GMW) | Mangroves | 25 m | Raster | 1996, 2007–2010, 2015–2020 | UNEP WCMC |
| 2. | Allen Coral Atlas (ACA) | Coral Reefs and Seagrass | 5 m | Raster | 2018–2020 | Arizona State University Center for Global Discovery and Conservation |
| 3. | Murray Global Intertidal (MGI) | Intertidal | 30 m | Raster | 1984–2017 | USGS/NASA |
| 4. | General Bathymetric Chart of the Oceans (GEBCO) | Continental Shelf | 500 m | Raster | 2019–2022 | UNESCO |
| 5. | VIIRS Boat Detection (VBD) | Vessels | 500 m | Raster | 2013–2018 | NOAA |
| 6. | World Database on Protected Areas (WDPA) | Marine Protected Areas | - | Vector | 2017–2030 | UNEP WCMC |
| No. | Protected Area | Potential Loss of MESV in Millions (USD) |
|---|---|---|
| 1 | KKPN Kepulauan Aru Bagian Tenggara | 23,525.729 |
| 2 | KKPD Kepulauan Derawan | 3,388.245 |
| 3 | KKPN Kepulauan Anambas | 333.773 |
| 4 | Ujung Kulon National Park | 306.487 |
| 5 | Kabupaten Bintan | 38.067 |
| 6 | Tanjung Puting National Park | 25.992 |
| 7 | KKPD Kabupaten Pangkajene Kepulauan | 8.233 |
| 8 | Pulau Sangalaki | 1.459 |
| 9 | Pulau Semama | 1.442 |
| 10 | Pulau Maratua-Karang Muaras | 1.439 |
| 11 | KKPD Kabupaten Serdang Bedagai | 0.347 |
| 12 | Baluran | 0.313 |
| 13 | Karang Gading dan Langkat Timur Laut | 0.043 |
| 14 | Pulau Nusa | 0.007 |
| No. | Protected Area | Status |
|---|---|---|
| 1 | KKPN Kepulauan Aru Bagian Tenggara | Over Exploitation and High-Risk Blue Carbon |
| 2 | KKPN Kepulauan Anambas | Low Productivity and Low-Risk Blue Carbon |
| 3 | KKPD Kepulauan Derawan | Under Exploitation and Sustainable Blue Carbon |
| 4 | Kabupaten Bintan | Under Exploitation and Low-Risk Blue Carbon |
| 5 | Tanjung Puting National Park | Over Exploitation and Medium Risk Blue Carbon |
| 6 | Ujung Kulon National Park | Under Exploitation and Sustainable Blue Carbon |
| 7 | KKPD Kabupaten Pangkajene Kepulauan | Under Exploitation and Sustainable Blue Carbon |
| 8 | Pulau Semama | Under Exploitation and Sustainable Blue Carbon |
| 9 | Pulau Sangalaki | Under Exploitation and Sustainable Blue Carbon |
| 10 | Pulau Maratua-Karang Muaras | Under Exploitation and Sustainable Blue Carbon |
| 11 | KKPD Kabupaten Serdang Bedagai | Over Exploitation and High-Risk Blue Carbon |
| 12 | Baluran | Under Exploitation and Sustainable Blue Carbon |
| 13 | Karang Gading dan Langkat Timur Laut | Sustainable Blue Carbon |
| 14 | Pulau Nusa | Under Exploitation and Low-Risk Blue Carbon |
Disclaimer/Publisher’s Note: The statements, opinions and data contained in all publications are solely those of the individual author(s) and contributor(s) and not of MDPI and/or the editor(s). MDPI and/or the editor(s) disclaim responsibility for any injury to people or property resulting from any ideas, methods, instructions or products referred to in the content. |
© 2023 by the authors. Licensee MDPI, Basel, Switzerland. This article is an open access article distributed under the terms and conditions of the Creative Commons Attribution (CC BY) license (https://creativecommons.org/licenses/by/4.0/).
Share and Cite
Fauzi, A.I.; Azizah, N.; Yati, E.; Atmojo, A.T.; Rohman, A.; Putra, R.; Rahadianto, M.A.E.; Ramadhanti, D.; Ardani, N.H.; Robbani, B.F.; et al. Potential Loss of Ecosystem Service Value Due to Vessel Activity Expansion in Indonesian Marine Protected Areas. ISPRS Int. J. Geo-Inf. 2023, 12, 75. https://doi.org/10.3390/ijgi12020075
Fauzi AI, Azizah N, Yati E, Atmojo AT, Rohman A, Putra R, Rahadianto MAE, Ramadhanti D, Ardani NH, Robbani BF, et al. Potential Loss of Ecosystem Service Value Due to Vessel Activity Expansion in Indonesian Marine Protected Areas. ISPRS International Journal of Geo-Information. 2023; 12(2):75. https://doi.org/10.3390/ijgi12020075
Chicago/Turabian StyleFauzi, Adam Irwansyah, Nur Azizah, Emi Yati, Aulia Try Atmojo, Arif Rohman, Raden Putra, Muhammad Ario Eko Rahadianto, Desi Ramadhanti, Nesya Hafiza Ardani, Balqis Falah Robbani, and et al. 2023. "Potential Loss of Ecosystem Service Value Due to Vessel Activity Expansion in Indonesian Marine Protected Areas" ISPRS International Journal of Geo-Information 12, no. 2: 75. https://doi.org/10.3390/ijgi12020075