Article

Assessment of Urban Resilience and Detection of Impact Factors Based on Spatial Autocorrelation Analysis and GeoDetector Model: A Case of Hunan Province

School of Resources and Safety Engineering, Central South University, Changsha 410083, China
*
Author to whom correspondence should be addressed.
ISPRS Int. J. Geo-Inf. 2023, 12(10), 391; https://doi.org/10.3390/ijgi12100391
Submission received: 26 July 2023 / Revised: 10 September 2023 / Accepted: 25 September 2023 / Published: 27 September 2023

Abstract

:
The rapid development of urbanization has led to increasing uncertainties related to urban safety risks, which has brought certain challenges to the sustainable development of cities. The concept of urban resilience has found a new way to improve the ability of a city to absorb and resolve risks. However, the existing literature on the evaluation of urban resilience is mostly developed from a static perspective, lacking a systematic and dynamic understanding of the level of urban resilience. Therefore, this paper takes Hunan Province as the research object, determines the resilience evaluation indicators, collects the data of each indicator by using the observation method and the literature method, then chooses the comprehensive index method and other methods to measure the urban resilience level of Hunan Province in the years of 2010–2021, and observes the dynamic changes in the resilience level. And, we use the GeoDetector model to detect the dominant factors affecting the urban resilience level and the interaction between these factors. The results of this study show that: (1) The level of urban resilience in Hunan Province shows a steady upward trend from 2010 to 2021, but cities with low resilience levels hold a dominant position. Among all subsystems, the level of urban economic resilience is the highest. (2) From 2010 to 2021, the level of urban resilience in Hunan Province indicates a stepwise spatial structure in the spatial pattern, gradually decreasing from east to west. (3) The urban resilience of Hunan Province from 2010 to 2021 has a significant spatial agglomeration effect, mainly manifested as “L-H type” agglomeration and “L-L type” agglomeration. (4) The spatio-temporal differentiation of urban resilience is mainly caused by economic and social factors, while ecological, institutional, and infrastructure factors have a relatively small influence on the level of urban resilience. The interaction of impact factors will have a more significant influence on urban resilience. The research results of this article are of great significance for urban resilience construction in Hunan Province and even the whole country.

1. Introduction

As early as 2007, the UN-Habitat proposed that mankind was about to enter the urban age, a period when the global urban population is greater than the rural population [1]. It is estimated that the urban population will account for nearly 70% of the global population by 2030, and nearly 75% of carbon emissions and energy consumption will also be concentrated in cities [2]. With the increasing expansion of urban functions and the growing complexity of urban systems [3], the ensuing issues of urban safety have become prominent. As a complex system integrating social, economic, ecological, and infrastructural aspects [4], cities are inevitably impacted by various risks such as natural disasters, climate change, and public emergencies [5]. As an important strategy to reduce urban risk, urban resilience has received increasing attention [6,7,8].
Resilience is perceived as a requirement for global and urban system sustainability, and there is a clear correlation between resilience and sustainability [9,10]. Cities, especially megacities with a high concentration of human activities, are the laboratories for resilience both in theory and practice [11]. For some developing countries, the rapid urbanization process makes cities more vulnerable to natural disasters, climate change, public emergencies, etc. [12,13]. It is also increasingly recognized that building resilient cities is key to achieving sustainable urban development and is an important manifestation of high-quality urban development. In 2002, the International Council for Sustainable Development proposed the topic of the “resilient city” to strengthen the research on safety resilience in the field of urban disaster prevention [14]. In 2013, the Rockefeller Foundation launched the 100 Resilient Cities Program, which aims to address uncertain risks by improving the resilience of cities to social, physical, and economic threats [12]. In China, scholars and policy makers are also gaining a clearer understanding of the role of resilience in urban development and construction. In November 2020, China’s 14th Five Year Plan was released, which, for the first time, proposed building “resilient cities”. In November 2021, Beijing issued the Guiding Opinions on Accelerating the Construction of Resilient Cities [15], which aims to enhance the comprehensive resilience of Beijing from the whole process of urban planning, construction, and management. The policy was issued with sustainable development as one of the objectives and is based on concepts related to urban resilience. To a certain extent, the implementation content of the policy is effectively in line with many aspects of each subsystem in the urban resilience measurement, such as economic resilience, ecological resilience, social resilience, etc., and constantly promotes the integration and development of each subsystem. On this basis, it also improves the regional risk avoidance and disaster prevention attention, so as to enhance the urban resilience of the city. At the same time, the development of urban resilience policies is a complex and evolving process, linked to urban governance systems, political pressures, the uncertainty and suddenness of threats, the speed of change, and the complexity of the long-term networks that shape cities. Moreover, many concepts of resilience may be used to develop relevant urban resilience policies [16]. The three urban development concepts of “sustainable urban development”, “eco-green city”, “healthy city”, and “sponge city”, have been gradually accepted and included in national urban development agendas. These efforts make the level of resilience in cities an issue that deserves further consideration. What is the level of resilience of cities? Are there spatial and temporal differences in resilience levels between regions? How did spatial and temporal differences evolve? What were the factors contributing to the spatial and temporal differences?
To sum up, most of the existing studies focus on different areas of the country and urban agglomerations, such as the Beijing-Tianjin-Hebei urban agglomeration, the Yangtze River Delta urban agglomeration, and the Pearl River Delta urban agglomeration, to explore the resilience level of urban agglomerations in regional sustainable development. However, there are not many resilience studies specific to the provincial level, and the dynamic studies of the level of urban resilience are not deep enough. Moreover, in the initial stage of urban resilience construction in China, analyses on the level of urban resilience and the influencing factors are not enough. As the largest province in central China, Hunan Province, a transitional zone between the eastern coastal region and the central and western regions, is the combination of the Yangtze River Open Economic Belt and the Coastal Open Economic Belt. It has the location characteristics of connecting the east to the west and connecting the south to the north. The study of urban resilience in Hunan Province will help promote the rise of the central region and strengthen the links between the east and west. Meanwhile, the city is a comprehensive and constantly evolving system. When cities face uncertain risks, their resilience levels exhibit spatial polarization and regional differences as they are influenced by factors such as the state of regional resource endowment and the foundation of development [17]. Therefore, in the context of accelerating the construction of resilient cities, a quantitative assessment of the level of urban resilience in Hunan Province is oriented to national strategic needs. It helps to enhance the sustainable development of Hunan Province and its neighboring regions and has important theoretical value and practical significance for the comprehensive promotion of urban resilience construction in China.
The research objectives of this paper include: (1) based on the urban resilience theory and from the perspective of dynamic evolution, we combine previous research results to construct a comprehensive evaluation index system of urban resilience with ecology, economy, society, institution, and infrastructure; (2) we collect data from each evaluation index and use the entropy weight method and comprehensive index evaluation method to measure the urban resilience level of 14 cities in Hunan Province from 2010 to 2021; (3) using ArcGIS 10.8 software and spatial autocorrelation models, including global spatial autocorrelation and local spatial autocorrelation, we explore the spatial and temporal evolution and spatial correlation characteristics of urban resilience levels in Hunan Province from 2010 to 2021; (4) we use the GeoDetector model to identify the dominant factors affecting the spatial pattern of urban resilience and the interactions between factors, which provides references for decision makers to better understand urban resilience and formulate refined strategies.
The organizational structure of this paper is as follows: Section 2 is a literature review. Section 3 introduces research methods such as data sources, construction of evaluation index, entropy weight method, comprehensive index evaluation method, the spatial autocorrelation model, and the GeoDetector model. Section 4 analyzes the results of urban resilience calculations, the evolution of spatial and temporal patterns, and the factors affecting urban resilience in Hunan Province. Section 5 discusses the findings of this paper. Section 6 provides the conclusions of this paper.

2. Literature Review

2.1. Study on the Definition of Resilience

The word resilience is derived from the Latin word “resilio”, which means “to spring back to its original state” [18]. With the deepening of the research, this concept has gone through the cognitive transformation of “Engineering resilience → Ecological resilience → Social-Ecological resilience (evolutionary resilience)”. The idea of engineering resilience was first proposed, which assumes that a system has only a single stable state and emphasizes the ability of the system to return to equilibrium after being affected by a disturbance, with no change in the structure and function of the system [19,20,21]. With the increasing understanding of systems and environments, Holling [22] introduced the concept of resilience into the ecological context in 1973, which is defined as “the amount of disturbance that a system can withstand before it shifts into an alternative stable state”. It emphasizes the maximum shock that a system can absorb before changing its structure and function [23]. In 1996, resilience was distinguished into engineering resilience and ecological resilience [24]. With the spread of resilience research to multidimensional fields, Adger [25] linked ecological resilience with social resilience, arguing that social system resilience is the ability of human society to withstand external disturbances. Then, Walker and Holling [26] and others took resilience as a core viewpoint of the Social-Ecological Systems framework, which, in turn, gave rise to the concept of evolutionary resilience. Evolutionary resilience indicates that a system adapts to frequent perturbations by continuously adjusting its own structure and developmental state. It emphasizes the system’s ability to self-organize, self-learn, and self-adapt in a constantly changing environment. Since then, this concept has been applied in different fields and disciplines, such as climate change and adaptation [23], urban planning [9,27], and disaster risk management [28,29].

2.2. Research on the Origin and Definition of Urban Resilience

Cities, as carriers of social systems, have naturally become the subject of resilience research. The concept of “urban resilience” was first proposed by the International Council for Sustainable Development in 2002. It refers to the ability of cities to withstand disasters, reduce disaster losses, and rationally deploy resources to quickly recover from disasters [14]. The United Nations Disaster Risk Reduction Agency (UNDRR) [30] defines safety resilience as the ability of a system, community, or society exposed to a disaster to resist in order to achieve and maintain an acceptable level of operation. The 2005 Hyogo Action Plan for Disaster Preparedness proposed to “strengthen the resilience of the country and communities to disasters” [31]. It can be seen that the early urban resilience agenda mainly emphasized resilience governance at the facility and environmental levels. Over time, urban resilience research has become more focused on synthesis, including the enhancement of cities’ learning and adaptive capacities. For example, the proposal of the Managing Risk and Enhancing Resilience [32] plan in London, UK; the 100 Resilient Cities Program [12] initiated by the Rockefeller Foundation; and so on. In China, the Beijing Municipality and Shanghai Municipality have emphasized the need to strengthen the city’s ability to cope with disasters and improve urban resilience in their latest urban master plans [33]. The 14th Five Year Plan, published in 2021, proposes the construction of livable, innovative, intelligent, green, humanistic, and resilient cities [34]. It can be seen that the study of urban resilience has become a highly concerned topic.
Because of the different knowledge and understanding of resilience in different fields, the definition of urban resilience is also different. Ecology researchers consider urban resilience to be the ability of urban systems to digest and absorb external disturbances, maintain their original structure, and sustain critical functions [35]. Researchers in urban planning studies consider urban resilience to be the ability of a system to achieve a normal operation of public safety, social order, and economic construction by reasonably buffering and responding to uncertain disturbances [36]. Researchers in the field of environment consider urban resilience as that, in order to sustain a certain dynamic regime, urban governance also needs to build a transformative capacity to face uncertainty and change [37,38]. Disaster researchers consider urban resilience as the ability of a system, community, or society exposed to disaster-causing factors to effectively resist, absorb, and withstand the impact of disasters in a timely manner, and recover from them [39]. In summary, all definitions emphasize that urban resilience should be self-resilient and self-learning, but with a different focus.

2.3. Evaluation Indicators and Methods for Resilient Cities
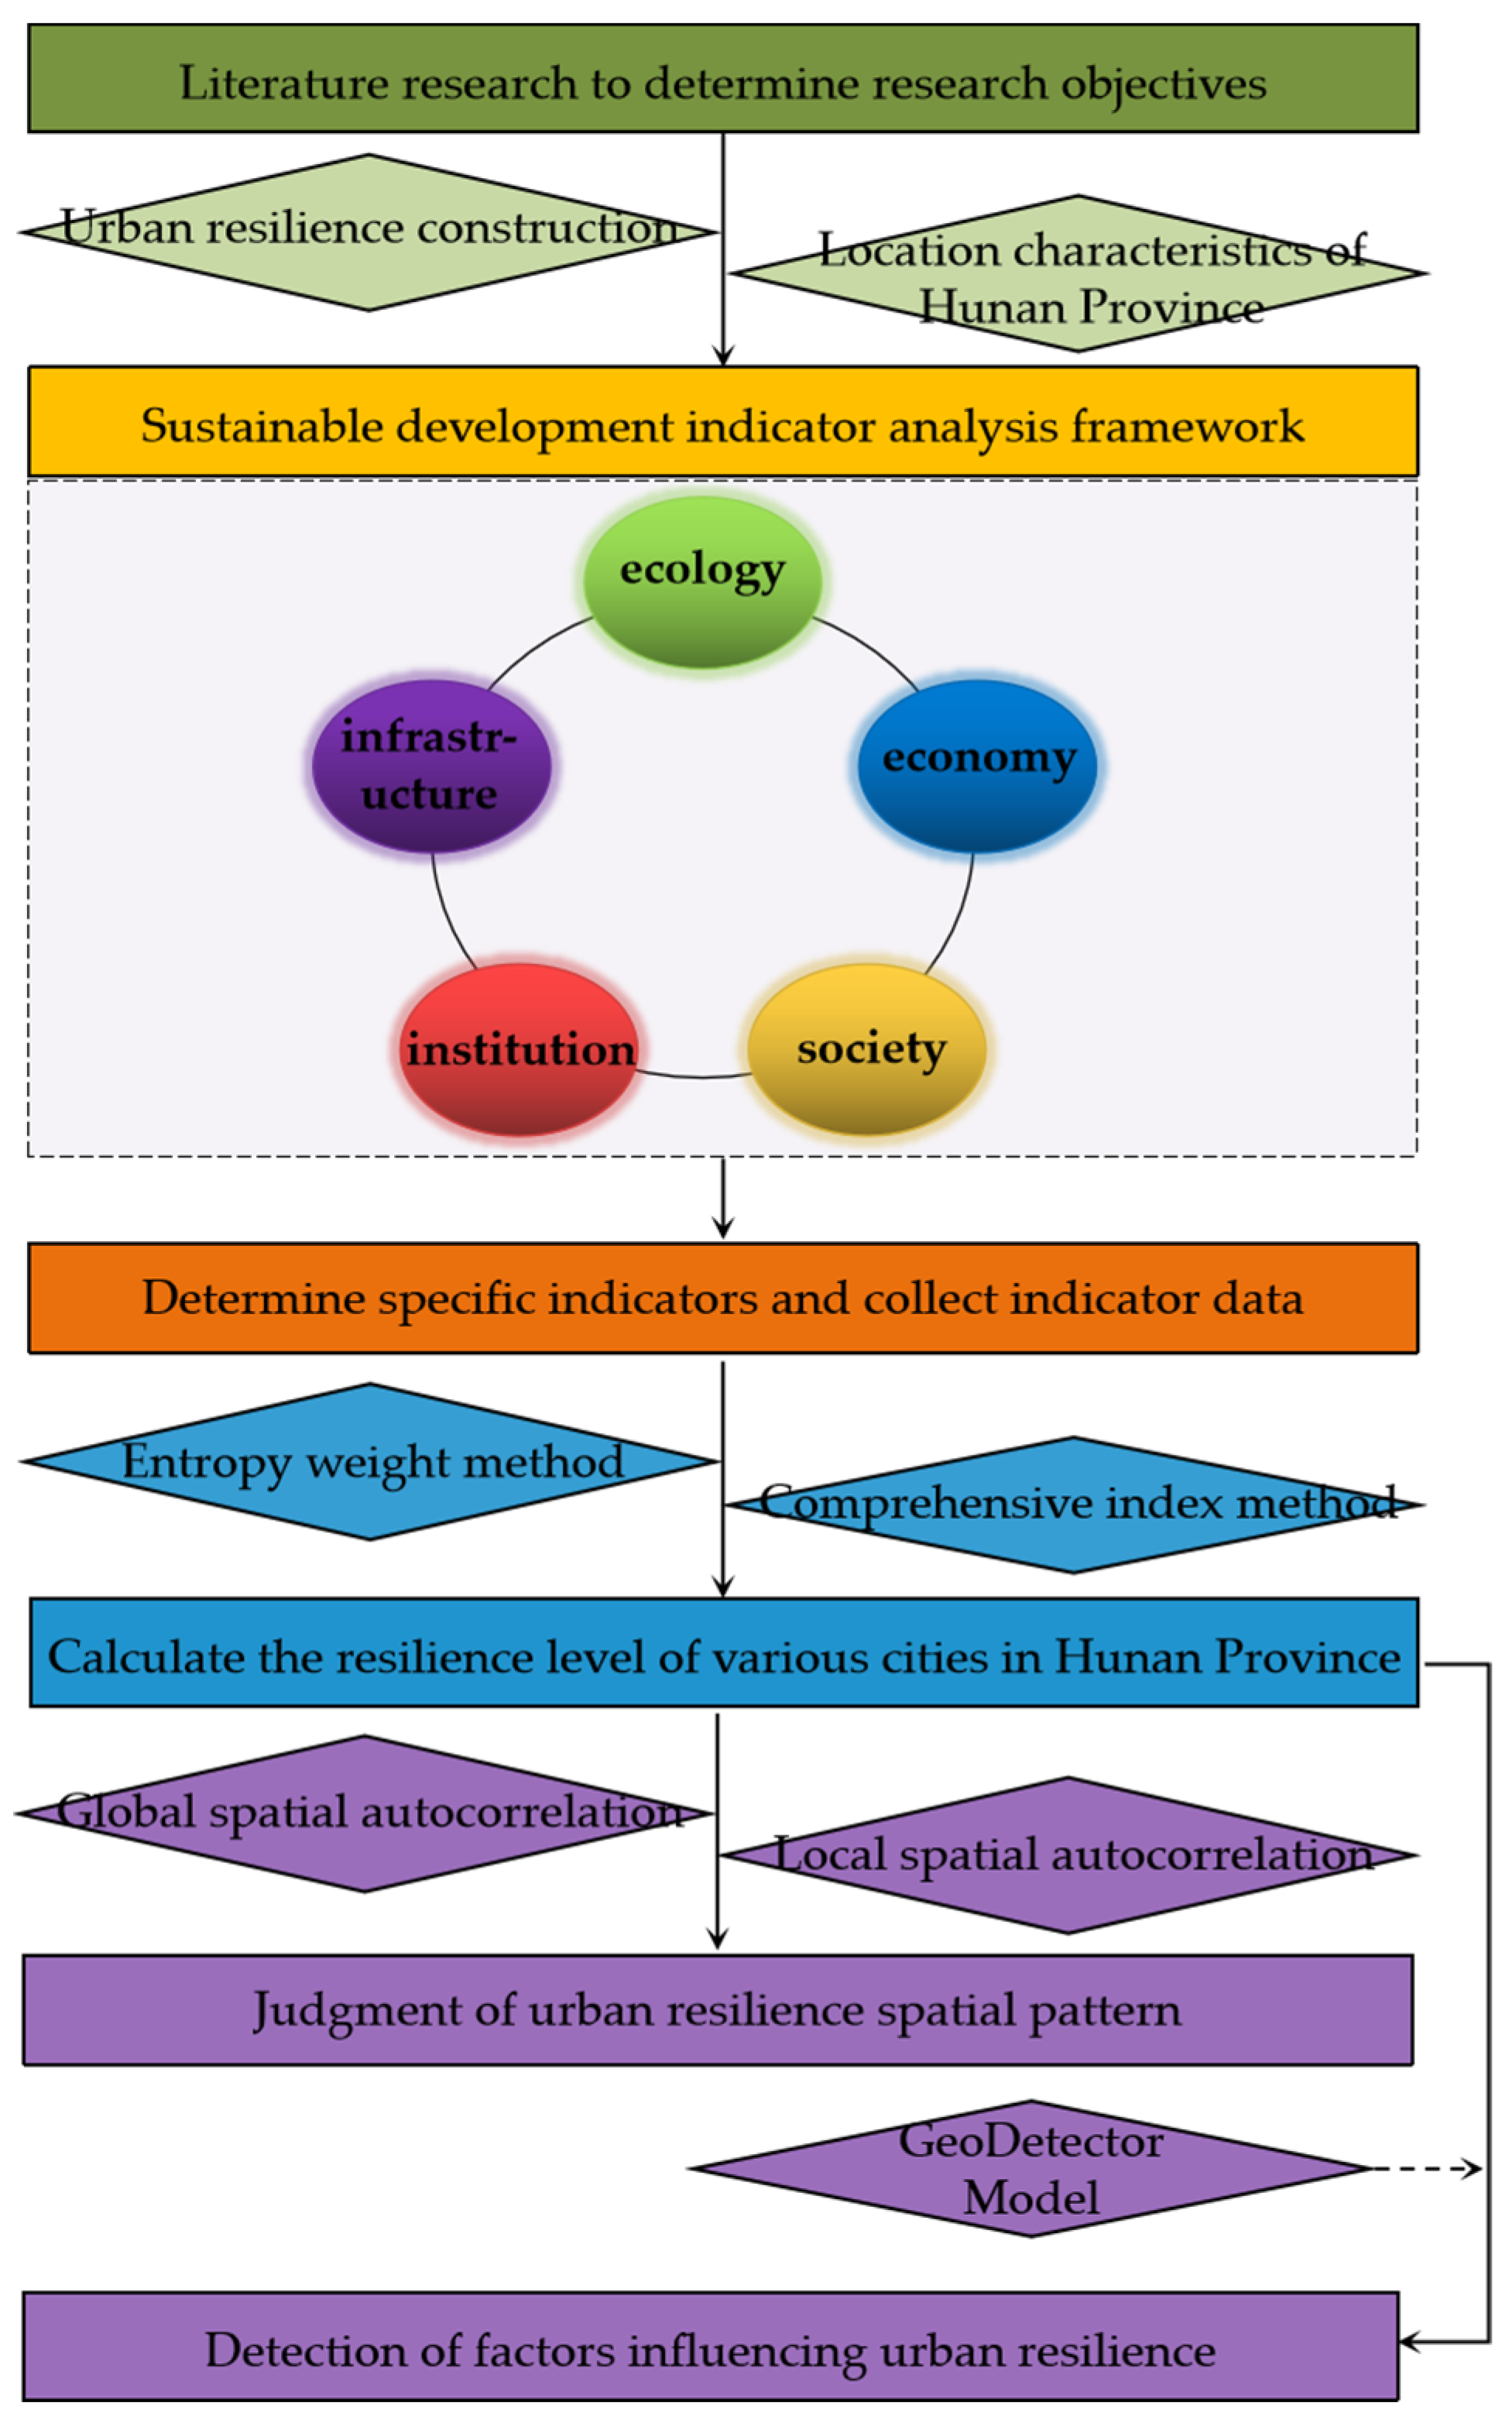
With the growing concern about urban resilience, scholars have conducted a lot of research on the evaluation of urban resilience. Urban development is a comprehensive process; in addition to political and economic factors, social capital also plays a crucial role. Social capital is the network of trust and cooperative relationships that people form in social interactions [40,41]. Mutual trust and cooperative relationships between people can effectively solve problems. For example, in the face of disasters, the existence of social capital can promote mutual help and cooperation among residents, which, in turn, helps to improve the resilience of the community as a whole. At the same time, the existence of social capital also promotes the effective allocation and utilization of resources. Resources can be shared or exchanged between groups. The flow of resource information will greatly enhance the flexibility and adaptability of society. Human capital is an economic concept opposite to “material capital”, which is the capital embodied in the workers, such as their knowledge and skills, cultural and technical level, and health condition. High-quality human capital has an abundant technological innovation capacity, which plays an important role in carrying out innovative and entrepreneurial activities, promoting the realization of industrial transformation, and enhancing the efficiency of urban construction after the impact [42].
Manyena [43] constructed a community disaster resilience indicator system including social capital, economic capital, physical capital, human capital, and natural capital. Hudec et al. [44] evaluated the differences in urban resilience under financial crises from three dimensions: economy, society, and community management ability. Xu et al. [45] constructed evaluation indicators including infrastructure, economy, society, and organization from the perspective of disaster prevention. Cutter [46] proposed to establish a community resilience index system from the perspective of ecology, society, economy, institution, infrastructure [17,47], and community competence. Joerin et al. [48] constructed an evaluation index system for urban community resilience from five dimensions: infrastructure, society, economy, institutions, and nature. Yang et al. [49] used the BRIC measurement model [46] to evaluate the differences in community resilience in response to public health risks in Guangzhou from five dimensions: natural environment, built environment, social capital, economic capital, and government system. Karunarathne et al. [50] studied the impact of social support network legacies on urban informal livelihoods and revealed the importance of social support network legacies in improving urban resilience.
Commonly used urban resilience evaluation methods by scholars include the entropy method and the comprehensive index evaluation method [5,17,51], the system dynamics model [11,52], network resilience evaluation [53], the resilience maturity model [54], and the graph overlay method [12]. The Spatial Econometric Model [55,56], the geographically weighted regression model [57], and the GeoDetector model [58,59] have been used to explore the impact factors affecting urban resilience. In addition, a large number of studies have been conducted at the unit scale of cities, including the national regions [17,60], urban agglomeration regions [47,61], and provincial and municipal regions [51,62,63].
In summary, although academic research on urban resilience has made great progress, how to systematically and dynamically recognize urban resilience is still an important issue. As the largest province in central China, Hunan Province is a transitional zone between the eastern coastal region and the central and western regions, and a combination of the Yangtze River Open Economic Belt and the Coastal Open Economic Belt. In the new development process, its strategic position cannot be ignored. The assessment of the level of urban resilience in Hunan Province and the exploration of the driving factors behind it can provide a certain cognitive foundation and scientific basis for the formulation of urban development policies in China.

3. Data and Methods

A research framework is developed in this study to achieve the research objectives, as shown in Figure 1. First, based on the urban resilience indicators, the entropy weight method and the comprehensive index method are utilized to calculate the level of urban resilience in Hunan Province. Second, the spatial autocorrelation method is used to analyze the spatial pattern and differences of urban resilience in Hunan Province. Finally, we use the GeoDetector model to detect the impact factors affecting the urban resilience level and the relationship between them.

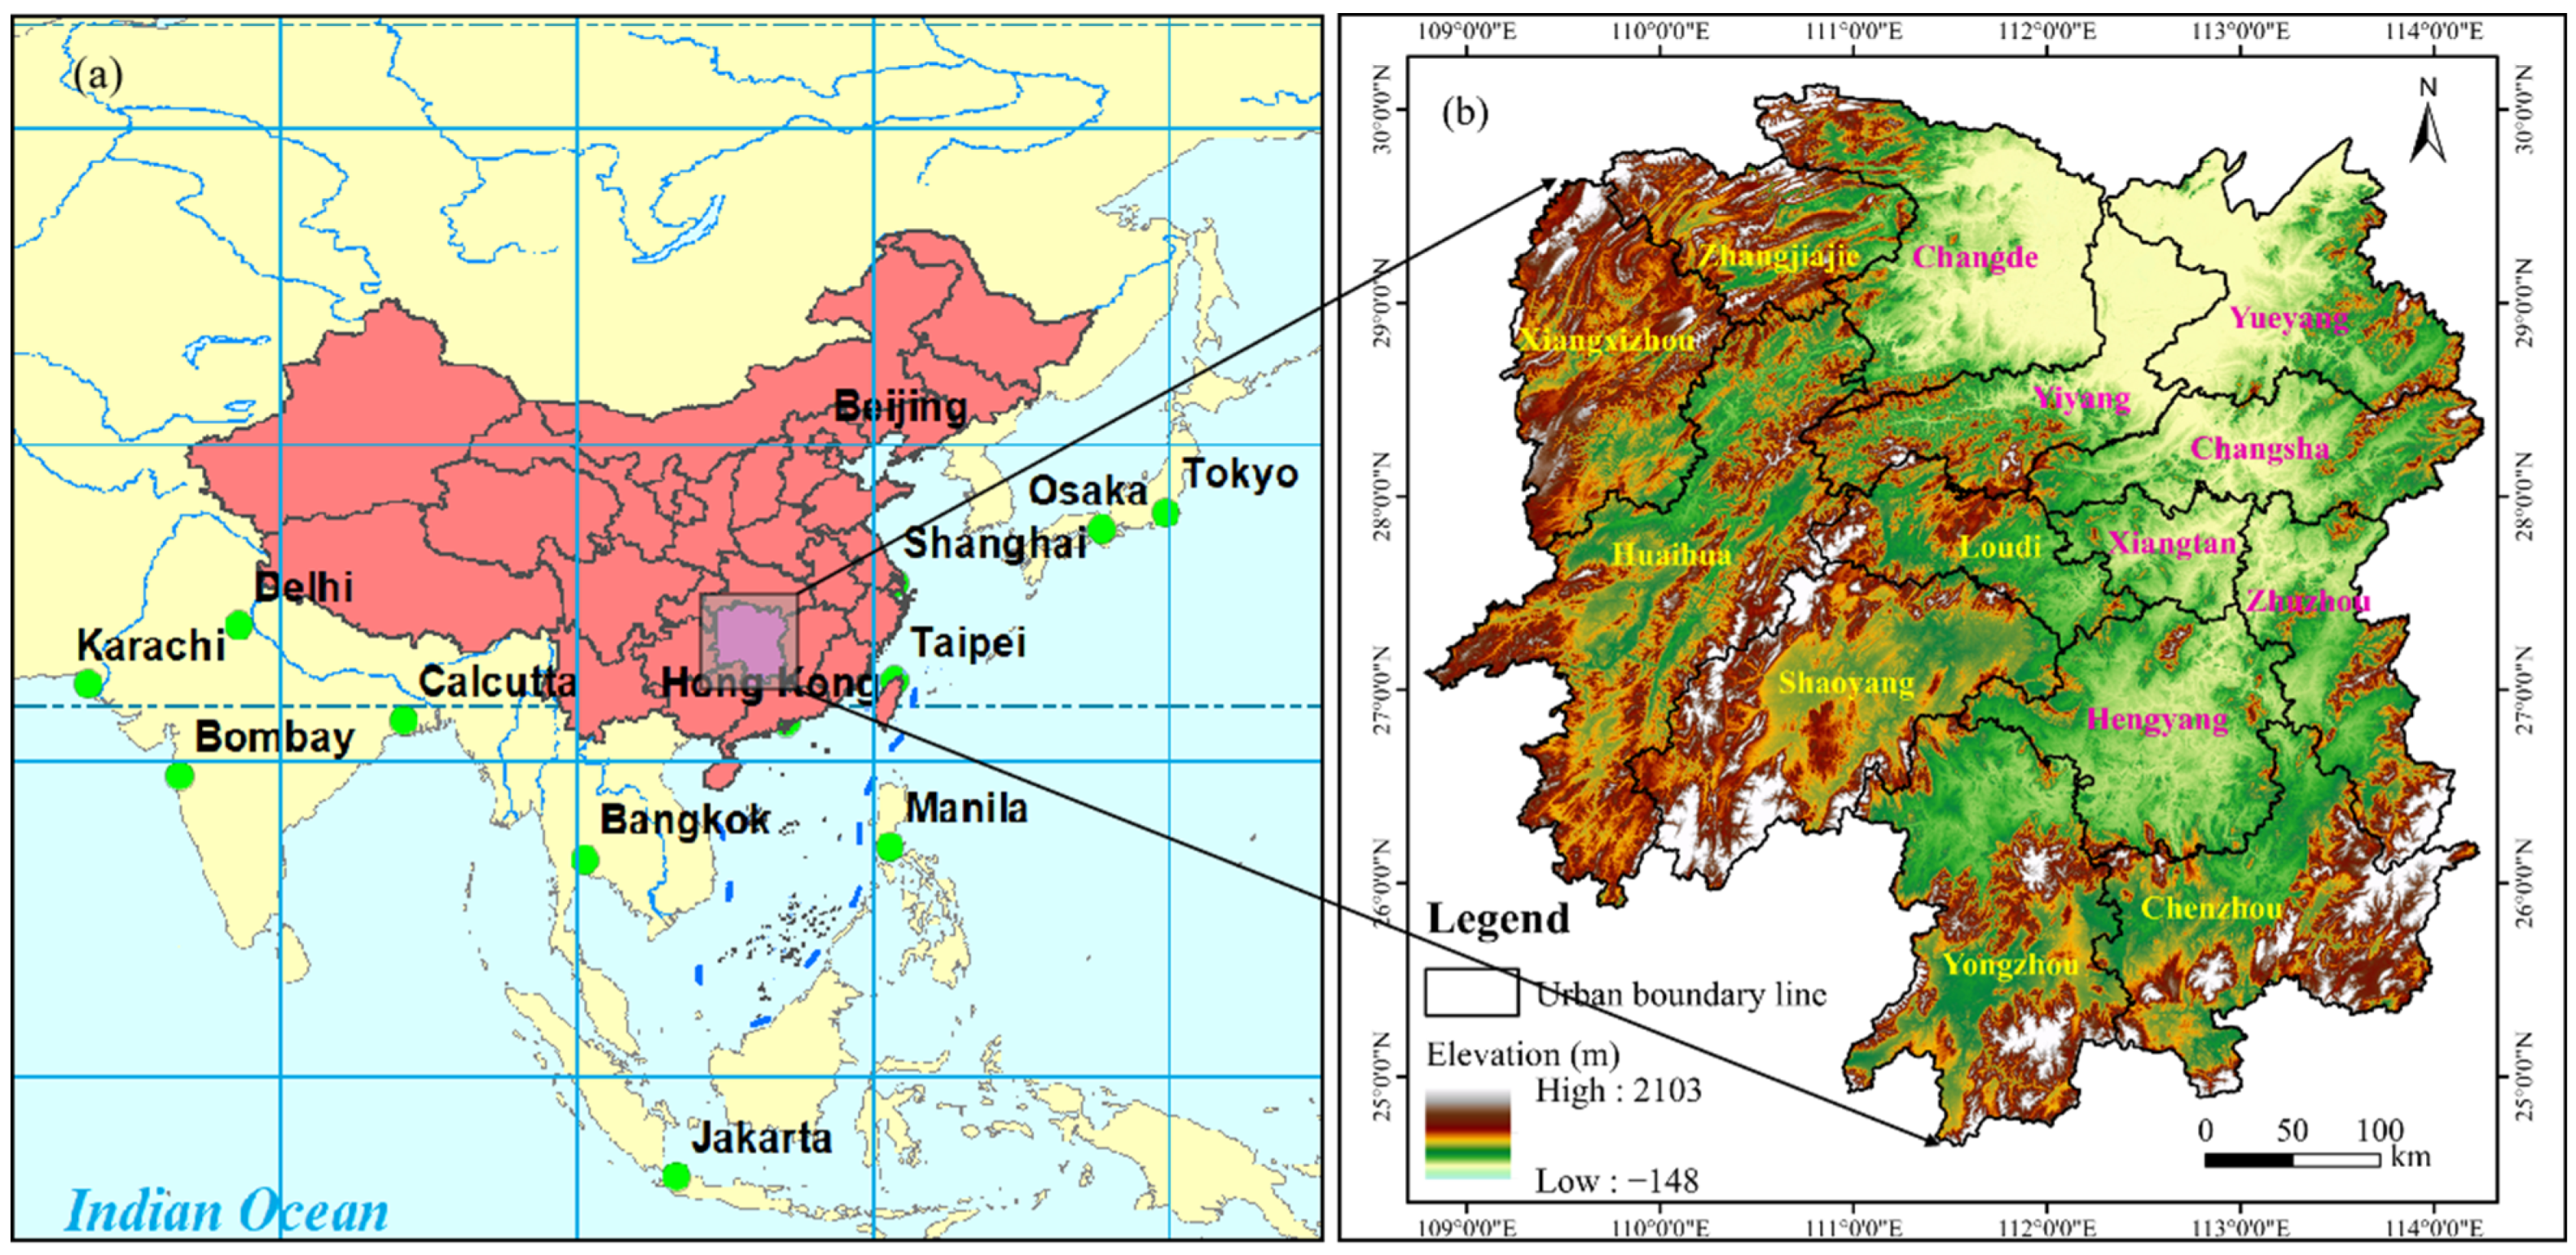
3.1. Study Area and Data Sources

Hunan Province is located in the central part of China and the middle reaches of the Yangtze River, at longitude 108°47′~114°15′ east and latitude 24°38′~30°08′ north. It is adjacent to Jiangxi in the east, Guangdong and Guangxi in the south, Guizhou and Chongqing in the west, and Hubei in the north. There are 14 cities in total, with a total area of 21,800 square kilometers, accounting for 2.2% of the national land area, ranking first in central China, as shown in Figure 2. In 2022, the ending permanent population of Hunan Province was 66.04 million, and the regional GDP was 4,867,037 billion yuan, accounting for 4.02% of the national economic aggregate [64]. Meanwhile, Hunan Province has a dense network of rivers and well-developed water systems, with 5341 rivers over 5 km in length. Dongting Lake is the second largest freshwater lake in China, and four major water systems, including the Xiangjiang River, Zishui River, Yuan River and Li River, cover the province. In addition, Hunan Province is a high incidence area of droughts, floods, and geologic disasters. In 2019, there were 19 floods and 8 hailstorms in the province. All kinds of natural disasters caused 11.52 million people in the province to be affected, with 33 deaths and direct economic losses of more than 24.26 billion yuan [65]. This paper will take 14 cities in Hunan Province as the research object to carry out this study on urban resilience.
The data used in this study are mainly from the “Hunan Provincial Statistical Yearbook”, “China Urban Statistical Yearbook”, “China Population Yearbook”, “China Population and Employment Statistical Yearbook”, “China Environmental Statistical Yearbook”, statistical yearbooks of cities in Hunan Province, and statistical bulletins of national economic and social development of each city. Among them, PM2.5 data come from the Atmospheric Composition Analysis Group of Dalhousie University, Canada (http://fizz.phys.dal.ca/~atmos/martin/?page_id=140, accessed on 15 June 2022). Some data on sulfur dioxide emissions per square kilometer come from the Department of Ecology and Environment of Hunan Province (http://sthjt.hunan.gov.cn/sthjt/xxgk/zdly/hjjc/index.html, accessed on 19 June 2022). Total factor productivity data come from Mark Data (https://www.macrodatas.cn/, accessed on 25 April 2023). Total city science and technology innovation scores come from the China City Science and Technology Innovation Index Report. The vector data of the administrative division of each city in Hunan Province come from the 1:1,000,000 Chinese basic geographic information database provided by the National Catalogue Service For Geographic Information (https://www.webmap.cn/commres.do?method=result100W, accessed on 20 June 2023). GDEMV2 30M resolution digital elevation data come from the Geospatial Data Cloud platform of the Computer Network Information Center of the Chinese Academy of Sciences (https://www.gscloud.cn/search, accessed on 20 June 2023). Due to objective factors such as differences in statistical capacity each year and adjustments in administrative divisions, partial statistical data are missing and missing data are calculated through interpolation.

3.2. Construction of Urban Resilience Evaluation Indicators

When studying a complex and huge system, we can not quickly and accurately discover the various factors in the system and sort the relationship between the factors; as such, the system decomposition method solves this problem. The system is decomposed into several subsystems according to certain principles, and the complexity of the function and structure of each subsystem after decomposition is greatly reduced compared with the whole system. In 2001, the United Nations Commission on Sustainable Development also constructed a common analytical framework of sustainable development indicators to evaluate the progress of governments in achieving sustainable development goals, which consists of four major systems: social, economic, ecological, and infrastructure. In the process of comprehensively evaluating urban resilience, the research perspectives are different and the dimensions of evaluation appear to vary greatly on the surface but, when implemented into specific indicators, they are still centered on the ecological, economic, social, institutional, and infrastructural aspects. In other words, the development of a city can not be separated from people. A society composed of people needs an economy as the foundation. The realization of a series of clothes, food, housing, and transportation can not be separated from infrastructure. The desire for a better life needs to live in harmony with nature, sharing a good ecosystem. However, it should be noted that in the process of sustainable urban development, different countries adopt different standards in ecological, economic, institutional, and other aspects; so, the evaluation indicators of urban resilience can not be directly copied from others. Before determining the specific indicators, we have the following considerations: (1) The selected indicators should be able to reflect and fully cover the connotation and extension of urban resilience. As stated above, ecological, economic, social, institutional, and infrastructural aspects constitute a complete urban resilience and are both interrelated and independent of each other. (2) Combined with the general direction of China’s current urban construction, the evaluation dimensions of urban resilience based on the framework of ecology, economy, society, institution, and infrastructure are also in line with the current policy orientation of China’s urbanization construction. Therefore, relevant indicators are selected in five subsystems of ecology, economy, society, institution, and infrastructure. The evaluation system is constructed by selecting the characterizing elements for each indicator and, finally, 43 indicators are obtained, as shown in Table 1.
The ecological environment is the foundation of urban resilience construction. Urban green ecological environment is the first productive force in the urban ecosystem. The green coverage rate in built-up areas, per capita green area, and park green area are selected to represent the urban green ecological environment. urban green ecological environment can absorb or remove substances such as CO2 and particulate matter. Urban green ecological environment can help to alleviate environmental pollution and urban heat island effect, and, at the same time, it can effectively reduce the risk of flooding and other meteorological disasters [49]. Furthermore, it can improve the quality of the human habitat [66]. The average annual precipitation is an important indicator to reflect the climate characteristics of a region, and it is also an important cause of flood disasters [67,68]. PM2.5 pollutant concentration and industrial sulfur dioxide emissions per square kilometer are selected to characterize the degree of air pollution. These pollutants affect the health of residents and cause a decrease in air visibility due to the scattering and absorption of light by the particulate matter itself. In terms of environmental governance, the sewage treatment rate and the comprehensive utilization rate of industrial solid waste are selected to analyze the governance of water and soil pollution.
Economic development is the key to building resilient cities. Economic development is closely related to building the resilience of cities. The per capita GDP and balance of savings balances of urban and rural residents can indicate that urban residents have some economic basis to support them to bear part of the losses caused when facing risks. Local fiscal revenue directly reflects the level of local economic development and financial management. The urban registered unemployed population is intended to measure idle labor capacity and is one of the main indicators of a region’s economic situation. The urbanization level is generally characterized by the proportion of urban population to total population. The higher the urbanization level, the stronger the urban resilience [69]. Industrial transformation is an important part of the economic growth process and has long been an internal driver of economic growth and the achievement of sustainable development. Total factor productivity is used to measure the role of pure technological progress in production. The proportion of tertiary sector of the economy in GDP is used to characterize the degree of structural change in the driving factors of economic growth. Internationally, the scale and intensity of research and development activities are usually used to reflect a country’s scientific and technological strength and core competitiveness. The city’s total score of urban scientific and technological innovation characterizes the city’s level of scientific and technological innovation, which covers both basic-oriented scientific research and application-oriented industrial innovation. The economic foundation provides financial support for urban resilience construction. Insufficient economic foundation can trigger resource tendency and the social deprivation phenomenon, which affects urban development. Therefore, the GDP of the secondary industry of the economy and GDP of tertiary industry of the economy are selected to characterize the economic base.
Social factors are at the core of urban resilience construction. The per capita disposable income of rural residents can be used to measure people’s living standards and purchasing power. The average annual salary of on-the-job employees is an important part of the production costs of enterprises and an important element in the study of income disparity among employees. Population density reflects the sparseness of population distribution in a region and reflects the residential density of groups. The proportion of social security and employment in fiscal expenditure, number of college students per 10,000 people, and medical insurance coverage rate reflect the degree of social security in a region in terms of government finance, education, and medical care, respectively. The proportion of employees of the tertiary industry of the economy reflects changes in the demographic structure of society. The population of public management and social organizations can be regarded as the link between residents and the government, which can promote mutual trust and support between the government and residents, and also increase social integration. Engel’s coefficient for all residents indicates the proportion of residents’ food consumption expenditure to total consumption expenditure, which is an indicator of the residents’ living standard.
Institutional factors determine the development direction of urban resilience construction. The unique political system in China and government-led urban development pattern [70] make government organizations play a leading and dominant role in urban development. The per capita financial expenditure is an important indicator reflecting the government’s financial system, including the structure of financial expenditure and the degree of marketization. The input level of general public service and the number of government agencies, enterprises, and public institutions can reflect the basic public functions of the government, as well as the production and supply system of public services. The level of health organization, which involves health organization relationships, health management relationships, and health development and service relationships, can reflect a city’s ability to cope with risk [26].
The per capita road area and the comprehensive capacity of the highway network can measure the traffic accessibility and adaptability of a city. This determines the emergency traffic handling capacity and plays an important role in post-disaster evacuation and material entry. Because of their fixed routes, public transportation vehicles can effectively disperse the flow of private cars and cabs and slow down traffic congestion. In the event of emergencies, public transportation vehicles can also be used as emergency rescue vehicles to quickly evacuate the affected population and provide medical assistance and living materials in a timely manner. On the one hand, the density of drainage pipelines reflects the efficiency of urban sewage discharge; on the other hand, it also reflects the protection and resistance ability to deal with flood disasters. The per capita daily water consumption reflects the amount of water used by residents and the water reserves of the area. Urban gas is an important part of urban energy structure and urban infrastructure. The use of gas is of great significance to improve the quality of life of urban residents, improve the urban environment, and increase the utilization rate of energy. Therefore, the gas penetration rate is chosen to characterize this. The number of mobile phone users and the number of fixed internet users are selected to reflect the communication capacity at a critical moment. Public health facilities, especially public toilets, not only address the physiological needs of residents in their daily lives but also help them to take refuge in case of emergency, which is a manifestation of urban civilization.

3.3. Calculation Model for Urban Resilience

3.3.1. Entropy Weight Method to Determine the Weights

As this study involves the measurement of the urban resilience index in multiple geographic regions and years, it includes a large amount of objective data and diversified [74] comprehensive indicators. Due to the subjectivity of methods such as the Delphi method and AHP in the process of determining weights [75], at the same time, too many indicators will bring duplicity of attributes. In this paper, the entropy weight method is firstly utilized to calculate the weight of each indicator.
The entropy weight method is a kind of objective weight assignment method. The idea is to calculate the entropy value based on the characteristics of entropy, and then to judge the size of the variability of a certain indicator [76]. The smaller the information entropy of a certain indicator, the greater the degree of variation in the indicator, the more information it provides, and the greater its impact on comprehensive evaluation [17,75]. On the contrary, the smaller the information entropy of a certain indicator, the smaller its degree of variation, and the smaller its impact on comprehensive evaluation. The specific calculation steps are as follows:
(1)
Data standardization
Because there are many evaluation indicators and each indicator has different dimensions and orders of magnitude, to eliminate the differences between them, the extreme value standardization method is used for the dimensionless processing of the original data:
Positive indicators [17]:
X t i j = X t i j min ( X t i j ) max ( X t i j ) min ( X t i j ) .
Negative indicator [17]:
X t i j = max ( X t i j ) X t i j max ( X t i j ) min ( X t i j ) .
Moderate indicators [17]:
X t i j = { 2 ( X 0 X t i j ) / ( max ( X t i j ) min ( X t i j ) ) , min ( X t i j ) < X t i j < X 0 0 , X t i j < X 0 2 ( X t i j X 0 ) / ( max ( X t i j ) min ( X t i j ) ) , X 0 < X t i j < max ( X t i j ) .
In these formulas, X t i j and X t i j , respectively, represent the original value and standardized value of the j-th indicator of the i-th city in year t. X 0 is the moderate value of the indicator. max ( X t i j ) and min ( X t i j ) are the maximum and minimum values of the j-th indicator for the i-th city in year t, respectively. In this study, the number of years T, the number of cities I, and the number of indicators J are 12, 14, and 43, respectively.
(2)
Normalization of indicators [17]
P t i j = X t i j t T i I X t i j .
(3)
Calculate weight
  • Calculate the entropy value of the j-th indicator [17]:
    E j = 1 ln ( T × I ) t = 1 T i = 1 I P t i j ln P t i j ,
    where, at that time P t i j = 0 , let P t i j ln P t i j = 0 .
  • Calculate the coefficient of difference for the j-th indicator [17]:
    G j = 1 E j .
  • Calculate the weights of various indicators [17]:
    W j = G j j = 1 J G j .
The weights of the indicators are shown in Table 1.

3.3.2. Comprehensive Index Evaluation Method

Based on the weights of indicators obtained by the entropy weighting method, the comprehensive index evaluation method is used to calculate the urban resilience index of each city [17]:
C t i = j = 1 J W j × X t i j ,
where C t i denotes the urban resilience index of the i-th city in year t.
The larger the urban resilience index in the same time interval, the higher the level of urban resilience.

3.4. Methods for Determining Spatial Patterns of Urban Resilience

A spatial autocorrelation analysis is the calculation of correlations existing between the spatial locations of study units using inferential statistics. In this way, it is used to determine the distribution characteristics of a particular unit in a geographic space and the degree of its influence on its neighbors. According to the function, it can be divided into two categories: global spatial autocorrelation and local spatial autocorrelation.

3.4.1. Global Spatial Autocorrelation

A global spatial autocorrelation analysis is used to describe the overall distribution of a certain geographical phenomenon and judge whether the phenomenon has agglomeration characteristics in space. But, it cannot pinpoint in which areas the agglomeration occurs [77]. In this paper, the Global Moran’s I (GMI) is selected as a global spatial autocorrelation statistic, and its value range is [−1, 1]. When GMI > 0 and p < 0.05, it indicates that the phenomenon is positively correlated in space. The closer the GMI is to 1 indicates that the phenomenon presents a more obvious agglomeration effect in spatial distribution. When GMI < 0 and p < 0.05, it indicates a negative correlation. The closer the GMI is to −1 indicates that the phenomenon presents a greater variability in spatial distribution. When GMI is equal to zero or close to zero, it indicates that this phenomenon is randomly distributed in space [78]. GMI is calculated by the formula:
G M I = n i n j n w i j ( x i x ¯ ) ( x j x ¯ ) ( i n j n w i j ) i = 1 n ( x i x ¯ ) 2 .
In the formula, n is the number of cities. x i and x j are the resilience indices of unit i and unit j, respectively. x ¯ is the average value of the resilience indices. w i j represents the degree of interaction between unit i and unit j. ( x i x ¯ ) ( x j x ¯ ) describes the similarity of the resilience levels.
The significance of the spatial autocorrelation model is usually tested using the Z statistical detection method [79].
Z ( I ) = I E ( I ) V a r ( I ) .
Z(I) is the Z-test value and Var(I) is the coefficient of variation.

3.4.2. Local Spatial Autocorrelation

As mentioned in the previous section, a global spatial autocorrelation analysis cannot pinpoint exactly where the phenomenon we want to study is agglomerative. It is also unable to characterize the spatial agglomerate characteristics of research units. In contrast, a local spatial autocorrelation analysis is used to reveal the similarity or correlation between the attribute eigen values of the study unit and its neighboring units [17]. It can characterize the degree of influence of the study unit on the spatial autocorrelation of the whole study area. It is usually expressed by the Local Moran’s I of the Local Indicators of Spatial Association [80]. The calculation formula is:
I i = [ ( x i x ¯ ) S i 2 ] j = 1 , j 1 n w i j ( x j x ¯ ) ,
where x i and x j are the resilience indices of unit i and unit j, respectively. S i 2 denotes the variance of x i . w i j denotes the spatial weight matrix.

3.5. Methods for Analyzing the Impact Factors of Urban Resilience

The GeoDetector model, as a statistical method for detecting spatial heterogeneity and revealing the driving factors [81], has gradually been applied in the research in related fields such as socio-economic, ecological environment, and human health [81,82,83]. Factor detection can better express whether a certain impact factor is the cause of the similarity or difference in the spatial distribution of an indicator value. Interaction detection is used to identify the interaction between different impact factors [81]. It can detect whether the combined effect of two different factors will enhance or weaken the influence on the spatial pattern of urban resilience, or detect whether the impact of two factors on it is independent [81]. A factor detector can detect whether each potential impact factor is the impact factor of urban resilience level, and it is measured by q-value. The interaction detector illustrates the strength and type of interaction by calculating the q-value (q(X1∩X2)) of their interaction and comparing q(X1) and q(X2) with q(X1∩X2). The classification of the relationship between the two factors is shown in Table 2. The q value is calculated as follows:
q = 1 1 N σ 2 m = 1 n N m σ m 2 .
n is the strata of variable Y or factor X, i.e., classification or partitioning. N is the number of sample units in the whole region. Nm denotes the number of units in stratum m (m = 1, 2, …, n). σ 2 and σ m 2 denote the discrete variance of the Y values for layer m and the whole region, respectively. The value of q ranges from [0, 1]. The closer the q value is to 1, the greater the impact of zoning factors on the urban resilience level and the stronger the explanatory power for its spatial differentiation.

4. Results and Analysis

4.1. Time Differentiation

4.1.1. Comprehensive Resilience Level

The urban resilience indexes of 14 cities in Hunan Province are obtained through the method in Section 3.3, as shown in Table 3. From 2010 to 2021, the resilience levels of 14 cities indicate a steady rise in general. The mean value of the urban resilience level also shows a steady upward trend in general in Figure 3. It rises steadily from 0.1824 in 2010 to 0.3708 in 2021, but shows a slight decline in 2012. This is because the urban resilience levels of Shaoyang, Changde, Zhangjiajie, Yongzhou, Huaihua, Loudi, and Xiangxi have declined, with ecological resilience and economic resilience playing a more obvious role.

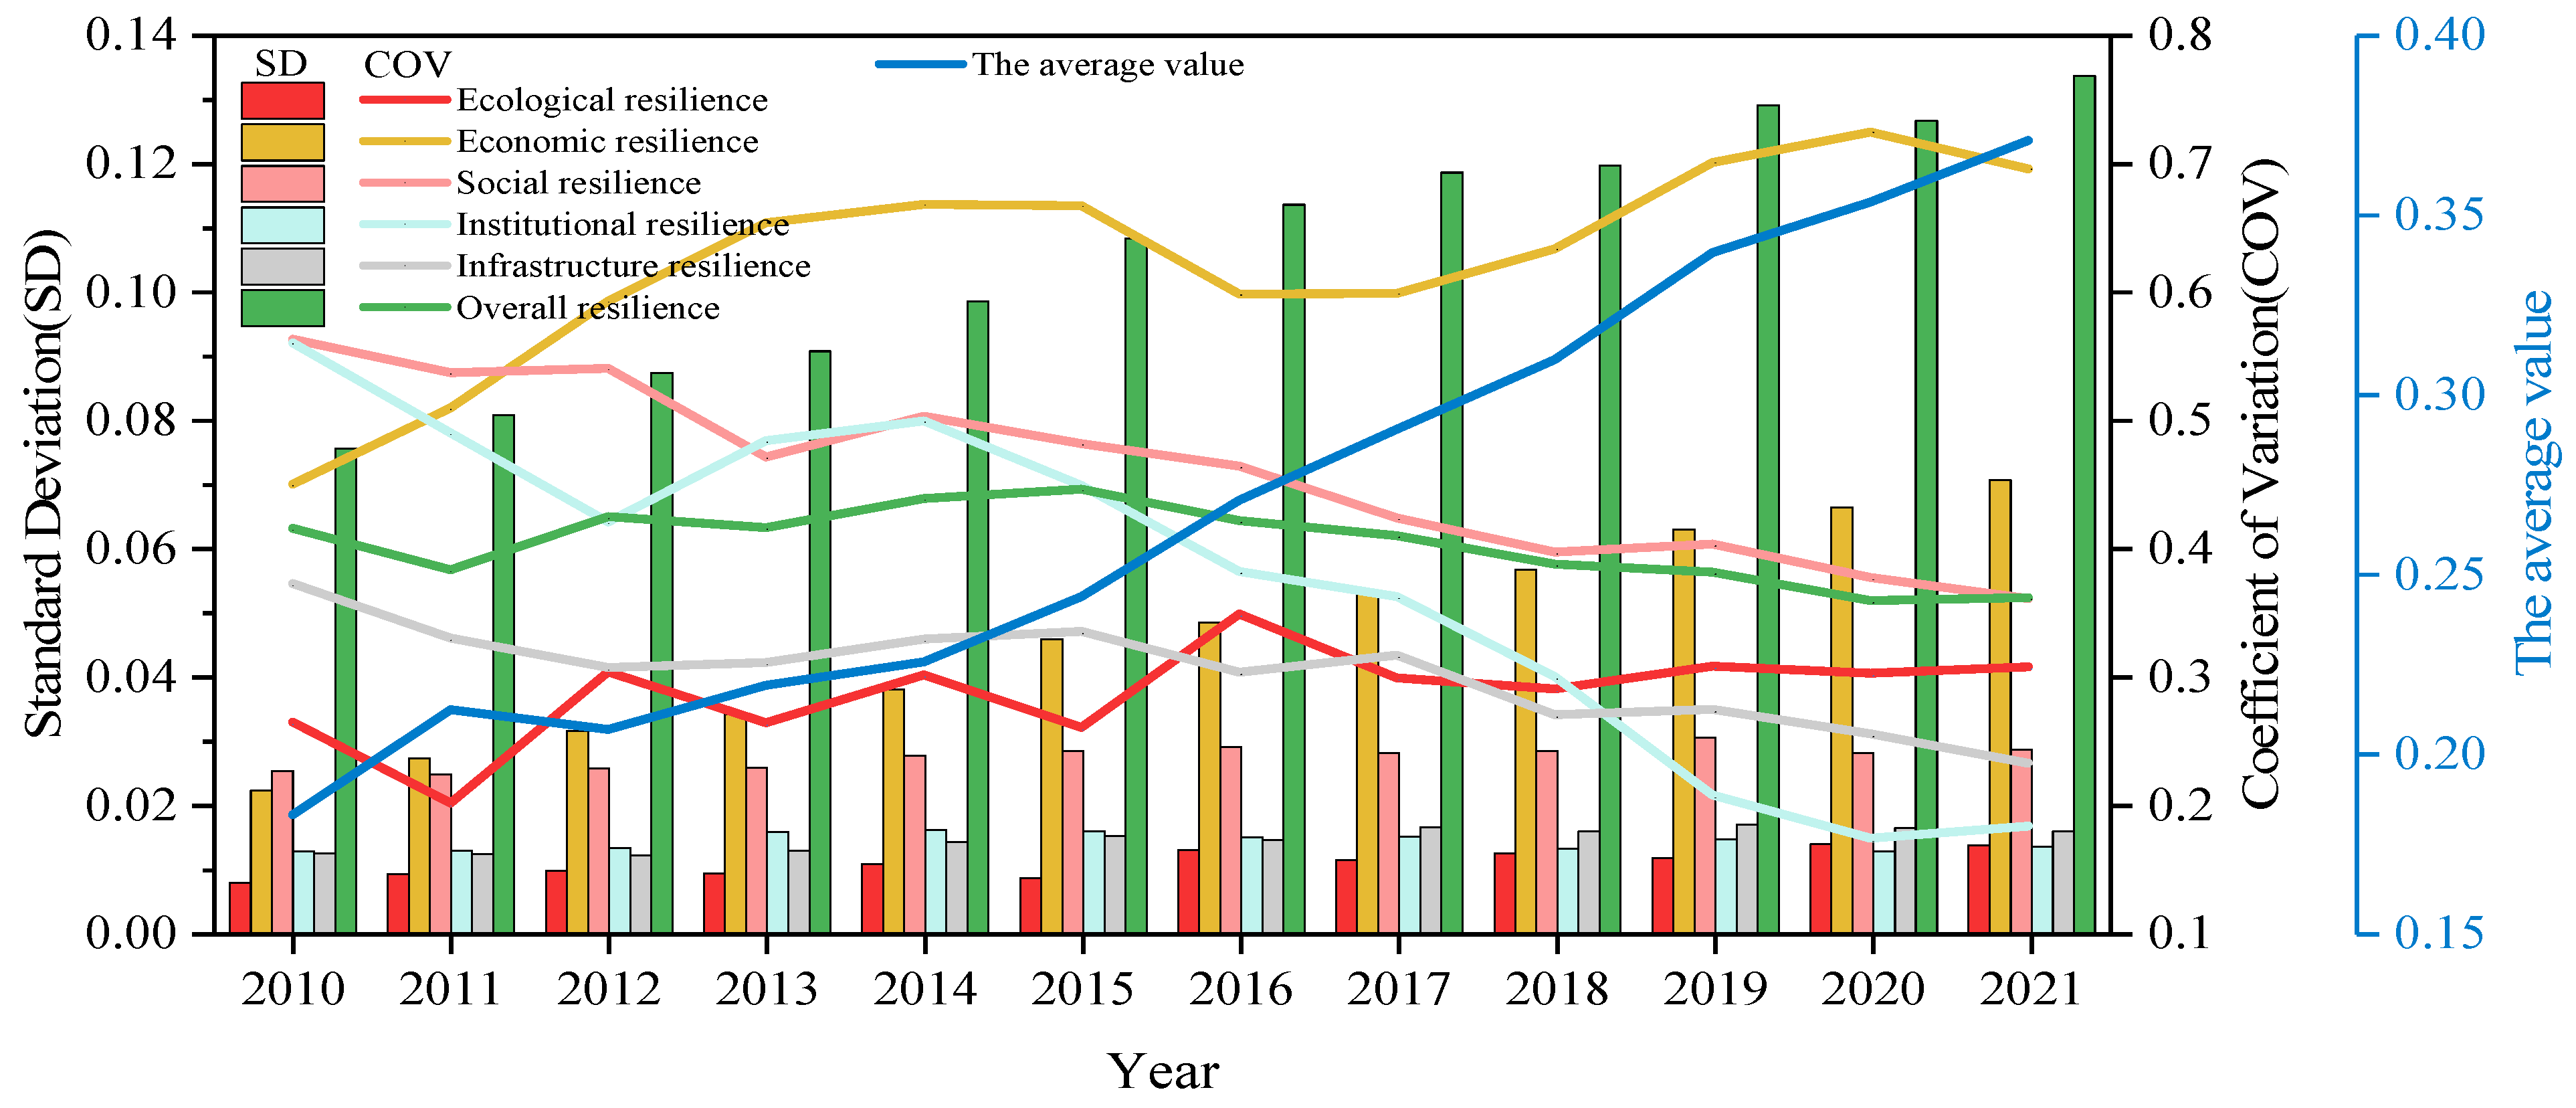
4.1.2. Degree of Dispersion

From 2010 to 2021, the coefficient of variation (COV) in urban resilience indexes in Hunan Province shows four stages. In the first phase (2010–2011), the COV in the urban resilience indexes shows a small decline. The decrease from 0.4147 to 0.3823 indicates a decreasing trend in the urban resilience level gap between the 14 cities in Hunan Province during this period. In the second phase (2011–2015), the COV in the urban resilience indexes shows a fluctuating upward trend. The range of values is between 0.3823 and 0.4455, indicating that the gap in urban resilience levels among the 14 cities in Hunan Province in this time period shows a fluctuating and increasing trend. In the third phase (2011–2015), the COV in the urban resilience indexes shows a rapidly decreasing trend. The value has a large change, decreasing from 0.4455 to 0.3582, indicating that the gap in the level of urban resilience among the 14 cities in Hunan Province in this time period shows a decreasing trend. In the fourth phase (2020–2021), the COV in the urban resilience indexes shows a rapidly decreasing trend. The overall change in the value is not significant, with the value increasing from 0.3582 to 0.3605, indicating an increasing trend in the urban resilience level gap between the 14 cities in Hunan Province during this period.

4.1.3. City Classification

According to the results obtained in Table 3, cities in Hunan Province are divided into three categories. The first category is high-level resilience city, which includes only Changsha. The resilience index ranges from 0.4239 to 0.8075, and its level of urban resilience is far higher than other cities. The second category is the medium-level resilience cities, mainly including Zhuzhou, Xiangtan, Hengyang, and Yueyang, with resilience indexes between 0.1759 and 0.4466. The third category is low-level resilience cities, including Shaoyang, Changde, Zhangjiajie, Yiyang, Chenzhou, Yongzhou, Huaihua, Loudi, and Xiangxi, with resilience indexes between 0.1223 and 0.3583. This shows that there is a significant spatial “Matthew effect” in the development of urban resilience in Hunan Province. There is a large gap in the level of urban resilience among cities. Low-level resilience cities occupy a dominant position.

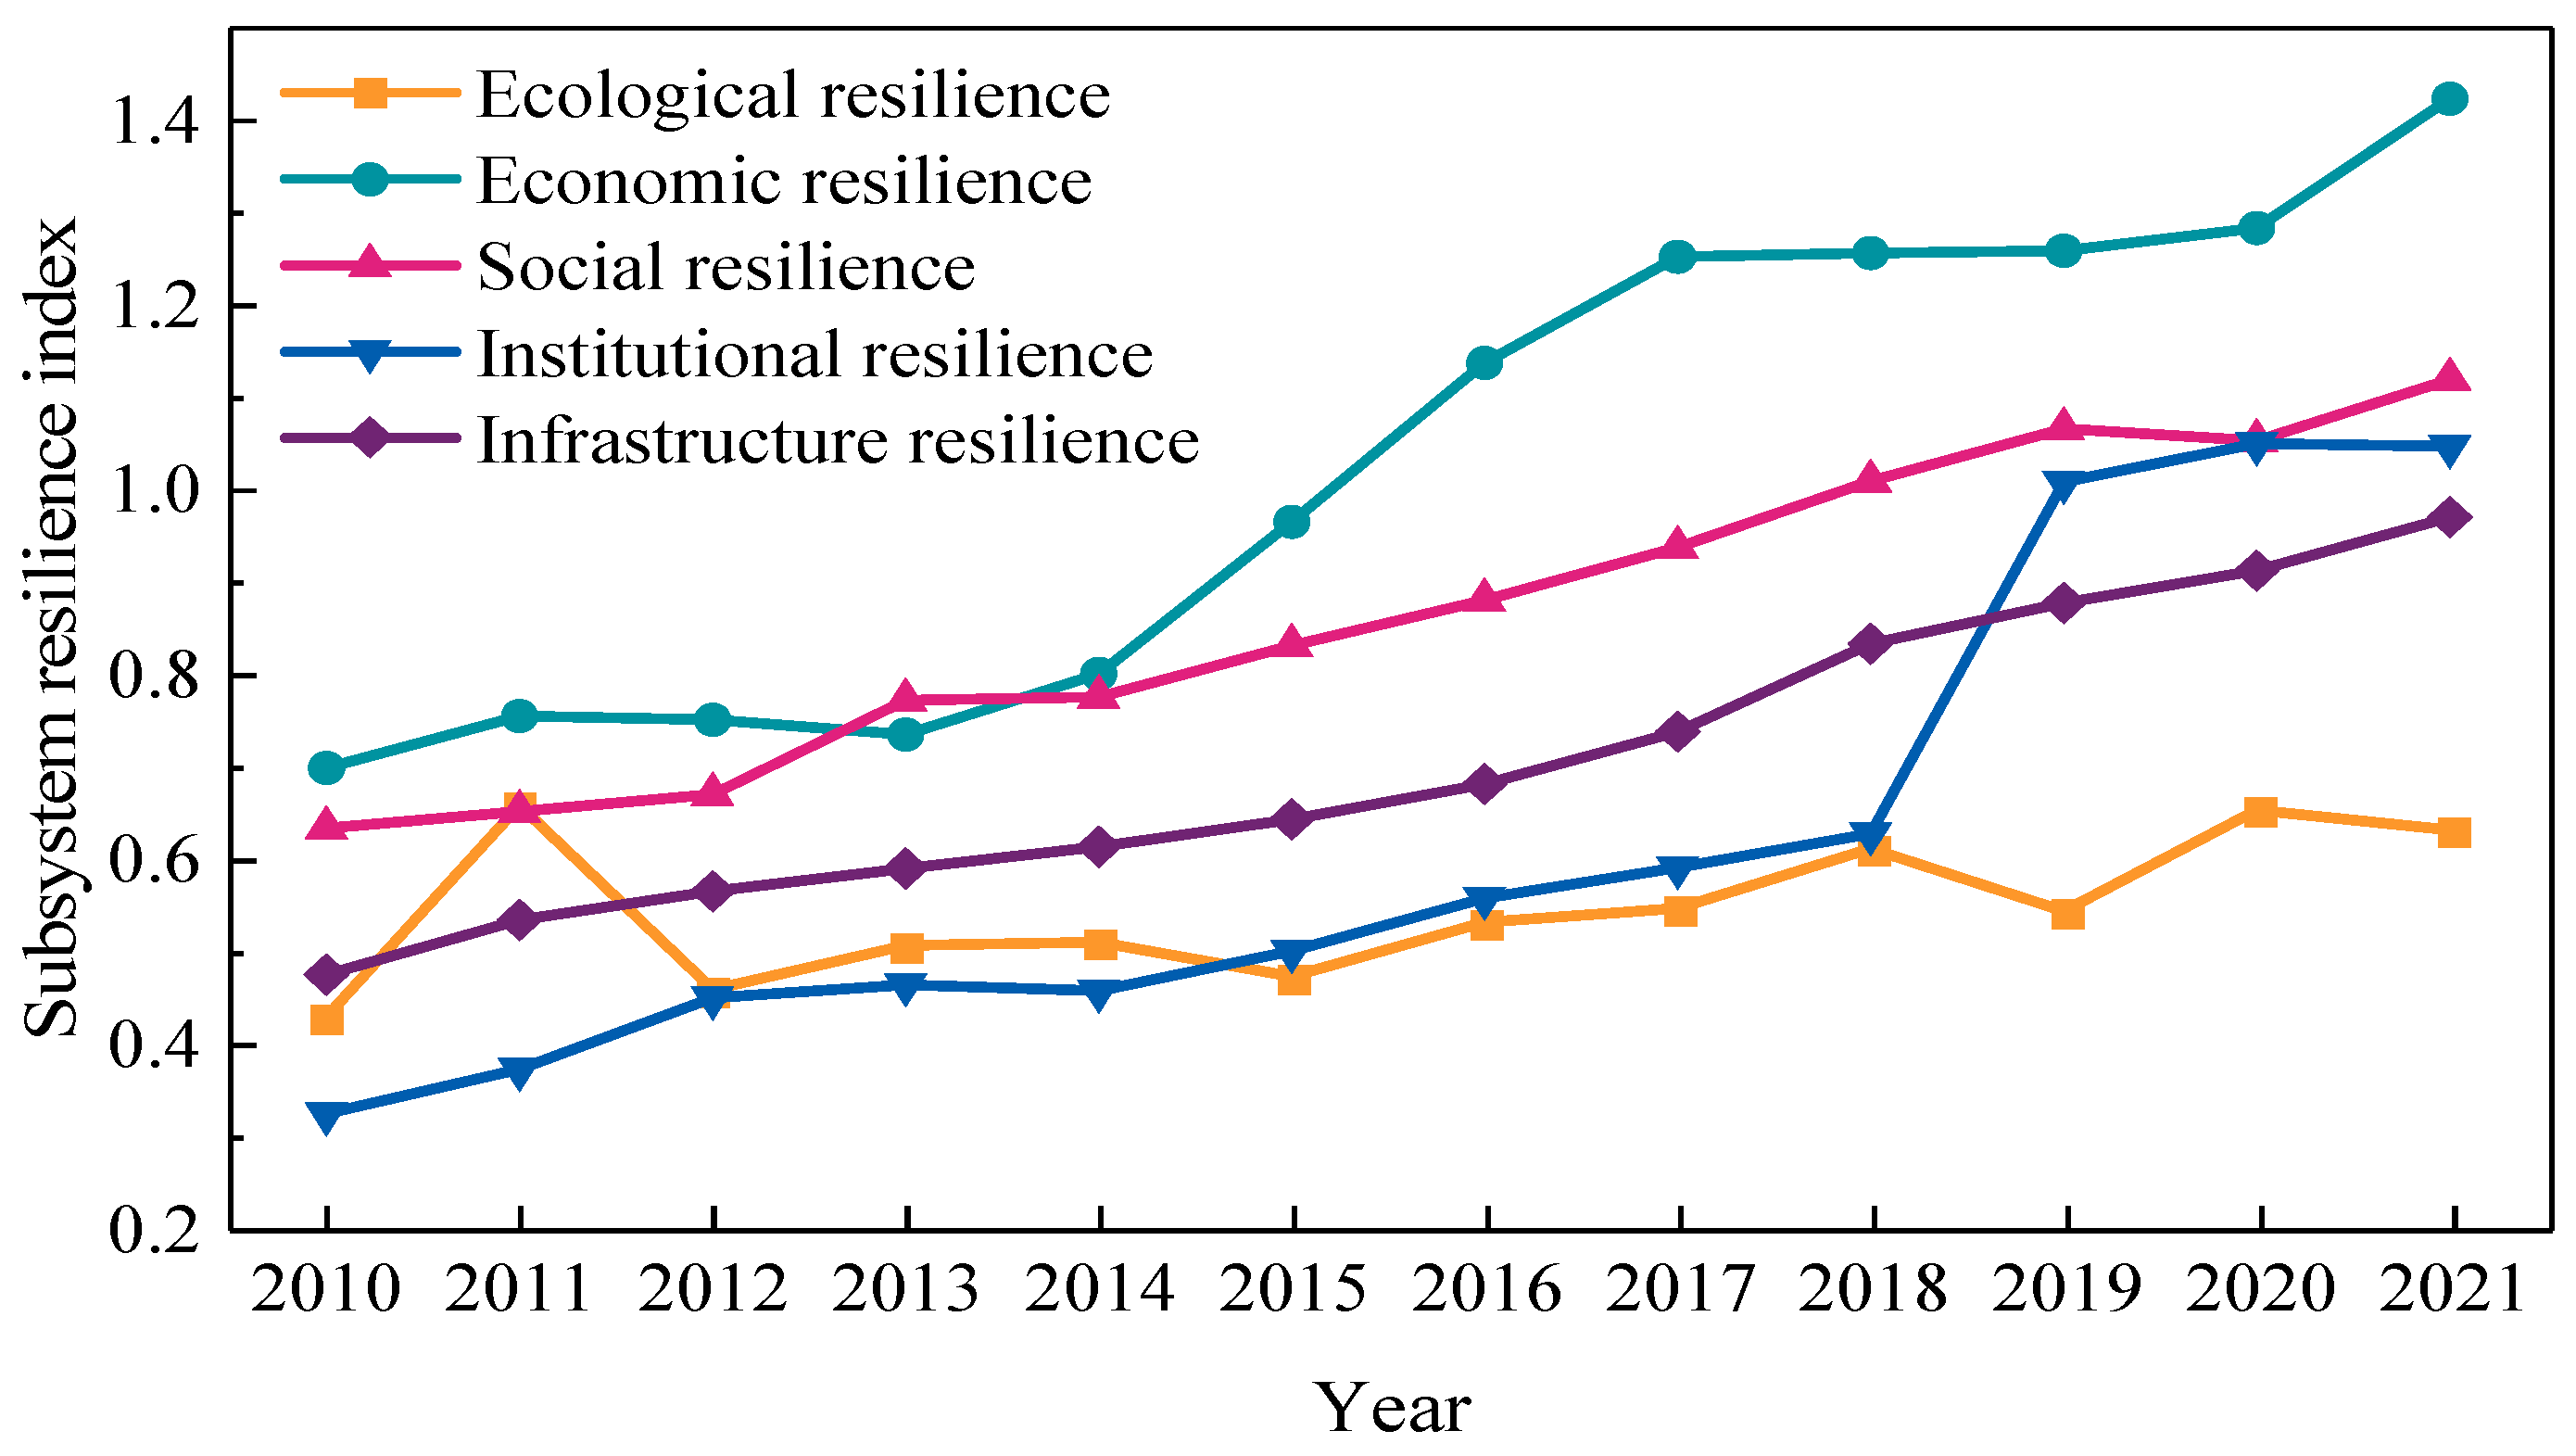
4.1.4. Resilience Level of Subsystem

Among the subsystems of urban resilience, the average values of economic resilience indexes and social resilience indexes are relatively large. The average values of the ecological resilience index, institutional resilience index, and infrastructure resilience index are relatively small. Therefore, there is a systematic differentiation in the level of urban resilience. Moreover, in addition to ecological resilience, economic resilience, social resilience, institutional resilience, and infrastructure resilience are all positively correlated with urban resilience. As can be seen from Figure 3, from 2010 to 2021, all subsystems show a balanced development in which the difference in institutional resilience decreases most significantly.
As can be seen from Figure 4, economic resilience, social resilience, institutional resilience, and infrastructure resilience show an obvious fluctuating upward trend. Economic resilience increases from 0.6976 in 2010 to 1.4241 in 2021. Social resilience increases from 0.6325 in 2010 to 1.1195 in 2021. Institutional resilience increases from 0.3223 in 2010 to 1.0470 in 2021. Infrastructure resilience increases from 0.4731 in 2010 to 0.9702 in 2021. It indicates that the levels of economy, society, institution, and infrastructure in Hunan Province have been improving from 2010 to 2021. The reasons are as follows: First, Hunan Province, with a deep foundation of real economy and a developed private economy, is an important grain production base in the country, so the overall economic level is relatively high. Indicators such as per capita GDP, local fiscal revenue, urbanization level, GDP of the secondary and proportion of tertiary sector of the economy in GDP all show a rising trend. Among them, the per capita GDP grew from 23,886 yuan in 2010 to 63,169 yuan in 2021, an increase of nearly 264.50%. The GDP of the secondary grew from 811.3 billion yuan in 2010 to 1812.6 billion yuan in 2021, an increase of nearly 223.42%. And the proportion of tertiary sector of the economy in GDP grew from 38.36% in 2010 to 51.07% in 2021, an increase of nearly 133.13%. In terms of social resilience, there is a fluctuating decline in population density. The difference in resident populations between the seventh and sixth census is used to approximate the net inflow of resident populations. In Hunan, there was a net outflow of 2,930,600 permanent residents from 2010 to 2021, a relatively serious loss of population. In addition, the average annual salary of on-the-job employees was affected by the COVID-19 epidemic, which dropped from 71,382 yuan in 2019 to 61,149 yuan in 2021. However, the per capita disposable income of rural residents, the proportion of social security and employment in fiscal expenditure, the number of college students per 10,000 people, the population of public management and social organizations, and the Engel’s coefficient for all residents all show a relatively obvious growth trend, so the level of social resilience is showing a rising trend. With regard to institutional resilience, although there is a downward trend in the input level of general public service, many indicators such as the per capita financial expenditure, number of government agencies, enterprises, and public institutions, the density of urban health institutions, the number of health personnel per thousand people, and the number of hospital beds per 10,000 people all show a clear upward trend, and, thus, institutional resilience is also showing a rising trend. For infrastructure resilience, indicators such as the per capita road area, comprehensive capacity of highway network, number of public transportation vehicles per 10,000 people, drainage pipeline density, and the number of fixed internet users all show a clear growth trend. Among them, the per capita road area increased from 9.70 square meters per person in 2010 to 20.54 square meters per person in 2021, an increase of nearly 211.75%. The number of fixed internet users increased from 388.12 in 2010 to 2323 in 2021, an increase of nearly 598.53%. Thus, infrastructure resilience is likewise showing an increasing trend. And, ecological resilience also shows a fluctuating upward trend, but the change is very small. It fluctuates from 0.4273 in 2010 to 0.6303 in 2021. Although the green coverage rate of built-up areas, per capita green area, and park green area all increase to a certain extent, the PM2.5 pollutant concentration and the comprehensive utilization rate of industrial solid waste do not change significantly over the years. For example, the PM2.5 pollutant concentration first decreased from 37.95 μg/m3 in 2010 to 21.06 μg/m3 in 2017 and then fluctuated to 34.35 μg/m3 in 2021. The comprehensive utilization rate of industrial solid waste decreased from 87.29% in 2010 to 81.34% in 2013, then increased to 86.28% in 2019, and then fluctuates to 84.11% in 2021. Overall, ecological resilience changed slightly.
The standard deviation (SD) of the urban economic resilience index changes most significantly from 2010 to 2021. It grows from 0.0224 to 0.0708, indicating that economic development has a significant impact on changes in urban resilience. In contrast, ecological resilience, social resilience, institutional resilience, and infrastructure resilience have a weaker impact on the development of urban resilience equalization. The rank order of social resilience gradually shifts from first place in 2010 to second place in 2021, and the SD of the social resilience index grows from 0.0254 to 0.0288. The rank order of institutional resilience gradually changes from the third in 2010 to the fifth in 2021, and the SD of the institutional resilience index grows from 0.0129 to 0.0136. The degree of influence of institutional resilience on the development of urban resilience equilibrium has weakened. The rank order of infrastructure resilience gradually changes from the fourth in 2010 to the third in 2021, and the SD of the infrastructure resilience index grows from 0.0125 to 0.0160. The degree of influence of infrastructure resilience on the development of urban resilience equalization has increased. The rank order of ecological resilience gradually changes from the bottom in 2010 to the fourth in 2021, and the SD of the ecological resilience index grows from 0.0125 to 0.0160. The degree of influence of ecological resilience on the development of urban resilience equalization has increased.

4.2. Spatial Differentiation

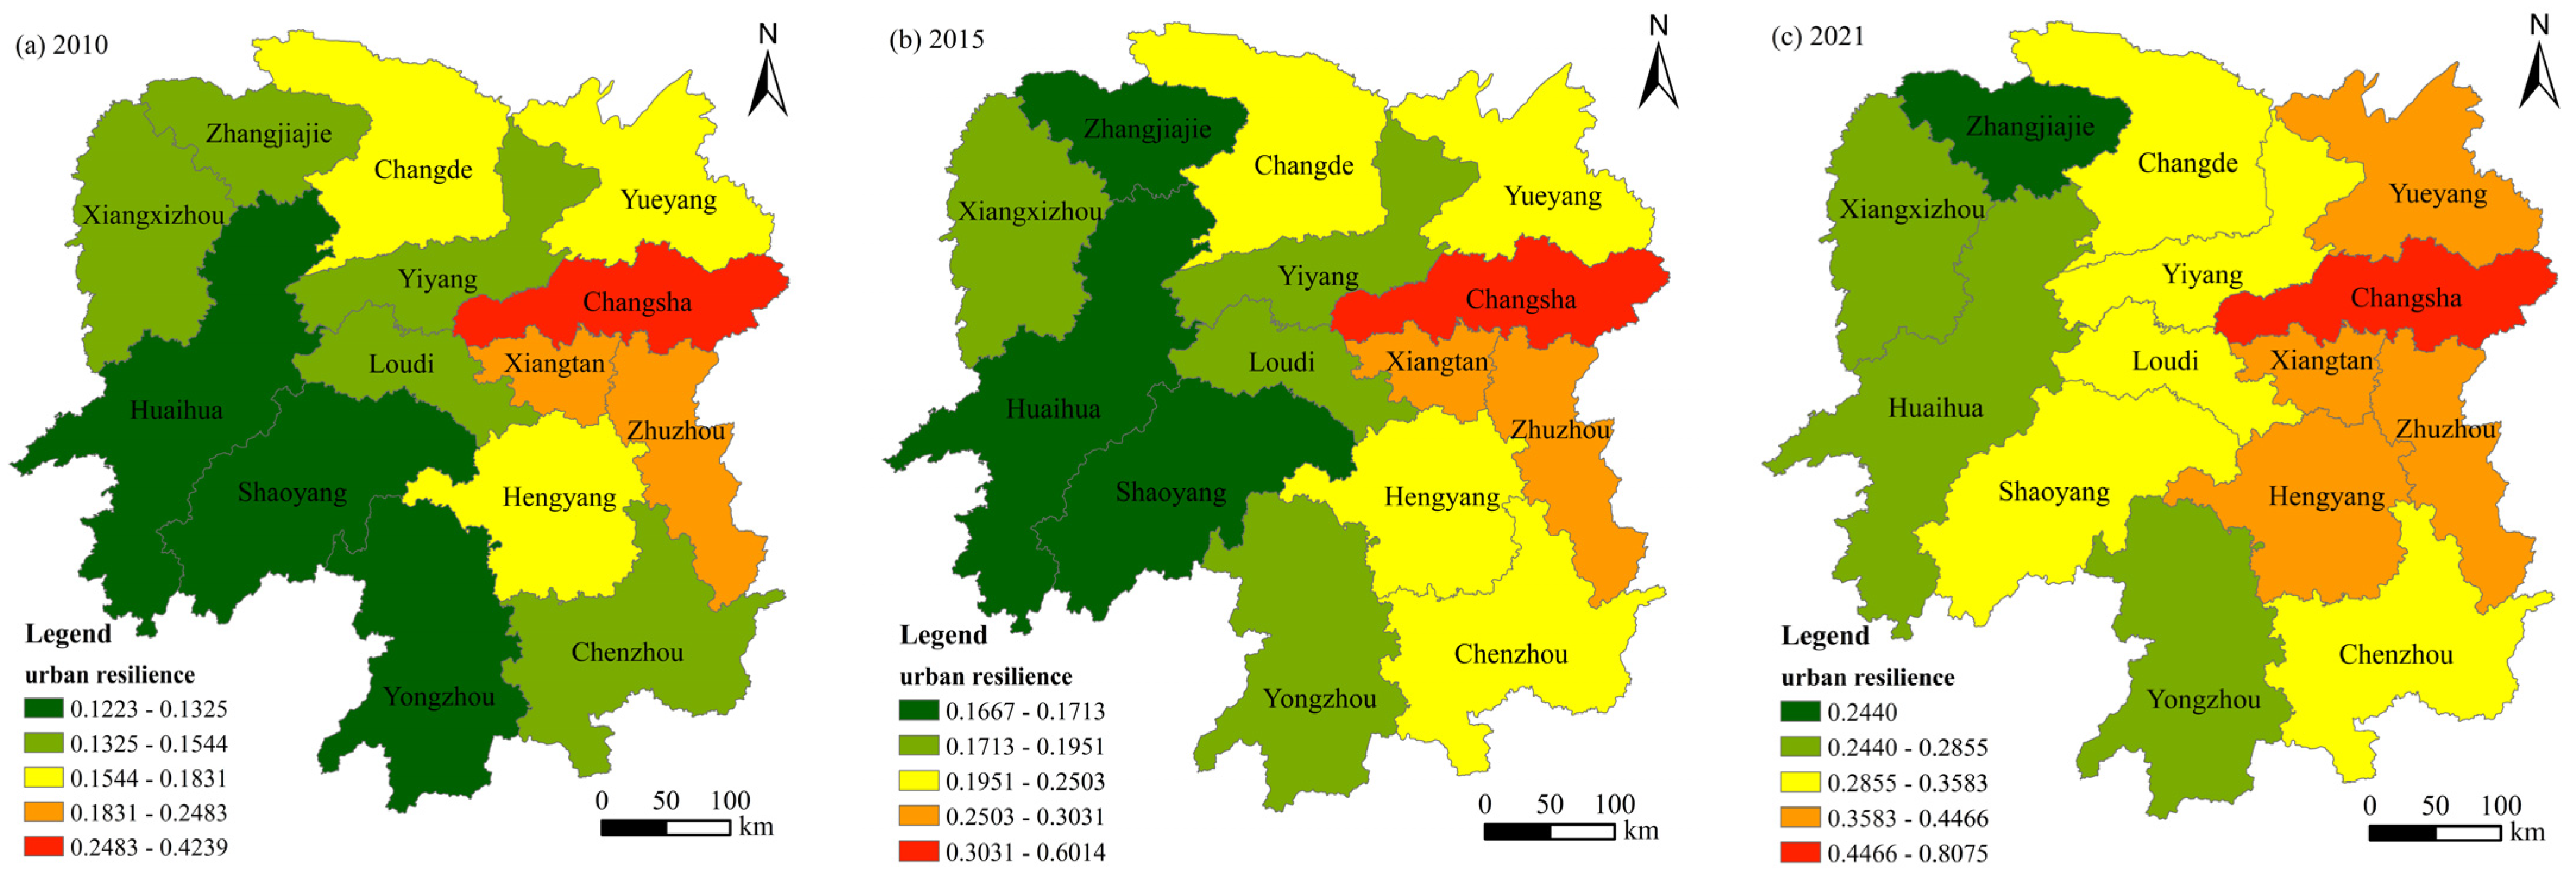
4.2.1. Overall Spatial Pattern

The natural fracture classification method built into the ArcGIS 10.8 software is used to grade and geo-visualize the urban resilience level in Hunan Province, as shown in Figure 5.
The urban resilience level in Hunan Province from 2010 to 2021 shows obvious regional differentiation in the spatial pattern. The urban resilience level in the eastern region is higher than that in the central and western region, but its spatial pattern changes stably. From the spatial distribution map of the urban resilience level, it can be seen that the higher values of the urban resilience index are located in the “Changsha-Zhuzhou-Xiangtan” urban agglomeration and its surrounding areas, and the lower values of the urban resilience index are concentrated in the western region. The overall spatial structure shows a gradient of high in the east and low in the west. The main reasons are as follows. First, the cities of Changsha, Zhuzhou, Xiangtan, Yueyang, and Hengyang have been regarded as important areas for the development of heavy industry and light industry due to historical policy reasons. Changsha, Zhuzhou, and Xiangtan, in particular, have become the center of economic development in Hunan Province. Second, the eastern part of Hunan Province, with Changsha city as the center, has a strong attraction for investors because of its better transportation advantages. Meanwhile, economic development drives the development of culture and education. For the central and western regions, the gap between resource advantages and market advantages has not been truly recognized, and the conditions for resource development are poor. Therefore, economic development is relatively backward. Thirdly, the supply of institutions has a direct impact on economic development. Due to the differences between formal and informal institutions such as law, policy, culture, custom, and value concept in the eastern and western regions, there are certain differences in economic development.
In November 2013, Hunan was defined as “the transition zone between the eastern coastal region and the central and western regions, and the combination of the Yangtze River Open Economic Belt and the Coastal Open Economic Belt” were referred to as “One Belt and One part”. In 2015, Hunan Province initially built a development pattern of “three platforms and four plates”. At the end of 2015, the 13th Five Year Plan of Hunan Province clearly proposed to accelerate the construction of a new balanced development pattern of “one core, three poles, four belts and multiple points”. Driven by various development strategies, the development of Hunan Province has been steady and positive.

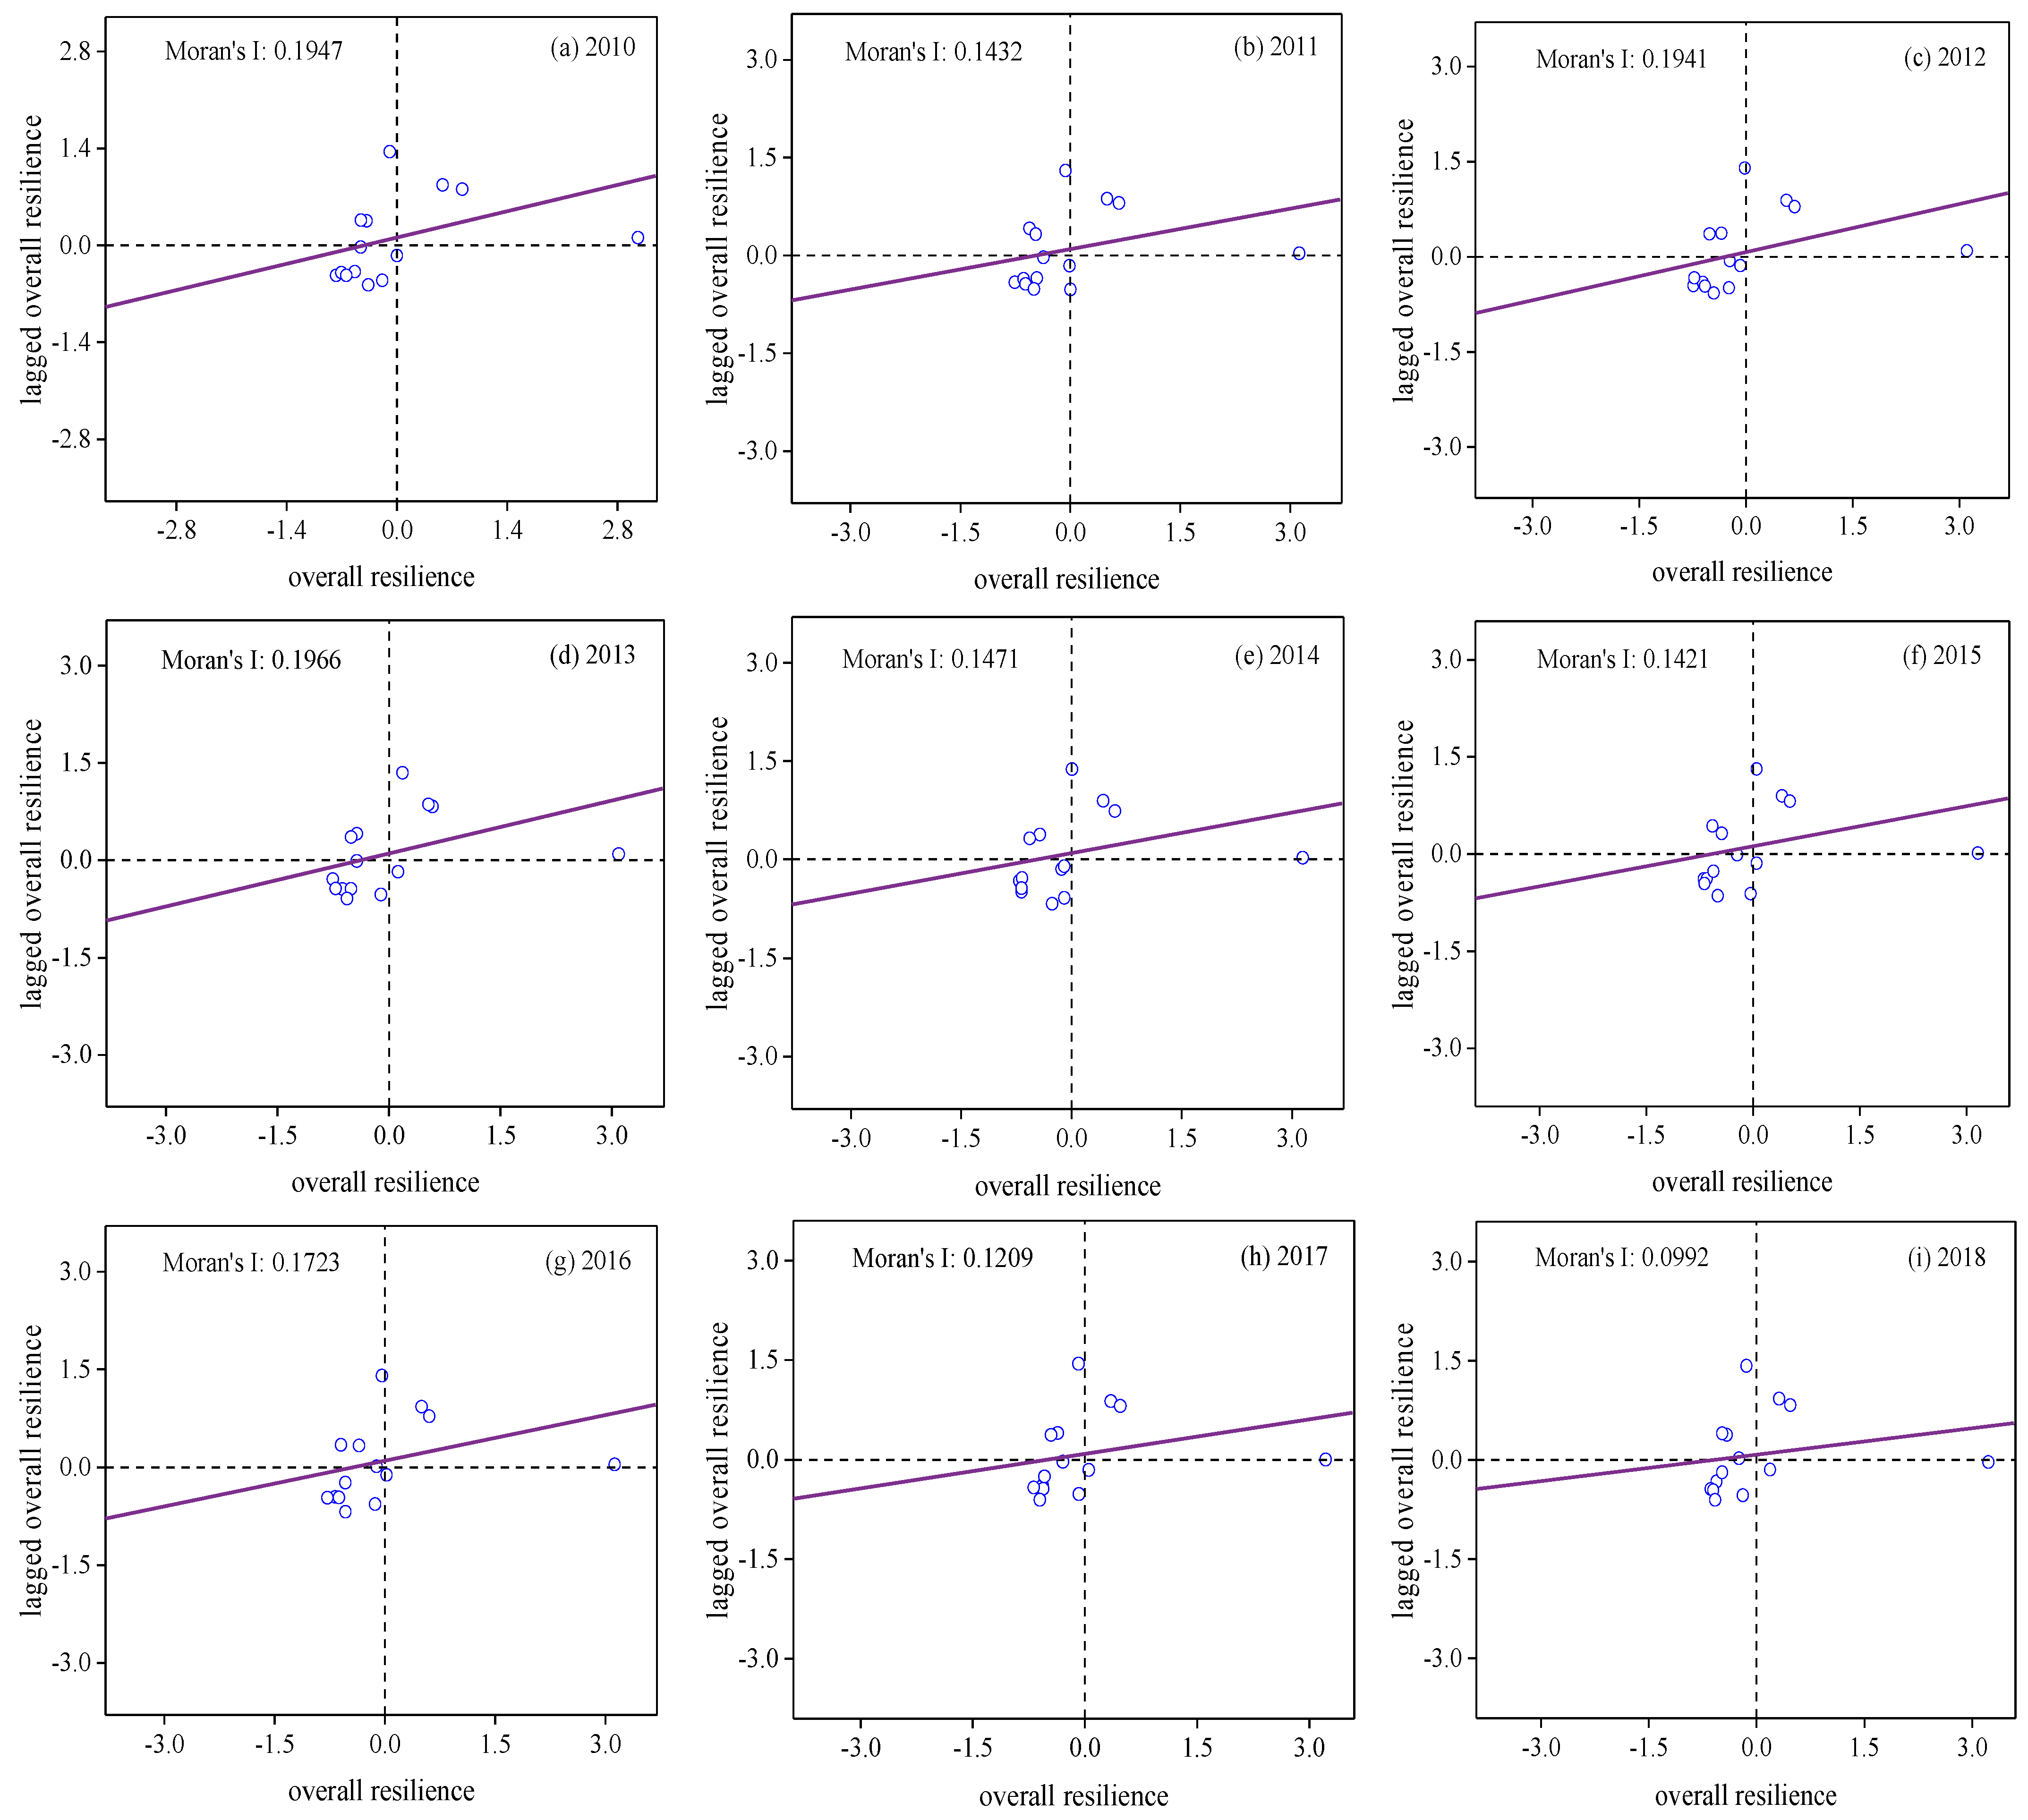
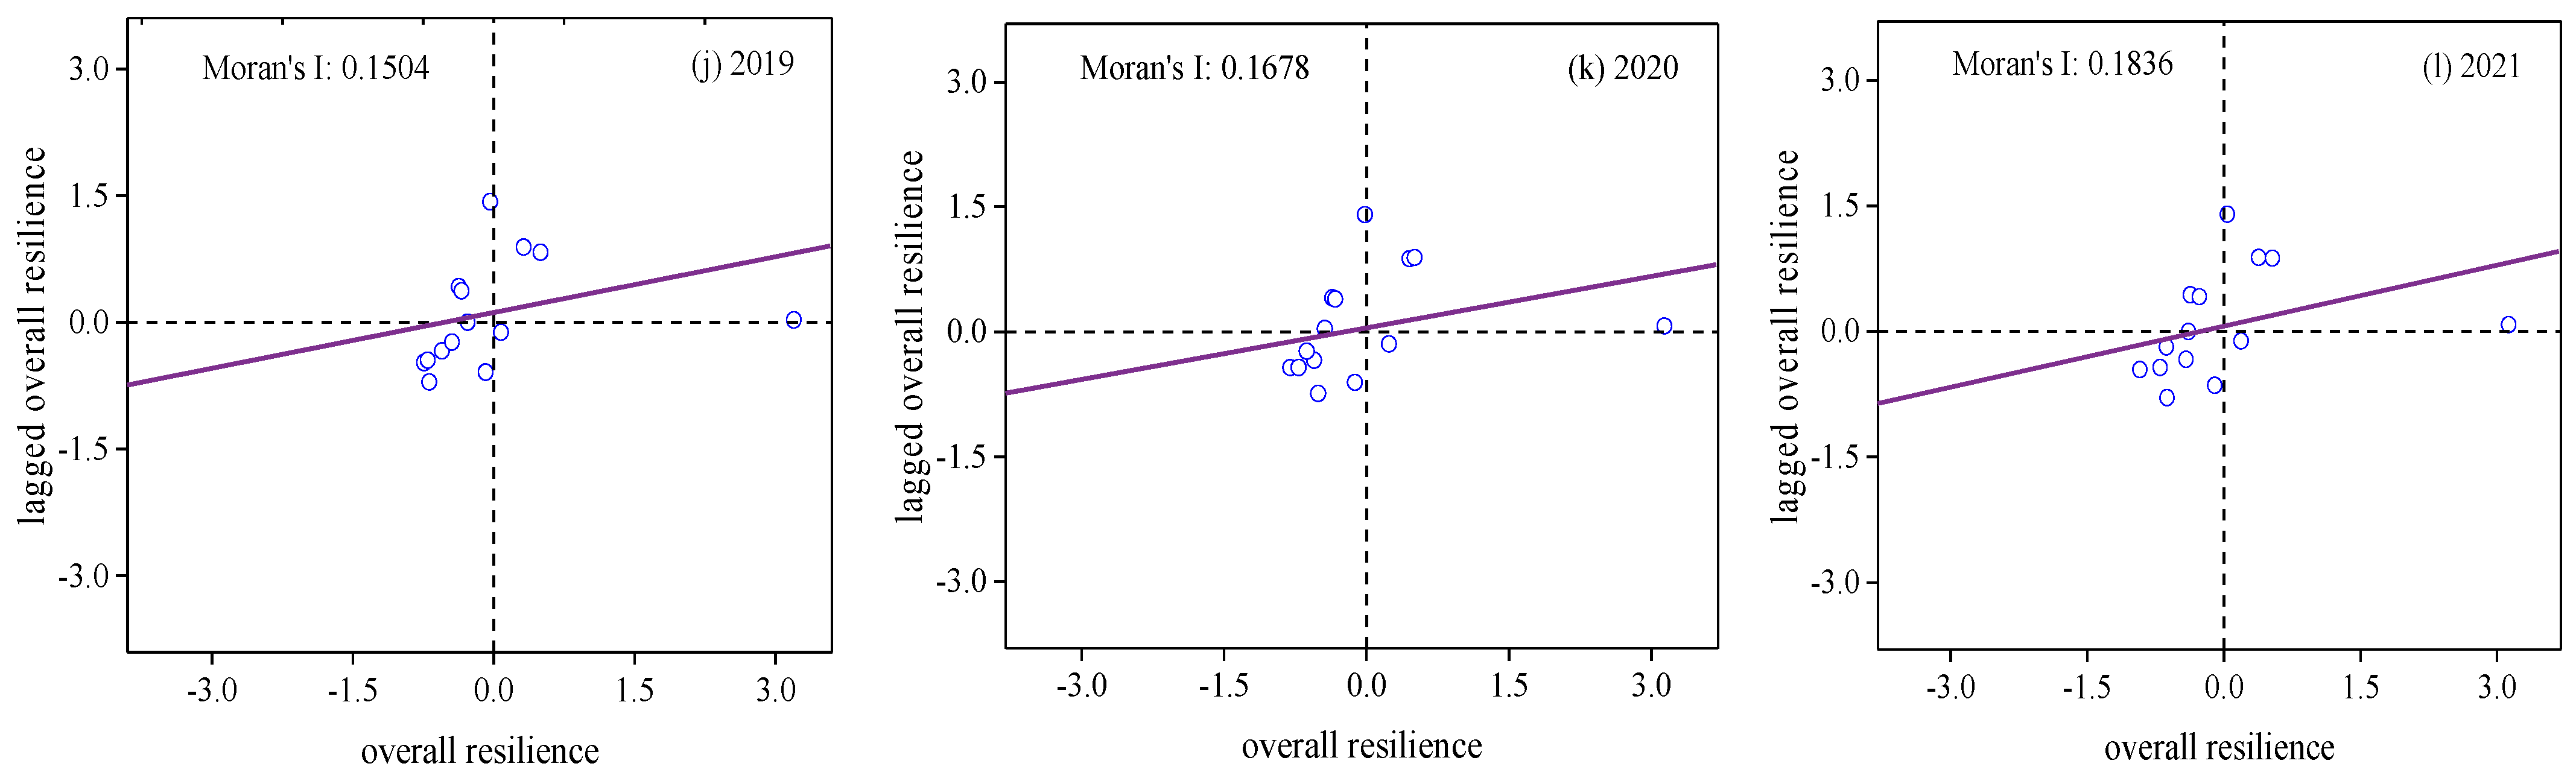
4.2.2. Global Spatial Agglomeration Analysis

The visualization study of the spatial pattern condition of urban resilience reflects the distribution law of urban resilience development at a certain level, but it cannot show the intrinsic agglomeration law between various types of urban units. In order to reveal the spatial correlation of urban resilience, this paper utilizes the spatial statistical tools in GeoDa v1.14.0.0 software to conduct an agglomeration trend analysis and explore the spatial autocorrelation of urban resilience in Hunan Province. The GMI values are calculated and the scatter plots are plotted, as shown in Figure 6.
As can be seen from Figure 6, the GMI values of urban resilience in Hunan Province from 2010 to 2021 are all positive, ranging from 0.0992 to 0.1966. And, all of them pass the significance test and are statistically significant, as shown in Table 4. The results show that the urban resilience of cities in Hunan Province presents a positive spatial autocorrelation, with an obvious spatial agglomeration effect, rather than a random distribution. Cities with high levels of urban resilience are in close proximity to each other, and cities with low levels of urban resilience are in close proximity to each other. Overall, the GMI values from 2010 to 2021 experience the fluctuation process of “decreasing-rising-decreasing-rising-decreasing-rising”, indicating that the resilience level of the cities in Hunan Province has the cyclic spatial pattern of “diffusion-agglomeration-diffusion-agglomeration-diffusion-agglomeration”.
The horizontal axis of the Moran scatterplot represents the value of the resilience level of each city in a given year, and the vertical axis represents the product of the spatial neighborhood weight matrix and the resilience level of each city in that year, i.e., a measure of the spatial lag level of the resilience level of each city. Each of the four quadrants of a scatter plot represents a different type of association. The first quadrant is the “High-High (H-H) type”. It indicates that both a region’s own resilience level and the surrounding area’s resilience level are relatively high. The second quadrant is the “Low-High (L-H) type”. It indicates that a region has a low level of resilience on its own, but a high level of resilience in the surrounding area. The third quadrant is “Low-Low (L-L) type”. It indicates that both a region’s own resilience level and the surrounding area’s resilience level are relatively low. The fourth quadrant is “High-Low (H-L) type”. It indicates that a region has a high level of resilience on its own, but a low level of resilience in the surrounding area.
As can be seen from Figure 6, the 14 cities are spatially distributed in the second and third quadrants, showing the spatial distribution of an “L-H type” agglomeration and an “L-L type” agglomeration. The “H-H type” is mainly concentrated in the Changsha-Zhuzhou-Xiangtan area where the cities are closely connected, the diffusion effect of the capital city is significant, and the cities can develop efficiently and harmoniously. The “L-H type” is mainly concentrated in Yueyang, Yiyang, and Loudi. These cities have a low level of resilience on their own, while the cities of ChangZhuTan which border them have a high level of resilience. The “L-L type” is mainly concentrated in western Hunan and southern Hunan, including Shaoyang, Changde, Zhangjiajie, Chenzhou, Yongzhou, Huaihua, and Xiangxi. The “H-L type” only includes Hengyang, which is neighboring Zhuzhou and Xiangtan in the north and Loudi, Shaoyang, Yongzhou, and Chenzhou in the west, and has no strong radiating effect on the neighboring cities. The result is consistent with the fact that the urban resilience level in Hunan Province shows a gradient spatial structure.

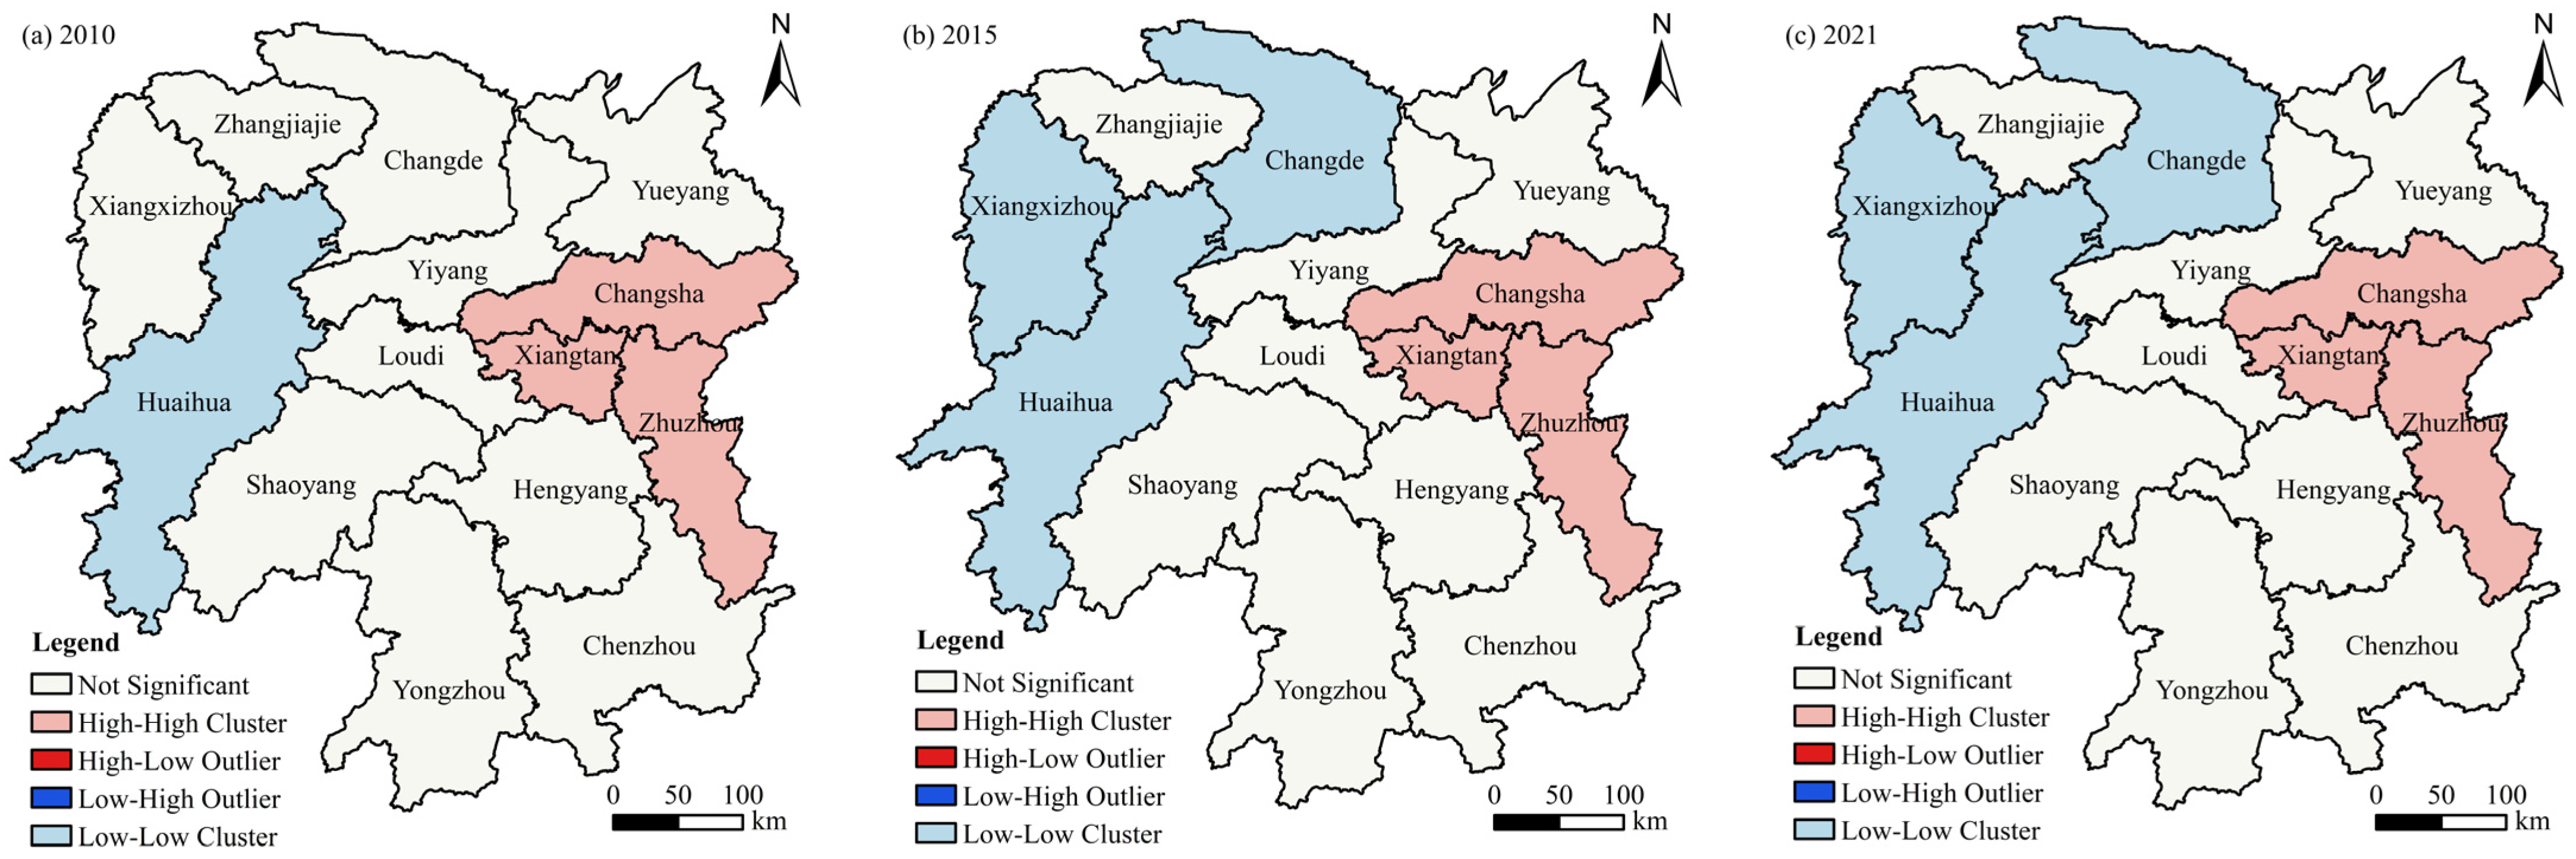
4.2.3. Local Spatial Agglomeration Analysis

In order to judge the local correlation types of each region and whether the agglomeration area is statistically significant, the GeoDa v1.14.0.0 software is used to obtain an agglomeration map of the urban resilience level for local autocorrelation analysis, as shown in Figure 7. It can be seen from Figure 7 that the distribution of each correlation type is less than that of each correlation type in Figure 6. This is because the correlation types marked on the agglomeration map are only those that have passed the significance test.
In 2010, the “H-H type” of urban resilience mainly includes Changsha, Zhuzhou, and Xiangtan. The “LL type” only includes Huaihua. There is no agglomeration area for the “L-H type” and “H-L type”. In 2015, the “H-H type” of urban resilience mainly includes Changsha, Zhuzhou, and Xiangtan. The “L-L type” increases Changde and Xiangxi compared to 2010. There is no agglomeration area for the “L-H type” and “H-L type”. The spatial agglomeration phenomenon in 2021 is the same as in 2015. In summary, the “H-H type” agglomeration area of urban resilience level in Hunan Province is distributed in the Changsha-Zhuzhou-Xiangtan area. The “L-L type” agglomeration area is distributed in the northwest of Hunan Province. The difference between the east and west is obvious. Therefore, in the subsequent development, the linkage development between cities should be greatly strengthened to promote the balanced development of the “H-H type” and “L-L type” agglomeration areas.

4.3. Impact Factors of Urban Resilience

4.3.1. Identification of Leading Impact Factors

In Section 3.3, we do not overly avoid the repeated calculations of some elements. The main reason is that the principle of GeoDetector can ensure immunity to the collinearity of multiple independent variables, which can effectively avoid the possible multicollinearity problem between explanatory variables. Therefore, the impact factors of urban resilience can be directly detected.
The explanatory variables are imported into the GeoDetector model to find the influence value of each explanatory variable on the level of urban resilience in Hunan Province, i.e., the q value. Only the impact factors that passed the significance test at the 0.05 level in 2010, 2015 and 2021 are listed, as shown in Table 5. The results show that economic factors and social factors play a dominant role in the spatial pattern of urban resilience level in Hunan Province. Ecological factors, institutional factors and infrastructure factors have relatively weak influences.
Fifteen, seventeen, and thirteen impact factors pass the test of significance at the 0.05 level in 2010, 2015, and 2021, respectively. Among the ecological factors, the influence of park green space area decreases. The demand for industrial land for urban construction is increasing. At the same time, due to the rural population and migrants moving into the city, the urban population has increased greatly, which brings the pressure of transportation and housing to the city. In this case, more construction land is needed, so the influence of the park green space decreases. In terms of economic factors, the influence of such factors as per capita GDP, urbanization level, research and development expenditure, the total score of urban scientific and technological innovation, and the GDP of the secondary industry of the economy is basically at the forefront. They have increased by nearly 264.50%, 135.49%, 904.38%, 103.33%, and 223.42%, respectively, over the past 12 years. This indicates that economic development is the dominant factor contributing to the level of urban resilience, and continuous economic development promotes the improvement of urban resilience. Among the social factors, the q-value of the per capita disposable income of rural residents increased from 0.972 in 2010 to 0.976 in 2021, and the influence ranking rises from third to first. The impact of people’s living standards and purchasing power on urban resilience is becoming increasingly significant. The influence of the number of college students per 10,000 people has decreased from 0.972 in 2010 to 0.942 in 2021, but it remains an important driver of urban resilience. The more the number of college students per 10,000 people, the higher the quality of the people. The influence of factors such as the average annual salary of on-the-job employees, population density, and medical insurance coverage rate is relatively small, but it cannot be ignored in the process of improving urban resilience. These factors indirectly reflect the level of people’s living standards and the operational capacity of cities. For institutional factors, the influence of per capita financial expenditure is gradually decreasing. This indicates that the role of government behavior in urban resilience has weakened, and further indicates that the role of economic development in urban resilience is becoming increasingly significant. The influence of the density of urban health institutions, the number of health personnel per thousand people, and the number of hospital beds per 10,000 people are all declining. It shows that the role of medical and health resources in the development of urban resilience is not significant. But in emergencies, medical and health resources are an important guarantee of life safety.

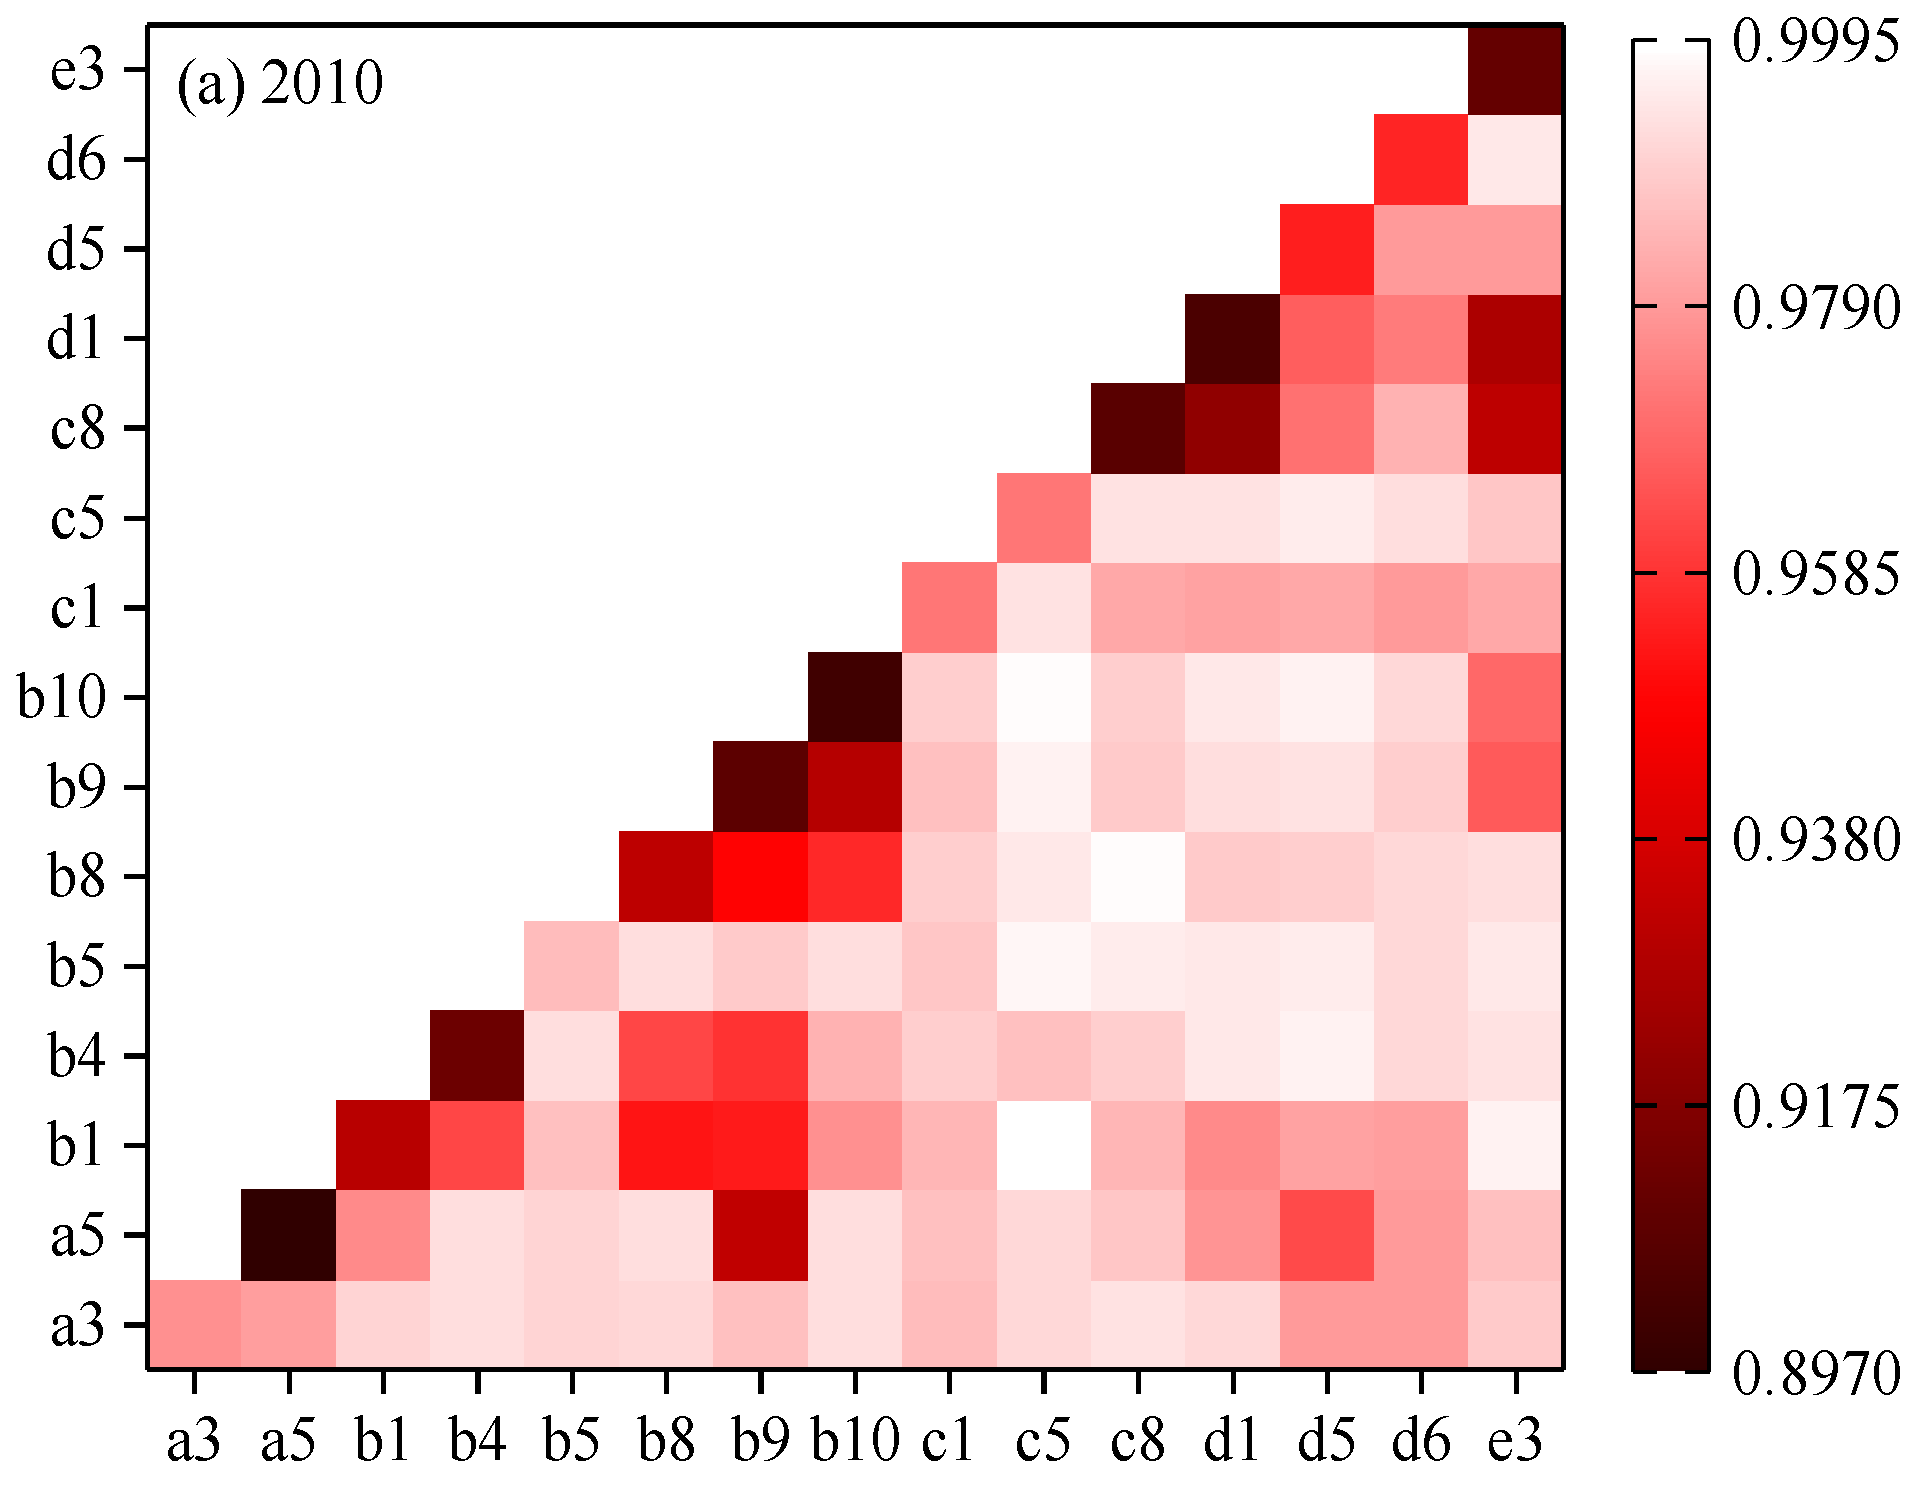
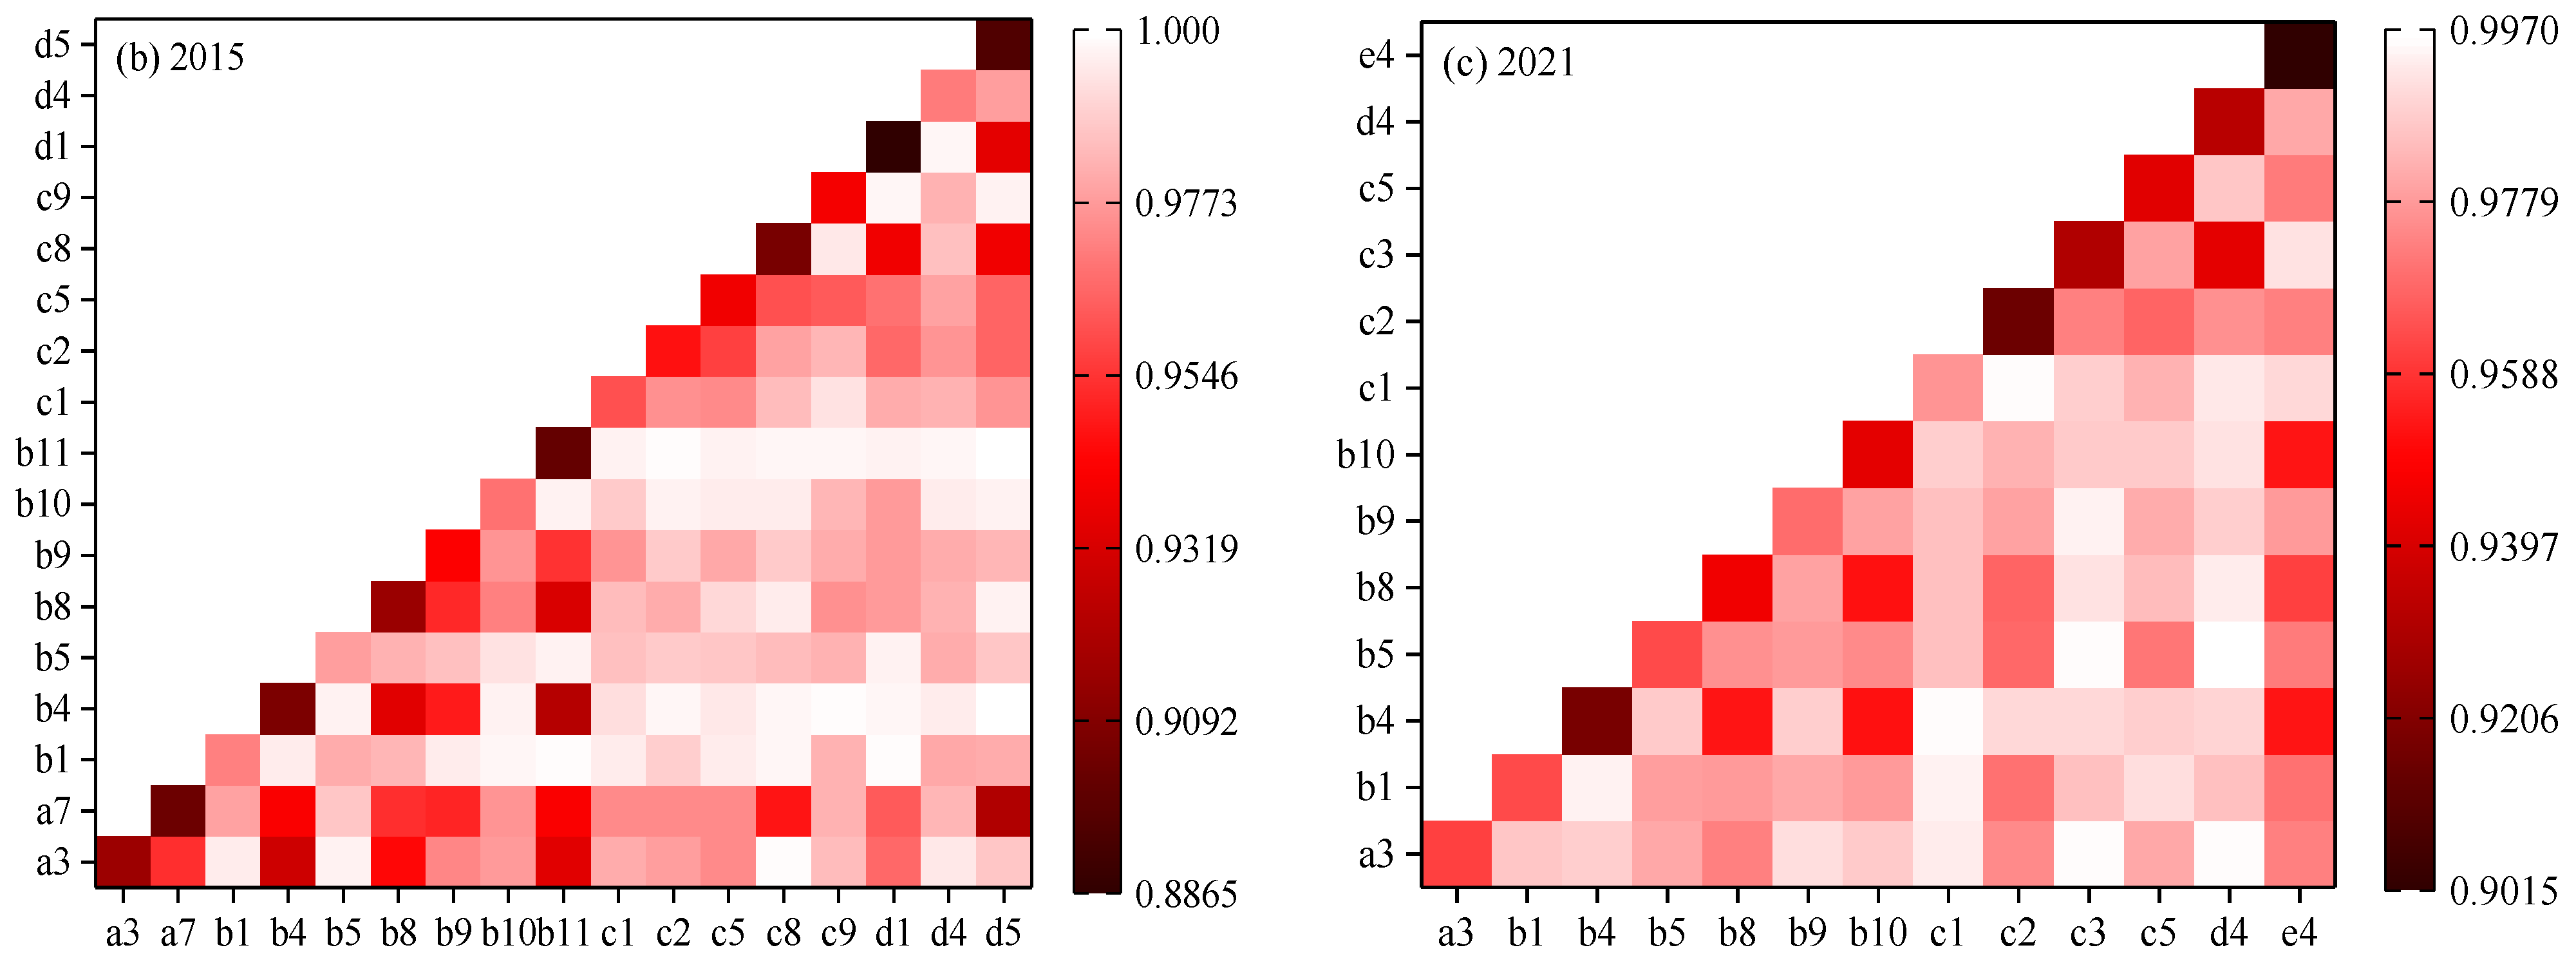
4.3.2. Results of Interactive Detection

The interactive detector is used to conduct interactive detection on the impact factors of urban resilience and the results are shown in Figure 8. The explanatory power is significantly enhanced after the interaction between the two impact factors, and the results show different degrees of double-factor enhancement. There is no relationship between nonlinear enhancement, weakening, and independence. This indicates that the spatial pattern of urban resilience level is the result of a combination of ecology, economy, society, institution, and infrastructure factors.
Taking 2015 as an example, the explanatory powers of per capita GDP, urbanization level, GDP of the secondary, per capita disposable income of rural residents, and average annual salary of on-the-job employees after interacting with other factors are 97.1%, 97.8%, 96.8%, 96.1%, and 94.6%, respectively. The explanatory powers become stronger. In 2010, the impact of the per capita financial expenditure in single-factor detection is relatively weak, with a q-value of 0.904. After the interaction between per capita financial expenditure and per capita GDP, the local fiscal revenue, GDP of the secondary, and number of public transportation vehicles per 10,000 people hold q values of 0.976, 0.994, 0.994, and 0.927, respectively. It shows that the force of government behavior on urban resilience can only be fully realized on the basis of the combined effect of the economic foundation and the level of infrastructure. It also reflects that the government should adjust its functions. The government should adjust its financial expenditures in order to guide the development of economy, institution, infrastructure, etc., and to improve its own capacity and level of urbanization. In addition, it can be found that the PM2.5 pollutant concentration is the weakest impact factor among the factors listed in 2010 that passed the significance test at the 0.05 level. Its q-value is 0.897. The influence of the sewage treatment rate among the factors listed in 2015 that passed the significance test at the 0.05 level is at the end, with a q-value of 0.904. However, the PM2.5 pollutant concentration and sewage treatment rates are significantly more influential when interacting with other factors. Economic growth will promote the optimization of urban industrial structure and the improvement of development quality [84]. The development of urban tourism and the promotion of citizens’ leisure demands make urban ecological environment construction inevitable. However, the protection of the ecological environment is the inevitable result of the economic drive, but also an important aspect of the city’s cultural dissemination and image display. In addition, infrastructure development does not directly create productive benefits. However, it can enhance the agglomeration and radiation effect of the city, ensure urban operation efficiency, and promote the construction of the ecological environment.

5. Discussion

Since urban resilience has become a research hotspot in the field of sustainable urban development, there has not been a recognized definition of urban resilience; so, scholars have been researching and exploring urban resilience from different perspectives. Based on the indicator data about urban resilience in Hunan Province from 2010 to 2021, this paper evaluates the urban resilience of Hunan Province in various aspects, including resilience level, characteristics, differences, and impact factors, from a dynamic perspective. The results of the urban resilience level in Hunan Province obtained by the study are basically consistent with the previous results [85,86].
We utilize the entropy weight method and the comprehensive index method to measure the relative size of urban resilience. This is the simplest and most effective method, which can avoid the research errors brought by personal subjectivity in the process of calculating the weights of indicators [75]. In addition, the resilience maturity model and the layer stacking method have been applied more often. The resilience maturity model is based on the stages that cities go through and proposes strategies for each. It requires holistic planning by the city to help the city assess the level of resilience and determine the policies that need to be implemented [87]. And, the layer stacking method is also applied in urban resilience research with the depth of research. It groups resilience components or risk resilience into layers and then analyzes them according to the attributes or weights of different layers [88]. This approach to resilience measurement is more intuitive and easier to understand, but it is limited to the evaluation of resilience within the region and does not take into account extra regional risks. There are some limitations in the selection of risks, so the measurement results do not reflect the main factors affecting urban resilience. Therefore, different methods have different applicable scenarios and conditions.
This paper constructs indicators from a comprehensive and system perspective, including five dimensions of ecology, economy, society, institution, and infrastructure, and considers the resilience level of the city under multiple factors as much as possible. This is also a more mainstream research method of an urban resilience indicator system [89]. This indicator system is mainly based on objective indicators to conduct research, focusing on the measurement of state resilience, and is suitable for regional resilience research at large and medium scales. In addition, the human dimension [90] as well as the environmental dimension [91,92] are addressed in the study of the indicator system. The human dimension includes socio-demographic and structural aspects. The environmental dimension includes environmental vulnerability and human damage. These studies reveal the resistance of cities to different types of disturbances from different directions. For the impact factors of urban resilience, they are different in different countries, regions, and cities. This should be analyzed according to the specific situation of the city, including the city itself and the situation of its neighboring cities.
This paper finds that the level of urban resilience in Hunan Province has been increasing over the years, indicating that the construction of urban resilience has achieved certain results. However, the level of urban resilience in Hunan Province shows some imbalance. If the differences between cities can not be found accurately, the accuracy of policy formulation will be affected or the policy formulation will be biased, and a more serious “urban Matthew effect” may occur. As mentioned by Bai et al., the construction of urban resilience needs to formulate refined and dynamic strategies according to the city’s region and development stage, combined with the city’s environment and future development [17]. At the same time, the impact factors of spatial patterns of urban resilience are very different. Therefore, it is necessary to balance the level of urban resilience construction through the way of local adaptation, and gradually realize a higher level of urbanization construction. The results of this paper reveal the level of urban resilience in Hunan Province, make up for the shortcomings of urban resilience research in the larger provinces in central China, and provide a certain reference for urban development in central China.

6. Conclusions

Based on the dynamic evolution perspective, this paper constructs an evaluation indicator system in five dimensions to measure the urban resilience level of Hunan Province from 2010 to 2021. The spatial autocorrelation analysis method is used to characterize the evolution of the spatial pattern of urban resilience level. The GeoDetector model is used to identify the dominant impact factors and the interactive relationship between factors. The conclusions are as follows:
(1) From 2010 to 2021, the resilience levels of cities in Hunan Province show a steady upward trend, but the cities with low resilience levels dominated. As a whole, the level of urban resilience in Hunan Province is still at a medium level, and there is a significant “Matthew effect” in urban resilience construction. From the perspective of urban subsystems, ecological resilience shows a slight change and the resilience level of the rest of the subsystems rises steadily. Economic resilience dominates over the long term and all subsystems show a balanced development, with the most significant relative difference reduction in institutional resilience.
(2) The spatial pattern of urban resilience in Hunan Province from 2010 to 2021 shows obvious regional differences. Cities with high resilience levels are located in the “Changsha-Zhuzhou-Xiangtan” urban agglomeration and its surrounding areas. The overall spatial structure shows a gradient of high in the east and low in the west.
(3) The spatial autocorrelation of the urban resilience in Hunan Province from 2010 to 2021 shows positive autocorrelation with obvious spatial agglomeration effects, which are mainly manifested in the “L-H type” agglomeration and the “L-L type” agglomeration. Locally, the scatter plot reflects that the urban resilience level of Hunan Province shows a three-level gradient distribution pattern geographically. The coordinated development of the “Changsha-Zhuzhou-Xiangtan” region has a positive radiation effect, which is reflected as a “H-H type” aggregation. The coordination degree in the western region is weak and has a negative radiation effect, which is reflected as an “L-L type” aggregation. The central region is in a period of transformation and development.
(4) The spatial differentiation of urban resilience is mainly caused by economic and social factors. Factors such as the per capita GDP, urbanization level, research and development expenditure, and the per capita disposable income of rural residents are the leading driving forces for urban resilience construction. The influence of ecological factors, institutional factors, and infrastructure factors on the urban resilience spatial pattern is relatively small. But, the park green area and the number of health personnel per thousand people have a high q value among the impact factors that have passed the 0.05 level significance test and they have a positive promoting effect on the construction of urban resilience. The interaction detection results of the influence factors that passed the significance test at the 0.05 level all show bivariate enhancement, i.e., the interaction between factors is greater than the effect of a single factor. These results suggest that the evolution of the spatial pattern of urban resilience is the result of a combination of the direct drive of economic and social development and the indirect drive of other factors such as ecology, institution, and infrastructure.
However, there are some limitations in this study: (1) Most of the selected indicators are objective indicators, ignoring the non-quantifiable or difficult-to-quantify soft power indicators, such as the influence of culture, the implementation and enforcement of policies, etc. How to combine these factors with the concept of urban resilience construction is a question worth thinking about. (2) There is still a lot of research space for detecting the impact factors of urban resilience. This paper only detects the impact factors of urban resilience based on the GeoDetector model. In the future, we should consider combining it with econometric models and geographically weighted regression analyses to explore the impact factors of urban resilience further. (3) In terms of the research scale, it is necessary to expand the research scope of urban resilience, for example, to all cities in central China. At the same time, the relationship between the level of resilience at micro-geographic scales, such as neighborhoods, and the resilience of the city as a whole, should be considered.

Author Contributions

Conceptualization, Jianhong Chen and Hongcai Ma; methodology, Zhiyong Zhou and Hongcai Ma; validation, Shan Yang and Zhiyong Zhou; formal analysis, Jianhong Chen; data curation, Hongcai Ma and Zhiyong Zhou; writing—original draft preparation, Hongcai Ma, Jianhui Huang and Licheng Chen; writing—review and editing, Shan Yang, Jianhui Huang and Licheng Chen; visualization, Jianhui Huang and Licheng Chen; project administration, Zhiyong Zhou and Jianhong Chen. All authors have read and agreed to the published version of the manuscript.

Funding

This research was funded by the National Natural Science Foundation Project of China under Grant No. 52274163, and the Graduate Student Innovation Fund Project of Central South University, grant No. 2022ZZTS0594.

Data Availability Statement

Not applicable.

Acknowledgments

The authors would like to express thanks to the National Natural Science Foundation Project of China and Graduate Student Innovation Fund Project of Central South University.

Conflicts of Interest

The authors declare no conflict of interest.

References

  1. Brenner, N.; Schmid, C. The ‘Urban Age’ in Question. Int. J. Urban Reg. Res. 2014, 38, 731–755. [Google Scholar] [CrossRef]
  2. Kennedy, C.A.; Ibrahim, N.; Hoornweg, D. Low-carbon infrastructure strategies for cities. Nat. Clim. Change 2014, 4, 343–346. [Google Scholar] [CrossRef]
  3. Liu, Y.; Wang, H.; Qian, H.; Wang, Y. Urban resilience: Connotation and evaluation system. J. Catastrophology 2019, 34, 8–12. [Google Scholar] [CrossRef]
  4. Fan, Y.; Yu, G.; He, Z. Origin, spatial pattern, and evolution of urban system: Testing a hypothesis of “urban tree”. Habitat Int. 2017, 59, 60–70. [Google Scholar] [CrossRef]
  5. You, X.; Sun, Y.; Liu, J. Evolution and analysis of urban resilience and its influencing factors: A case study of Jiangsu Province, China. Nat. Hazards 2022, 113, 1751–1782. [Google Scholar] [CrossRef] [PubMed]
  6. Masnavi, M.R.; Gharai, F.; Hajibandeh, M. Exploring urban resilience thinking for its application in urban planning: A review of literature. Int. J. Environ. Sci. Technol. 2019, 16, 567–582. [Google Scholar] [CrossRef]
  7. Cao, Q.; Huang, Y.; Ran, B.; Zeng, G.; Van Rompaey, A.; Shi, M. Coordination Conflicts between Urban Resilience and Urban Land Evolution in Chinese Hilly City of Mianyang. Remote Sens. 2021, 13, 4887. [Google Scholar] [CrossRef]
  8. Leichenko, R. Climate change and urban resilience. Curr. Opin. Environ. Sustain. 2011, 3, 164–168. [Google Scholar] [CrossRef]
  9. Ahern, J. From fail-safe to safe-to-fail: Sustainability and resilience in the new urban world. Landsc. Urban Plan. 2011, 100, 341–343. [Google Scholar] [CrossRef]
  10. Cavallaro, M.; Asprone, D.; Latora, V.; Manfredi, G.; Nicosia, V. Assessment of Urban Ecosystem Resilience through Hybrid Social-Physical Complex Networks. Comput-Aided. Civ. Inf. 2014, 29, 608–625. [Google Scholar] [CrossRef]
  11. Li, G.; Kou, C.; Wang, Y.; Yang, H. System dynamics modelling for improving urban resilience in Beijing, China. Resour. Conserv. Recycl. 2020, 161, 104954. [Google Scholar] [CrossRef]
  12. Spaans, M.; Waterhout, B. Building up resilience in cities worldwide-Rotterdam as participant in the 100 Resilient Cities Programme. Cities 2017, 61, 109–116. [Google Scholar] [CrossRef]
  13. Qin, X.; Wu, Y.; Lin, T.; Gao, L. Urban Flood Dynamic Risk Assessment Based on Typhoon Rainfall Process: A Case Study of Typhoon “Lupit” (2109) in Fuzhou, China. Remote Sens. 2023, 15, 3116. [Google Scholar] [CrossRef]
  14. Motesharrei, S.; Rivas, J.; Kalnay, E.; Asrar, G.R.; Busalacchi, A.J.; Cahalan, R.F.; Cane, M.A.; Colwell, R.R.; Feng, K.; Franklin, R.S.; et al. Modeling sustainability: Population, inequality, consumption, and bidirectional coupling of the Earth and Human Systems. Natl. Sci. Rev. 2016, 3, 470–494. [Google Scholar] [CrossRef]
  15. Beijing Municipal People’s Government. Notice on Guiding Opinions on Accelerating the Construction of Urban resilience. Available online: https://www.beijing.gov.cn/zhengce/zhengcefagui/202111/t20211111_2534214.html (accessed on 15 April 2023).
  16. X Sanchez, A.; Jeroen, V.D.H.; Osmond, P. The city politics of an urban age: Urban resilience conceptualisations and policies. Palgr. Commun. 2018, 4, 25. [Google Scholar] [CrossRef]
  17. Bai, L.; Xiu, C.; Feng, X.; Mei, D.; Wei, Y. A comprehensive assessment of urban resilience and its spatial differentiation in China. World Reg. Stud. 2019, 28, 77–87. [Google Scholar]
  18. Klein, R.J.T.; Nicholls, R.J.; Thomalla, F. Resilience to natural hazards: How useful is this concept? Environ. Hazards 2003, 5, 35–45. [Google Scholar] [CrossRef]
  19. Gunderson, L.H. Ecological resilience—In theory and application. Annu. Rev. Ecol. Syst. 2000, 31, 425–439. [Google Scholar] [CrossRef]
  20. Bruijn, K.M.D. Resilience and flood risk management. Water Policy 2004, 6, 53–66. [Google Scholar] [CrossRef]
  21. Folke, C.; Carpenter, S.R.; Walker, B.; Scheffer, M.; Chapin, T.; Rockström, J. Resilience thinking: Integrating resilience, adaptability and transformability. Ecol. Soc. 2010, 15, 20. [Google Scholar] [CrossRef]
  22. Holling, C.S. Resilience and Stability of Ecological Systems. Annu. Rev. Ecol. Syst. 1973, 4, 1–23. [Google Scholar] [CrossRef]
  23. Nelson, D.R.; Adger, W.N.; Brown, K. Adaptation to environmental change: Contributions of a resilience framework. Annu. Rev. Environ. Resour. 2007, 32, 395–419. [Google Scholar] [CrossRef]
  24. Holling, C.S. Engineering resilience. In Engineering within Ecological Constraints; Schulze, P.E., Ed.; National Academy Press: Washington, DC, USA, 1996; pp. 31–43. [Google Scholar]
  25. Adger, W.N. Social and ecological resilience: Are they related? Prog. Hum. Geogr. 2000, 24, 347–364. [Google Scholar] [CrossRef]
  26. Walker, B.; Holling, C.S.; Carpenter, S.R.; Kinzig, A. Resilience, adaptability and transformability in social–ecological systems. Ecol. Soc. 2004, 9, 5. [Google Scholar] [CrossRef]
  27. Wilkinson, C. Social-ecological resilience: Insights and issues for planning theory. Plan. Theory 2012, 11, 148–169. [Google Scholar] [CrossRef]
  28. Coaffee, J. Risk, resilience, and environmentally sustainable cities. Energy Policy 2008, 36, 4633–4638. [Google Scholar] [CrossRef]
  29. Cutter, S.L.; Barnes, L.; Berry, M.; Burton, C.; Evans, E.; Tate, E.; Webb, J. A place-based model for understanding community resilience to natural disasters. Glob. Environ. Change-Hum. Policy Dimens. 2008, 18, 598–606. [Google Scholar] [CrossRef]
  30. Xu, Y.; Li, G.; Cui, S.; Xu, Y.; Pan, J.; Tong, N.; Xu, J.; Zhu, Y. Review and perspective on resilience science: From ecological theory to urban practice. Acta. Ecol. Sin. 2018, 38, 5297–5304. [Google Scholar]
  31. Liu, B. The Strategies of Integrating Local Knowledge into Community-based Disaster Risk Reduction: A Case Study of Aba Prefecture in Sichuan Province. J. Guangzhou Univ. (Soc. Sci. Edn.) 2016, 15, 19–27. [Google Scholar]
  32. Greater London Authority. Managing Climate Risks and Increasing Resilience; Greater London Authority: London, UK, 2011. [Google Scholar]
  33. Huang, H.; Li, R.; Fan, W.; Shan, C. Analysis on characteristics of safety resilient city and enlightenments for safe development of Xiongan New Area. J. Saf. Sci. Technol. 2018, 14, 5–11. [Google Scholar]
  34. Xinhua News Agency. The 14th Five- Year Plan for the National Economic and Social Development of the People’s Republic of China and the Outline of Long-term Goals for 2035. Gazette of the State Council of the People’s Republic of China. Available online: http://www.gov.cn/xinwen/2021-03/13/content_5592681.htm?pc (accessed on 18 May 2023).
  35. Alberti, M.; Marzluff, J.M.; Shulenberger, E.; Bradley, G.; Ryan, C.; Zumbrunnen, C. Integrating humans into ecology: Opportunities and challenges for studying urban ecosystems. BioScience 2003, 53, 1169–1179. [Google Scholar] [CrossRef]
  36. Shao, Y.; Xu, J. Understanding Urban Resilience: A Conceptual Analysis Based on Integrated International Literature Review. Urban Plan. Int. 2015, 30, 48–54. [Google Scholar]
  37. Ernstson, H.; van der Leeuw, S.E.; Redman, C.L.; Meffert, D.J.; Davis, G. Urban Transitions: On Urban Resilience and Human-Dominated Ecosystems. Ambio 2010, 39, 531–545. [Google Scholar] [CrossRef] [PubMed]
  38. Liao, K.H. A theory on urban resilience to floods—A basis for alternative planning practices. Ecol. Soc. 2012, 17, 48. [Google Scholar] [CrossRef]
  39. The World Bank. World Development Report 2009; The World Bank: Washington, DC, USA, 2008; pp. 73–78. [Google Scholar]
  40. Coleman, J.S. The rational reconstruction of society. Am. Sociol. Rev. 1993, 58, 1–15. [Google Scholar] [CrossRef]
  41. Putnam, R. Making Democracy Work: Civic Transition in Modern Italy; Princeton University Press: Princeton, NJ, USA, 1993. [Google Scholar]
  42. Coleman, J.S. Social Capital in the Creation of Human Capital. Am. J. Sociol. 1988, 94, S95–S120. [Google Scholar] [CrossRef]
  43. Manyena, S.B. The concept of resilience revisited. Disasters 2006, 30, 434–450. [Google Scholar] [CrossRef]
  44. Hudec, O.; Reggiani, A.; Šiserová, M. Resilience capacity and vulnerability: A joint analysis with reference to Slovak urban districts. Cities 2018, 73, 24–35. [Google Scholar] [CrossRef]
  45. Xu, Z.; Tian, J.; Zhang, J. Urban resilience evaluation system and optimization strategy from perspective of disaster prevention. Chin. Saf. Sci. J. 2019, 29, 1–7. [Google Scholar]
  46. Cutter, S.L.; Ash, K.D.; Emrich, C.T. The geographies of community disaster resilience. Glob. Environ. Change 2014, 29, 65–77. [Google Scholar] [CrossRef]
  47. Lu, H.; Zhang, C.; Jiao, L.; Wei, Y.; Zhang, Y. Analysis on the spatial-temporal evolution of urban agglomeration resilience: A case study in Chengdu-Chongqing Urban Agglomeration, China. Int. J. Disaster Risk Reduct. 2022, 79, 103167. [Google Scholar] [CrossRef]
  48. Joerin, J.; Shaw, R.; Takeuchi, Y.; Krishnamurthy, R. Action-oriented resilience assessment of communities in Chennai, India. Environ. Hazards 2012, 11, 226–241. [Google Scholar] [CrossRef]
  49. Yang, Y.; Lin, L.; Zhong, Z.; Ou, Y.; Xu, Q.; Meng, M.; Hao, S. Comprehensive evaluation and spatial differentiation of community resilience in Guangzhou based on response of the city to public health hazards. Acta. Geogr. Sin. 2019, 74, 266–284. [Google Scholar] [CrossRef]
  50. Karunarathne, A.Y.; Lee, G. How do urban reciprocal support network legacies matter to improve the resiliency of urban informal livelihoods? Sust. Cities Soc. 2022, 77. [Google Scholar] [CrossRef]
  51. Liu, L.; Lei, Y.; Zhuang, M.; Ding, S. The impact of climate change on urban resilience in the Beijing-Tianjin-Hebei region. Sci. Total Environ. 2022, 827, 154157. [Google Scholar] [CrossRef]
  52. Datola, G.; Bottero, M.; De Angelis, E.; Romagnoli, F. Operationalising resilience: A methodological framework for assessing urban resilience through System Dynamics Model. Ecol. Model. 2022, 465, 109851. [Google Scholar] [CrossRef]
  53. Wei, S.; Pan, J. Resilience of Urban Network Structure in China: The Perspective of Disruption. ISPRS Int. J. Geo-Inf. 2021, 10, 796. [Google Scholar] [CrossRef]
  54. Sherrieb, K.; Norris, F.H.; Galea, S. Measuring capacities for community resilience. Soc. Indic. Res. 2010, 99, 227–247. [Google Scholar] [CrossRef]
  55. Wang, J.; Gu, G.; Yao, L.; Chen, Y. Analysis of new urbanization’s spatial pattern evolution and influence factors in China. Sci. Geogr. Sin. 2016, 36, 63–71. [Google Scholar]
  56. Yang, S.; Wang, L. Spatio-temporal Evolution Characteristics and Influencing Factors of Small Towns’ Circulation Industry in Mount Wuling of Hunan Province. Econ. Geogr. 2022, 42, 127–134. [Google Scholar] [CrossRef]
  57. Cao, X.; Xu, J. Spatial heterogeneity analysis of regional economic development and driving factors in China’s provincial border counties. Acta. Geogr. Sin. 2018, 73, 1065–1075. [Google Scholar] [CrossRef]
  58. Hao, F.; Shi, X.; Bai, X.; Wang, S. Geographic detection and multifunctional land use from the perspective of urban diversity: A case study of Changchun. Geogr. Res. 2019, 38, 247–258. [Google Scholar] [CrossRef]
  59. Song, Z.; Zhu, Q. Spatio-temporal pattern and driving forces of urbanization in China’s border areas. Acta. Geogr. Sin. 2020, 75, 1603–1616. [Google Scholar] [CrossRef]
  60. Zhao, R.; Fang, C.; Liu, H.; Liu, X. Evaluating urban ecosystem resilience using the DPSIR framework and the ENA model: A case study of 35 cities in China. Sust. Cities Soc. 2021, 72, 102997. [Google Scholar] [CrossRef]
  61. Sun, Y.; Zhang, L.; Yao, S. Evaluation resilience of prefecture cities in the Yangtze River delta region from a socio-ecological perspective. Chin. Popul. Resour. Environ. 2017, 27, 151–158. [Google Scholar] [CrossRef]
  62. Xiu, C.; Wei, Y.; Wang, Q. Evaluation of urban resilience of Dalian city based on the perspective of “Size-Density-Morphology”. Acta. Geogr. Sin. 2018, 73, 2315–2328. [Google Scholar] [CrossRef]
  63. Ruan, J.; Chen, Y.; Yang, Z. Assessment of temporal and spatial progress of urban resilience in Guangzhou under rainstorm scenarios. Int. J. Disaster Risk Reduct. 2021, 66, 102578. [Google Scholar] [CrossRef]
  64. Hunan Provincial People’s Government. Basic Information of Hunan Province. Available online: http://www.hunan.gov.cn/hnszf/jxxx/hngk/hngk.html (accessed on 6 July 2023).
  65. Department of Emergency Management of Hunan Province. Natural Disaster Information of Hunan Province in 2019. Available online: http://yjt.hunan.gov.cn/yjt/xxgk/gzdt/sjdt/201912/t20191227_11018795.html (accessed on 6 July 2023).
  66. Ning, X.; Zhang, X.; Zhang, X.; Wang, H.; Zhang, W. A Method for Assessing Urban Ecological Resilience and Identifying Its Critical Distance Belt Based on the “Source-Sink” Theory: A Case Study of Beijing. Remote Sens. 2023, 15, 2502. [Google Scholar] [CrossRef]
  67. Afsari, R.; Nadizadeh Shorabeh, S.; Kouhnavard, M.; Homaee, M.; Arsanjani, J.J. A Spatial Decision Support Approach for Flood Vulnerability Analysis in Urban Areas: A Case Study of Tehran. ISPRS Int. J. Geo-Inf. 2022, 11, 380. [Google Scholar] [CrossRef]
  68. Zhang, J.; Wang, H.; Huang, J.; Sun, D.; Liu, G. Evaluation of Urban Flood Resilience Enhancement Strategies—A Case Study in Jingdezhen City under 20-Year Return Period Precipitation Scenario. ISPRS Int. J. Geo-Inf. 2022, 11, 285. [Google Scholar] [CrossRef]
  69. Lester, T.W.; Nguyen, M.T. The economic integration of immigrants and regional resilience. J. Urban Aff. 2016, 38, 42–60. [Google Scholar] [CrossRef]
  70. Tian, L.; Li, J.; Ouyang, W.; Chen, W.; Zeng, H.; Xiao, Y. Relationships between urban-rural planning and public health and some thoughts on a inter-disciplinary research framework. Urban Plan. Forum. 2016, 2, 111–116. [Google Scholar] [CrossRef]
  71. Chen, X.; Lou, J.; Wang, Y. Evolution and dynamic simulation of the temporal-spatial pattern of urban resilience in Harbin-Changchun Urban Group. Sci. Geogr. Sin. 2020, 40, 2000–2009. [Google Scholar] [CrossRef]
  72. Zheng, Y.; Xie, X.; Lin, C.; He, X. Development as adaptation: Framing and measuring urban resilience in Beijing. Adv. Clim. Change Res. 2018, 9, 234–242. [Google Scholar] [CrossRef]
  73. Zhao, R.; Fang, C.; Liu, H. Progress and prospect of urban resilience research. Prog. Geogr. 2020, 39, 1717–1731. [Google Scholar] [CrossRef]
  74. Tian, S.; Li, X.; Yang, J.; Zhang, C.; Zhang, Y. Initial Study on Triaxiality of Human Settlements—In the Case of 10 Districts (Counties) of Dalian. Sustainability 2014, 6, 7276–7291. [Google Scholar] [CrossRef]
  75. Zhang, Z.; Zhang, Y.; Zhang, J.; Lang, Q.; Yan, J.; Duan, C. Urban Resilience Assessment Based on Entropy Weight Method and TOPSIS Model-Take Changchun City as an Example. J. Catastrophology 2023, 38, 213–219. [Google Scholar] [CrossRef]
  76. Yao, X. Analysis on the Current Situation, Internal Coupling and Influencing Factors of the Urban Resilience of China’s Provincial Capital Cities. Master’s Thesis, Zhejiang University, Hangzhou, China, 2022. [Google Scholar] [CrossRef]
  77. Qi, Y.; Yang, Y.; Jin, F. China’s economic development stage and its patio-temporal evolution: A prefectural-level analysis. Acta Geogr. Sin. 2013, 68, 517–531. [Google Scholar]
  78. Long, T.; Yin, J.; Ou, Z.; Yang, Q.; Li, Y.; Wang, Q. Comprehensive assessment and spatial pattern study on forest fire risk in Yunnan Province. Chin. Saf. Sci. J. 2021, 31, 167–173. [Google Scholar] [CrossRef]
  79. Ou, Z.; Zhu, Q.; Sun, Y. Regional ecological security and diagnosis of obstacle factors in underdeveloped regions: A case study in Yunnan Province, China. J Mt. Sci. 2017, 14, 870–884. [Google Scholar] [CrossRef]
  80. Ma, W.; Bai, Y.; Zhang, Y.; Zhou, P.; Niu, Z.; Feng, H. Spatial Pattern and Convergence of New Urbanization in China: 2002–2011. Econ. Geogr. 2015, 35, 62–70. [Google Scholar] [CrossRef]
  81. Wang, J.; Xu, C. Geodetector: Principle and prospective. Acta. Geogr. Sin. 2017, 72, 116–134. [Google Scholar] [CrossRef]
  82. Wang, J.; Hu, Y. Environmental health risk detection with GeogDetector. Environ. Modell. Softw. 2012, 33, 114–115. [Google Scholar] [CrossRef]
  83. Song, Y.; Liu, Y.; Zhang, Y.; Wang, S. Spatio-temporal differentiation characteristics and influencing factors of hand, foot, and mouth disease in China. Acta. Geogr. Sin. 2022, 77, 574–588. [Google Scholar] [CrossRef]
  84. Huang, C.; Lin, F.; Chu, D.; Wang, L.; Liao, J.; Wu, J. Spatiotemporal Evolution and Trend Prediction of Tourism Economic Vulnerability in China’s Major Tourist Cities. ISPRS Int. J. Geo-Inf. 2021, 10, 644. [Google Scholar] [CrossRef]
  85. Qin, S.; You, H.; Liu, D.; Qie, M. Research on Urban Resilience Measurement and Spatial Evolution in Hunan Province. China-Arab States Sci. Technol. Forum. 2022, 3, 7–11. [Google Scholar]
  86. Liu, X. Green Efficiency of Urban Region Development: A Case of Hunan Province. J. Urban Stud. 2020, 41, 39–44. [Google Scholar]
  87. Gimenez, R.; Labaka, L.; Hernantes, J. A maturity model for the involvement of stakeholders in the city resilience building process. Technol. Forecast. Soc. Chang. 2017, 121, 7–16. [Google Scholar] [CrossRef]
  88. Metzger, M.J.; Leemans, R.; Schröter, D. A multidisciplinary multi-scale framework for assessing vulnerabilities to global change. Int. J. Appl. Earth Obs. Geoinf. 2005, 7, 253–267. [Google Scholar] [CrossRef]
  89. Arif, M.; Gupta, K. Spatial development planning in peri-urban space of Burdwan City, West Bengal, India: Statutory infrastructure as mediating factors. SN Appl. Sci. 2020, 2, 1779. [Google Scholar] [CrossRef]
  90. Zhao, G.; Zhang, W. Research on socio-economic vulnerability of coastal zone. Statist. Decis. 2006, 5, 12–14. [Google Scholar]
  91. RS and GIS based study on fragirity of ecological environment in Fuzhou City. J. Nat. Disasters. 2007, 2, 133–137.
  92. Pang, S.; Liu, K.; Ji, W. Ecological vulnerability evaluation of Yan’an city. J. Arid Land. Resour. Environ. 2011, 25, 63–66. [Google Scholar] [CrossRef]
Figure 1. Research framework.
Ijgi 12 00391 g001
Figure 2. Study area: (a) Regional distribution map of Hunan Province; (b) elevation map of Hunan Province.
Ijgi 12 00391 g002
Figure 3. Changes in coefficient of variation and standard deviation of urban resilience subsystem in Hunan province.
Ijgi 12 00391 g003
Figure 4. Summary of urban subsystem resilience indexes of Hunan Province from 2010 to 2021.
Ijgi 12 00391 g004
Figure 5. Spatial distribution of urban resilience levels in Hunan Province. (a) Spatial distribution of resilience levels in 2010; (b) Spatial distribution of resilience levels in 2015; (c) Spatial distribution of resilience levels in 2021.
Ijgi 12 00391 g005
Figure 6. Global Moran’s I and scatter plots of urban resilience in Hunan Province from 2010 to 2021.
Ijgi 12 00391 g006aIjgi 12 00391 g006b
Figure 7. Scatter plot of urban resilience level in Hunan Province. (a) Scatter map of urban resilience in 2010; (b) Scatter map of urban resilience in 2015; (c) Scatter map of urban resilience in 2021.
Ijgi 12 00391 g007
Figure 8. Interaction of impact factors in 2010, 2015, and 2021.
Ijgi 12 00391 g008aIjgi 12 00391 g008b
Table 1. Evaluation indicator system and weight of urban resilience in Hunan Province.
SubsystemCharacterizing ElementsUnitDirectionReferenceIndicator Weight/10−1
Ecological
Resilience
(a)
a1 The green coverage rate of built-up areas%+[71,72,73]0.055
a2 Per capita green aream2/person+[17,46,72,73]0.217
a3 Park green areahectare+[46,48,73]0.469
a4 Average annual precipitationmmModerate[67]0.318
a5 PM2.5 pollutant concentrationμg/m3[73]0.075
a6 Industrial sulfur dioxide emissions per square kilometert/km2[17,73]0.038
a7 Sewage treatment rate%+[17,73]0.049
a8 Comprehensive utilization rate of industrial solid waste%+[17,73]0.038
Economic
Resilience
(b)
b1 Per capita GDPyuan/person+[17,46,48,72,73]0.282
b2 Balance of savings account of urban and rural residents at the end of the yearbillion+[44,48,73]0.326
b3 Urban registered unemployed populationperson[17,48,73]0.044
b4 Local fiscal revenueten thousand yuan+ 0.581
b5 Urbanization level%+[72,73]0.172
b6 Total factor productivity + 0.205
b7 Proportion of tertiary sector of the economy in GDP%+[17,46,73]0.216
b8 Research and development expenditureten thousand yuan+ 0.803
b9 Total score of urban scientific and technological innovation + 0.125
b10 GDP of the secondary industry of the economybillion+[49]0.429
b11 GDP of the tertiary industry of the economybillion+[46,49,73]0.542
Social
Resilience
(c)
c1 Per capita disposable income of rural residentsyuan/person+[17,44,46,48,72,73]0.237
c2 Average annual salary of on-the-job employeesyuan/person+[17,73]0.197
c3 Population densityperson/km2[48,49,72]0.051
c4 Proportion of social security and employment in fiscal expenditure%+[17,46,48,72,73]0.079
c5 Number of college students per 10,000 peopleperon/ten thousand people+[44,46,49]0.791
c6 Proportion of tertiary industry of the economy employees%+[17,49,73]0.105
c7 Population of public management and social organizations%+[49,72]0.171
c8 Medical insurance coverage rate%+[44,72]0.218
c9 Engel’s coefficient for all residents 0.108
Institutional
Resilience
(d)
d1 Per capita financial expenditureyuan/person+[44,48]0.179
d2 Input level of general public service%+ 0.171
d3 Number of government agencies, enterprises, and public institutions%+ 0.098
d4 Density of urban health institutionspiece/km2+[49]0.524
d5 Number of health personnel per thousand peopleperson/thousand people+[46,49]0.184
d6 Number of hospital beds per 10,000 peoplesheet/ten thousand people+[17,44,46,73]0.153
Infrastructure Resilience
(e)
e1 Per capita road aream2/person+[17,44,46,48,49,73]0.204
e2 Comprehensive capacity of highway networkkm/km2+ 0.215
e3 Number of public transportation vehicles per 10,000 peopleset/ten thousand people+[17,73]0.211
e4 Drainage pipeline densitykm/km2+[44,46]0.090
e5 Per capita daily water consumptionliter/person 0.074
e6 Gas penetration rate%+[17,46,73]0.040
e7 Number of mobile phone usersten thousand users+[17,49,73]0.269
e8 Number of fixed internet usersten thousand users+[46,49,72,73]0.375
e9 Number of public health facilities per 10,000 peopleset/ten thousand people+[44,49,73]0.270
Note: Excessive precipitation is prone to floods, while too little is prone to droughts. Moreover, the average annual precipitation is affected by multiple factors such as topography and climate, so there is no recognized moderate value. Based on the actual situation, 1500 mm is selected as the moderate value for the average annual precipitation in Hunan Province.
Table 2. Interaction types and discrimination basis of GeoDetector.
CriterionInteraction
q(X1∩X2) < Min(q(X1), q(X2))Weaken; nonlinear
Min(q(X1), q(X2)) < q(X1∩X2) < Max(q(X1), q(X2))Weaken; nonlinear; univariate
q(X1∩X2) > Max(q(X1), q(X2))Enhance; bivariate
q(X1∩X2) = q(X1) + q(X2)Independent
q(X1∩X2) > q(X1) + q(X2)Enhance; nonlinear
Table 3. Calculation results of urban resilience indexes of cities in Hunan Province from 2010 to 2021.
Cities201020112012201320142015201620172018201920202021
Changsha0.42390.47570.49010.51170.54910.60140.64110.68930.71290.77030.76850.8075
Zhuzhou0.22880.25480.25920.26990.27060.29060.33050.33420.34980.38390.41490.4253
Xiangtan0.24830.26850.26960.27480.28690.30310.34290.34990.36910.40790.42180.4466
Hengyang0.18310.21170.20000.23100.21260.25030.27410.29760.33420.35140.38620.3985
Shaoyang0.12230.14870.14000.16040.15650.16670.19150.22140.24120.26680.28230.3145
Yueyang0.17590.20710.20580.23680.22700.25030.26670.28080.29330.33560.35280.3775
Changde0.16850.21270.18550.20940.21610.24080.25560.28140.28690.32940.33880.3583
Zhangjiajie0.14090.17400.15210.17130.15320.17130.19750.22230.23120.24110.24890.2440
Yiyang0.15280.16570.17590.17890.18220.18020.22980.24620.25910.29090.30750.3212
Chenzhou0.14680.18170.18650.17870.21600.21940.25810.25490.28030.30360.29700.3182
Yongzhou0.12750.15890.14120.14810.15720.18190.20770.22440.25080.28110.27180.2843
Huaihua0.13250.16120.15490.15180.15650.16750.17900.20670.23550.24640.26080.2749
Loudi0.14710.17290.16070.17140.16790.19510.20080.23520.25110.29480.31150.3349
Xiangxizhou0.15440.17090.16610.16630.19930.18880.20790.21680.23880.24880.28790.2855
Table 4. GMI, Z, and p values of urban resilience level in Hunan Province from 2010 to 2021.
YearGMIZpConfidence Coefficient
20100.19472.37820.017495%
20110.14322.06030.039495%
20120.19412.49680.012595%
20130.19662.46890.013695%
20140.14712.16020.030895%
20150.14212.15420.031295%
20160.17232.33810.019495%
20170.12092.12700.033495%
20180.09921.90650.056690%
20190.15042.34970.018895%
20200.16782.33010.019895%
20210.18362.46250.013895%
Table 5. GeoDetector model for impact factors of urban resilience in Hunan Province in 2010, 2015, and 2021.
Subsystem201020152021
Impact FactorsqImpact FactorsqImpact Factorsq
Ecological resiliencea30.977 **a30.916 *a30.961 **
a50.897 *a70.904 *
Economic resilienceb10.931 **b10.971 **b10.963 **
b40.913 *b40.908 *b40.918 *
b50.985 **b50.978 **b50.963 **
b80.932 *b80.915 *b80.945 **
b90.908 *b90.942 **b90.969 **
b100.901 *b100.968 **b100.943 **
b110.901 *
Social resiliencec10.972 **c10.961 **c10.976 **
c50.972 **c20.946 **c20.916 *
c80.907 *c50.939 *c30.931 **
c80.906 *c50.942 *
c90.939 **
Institutional resilienced10.904 *d10.887 *d40.933 **
d50.954 **d40.971 **
d60.956 **d50.896 *
Infrastructure resiliencee30.911 *e40.902 *
Note: ** indicates p < 0.01, * indicates p < 0.05.
Disclaimer/Publisher’s Note: The statements, opinions and data contained in all publications are solely those of the individual author(s) and contributor(s) and not of MDPI and/or the editor(s). MDPI and/or the editor(s) disclaim responsibility for any injury to people or property resulting from any ideas, methods, instructions or products referred to in the content.

