Article

Assessing the Influence of Land Cover and Climate Change Impacts on Runoff Patterns Using CA-ANN Model and CMIP6 Data

1
Department of Civil Engineering, International University of Business Agriculture and Technology (IUBAT), Dhaka 1230, Bangladesh
2
Department of Civil Engineering, Kunsan National University, 558 Daehakro, Gunsan 54150, Jeollabuk-do, Republic of Korea
3
Geomatics and Spatial Analytics Research Lab (GSAR), International University of Business Agriculture and Technology (IUBAT), Dhaka 1230, Bangladesh
4
Department of Civil Engineering, Ghulam Ishaq Khan Institute of Engineering Sciences and Technology, Topi, Swabi 23640, Pakistan
5
Key Lab of Mountain Hazards and Surface Process, Institute of Mountain Hazards and Environment, Chinese Academy of Sciences, Chengdu 610041, China
6
Kathmandu Center for Research and Education, Chinese Academy of Sciences-Tribhuvan University, Beijing 100101, China
7
Ministry of Planning, Government of the People’s Republic of Bangladesh, Dhaka 1207, Bangladesh
8
School of Earth and Planetary Sciences, Curtin University, Bentley, WA 6102, Australia
*
Author to whom correspondence should be addressed.
ISPRS Int. J. Geo-Inf. 2023, 12(10), 401; https://doi.org/10.3390/ijgi12100401
Submission received: 18 August 2023 / Revised: 23 September 2023 / Accepted: 28 September 2023 / Published: 1 October 2023

Abstract

:
Dhaka city is experiencing rapid land cover changes, and the effects of climate change are highly visible. Investigating their combined influence on runoff patterns is vital for sustainable urban planning and water resources management. In this work, multi-date land cover classification was performed using a random forest (RF) algorithm. To validate accuracy of land cover classification, an assessment was conducted by employing kappa coefficient, which ranged from 85 to 96%, indicating a high agreement between classified images and the reference dataset. Future land cover changes were forecasted with cellular automata-artificial neural network (CA-ANN) model. Further, soil conservation service -curve number (SCS-CN) rainfall-runoff model combined with CMIP6 climate data was employed to assess how changes in land cover impact runoff within Dhaka metropolitan development plan (DMDP) area. Over the study period (2020–2100), substantial transformations of land cover were observed, i.e., built-up areas expanded to 1146.47 km2 at the end of 2100, while agricultural areas and bare land diminished considerably. Consequently, monsoon runoff increased from 350.14 to 368.24 mm, indicating elevated hydrological responses. These findings emphasized an intricate interplay between urban dynamics and climatic shifts in shaping runoff patterns, underscoring urgency of incorporating these factors into urban planning strategies for sustainable water resources management in a rapidly growing city such as Dhaka.

1. Introduction

Assessing runoff pattern is crucial in hydrology to understand complex interactions between land cover changes, climatic variations, and resulting alterations in water flow patterns [1,2]. Runoff, the portion of precipitation that flows over land into waterbodies, plays a pivotal role in ecosystem dynamics, water resource management, and landscape stability [3,4]. As human activities and climatic conditions intertwined, it is imperative to unravel complex relationships between land use alteration, climate change, and their combined effects on runoff [5,6].
The field of runoff assessment has witnessed substantial growth over the past few decades [7,8,9]. Researchers have extensively explored the impacts of land cover changes, including urbanization, deforestation, and agricultural expansion, on hydrological processes [10,11]. Simultaneously, the effects of climate change on precipitation patterns, temperature, and evapotranspiration rates have been well-documented [12]. However, understanding how these factors synergistically interact to shape runoff dynamics remains a challenge. Divergent hypotheses exist, with some studies suggesting that land cover changes dominate runoff alterations, while others emphasize overriding influence of climate changes [13].
Land cover change and its effect on runoff patterns has substantial implications for Dhaka. Urbanization involves conversion of natural landscapes into built environments, leading to increased impervious surfaces that hinder water infiltration and amplify surface runoff during rainfall events [14]. It often leads to loss of greenspaces and natural habitats, which provide essential services such as temperature regulation, air purification, and biodiversity conservation [15]. Analyzing how shifts in land cover affect these services helps realize the value of preserving greenery within urban landscapes [16]. Importantly, the interaction between land cover and runoff is exacerbated by the specter of climate change. Integrating climate change projections with land cover assessments provides a holistic view of future runoff patterns, enabling adaptive strategies to mitigate worst effects of changing hydrological regimes [17].
Many works have delved into the consequences of land use and land cover (LULC) changes linked to urbanization, particularly their impacts on hydrological dynamics and initiation of runoff [18]. Urban expansion typically involves the proliferation of impermeable surfaces, widely acknowledged as the primary driver behind escalated runoff across urban landscape [19,20]. This phenomenon manifests as heightened peak flow rates, accelerated runoff reaction times, and modifications in hydrological patterns and overall water equilibrium [21]. The soil conservation service-curve number (SCS-CN), alternatively recognized by the US natural resources conservation service curve number (NRCS-CN) method, stands as a preeminent technique for evaluating the impact of LULC changes on hydrological responses [22,23]. It comprehensively encompasses influential factors contributing to runoff generation, encompassing soil attributes, land use variations, and land management practices, all encapsulated within a single CN parameter [24]. The SCS-CN method focuses on delineating the impact of urbanization on runoff behaviors.
This study addresses key questions concerning the projected interactions between LULC changes, climatic shift, and resulting hydrological responses. The first research question aims to understand the efficacy of cellular automata-artificial neural network (CA-ANN) model, operationalized through QGIS MOLUSCE plugin, in projecting future LULC changes within DMDP area. Accurate projection of LULC changes is pivotal as it underpins subsequent analyses of hydrological dynamics [25,26,27]. The second research question pertains to combined effects of the projected LULC changes, simulated via CA-ANN model, and climate data extracted from Centre National de Recherches Météorologiques Coupled Model version 6.1 (CNRM-CM6-1) model under shared socioeconomic pathway 1-2.6 (SSP1-2.6) scenario. A key aim is to understand how these intertwined factors influence Dhaka’s runoff patterns and hydrological behaviors for the year 2100. To achieve these research questions, this study has several objectives. First, CA-ANN model will be developed and implemented through QGIS MOLUSCE plugin to simulate LULC trends. This approach leverages model’s complexity and spatial capabilities to ensure accurate projections. Second, CMIP6 climate data, specifically from CNRM-CM6-1 model under SSP1-2.6 scenario, will be employed for climate projections, with stringent data preprocessing to ensure robustness. Third, by integrating projected LULC changes with climatic variables, runoff dynamics will be simulated using hydrological modeling techniques, i.e., to reveal how runoff behaviors are associated with the combined impact of LULC transformation and climate change. Lastly, the study will assess the implications of altered runoff patterns for water resource management, including water availability and flood risks.
A unique value of this study lies in its detailed examination of specific case of Dhaka city, a rapidly growing urban center in a well-known climate hotspot. By offering quantitative assessments of future runoff projections and their potential hydrological impacts, this study provides actionable insights into potential flood risks, water management strategies, and sustainable urban planning practices. Incorporation of machine learning techniques and climate modeling enhances the robustness of the findings, contributing advancing hydrological modeling methodologies. Given the pressing global challenges posed by urbanization and climate change, researchers in the fields of urban hydrology, climate science, and sustainable urban planning would be benefitted from this work for its innovative methodologies, specific regional focus, and the potential for generalizable insights that can be applied to similar urban contexts elsewhere.

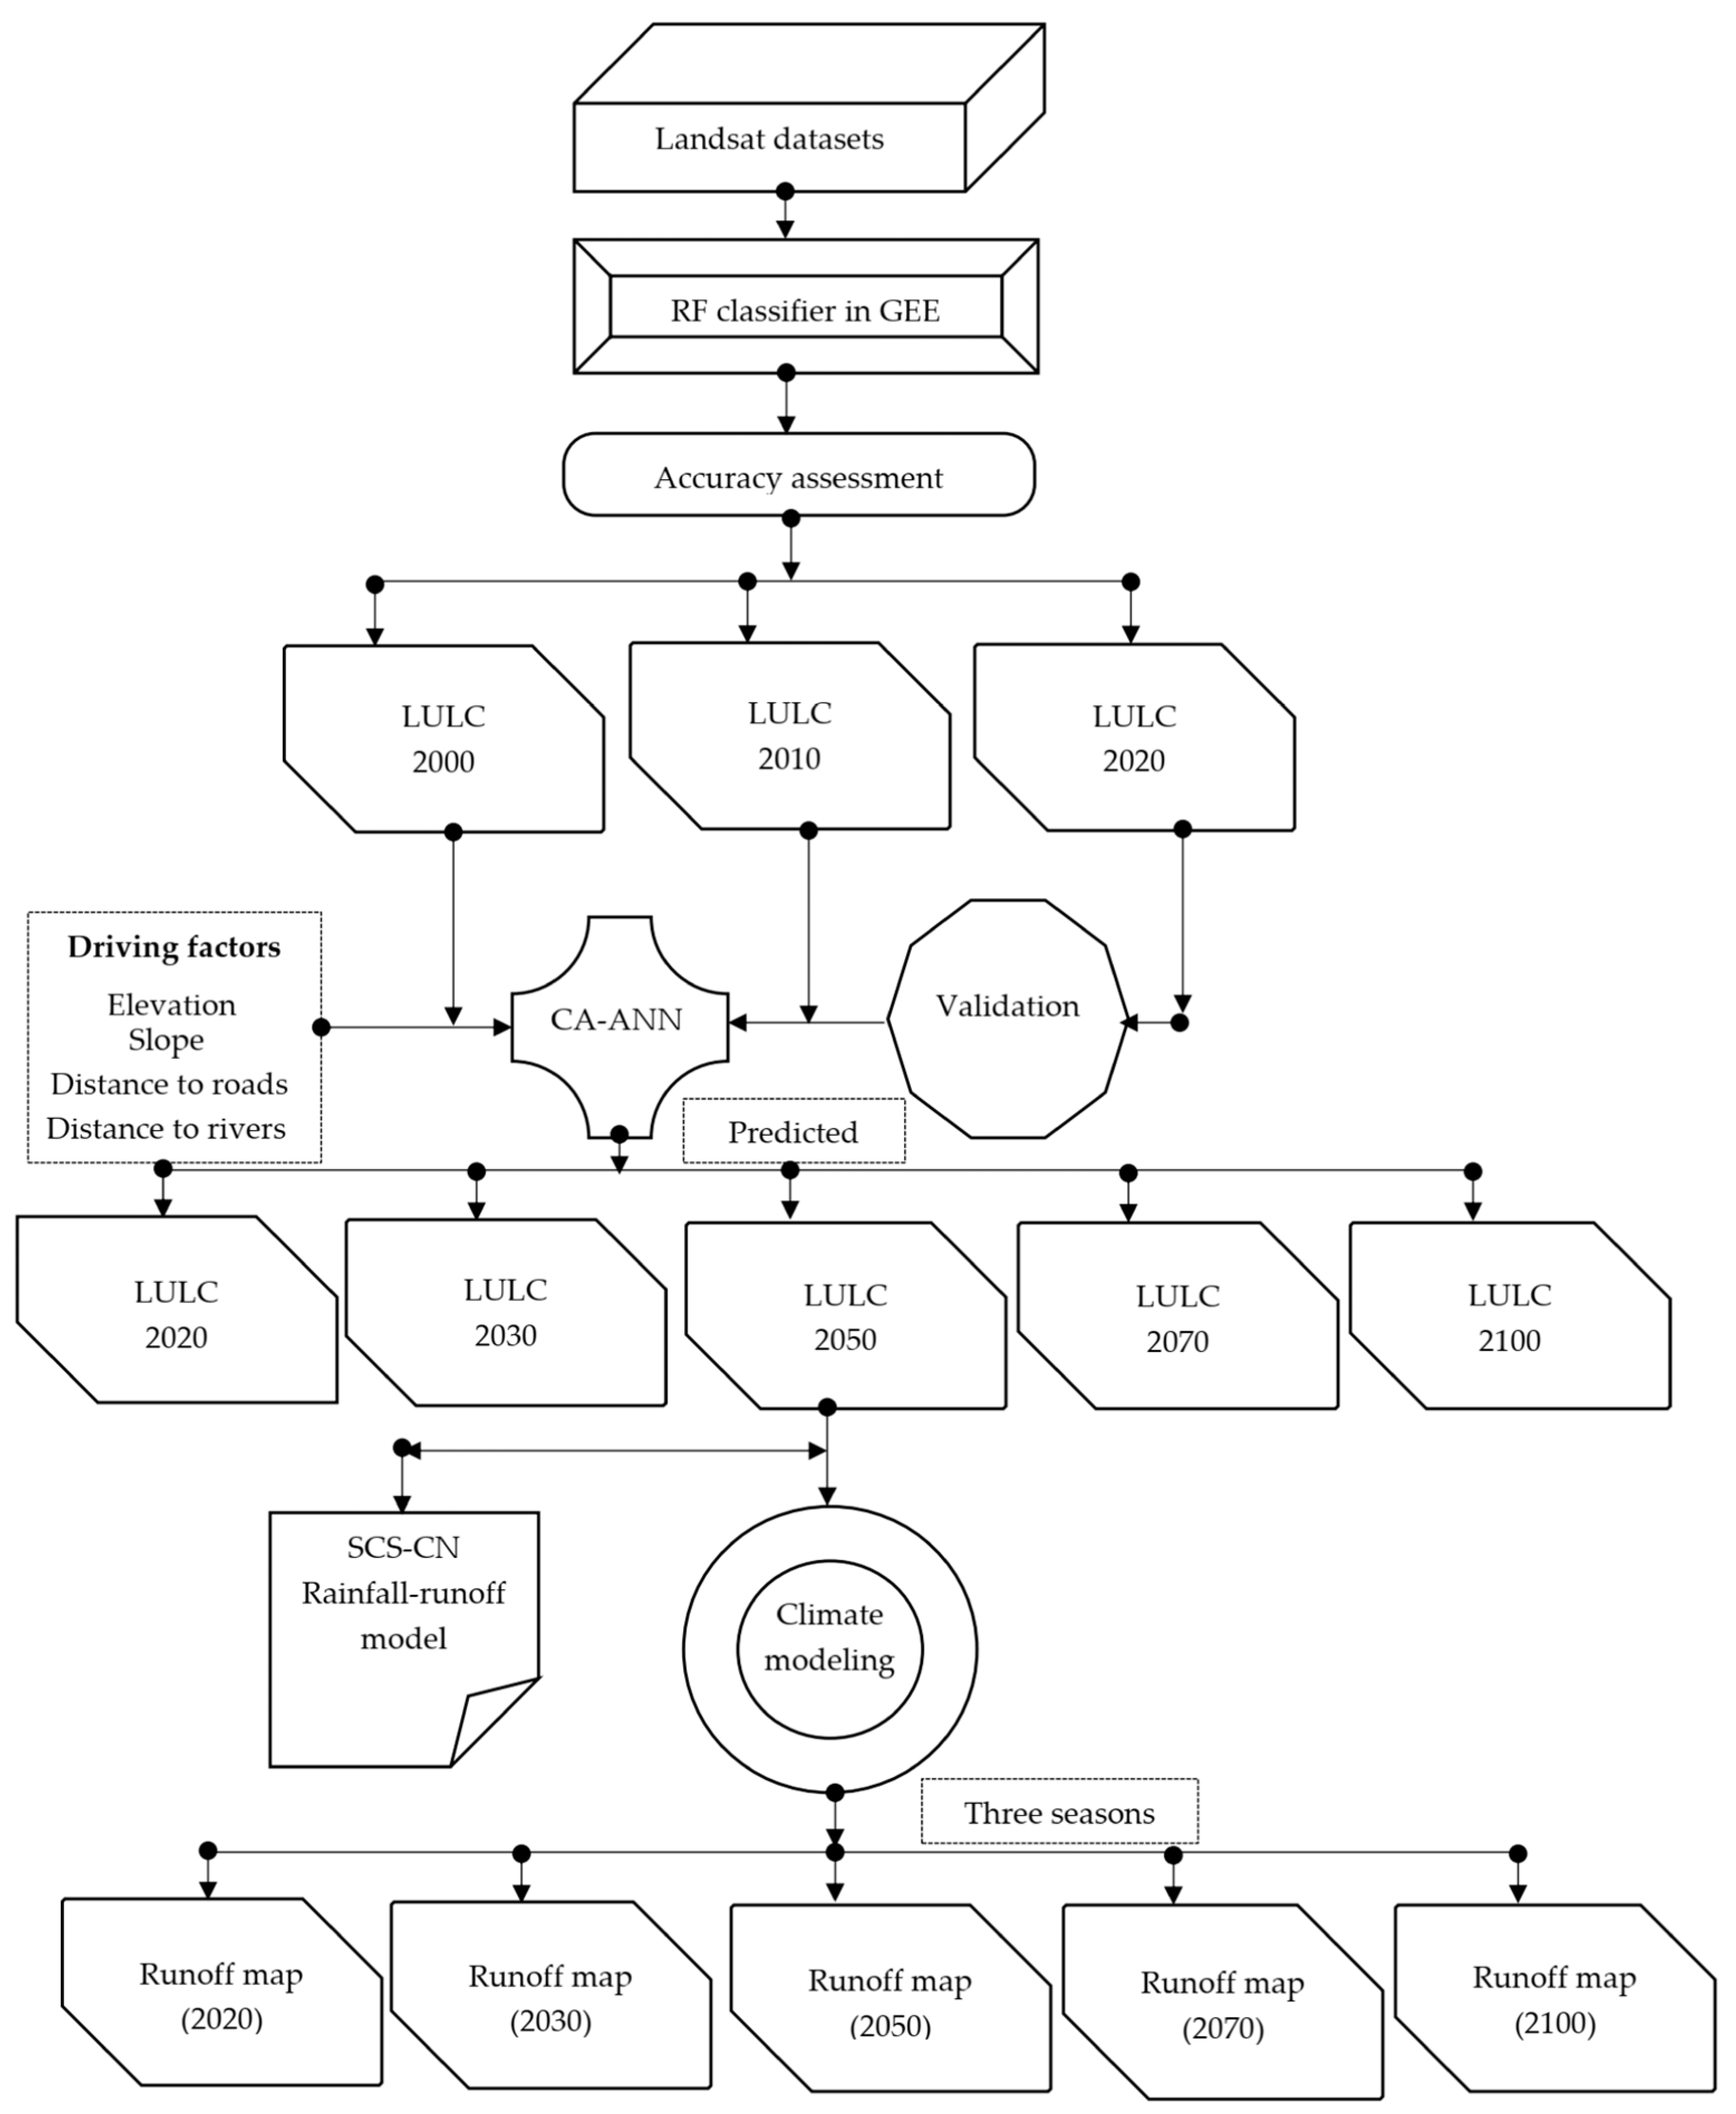
2. Materials and Methods
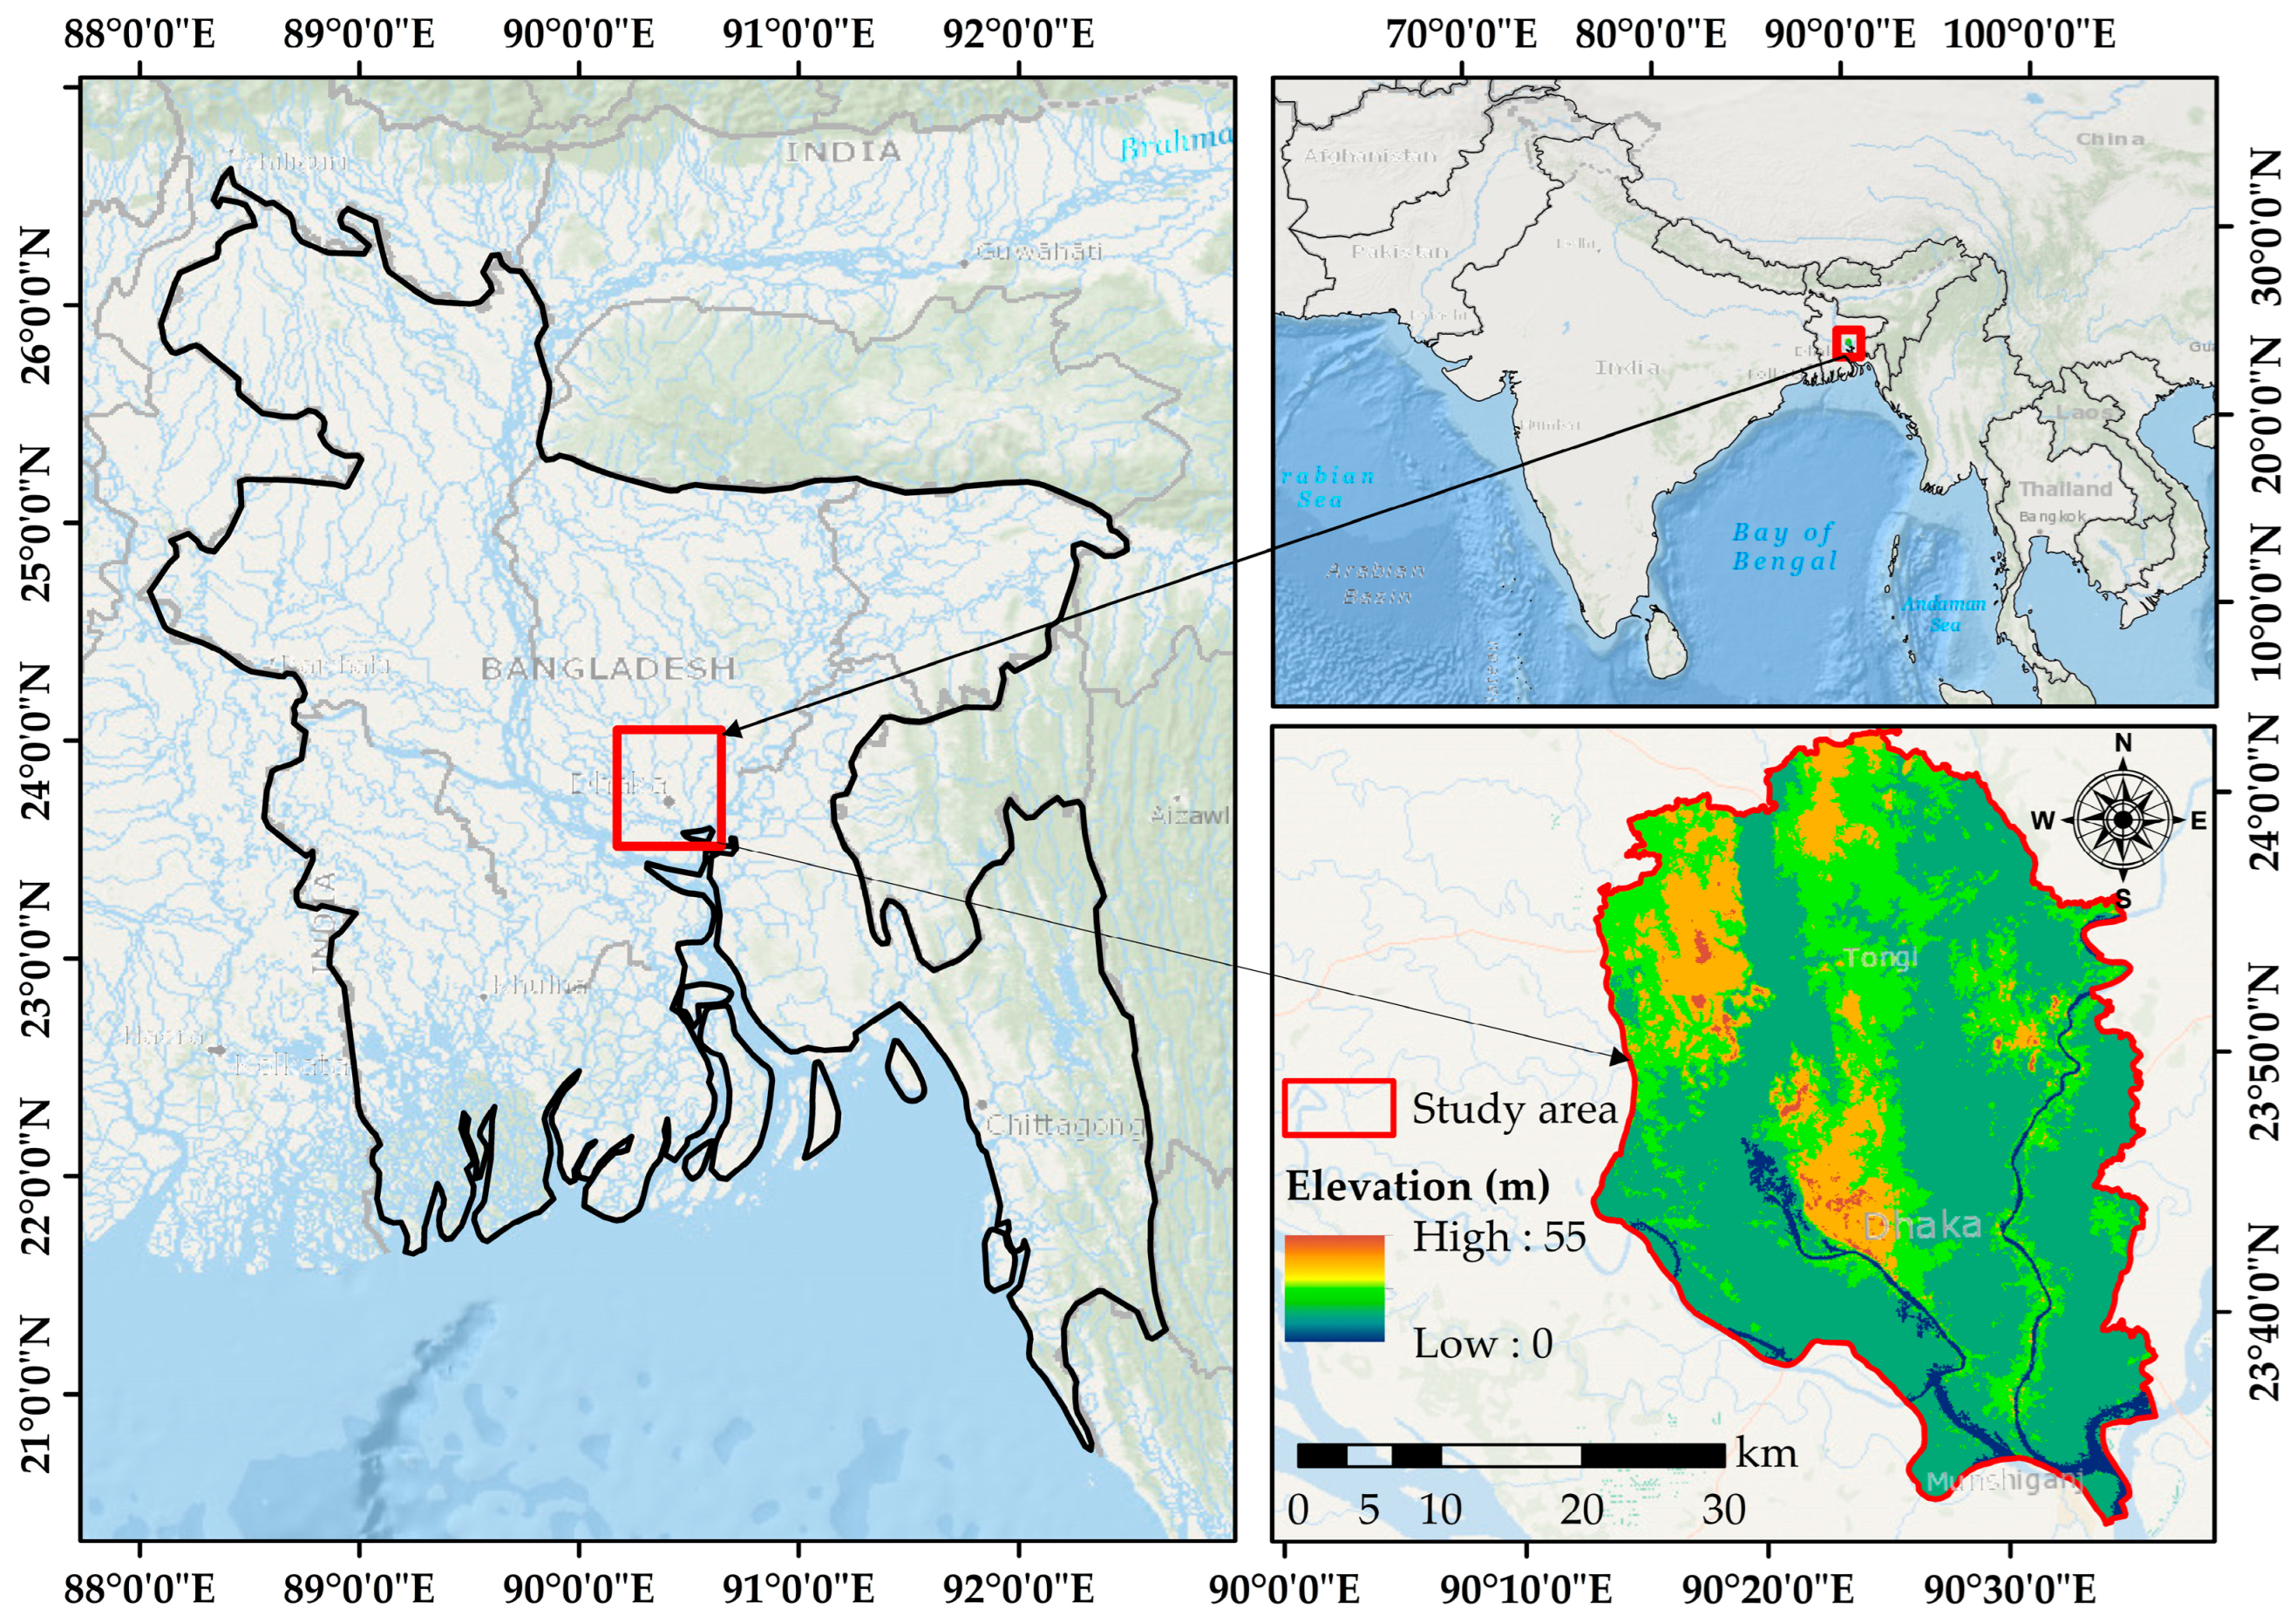
2.1. The Study Area

Dhaka City, an important hub of Bangladesh, is a captivating microcosm of the complex interplay between urbanization, climatic factors, and hydrological dynamics [28,29]. Spanning around 1490 km2, Dhaka’s geographical landscape is characterized by its flat terrain (Figure 1), which contributes to its susceptibility to flooding, particularly during the monsoon season when heavy rainfall is typical [30]. The city’s urbanization journey has been marked by rapid population growth and expansion of built environments, resulting in significant changes in its land use patterns [31]. This urban sprawl entails converting agricultural and natural covers into concrete jungles, leading to the proliferation of impervious surfaces that disrupt the natural hydrological cycle [32]. As a result, understanding the shifts in runoff patterns, groundwater recharge rates, and overall hydrological equilibrium becomes pivotal in the context of Dhaka’s growing risk to climatic challenges [33].
With distinct wet and dry seasons, Dhaka’s climatic context amplifies its hydrological complexities. Monsoon brings intense rainfall, overwhelm city’s drainage systems and exacerbating waterlogging and flooding [34,35]. The city’s infrastructure, characterized by formal and informal settlements, is intricately connected to its hydrological response. Moreover, Dhaka’s status as Bangladesh’s political, economic, and cultural hub further underscores urgency of studying its hydrological dynamics [36]. Insights drawn from this study can contribute to tailored solutions for its water management and broader discussions on sustainable urbanization, climate adaptation strategies, and preservation of urban water in similar contexts elsewhere [37].

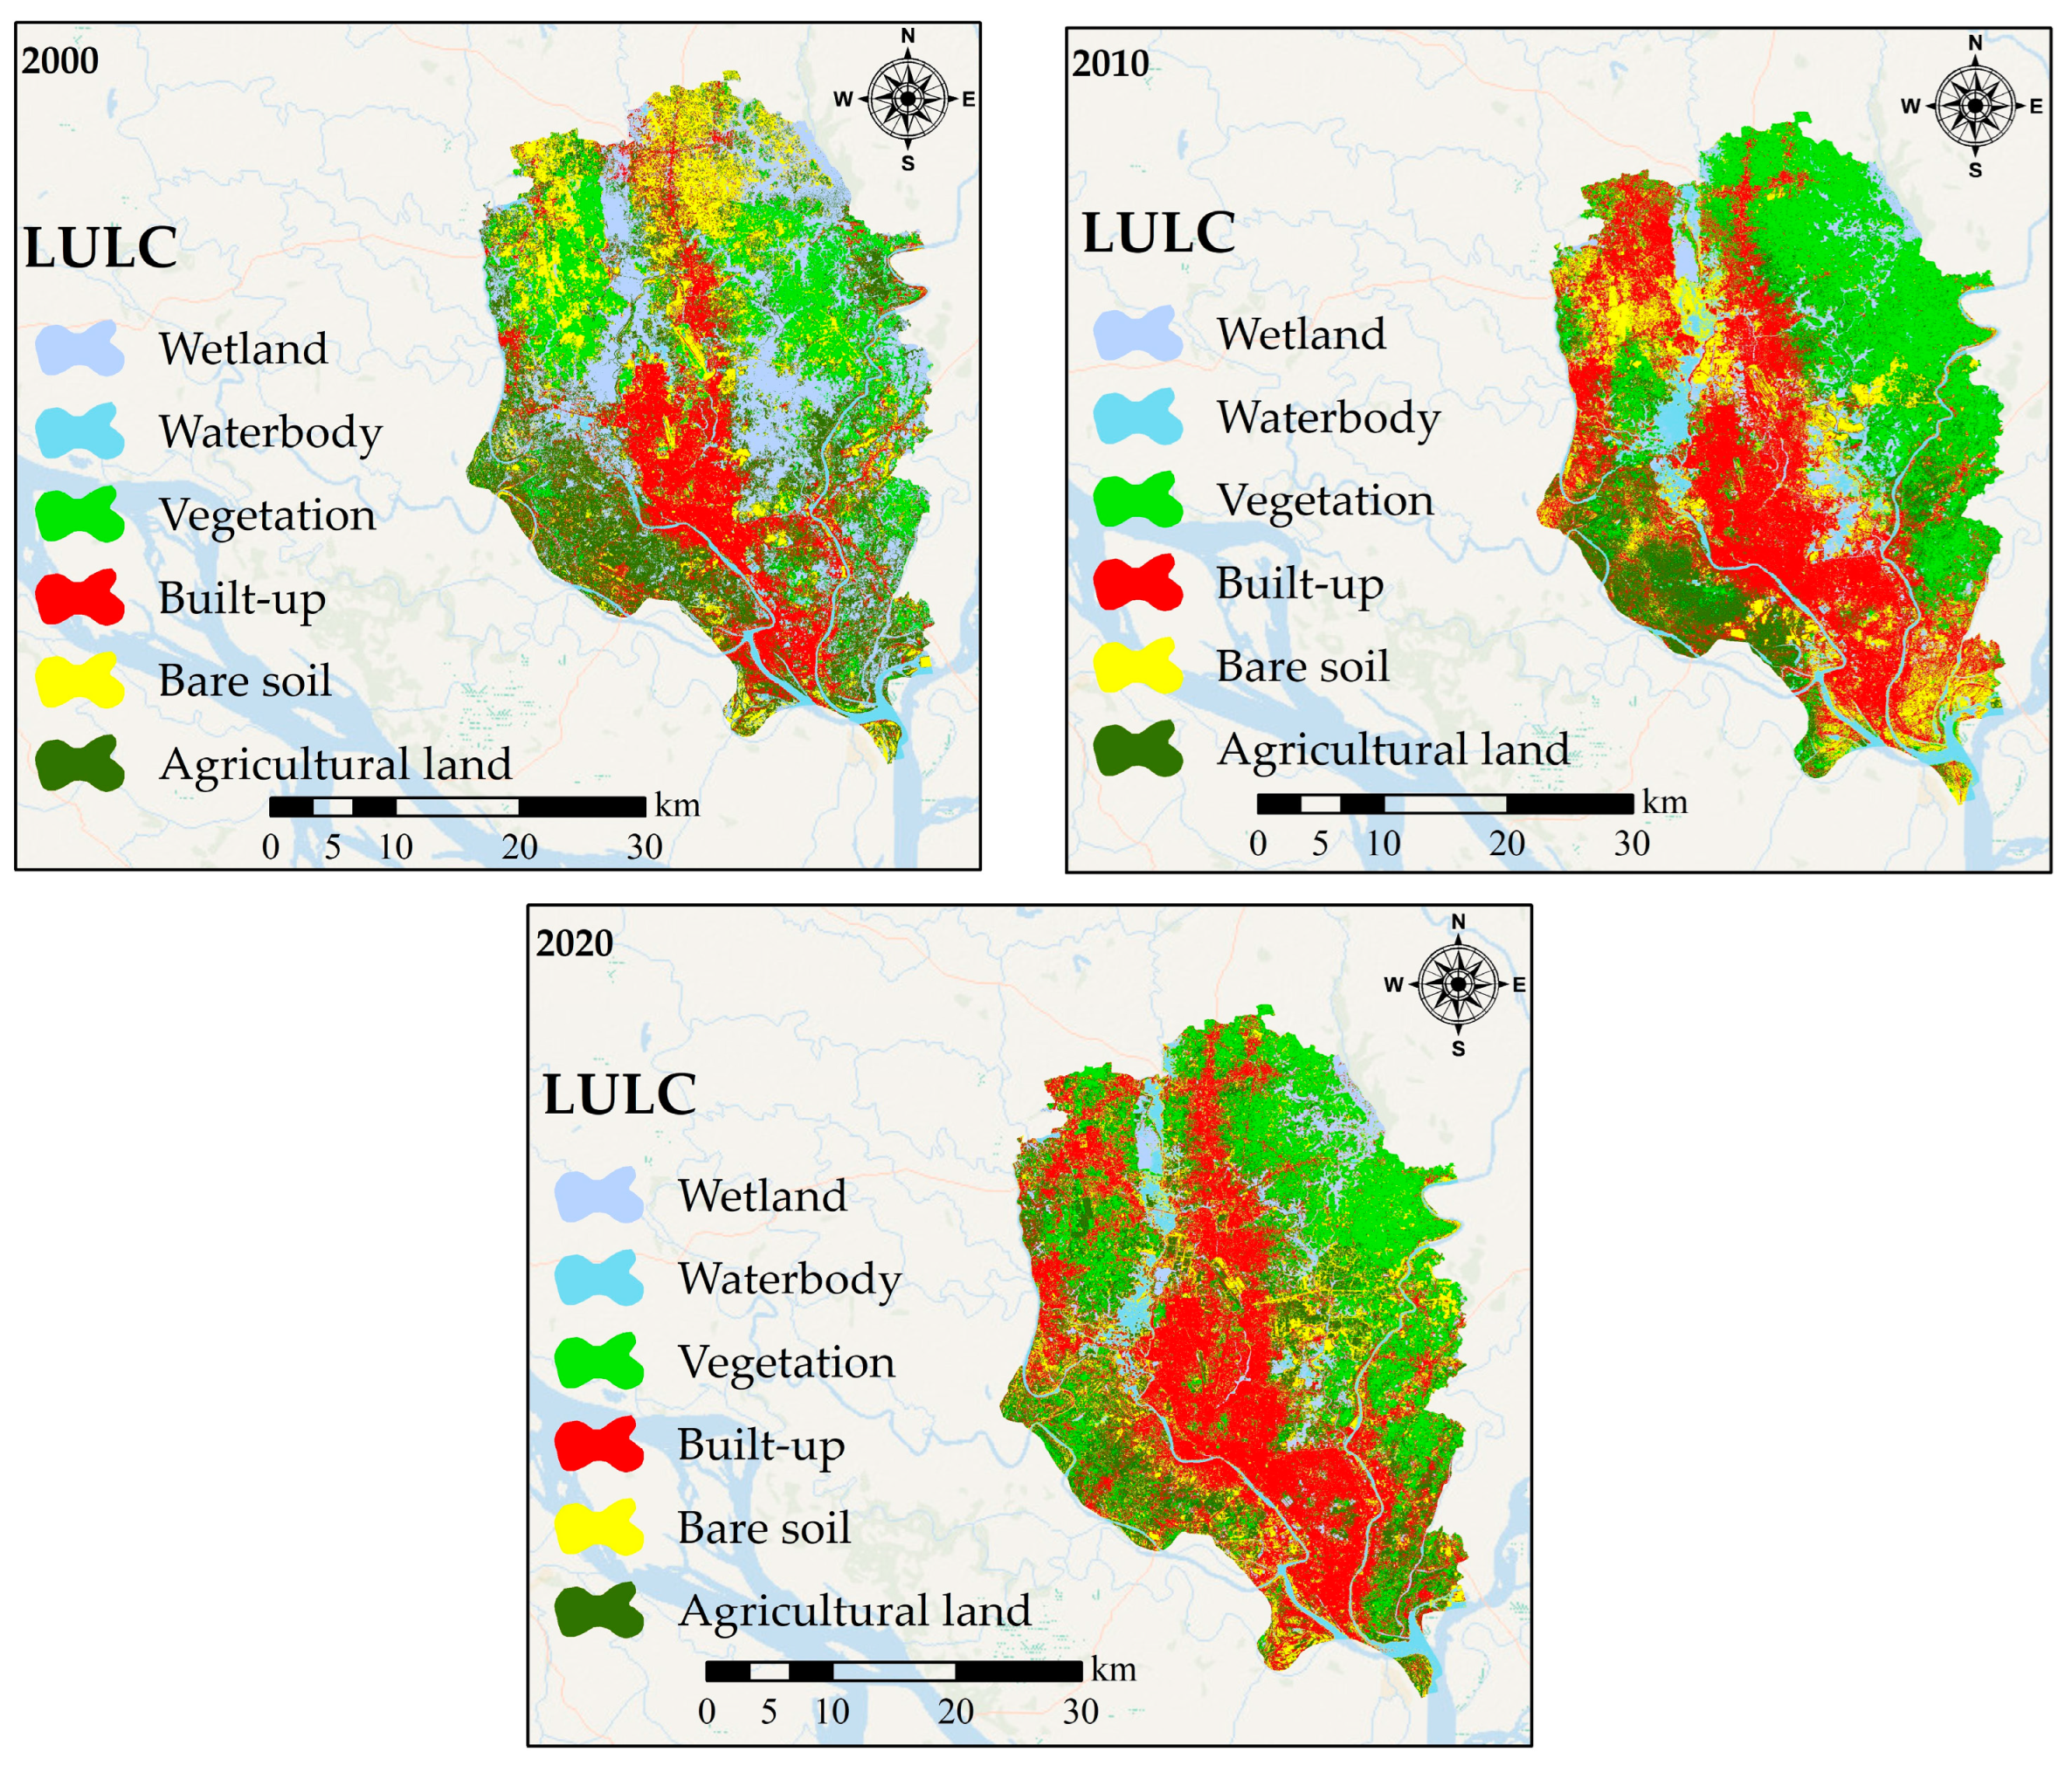
2.2. Land Use and Land Cover Analysis

In this study, the robustness of random forest (RF) algorithm was harnessed via google earth engine (GEE) (https://code.earthengine.google.com/; accessed on 20 June 2022) to produce LULC maps of different periods (e.g., 2000, 2010, and 2020). The process involved utilizing calibrated top-of-atmosphere (TOA) reflectance data derived from Landsat 7 (2000 and 2010) and Landsat 8 (2020). Subsequently, leveraging JavaScript application programming interface (API) within GEE, images were analyzed [38]. The analysis involved processing of a total of 30 Landsat images, comprising 20 Landsat 7 and 10 Landsat 8 images, each selected to have cloud coverage of <10%. These images were utilized to examine annual changes in six land cover classes (Table 1): waterbody, vegetation, built-up, agricultural land, wetland, and bare land, for the years 2000, 2010, and 2020. Utilizing a meticulously curated dataset of 1450 samples, representing diverse land cover categories, RF algorithm was selected due to its inherent strengths in handling complex relationships within data and its ability to mitigate overfitting through its ensemble learning framework [39]. Diverging from conventional approaches, this study exploited spectral bands and integrated additional data dimensions. Inclusion of soil-adjusted vegetation index (SAVI), normalized difference vegetation index (NDVI), normalized difference built-up index (NDBI), and normalized difference water index (NDWI) enriched classification process by encompassing ecological nuances beyond pure spectral information (Table 2) [40].
By partitioning the dataset into 70% training and 30% testing, the ensemble approach of RF ensures a robust and accurate classification outcome, essential for understanding complex land cover dynamics. Furthermore, its capability to incorporate spectral indices reflect growing trend of data fusion in remote sensing, leading to informative classification outcomes.

2.3. Future LULC Simulation and Projection

CA-ANN model, implemented via QGIS MOLUSCE plugin, was pivotal in developing future LULC maps [42,43]. To construct future LULC, data from 2000, 2010, and 2020 were employed (cf. Section 2.2). Moreover, projected LULC data were created for 2030, 2050, 2070, and 2100. This temporal framework allowed examining potential LULC changes over multiple periods. Spatial variables, encompassing digital elevation model (DEM), slope, distance to rivers and distance to roads (Table 3), were incorporated into the model to enhance its accuracy and predictive power [44]. DEM offers topographical variations within the study area, contributing to the understanding of how elevation and slope differences could influence land cover changes [45]. Inclusion of distance to roads and rivers signifies the impact of accessibility, human interventions of natural surfaces and water availability, transportation corridors, and environmental regulations on land use decisions [46]. To evaluate strength of the associations between spatial variables and projected LULC changes, Pearson’s correlation coefficient was employed. A workflow of the study is shown in Figure 2.

2.4. Model Validation

Utilizing LULC datasets for 2000 and 2010, along with explanatory variables and transition matrices, we performed projections to predict LULC for the year 2020. To ascertain fidelity of the model and validate prediction accuracy, the MOLUSCE plugin provided a kappa statistic and facilitated a comparison between two maps, e.g., base LULC with projected LULC [47]. The ANN learning process was governed by specific parameters (Table 4) chosen to project LULC for 2020. With useful outcomes, this was extended to predict LULC maps for 2030, 2050, 2070, and 2100.

2.5. Annual Rate of LULC Conversion

To determine annual rate of alteration (ROA) for individual land use types, disparity between concluding year and the initial year, representing the extent of change between corresponding years, was divided by initial year and duration of time. To evaluate spatiotemporal magnitude and pace of transformations within LULC categories, Equation (1) was employed [48,49].
R O A ( % ) = Y C Y I Y I × t × 100
where “YI” and “YC” stand for initial and final year in sq. km, respectively, while “t” denotes the time interval.

2.6. Rainfall-Runoff Modeling

Developed by the United States Department of Agriculture’s Natural Resources Conservation Service, SCS-CN method offers a useful way to evaluate runoff potential in diverse terrain [50]. Central to SCS-CN method is the curve number (CN), a parameter that encapsulates interplay of land use, soil characteristics, and land cover in influencing runoff [51]. Ranging from 0 to 100, CN value signifies hydrological response in a given area, with lower values indicating enhanced infiltration and reduced runoff potential, while higher values denote elevated runoff potential [52].
The process of calculating runoff involves several critical steps, necessitating an integration of soil type, precipitation data, LULC information, and hydrological parameters. Initially, to quantify runoff, it’s imperative to acquire precise soil type and precipitation data relevant to specific area of interest. The precipitation data is adjusted based on the antecedent moisture condition (AMC) criteria (AMC I, AMC II, and AMC III). Subsequently, inverse distance weighting (IDW) technique was leveraged, and precipitation maps are generated, each corresponding to distinct AMC conditions [53]. Furthermore, hydrologic soil group (HSG), CN, and weighted CN are derived for each LULC class based on the corresponding soil type. Likewise, precipitation data (e.g., 2000, 2010, 2020) linked to AMC and year is processed using the fishnet, where values are extracted through geospatial tools. The following steps were considered to calculate runoff depth [54]:
C N = 25,400 S + 254
where CN is Curve Number and S is potential maximum retention after runoff begins.
(i)
Compute CN and weighted CNW value for the study, accounting for the proportion of different land use types.
C N W = A i C N i A i
where CNW is weighted curve number, CNi is curve number for a particular domain, Ai is the area of the domain.
(ii)
Consider initial abstraction, rainfall required to wet the surface before runoff commences, given by:
I A = 0.2 × P
where IA is initial abstraction, and P is the total rainfall depth.
(iii)
Estimate the potential maximum retention (S) using the following equation:
S = 25,400 C N 254
where S is the potential maximum retention, and CN is curve number.
(iv)
Calculate effective rainfall (R) by subtracting initial abstraction from total rainfall depth (P).
(v)
Compute direct runoff (Q) using SCS-CN equation:
Q = R 0.2 S 2 R + 0.8 S

2.7. Climate Modeling for Future Runoff Prediaction

CNRM-CM6-1 represents a configuration within CNRM-CM6 model family, one of the participating climate models in CMIP6 [55,56]. This configuration is aligned with the shared socioeconomic pathway 1-2.6 (SSP1-2.6), a scenario that envisions a future characterized by sustainable development with relatively low greenhouse gas (GHGs) emissions. SSP1-2.6 scenario outlines a pathway that strives to achieve a resilient and environmentally conscious trajectory, aiming to limit global warming and its associated impacts [57].
CMIP6 serves as a crucial platform for modeling and simulating various climate scenarios, encompassing changes in GHGs, land use, and other relevant factors [58,59]. The CNRM-CM6-1 SSP1-2.6 configuration, in particular, offers insights into how climate may evolve under conditions that prioritize sustainable practices and reduced emissions. Researchers and policymakers utilize these model outputs to project potential future climatic conditions and their implications, aiding in the formulation of strategies to address climate change, adapt to its effects, and inform global climate policies [60].
This study utilized simple quantile mapping (SQM) method to rectify biases in climate model outputs, particularly from CMIP6 general circulation models (GCMs) [61]. SQM aligns cumulative distribution functions (CDFs) of model simulations with observed data. In this approach, SQM function takes both model and observed data, calculates percentiles for each, and creates an interpolation function to correct bias [62]. By addressing discrepancies between observed and simulated CDFs, this method improves accuracy of future simulations for specific percentiles, enhancing overall reliability and relevance [63].

3. Results

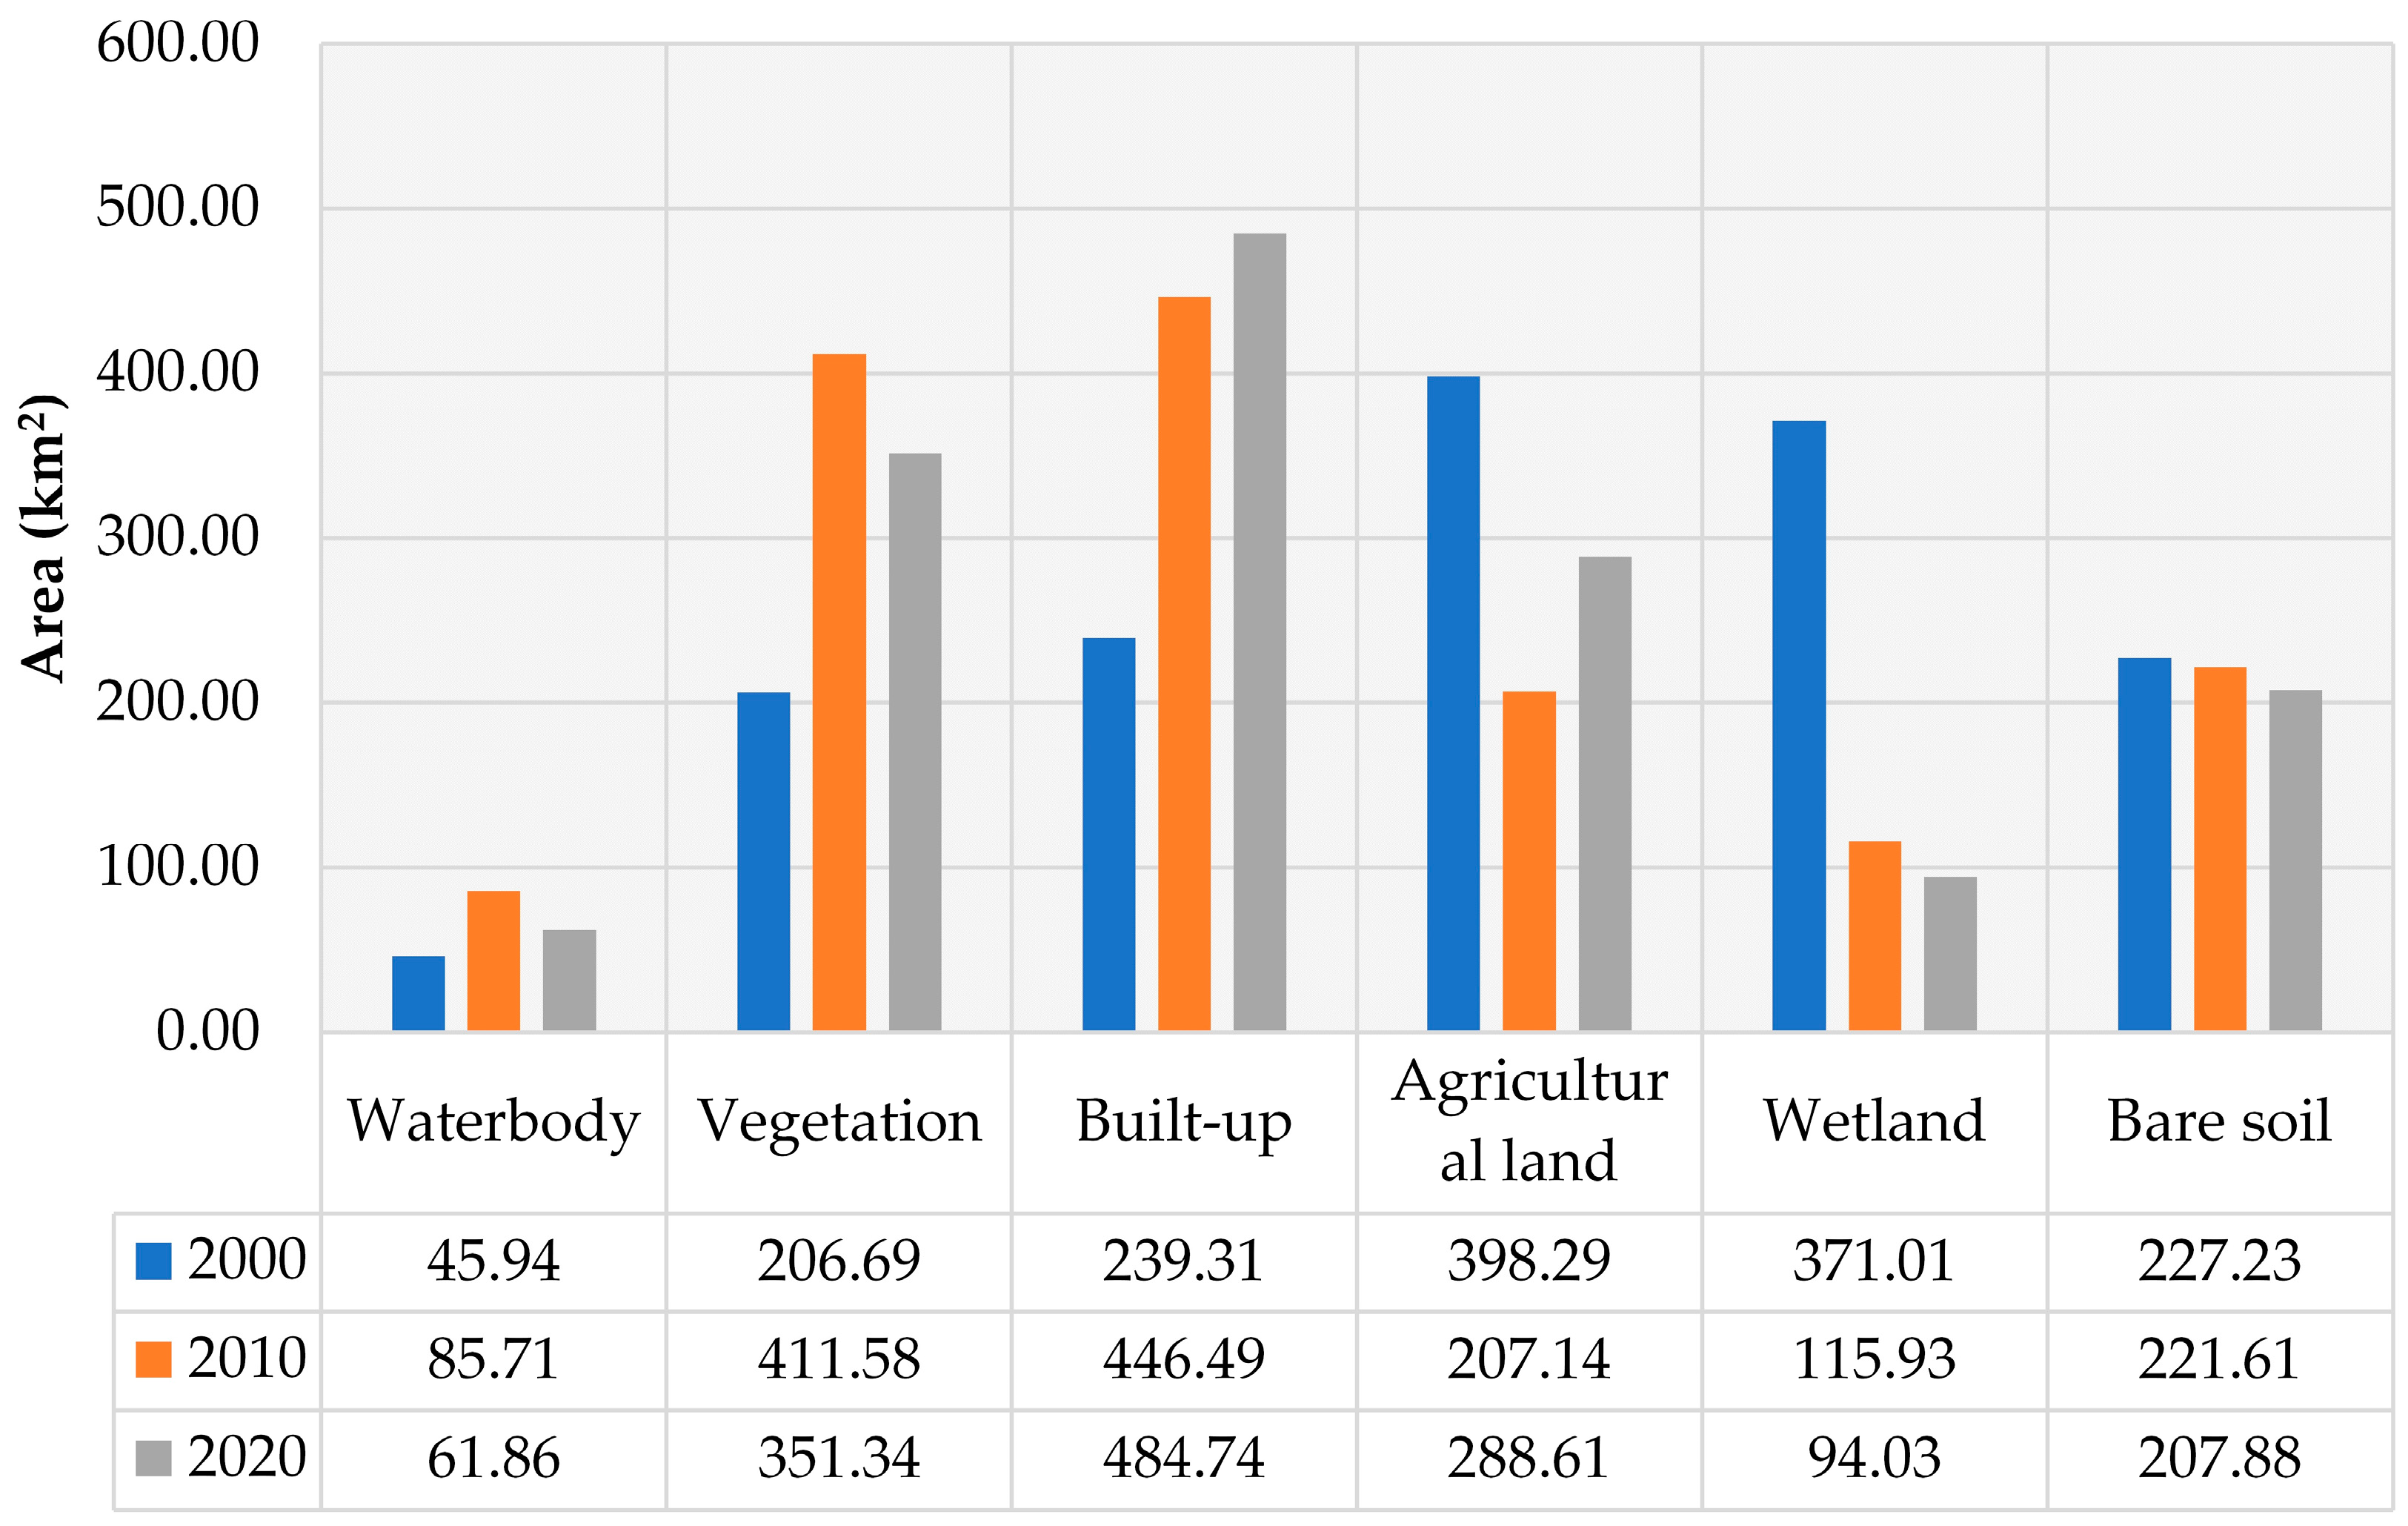
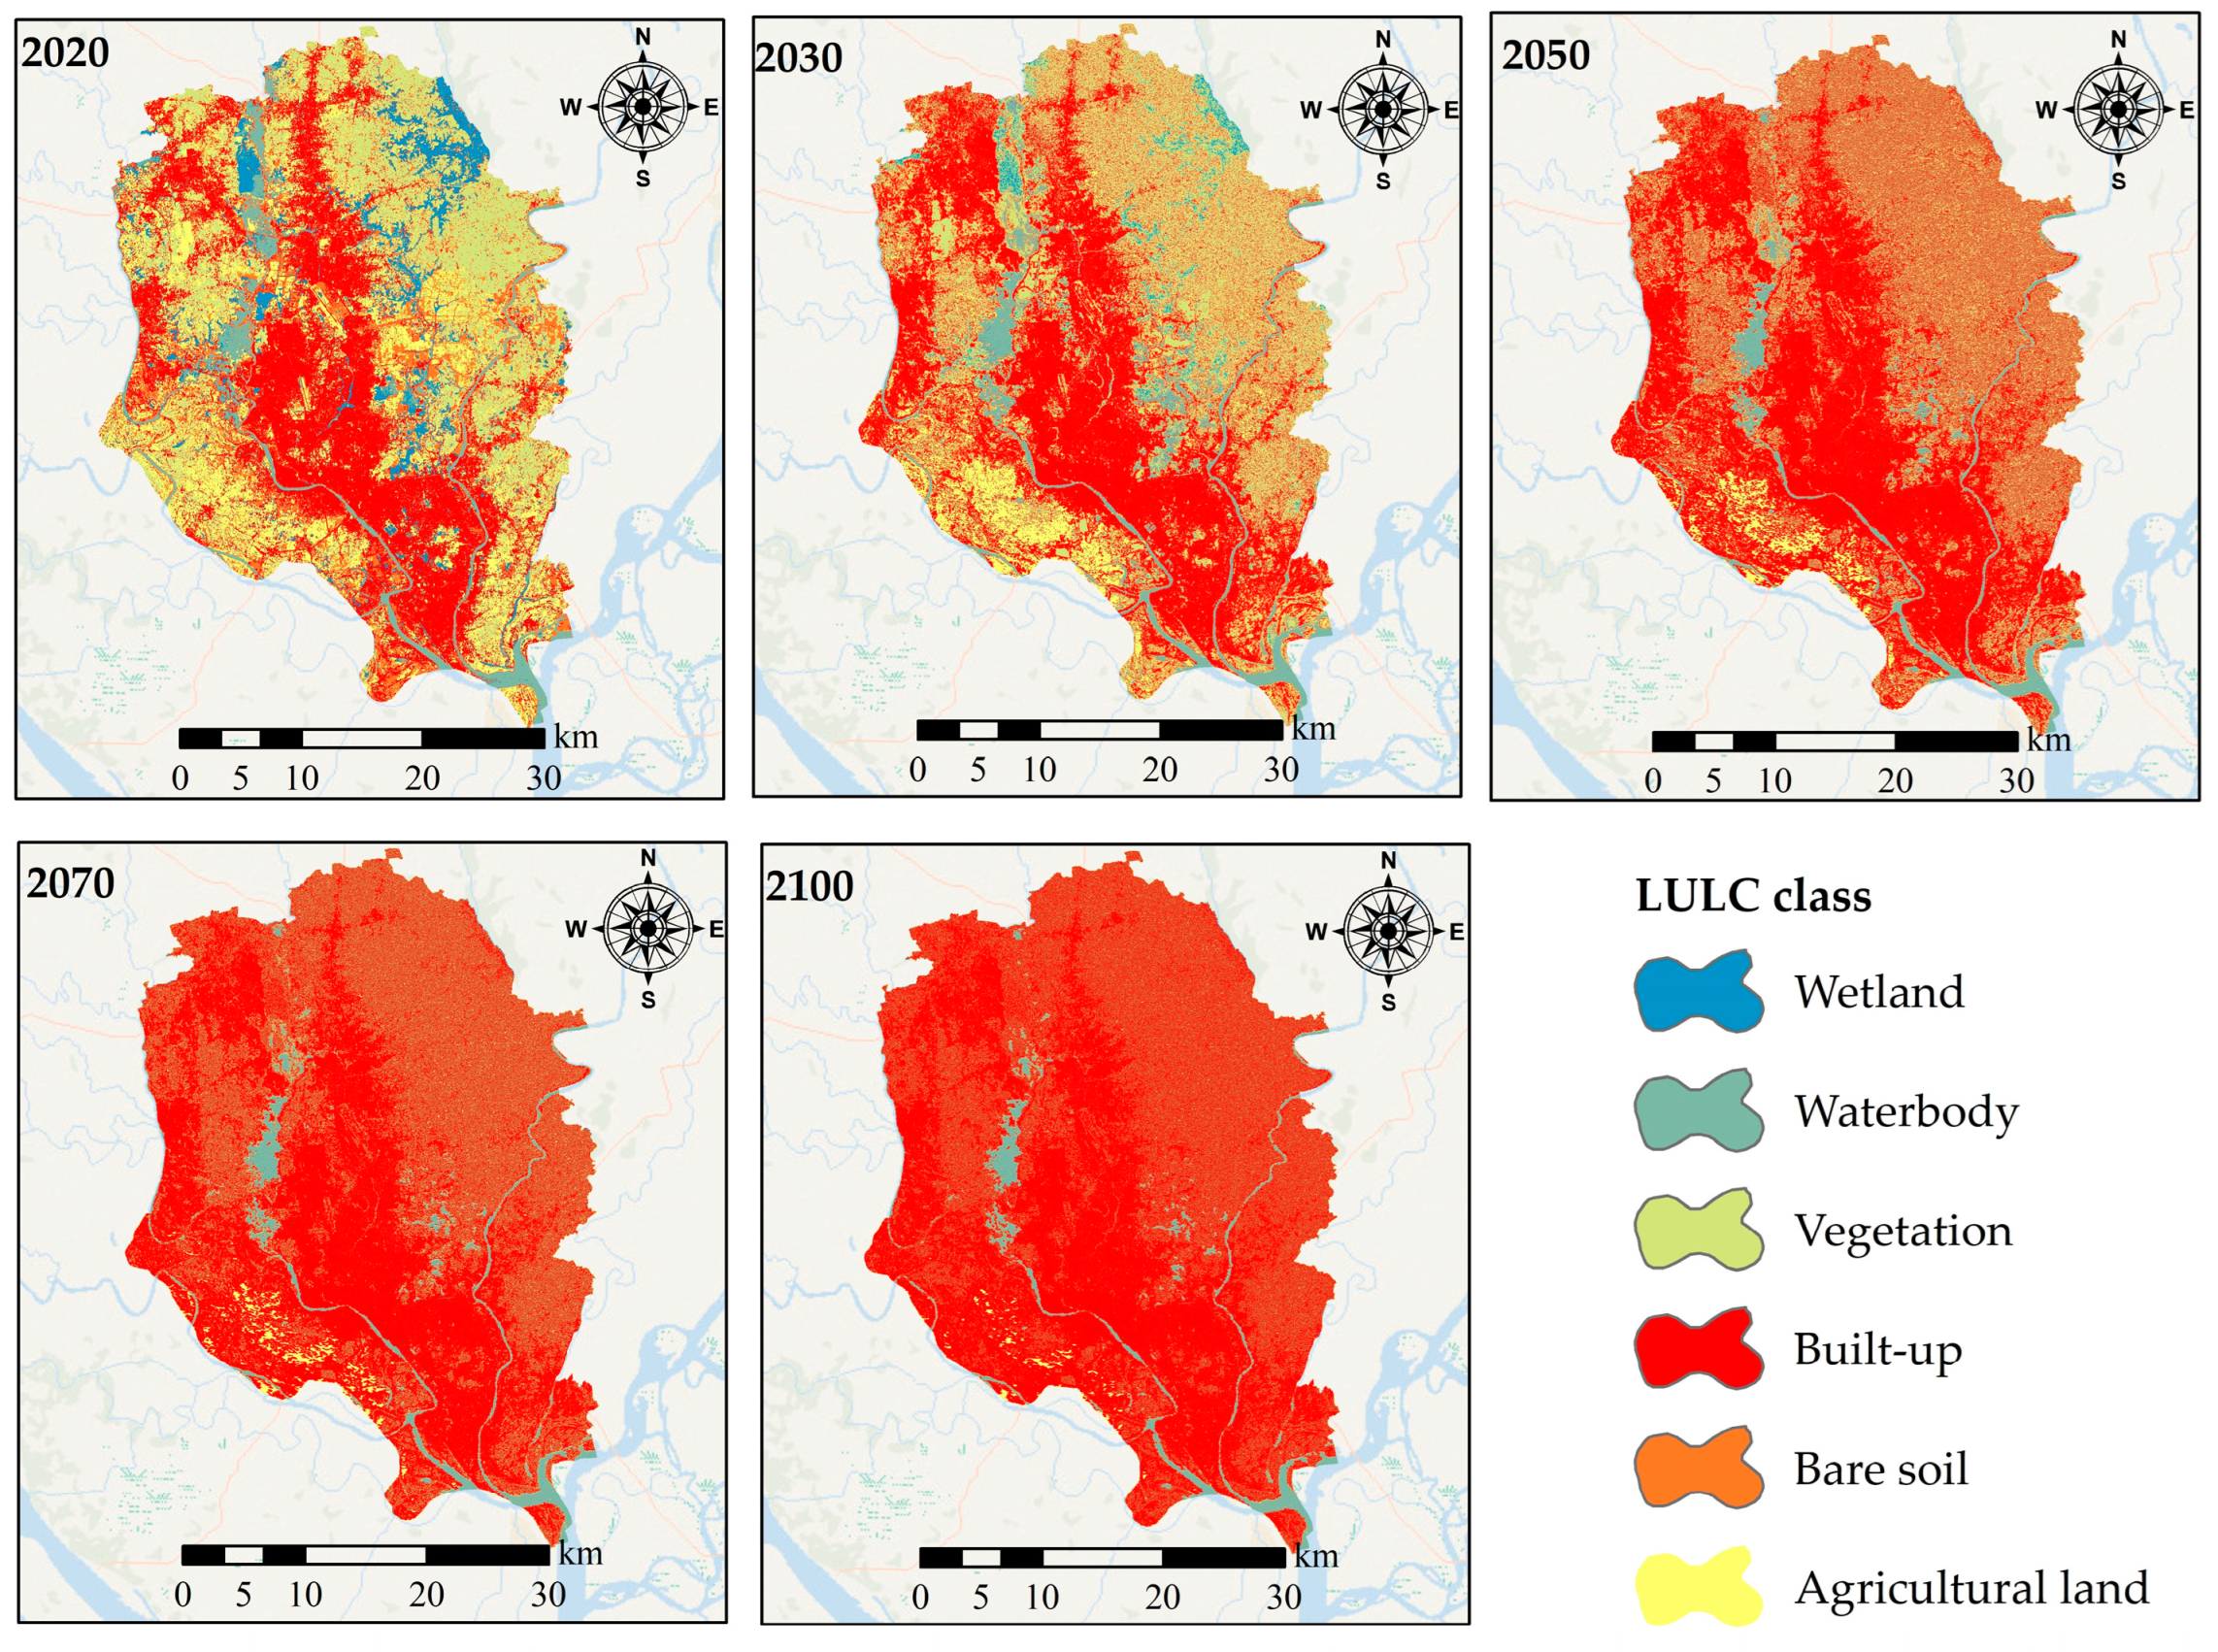
3.1. Land Cover Classification and Accuracy Assessment

The outcomes of RF classifier have yielded useful predictions for LULC classes across three distinct time periods: 2000, 2010, and 2020 (Figure 3 and Figure 4). The results demonstrate dynamic nature of various LULC categories. Waterbody category exhibited fluctuations, with values ranging from 45.94 km2 in 2000 to 85.71 km2 in 2010, before decreasing to 61.86 km2 in 2020. The fluctuation in waterbody extent, with an increase observed from 2000 to 2020 followed by a projected decrease by 2100, can be attributed to a complex interplay of natural and human-induced factors. Natural variability, including climate cycles and long-term trends, may have contributed to initial expansion of waterbodies, driven by favorable conditions like increased rainfall. However, in the ensuing decades, various human activities such as urbanization, land development, and alterations in land use practices could have led to a decline in the spatial extent of waterbodies. Additionally, long-term impacts of climate change, which can affect precipitation patterns and temperature, might play a role in altering availability and size of waterbodies. Vegetation witnessed substantial expansion from 206.69 km2 in 2000 to 411.58 km2 in 2010, followed by a slight reduction to 351.34 km2 in 2020. Built-up areas exhibited consistent growth, escalating from 239.31 km2 in 2000 to 446.49 km2 in 2010, and further to 484.74 km2 in 2020. We acknowledge that urban development indeed occurs in stages, and it is influenced by various factors, including resource availability and environmental conditions. Agricultural land experienced variations, with a peak of 398.29 km2 in 2000, followed by a decline to 207.14 km2 in 2010, and a subsequent increase to 288.61 km2 in 2020. Wetland areas dwindled from 371.01 km2 in 2000 to 115.93 km2 in 2010, and further to 94.03 km2 in 2020. Similarly, bare soil cover witnessed slight fluctuations, with values of 227.23 km2 in 2000, 221.61 km2 in 2010, and 207.88 km2 in 2020.
Accuracy assessment of LULC classification across 2000, 2010, and 2020 demonstrates a consistent improvement in predictive performance. In 2000, an overall accuracy of 93.65% and a kappa value of 0.85 indicate high agreement between predicted and actual categories. In 2010, accuracy increased to 97.04% with a kappa value of 0.94. Notably, 2020 witnessed further advancement, yielding an overall accuracy of 98.55% and a kappa value of 0.96. These upward trends affirm model’s proficiency and underscore reliability of classification methodology.

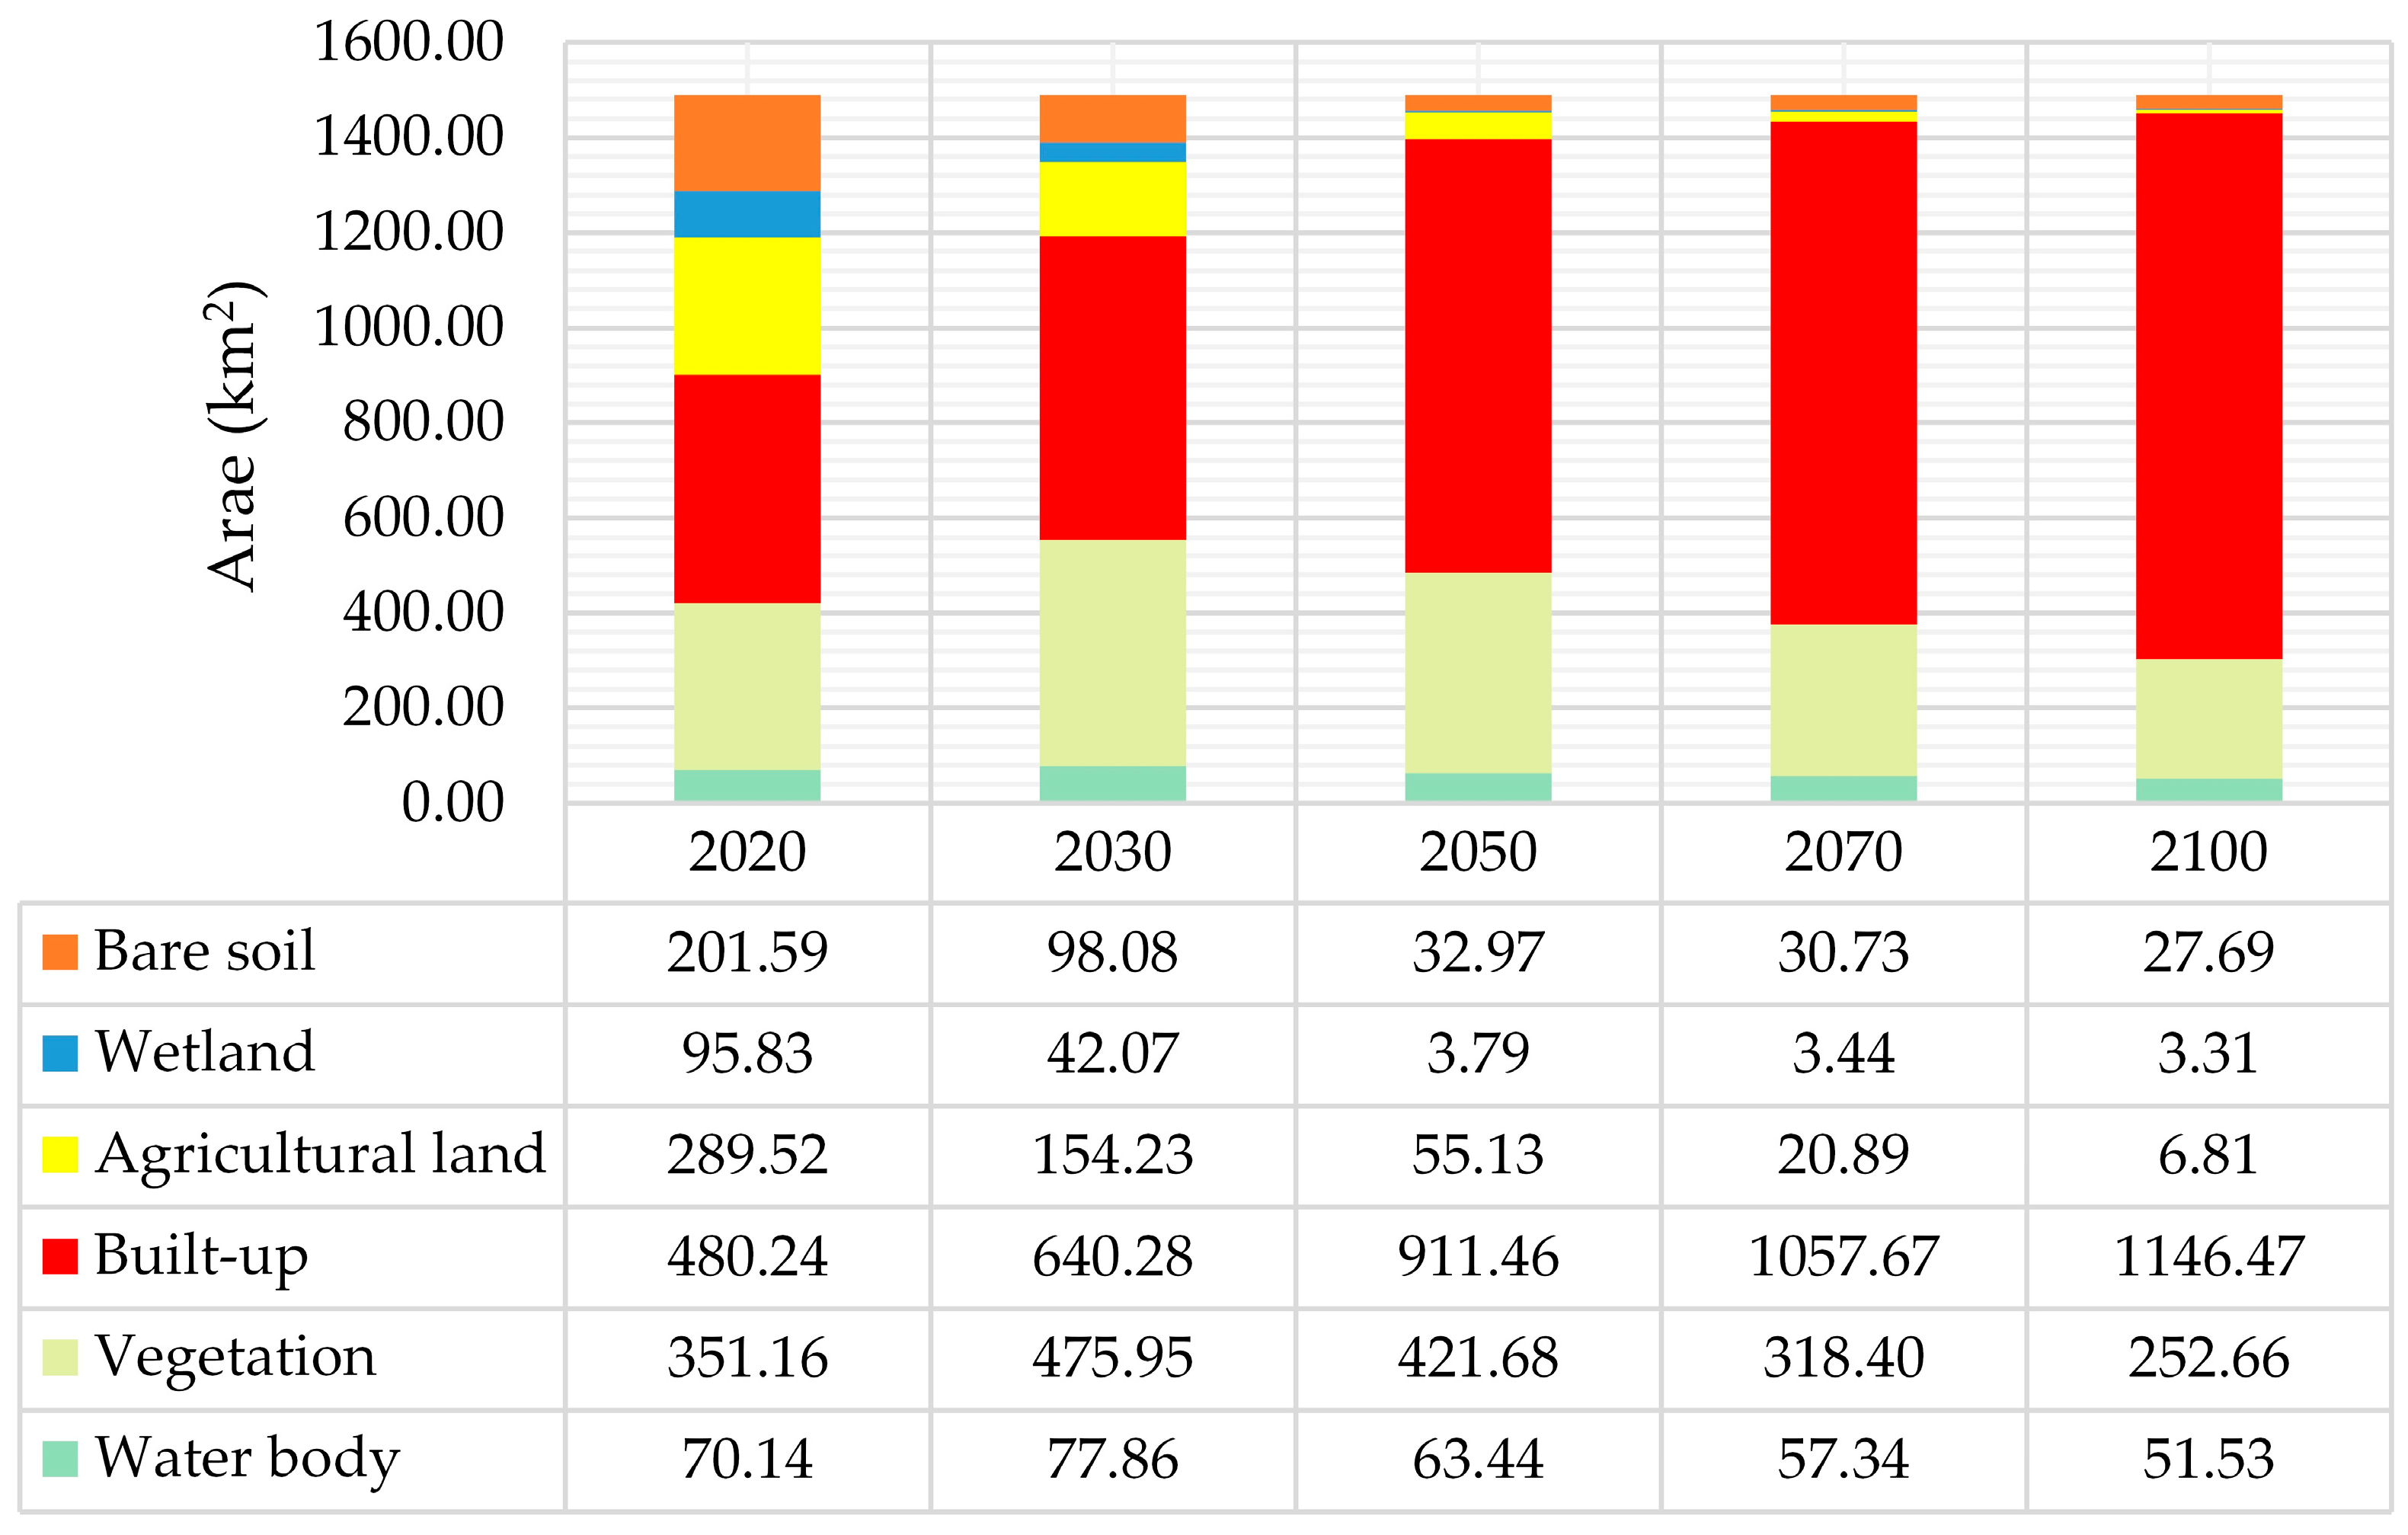
3.2. Land Cover Future Projection and Model Validation

Figure 5 and Figure 6 show a depiction of future LULC projections, derived from CA-ANN model. It elucidates evolving dynamics across distinct LULC classes: waterbodies exhibit a gradual reduction from 70.14 km2 in 2020 to 51.53 km2 in 2100; vegetation class indicates a growth of 475.95 km2 in 2030 before tapering off; built-up areas consistently expand from 480.24 km2 in 2020 to 1146.47 km2 in 2100; agricultural land experiences fluctuations, declining to 6.81 km2 by 2100; wetlands contract from 95.83 km2 in 2020 to 3.31 km2 in 2100; and bare soil diminishes from 201.59 km2 in 2020 to 27.69 km2 in 2100.
Validation of future LULC demonstrates a kappa value of 0.95 for its ANN component and 0.75 for validation. Subsequent years reveal a predictive accuracy of kappa of 0.70 in 2030, 0.68 in 2050, 0.66 in 2070, and 0.65 in 2100. It’s important to note that these kappa values were automatically calculated within the CA-ANN model, representing a quantified measure of the model’s performance. In addition, these values indicate the degree of agreement between model’s predictions and validation. The validation process serves as a crucial step in gauging the model’s reliability and its capacity to provide meaningful insights into potential land use dynamics in the years ahead.

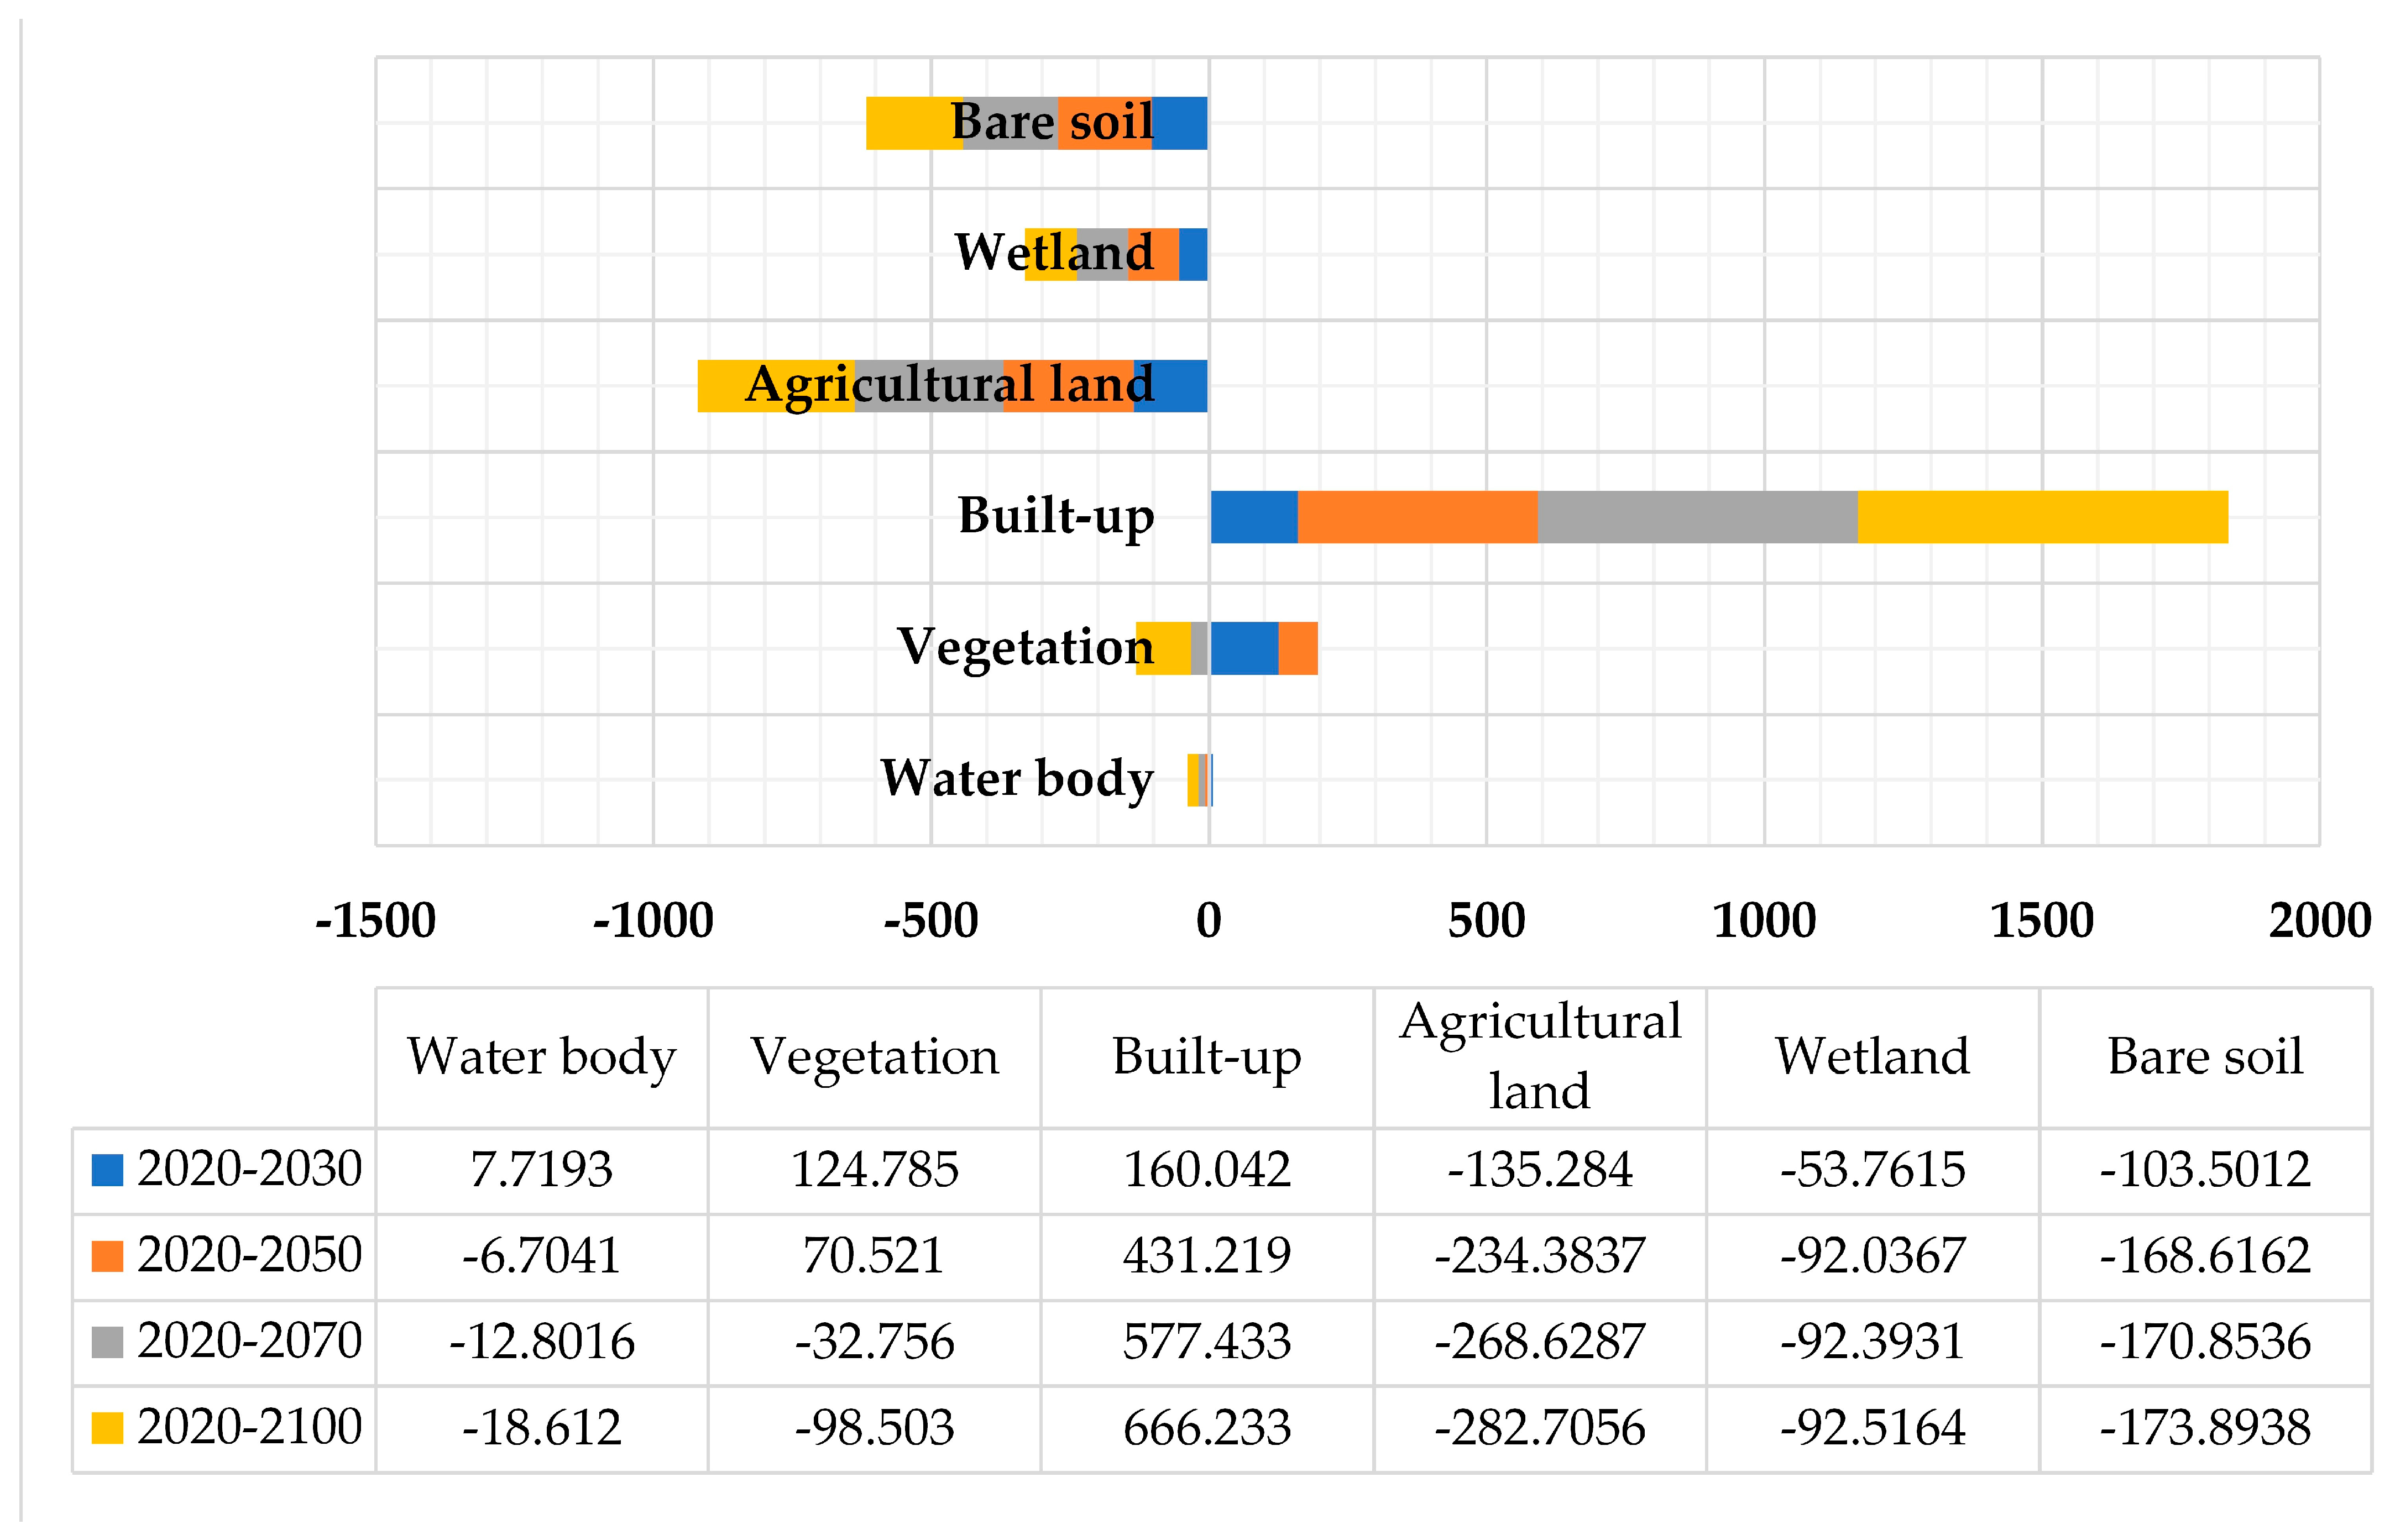
3.3. Annual Rate of Conversion for the Projected LULC

Figure 7 illustrates changes in areas of projected LULC classes over various temporal spans (2020–2030, 2020–2050, 2020–2070, and 2020–2100). It shows waterbodies would have a positive rate in the first interval (7.7193 km2) but gradually decrease in subsequent periods. Vegetation experiences growth (124.785 km2) in the earlier timeframe, followed by a decline in later times. Conversely, built-up areas consistently expand across all periods, with significant rate (ranging from 160.042 km2 to 666.233 km2). Agricultural land and wetlands demonstrate decreasing rates over time. Bare soil areas also exhibit decreasing rates, indicating diminishing bare areas. Overall, these projected annual rates of conversion shed light on the change dynamics of LULC categories, underscoring shifts in urbanization, vegetation, and other key land cover types (Figure 7 and Table 5).

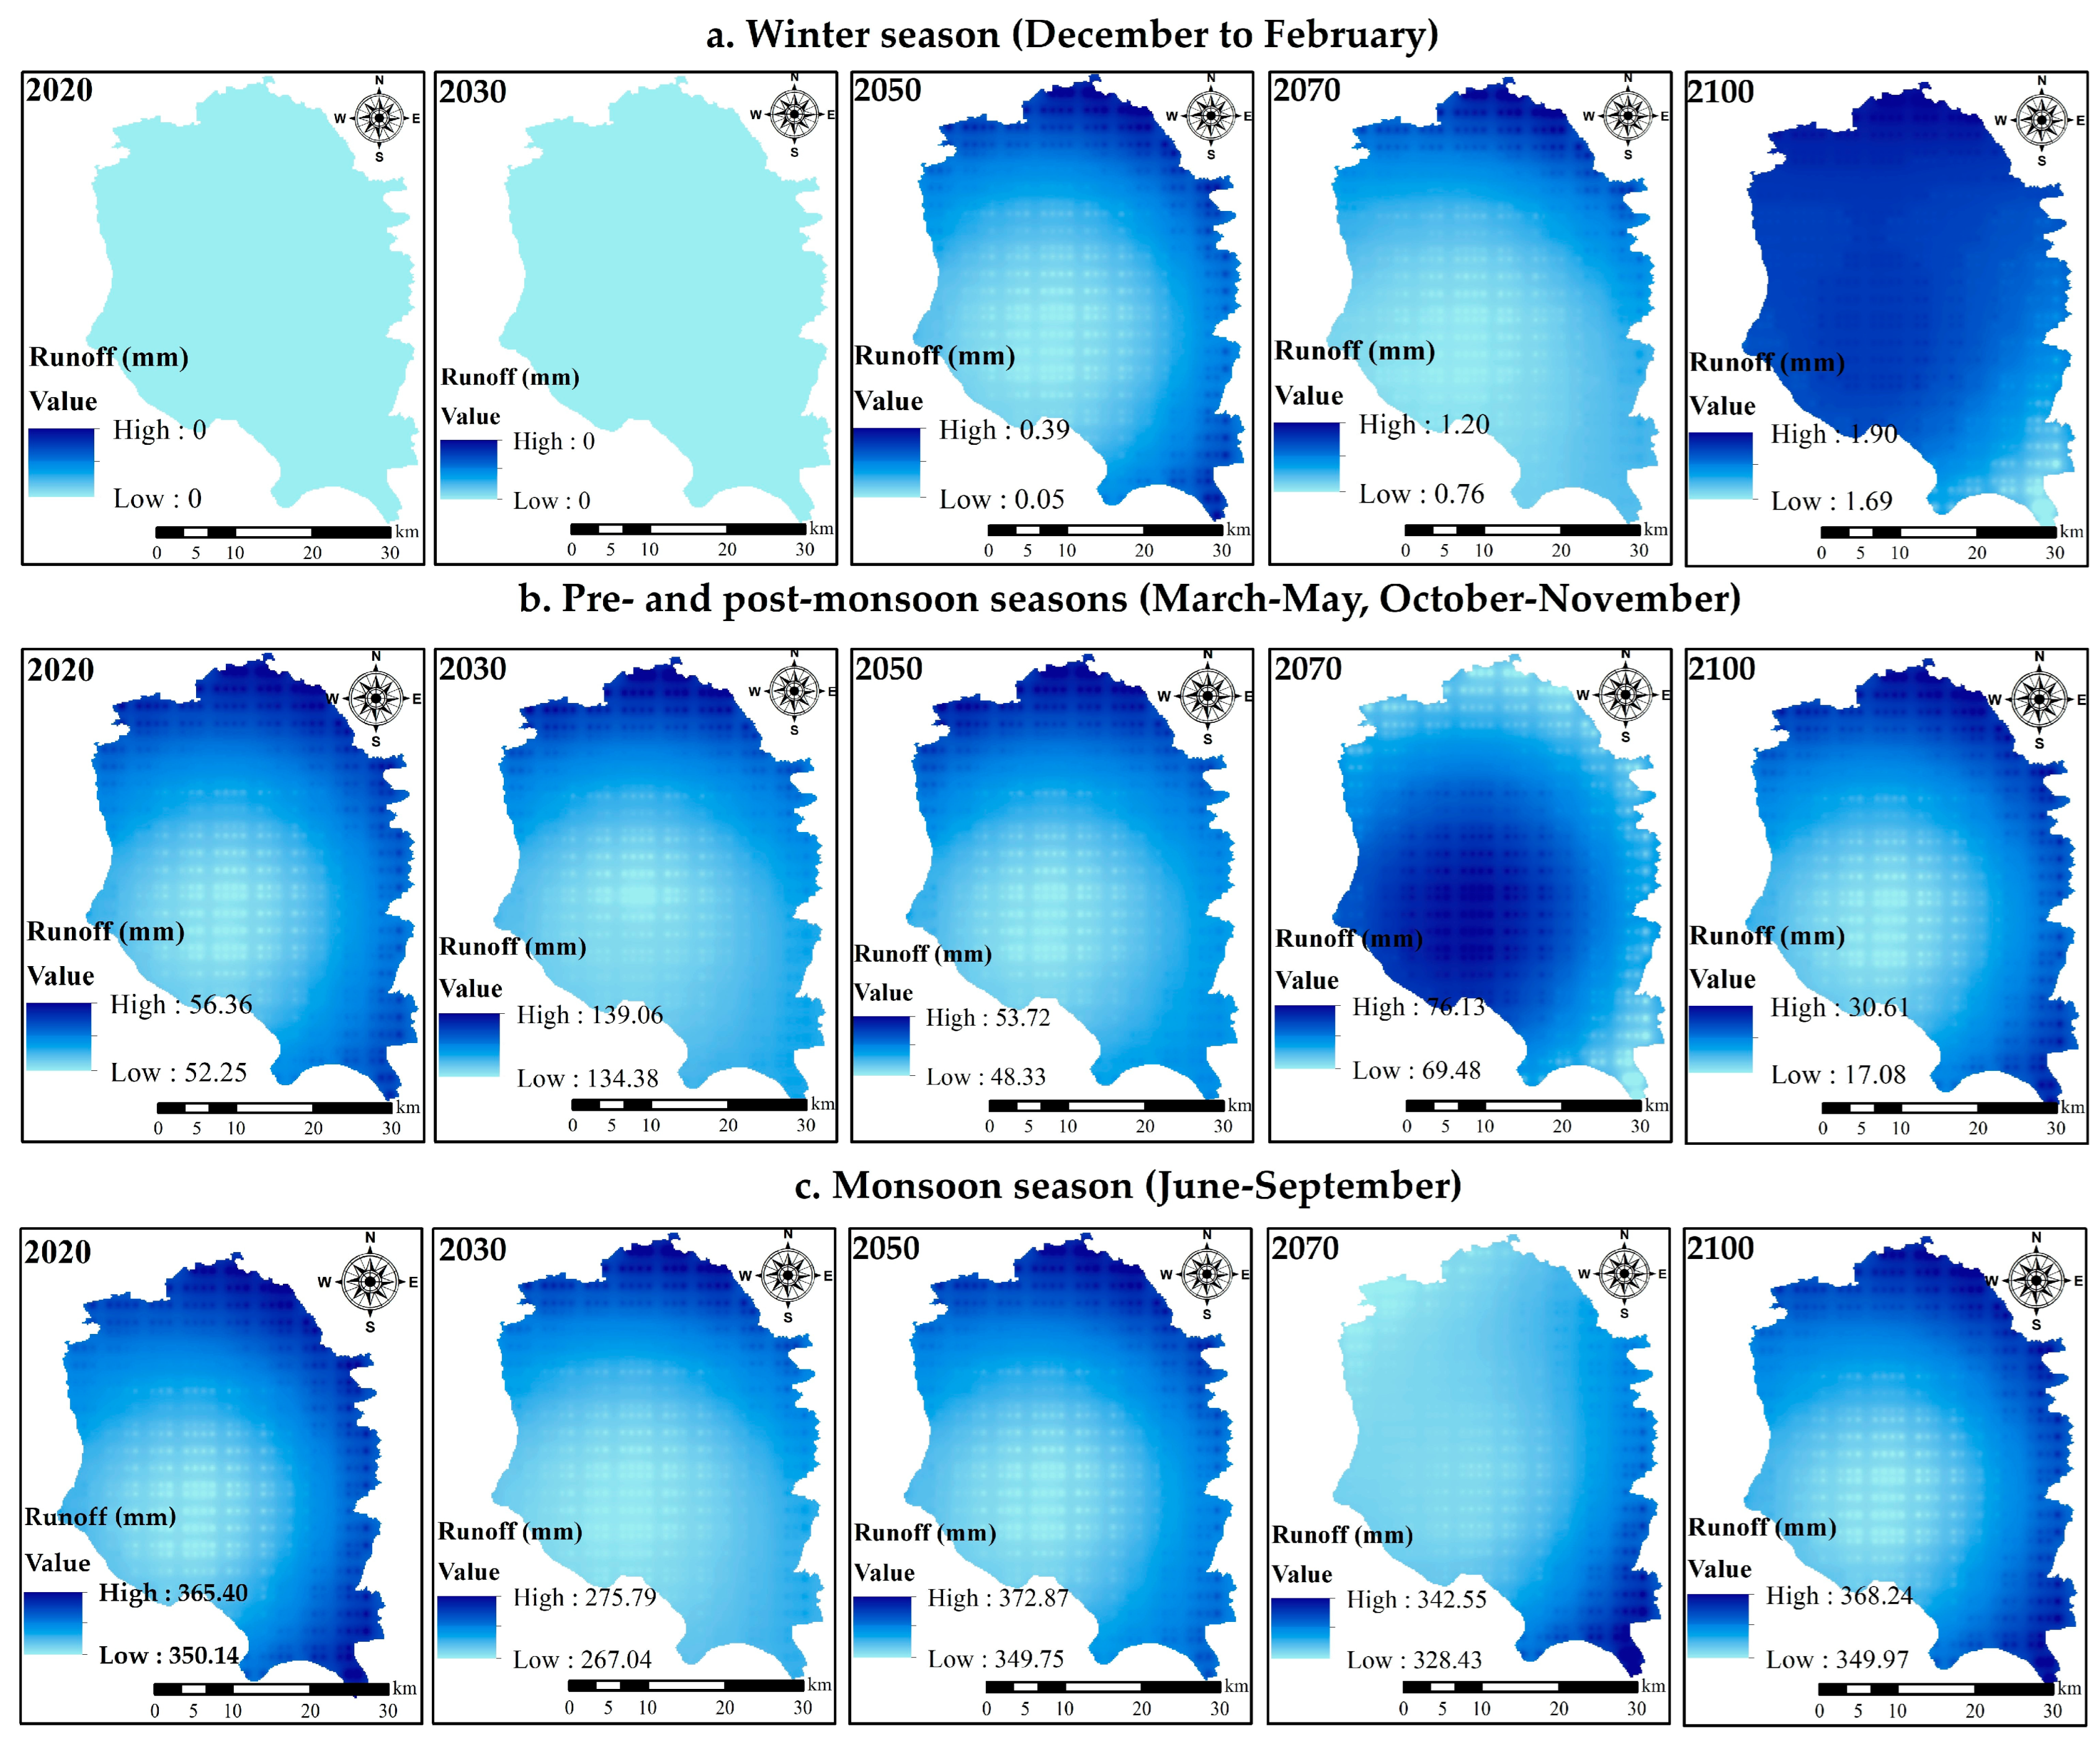
3.4. Assessing Rainfall-Runoff

Figure 8 shows results of runoff projections for different seasons and time periods. This highlights the potential changes in runoff under future scenarios, with baseline calculations relying on historical data and future predictions driven by CNRM-CM6-1 SSP1-2.6 model within CMIP6 GCMs. During the winter season (December to February), it indicates minimal runoff for the year 2020 and 2030, with values of zero, while in 2050, 2070, and 2100, runoff gradually increases, with values of 0.39 mm, 1.2 mm, and 1.9 mm, respectively, for the ‘High’ runoff category. Similarly, for the ‘Low’ runoff category, the values also follow the same pattern. The pre- and post-monsoon seasons runoff show variability, with the ‘High’ and ‘Low’ runoff categories displaying fluctuations across different time periods. Notably, in 2030 and 2070, the ‘High’ runoff values would rise, while in other years, different trends are observed. For the monsoon season, both ‘High’ and ‘Low’ runoff categories experience changing patterns. The values depict variations over the years, suggesting complex shifts in monsoon-related runoff dynamics.
These runoff projections illustrate potential future scenarios under climate change using SCS-CN model and CNRM-CM6-1 SSP1-2.6 model of CMIP6 GCMs. This approach offers insights into potential hydrological impacts, aiding in preparedness and adaptation strategies for managing near depleting water resources. The significant variations in runoff simulation results at different stages indeed raise questions about driving factors promoting these changes. While we did not explicitly model precipitation changes in this study, we recognize its crucial role in influencing runoff. The observed differences in runoff between stages may be attributed to several factors, which were implicit in our model but not examined. These factors include variations in land use patterns, urbanization, and potential alterations in soil properties due to land development.

4. Discussion and Conclusions

In the context of a rapidly urbanizing world and shifting climate patterns, understanding the interplay between urban dynamics and hydrological responses holds global and regional importance. Globally, urbanization is altering landscapes, impacting hydrology, and necessitating sustainable planning. Dhaka city has challenges of urban growth, climate vulnerability, and water scarcity [64,65,66]. This study deciphered these interactions, offering insights applicable beyond Dhaka. Its findings can guide urban planning, flood management, and climate resilience strategies in similar urban centers across South Asia and beyond, addressing broader concerns of water resource sustainability in the face of urban expansion and changing climate conditions [67].
The results of this study can contribute to the understanding of how urbanization, climate change, and land cover alterations collectively shape runoff patterns in the city [68]. The findings are well-aligned with previous research and hypotheses, showcasing both incremental and interactive effects of these factors on hydrological dynamics. Observed urbanization, in line with previous studies [69,70,71], has led to substantial changes in land cover, especially built-up area expansion and reduction of agricultural and bare lands. This corresponds to the anticipated outcomes of urban growth and land development, affirming sensitivity of land cover transformations to urban dynamics.
The use of advanced modeling techniques, such as random forest algorithm for land cover classification, not only enhanced our understanding of urban dynamics but also served as a transferable approach for other urban environments grappling with similar challenges [72]. The validation of this classification method using kappa coefficient aligns with in literature regarding robustness of machine learning in capturing complex land cover patterns. Moreover, integration of cellular automata-artificial neural network (CA-ANN), coupled with MOLUSCE plugin, contributed to a comprehensive toolkit for future land cover projections [73]. This method has the potential to be extrapolated to diverse urban contexts, enabling accurate predictions and offering insights into the future of urban landscapes [74]. The application of the soil conservation service-curve number (SCS-CN) rainfall-runoff model with CMIP6 climate data amplifies the study’s broader relevance [75]. By assessing the influence of land cover changes on runoff, the method provided a blueprint for evaluating hydrological responses in other urban areas experiencing rapid h urbanization and climatic shifts [76]. Integration of climate data from CMIP6 GCMs aligns with emerging practice of using global climate models to explore local impacts [77].
The synergistic impacts of urbanization and climate change on runoff, as highlighted in this study, echoed the findings of previous studies [78], where hydrological response was influenced by both land use changes and climatic variations. The increased monsoon season runoff signifies heightened hydrological sensitivity, mirroring the results of hydrological models applied to other contexts [79].
From a broader perspective, this research underscored the necessity of integrating urban planning strategies for climate resilience and water resource management. The findings emphasized that successful management of urban growth necessitates a holistic approach that factors in both land cover dynamics and evolving climate scenarios. These insights resonate with broader discourse on sustainable urban development [80,81]. The implications of this work extend to potential policy formulations aimed at mitigating adverse hydrological impacts stemming from urbanization and climate change. Further, this study underscored the need for adaptive urban planning strategies that account for hydrological responses, with implications for stormwater management, flood mitigation, and infrastructure development.
Future research could delve deeper into exploring complicated causal relationships between urbanization, land cover changes, and runoff patterns. More comprehensive modeling approaches could also incorporate socio-economic variables to better capture multifaceted nature of urbanization dynamics and their hydrological implications. Additionally, analyzing the potential for green infrastructure and nature-based solutions to mitigate hydrological impacts could offer actionable insights for urban planners and policymakers. In this study, our focus was exclusively on CNRM-CM6-1 SSP1-2.6 model. However, for future investigations, a broader scope could include multiple climate models and scenarios. This approach would facilitate an inter-model and scenario comparison, enabling the derivation of more robust and comprehensive findings. Furthermore, it’s important to acknowledge that, in the current study, validation of runoff predictions was not conducted due to limitations of ground data. However, this limitation could be addressed in subsequent research, potentially enhancing credibility and reliability of the results. Such future studies could significantly contribute to refinement and expansion of our understanding of complex relationships between land cover, climate change, and hydrological responses in urban environments.
In conclusion, this study effectively bridged the gap between urbanization, climate change, and hydrological responses in Dhaka city. The findings provided a valuable lens through which urban planning strategies can be refined to ensure sustainable water resource management amidst evolving urban dynamics and changing climatic conditions. This research sets the stage for more holistic and proactive approaches to address urban hydrological challenges, offering a blueprint for other cities facing similar transformations and uncertainties.

Author Contributions

Conceptualization, Mahfuzur Rahman; methodology, Mahfuzur Rahman; software, Mahfuzur Rahman and Matiur Rahman Raju; validation, Mahfuzur Rahman, Md. Monirul Islam, Hyeong-Joo Kim, Shamsher Sadiq, Mehtab Alam, Ningsheng Chen, Md. Alamgir Hossain and Ashraf Dewan; formal analysis, Mahfuzur Rahman, Taslima Siddiqua, Md. Al Mamun and Md. Ashiq Hossen Gazi; investigation, Mahfuzur Rahman, Md. Monirul Islam, Hyeong-Joo Kim, Shamsher Sadiq and Mehtab Alam; resources, Mahfuzur Rahman; data curation, Taslima Siddiqua, Md. Al Mamun, Md. Ashiq Hossen Gazi and Matiur Rahman Raju; writing—original draft preparation, Mahfuzur Rahman; writing—review & editing, Md. Monirul Islam, Hyeong-Joo Kim, Shamsher Sadiq, Mehtab Alam, Taslima Siddiqua, Md. Al Mamun, Md. Ashiq Hossen Gazi, Matiur Rahman Raju, Ningsheng Chen, Md. Alamgir Hossain and Ashraf Dewan; visualization, Md. Monirul Islam, Hyeong-Joo Kim, Ningsheng Chen, Md. Alamgir Hossain and Ashraf Dewan; supervision, Md. Monirul Islam, Hyeong-Joo Kim, Ningsheng Chen and Ashraf Dewan; project administration, Hyeong-Joo Kim; funding acquisition, Hyeong-Joo Kim. All authors have read and agreed to the published version of the manuscript.

Funding

The Basic Science Research Program supported this research through the National Research Foundation of Korea, funded by the Ministry of Education (NRF-2021R1A6A1A03045185).

Data Availability Statement

Data can be available upon request to corresponding author.

Acknowledgments

The authors acknowledge and appreciate the hydrological data the Bangladesh Meteorological Department (BMD) provided, without which this study would not have been possible. The authors would like to thanks Md. Sakib Hasan Tumon for helping us during data curation stage.

Conflicts of Interest

The authors declare no conflict of interest. The funders had no role in the design of the study; in the collection, analyses, or interpretation of data; in the writing of the manuscript; or in the decision to publish the results.

References

  1. Mashala, M.J.; Dube, T.; Mudereri, B.T.; Ayisi, K.K.; Ramudzuli, M.R. A Systematic Review on Advancements in Remote Sensing for Assessing and Monitoring Land Use and Land Cover Changes Impacts on Surface Water Resources in Semi-Arid Tropical Environments. Remote Sens. 2023, 15, 3926. [Google Scholar] [CrossRef]
  2. Adhami, M.; Sadeghi, S.H.; Duttmann, R.; Sheikhmohammady, M. Changes in watershed hydrological behavior due to land use comanagement scenarios. J. Hydrol. 2019, 577, 124001. [Google Scholar] [CrossRef]
  3. Ala-Aho, P.; Soulsby, C.; Pokrovsky, O.; Kirpotin, S.; Karlsson, J.; Serikova, S.; Vorobyev, S.; Manasypov, R.; Loiko, S.; Tetzlaff, D. Using stable isotopes to assess surface water source dynamics and hydrological connectivity in a high-latitude wetland and permafrost influenced landscape. J. Hydrol. 2018, 556, 279–293. [Google Scholar] [CrossRef]
  4. Correa, A.; Windhorst, D.; Tetzlaff, D.; Crespo, P.; Célleri, R.; Feyen, J.; Breuer, L. Temporal dynamics in dominant runoff sources and flow paths in the A ndean P áramo. Water Resour. Res. 2017, 53, 5998–6017. [Google Scholar] [CrossRef]
  5. Pi, K.; Bieroza, M.; Brouchkov, A.; Chen, W.; Dufour, L.J.; Gongalsky, K.B.; Herrmann, A.M.; Krab, E.J.; Landesman, C.; Laverman, A.M. The cold region critical zone in transition: Responses to climate warming and land use change. Annu. Rev. Environ. Resour. 2021, 46, 111–134. [Google Scholar] [CrossRef]
  6. Naylor, L.A.; Spencer, T.; Lane, S.N.; Darby, S.E.; Magilligan, F.J.; Macklin, M.G.; Möller, I. Stormy geomorphology: Geomorphic contributions in an age of climate extremes. Earth Surf. Process. Landf. 2017, 42, 166–190. [Google Scholar] [CrossRef]
  7. Todmal, R.S. Assessment of hydro-climatic trends in a drought-prone region of Maharashtra (India) with reference to rainfed agriculture. Reg. Environ. Chang. 2023, 23, 62. [Google Scholar] [CrossRef]
  8. Sun, S.; Liu, Y.; Chen, H.; Ju, W.; Xu, C.-Y.; Liu, Y.; Zhou, B.; Zhou, Y.; Zhou, Y.; Yu, M. Causes for the increases in both evapotranspiration and water yield over vegetated mainland China during the last two decades. Agric. For. Meteorol. 2022, 324, 109118. [Google Scholar] [CrossRef]
  9. Mahmoud, S.H.; Alazba, A. Hydrological response to land cover changes and human activities in arid regions using a geographic information system and remote sensing. PLoS ONE 2015, 10, e0125805. [Google Scholar] [CrossRef]
  10. Rogger, M.; Agnoletti, M.; Alaoui, A.; Bathurst, J.; Bodner, G.; Borga, M.; Chaplot, V.; Gallart, F.; Glatzel, G.; Hall, J. Land use change impacts on floods at the catchment scale: Challenges and opportunities for future research. Water Resour. Res. 2017, 53, 5209–5219. [Google Scholar] [CrossRef]
  11. Roy, P.S.; Ramachandran, R.M.; Paul, O.; Thakur, P.K.; Ravan, S.; Behera, M.D.; Sarangi, C.; Kanawade, V.P. Anthropogenic land use and land cover changes—A review on its environmental consequences and climate change. J. Indian Soc. Remote Sens. 2022, 50, 1615–1640. [Google Scholar] [CrossRef]
  12. Gobler, C.J. Climate change and harmful algal blooms: Insights and perspective. Harmful Algae 2020, 91, 101731. [Google Scholar] [CrossRef] [PubMed]
  13. Barnosky, A.D.; Hadly, E.A.; Bascompte, J.; Berlow, E.L.; Brown, J.H.; Fortelius, M.; Getz, W.M.; Harte, J.; Hastings, A.; Marquet, P.A. Approaching a state shift in Earth’s biosphere. Nature 2012, 486, 52–58. [Google Scholar] [CrossRef]
  14. Chingombe, W. Effects of Land-Cover-Land-Use on Water Quality within the Kuils-Eerste River Catchment. Ph.D. Thesis, University of Western Cape, Cape Town, South Africa, 2012. [Google Scholar]
  15. Furberg, D.; Ban, Y.; Nascetti, A. Monitoring of urbanization and analysis of environmental impact in Stockholm with Sentinel-2A and SPOT-5 multispectral data. Remote Sens. 2019, 11, 2408. [Google Scholar] [CrossRef]
  16. Gao, J.; Li, F.; Gao, H.; Zhou, C.; Zhang, X. The impact of land-use change on water-related ecosystem services: A study of the Guishui River Basin, Beijing, China. J. Clean. Prod. 2017, 163, S148–S155. [Google Scholar] [CrossRef]
  17. Molina-Navarro, E.; Trolle, D.; Martínez-Pérez, S.; Sastre-Merlín, A.; Jeppesen, E. Hydrological and water quality impact assessment of a Mediterranean limno-reservoir under climate change and land use management scenarios. J. Hydrol. 2014, 509, 354–366. [Google Scholar] [CrossRef]
  18. Sahana, M.; Ravetz, J.; Patel, P.P.; Dadashpoor, H.; Follmann, A. Where Is the Peri-Urban? A Systematic Review of Peri-Urban Research and Approaches for Its Identification and Demarcation Worldwide. Remote Sens. 2023, 15, 1316. [Google Scholar] [CrossRef]
  19. Berndtsson, R.; Becker, P.; Persson, A.; Aspegren, H.; Haghighatafshar, S.; Jönsson, K.; Larsson, R.; Mobini, S.; Mottaghi, M.; Nilsson, J. Drivers of changing urban flood risk: A framework for action. J. Environ. Manag. 2019, 240, 47–56. [Google Scholar] [CrossRef]
  20. Gulachenski, A.; Ghersi, B.M.; Lesen, A.E.; Blum, M.J. Abandonment, ecological assembly and public health risks in counter-urbanizing cities. Sustainability 2016, 8, 491. [Google Scholar] [CrossRef]
  21. Burns, D.A.; Pellerin, B.A.; Miller, M.P.; Capel, P.D.; Tesoriero, A.J.; Duncan, J.M. Monitoring the riverine pulse: Applying high-frequency nitrate data to advance integrative understanding of biogeochemical and hydrological processes. Wiley Interdiscip. Rev. Water 2019, 6, e1348. [Google Scholar] [CrossRef]
  22. AL-Shammari, M.M.; AL-Shamma’a, A.M.; Al Maliki, A.; Hussain, H.M.; Yaseen, Z.M.; Armanuos, A.M. Integrated water harvesting and aquifer recharge evaluation methodology based on remote sensing and geographical information system: Case study in Iraq. Nat. Resour. Res. 2021, 30, 2119–2143. [Google Scholar] [CrossRef]
  23. Jayantilal, G.M. Modelling Runoff Using Modified SCS-CN Method for Middle South Saurashtra Region (Gujarat-India). Ph.D. Thesis, Gujarat Technological University Ahmedabad, Gujarat, India, 2016. [Google Scholar]
  24. Roopnarine, C.; Ramlal, B.; Roopnarine, R. A Comparative Analysis of Weighting Methods in Geospatial Flood Risk Assessment: A Trinidad Case Study. Land 2022, 11, 1649. [Google Scholar] [CrossRef]
  25. Aznarez, C.; Jimeno-Sáez, P.; López-Ballesteros, A.; Pacheco, J.P.; Senent-Aparicio, J. Analysing the impact of climate change on hydrological ecosystem services in Laguna del Sauce (Uruguay) using the SWAT model and remote sensing data. Remote Sens. 2021, 13, 2014. [Google Scholar] [CrossRef]
  26. Hailu, A.; Mammo, S.; Kidane, M. Dynamics of land use, land cover change trend and its drivers in Jimma Geneti District, Western Ethiopia. Land Use Policy 2020, 99, 105011. [Google Scholar] [CrossRef]
  27. Sonu, T.; Bhagyanathan, A. The impact of upstream land use land cover change on downstream flooding: A case of Kuttanad and Meenachil River Basin, Kerala, India. Urban Clim. 2022, 41, 101089. [Google Scholar]
  28. Nasreen, M.; Hossain, K.M.; Khan, M.M. (Eds.) Coastal Disaster Risk Management in Bangladesh: Vulnerability and Resilience, 1st ed.; Routledge: London, UK, 2023. [Google Scholar]
  29. Benton-Short, L.; Short, J.R. Cities and Nature; Routledge: New York, NY, USA, 2013. [Google Scholar]
  30. Reza, I. Assessment of Water Level and Bed Level Variation in the Lower Meghna River. Master’s Thesis, Bangladesh University of Engineering and Technology, Dhaka, Bangladesh, 2010. [Google Scholar]
  31. Kim, H.W.; Li, M.-H.; Kim, J.-H.; Jaber, F. Examining the impact of suburbanization on surface runoff using the SWAT. Int. J. Environ. Res. 2016, 10, 379–390. [Google Scholar]
  32. Barbero-Sierra, C.; Marques, M.-J.; Ruíz-Pérez, M. The case of urban sprawl in Spain as an active and irreversible driving force for desertification. J. Arid Environ. 2013, 90, 95–102. [Google Scholar] [CrossRef]
  33. Kumar, P.; Avtar, R.; Dasgupta, R.; Johnson, B.A.; Mukherjee, A.; Ahsan, M.N.; Nguyen, D.C.H.; Nguyen, H.Q.; Shaw, R.; Mishra, B.K. Socio-hydrology: A key approach for adaptation to water scarcity and achieving human well-being in large riverine islands. Prog. Disaster Sci. 2020, 8, 100134. [Google Scholar] [CrossRef]
  34. Halder, A.; Majed, N. The effects of unplanned land use and heavy seasonal rainfall on the storm-water drainage in Dhaka metropolitan city of Bangladesh. Urban Water J. 2023, 20, 707–722. [Google Scholar] [CrossRef]
  35. Tawhid, K.G. Causes and Effects of Water Logging in Dhaka City, Bangladesh. TRITA-LWR. Master’s Thesis, Department of Land and Water Resource Engineering, Royal Institute of Technology, Stockholm, Sweden, 2004. [Google Scholar]
  36. Ahmed, A.U.; Appadurai, A.N.; Neelormi, S. Status of climate change adaptation in South Asia region. In Status of Climate Change Adaptation in Asia and the Pacific; Springer: Cham, Switzerland, 2019; pp. 125–152. [Google Scholar]
  37. Chasek, P.; Downie, D. Global Environmental Politics; Routledge: New York, NY, USA, 2020. [Google Scholar]
  38. Rahman, M.; Ningsheng, C.; Mahmud, G.I.; Islam, M.M.; Pourghasemi, H.R.; Ahmad, H.; Habumugisha, J.M.; Washakh, R.M.A.; Alam, M.; Liu, E. Flooding and its relationship with land cover change, population growth, and road density. Geosci. Front. 2021, 12, 101224. [Google Scholar] [CrossRef]
  39. Erhard, L.; Heiberger, R. Regression and Machine learning. In Research Handbook on Digital Sociology; Edward Elgar Publishing: Cheltenham, UK, 2023; pp. 130–145. [Google Scholar]
  40. Kumar, A.; Upadhyay, P.; Singh, U. Multi-Sensor and Multi-Temporal Remote Sensing: Specific Single Class Mapping; CRC Press: Boca Raton, FL, USA, 2023. [Google Scholar]
  41. Naboureh, A.; Li, A.; Bian, J.; Lei, G.; Amani, M. A hybrid data balancing method for classification of imbalanced training data within google earth engine: Case studies from mountainous regions. Remote Sens. 2020, 12, 3301. [Google Scholar] [CrossRef]
  42. Lukas, P.; Melesse, A.M.; Kenea, T.T. Prediction of future land use/land cover changes using a coupled CA-ANN model in the upper omo–gibe river basin, Ethiopia. Remote Sens. 2023, 15, 1148. [Google Scholar] [CrossRef]
  43. Muhammad, R.; Zhang, W.; Abbas, Z.; Guo, F.; Gwiazdzinski, L. Spatiotemporal change analysis and prediction of future land use and land cover changes using QGIS MOLUSCE plugin and remote sensing big data: A case study of Linyi, China. Land 2022, 11, 419. [Google Scholar] [CrossRef]
  44. Ramadan, G.F.; Hidayati, I.N. Prediction and Simulation of Land Use and Land Cover Changes Using Open Source QGIS. A Case Study of Purwokerto, Central Java, Indonesia. Indones. J. Geogr. 2022, 54, 344–351. [Google Scholar] [CrossRef]
  45. Guo, X.; Fu, Q.; Hang, Y.; Lu, H.; Gao, F.; Si, J. Spatial variability of soil moisture in relation to land use types and topographic features on hillslopes in the black soil (mollisols) area of northeast China. Sustainability 2020, 12, 3552. [Google Scholar] [CrossRef]
  46. Randolph, J. Environmental Land Use Planning and Management; Island Press: Washington, DC, USA, 2004. [Google Scholar]
  47. Deng, X.; Li, Z.; Gibson, J. A review on trade-off analysis of ecosystem services for sustainable land-use management. J. Geogr. Sci. 2016, 26, 953–968. [Google Scholar] [CrossRef]
  48. Souza, C.M., Jr.; Shimbo, J.Z.; Rosa, M.R.; Parente, L.L.; Alencar, A.A.; Rudorff, B.F.; Hasenack, H.; Matsumoto, M.; Ferreira, L.G.; Souza-Filho, P.W. Reconstructing three decades of land use and land cover changes in brazilian biomes with landsat archive and earth engine. Remote Sens. 2020, 12, 2735. [Google Scholar] [CrossRef]
  49. Leta, M.K.; Demissie, T.A.; Tränckner, J. Modeling and prediction of land use land cover change dynamics based on land change modeler (Lcm) in nashe watershed, upper blue nile basin, Ethiopia. Sustainability 2021, 13, 3740. [Google Scholar] [CrossRef]
  50. Gao, G.; Fu, B.; Lü, Y.; Liu, Y.; Wang, S.; Zhou, J. Coupling the modified SCS-CN and RUSLE models to simulate hydrological effects of restoring vegetation in the Loess Plateau of China. Hydrol. Earth Syst. Sci. 2012, 16, 2347–2364. [Google Scholar] [CrossRef]
  51. Kiprotich, P.; Wei, X.; Zhang, Z.; Ngigi, T.; Qiu, F.; Wang, L. Assessing the impact of land use and climate change on surface runoff response using gridded observations and swat+. Hydrology 2021, 8, 48. [Google Scholar] [CrossRef]
  52. Shrestha, S.; Cui, S.; Xu, L.; Wang, L.; Manandhar, B.; Ding, S. Impact of land use change due to urbanisation on surface runoff using GIS-based SCS–CN method: A case study of Xiamen city, China. Land 2021, 10, 839. [Google Scholar] [CrossRef]
  53. Taherizadeh, M.; Niknam, A.; Nguyen-Huy, T.; Mezősi, G.; Sarli, R. Flash flood-risk areas zoning using integration of decision-making trial and evaluation laboratory, GIS-based analytic network process and satellite-derived information. Nat. Hazards 2023, 118, 2309–2335. [Google Scholar] [CrossRef]
  54. Satheeshkumar, S.; Venkateswaran, S.; Kannan, R. Rainfall–runoff estimation using SCS–CN and GIS approach in the Pappiredipatti watershed of the Vaniyar sub basin, South India. Model. Earth Syst. Environ. 2017, 3, 24. [Google Scholar] [CrossRef]
  55. Voldoire, A.; Saint-Martin, D.; Sénési, S.; Decharme, B.; Alias, A.; Chevallier, M.; Colin, J.; Guérémy, J.F.; Michou, M.; Moine, M.P. Evaluation of CMIP6 deck experiments with CNRM-CM6-1. J. Adv. Model. Earth Syst. 2019, 11, 2177–2213. [Google Scholar] [CrossRef]
  56. Michou, M.; Nabat, P.; Saint-Martin, D.; Bock, J.; Decharme, B.; Mallet, M.; Roehrig, R.; Séférian, R.; Sénési, S.; Voldoire, A. Present-day and historical aerosol and ozone characteristics in CNRM CMIP6 simulations. J. Adv. Model. Earth Syst. 2020, 12, e2019MS001816. [Google Scholar] [CrossRef]
  57. Rahman, M.; Tumon, M.S.H.; Islam, M.M.; Chen, N.; Pham, Q.B.; Ullah, K.; Ahammed, S.J.; Liza, S.N.; Aziz, M.A.; Chakma, S.; et al. Could climate change exacerbate droughts in Bangladesh in the future? J. Hydrol. 2023, 625, 130096. [Google Scholar] [CrossRef]
  58. Fujimori, S.; Hasegawa, T.; Ito, A.; Takahashi, K.; Masui, T. Gridded emissions and land-use data for 2005–2100 under diverse socioeconomic and climate mitigation scenarios. Sci. Data 2018, 5, 180210. [Google Scholar] [CrossRef]
  59. Chen, G.; Li, X.; Liu, X. Global land projection based on plant functional types with a 1-km resolution under socio-climatic scenarios. Sci. Data 2022, 9, 125. [Google Scholar] [CrossRef] [PubMed]
  60. The, U.S. Global Change Research Program. In Global Climate Change Impacts in the United States; Cambridge University Press: Cambridge, UK, 2009. [Google Scholar]
  61. Meresa, H.; Tischbein, B.; Mekonnen, T. Climate change impact on extreme precipitation and peak flood magnitude and frequency: Observations from CMIP6 and hydrological models. Nat. Hazards 2022, 111, 2649–2679. [Google Scholar] [CrossRef]
  62. Willkofer, F.; Schmid, F.-J.; Komischke, H.; Korck, J.; Braun, M.; Ludwig, R. The impact of bias correcting regional climate model results on hydrological indicators for Bavarian catchments. J. Hydrol. Reg. Stud. 2018, 19, 25–41. [Google Scholar] [CrossRef]
  63. Das, S.; Islam, A.R.M.T.; Kamruzzaman, M. Assessment of climate change impact on temperature extremes in a tropical region with the climate projections from CMIP6 model. Clim. Dyn. 2023, 60, 603–622. [Google Scholar] [CrossRef]
  64. Dewan, A.M.; Yamaguchi, Y. Land use and land cover change in Greater Dhaka, Bangladesh: Using remote sensing to promote sustainable urbanization. Appl. Geogr. 2009, 29, 390–401. [Google Scholar] [CrossRef]
  65. Abdullah, S.; Adnan, M.S.G.; Barua, D.; Murshed, M.M.; Kabir, Z.; Chowdhury, M.B.H.; Hassan, Q.K.; Dewan, A. Urban green and blue space changes: A spatiotemporal evaluation of impacts on ecosystem service value in Bangladesh. Ecol. Inform. 2022, 70, 101730. [Google Scholar] [CrossRef]
  66. Dewan, A.M.; Kabir, M.H.; Nahar, K.; Rahman, M.Z. Urbanisation and environmental degradation in Dhaka Metropolitan Area of Bangladesh. Int. J. Environ. Sustain. Dev. 2012, 11, 118–147. [Google Scholar] [CrossRef]
  67. Dewan, A.M.; Corner, R.J. The impact of land use and land cover changes on land surface temperature in a rapidly urbanizing megacity. In Proceedings of the 2012 IEEE International Geoscience and Remote Sensing Symposium, Munich, Germany, 22–27 July 2012; pp. 6337–6339. [Google Scholar]
  68. Dewan, A.M.; Corner, R.J. Spatiotemporal analysis of urban growth, sprawl and structure. In Dhaka Megacity: Geospatial Perspectives on Urbanisation, Environment and Health; Springer: Dordrecht, The Netherlands, 2014; pp. 99–121. [Google Scholar]
  69. Yan, Z.-W.; Wang, J.; Xia, J.-J.; Feng, J.-M. Review of recent studies of the climatic effects of urbanization in China. Adv. Clim. Change Res. 2016, 7, 154–168. [Google Scholar] [CrossRef]
  70. Ranagalage, M.; Morimoto, T.; Simwanda, M.; Murayama, Y. Spatial analysis of urbanization patterns in four rapidly growing south Asian cities using Sentinel-2 Data. Remote Sens. 2021, 13, 1531. [Google Scholar] [CrossRef]
  71. Hossain, S. Rapid Urban Growth and Poverty in Dhaka City. Bangladesh E-J. Sociol. 2008, 5, 1–24. [Google Scholar]
  72. Tuia, D.; Roscher, R.; Wegner, J.D.; Jacobs, N.; Zhu, X.; Camps-Valls, G. Toward a collective agenda on ai for earth science data analysis. IEEE Geosci. Remote Sens. Mag. 2021, 9, 88–104. [Google Scholar] [CrossRef]
  73. Sajan, B.; Mishra, V.N.; Kanga, S.; Meraj, G.; Singh, S.K.; Kumar, P. Cellular automata-based artificial neural network model for assessing past, present, and future land use/land cover dynamics. Agronomy 2022, 12, 2772. [Google Scholar] [CrossRef]
  74. Schubert, J.E.; Sanders, B.F. Building treatments for urban flood inundation models and implications for predictive skill and modeling efficiency. Adv. Water Resour. 2012, 41, 49–64. [Google Scholar] [CrossRef]
  75. Ho, M.; Wasko, C.; O’Shea, D.; Nathan, R.; Vogel, E.; Sharma, A. Changes in flood-associated rainfall losses under climate change. J. Hydrol. 2023, 625, 129950. [Google Scholar] [CrossRef]
  76. Romero-Lankao, P.; Gnatz, D.M. Conceptualizing urban water security in an urbanizing world. Curr. Opin. Environ. Sustain. 2016, 21, 45–51. [Google Scholar] [CrossRef]
  77. Mahdian, M.; Hosseinzadeh, M.; Siadatmousavi, S.M.; Chalipa, Z.; Delavar, M.; Guo, M.; Abolfathi, S.; Noori, R. Modelling impacts of climate change and anthropogenic activities on inflows and sediment loads of wetlands: Case study of the Anzali wetland. Sci. Rep. 2023, 13, 5399. [Google Scholar] [CrossRef]
  78. Schneider, S.H. Encyclopedia of Climate and Weather; Oxford University Press: Oxford, UK, 2011; Volume 1. [Google Scholar]
  79. Masrur, A.; Dewan, A.; Botje, D.; Kiselev, G.; Murshed, M.M. Dynamics of human presence and flood-exposure risk in close proximity to Bangladesh’s river network: An evaluation with multitemporal satellite imagery. Geocarto Int. 2022, 37, 14946–14962. [Google Scholar] [CrossRef]
  80. Zhang, X.; Bayulken, B.; Skitmore, M.; Lu, W.; Huisingh, D. Sustainable urban transformations towards smarter, healthier cities: Theories, agendas and pathways. J. Clean. Prod. 2018, 173, 1–10. [Google Scholar] [CrossRef]
  81. Nae, M.; Dumitrache, L.; Suditu, B.; Matei, E. Housing activism initiatives and land-use conflicts: Pathways for participatory planning and urban sustainable development in Bucharest city, Romania. Sustainability 2019, 11, 6211. [Google Scholar] [CrossRef]
Figure 1. Location of the study area.
Ijgi 12 00401 g001
Figure 2. Flowchart, showing method of this study.
Ijgi 12 00401 g002
Figure 3. RF-based LULC maps of the study area.
Ijgi 12 00401 g003
Figure 4. Area (km2) of LULC categories for 2000, 2010, and 2020.
Ijgi 12 00401 g004
Figure 5. Future LULC of the study area developed from CA-ANN model.
Ijgi 12 00401 g005
Figure 6. Areas (km2) of future LULC classes for 2020, 2030, and 2050, 2070, and 2100.
Ijgi 12 00401 g006
Figure 7. LULC changes in different periods.
Ijgi 12 00401 g007
Figure 8. Spatial distribution of runoff (mm) during the three seasons in different temporal periods.
Ijgi 12 00401 g008
Table 1. Major LULC categories.
LULC ClassDescription
WaterbodyRiver, permanent open water, lakes, ponds, and canals
VegetationTrees, natural vegetation, mixed forest, gardens, parks and playgrounds, and grassland
Built-up Residential and non-residential buildings, commercial and industrial buildings, and any type of infrastructure
Agricultural landCrop, open field, fallow land, and mixed forest land
WetlandPermanent/seasonal wetlands, exposed soils in the riverine area, wetland, and newly accreted land
Bare soilSand, bare land, and landfill sites
Table 2. Computed spectrometric indices and their formulae [38,41].
NameFormula
NDVI(NIR−Red)/(NIR + Red)
NDWI(Green−NIR)/(Green + NIR)
NDBI(SWIR−NIR)/(SWIR + NIR)
SAVI((NIR−Red)/(NIR + Red + L)) × (1 + L)
Note: NIR: near infrared, SWIR: shortwave infrared, L = 0.428.
Table 3. Factors used in simulating and predicting LULC.
FactorsSourceRemarks
ElevationShuttle Radar Topography Mission (SRTM) digital elevation model (30 m, DEM: https://earthexplorer.usgs.gov/; accessed on 5 June 2022)NA
SlopeShuttle Radar Topography Mission (SRTM) digital elevation model (30 m, DEM: https://earthexplorer.usgs.gov/; accessed on 5 June 2022)NA
Distance to riversLGED river network: https://data.humdata.org/dataset/bangladesh-water-courses; accessed on 5 June 2022Reclassify using the Euclidean distance
Distance to roadsLGED road network: https://data.humdata.org/dataset/bangladesh-water-courses; accessed on 5 June 2022Reclassify using the Euclidean distance
Table 4. Hyper-parameter configuration space for the ANN algorithm in CA-ANN model.
IterationNeighborhood ValueLearning RateHidden LayerMomentum
1203 × 3 pixels0.001100.04
Table 5. Annual rate of alteration (%) of projected LULC in various temporal intervals.
LULC Class2020–20302020–20502020–20702020–2100
%%%%
Waterbody1.100.37−0.37−0.23
Vegetation3.551.18−0.23−0.14
Built-up 3.331.110.850.53
Agricultural land−4.67−1.56−1.29−0.80
Wetland−5.61−1.87−1.82−1.14
Bare soil−5.13−1.71−1.33−0.83
Disclaimer/Publisher’s Note: The statements, opinions and data contained in all publications are solely those of the individual author(s) and contributor(s) and not of MDPI and/or the editor(s). MDPI and/or the editor(s) disclaim responsibility for any injury to people or property resulting from any ideas, methods, instructions or products referred to in the content.

