Article

Portraying the Influence Factor of Urban Vibrancy at Street Level Using Multisource Urban Data

1
Yunnan Vocational Institute of Energy Technology, Qujing 655000, China
2
School of Geography and Information Engineering, China University of Geosciences, Wuhan 430074, China
3
National Engineering Research Center of Geographic Information System, Wuhan 430074, China
*
Author to whom correspondence should be addressed.
ISPRS Int. J. Geo-Inf. 2023, 12(10), 402; https://doi.org/10.3390/ijgi12100402
Submission received: 6 August 2023 / Revised: 21 September 2023 / Accepted: 23 September 2023 / Published: 1 October 2023

Abstract

:
Exploring the factors influencing urban vibrancy can help policy development and advance urban planning and sustainable development. Previous studies have typically focused on the effects of physical environmental factors (e.g., built environment, urban landscape) on urban vibrancy, ignoring the role of non-physical environmental factors (e.g., urban psychological perceptions). In addition, these studies remain focused on relatively coarse spatial units and lack the exploration of finer-grained spatial structures. In this study, a novel framework is proposed to analyze urban vibrancy and its influencing factors at a more fine-grained street level. Firstly, two types of urban sensing data, POIs and Weibo check-ins, are integrated to portray the spatial distribution patterns of urban vibrancy on the streets. Secondly, a full convolutional network (FCN-8s) is used to segment the streetscape images of Beijing and use them as a basis to extract potential visual–spatial features and urban psychological perceptual features that influence urban vibrancy. Thirdly, we reveal the deeper causes of the impact of psychological perception on urban vibrancy. Finally, an improved ridge regression model is proposed to model the relationship between features and vibrancy, reducing the covariance between features while avoiding the reduction of important features. Satisfactory regression model performances were attained with adjusted R2 values of 0.706, 0.743, and 0.807 at each characteristic level. The results of the study show that: Urban vibrancy is highly dependent on the proposed visual–spatial and urban psychological perception characteristics at the street level. In particular, positive urban psychological perceptions (safety, lively, wealthy) are positively correlated with urban vibrancy, while negative street perceptions (boring) are negatively correlated with urban vibrancy. Unlike previous research scales, our study shows that urban vibrancy portrayal based on the street scale has a greater potential to demonstrate fine-grained vibrancy distribution compared to the neighborhood scale. These findings may provide important insights for people-oriented urban development and planning.

1. Introduction

Urban vibrancy is relevant to the sustainable development of cities [1]. Creating and maintaining urban vibrancy not only attracts more human and economic capital to improve productivity and economic sustainability, but also promotes human activities to improve social sustainability [2,3]. Vibrant cities reveal greater prosperity and resilience in response to changes in society, the economy and the environment [4,5]. In addition, urban vibrancy improves people’s subjective perceptions of urban space and is critical to the rational deployment of local facilities and the improvement of residents’ quality of life [6,7,8]. Therefore, revealing the factors associated with urban vibrancy and understanding the deeper causes of urban vibrancy are necessary for city managers and planners [9,10].
According to the scale of research, existing exploratory studies on the factors influencing urban vibrancy are mainly focused on both macro-scale and micro-scale [8,11,12,13]. In macro-scale studies, countries and cities as well as urban agglomerations are usually taken as study objects, studying the vibrancy of intra-city regions or between individual cities [14]. This allows for a global understanding of the factors influencing urban vibrancy and provides a good portrayal of the overall spatial structure of urban vibrancy. Such methods mainly describe the spatial structure of urban vibrancy as a whole by constructing an evaluation system based on the magnitude of indicators within a neighborhood or mean raster [8]. In micro-scale studies, traditional municipal organizational block units such as neighborhoods and traffic analysis zones are usually taken as the target. These studies focus on reporting the close relationship between human activity landscape, mixed-use, urban form and built environment, etc. [10,11,15,16]. Compared to macro-scale studies, these micro-scale studies are more closely related to planning and reality, which can improve the understanding of the complex relationship between human activities and the space of occurrence. However, analyzing the factors influencing urban vibrancy from a block perspective still inevitably overlooks the finer-grained spatial features within blocks that are effective for understanding urban vibrancy [17]. Thus, exploring the factors influencing urban vibrancy at a more microscopic scale (e.g., the street) requires immediate attention.
As the basic unit of urban awareness and urban life, streets play a very important role in urban life. They are generally defined as the spaces formed by building facades on both sides of the street and the street itself, which are urban places for personal interaction and recreation [18]. With the attributes of short length, high pedestrian density, mixed functions, and mixed building ages, streets are not only the main carriers of urban traffic, but also important visual spatial carriers for residents to intuitively perceive urban vibrancy [19]. As Jacobs says, if the street is vibrant, the city is vibrant [20]. The inherent properties of streets allow us to explore the deeper influences on urban vibrancy in the context of more microscopic and complex functional places.
The studies of street vibrancy have focused on two main aspects, namely, the measurement of vibrancy and the exploration of the influencing factors of vibrancy [12,13,17]. Among the prerequisites for exploring the influencing factors of vibrancy is the need to find a suitable proxy to portray vibrancy itself. Existing studies on street vibrancy have been conducted from a qualitative perspective and lack strong data support [4,21,22]. Some of the quantitative studies related to street vibrancy have been done by expert scoring and field research, which are costly and difficult to conduct on a large scale [23,24]. With the emergence of geographical big data and the proliferation of deep learning, there is an unprecedented opportunity for researchers to conduct large-scale quantitative studies of the factors that influence urban vibrancy. However, there are still some other shortcomings: Firstly, the influence of urban non-physical environmental features (e.g., urban psychological perception) that underpin urban planning and important functions in the public domain is neglected [16,25]. Most of them currently focus on social and physical environmental factors, for example, population, employment, income, land use, buildings, and transportation networks [15,22,26,27]. Second, the use of remote sensing images to construct visual indicators of vibrancy-influencing factors does not convey more detailed visual information about the urban microphysical environment. Third, relying on a single source of urban data (e.g., points of interest, social media check-in, house price data, land use, field surveys, etc.) to portray urban vibrancy lacks multifacetedness [9].
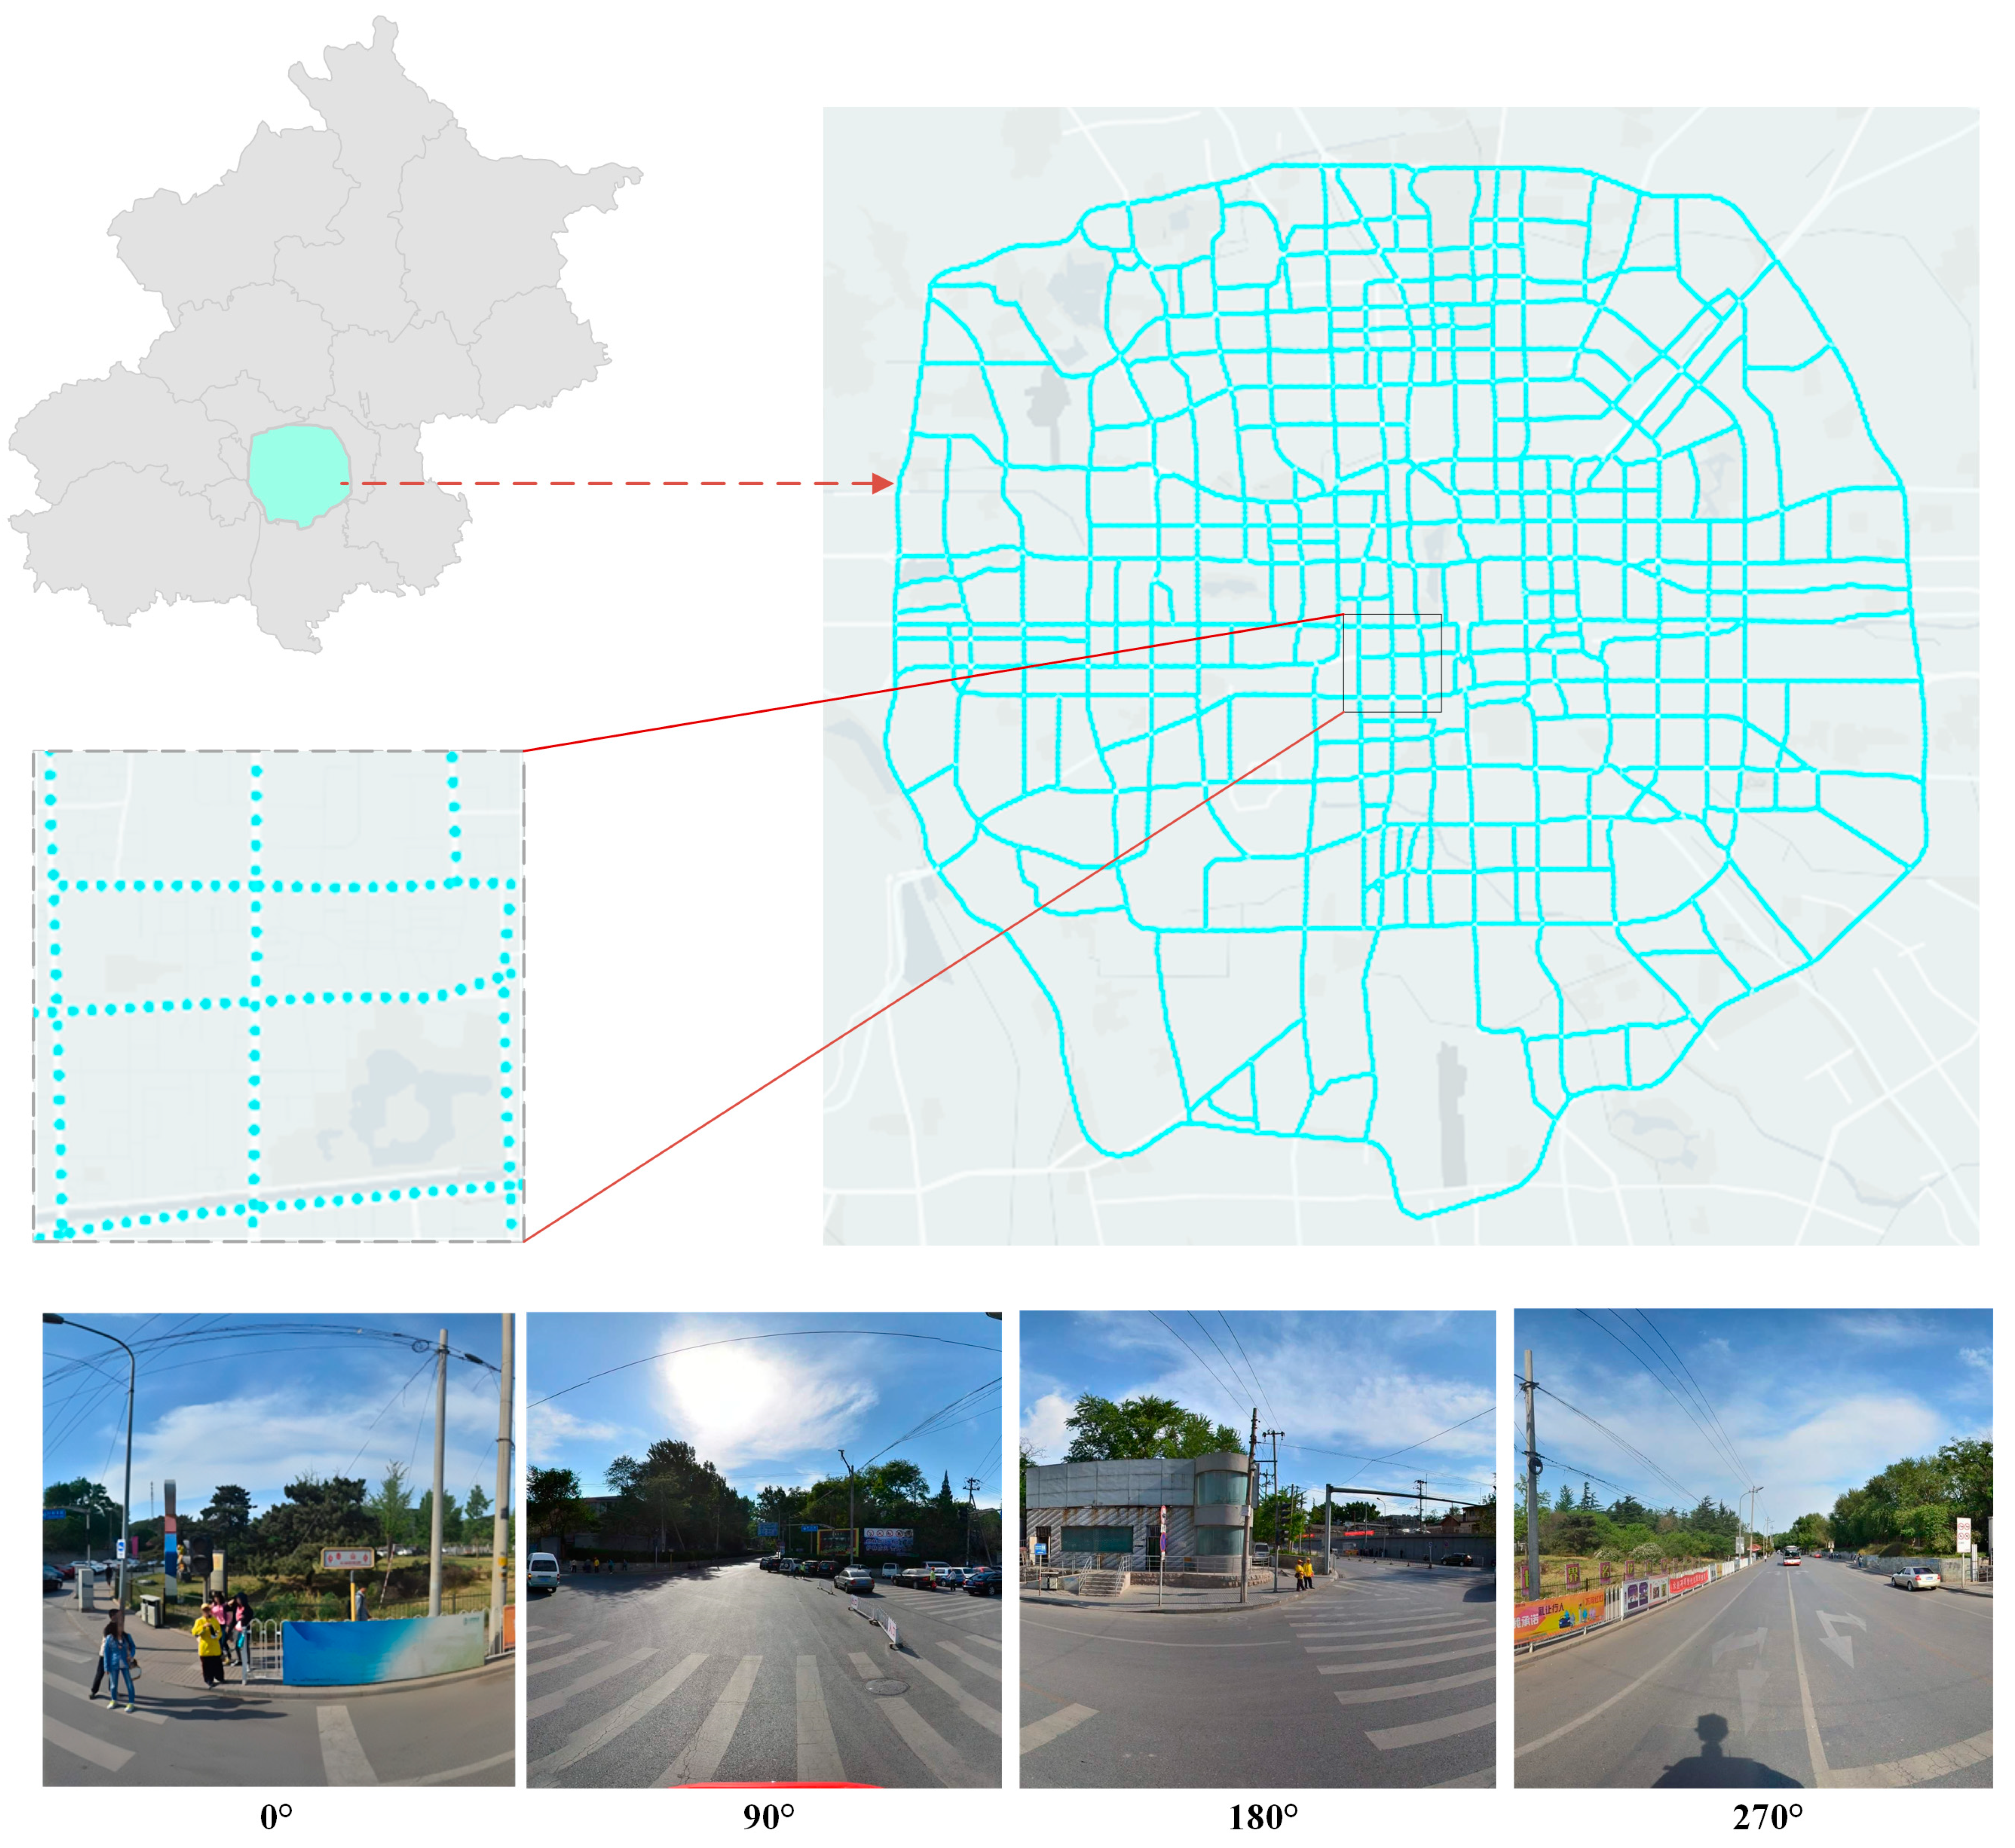
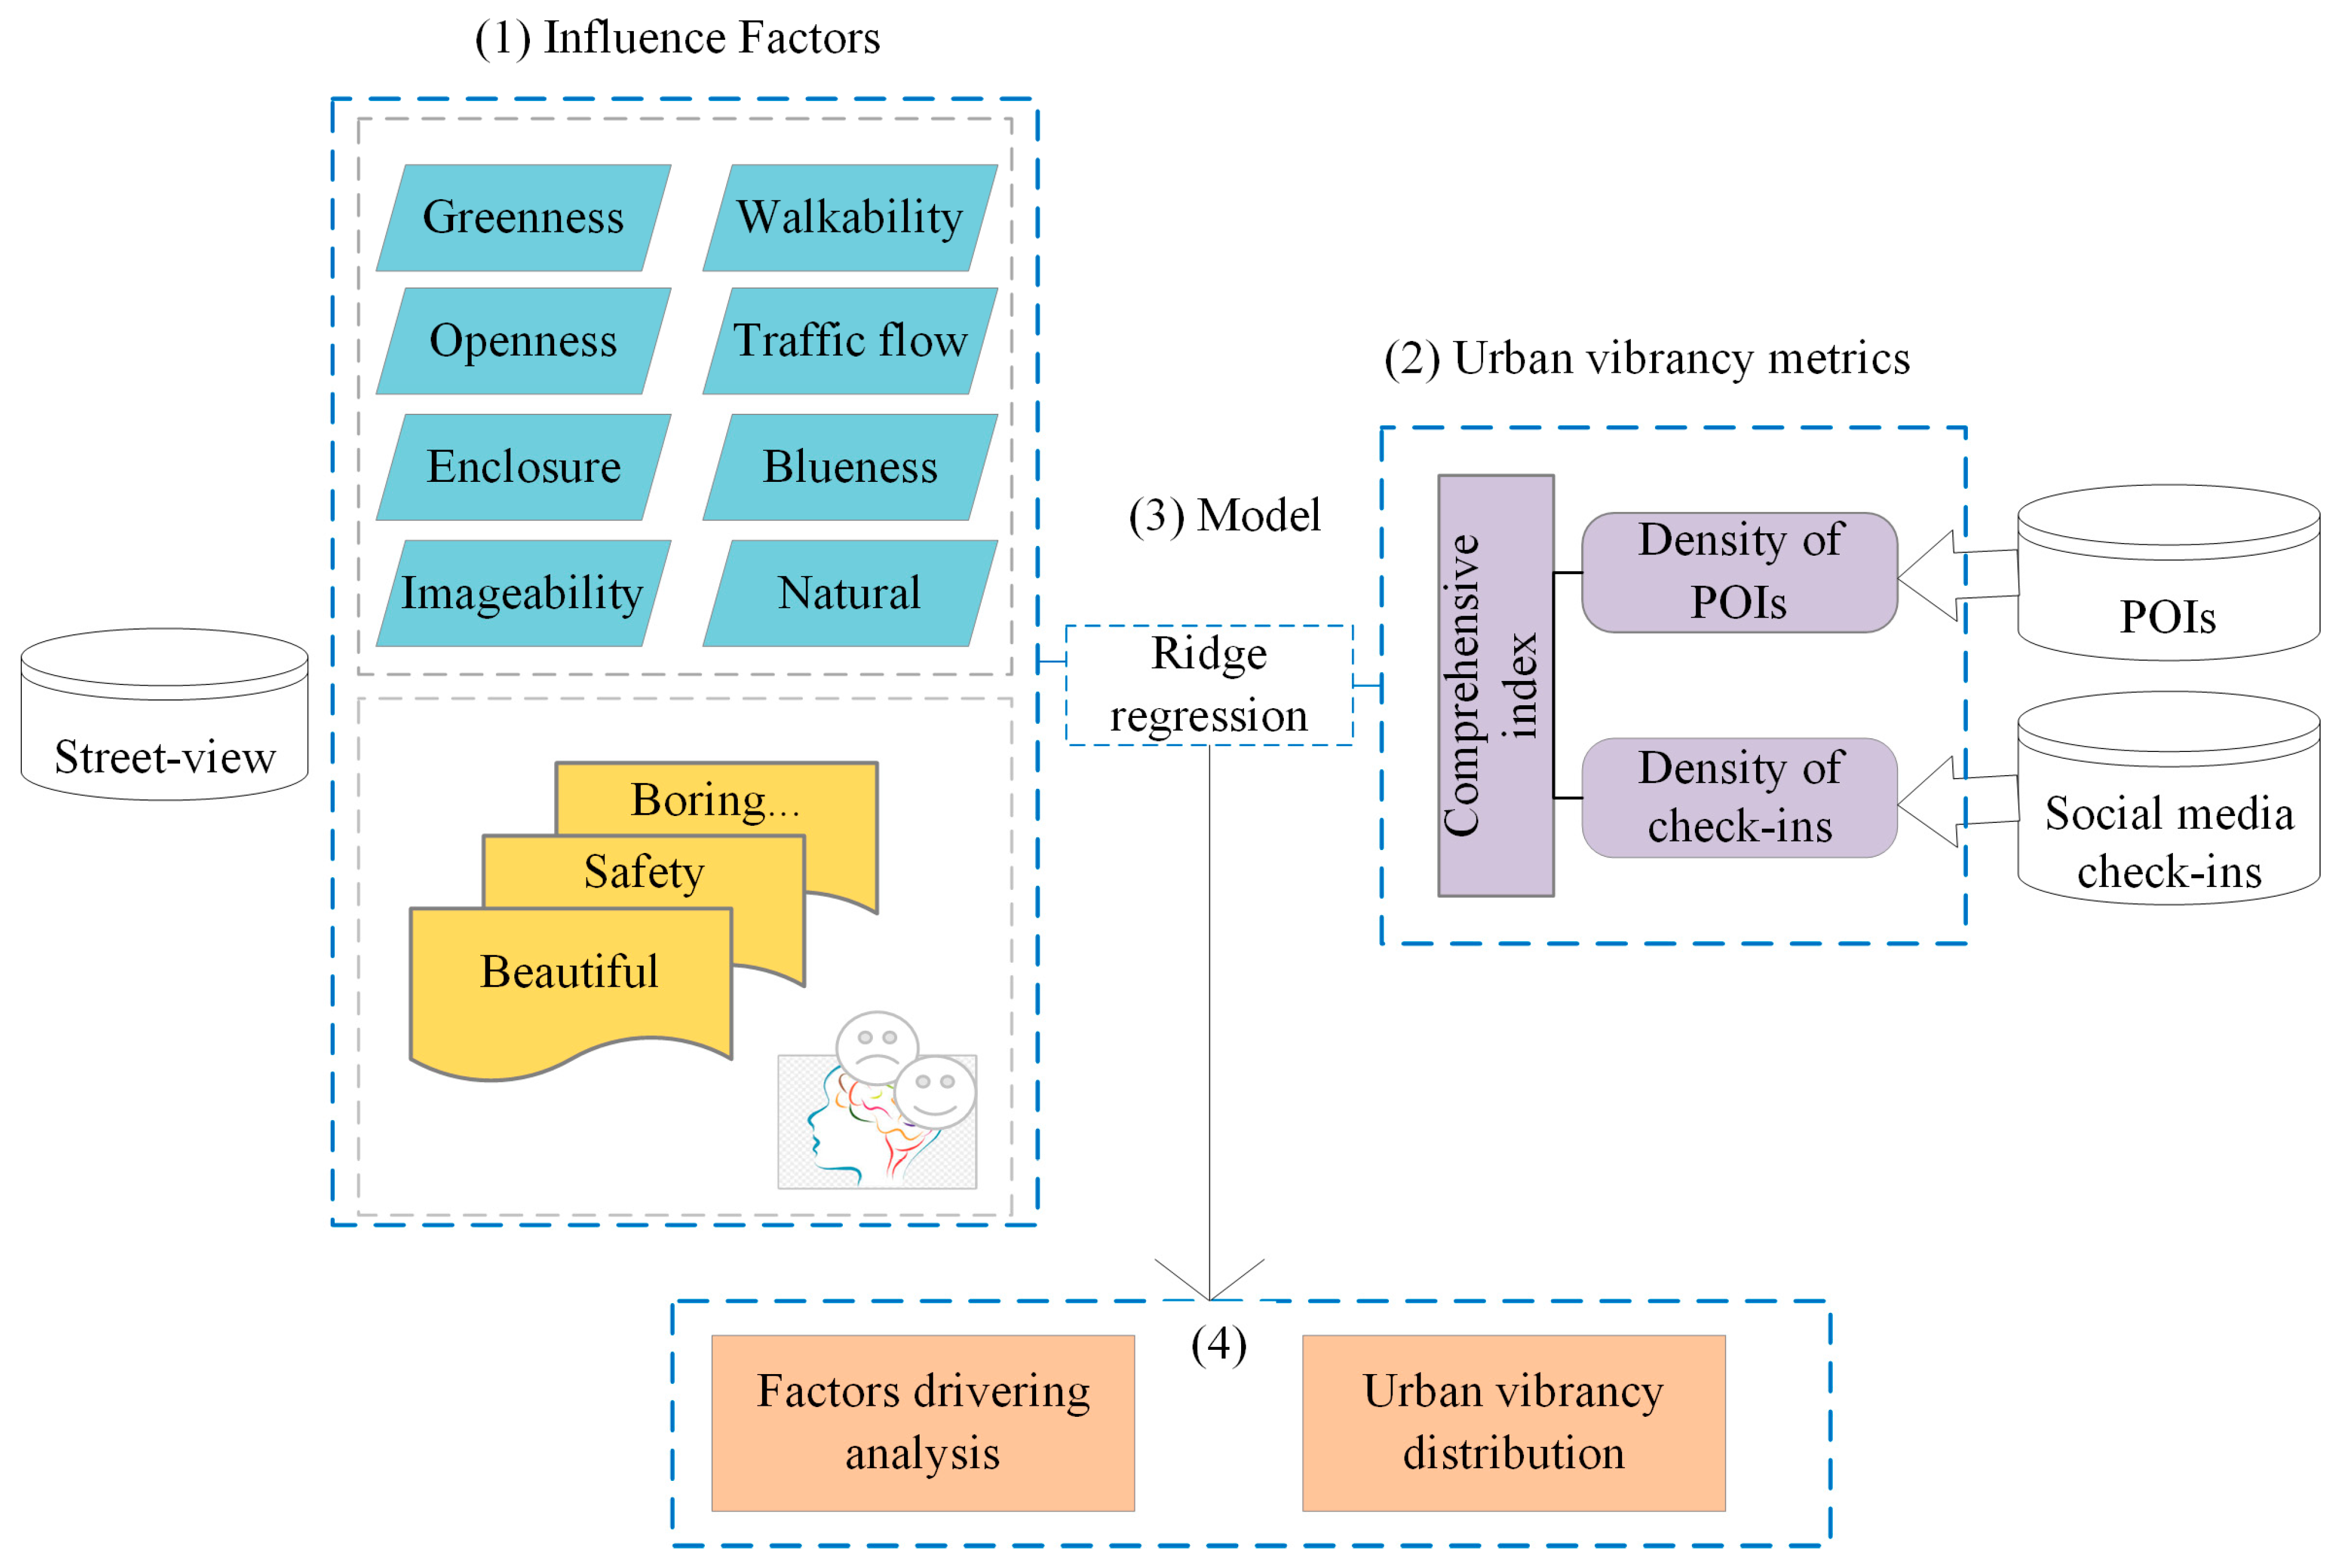
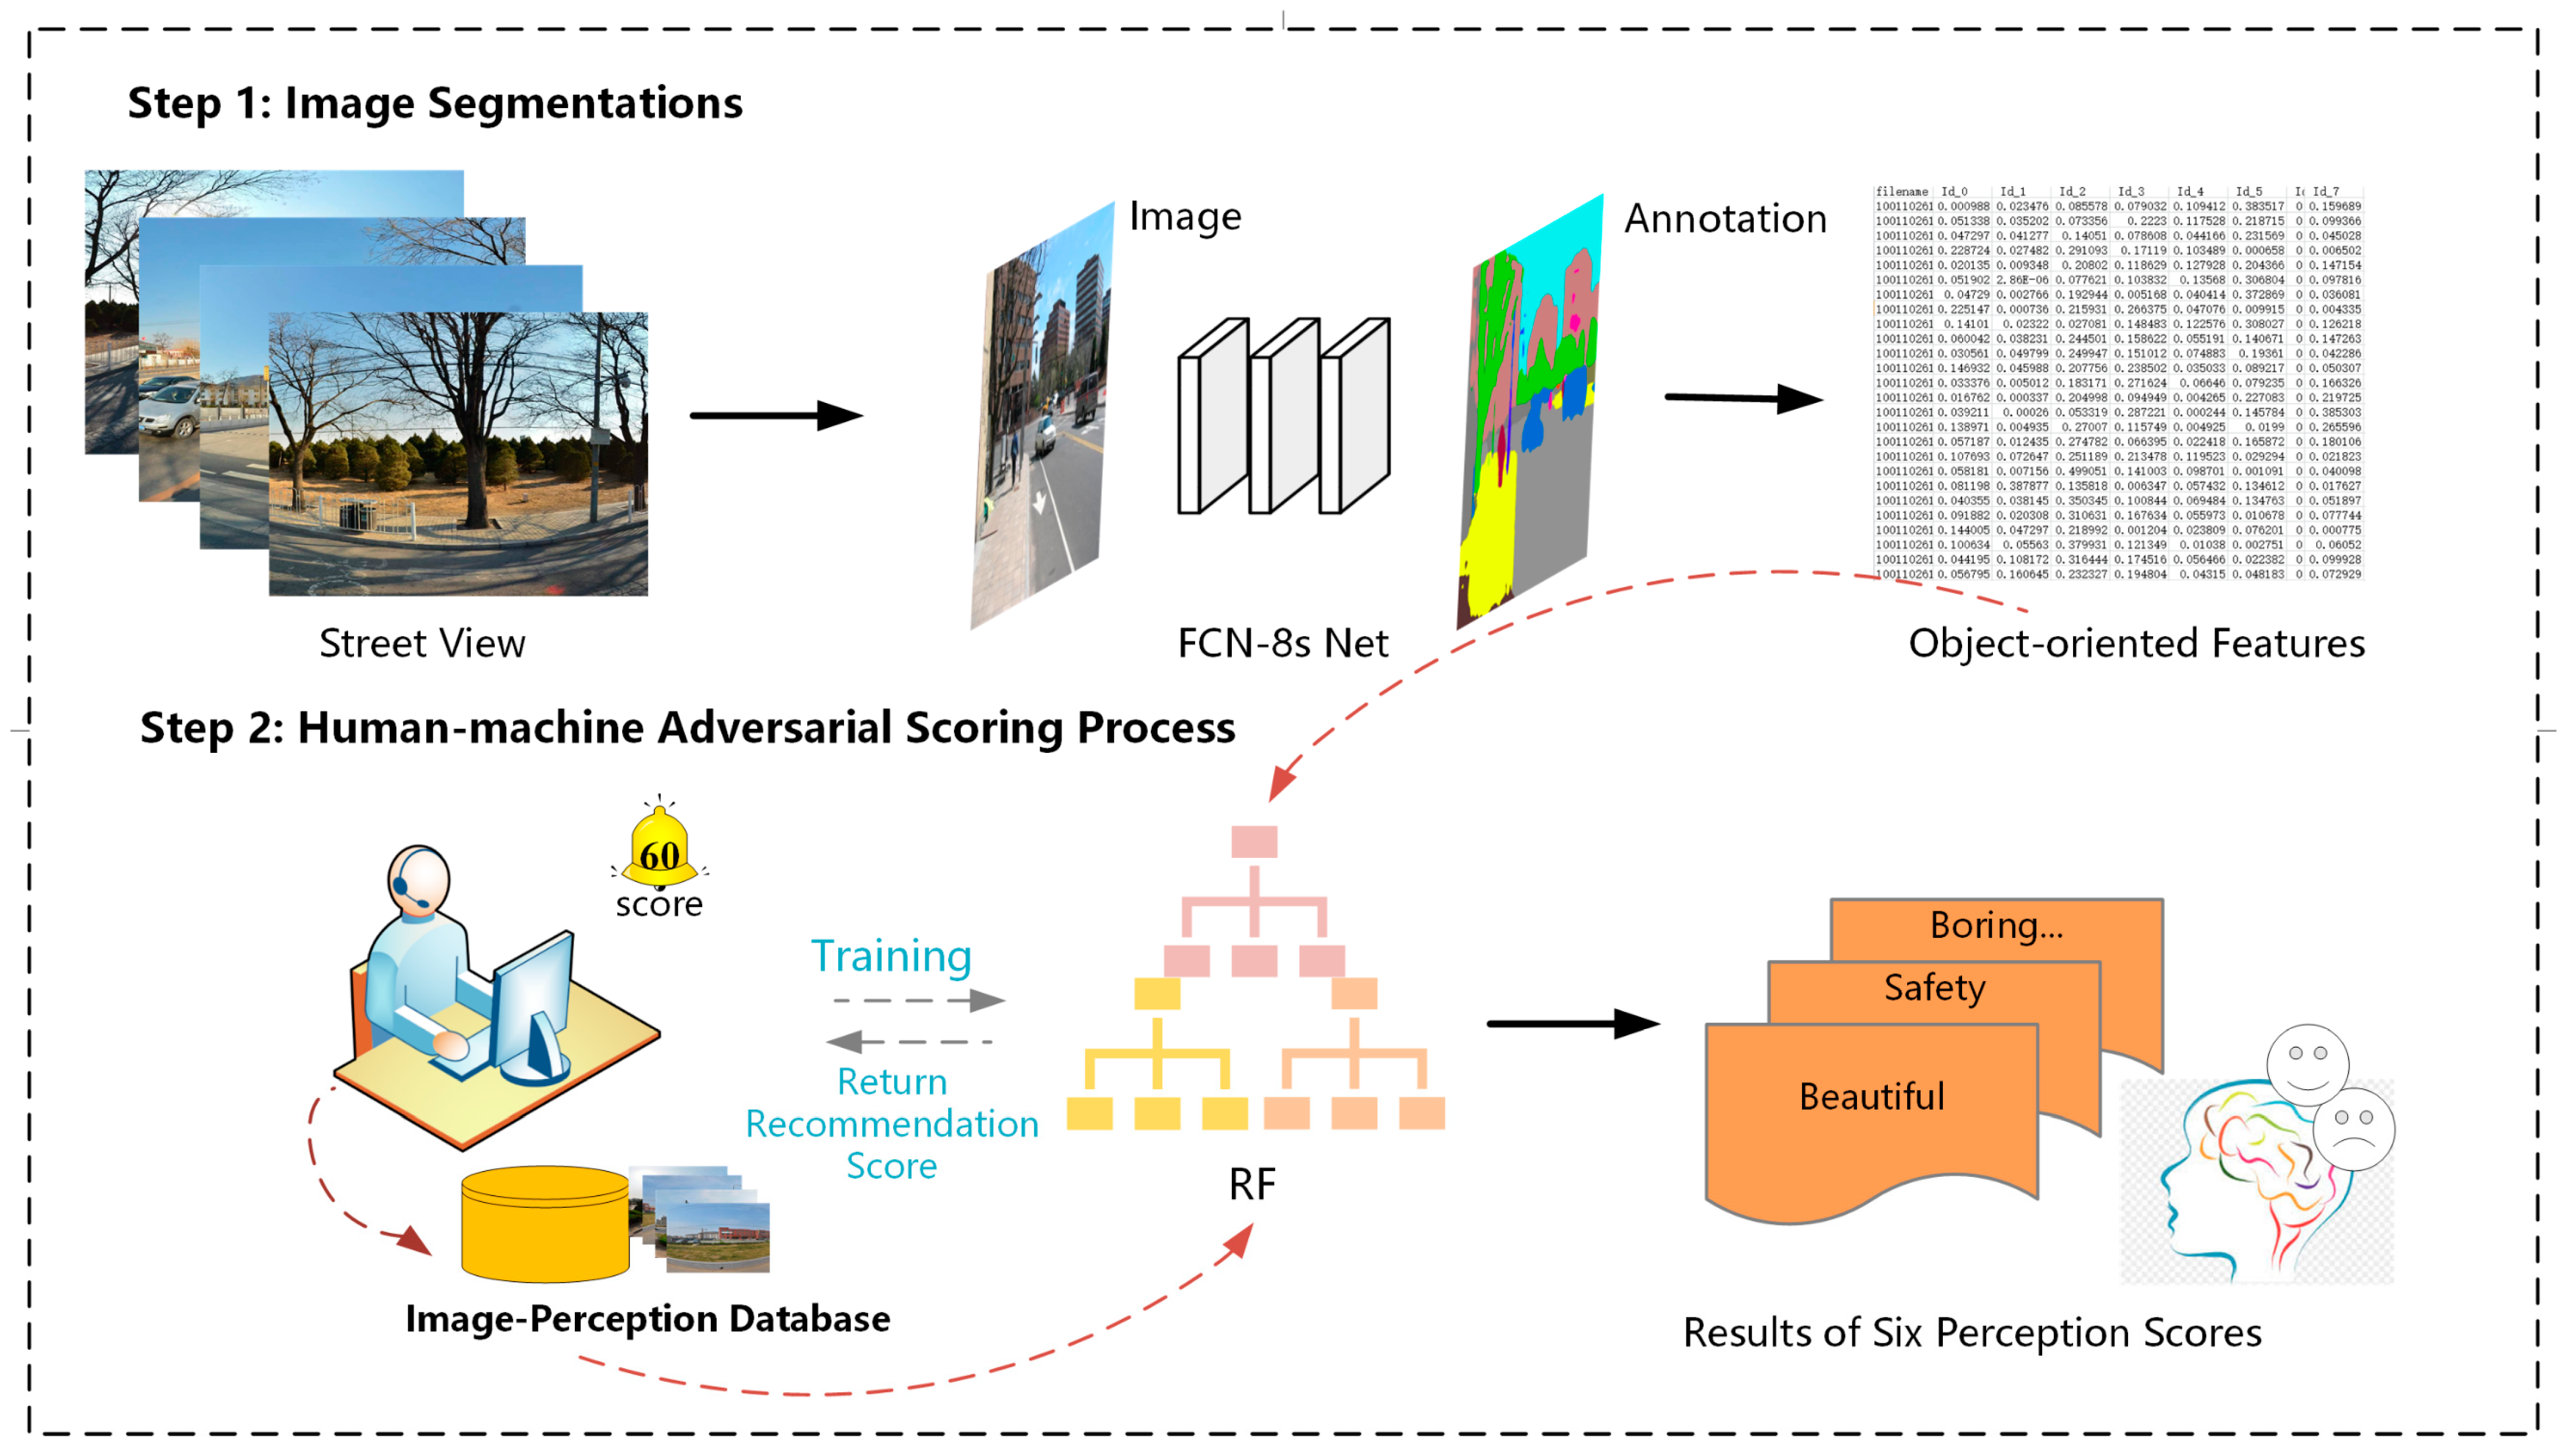
To address the above issues, this study proposes a new framework to study the factors influencing urban vibrancy at the street level based on multi-source data. The emergence of labeled geographic big data, especially street-view data, provides great advantages for mapping the impact of physical environmental factors as well as non-physical environmental factors on urban vibrancy in street micro spaces. Firstly, a comprehensive urban vibrancy index is calculated using the adaptive weighting of two types of urban sensing data, namely, POI and check-in data, as a suitable proxy for accurately quantifying vibrancy. POI data can reflect the location of human activities and portray vibrancy in terms of physical space; check-in data can portray human activity patterns and portray vibrancy in terms of human activity space. Combining the two can portray vibrancy in a more comprehensive and effective way. Secondly, the factors influencing urban vibrancy are portrayed in terms of both urban visual–spatial and psychological perception. A full convolutional network (FCN-8s) is used to segment the streetscape images of Beijing and use them as a basis to extract the above features that influence urban vibrancy. Thirdly, exploring the influencing factors of urban psychological perception reveals the deeper causes of the impact of psychological perception on urban vibrancy. Finally, an improved ridge regression model is proposed to model the relationship between features and vibrancy, reducing the covariance between features while avoiding the reduction of important features.
The feasibility of this research framework is verified using Beijing as a case study. The findings of this study have the potential to provide important insights for people-oriented urban development and planning.
The main contributions of this study are as follows:
(1)
Exploring the factors influencing urban vibrancy from the street scale with finer granularity;
(2)
Portraying the factors influencing urban vibrancy from the two points of view of the objective physical environment (urban visual–spatial) and the non-physical environmental (psychological perception);
(3)
Utilizing two types of urban sensing data to calculate the comprehensive vibrancy index as a proxy of urban vibrancy.
The remainder of this study is organized as follows. Section 2 introduces the related work. Section 3 introduces the study area and datasets used, describing the framework and corresponding methods, variables, and regression models in detail. Section 4 reports and analyzes the results. Section 5 discusses the results and implications. The Section 6 concludes this study.

2. Related Work

In brief, two main issues of urban vibrancy studies have been raised: portraying urban vibrancy and exploring its influencing factors [9,10,11,12,13,14,15,16,17].

2.1. Measurement of Urban Vibrancy

For urban vibrancy measurement, a suitable proxy must be found to accurately measure urban vibrancy. Initially, scholars favored expert scoring and field research to measure regional vibrancy [28]. Expert scoring and field research are effective ways to capture urban vibrancy, and directly investigate the experience of human activity, interaction and life. The expert scoring approach provides a direct and accurate picture of residents’ activities in their living spaces and their perceptions of the living space environment, providing detailed information about individuals, gender, age, satisfaction, etc. [9,13]. However, those indicators are costly and static, and hardly capture dynamic patterns of the population. In addition, current large-scale studies on vibrancy have a large degree of granularity, and this type of method suffers from the limited sample size and difficulties in expanding at large scales.
Many new big data sources are widely used to measure urban vibrancy, in particular, geotagged data are an effective way to perceive urban space [29], such as cell phone signaling data, GPS trajectory data and smart card data, which provide new means of sensing residents’ activities and the intensity of their interaction with the environment, making up for the difficulty of obtaining traditional data and the lack of coverage [30]. Compared with traditional survey methods and related city data, big city data are highly permeable, cover a wide range of areas, and contain rich information such as location, time, and semantics, thus providing an effective tool for measuring urban vibrancy. Therefore, the study of urban vibrancy based on urban big data is becoming a hot topic. For example, Jacobs-Crisioni et al. [31]. explored the relationship between land use intensity and mixing and urban dynamics in the Netherlands using cell phone records as a proxy for population activity. De Nadi et al. used cell phone location data to extract the population activity in six Italian cities, which can be used as a proxy for activity to reconfirm the four conditions of mixed spatial functions, small-scale neighborhoods, rich historical spaces, and dense population proposed by Jacobs to promote urban vibrancy [32]. Smart card data are widely used in traffic studies to obtain more accurate personal travel profiles, monitor traffic congestion, and plan transportation interchange routes [33,34].
Apart from the aforementioned data, points of interest are regarded as proxies for human activities and interactions from a long-term point of view; therefore, they have been successfully adopted to represent urban vibrancy indirectly [35]. Yue et al. investigated the diversity of points of interest (POIs) and further associated these with urban vibrancy [12]. In addition, location-based check-in services allow individuals to share activity-related dynamics, thus providing a new source of data for urban researchers. Social media data (e.g., Twitter and Weibo), which reflect people’s activity locations and preferences, are also used to measure urban vibrancy [36,37,38]. Social media check-ins are recognized as weighted POIs in reflecting the preferences of locations among social media users. Previous studies have demonstrated that most social media check-ins are produced by young users at popular destinations [39,40]. However, the check-ins and actual locations of a person’s behavior do not necessarily match, and reflecting the spatial behaviors of children and the elderly is difficult. Therefore, the present study uses POI data and check-ins data to measure a city’s comprehensive vibrancy.

2.2. Influence Factors

With the increasing richness of urban vibrancy research theories and big data, effectively enhancing and promoting urban vibrancy has also triggered a lot of thoughts from scholars. A large body of the literature suggests that two main factors influence urban vibrancy: socioeconomic and the physical environment [10,12,23,26,35,41,42]. Socioeconomic factors include functional mix, population, employment income, culture and other characteristic elements. Studies have been conducted to prove the impact of pedestrian flow, firm location and property gains on urban vibrancy [43,44]. With the growing interest in the study of urban vibrancy, other factors (housing/land prices and cultural rating) have been used as influencing factors to assess urban vibrancy [42,45]. Most studies have focused on socioeconomic indicators, while development intensity and the urban physical environment characteristics described by urban form are less frequently mentioned. Physical environment factors include built environment, land use, spatial accessibility and urban landscape characteristics [10,11,12]. From the perspective of physical factors, the physical form of the area where urban spatial vibrancy is generated also has a strong influence on urban vibrancy. Land use, spatial accessibility and building density are used to qualitatively describe the correlation between urban form and urban vibrancy [46]. Zhang et al. constructed a framework for analyzing the spatiotemporal relationship between urban vibrancy and the distribution of service facilities, such as transport and roads, in the context of the rise of multi-source big data [47]. However, the following problems remain: (1) These studies on the impact of urban vitality lack a focus on the micro-urban environment (visual–spatial) from the human eye perspective, and most of them only construct impact indicators of urban vitality from an overhead perspective. (2) In addition, non-physical environmental (urban psychological perceptions) influences are often easily overlooked.
As a basic place for human habitation and basic living conditions, the urban environment can influence human activities [48]. Visual–spatial qualities, as an important manifestation of the urban environment, play a central role in influencing psychological perceptions of the urban environment [49]. Urban psychological perceptions refer to individuals’ psychological feelings about urban places [50,51]; most of the literature usually subdivides them into six indicator dimensions: safety, lively, depression, beauty, boring, and wealthy [52,53,54]. For example, beauty is the degree to which a person perceives the place to be beautiful to the eye, with a distribution of scores from 0 to 100. Other indicators of psychological perception are defined in the same way. Researchers have attempted to measure the impact of urban psychological perception factors in other fields. A wide spectrum of studies have assessed urban psychological perceptions based on the MIT Place Pulse project [55,56]. Using a deep learning model trained on this dataset, it is possible to simulate the emotional feelings of individual residents towards urban scenes and thus evaluate urban scenes [57]. Jacobs (1961) pointed out that safer and more lively streets attracted many individuals who participated in activities [20]. Gehl (1971) described urban vibrancy not only in terms of the concentration of individuals, but also in terms of the psychological perceptions of the place [58]. Naik et al. (2014) introduced a novel computational method that can predict street view safety scores in cities and their effects on inhabitants [53]. Previous studies explored how the environment’s aesthetics [59,60], housing, and neighborhood satisfaction might influence human well-being. The abovementioned extensive evidence has revealed that the impacts of human subjective perceptions are essential for urban public space studies. However, traditional methods of obtaining perceptions (e.g., questionnaires and interviews) are labor-intensive and time-consuming, and it is difficult to develop them on a large scale [61,62].
The core of street vibrancy is the people engaged in the activities of the street; the physical environment of the street provides a place for people to move around and has an impact on their activities. Pedestrians spend a lot of time and energy, consciously or unconsciously, appreciating and perceiving the urban landscape of the street space (the intermediate space between buildings and streets) [63], and the psychological emotions such as safety, beauty, and liveliness generated in the process also play a crucial role in influencing urban vibrancy [11,25,27]. The emergence of Street View data and the popularity of deep learning provide opportunities for researchers to quantify the relationship between urban sensing and urban vibrancy. The impact of the urban non-physical environment on urban vibrancy deserves to be focused on and discussed by scholars.
With the increasing attention on domestic urban vibrancy-related research, the study of urban vibrancy has gradually shifted from qualitative analysis to quantitative analysis. In order to further explore the relationship between urban vibrancy and its influencing factors, based on the above literature, a series of models including least squares regression, logistic regression, multivariate linear regression, and geodesic weighted regression are used [15,26,64]. Among them, the least squares regression model is the most commonly used and simplest model that can reveal the relationship and mechanism between the dependent variable and the influencing factor variable of urban vibrancy [10]. Initially, the least square regression model is used to explore the relationship between vibrancy and influencing factors. However, this method cannot deal with the collinearity of variables effectively. In this paper, the improved Ridge regression model is used to reveal the relationship between urban vibrancy and influencing factors.

3. Data and Methods

3.1. Study Area and Data Sources

The focus of this study is Beijing, a city with a well-developed economy and infrastructure located in northern China, north of the North China Plain. According to statistics released by the Beijing Municipal Environmental Protection Bureau (http://tjj.beijing.gov.cn, accessed on 1 November 2020), as of 2020, Beijing had a resident population of 21.89 million and an area of 16,410 square kilometers, encompassing 16 administrative districts. The urbanization rate in Beijing jumped from 54.96% in 1978 to 87.50%. A relatively stable level of urbanization has caused Beijing’s urbanization development to shift from the process of increasing speed to quality improvement, and it has the basic conditions to improve the quality and vibrancy of urban space.
Beijing has a typical concentric circle structure, with most social and economic activities gathered within the Fifth Ring Road. This area is the center of the national economy, culture, and commerce, and is characterized by a dense road network, a high concentration of people, and complex and diverse functions. In this paper, the area within the Fifth Ring Road of Beijing is chosen as the study area, which is typical. The following four types of city datasets are employed to measure urban vibrancy:
(1)
OpenStreetMap data—The foundational dataset for this study is the road network obtained from OpenStreetMap (OSM). OSM is an available map provider, designed to provide users with an easily accessible and free digital map resource, and it is the most popular and widely used voluntary geographic information set at this stage [65,66]. The accuracy of the OSM data within the study area is relatively high [12,66]. After preprocessing operations, such as simplification, merging, and topology inspection, 757 main roads are retained, as shown in Figure 1. These data are used to create a 200 m buffer and produce 757 street analysis units. Road buffers are utilized to acquire city streets according to the research by Liu and Long (2016) [67];
(2)
Street view data—This study utilizes urban street view data to obtain subjective perceptions of the urban landscape. Tencent Maps (https://map.qq.com/, accessed on 12 May 2019) is one of China’s largest online map service providers. Based on OSM road network data (https://www.openstreetmap.org, accessed on 10 July 2019), the processed road network generates sampling points, at a sampling distance of 100 m. The point coordinates are obtained to capture street view images in bulk in the Tencent Map platform’s application programming interface (API). In the street view sampling strategy, each sample point acquires images from four directions (0°, 90°, 180°, and 270°) with a fixed horizontal pitch, as shown in Figure 1. Finally, 32,140 sampling points are selected, and 128,560 street view images are acquired for the experiment. Each Street View image has a spatial resolution of 2048 × 1024 pixels, and the panoramic image was taken during the time period of 09:30 12 May 2019–15:30 28 May 2019;
(3)
POIs data—In this study, POIs are obtained through an API, provided by Gaude’s online mapping service (one of China’s largest online mapping service providers). After filtering and processing the data, a total of 356,253 valid data points are obtained, containing location information and category information for the POIs;
(4)
Check-in data—Social media check-in data, which can express preferences for crowd activity types and locations, is a type of urban sensing data that has been studied extensively in recent years. Check-in data from Sina-Weibo (the largest microblogging site in China) were crawled in 2014. The check-in data have restrictions, such as sampling bias, location inconsistency, and the presence of followers. According to the method used by Wu et al. (2018) and Wu et al. (2014) [17,38], the following criteria are used to process the check-in data—(1) only check-in data within the Beijing research area land unit are retained; (2) POIs with fewer than two check-ins are deleted and marked as invalid. Ultimately, 32,205 check-in records are applied to examine street-block vitality in Beijing, China.
To avoid the time gap problem, the time at which the data sources were collected has been listed in Table 1. We assume that the intention of this paper is to mine the potential perceptual information in the multi-sourced data. Therefore, the impact of the collecting time differences between the data would be not considered.

3.2. Overall Framework

A novel framework is proposed to portray the influence factors of urban vibrancy at the street level using multi-source data. As shown in Figure 2, the proposed framework involves three major parts: (1) quantifying the vibrancy using POIs and social media check-in; (2) calculating the potential association factors; (3) modeling the relationship with the improved least-squares regression–Ridge regression. The details of these steps are shown below.

3.2.1. Quantification of Urban Vibrancy

Using the POIs and micro-blog check-ins data, two urban vibrancy metrics and a comprehensive vibrancy index are derived, as outlined in the following.
(1)
Density of POIs
POIs are locations where human activity commonly happens and are widely used as a proxy for urban vibrancy [9,42], such as residential buildings, factories, schools, stores and parks. Previous studies have demonstrated that POIs are useful for describing urban vibrancy due to their high accuracy, wide range, quick updating, and large amount of data [68]. Here, we express the vibrancy of a street as the POI density, d p o i , as estimated by Equation (1).
The min–max normalization is used to eliminate the magnitudes and the normalized values range from [0, 1], as estimated by Equation (2).
d p o i = i P O I s i A r e a
v p o i = d p o i d m i n d m a x d m i n
where i P O I s represent the number of POIs in a road buffer, and   i A r e a is the road buffer areas. The larger the value of v p o i , the higher the quantified vibrancy of the road buffers.
(2)
Density of social media check-ins
Human activities are usually uneven across locations, as influenced by personal preferences and characteristics of attractions (i.e., type, size). Check-ins on social networking sites are considered another suitable proxy for vibrancy, considering the preferences [17]. To some extent, social media check-ins are POIs weighted by their popularity. Check-in density is calculated in streets to quantify the degree of vibrancy, as follows.
d c i = i c h e c k i n _ n u m i A r e a
v c i = d c i d m i n d m a x d m i n
where d c i is the urban vibrancy quantified in a street, i c h e c k i n _ n u m represents the number of check-ins in a street, v c i is the result normalized by the min–max normalization method. The larger the value of v c i , the higher the quantified vibrancy of the streets.
(3)
Comprehensive urban vibrancy index
Portraying vibrancy with a single source of urban data may be biased in some places. It is necessary to integrate multi-source urban datasets to portray urban vibrancy [3,9]. This paper integrates the above two indicators using the entropy weighting method to obtain a more comprehensive description of vibrancy [69]. This is an objective weighting method that considers the distribution of values. The Shannon entropy H j is measured as in Equation (5).
H j = 1 n v k i ln ( v k i )
where v k i is the vibrancy in a street, i ; n is the total count of streets.
The weights of one type of urban vibrancy,   w j , are calculated via Equation (6).
w j = H j H j
The comprehensive urban vibrancy index, v c , is calculated via Equation (7), where v j is one type of vibrancy.
v c = v j × w j

3.2.2. Influence Factors

The socioeconomic, urban visual–spatial and psychological perceptions have significant influences on urban vibrancy [25,70,71]. Portraying environmental factors with streetscape data from a human perspective can implicitly reflect the urban functions and socioeconomic information [72]. After having reviewed the related literature, urban visual–spatial and psychological perception features are selected as independent variables. The socioeconomic factor is not discussed separately, and it can be found in Nicodemus A G, 2013, etc. [42].
As shown in Figure 3, we used the human–machine adversarial deep learning model proposed by Yao et al. [73] to obtain the urban visual–spatial and psychological perception factors. The detailed process is as follows.
(1)
Urban visual–spatial-factors—Physical environmental influences on vibrancy have long been observed. In terms of portraying the physical environment, eight visual–spatial indicators of greenness, openness, enclosure, imageability, walkability, blueness, traffic flow and natural are considered in a street [74]. To obtain the above indicators, FCN-8s is used to identify different ground objects in street view images [75]. We used ADE-20K as the annotated dataset, which includes 151 categories (trees, buildings, cars, etc.). The pixel proportions of different objects in the image can be obtained by inputting the street view images into the full convolution network. Then, we segmented all street view images into 151 feature types and kept 64 object categories for outdoor elements according to their occurrence in a general outdoor scene. On this basis, the Beijing urban feature dataset was formed based on the top 30 features in the outdoor elements. Finally, we introduced the street visual descriptor for urban visual–spatial quantitative representation [76].
For a typical street-level image I , let O b j e c t μ   μ = (1, 2, …, 30) represent the 30 object instances in the image, including buildings, trees, roads, etc. Accordingly, for ϕ O b j e c t μ , ϕ O b j e c t μ is the proportion of the viewshed area of O b j e c t μ in image I , which can be calculated as follows:
ϕ O b j e c t μ = C o u n t p i x e l N u m b e r O f O b j e c t μ C o u n t p i x e l N u m b e r O f I
Greenness includes urban parks, lawns, street and square trees, and other forms of vegetation, and has long been approved as a critical landscape design element in urban environments [77]. We measure street openness in terms of sky ratio [78]. Enclosure refers to the degree to which buildings, walls, and other structures enclose public spaces [79]. A good degree of enclosure will give a comfortable, shaded feeling. Having a visual focus easily creates a sense of enclosure. Imageability refers to the cognizable, recognizable, and distinctive qualities of space. Imaginative spatial aspects contain elements of differentiation that are easily recognizable to users, such as city landmarks, etc., which will make the space imaginative and distinctive [80]. Walkability includes residential density, intersection density, land use mix and presence of trees and vegetation. Good walkability can promote physical activities and enhance social contact, and improve physical and mental health [81]. Blueness in cities is made up of various bodies of water, such as lakes, oceans, rivers, et al. Studies have shown that exposure to street blue spaces reduces the probability of depression in older adults [82]. Traffic flow is mainly focused on the pedestrian flow and the vehicle flow. The street’s traffic flow can reflect the liveliness of the area around the street. Natural aspects include “land”, “terrain”, “vegetation”, “sky” and “water body”, which have been regarded as the five basic dimensions of a natural scene based on cognition and common sense [76]. Natural elements such as farmland and lakes have been shown to have an impact on urban commercial activeness.
Hence, the typical street visual descriptor can be represented by:
V s t r e e t = i = 1 k G i , i = 1 k O i , i = 1 k E i , i = 1 k I i , i = 1 k W i , i = 1 k B i , i = 1 k T i , i = 1 k N i    
where G i , O i , E i , I i , W i , B i , T i , and N i denote greenness, openness, enclosure, imageability, walkability, blueness, traffic flow, and natural, respectively, C o n , . . . G r e are calculated in detail in Table 2. k is the total number of sampling points.
(2)
Psychological perception factors—The second step is the human–machine adversarial scoring process, used to obtain street psychological perceptions. Firstly, to obtain a training sample for psychological perception, we invited 26 volunteers with local social backgrounds to manually rate a certain number of street view images; these volunteers included university students and teachers, aged between 20 and 45 years old, with a male to female ratio of 1:1. Volunteers with local social backgrounds were invited to manually score the 30,000 chosen street view images to obtain a training sample for psychological perception scoring. They scored the street images on a scale of 0 to 100 points on six perceptions: Wealthy, Safe, Lively, Beautiful, Boring and Depressing. Then, we used the random forest method to fit the relationship between the visual–spatial features and manual scoring. The scoring system automatically builds this fitted model when the user initially scores up to 50 images. The results were calculated by image segmentation, used as input. In the next scoring process, the system will give the recommended score, and at the same time will automatically adjust the recommended score according to the user’s scoring behavior. If the recommended scores for more than five images deviate severely from the user scores, by more than 10 points, the embedded random forest module will be retrained and self-correct the model parameters. Otherwise, if the OOB validation error of the fitted model is less than 10 points, the user scoring process stops and the human–machine adversarial scoring dataset is output. After the above process, the model is more stable and accurate. Finally, we obtained the Beijing perception dataset.
Compared with existing urban perception studies based on global datasets, provided by MIT Place Pulse, which are not fully representative of mainland China’s cities, the method offers unique advantages. First, this powerful technique can conduct local urban perception assessments in Chinese urban areas. Second, it is computationally more efficient than previous methods used to obtain urban perceptions. For more detailed information on the prediction method and the toolkit, see Yao et al. (2019) and Wang et al. (2019) [73,82].

3.2.3. Analytical Methods

The variance inflation factors (VIF) are calculated to detect the presence of multicollinearity among the variables. A larger VIF indicates more severe multicollinearity. It is generally accepted that when 0 < VIF < 10, there is no multicollinearity; when 10 ≤ VIF < 100, there is strong multicollinearity; and when VIF ≥ 100, there is severe multicollinearity. After detection, the VIF between most of the indicators in this study is less than 10, and only the individual VIF between indicators is greater than 10. To avoid the loss of valid indicators, a ridge regression model is employed to model the relationship between the independent and dependent variables.
The ridge regression model is a regularized linear regression model, which is specially designed to analyze co-linear data and minimize the effects of the predictor variable correlations [83,84]. Yue et al. [15] proposed a linear regression model to quantify the association between POI-related land use mixtures and urban vibrancy. In this study, the ridge regression model is employed to measure the relationship between potential influence factors and urban vibrancy. The presented urban visual–spatial and psychological perception indicators are regarded as independent variables, while the quantified urban vibrancy is the dependent variable. To analyze the expected impact of urban visual–spatial and psychological perception on urban vibrancy, three models are designed to consider different variable types. First, base model 1 is fitted, with only the urban visual–spatial indicators used as explanatory metrics, to determine the urban street environment’s effect on urban vibrancy. Second, model 2 only represents the spatial metrics of psychological perception to assess the impact of human perception on urban vibrancy. Third, model 3 consists of all variables. Finally, k-fold cross-validation is used to assess the performance of the fitted models.

4. Results

4.1. Characteristics of the Independent Variables

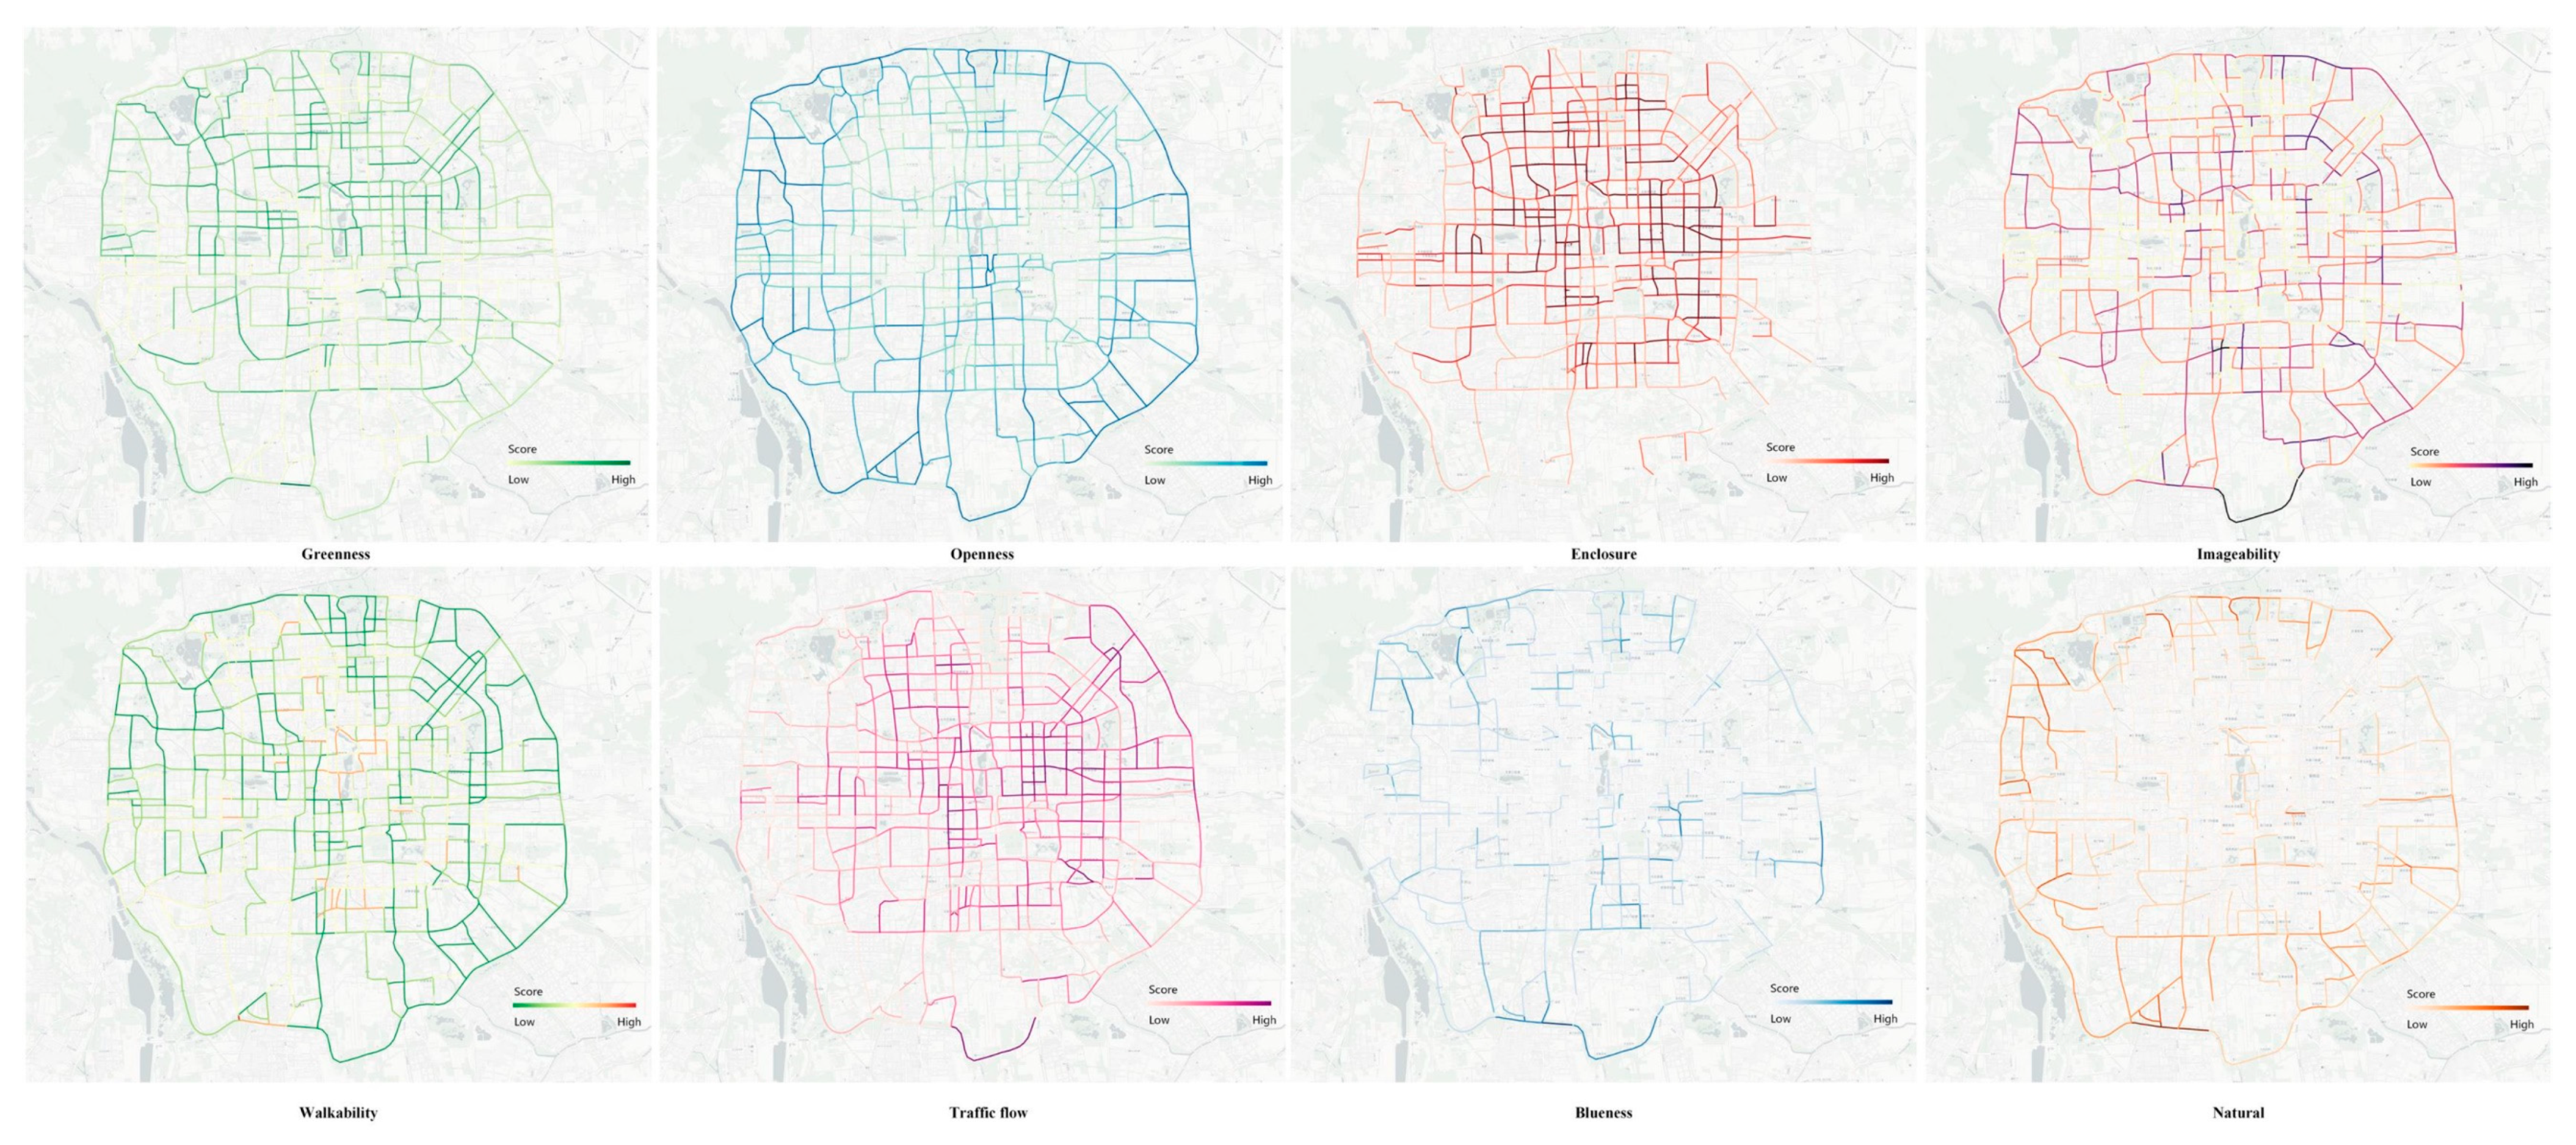
Table 3 shows the main characteristics of the independent variables. The spatial distributions of the eight visual–spatial indicators are displayed in Figure 4. The average greenness of street space in Beijing is 12.8%, with a street openness of 29.5%, street enclosure of 28.8% and street walkability of 17%, while the four values of imageability, traffic flow, blueness and naturalness are low. In terms of spatial distribution, streets with good greening conditions are usually located near the northern part of central Beijing, while the southwest side, due south side and southeast side of the greening situation need to be improved. Streets with higher openness values are usually located near the boundary of the Five Rings district. In contrast, streets containing higher values of enclosure and traffic flow are distributed in the inner district. The spatial distribution patterns of both are similar, especially the street distribution with higher traffic flow values. Both the north side of Chaoyang District and Haidian District have a good street enclosure, and the streets with high motorization are concentrated on the main roads of the city. Streets with high imageability are located around the Four Rings area, while high values of walkability are sparsely located in the central area. Regarding the blueness and natural indicators, streets with low values of both are sparsely distributed across the Fifth Ring district.
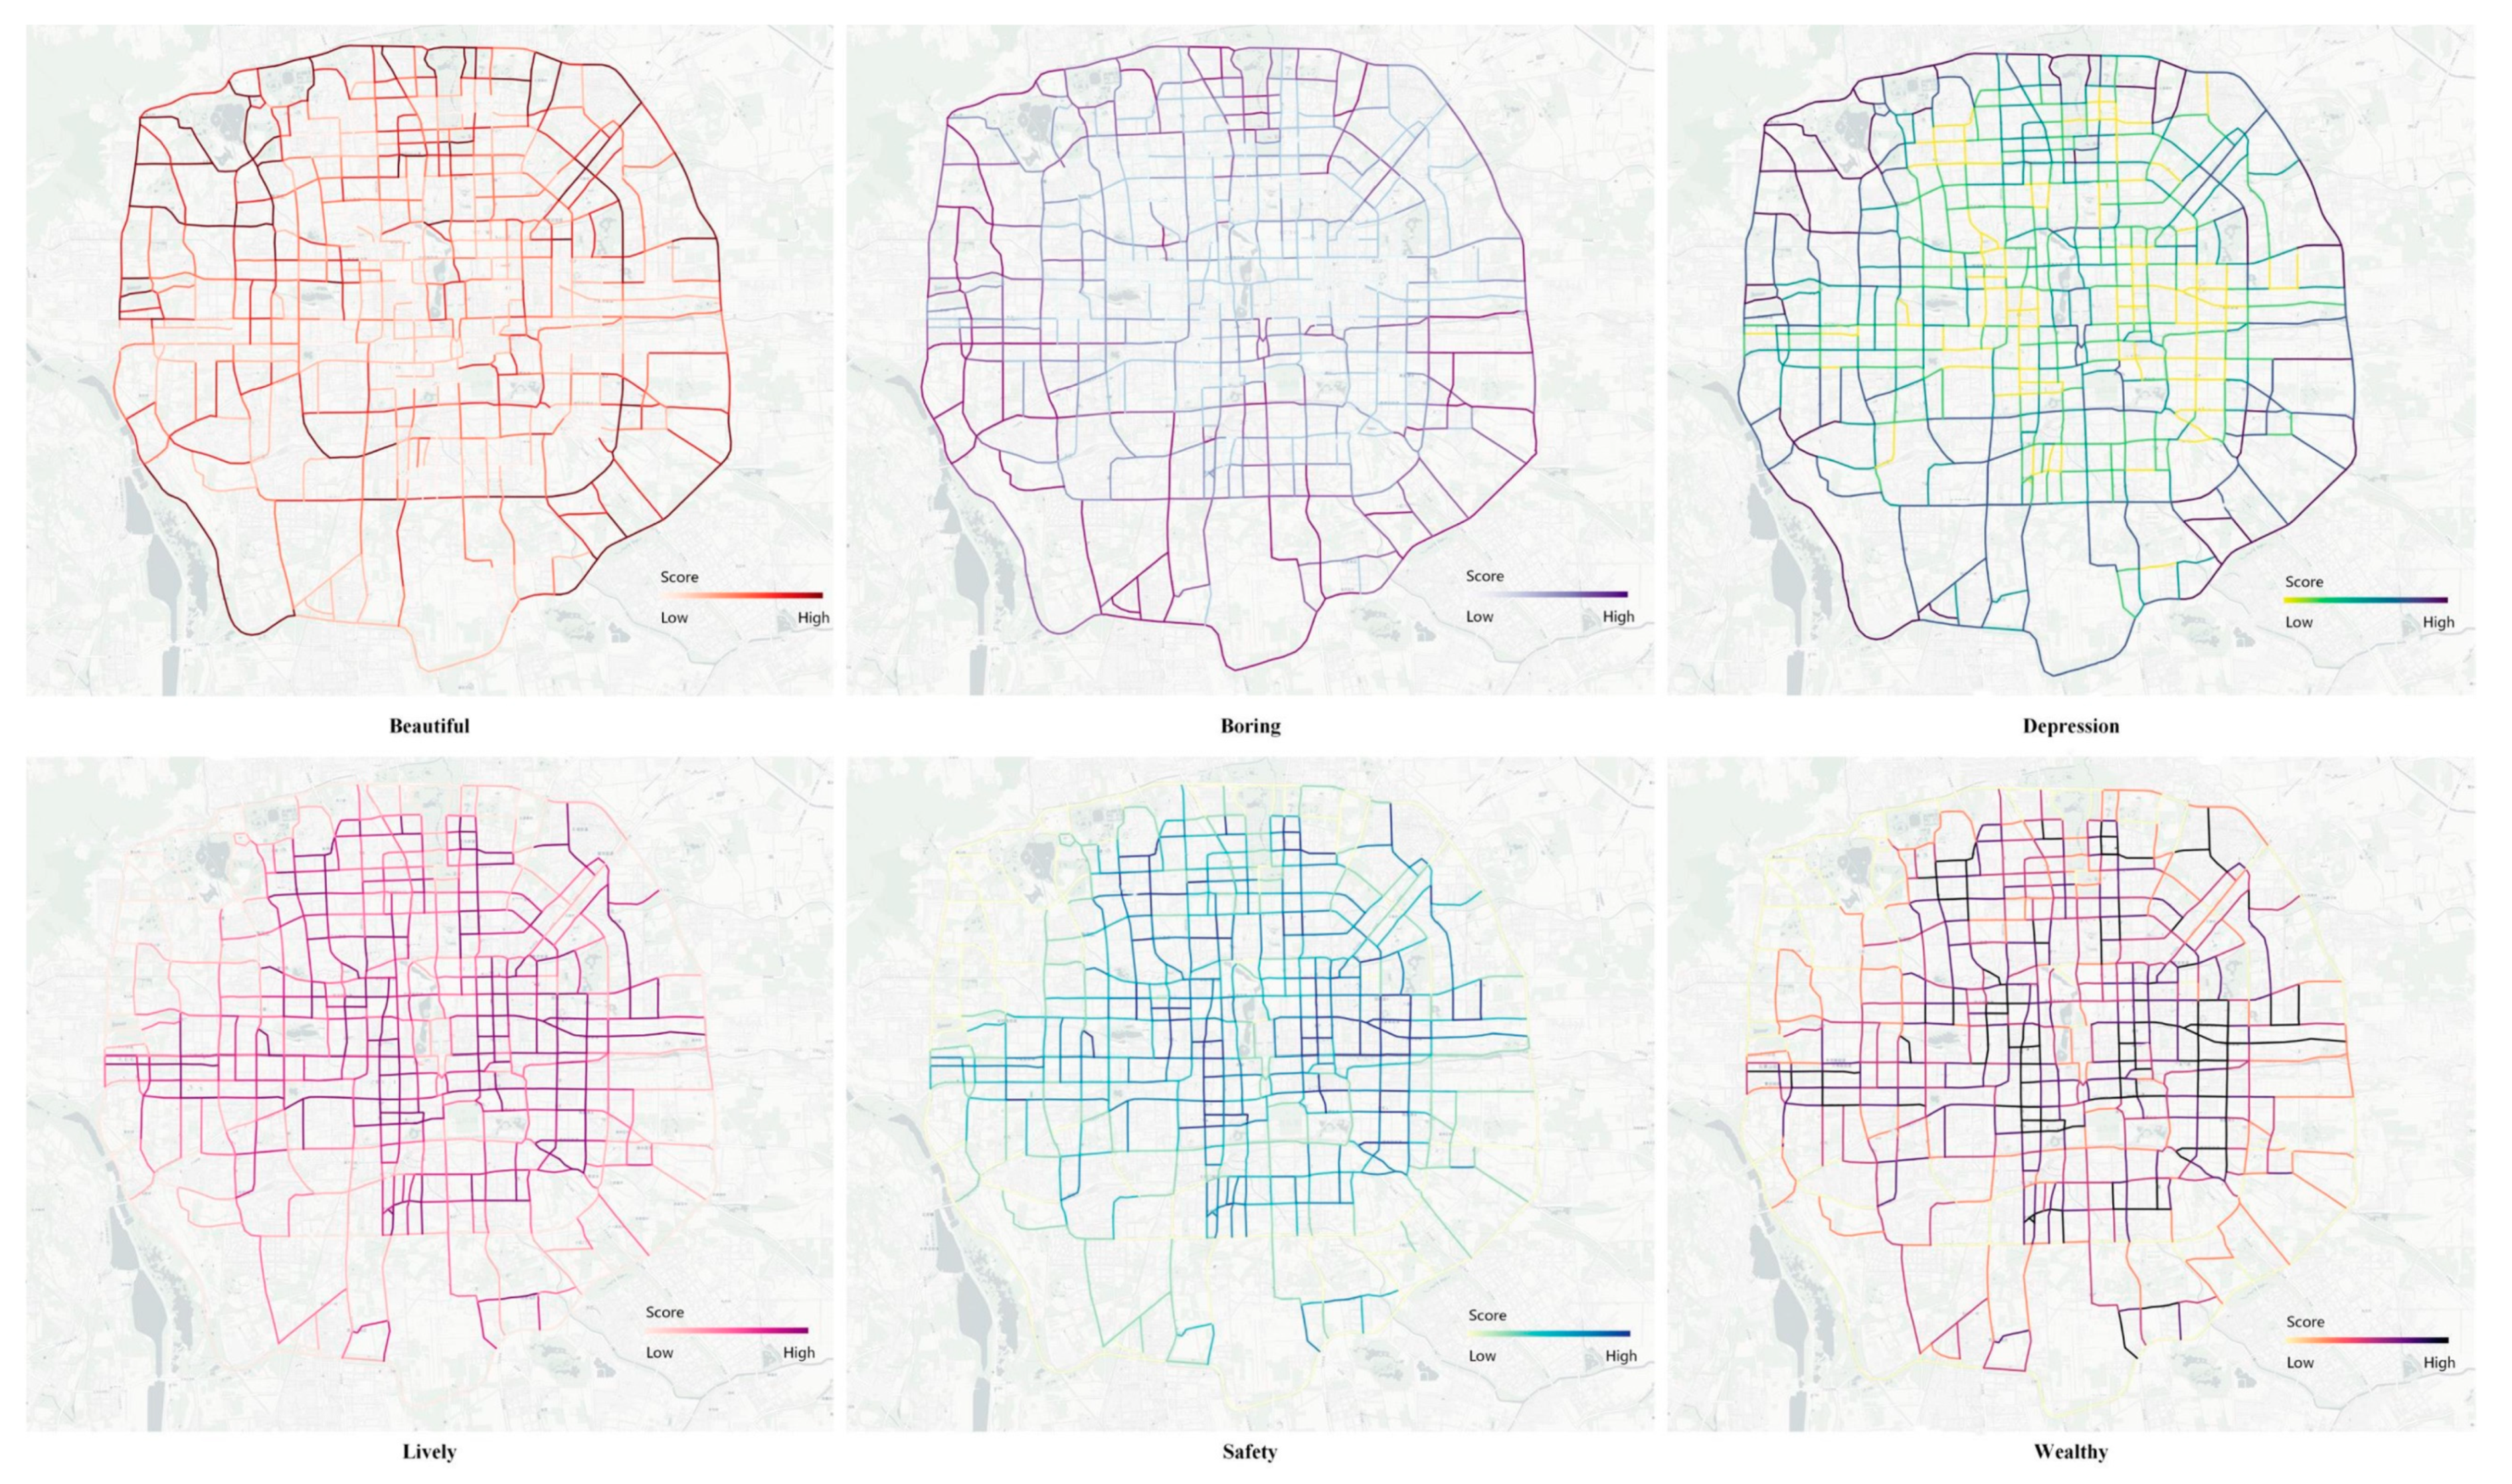
The spatial distributions of the six urban psychological perceptual indicators are displayed in Figure 5. For urban psychological perceptual indicators, the mean value of beautiful is 40.086. Streets with higher beautiful values are usually located near the Beijing district’s boundary. The mean boring value is 61.352. The streets with higher boring values are located north and south of Beijing. The mean depression value is 55.081. Streets containing higher values of depression are distributed in the inner district. The mean scores of lively and safe are 50.765 and 44.391, respectively. Lively and safe exhibit a consistent spatial distribution, and downtown areas are more lively and safer than the surrounding suburbs. The mean value of wealthy is 52.777, and high wealthy values are more evenly distributed.

4.2. Spatial Distribution of Urban Vibrancy

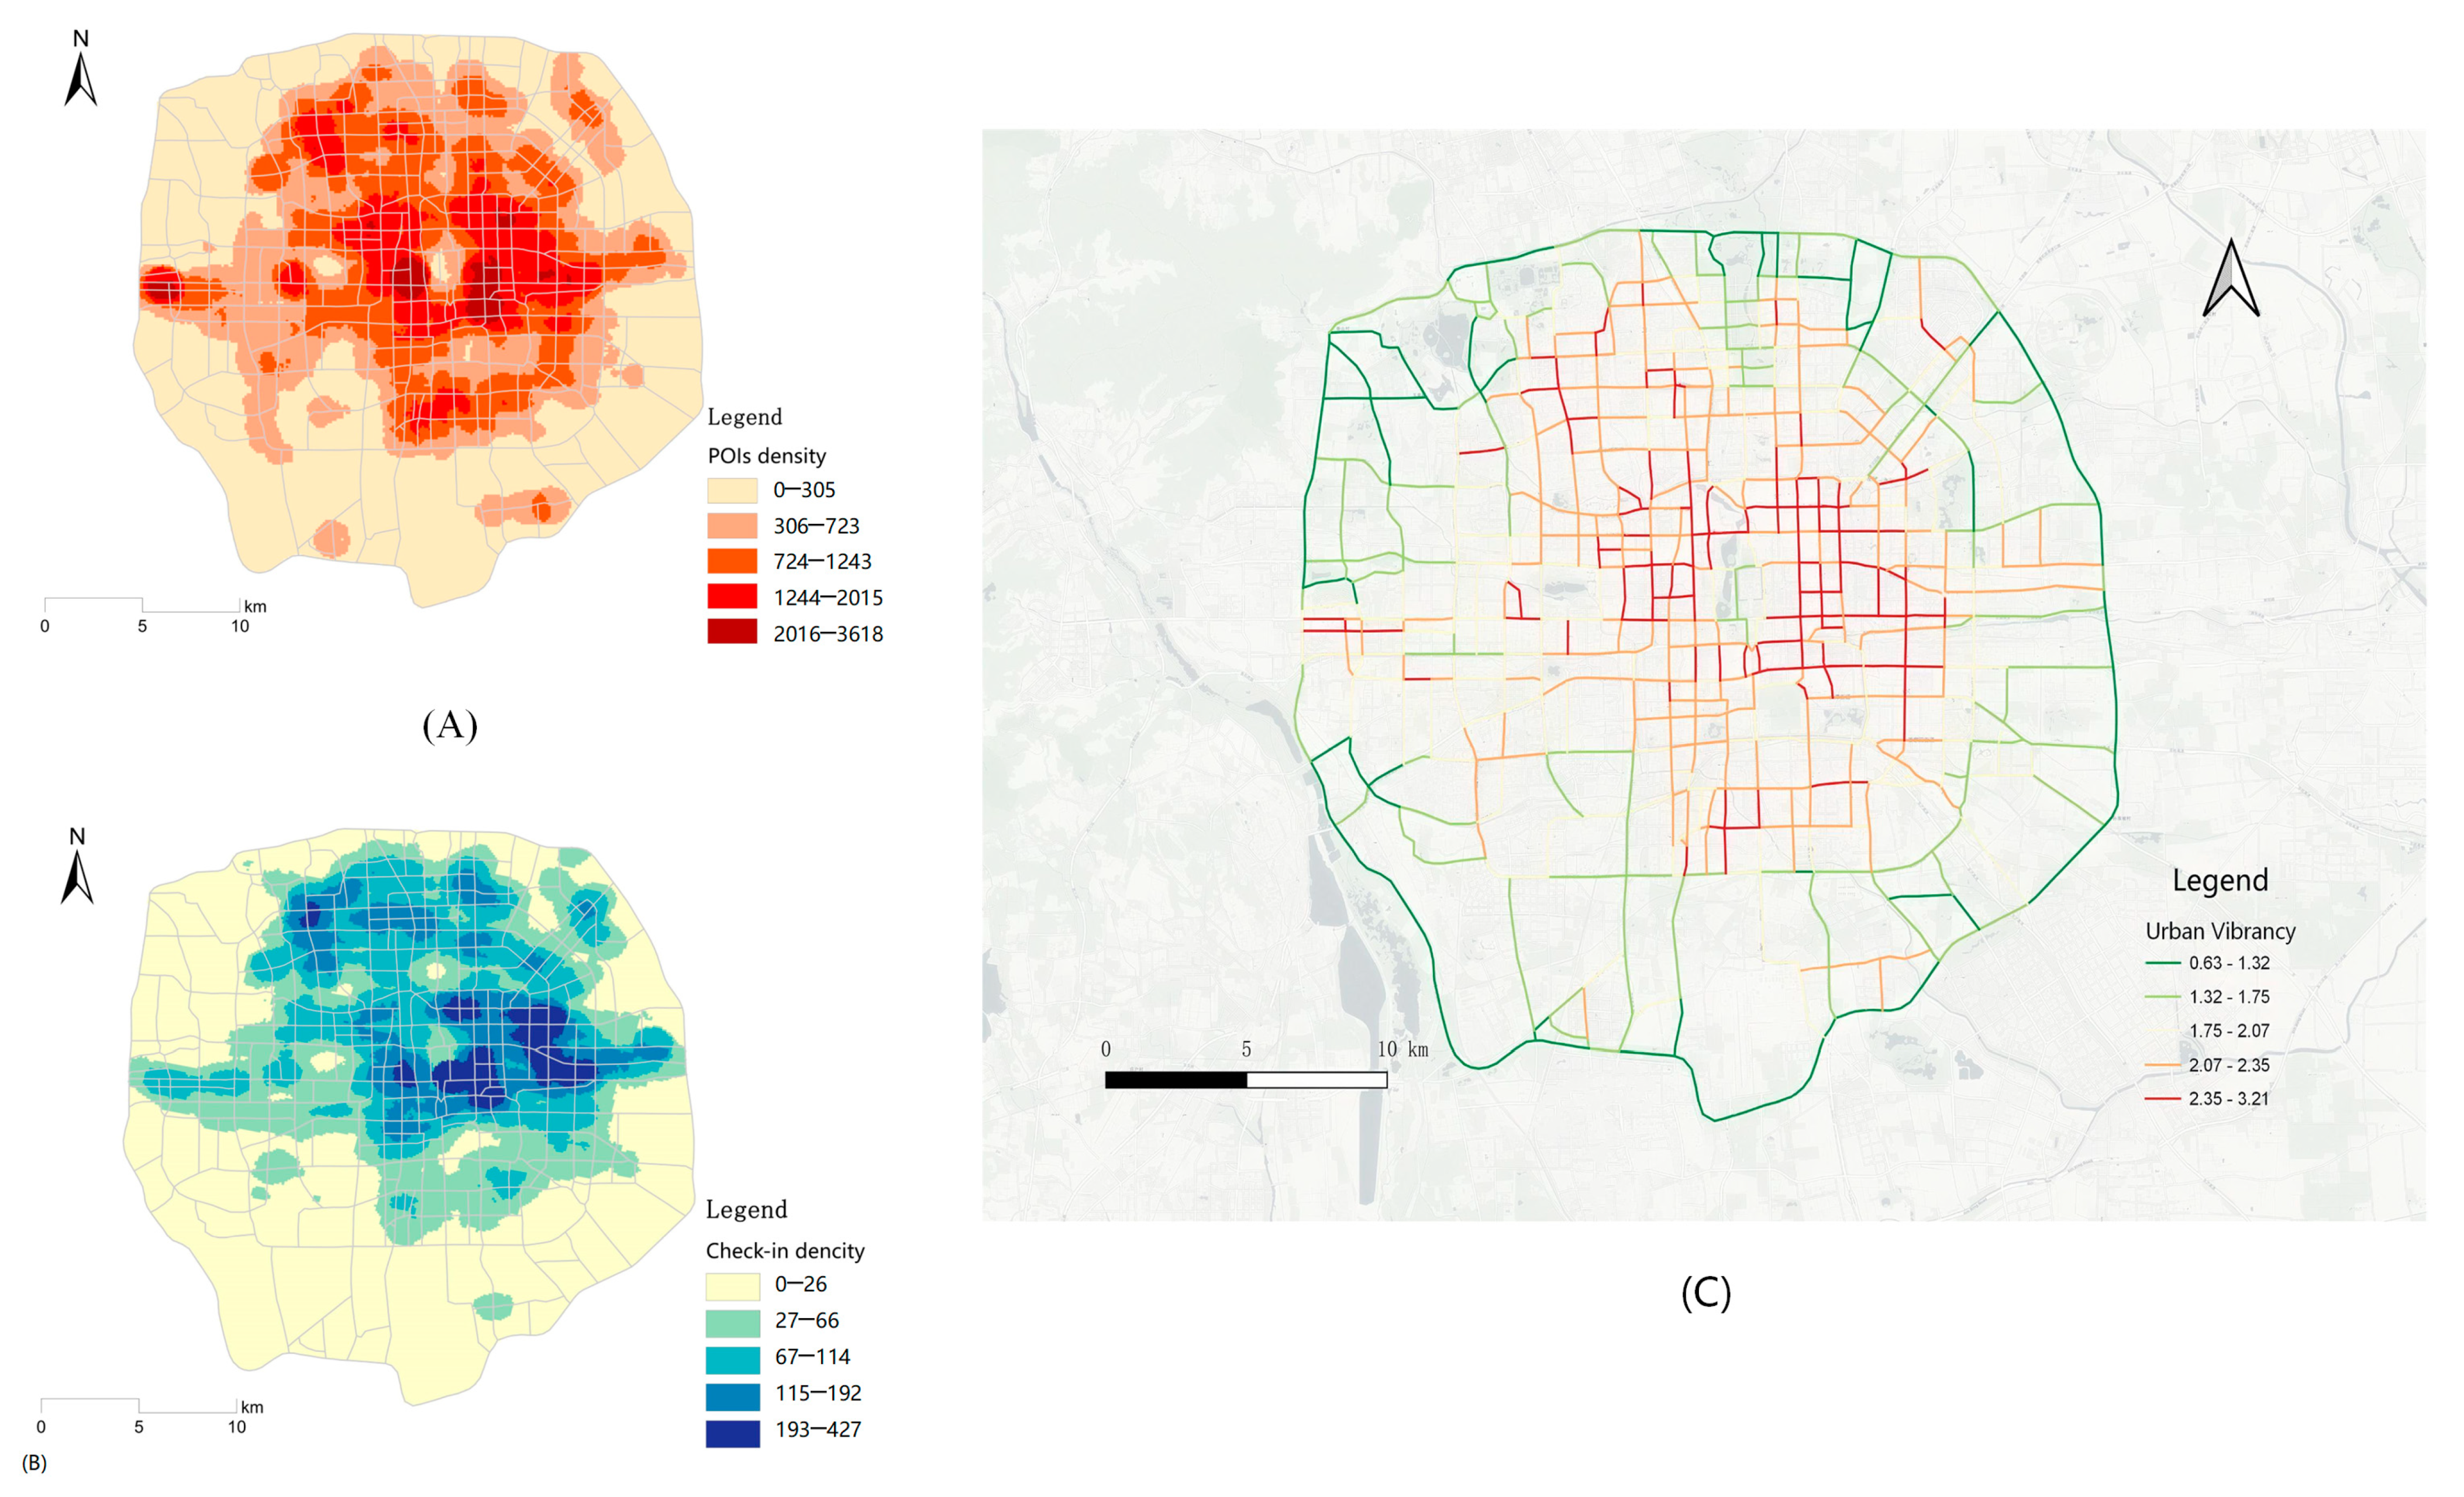
The spatial distribution of urban vibrancy in Beijing calculated by two types of urban sensing data is shown in Figure 6. For the neighborhood scale, we also used social check-in data and POIs as proxy indicators to quantify urban vibrancy, and used these indicators divided by the neighborhood area to obtain the vibrancy distribution, as shown in Figure 6A,B. For details, see reference [10]; the formulae are as follows:
      d p o i = i c h e c k i n _ n u m i A r e a
where d p o i denotes the quantified indicator of urban vibrancy in the neighborhood i ; i P O I s and i A r e a indicate the total POIs and geographical area of i .
d c i = i c h e c k i n _ n u m i A r e a
where d c i denotes the quantified indicator of urban vibrancy in the neighborhood i ; i c h e c k i n _ n u m and i A r e a indicate the total check-ins and geographical area of i .
In Figure 6A,B, the vibrancy indicators calculated using the POIs and social media check-in data show overall similarity. The deeper the color, the higher the vibrancy of the city, and vice versa. High-vibrancy areas are mainly located within the Second Ring Road and the northern belt of Beijing, while low-vibrancy areas are mainly located in the area between the fourth and Fifth Ring roads. However, some differences exist between Figure 6A and B. In Figure 6A, localized areas in the west and south are significantly more vibrant than in Figure 6B, whereas localized vibrancy in the northwest of Figure 6B is higher than in Figure 6A. To reduce biases in portraying urban vibrancy using a single data source, the comprehensive urban vibrancy index is quantified using Equation (7). POIs data and social media check-in data were weighted as 0.98 and 0.02, respectively. The distribution of comprehensive vibrancy at the street level was obtained by spatially connecting the comprehensive vibrancy index to the corresponding streets, as shown in Figure 6C. It can be seen that the spatial distribution of comprehensive vibrancy is similar to the spatial distribution of vibrancy obtained from the two types of urban sensing data. Street vibrancy values are higher in areas within the Second Ring Road, and gradually decrease in areas extending from the center of the Fifth Ring Road to the periphery. Interestingly, we find that short streets tend to be more vibrant in dense street networks (e.g., Nanluoguxiang, Xidan, and others). This result may align with those of Jacobs [19] and Zhang et al. [19,56]. Hence, optimizing short urban street space and increasing its vibrancy can help enhance the vibrancy of other areas of the city.
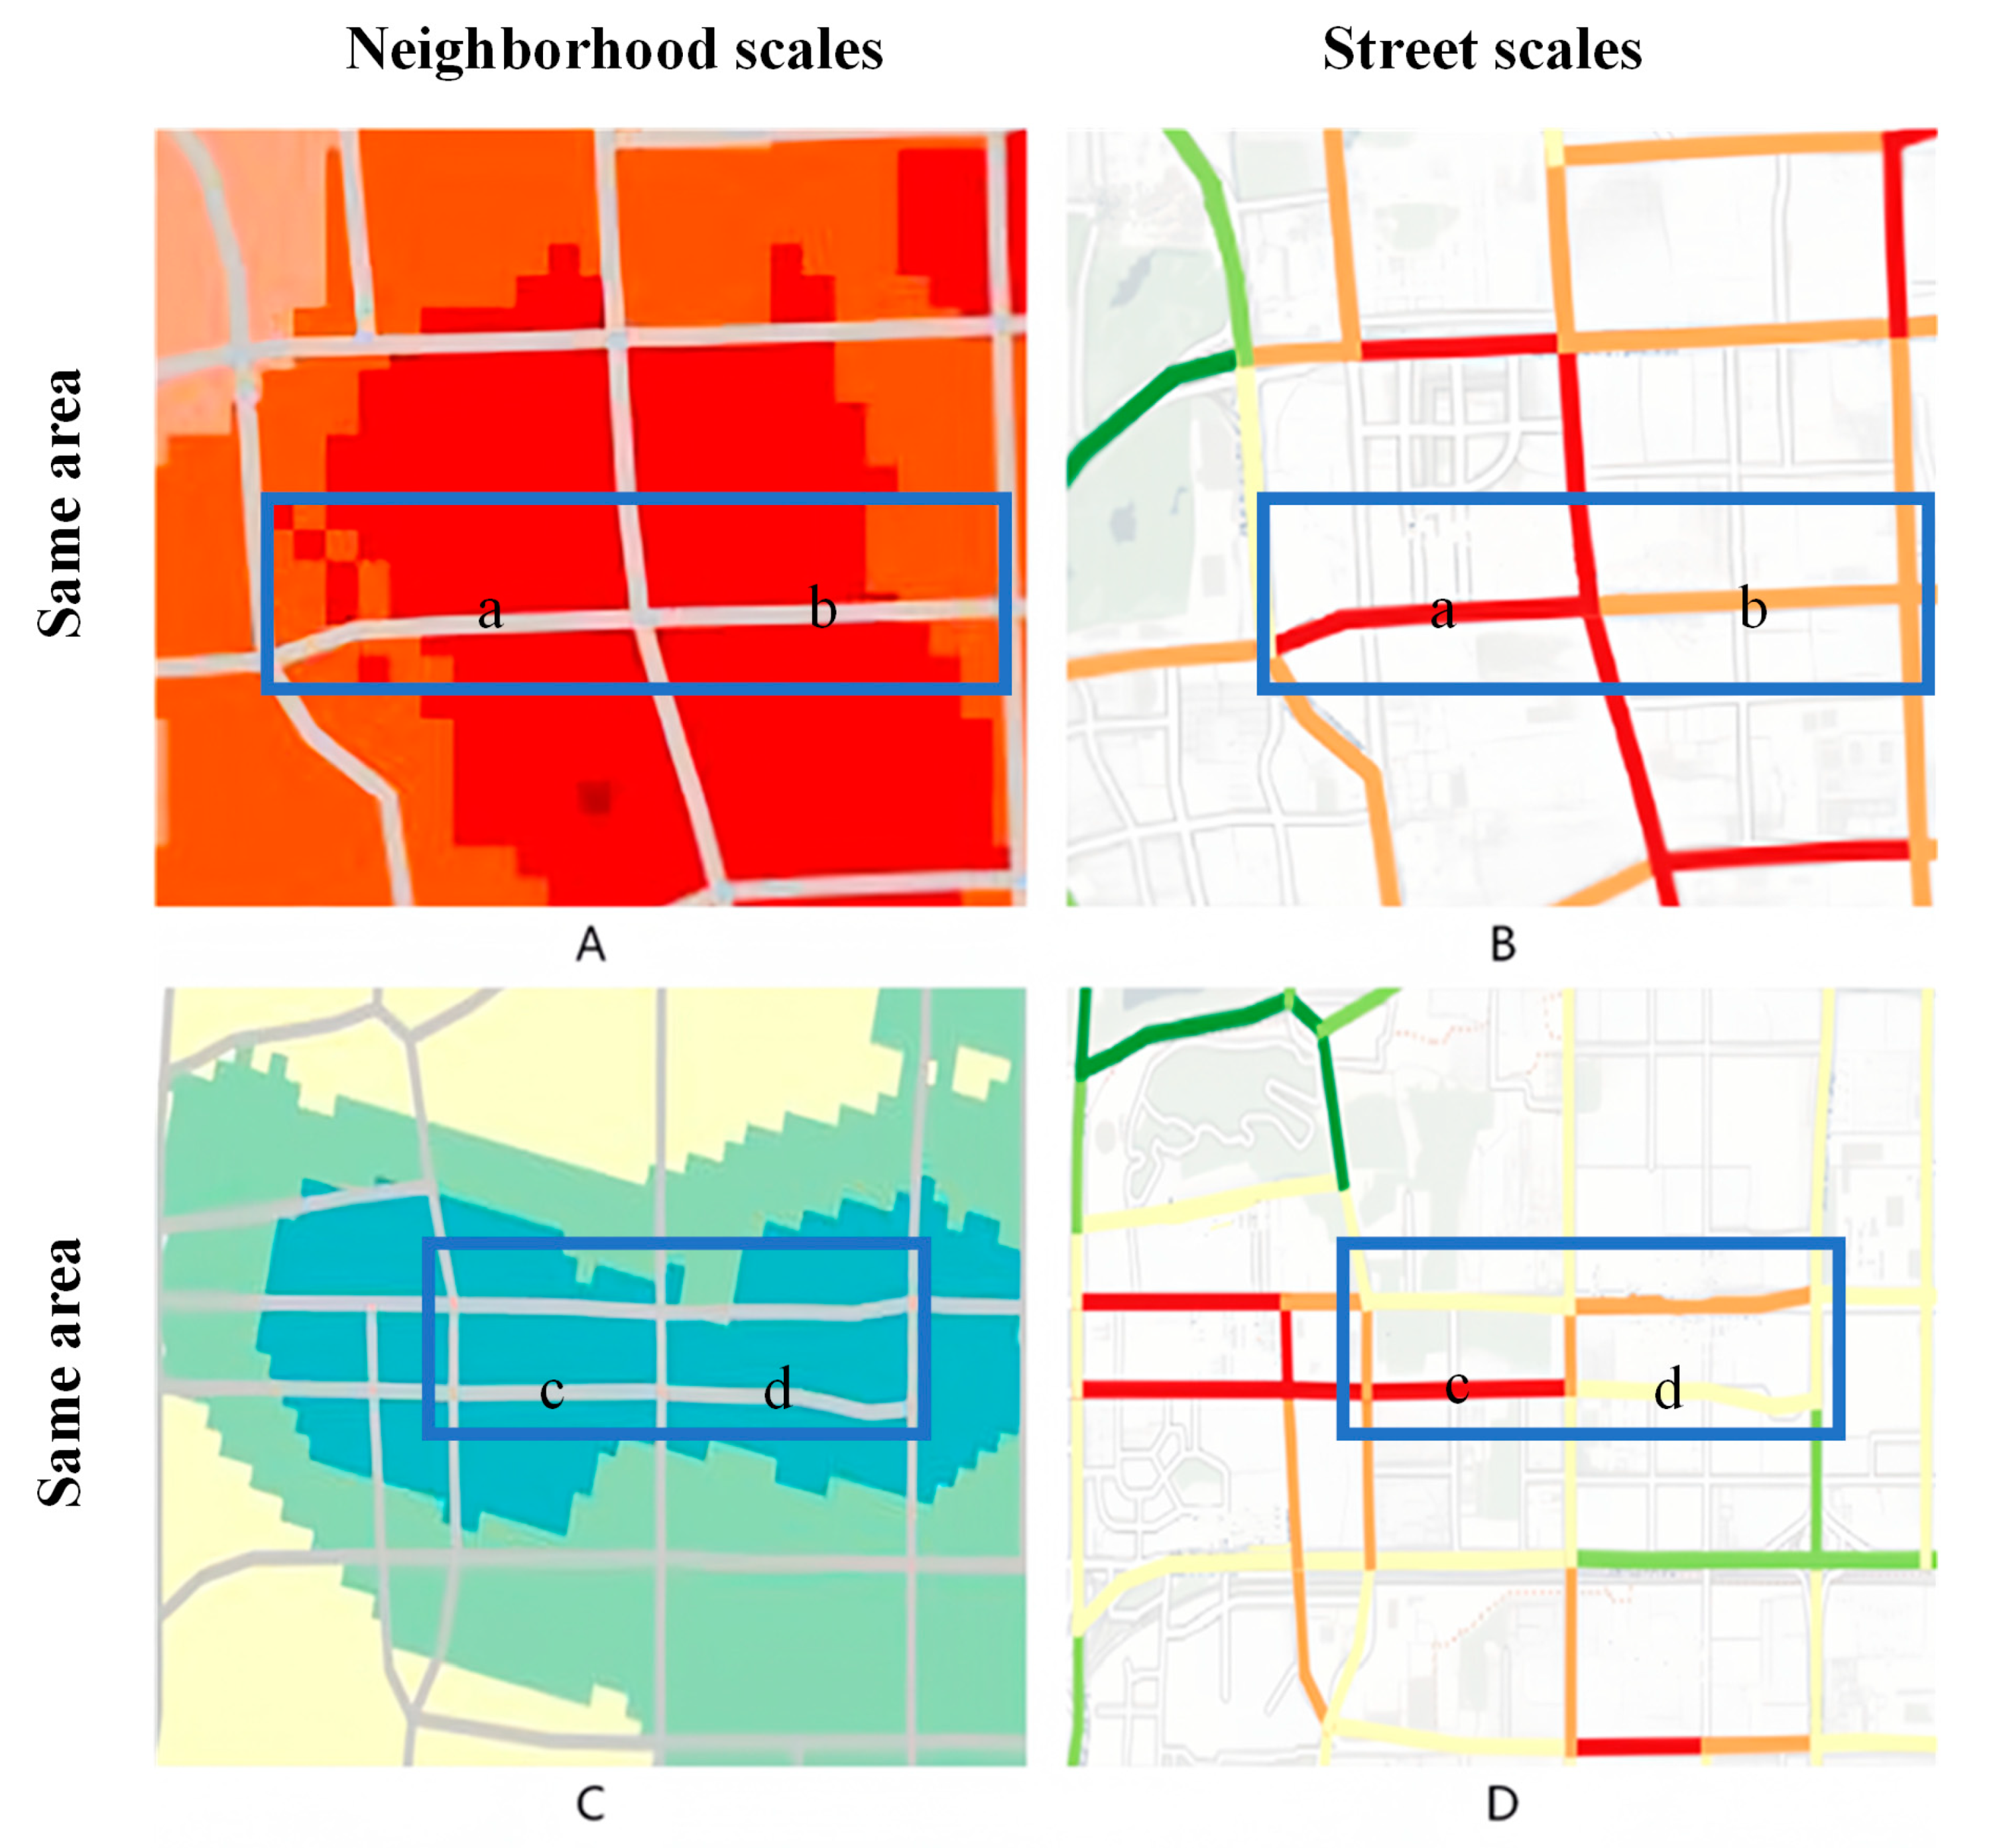
Notably, street vibrancy can vary significantly, even among adjacent neighborhoods. This is difficult to intuitively derive from previous neighborhood-based quantifications of vibrancy. In Section 5.2, we further analyze the details and differences between neighborhood-based and street-based vibrancy measurements to highlight the contributions of this study.

4.3. Analysis of the Linkage between the Influence Factors and Urban Vibrancy

We captured visual–spatial features and urban psychological perceptual features from the streetscape to analyze how these characteristics affect urban vibrancy. Specifically, 14 metrics (independent variables) and VIF values were calculated. After calculation, it was clear that the variables greenness, openness, enclosure, depression, lively, safety, and wealthy had a multicollinearity problem. The VIF values were all >10 (30.98, 52.48, 32.37, 90.12, 55.72, 31.65 and 60.87 for greenness, openness, enclosure, depression, lively, safety and wealthy, respectively). Thus, we used the improved ridge regression model to minimize the effect of the correlation of predictor variables.
We developed three models, the results of which are presented in Table 4. The performances of the three models were evaluated using two indices: R2 and k-fold value. Particularly, models 1, 2, and 3 have R2 values of 0.706, 0.743, and 0.807, respectively. In addition, the k-fold values are 0.660, 0.700, and 0.75 for models 1–3, respectively. The R2 and k-fold estimates increase from model 1 to model 3, and the fairly high values guarantee the performance of the regression model. From model 1 to model 2, the accuracy improved by 3.7 percentage points. The comparison result also reveals that urban psychological perceptual features have a more significant effect on urban vibrancy than visual–spatial features. From model 1 to model 3, the accuracy improved by about 10 percentage points. The results indicate that combining visual–spatial features and urban psychological perceptual features with regression approaches improves the R2 significantly, and enhances model performance. Most importantly, the model that included all variables achieved the best performance. It is suggested that neither physical environmental nor non-physical environmental factors alone are sufficient to fully explain the factors influencing urban vibrancy, which confirms the conjecture proposed in this study. As can be seen in 
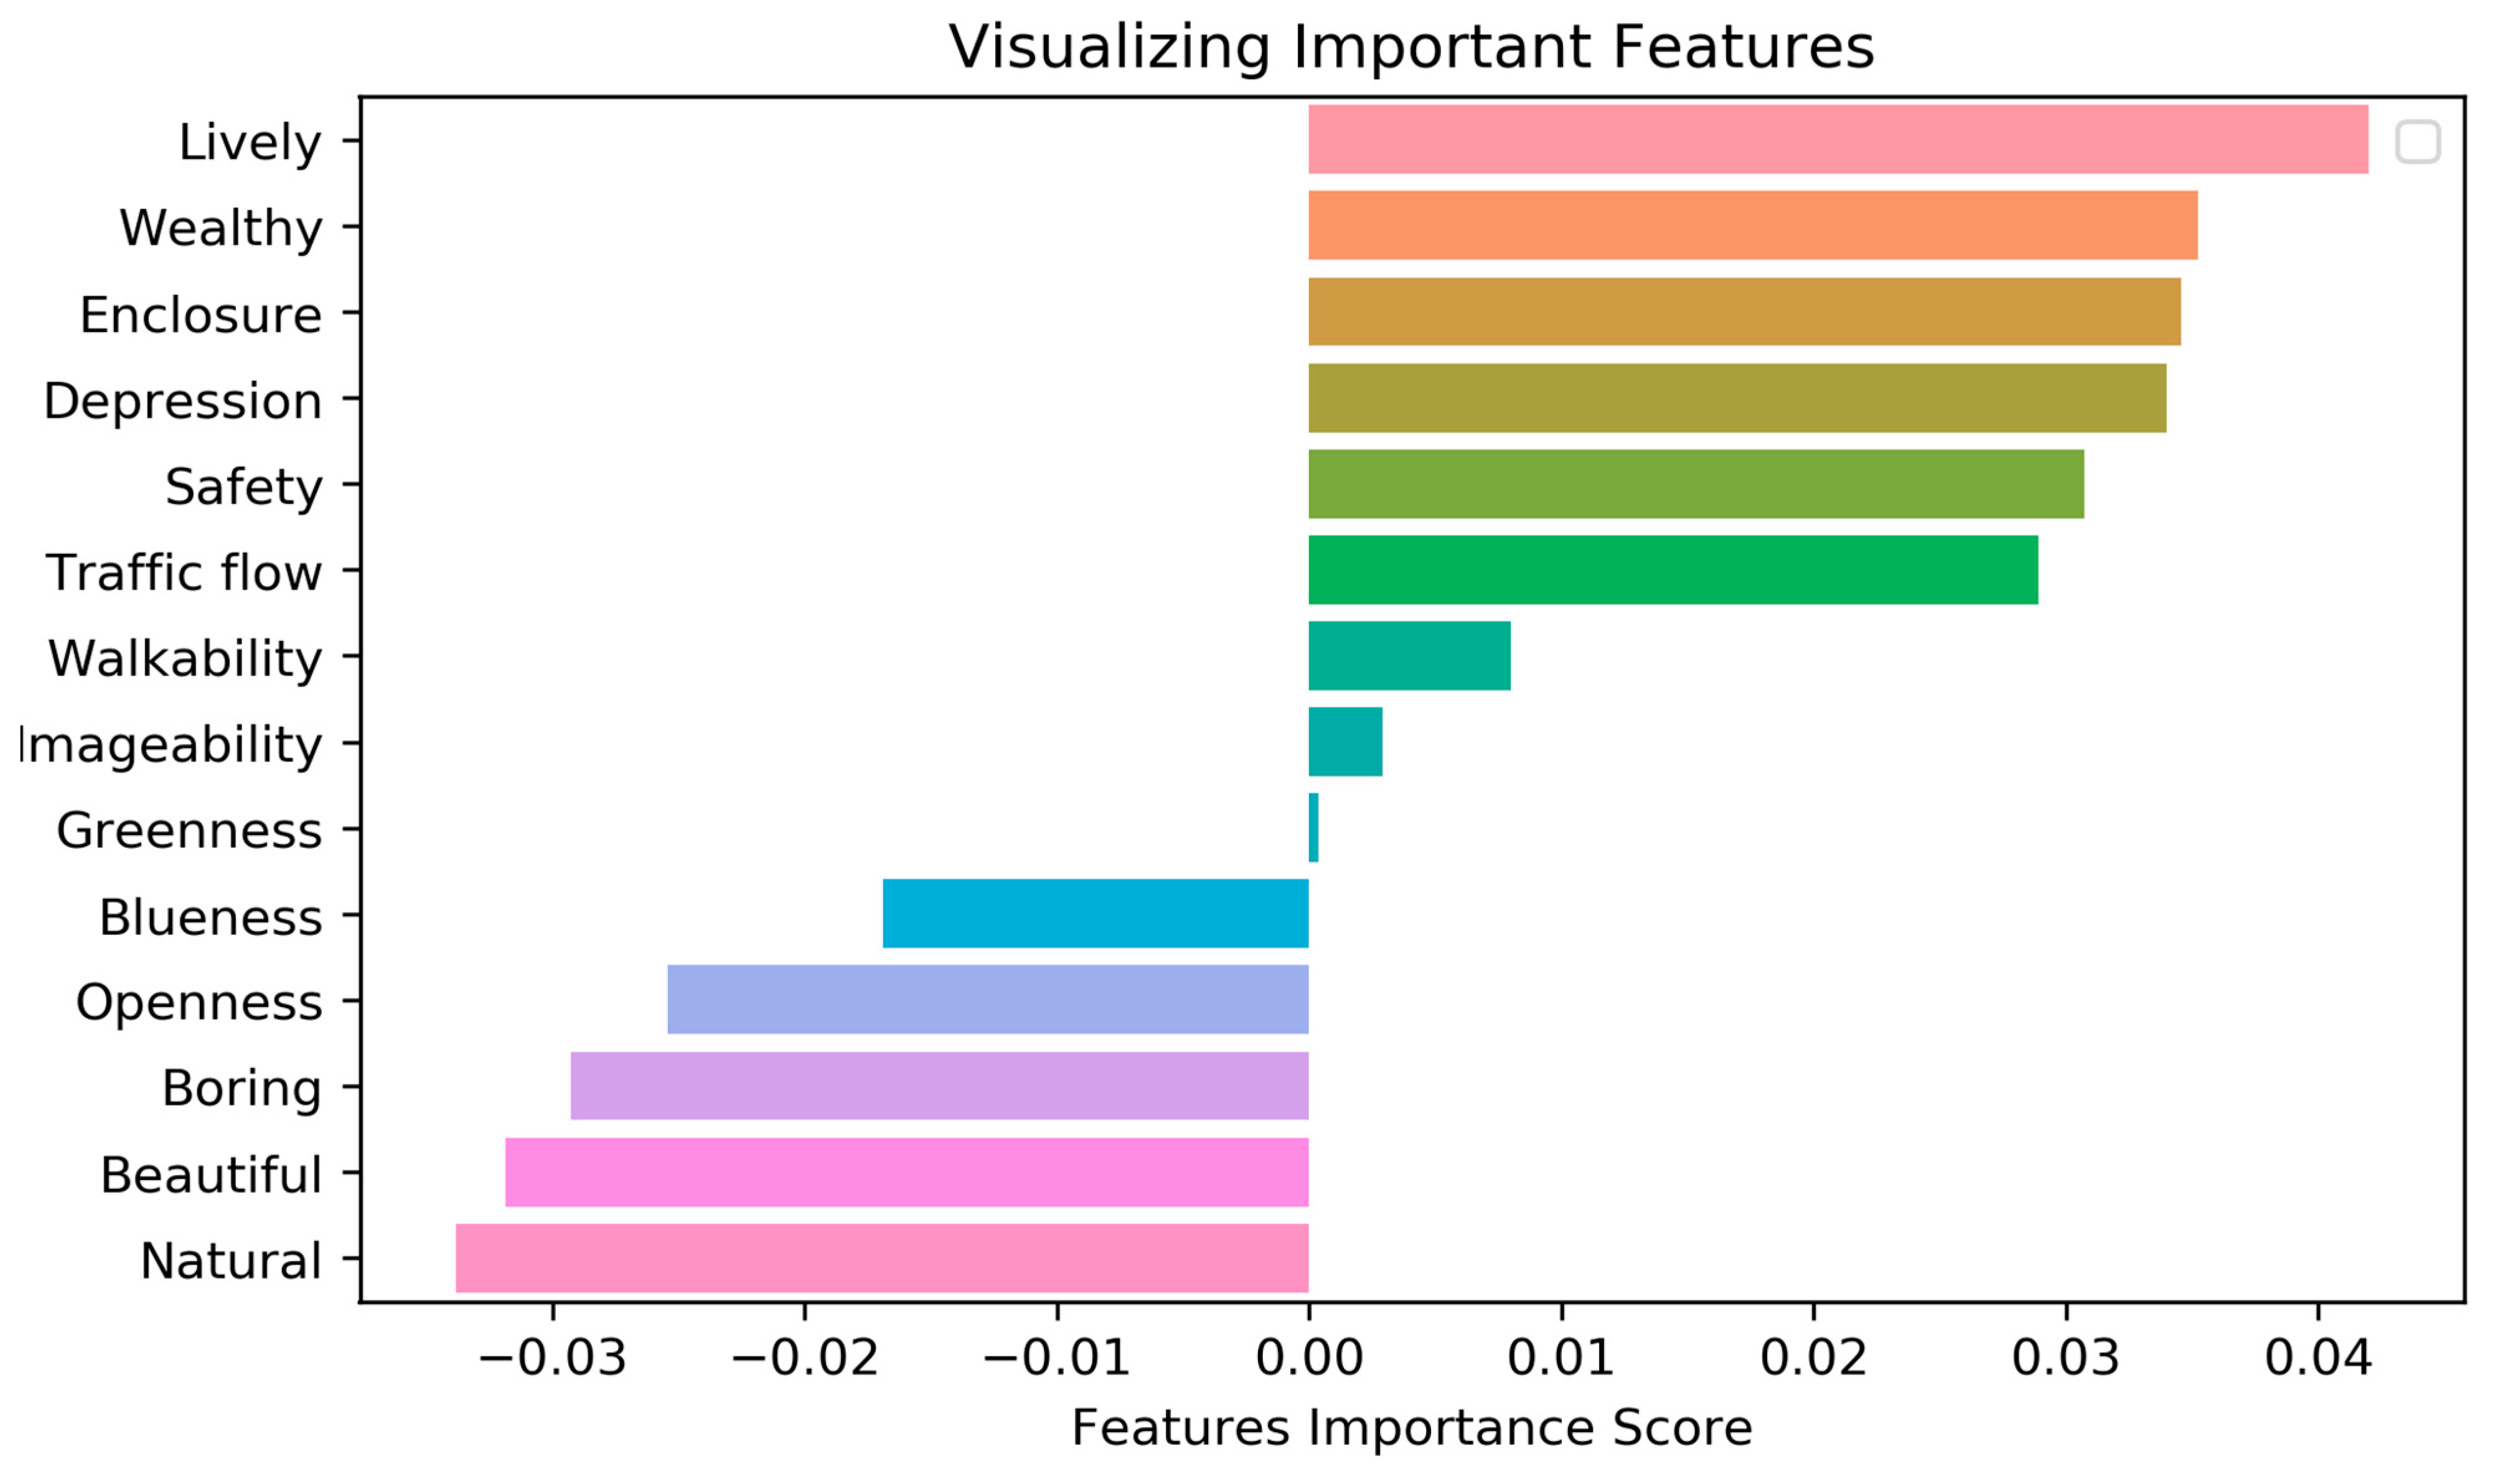
Table 5, urban vibrancy also affects visual–spatial factors and psychological characteristics to varying degrees. The regression coefficients indirectly indicate which variables contribute more to the model’s goodness of fit, and they signify the importance of the variables. The ranks of the impacts of the 14 variables on urban vibrancy are shown in Figure 7.
Visual–spatial indicators, enclosures, traffic flow, walkability, and imageability show positive effects on urban vibrancy. Specifically, the objects that show a stronger positive impact on urban vibrancy are enclosure and traffic flow. Intuitively, the urban vibrancy should be high near these objects, since there are many buildings, houses, and crowds gathering easily that are more willing to stop and be active there. In addition, the higher the vibrancy of the city, the higher the traffic flow, corresponding to more people in cars. Street walkability and urban imageability are the objects that show a medium positive impact on urban vibrancy. This suggests that good walkability, and differentiated and identifiable streets contribute to a vibrant urban space. Openness, blueness and nature show negative effects on urban vibrancy. Specifically, nature shows a strong negative impact on urban vibrancy and greenness has little impact on urban vibrancy. It indicates that more elements such as mountains, fields and open spaces reduce the urban vibrancy. On the other hand, excessively open city streets and numerous lakes and rivers are detrimental to the urban vibrancy.
Regarding urban psychological perceptual indicators, it was noted that the impacts of the lively, beautiful and wealthy components of the perception features ranked high among all eight perceptual variables. It can be deduced that the three aforementioned variables tend to contribute to urban vibrancy. More active places (e.g., a street with more shopping centers, available snacks, and entertainment facilities, among others) are more popular and have the most significant impact on urban vibrancy. Wealthy is positively correlated with urban vibrancy. This could mean that in more upscale places, consumer desires and spending power are also higher, indicating that urban vibrancy coincides with a faster pace of life.
In addition, depression, lively, wealthy, and safe show positive effects on urban vibrancy; however, both boring and beautiful show negative effects on urban vibrancy. The perception of safe in the street also has a strong influence on urban vibrancy. It suggests that the safer a place is perceived to be, the less likely it is that crime and accidents will occur, and the more likely it is that interactions between people and physical entities in that place will emerge. The results are consistent with those of previous research [20]. In other words, boring, dull streets do not effectively promote urban vitality; streets that feel vibrant and have a higher safety value tend to attract more people.

5. Discussion

5.1. Evaluation of the Factors Driving Association with Urban Psychological Perceptions

Interestingly, streets with high aesthetic value do not contribute to the urban vibrancy, while streets that make people feel depressed attract more people, which is inconsistent with our usual view. To explore the driving factors of urban psychological perception, the multiple regression model is employed to portray the relationship between urban psychological perception and visual–spatial features. Previous research has demonstrated a strong association between the street physical environment and human mental health (e.g., human well-being and depression) [74]. Inspired by related studies, as shown in Table 6, we calculated regression coefficients for visual–spatial indicators and urban psychological perception indicators, focusing on the inner causes of the effects of lively, beautiful, boring and depression on urban vibrancy.
It can be found that the degree of enclosure and traffic flow influence positive perceptions (lively, safety and wealthy), and lively, safety and wealthy were proven to help enhance vibrancy in the previous subsection. This further validates that good enclosure and traffic flow can effectively contribute to urban vibrancy. On the other hand, we found that openness has a positive impact on the perception of beauty, showing that open views significantly improve the city’s identity. Urban greenness creates a sense of pleasure and beauty and has a positive impact on people’s perceptions and psychology. However, the interesting thing is that the effect of openness on urban vibrancy is negative, as shown in Figure 7. Thus, it is not difficult to conclude that the negative impact of beauty on urban vibrancy is caused by too much openness. Blue space has a negative impact on the perception of beauty and urban vibrancy. It shows that too much water in the landscape is conducive neither to enhancing the beauty, nor to creating urban vibrancy in the process of urban planning and development.
The regression coefficients of both greenness and openness on depression were negative, indicating that urban greenness and open horizons have a significant effect on eliminating depression. It was further shown that the underlying reason for the higher depression and higher vibrancy values was the low openness. This is the same result as that which a higher beauty sense and lower vibrancy value lead to. The regression coefficient of traffic flow on the value of lively is positive; this means that city residents will feel the vibrancy of the area as they experience the density of vehicles and people. At the same time, this vibrancy can improve the overall urban vibrancy. Enclosures and traffic flow improve residents’ sense of security, and greenness can reduce residents’ sense of safety, suggesting that wooded areas may enhance the perception of danger and thus reduce urban vibrancy.
Enclosure enhances the perception of wealthy. More enclosed areas are mostly surrounded by buildings, corresponding to central areas. Traffic flow also has a positive impact on the wealthy, and areas with higher traffic and pedestrian flow also contribute to wealthy, thus creating a vibrant urban street environment. Greenness reduces the perception of affluence, indicating that affluence is lower in areas with abundant trees. This point also shows the difference between Chinese cities and foreign cities.

5.2. Effects of Influence Factors on Urban Vibrancy at the Street-Level

A street is a complex that not only provides transportation functions for the city, but also integrates people’s daily spatial functions such as transportation, housing, socializing, shopping and leisure. Neighborhood environments are relatively self-contained and are the basic units of urban planning and urban areas, usually generated by the division of roadways or waterways, railroads, and other elements [85]. Some scholars have provided alternatives for the generation of urban neighborhoods by considering the functional attributes of neighborhoods [67]. However, these approaches typically produce irregular and complex urban neighborhoods, which may limit their realistic impact on vibrancy inquiry and urban planning. Unlike previous research scales, our study exhibits that urban vibrancy portrayal based on the street scale has a greater potential to demonstrate fine-grained vibrancy distribution compared to the neighborhood scale. As shown in Figure 8A, both street a and street b are located in high-vibrancy neighborhoods, and the distribution of vibrancy is almost identical, with no subtle differences visible. In Figure 8B, it is intuitively clear that there is a significant difference in adjacent street vibrancy even in adjacent neighborhoods. For example, street a is significantly more vibrant than street b. Again, the same pattern is demonstrated in Figure 8C,D. Interestingly, it is easy to see in Figure 8D that even four streets in the same neighborhood may show large differences in vibrancy. In contrast, in Figure 8C, all four streets are located in a high-vibrancy neighborhood, and the difference in vibrancy is indistinguishable.
On the other hand, this research highlights that it is necessary to focus on the factors influencing urban vibrancy at the street level, from eye-level perspectives. Visual–spatial indicators and psychological perceptual characteristics obtained from streetscape images using micro-scale image data of streets have a significant impact on the level of urban vibrancy. Although it is difficult to fully explain the exact meaning of these perceptual features, they do suggest that high-dimensional environmental and perceptual characteristics can capture some aspects of the causes associated with urban vitality, and the findings support the paper’s view. In addition, street view images can effectively portray the overall appearance of the street environment. Detailed visual–emotional information about the street space landscape also plays an important role in assessing urban vitality at the street scale.

6. Conclusions

In this paper, we proposed a novel framework that systematically combines the impacts of visual–spatial features and urban psychological perceptions on urban vibrancy at the street scale. Based on the above analyses, the main finding that there is a positive linkage between influencing factors and urban vibrancy satisfies the aim of this study. Accordingly, this study makes several contributions to the literature.
This research integrates visual–spatial features and urban psychological perceptions to quantitatively investigate the influence of objective and subjective factors on urban vibrancy. We obtain satisfactory regression model performances, with R2 values of 0.706, 0.743 and 0.807. Compared to experiments, personal human perceptions have a more significant impact on urban vibrancy than visual–spatial features. This finding inspires us to recognize that urban psychological perceptions are essential for encouraging social activities and interactions in a street. A livelier and safer place will provide activity opportunities for urban residents. It provides a new research perspective that complements and refines previous quantitative urban vibrancy studies.
This study quantifies urban vibrancy in terms of both location and human activity. Utilizing POIs, reflected activity locations, and social media check-in data revealed activity patterns. Relying on a single source of data to characterize urban vibrancy may cause misunderstandings among urban researchers and urban planners; therefore, we calculated a comprehensive urban vibrancy index. In particular, the proposed methods describe the activity pattern of individuals and activity location spatial distinctions.
This research provides essential insights into constructing a vibrancy public space environment that meets the psychological and physical needs of the inhabitants, and enhances one’s perception of outdoor spaces. Further, this study provides a reference for city planners to build a people-centered, livable city. Lastly, this research enriches the systematic knowledge of urban managers and researchers regarding emotional characteristics and urban vibrancy, subsequently providing a basis for planning, managing, and designing responses, and for improving urban practices and management strategies.
On the above basis, several problems regarding the establishment of a general methodology for measuring urban vibrancy persist. Firstly, socioeconomic features are positively correlated with urban vibrancy. To some extent, although street view data can reflect the socioeconomic characteristics behind the spatiotemporal behavioral patterns of people, quantifying this remains a challenge. Second, we did not consider the impact of time lags in data collection. Within different time periods, the visuo-spatial features portrayed via street view data may be inconsistent, resulting in different psychological perceptions. In addition, as time changes, the locations of activities reflected by POIs change, and the human activity patterns portrayed by Weibo check-ins will also be different. We will further explore the characteristics of the spatial and temporal distribution of vibrancy and the spatial and temporal relationships between the factors in our future research work. Third, the analysis of the linkage between perception features and urban vibrancy merely focused on a single study area, namely, within the Fifth Ring Road district in Beijing. Urban psychological perception is a relatively subjective characteristic, as different cities may appear to have distinct perception features due to their diverse cultural and social backgrounds. Accordingly, it may be possible that urban sensing in other cities may have different effects on urban vibrancy than the ones we identified in Beijing. Based on this, we can conclude that the proposed framework can be applied to other cities; however, different findings regarding how perception features specifically affect urban vitality may be acquired. In future studies, we will further explore this issue within a larger research scope, such as China.

Author Contributions

The research was mainly conceived and designed by Rujuan Lu and Deping Chu. Rujuan Lu performed the experiments and wrote the manuscript. Deping Chu reviewed the manuscript and provided comments. Liang Wu’s contribution was in supervision. All authors have read and agreed to the published version of the manuscript.

Funding

This study was supported by the National Key R&D program of China (No.2017YFB0503601) and the National Natural Science Foundation of China (grant number 4187010911).

Data Availability Statement

Data will be provided through request.

Acknowledgments

Thank you to all potential reviewers.

Conflicts of Interest

No potential conflicts of interest are reported by the authors.

References

  1. Hadi, A.S.; Idrus, S.; Mohamed, A.F.; Taha, M.R.; Othman, M.R.; Ismail, S.M.F.S.; Ismail, S.M. Managing the Growing Kuala Lumpur Mega Urban Region for Livable City: The Sustainable Development Goals as Guiding Frame. Handb. Sustain. Sci. Res. 2018, 357–368. [Google Scholar] [CrossRef]
  2. Xiao, L.; Lo, S.; Liu, J.; Zhou, J.; Li, Q. Nonlinear and Synergistic Effects of TOD on Urban Vibrancy: Applying Local Explanations for Gradient Boosting Decision Tree. Sustain. Cities Soc. 2021, 72, 103063. [Google Scholar] [CrossRef]
  3. Huang, B.; Zhou, Y.; Li, Z.; Song, Y.; Cai, J.; Tu, W. Evaluating and Characterizing Urban Vibrancy Using Spatial Big Data: Shanghai as a Case Study. Environ. Plan. B Urban Anal. City Sci. 2020, 47, 1543–1559. [Google Scholar] [CrossRef]
  4. Montgomery, J. Making a City: Urbanity, Vitality and Urban Design. J. Urban Des. 1998, 3, 93–116. [Google Scholar] [CrossRef]
  5. Couture, V. Three Essays in Urban Economics. Ph.D. Thesis, University of Toronto, Toronto, Canada, 2013. [Google Scholar]
  6. Pinquart, M.; Sörensen, S. Influences of Socioeconomic Status, Social Network, and Competence on Subjective Well-Being in Later Life: A Meta-Analysis. Psychol. Aging 2000, 15, 187. [Google Scholar] [CrossRef]
  7. Van Lenthe, F.J.; Brug, J.; Mackenbach, J.P. Neighbourhood Inequalities in Physical Inactivity: The Role of Neighbourhood Attractiveness, Proximity to Local Facilities and Safety in the Netherlands. Soc. Sci. Med. 2005, 60, 763–775. [Google Scholar] [CrossRef]
  8. Jin, X.; Long, Y.; Sun, W.; Lu, Y.; Yang, X.; Tang, J. Evaluating Cities’ Vitality and Identifying Ghost Cities in China with Emerging Geographical Data. Cities 2017, 63, 98–109. [Google Scholar] [CrossRef]
  9. Tu, W.; Zhu, T.; Xia, J.; Zhou, Y.; Lai, Y.; Jiang, J.; Li, Q. Portraying the Spatial Dynamics of Urban Vibrancy Using Multisource Urban Big Data. Comput. Environ. Urban Syst. 2020, 80, 101428. [Google Scholar] [CrossRef]
  10. Meng, Y.; Xing, H. Exploring the Relationship between Landscape Characteristics and Urban Vibrancy: A Case Study Using Morphology and Review Data. Cities 2019, 95, 102389. [Google Scholar] [CrossRef]
  11. Lu, S.; Shi, C.; Yang, X. Impacts of Built Environment on Urban Vitality: Regression Analyses of Beijing and Chengdu, China. Int. J. Environ. Res. Public Health 2019, 16, 4592. [Google Scholar] [CrossRef]
  12. Ye, Y.; Li, D.; Liu, X. How Block Density and Typology Affect Urban Vitality: An Exploratory Analysis in Shenzhen, China. Urban Geogr. 2018, 39, 631–652. [Google Scholar] [CrossRef]
  13. Wu, J.; Ta, N.; Song, Y.; Lin, J.; Chai, Y. Urban Form Breeds Neighborhood Vibrancy: A Case Study Using a GPS-Based Activity Survey in Suburban Beijing. Cities 2018, 74, 100–108. [Google Scholar] [CrossRef]
  14. Xia, C.; Yeh, A.G.-O.; Zhang, A. Analyzing Spatial Relationships between Urban Land Use Intensity and Urban Vitality at Street Block Level: A Case Study of Five Chinese Megacities. Landsc. Urban Plan. 2020, 193, 103669. [Google Scholar] [CrossRef]
  15. Yue, Y.; Zhuang, Y.; Yeh, A.G.; Xie, J.-Y.; Ma, C.-L.; Li, Q.-Q. Measurements of POI-Based Mixed Use and Their Relationships with Neighbourhood Vibrancy. Int. J. Geogr. Inf. Sci. 2017, 31, 658–675. [Google Scholar] [CrossRef]
  16. Lu, S.; Huang, Y.; Shi, C.; Yang, X. Exploring the Associations Between Urban Form and Neighborhood Vibrancy: A Case Study of Chengdu, China. ISPRS Int. J. Geo-Inf. 2019, 8, 165. [Google Scholar] [CrossRef]
  17. Wu, C.; Ye, X.; Ren, F.; Du, Q. Check-in Behaviour and Spatio-Temporal Vibrancy: An Exploratory Analysis in Shenzhen, China. Cities 2018, 77, 104–116. [Google Scholar] [CrossRef]
  18. Moughtin, C.; Oc, T.; Tiesdell, S. Urban Design: Ornament and Decoration; Routledge: London, UK, 1999. [Google Scholar]
  19. Jacobs, J. The Death and Life of Great American Cities. 1961. N. Y. Vintage 1992, 321–325. [Google Scholar]
  20. Jacobs, J. Jane Jacobs. Death Life Gt. Am. Cities 1961, 21, 13–25. [Google Scholar]
  21. Filion, P.; Hammond, K. Neighbourhood Land Use and Performance: The Evolution of Neighbourhood Morphology over the 20th Century. Environ. Plan. B Plan. Des. 2003, 30, 271–296. [Google Scholar] [CrossRef]
  22. Azmi, D.I.; Karim, H.A. Implications of Walkability towards Promoting Sustainable Urban Neighbourhood. Procedia-Soc. Behav. Sci. 2012, 50, 204–213. [Google Scholar] [CrossRef]
  23. Travel and the Built Environment: A Meta-Analysis: Journal of the American Planning Association: Vol 76, No 3. Available online: https://www.tandfonline.com/doi/abs/10.1080/01944361003766766 (accessed on 2 July 2023).
  24. Clifton, K.J.; Smith, A.D.L.; Rodriguez, D. The Development and Testing of an Audit for the Pedestrian Environment. Landsc. Urban Plan. 2007, 80, 95–110. [Google Scholar] [CrossRef]
  25. Khalili, A.; Fallah, S.N. Role of Social Indicators on Vitality Parameter to Enhance the Quality of Women’s Communal Life within an Urban Public Space (Case: Isfahan’s Traditional Bazaar, Iran). Front. Archit. Res. 2018, 7, 440–454. [Google Scholar] [CrossRef]
  26. Xu, Y.; Belyi, A.; Bojic, I.; Ratti, C. How Friends Share Urban Space: An Exploratory Spatiotemporal Analysis Using Mobile Phone Data. Trans. GIS 2017, 21, 468–487. [Google Scholar] [CrossRef]
  27. Chhetri, P.; Stimson, R.J.; Western, J. Modelling the Factors of Neighbourhood Attractiveness Reflected in Residential Location Decision Choices. Stud. Reg. Sci. 2006, 36, 393–417. [Google Scholar] [CrossRef]
  28. Zarin, S.Z.; Niroomand, M.; Heidari, A.A. Physical and Social Aspects of Vitality Case Study: Traditional Street and Modern Street in Tehran. Procedia-Soc. Behav. Sci. 2015, 170, 659–668. [Google Scholar] [CrossRef]
  29. Liu, Y.; Liu, X.; Gao, S.; Gong, L.; Kang, C.; Zhi, Y.; Chi, G.; Shi, L. Social Sensing: A New Approach to Understanding Our Socioeconomic Environments. Ann. Assoc. Am. Geogr. 2015, 105, 512–530. [Google Scholar] [CrossRef]
  30. Shaw, S.-L.; Tsou, M.-H.; Ye, X. Human Dynamics in the Mobile and Big Data Era. Int. J. Geogr. Inf. Sci. 2016, 30, 1687–1693. [Google Scholar] [CrossRef]
  31. Jacobs-Crisioni, C.; Rietveld, P.; Koomen, E.; Tranos, E. Evaluating the Impact of Land-Use Density and Mix on Spatiotemporal Urban Activity Patterns: An Exploratory Study Using Mobile Phone Data. Environ. Plan. A 2014, 46, 2769–2785. [Google Scholar] [CrossRef]
  32. De Nadai, M.; Staiano, J.; Larcher, R.; Sebe, N.; Quercia, D.; Lepri, B. The Death and Life of Great Italian Cities: A Mobile Phone Data Perspective. In Proceedings of the 25th international Conference on World Wide Web, Montreal, QC, Canada, 11–15 April 2016; pp. 413–423. [Google Scholar]
  33. Pelletier, M.-P.; Trépanier, M.; Morency, C. Smart Card Data Use in Public Transit: A Literature Review. Transp. Res. Part C Emerg. Technol. 2011, 19, 557–568. [Google Scholar] [CrossRef]
  34. Othman, N.B.; Legara, E.F.; Selvam, V.; Monterola, C. Simulating Congestion Dynamics of Train Rapid Transit Using Smart Card Data. Procedia Comput. Sci. 2014, 29, 1610–1620. [Google Scholar] [CrossRef]
  35. Joosten, V.; Van Nes, A. How Block Types Influences the Natural Movement Economic Process: Micro-Spatial Conditions on the Dispersal of Shops and Café in Berlin. In Proceedings of the 5th International Space Syntax Symposium, TU Delft, Delft, The Netherlands, 13–17 June 2005; pp. 13–17. [Google Scholar]
  36. Li, L.; Goodchild, M.F.; Xu, B. Spatial, Temporal, and Socioeconomic Patterns in the Use of Twitter and Flickr. Cartogr. Geogr. Inf. Sci. 2013, 40, 61–77. [Google Scholar] [CrossRef]
  37. Hasan, S.; Zhan, X.; Ukkusuri, S.V. Understanding Urban Human Activity and Mobility Patterns Using Large-Scale Location-Based Data from Online Social Media. In Proceedings of the 2nd ACM SIGKDD International Workshop on Urban Computing, Chicago, IL, USA, 11 August 2013; pp. 1–8. [Google Scholar]
  38. Wu, L.; Zhi, Y.; Sui, Z.; Liu, Y. Intra-Urban Human Mobility and Activity Transition: Evidence from Social Media Check-in Data. PLoS ONE 2014, 9, e97010. [Google Scholar]
  39. Longley, P.A.; Adnan, M.; Lansley, G. The Geotemporal Demographics of Twitter Usage. Environ. Plan. A 2015, 47, 465–484. [Google Scholar] [CrossRef]
  40. Malizia, E.; Motoyama, Y. The Economic Development–Vibrant Center Connection: Tracking High-Growth Firms in the DC Region. Prof. Geogr. 2016, 68, 349–355. [Google Scholar]
  41. Zumelzu, A.; Barrientos-Trinanes, M. Analysis of the Effects of Urban Form on Neighborhood Vitality: Five Cases in Valdivia, Southern Chile. J. Hous. Built Environ. 2019, 34, 897–925. [Google Scholar]
  42. Nicodemus, A.G. Fuzzy Vibrancy: Creative Placemaking as Ascendant US Cultural Policy. Cult. Trends 2013, 22, 213–222. [Google Scholar] [CrossRef]
  43. Harvey, L. Defining and Measuring Employability. Qual. High. Educ. 2001, 7, 97–109. [Google Scholar] [CrossRef]
  44. Ravenscroft, N. The Vitality and Viability of Town Centres. Urban Stud. 2000, 37, 2533–2549. [Google Scholar]
  45. Stern, M.J.; Seifert, S.C. Cultural Clusters: The Implications of Cultural Assets Agglomeration for Neighborhood Revitalization. J. Plan. Educ. Res. 2010, 29, 262–279. [Google Scholar]
  46. Lowry, J.H.; Lowry, M.B. Comparing Spatial Metrics That Quantify Urban Form. Comput. Environ. Urban Syst. 2014, 44, 59–67. [Google Scholar]
  47. Zhang, X.; Sun, Y.; Chan, T.O.; Huang, Y.; Zheng, A.; Liu, Z. Exploring Impact of Surrounding Service Facilities on Urban Vibrancy Using Tencent Location-Aware Data: A Case of Guangzhou. Sustainability 2021, 13, 444. [Google Scholar] [CrossRef]
  48. Zhang, L.; Pei, T.; Chen, Y.; Song, C.; Liu, X. A Review of Urban Environmental Assessment Based on Street View Images. J. Geo-Inf. Sci. 2019, 21, 46–58. [Google Scholar]
  49. Su, M.; Du, Y.; Liu, Q.; Ren, Y.; Kawachi, I.; Lv, J.; Li, L. Objective Assessment of Urban Built Environment Related to Physical Activity—Development, Reliability and Validity of the China Urban Built Environment Scan Tool (CUBEST). BMC Public Health 2014, 14, 109. [Google Scholar]
  50. Tuan, Y.-F. Landscapes of Fear; University of Minnesota Press: Minneapolis, MN, USA, 2013. [Google Scholar]
  51. Ordonez, V.; Berg, T.L. Learning High-Level Judgments of Urban Perception. In Computer Vision–ECCV 2014: 13th European Conference, Zurich, Switzerland, 6–12 September 2014, Proceedings, Part VI 13; Springer: Berlin/Heidelberg, Germany, 2014; pp. 494–510. [Google Scholar]
  52. Staff, P.O. Correction: The Collaborative Image of The City: Mapping the Inequality of Urban Perception. PLoS ONE 2015, 10, e0119352. [Google Scholar]
  53. Naik, N.; Philipoom, J.; Raskar, R.; Hidalgo, C. Streetscore-Predicting the Perceived Safety of One Million Streetscapes. In Proceedings of the IEEE Conference on Computer Vision and Pattern Recognition Workshops, Columbus, OH, USA, 23–28 June 2014; pp. 779–785. [Google Scholar]
  54. Zhang, F.; Hu, M.; Che, W.; Lin, H.; Fang, C. Framework for Virtual Cognitive Experiment in Virtual Geographic Environments. ISPRS Int. J. Geo-Inf. 2018, 7, 36. [Google Scholar] [CrossRef]
  55. Porzi, L.; Rota Bulò, S.; Lepri, B.; Ricci, E. Predicting and Understanding Urban Perception with Convolutional Neural Networks. In Proceedings of the 23rd ACM International Conference on Multimedia, Brisbane, Australia, 26–30 October 2015; pp. 139–148. [Google Scholar]
  56. Zhang, F.; Zhou, B.; Liu, L.; Liu, Y.; Fung, H.H.; Lin, H.; Ratti, C. Measuring Human Perceptions of a Large-Scale Urban Region Using Machine Learning. Landsc. Urban Plan. 2018, 180, 148–160. [Google Scholar] [CrossRef]
  57. Dubey, A.; Naik, N.; Parikh, D.; Raskar, R.; Hidalgo, C.A. Deep Learning the City: Quantifying Urban Perception at a Global Scale. In Computer Vision–ECCV 2016: 14th European Conference, Amsterdam, The Netherlands, 11–14 October 2016, Proceedings, Part I 14; Springer: Berlin/Heidelberg, Germany, 2016; pp. 196–212. [Google Scholar]
  58. Gehl, J. Life between Buildings: Using Public Space Copenhagen. Dan. Arch. 1971. [Google Scholar]
  59. Parsons, R. The Potential Influences of Environmental Perception on Human Health. J. Environ. Psychol. 1991, 11, 1–23. [Google Scholar] [CrossRef]
  60. Ulrich, R.S. Visual Landscapes and Psychological Well-Being. Landsc. Res. 1979, 4, 17–23. [Google Scholar] [CrossRef]
  61. Cresswell, T.J. In Place/out of Place: Geography, Ideology and Transgression; The University of Wisconsin-Madison: Madison, WI, USA, 1992. [Google Scholar]
  62. Montello, D.R.; Goodchild, M.F.; Gottsegen, J.; Fohl, P. Where’s Downtown?: Behavioral Methods for Determining Referents of Vague Spatial Queries. Spat. Cogn. Comput. 2003, 3, 185–204. [Google Scholar]
  63. Can, I.; Heath, T. In-between Spaces and Social Interaction: A Morphological Analysis of Izmir Using Space Syntax. J. Hous. Built Environ. 2016, 31, 31–49. [Google Scholar] [CrossRef]
  64. Brunsdon, C.; Fotheringham, A.S.; Charlton, M.E. Geographically Weighted Regression: A Method for Exploring Spatial Nonstationarity. Geogr. Anal. 1996, 28, 281–298. [Google Scholar] [CrossRef]
  65. Fan, H.; Zipf, A.; Fu, Q.; Neis, P. Quality Assessment for Building Footprints Data on OpenStreetMap. Int. J. Geogr. Inf. Sci. 2014, 28, 700–719. [Google Scholar] [CrossRef]
  66. Haklay, M. How Good Is Volunteered Geographical Information? A Comparative Study of OpenStreetMap and Ordnance Survey Datasets. Environ. Plan. B Plan. Des. 2010, 37, 682–703. [Google Scholar] [CrossRef]
  67. Liu, X.; Long, Y. Automated Identification and Characterization of Parcels with OpenStreetMap and Points of Interest. Environ. Plan. B Plan. Des. 2016, 43, 341–360. [Google Scholar] [CrossRef]
  68. Gibson, C.; Brennan-Horley, C.; Laurenson, B.; Riggs, N.; Warren, A.; Gallan, B.; Brown, H. Cool Places, Creative Places? Community Perceptions of Cultural Vitality in the Suburbs. Int. J. Cult. Stud. 2012, 15, 287–302. [Google Scholar] [CrossRef]
  69. Zou, Z.-H.; Yi, Y.; Sun, J.-N. Entropy Method for Determination of Weight of Evaluating Indicators in Fuzzy Synthetic Evaluation for Water Quality Assessment. J. Environ. Sci. 2006, 18, 1020–1023. [Google Scholar] [CrossRef]
  70. Walks, R.A. Naked City: The Death and Life of Authentic Urban Places; Oxford University Press: Oxford, UK, 2010; Volume 44, pp. 659–661. [Google Scholar]
  71. Su, S.; Pi, J.; Xie, H.; Cai, Z.; Weng, M. Community Deprivation, Walkability, and lic Health: Highlighting the Social Inequalities in Land Use Planning for Health Promotion. Land Use Policy 2017, 67, 315–326. [Google Scholar] [CrossRef]
  72. Zhang, F.; Liu, Y. Street View Imagery: Methods and Applications Based on Artificial Intelligence. Natl. Remote Sens. Bull. 2021, 25, 1043–1054. [Google Scholar] [CrossRef]
  73. Yao, Y.; Liang, Z.; Yuan, Z.; Liu, P.; Bie, Y.; Zhang, J.; Wang, R.; Wang, J.; Guan, Q. A Human-Machine Adversarial Scoring Framework for Urban Perception Assessment Using Street-View Images. Int. J. Geogr. Inf. Sci. 2019, 33, 2363–2384. [Google Scholar] [CrossRef]
  74. Dai, L.; Zheng, C.; Dong, Z.; Yao, Y.; Wang, R.; Zhang, X.; Ren, S.; Zhang, J.; Song, X.; Guan, Q. Analyzing the Correlation between Visual Space and Residents’ Psychology in Wuhan, China Using Street-View Images and Deep-Learning Technique. City Environ. Interact. 2021, 11, 100069. [Google Scholar] [CrossRef]
  75. Van den Berg, M.; Wendel-Vos, W.; van Poppel, M.; Kemper, H.; van Mechelen, W.; Maas, J. Health Benefits of Green Spaces in the Living Environment: A Systematic Review of Epidemiological Studies. Urban For. Urban Green. 2015, 14, 806–816. [Google Scholar] [CrossRef]
  76. Zhang, F.; Zhang, D.; Liu, Y.; Lin, H. Representing Place Locales Using Scene Elements. Comput. Environ. Urban Syst. 2018, 71, 153–164. [Google Scholar] [CrossRef]
  77. Li, F.; Wang, R.; Paulussen, J.; Liu, X. Comprehensive Concept Planning of Urban Greening Based on Ecological Principles: A Case Study in Beijing, China. Landsc. Urban Plan. 2005, 72, 325–336. [Google Scholar] [CrossRef]
  78. Ma, X.; Ma, C.; Wu, C.; Xi, Y.; Yang, R.; Peng, N.; Zhang, C.; Ren, F. Measuring Human Perceptions of Streetscapes to Better Inform Urban Renewal: A Perspective of Scene Semantic Parsing. Cities 2021, 110, 103086. [Google Scholar] [CrossRef]
  79. Ewing, R.; Clemente, O.; Neckerman, K.M.; Purciel-Hill, M.; Quinn, J.W.; Rundle, A. Measuring Urban Design: Metrics for Livable Places; Springer: Berlin/Heidelberg, Germany, 2013; Volume 200. [Google Scholar]
  80. Lynch, K. The Image of the City; MIT Press: Cambridge, MA, USA, 1964. [Google Scholar]
  81. Yin, L.; Wang, Z. Measuring Visual Enclosure for Street Walkability: Using Machine Learning Algorithms and Google Street View Imagery. Appl. Geogr. 2016, 76, 147–153. [Google Scholar] [CrossRef]
  82. Wang, R.; Liu, Y.; Lu, Y.; Yuan, Y.; Zhang, J.; Liu, P.; Yao, Y. The Linkage between the Perception of Neighbourhood and Physical Activity in Guangzhou, China: Using Street View Imagery with Deep Learning Techniques. Int. J. Health Geogr. 2019, 18, 18. [Google Scholar] [CrossRef]
  83. Marquardt, D.W.; Snee, R.D. Ridge Regression in Practice. Am. Stat. 1975, 29, 3–20. [Google Scholar]
  84. Ogutu, J.O.; Schulz-Streeck, T.; Piepho, H.-P. Genomic Selection Using Regularized Linear Regression Models: Ridge Regression, Lasso, Elastic Net and Their Extensions. In BMC Proceedings; Springer: Berlin/Heidelberg, Germany, 2012; Volume 6, pp. 1–6. [Google Scholar]
  85. Long, Y.; Shen, Y.; Jin, X. Mapping Block-Level Urban Areas for All Chinese Cities. Ann. Am. Assoc. Geogr. 2016, 106, 96–113. [Google Scholar] [CrossRef]
Figure 1. Study area: Beijing, China. The blue points indicate the sample locations with Tencent images (four street views for each location) formatting.
Ijgi 12 00402 g001
Figure 2. Analytical framework.
Ijgi 12 00402 g002
Figure 3. Schematic diagram used to obtain six human perception scores of the street block [73].
Ijgi 12 00402 g003
Figure 4. Mapping the eight visual–spatial indicators.
Ijgi 12 00402 g004
Figure 5. Mapping the six urban psychological indicators.
Ijgi 12 00402 g005
Figure 6. Spatial distribution of urban vibrancy within Beijing’s Fifth Ring Road. (A) POIs. (B) Social media check-ins. (C) Comprehensive vibrancy.
Ijgi 12 00402 g006
Figure 7. Importance of the 14 variables.
Ijgi 12 00402 g007
Figure 8. Comparison of neighborhood scale and street scale vibrancy in the same area (AD). “a”,”b”,” c”,” d”refers to the streets that make up the different neighbourhoods, respectively.
Ijgi 12 00402 g008
Table 1. Types of data sources.
No.DataCollecting TimeNumber
1OSMJuly 2019757 edges
2Street view imagesMay 2019128,560 images
3POIsSeptember 2018356,000 records
4Social check-insMarch 2013 to March 201432,205 records
Table 2. Formulas for the eight indices of the visual space indicators scores.
IndicatorsFormulaExpression
Greenness G i = 1 4 j = 1 4 t r e e j + 1 4 j = 1 4 g r a s s j + 1 4 j = 1 4 p l a n t j Greenness was measured by the proportion of trees, grass and plant in the street view images.
Openness O i = 1 4 j = 1 4 s k y j Openness was reflected by the proportion of the sky in street view images.
Enclosure E i = 1 4 j = 1 4 b u i l d j + 1 4 j = 1 4 w a l l j + 1 4 j = 1 4 s k y s c j + 1 4 j = 1 4 f l o o r j + 1 4 j = 1 4 h o u s e j + 1 4 j = 1 4 b a s e j + 1 4 j = 1 4 t r e e s j Enclosure was measured by the proportion of buildings, walls, skyscrapers, floors, houses, bases and trees in street view images.
Imageability I i = 1 4 j = 1 4 s i g n b j + 1 4 j = 1 4 c o l u m j + 1 4 j = 1 4 p a i n t j + 1 4 j = 1 4 w i n d j Imageability was measured by some signs in the street scene that can make a deep impression, such as signboards, columns, paintings and windowpane.
Walkability W i = 1 4 j = 1 4   s i d e w j + 1 4 j = 1 4   f e n c e j 1 4 j = 1 4   r o a d j + 1 4 j = 1 4   p a t h j The walkability index was reduced to the degree of the visual impact of the environment perceived from a horizontal perspective, defined by the ratio of the sidewalk and fence to the overall road and path.
Blueness B i = 1 4 j = 1 4   r i v e r j + 1 4 j = 1 4   s e a j + 1 4 j = 1 4   w a t e r j Blueness was measured by river, sea and other water in street view images.
Traffic flow T i = 1 4 j = 1 4   p e d e s j + 1 4 j = 1 4   r u n w a j + 1 4 j = 1 4   r a i l i j + 1 4 j = 1 4   v e h i c j Traffic flow was measured by pedestrians, runways, railing and vehicles in street view images.
Natural N i = 1 4 j = 1 4   m o u n t j + 1 4 j = 1 4   f i e l d j + 1 4 j = 1 4 e a r t h j   + 1 4 j = 1 4   r o c k j + 1 4 j = 1 4   s a n d j Natural was measured by mountains, fields, earth, rock and sand in street view images.
i is the i t h   sample point, and j is the   j t h direction.
Table 3. Descriptive statistics of the independent variables.
VariablesMeanStd
Greenness0.1280.062
Openness0.2950.064
Enclosure0.2880.070
Imageability0.0020.001
Walkability0.1700.074
Traffic flow0.0480.014
Blueness0.0020.013
Natural0.0090.009
Beautiful40.0863.803
Boring61.3522.830
Depression55.0814.723
Lively50.7655.894
Safe44.3915.402
Wealthy52.7775.782
Table 4. Variables used in the three models ( v c is the comprehensive urban vibrancy index).
VariablesModel 1Model 2Model 3
Visual–spatial characteristic
Urban psychological perceptions
Urban   vibrancy   ( v c )
R 2 0.7060.7430.807
The results of k-fold test: model 1_CV accuracy = 0.660, model 2_CV accuracy = 0.700, model 3_CV accuracy = 0.750.
Table 5. Correlation table between influencing factors and urban vibrancy.
VariablesGreOpeEncImaWalTraBluNatBeaBorDepLivSafWea
Greenness1.00−0.310.28−0.090.090.010.430.110.54−0.44−0.18−0.20−0.12−0.32
Openness−0.311.00−0.940.09−0.09−0.47−0.140.520.460.73−0.85−0.68−0.78−0.64
Enclosure0.28−0.941.00−0.200.130.51−0.07−0.57−0.43−0.820.830.710.800.65
Imageability−0.090.09−0.201.00−0.04−0.090.050.050.000.27−0.04−0.24−0.24−0.22
Walkability0.09−0.090.13−0.041.00−0.01−0.070.09−0.09−0.060.06−0.010.00−0.045
Traffic flow0.01−0.480.52−0.06−0.011.00−0.09−0.54−0.36−0.640.550.620.640.55
Blueness0.43−0.14−0.08−0.09−0.07−0.09−1.000.260.000.10−0.03−0.07−0.05−0.04
Natural0.110.52−0.580.050.09−0.540.261.000.360.58−0.62−0.70−0.67−0.65
Beautiful0.540.46−0.43−0.05−0.09−0.360.000.361.000.13−0.80−0.71−0.66−0.76
Boring−0.440.74−0.82−0.27−0.06−0.640.100.580.131.00−0.56−0.64−0.72−0.52
Depression−0.18−0.860.83−0.050.060.54−0.03−0.62−0.80−0.561.000.850.890.86
Lively−0.20−0.680.71−0.240.000.61−0.06−0.70−0.71−0.640.861.000.950.98
Safe−0.12−0.780.81−0.24−0.040.64−0.05−0.67−0.66−0.720.890.951.000.94
Wealthy−0.32−0.640.66−0.220.100.55−0.03−0.65−0.76−0.520.860.970.941.00
Vibrancy−0.07−0.650.72−0.120.760.57−0.14−0.64−0.61−0.620.770.820.780.77
Table 6. Results of multiple regression analysis.
IndicesBeautifulBoringDepressionLivelySafetyWealthy
Greenness0.873−0.381−0.489−0.410−0.367−0.567
Openness0.211−0.067−0.538−0.146−0.244−0.191
Enclosure−0.474−0.3600.3850.4030.4540.412
Imageability−0.0180.1030.045−0.161−0.135−0.167
Walkability−0.060−0.001−0.014−0.009−0.016−0.027
Traffic flow−0.108−0.2950.0840.2070.2220.150
Blueness−0.3620.1630.1450.2150.1650.288
Natural−0.0640.164−0.057−0.276−0.149−0.234
R20.8520.8500.9780.8170.8820.852
RMSE0.4080.3780.1470.4360.3470.289
MAE0.4200.3140.1140.3220. 2730.396
Disclaimer/Publisher’s Note: The statements, opinions and data contained in all publications are solely those of the individual author(s) and contributor(s) and not of MDPI and/or the editor(s). MDPI and/or the editor(s) disclaim responsibility for any injury to people or property resulting from any ideas, methods, instructions or products referred to in the content.

