
Analysis of Marrubiin in Marrubium alysson L. Extract Using Advanced HPTLC: Chemical Profiling, Acetylcholinesterase Inhibitory Activity, and Molecular Docking
 ,
,  , , , ,
  and
and
Abstract
:1. Introduction
2. Materials and Methods
2.1. Analysis of n-Hexane Extract Using GC-MS
2.1.1. Chemicals
2.1.2. Extraction and Fractionation of the Plant
2.1.3. Preparation of Unsaponifiable Matter
2.1.4. Preparation of Fatty Acid Methyl Ester
2.1.5. GC-MS Analysis
2.2. Quantitative Analysis of Marrubiin
2.2.1. Instrumentation
2.2.2. Chemicals
2.2.3. Preparation of Plant Extract
2.2.4. Standard Solution
2.2.5. Calibration Graph
2.2.6. Sample Assay
2.3. In Vitro Biological Study: Acetylcholinesterase Inhibitory Effect
2.3.1. Donepezil Standard
2.3.2. Sample Preparation
2.3.3. Sources of Chemicals and Enzyme
2.3.4. Acetylcholinesterase Inhibitor Assay
2.3.5. Micro Plate Reader Analysis
2.4. Molecular Docking Studies
3. Results
3.1. GC-MS Analysis of n-Hexane Extract
3.2. Quantitative Analysis of Marrubiin
3.2.1. Linearity
3.2.2. System Precision
3.2.3. Method Precision
3.2.4. Accuracy
3.2.5. Limit of Detection (LOD) and Limit of Quantification (LOQ)
3.2.6. Robustness
3.2.7. Analytical Solution Stability
3.2.8. Sample Analysis
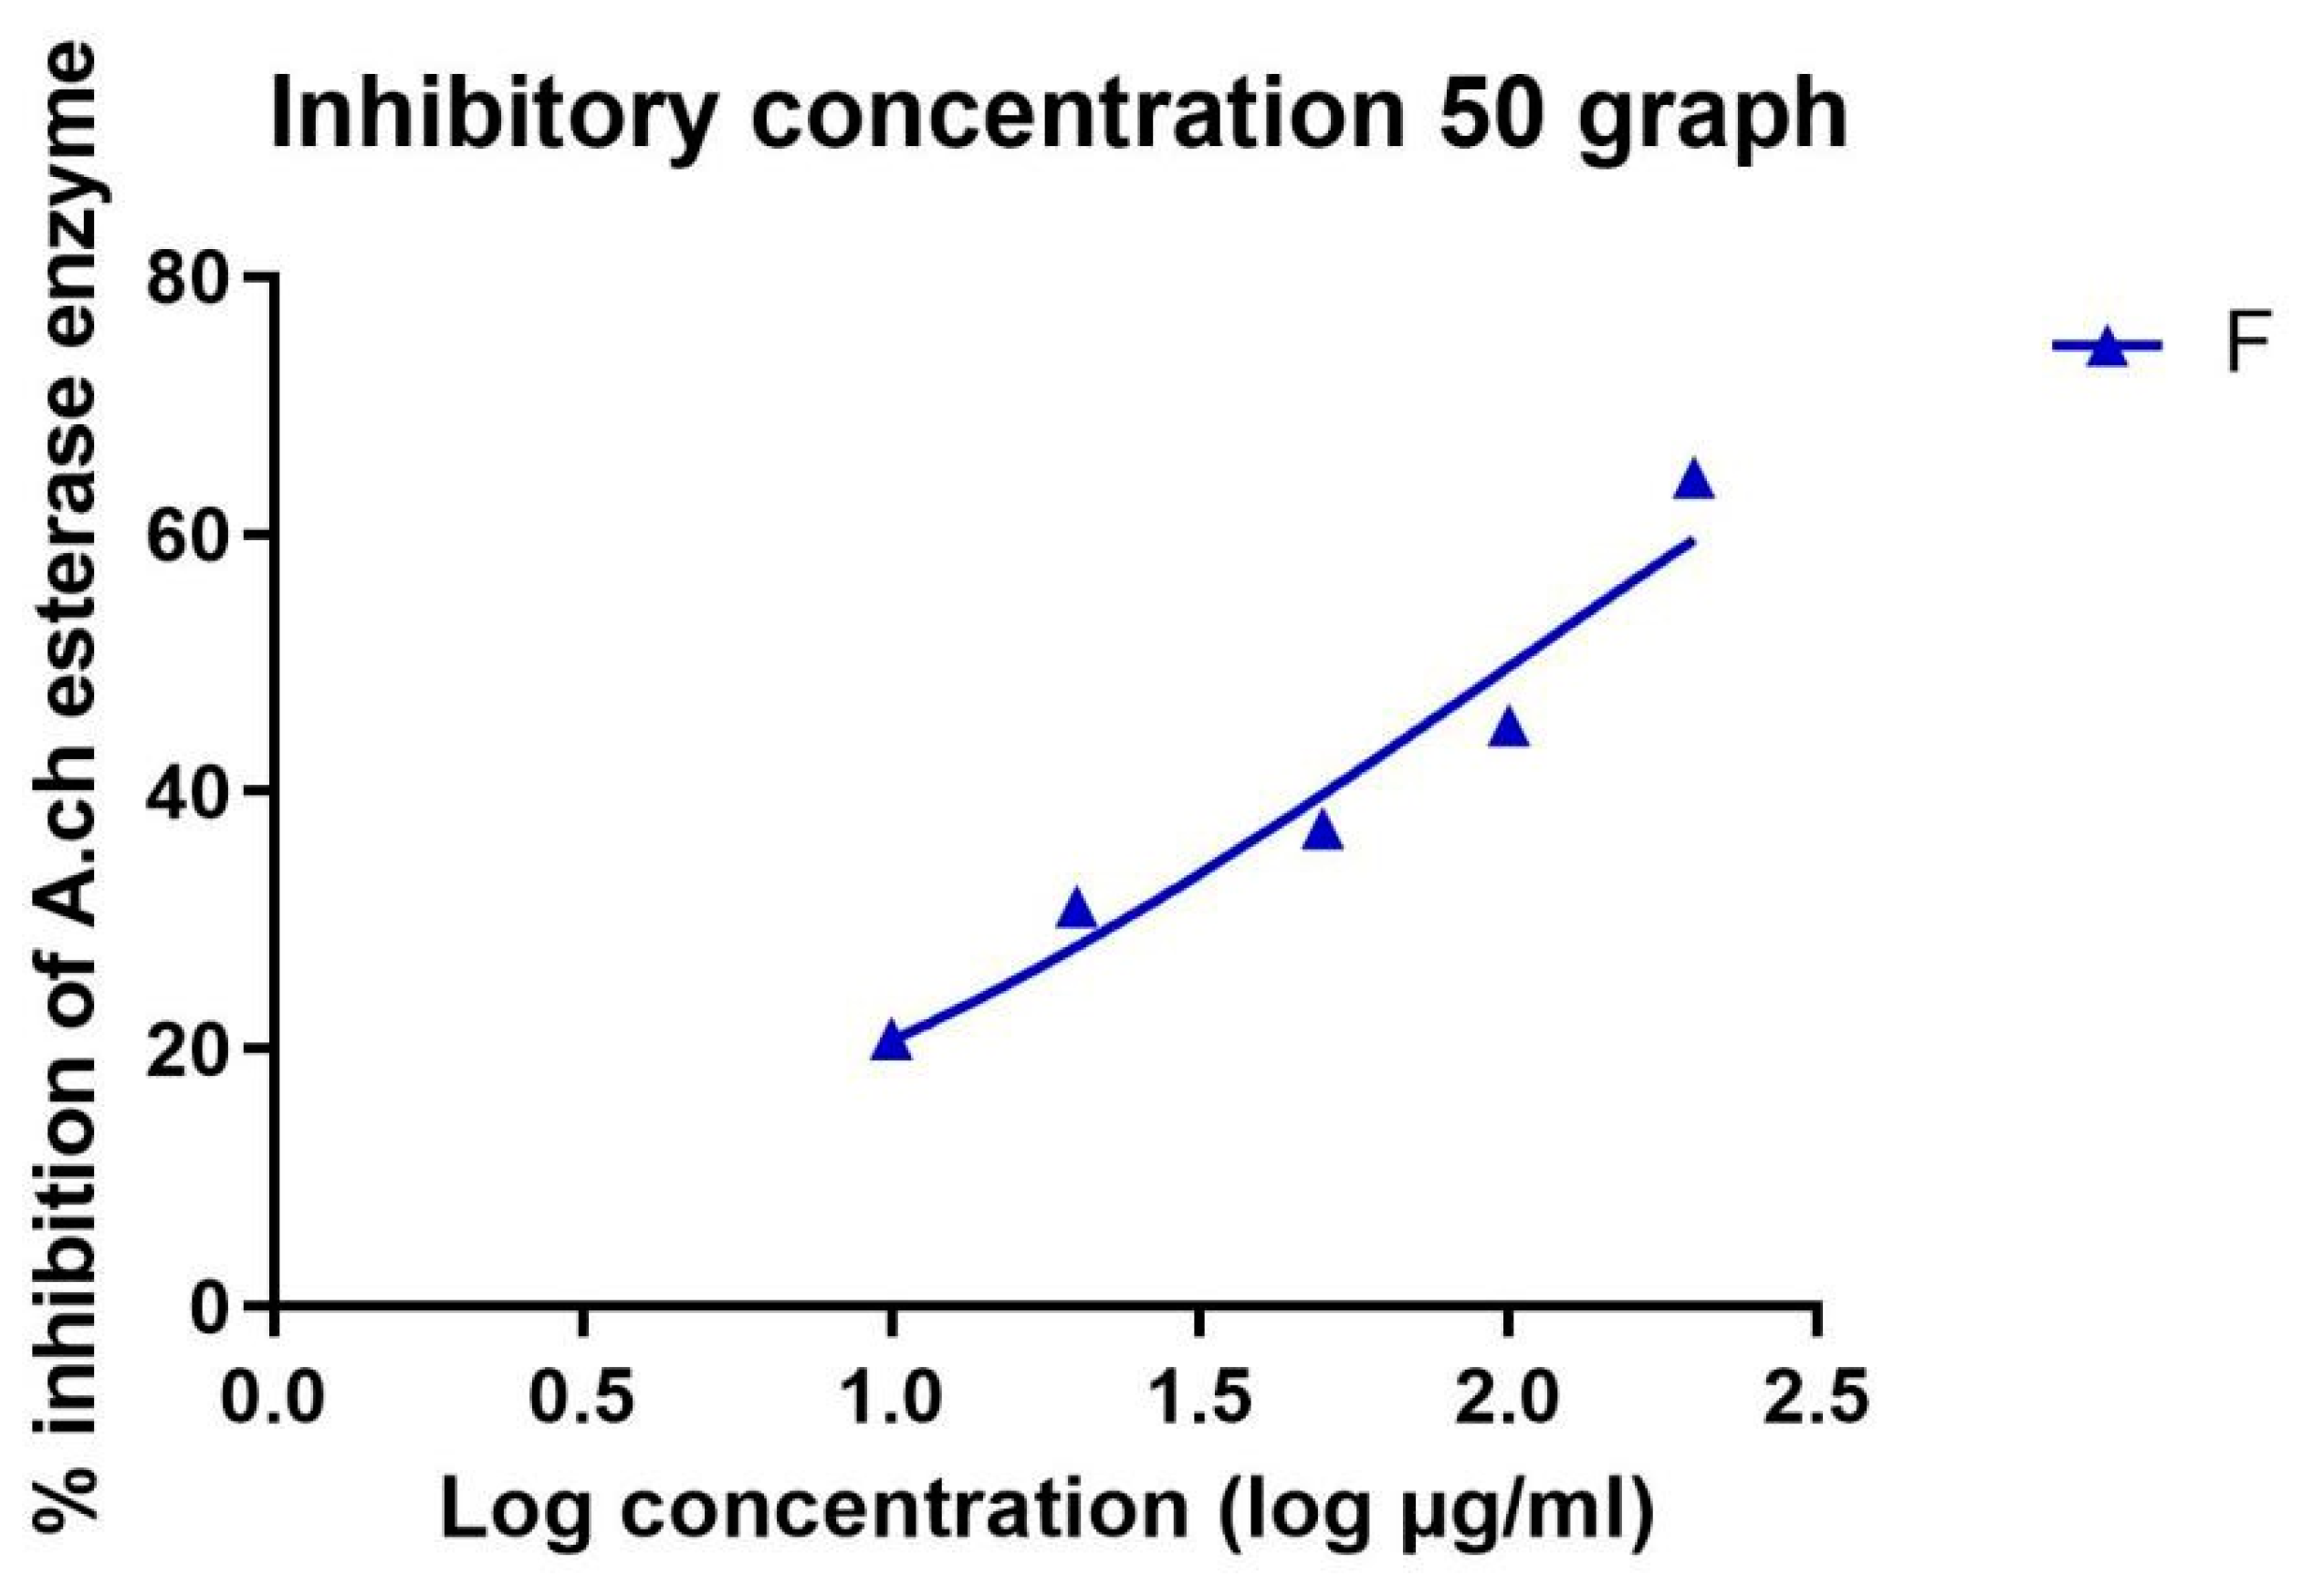
3.3. In Vitro Biological Study: Acetylcholinesterase Inhibitory Effect
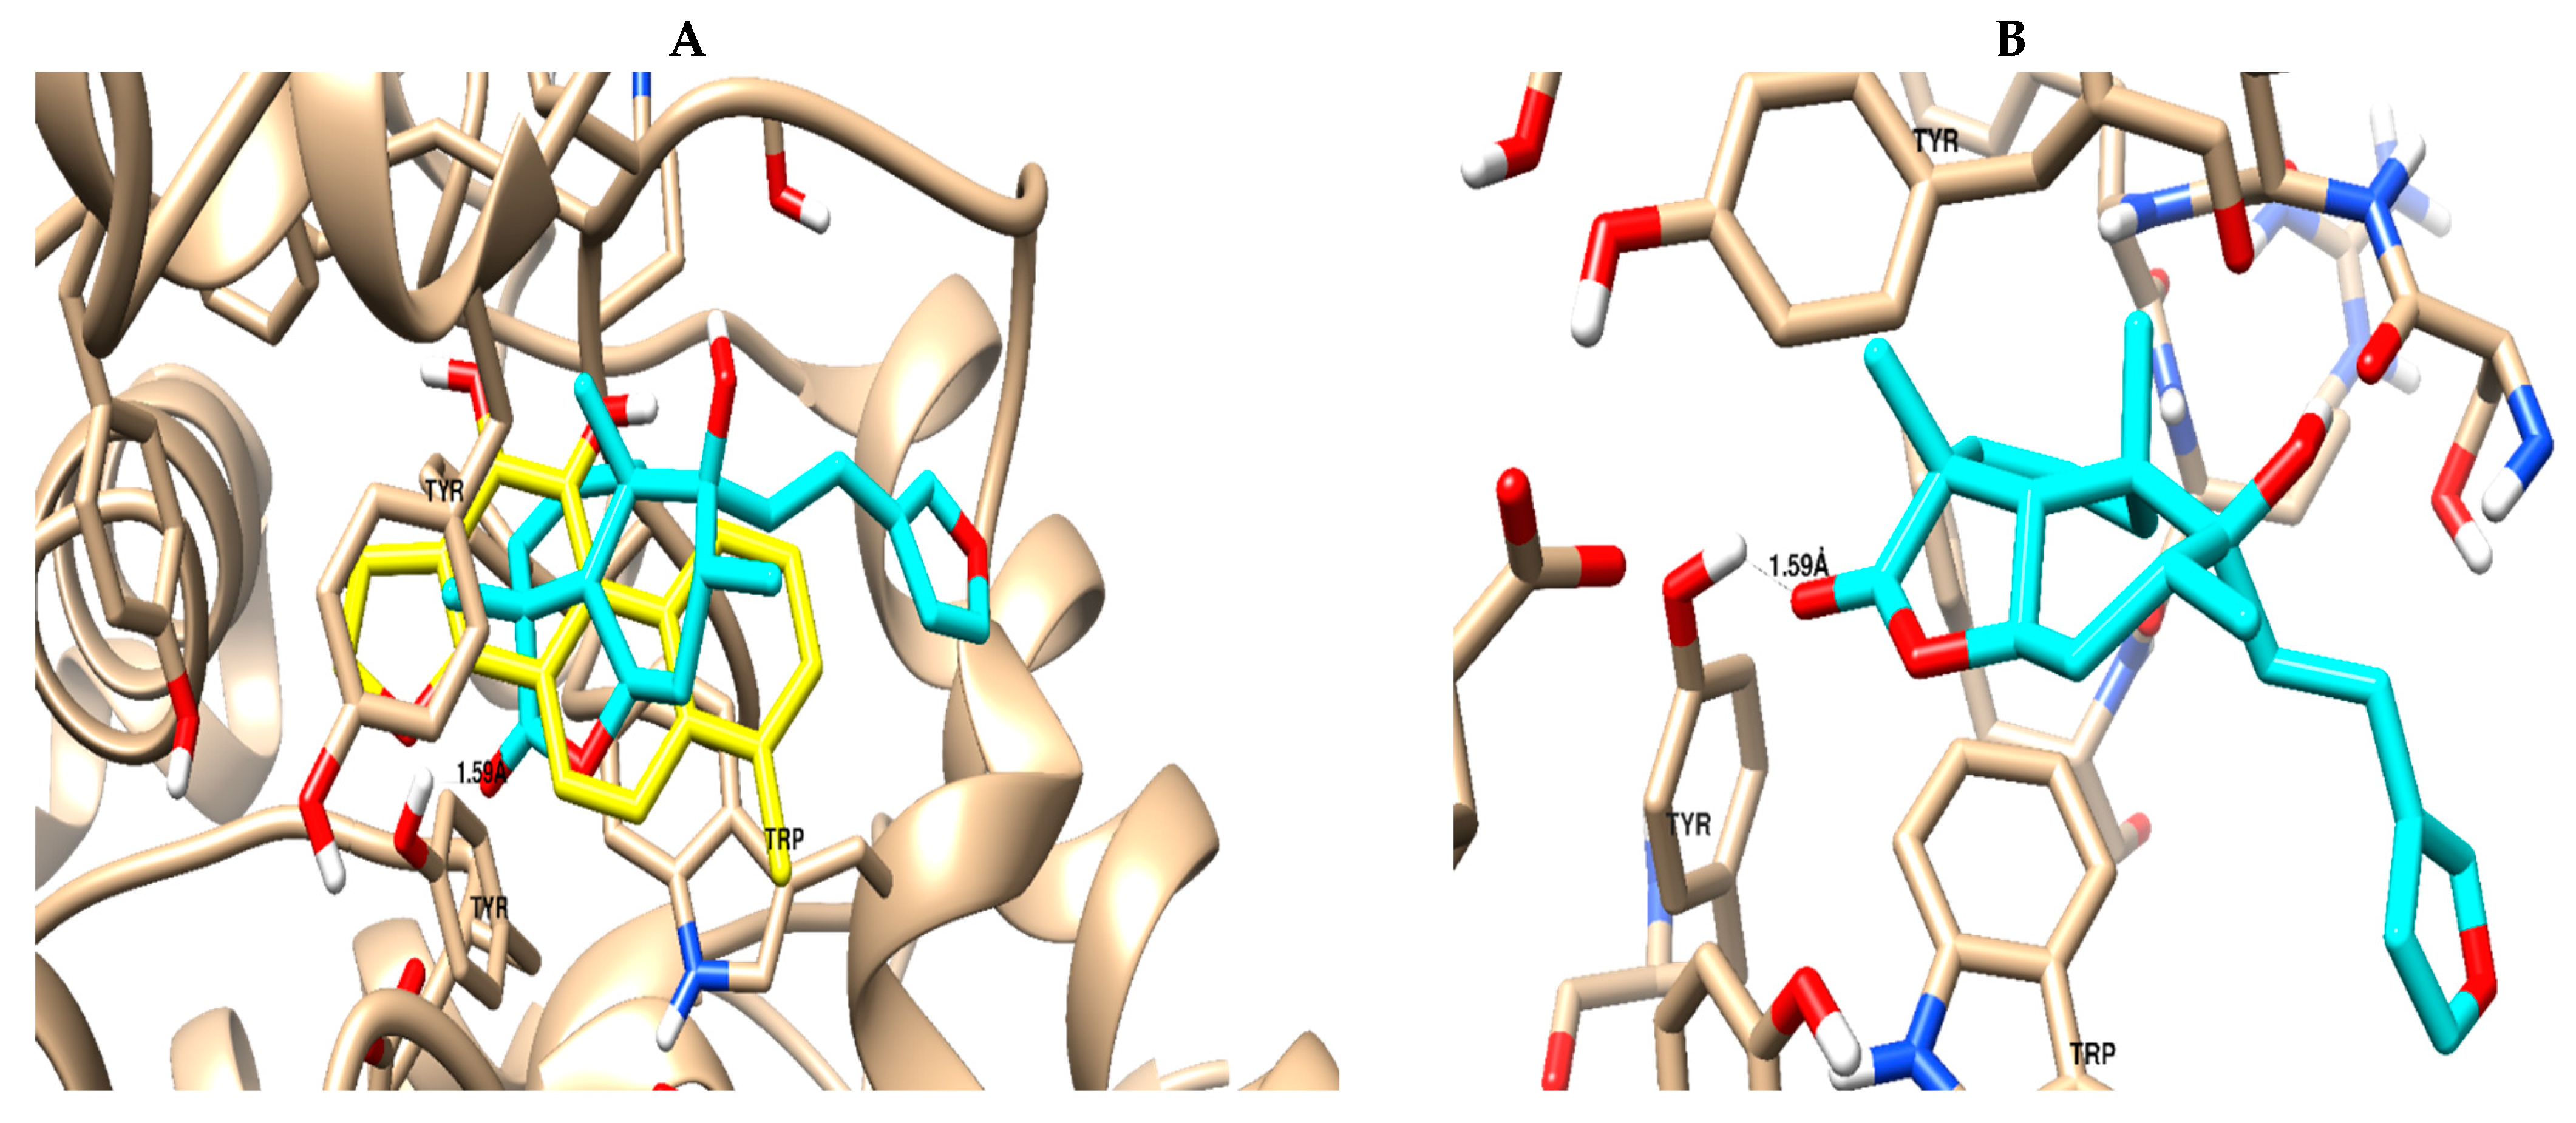
3.4. Molecular Docking
4. Discussion
5. Conclusions
Supplementary Materials
Author Contributions
Funding
Institutional Review Board Statement
Informed Consent Statement
Data Availability Statement
Conflicts of Interest
References
- Alaa, R.; Abd-Alhaseeb, M.; Habib, E.; Ibrahim, A.; Ahmed, S. Screening of Marrubium alysson L. extract for pharmacological activity. J. Chem. Pharm. Res. 2016, 8, 283–289. [Google Scholar]
- Rezgui, M.; Basma, M.; Neng, N.; Nogueira, J.M.; Ben-Kaab, L.B.; Araújo, M.E. Evaluatin of Marrubium vulgare Growing Wild in Tunisia for Its Potential as a Dietary Supplement. Foods 2021, 10, 2864. [Google Scholar] [CrossRef] [PubMed]
- Ahvazi, M.; Balali, G.R.; Jamzad, Z.; Saeidi, H. A Taxonomical, Morphological and Pharmacological Review of Marrubium vulgare L., An Old Medicinal Plant in Iran. J. Med. Plants 2018, 17, 7–24. [Google Scholar]
- Uritu, C.M.; Mihai, C.T.; Stanciu, G.D.; Dodi, G.; Alexa-Stratulat, T.; Luca, A.; Leon-Constantin, M.M.; Stefanescu, R.; Bild, V.; Melnic, S.; et al. Medicinal Plants of the Family Lamiaceae in Pain Therapy: A Review. Pain Res. Manag. 2018, 2018, 7801543. [Google Scholar] [CrossRef] [PubMed]
- Hamedeyazdan, S.; Fathiazad, F.; Asnaashari, S. Chemical composition of the essential oil from Marrubium persicum C. A. Mey. (Lamiaceae). Pharm. Sci. 2013, 19, 35–38. [Google Scholar]
- Abdelhameed, R.F.A.; Habib, E.S.; Ibrahim, A.K.; Yamada, K.; Abdel-Kader, M.S.; Ibrahim, A.K.; Ahmed, S.A.; Badr, J.M.; Nafie, M.S. Chemical profiling, cytotoxic activities through apoptosis induction in MCF-7 cells and molecular docking of Phyllostachys heterocycla bark nonpolar extract. J. Biomol. Struct. Dyn. 2022, 40, 9636–9647. [Google Scholar] [CrossRef] [PubMed]
- Gordin, H.M. MARRUBIIN. J. Am. Chem. Soc. 1908, 30, 265–271. [Google Scholar] [CrossRef]
- Aćimović, M.; Jeremić, K.; Salaj, N.; Gavarić, N.; Kiprovski, B.; Sikora, V.; Zeremski, T. Marrubium vulgare L.: A Phytochemical and Pharmacological Overview. Molecules 2020, 25, 2898. [Google Scholar] [CrossRef]
- Popoola, O.K.; Elbagory, A.M.; Ameer, F.; Hussein, A.A. Marrubiin. Molecules 2013, 18, 9049–9060. [Google Scholar] [CrossRef]
- Piozzi, F.; Bruno, M.; Rosselli, S.; Maggio, A. The Diterpenoids of the Genus Marrubium (Lamiaceae). Nat. Prod. Commun. 2006, 1, 585–592. [Google Scholar] [CrossRef]
- De Jesus, R.A.P.; Cechinel-Filho, V.; Oliveira, A.E.; Schlemper, V. Analysis of the antinociceptive properties of marrubiin isolated from Marrubium vulgare. Phytomedicine 2000, 7, 111–115. [Google Scholar] [CrossRef] [PubMed]
- Stulzer, H.K.; Tagliari, M.P.; Zampirolo, J.A.; Cechinel-Filho, V.; Schlemper, V. Antioedematogenic effect of marrubiin obtained from Marrubium vulgare. J. Ethnopharmacol. 2006, 108, 379–384. [Google Scholar] [CrossRef] [PubMed]
- Mnonopi, N.; Levendal, R.A.; Davies-Coleman, R.T.; Frost, C.L. The cardioprotective effects of marrubiin, a diterpenoid found in Leonotis leonurus extracts. J. Ethnopharmacol. 2011, 138, 67–75. [Google Scholar] [CrossRef] [PubMed]
- Zaabat, N.; Hay, A.; Michalet, S.; Darbour, N.; Bayet, C.; Skandrani, I.; Chekir-Ghedira, L.; Akkal, S.; Dijoux-Franca, M. Antioxidant and antigenotoxic properties of compounds isolated from Marrubium deserti de Noé. Food Chem. Toxicol. 2011, 49, 3328–3335. [Google Scholar] [CrossRef]
- Paula de Oliveira, A.; Santin, J.R.; Lemos, M.; Klein Júnior, L.C.; Couto, A.G. Gastroprotective activity of methanol extract and marrubiin obtained from leaves of Marrubium vulgare L. (Lamiaceae). J. Pharm. Pharmacol. 2011, 63, 1230–1237. [Google Scholar] [CrossRef] [PubMed]
- Meyre-Silva CYunes, R.A.; Schlemper, V.; Campos-Buzzi, F. Analgesic potential of marrubiin derivatives, a bioactive diterpene present in Marrubium vulgare (Lamiaceae). II Farm. 2005, 60, 321–326. [Google Scholar] [CrossRef]
- El Bardai, S.; Morel, N.; Wibo, M.; Fabre, N.; Llabres, G.; Lyoussi, B.; Quetin-Leclercq, J. The Vasorelaxant Activity of Marrubenol and Marrubiin from Marrubium vulgare. Planta Med. 2003, 69, 75–77. [Google Scholar] [CrossRef]
- Nidhi, S.G.; Valecha, R.; Shukla, G.; Kaushik, D.; Rahman, M.A.; Gautam, R.K.; Madan, K.; Mittal, V.; Singla, R.K. Neurobehavioral and biochemical evidences in support of protective effect of Marrubiin (furan labdane diterpene) from Marrubium vulgare Linn. and its extracts after traumatic brain injury in experimental mice. Evid.-Based Complement. Altern. Med. 2022, 2022, 4457973. [Google Scholar] [CrossRef]
- Hussain, J.; Rehman, N.; Al-Harrasi, A.; Ali, L.; Ullah, R.; Mabood, F.; Hussain, H.; Ismail, M. Nutritional prospects and mineral compositions of selected vegetables from Dhoda Sharif-Kohat. J. Med. Plants Res. 2011, 5, 6509–6514. [Google Scholar]
- Mnonopi, N.; Levendal, R.A.; Mzilikezi, N.; Frost, C.L. Marrubiin, a constituent of Leonotus leonurus, alleviates diabetic symptoms. Phytomedicine 2012, 19, 488–493. [Google Scholar] [CrossRef]
- Marrelli, M.; Conforti, F.; Rigano, D.; Formisano, C.; Bruno, M.; Senatore, F.; Menichini, F. Cytotoxic properties of Marrubium globosum ssp. libanoticum and its bioactive components. Nat. Prod. Commun. 2013, 8, 567–569. [Google Scholar] [CrossRef]
- Liu, H.; He, X.-Z.; Feng, M.-Y.; Zeng, Y.; Rauwolf, T.J.; Shao, L.-D.; Ni, W.; Yan, H.; Porco, J.A., Jr.; Hao, X.-J.; et al. Acylphloroglucinols with acetylcholinesterase inhibitory effects from the fruits of Eucalyptus robusta. Bioorg. Chem. 2020, 103, 104127. [Google Scholar] [CrossRef] [PubMed]
- Chapla, V.M.; Honório, A.E.; Gubiani, J.R.; Vilela, A.F.L.; Younge, M.C.M.; Cardosod, C.L.; Pavan, F.R.; Cicarelli, R.M.; Ferreira, P.M.P.; Bolzani, V.d.S.; et al. Acetylcholinesterase inhibition and antifungal activity of cyclohexanoids from the endophytic fungus Saccharicola sp. Phytochem. Lett. 2020, 39, 116–123. [Google Scholar] [CrossRef]
- López, A.F.F.; Martínez, O.M.M.; Hernández, H.F.C. Evaluation of Amaryllidaceae alkaloids as inhibitors of human acetylcholinesterase by QSAR analysis and molecular docking. J. Mol. Struct. 2021, 1225, 129142. [Google Scholar] [CrossRef]
- Tuzimski, T.; Petruczynik, A. Determination of anti-Alzheimer’s disease activity of selected plant ingredients. Molecules 2022, 27, 3222. [Google Scholar] [CrossRef] [PubMed]
- Ahmed, S.; Khan, S.T.; Zargaham, M.K.; Khan, A.U.; Khan, S.; Hussain, A.; Uddin, J.; Khan, A.; Al-Harrasi, A. Potential therapeutic natural products against Alzheimer’s disease with Reference of Acetylcholinesterase. Biomed. Pharmacother. 2021, 139, 111609. [Google Scholar] [CrossRef]
- Abbas-Mohammadi, M.; Farimani, M.M.; Salehia, P.; Ebrahimi, S.N.; Sonboli, A.; Kelso, C.; Skropeta, D. Acetylcholinesterase-inhibitory activity of Iranian plants: Combined HPLC/bioassay-guided fractionation, molecular networking and docking strategies for the dereplication of active compounds. J. Pharm. Biomed. Anal. 2018, 158, 471–479. [Google Scholar] [CrossRef]
- Abdelhameed, R.F.A.; Ali, A.I.; Elhady, S.S.; Abo Mansour, H.E.; Mehanna, E.T.; Mosaad, S.M.; Ibrahim, S.A.; Hareeri, R.H.; Badr, J.M.; Eltahawy, N.A. Marrubium alysson L. Ameliorated Methotrexate-Induced Testicular Damage in Mice through Regulation of Apoptosis and miRNA-29a Expression: LC-MS/MS Metabolic Profiling. Plants 2022, 11, 2309. [Google Scholar] [CrossRef]
- Kotb, S.S.; Ayoub, I.M.; Elmoghazy, S.; Singab, A.N.B. Profiling the lipophilic fractions of Pithecellobium dulce bark and leaves using GC/MS and evaluation of their antioxidant, antimicrobial, and cytotoxic activities. Chem. Biodivers. 2020, 17, e2000048. [Google Scholar] [CrossRef]
- Adams, R.P. Identification of Essential Oil Components by Gas Chromatography/Quadrupole Mass Spectroscopy; Allured Publishing Corporation: Carol Stream, IL, USA, 2004. [Google Scholar]
- Suzuki, T.; Miyoshi, M.; Nakagawa, K.; Suemori, H.; Chuma, S.; Nakatsuji, N. Determination of Fatty-acid Composition of Lipids in Human Embryonic Stem Cells Using GC-MS. Shimadzu Tech. Rep. 2013, 146, 1–4. [Google Scholar]
- Fathy, S.A.; Ibrahim, A.K.; Eltamany, E.E.; Badr, J.M. A Developed High-Performance Thin-Layer Chromatographic Method for the Determination of Orlistat in Pharmaceutical Preparations. J. Planar Chromatogr. 2019, 32, 329–334. [Google Scholar] [CrossRef]
- Ellman, G.L.; Courtney, K.D.; Andres, V., Jr.; Featherstone, R.M. A new and rapid colorimetric determination of acetylcholinesterase activity. Biochem. Pharmacol. 1961, 7, 88–95. [Google Scholar] [CrossRef] [PubMed]
- Osman, H.; Kumar, R.S.; Basiri, A.; Murugaiyah, V. Ionic liquid mediated synthesis of mono- and bis-spirooxindole-hexahydropyrrolidines as cholinesterase inhibitors and their molecular docking studies. Bioorganic Med. Chem. 2014, 22, 1318–1328. [Google Scholar]
- Nafie, M.S.; Tantawy, M.A.; Elmgeed, G.A. Screening of different drug design tools to predict the mode of action of steroidal derivatives as anti-cancer agents. Steroids 2019, 152, 108485. [Google Scholar] [CrossRef] [PubMed]
- Kishk, S.M.; Kishk, R.M.; Yassen, A.S.A.; Nafie, M.S.; Nemr, N.A.; ElMasry, G.; Al-Rejaie, S.; Simons, C. Molecular Insights into Human Transmembrane Protease Serine-2 (TMPS2) Inhibitors against SARS-CoV2: Homology Modelling, Molecular Dynamics, and Docking Studies. Molecules 2020, 25, 5007. [Google Scholar] [CrossRef] [PubMed]
- Ravi, L.; Krishnan, K. Cytotoxic potential of n-hexadecanoic acid extracted from Kigelia pinnata leaves. Asian J. Cell Biol. 2016, 12, 20–27. [Google Scholar] [CrossRef]
- Librán-Pérez, M.; Pereiro, P.; Figueras, A.; Novoa, B. Antiviral activity of palmitic acid via autophagic flux inhibition in zebrafish (Danio rerio). Fish Shellfish. Immunol. 2019, 95, 595–605. [Google Scholar]
- Swantara, M.D.; Rita, W.S.; Suartha, N.; Agustina, K.K. Anticancer activities of toxic isolate of Xestospongia testudinaria sponge. Vet. World 2019, 12, 1434–1440. [Google Scholar] [CrossRef]
- Wei, L.S.; Wee, W. Characterization of antimicrobial, antioxidant, anticancer properties and chemical composition of Malaysian Andrographis paniculata leaf extract. Pharmacologyonline 2011, 2, 996–1002. [Google Scholar]
- Islam, M.T.; Ali, E.S.; Uddin, S.J.; Shaw, S.; Islam, M.A.; Ahmed, M.I.; Chandra Shill, M.; Karmakar, U.K.; Yarla, N.S.; Khan, I.N.; et al. Phytol: A review of biomedical activities. Food Chem. Toxicol. 2018, 121, 82–94. [Google Scholar] [CrossRef]
- Ramasamy, A.; Anandakumar, K.; Kathiresan, K. In-vitro antioxidant potential and acetylcholinesterase inhibitory effect of Ficus benghalensis aerial root extract. Afr. Health Sci. 2022, 22, 291–299. [Google Scholar] [CrossRef] [PubMed]
- Kılıç, Ö. Fatty acid and essential oil composition of Marrubium parviflorum subsp. parviflorum plant. Mus Alparslan Univ. J. Sci. 2018, 6, 487–491. [Google Scholar]
- Hamed, A.N.E.; Abdelaty, N.A.; Attia, E.Z.; Desoukey, S.Y. Phytochemical investigation of saponifiable matter & volatile oils and antibacterial activity of Moluccella laevis L., family Lamiaceae (Labiatae). J. Adv. Biomed. Pharm. Sci. 2020, 3, 213–220. [Google Scholar]
- Stark, A.H.; Crawford, M.A.; Reifen, R. Update on alpha-linolenic acid. Nutr. Rev. 2008, 66, 326–332. [Google Scholar] [CrossRef]
- Harada, H.; Yamashita, U.; Kurihara, H.; Fukushi, E.; Kawabata, J.; Kamei, Y. Antitumor activity of palmitic acid found as a selective cytotoxic substance in a marine red alga. Anticancer. Res. 2002, 22, 2587–2590. [Google Scholar]
- Grassia, A.; Senatore, F.; Arnold, N.A.; Bruno, M.; Piozzi, F.; Rigano, D.; Formisano, C. Chemical composition and antimicrobial activity of the essential oils from aerial parts of two Marrubium sp. (Lamiaceae) growing wild in Lebanon. Polish J. Chem. 2006, 80, 623–628. [Google Scholar]
- Aebisher, D.; Cichonski, J.; Szpyrka, E.; Masjonis, S.; Chrzanowski, G. Essential Oils of Seven Lamiaceae Plants and Their Antioxidant Capacity. Molecules 2021, 26, 3793. [Google Scholar] [CrossRef]
- Fidan, H.; Stankov, S.; Ivanova, T.; Stoyanova, A.; Damyanova, S.; Ercisli, S. Characterization of aromatic compounds and antimicrobial properties of four spice essential oils from family Lamiaceae. Ukr. Food J. 2019, 8, 227–238. [Google Scholar] [CrossRef]
- Santos, C.C.M.P.; Salvadori, M.S.; Mota, V.G.; Costa, L.M.; Almeida, A.A.C.O. Antinociceptive and antioxidant activities of phytol in vivo and in vitro models. Neurosci J. 2013, 2013, 949452. [Google Scholar] [CrossRef]
- Ryu, K.R.; Choi, J.Y.; Chung, S.; Kim, D.H. Anti-scratching behavioral effect of the essential oil and phytol isolated from Artemisia princeps Pamp. in mice. Planta Med. 2011, 77, 22–26. [Google Scholar] [CrossRef]
- Lim, S.Y.; Meyer, M.; Kjonaas, R.A.; Ghosh, S.K. Phytol-based novel adjuvants in vaccine formulation: 1. assessment of safety and efficacy during stimulation of humoral and cell-mediated immune responses. J. Immune Based Ther. Vaccines 2006, 4, 6. [Google Scholar] [CrossRef] [PubMed]
- Moraes, M.; Oliveira, R.N.; Costa, J.P.; Junior, A.L.G.; Sousa, D.P.; Freitas, R.M.; Allegretti, S.M.; Pinto, P.L.S. Phytol, a Diterpene Alcohol from Chlorophyll, as a Drug against Neglected Tropical Disease Schistosomiasis. PLoS Neglected Trop. Dis. 2014, 8, 2617–2628. [Google Scholar] [CrossRef] [PubMed]
- Benet, L.Z.; Hosey, C.M.; Ursu, O.; Oprea, T.I. BDDCS, the Rule of 5 and drugability. Adv. Drug Deliv. Rev. 2016, 101, 89–98. [Google Scholar] [CrossRef] [PubMed]


| Retention Time (min) | Retention Index | Name and Structure of Compound | Molecular Formula | Molecular Weight | ||
|---|---|---|---|---|---|---|
| (Cal.) | (Rep.)* | |||||
| 1 | 28.960 | 1688 | 1688 |  2-Propenoic acid, 3-(4-hydroxyphenyl)-, methyl ester | C10H10O3 | 178.1 |
| 2 | 29.275 | 1726 | 1727 |  Methyl tetradecanoate (Tetradecanoic acid, methyl ester) (Myristic acid, methyl ester) | C15H30O2 | 242.3 |
| 3 | 33.625 | 1926 | 1928 |  Hexadecanoic acid, methyl ester (Palmitic acid, methyl ester) | C17H34O2 | 270.4 |
| 4 | 36.840 | 2089 | 2093 |  9,12-Octadecadienoic acid (Z,Z)-, methyl ester (Linoleic acid, methyl ester) | C19H34O2 | 294.4 |
| 5 | 36.920 | 2098 | 2100 |  9,12,15-Octadecatrienoic acid, methyl ester, (Z,Z,Z)- (Linolenic acid, methyl ester) | C19H32O2 | 292.4 |
| 6 | 37.005 | 2110 | 2110 |  9-Octadecenoic acid, methyl ester, (E)- (Elaidic acid, methyl ester) | C19H36O2 | 296.4 |
| 7 | 37.560 | 2126 | 2128 |  Methyl stearate (Octadecanoic acid, methyl ester) | C19H38O2 | 298.5 |
| 8 | 41.175 | 2324 | 2324 |  Eicosanoic acid, methyl ester (Methyl arachisate) | C21H42O2 | 326.5 |
| 9 | 44.505 | 2524 | 2527 |  Behenic acid, methyl ester (Methyl behenate) | C23H46O2 | 354.6 |
| Retention Time (min) | Retention Index | Name and Structure of Compound | Molecular Formula | Molecular Weight | ||
|---|---|---|---|---|---|---|
| (Cal.) | (Rep.)* | |||||
| 1 | 24.045 | 1512 | 1511 |  Butylated Hydroxytoluene | C15H24O | 220.3 |
| 2 | 31.940 | 1846 | 1845 |  2-Pentadecanone, 6,10,14-trimethyl- | C18H36O | 268.4 |
| 3 | 34.260 | 1984 | 1978 |  n-Hexadecanoic acid | C16H32O2 | 256.4 |
| 4 | 37.350 | 2148 | 2145 |  Phytol | C20H40O | 296.5 |
| 5 | 37.535 | 2162 | 2159 |  9,12,15-Octadecatrienoic acid, (Z,Z,Z), (Linolenic acid) | C18H30O2 | 278.4 |
| 6 | 39.230 | 2231 | nd |  1a,2,5,5-Tetramethyl-cis-1a,4a,5,6,7,8-hexahydro-gamma-chromene | C13H22O | 194.3 |
| 7 | 54.300 | 3238 | nd |  Card-20(22)-enolide, 3,5,14,19-tetrahydroxy-, (3.ß.,5.ß.) | C23H34O6 | 406.5 |
| Sample ID | IC50 | SD |
|---|---|---|
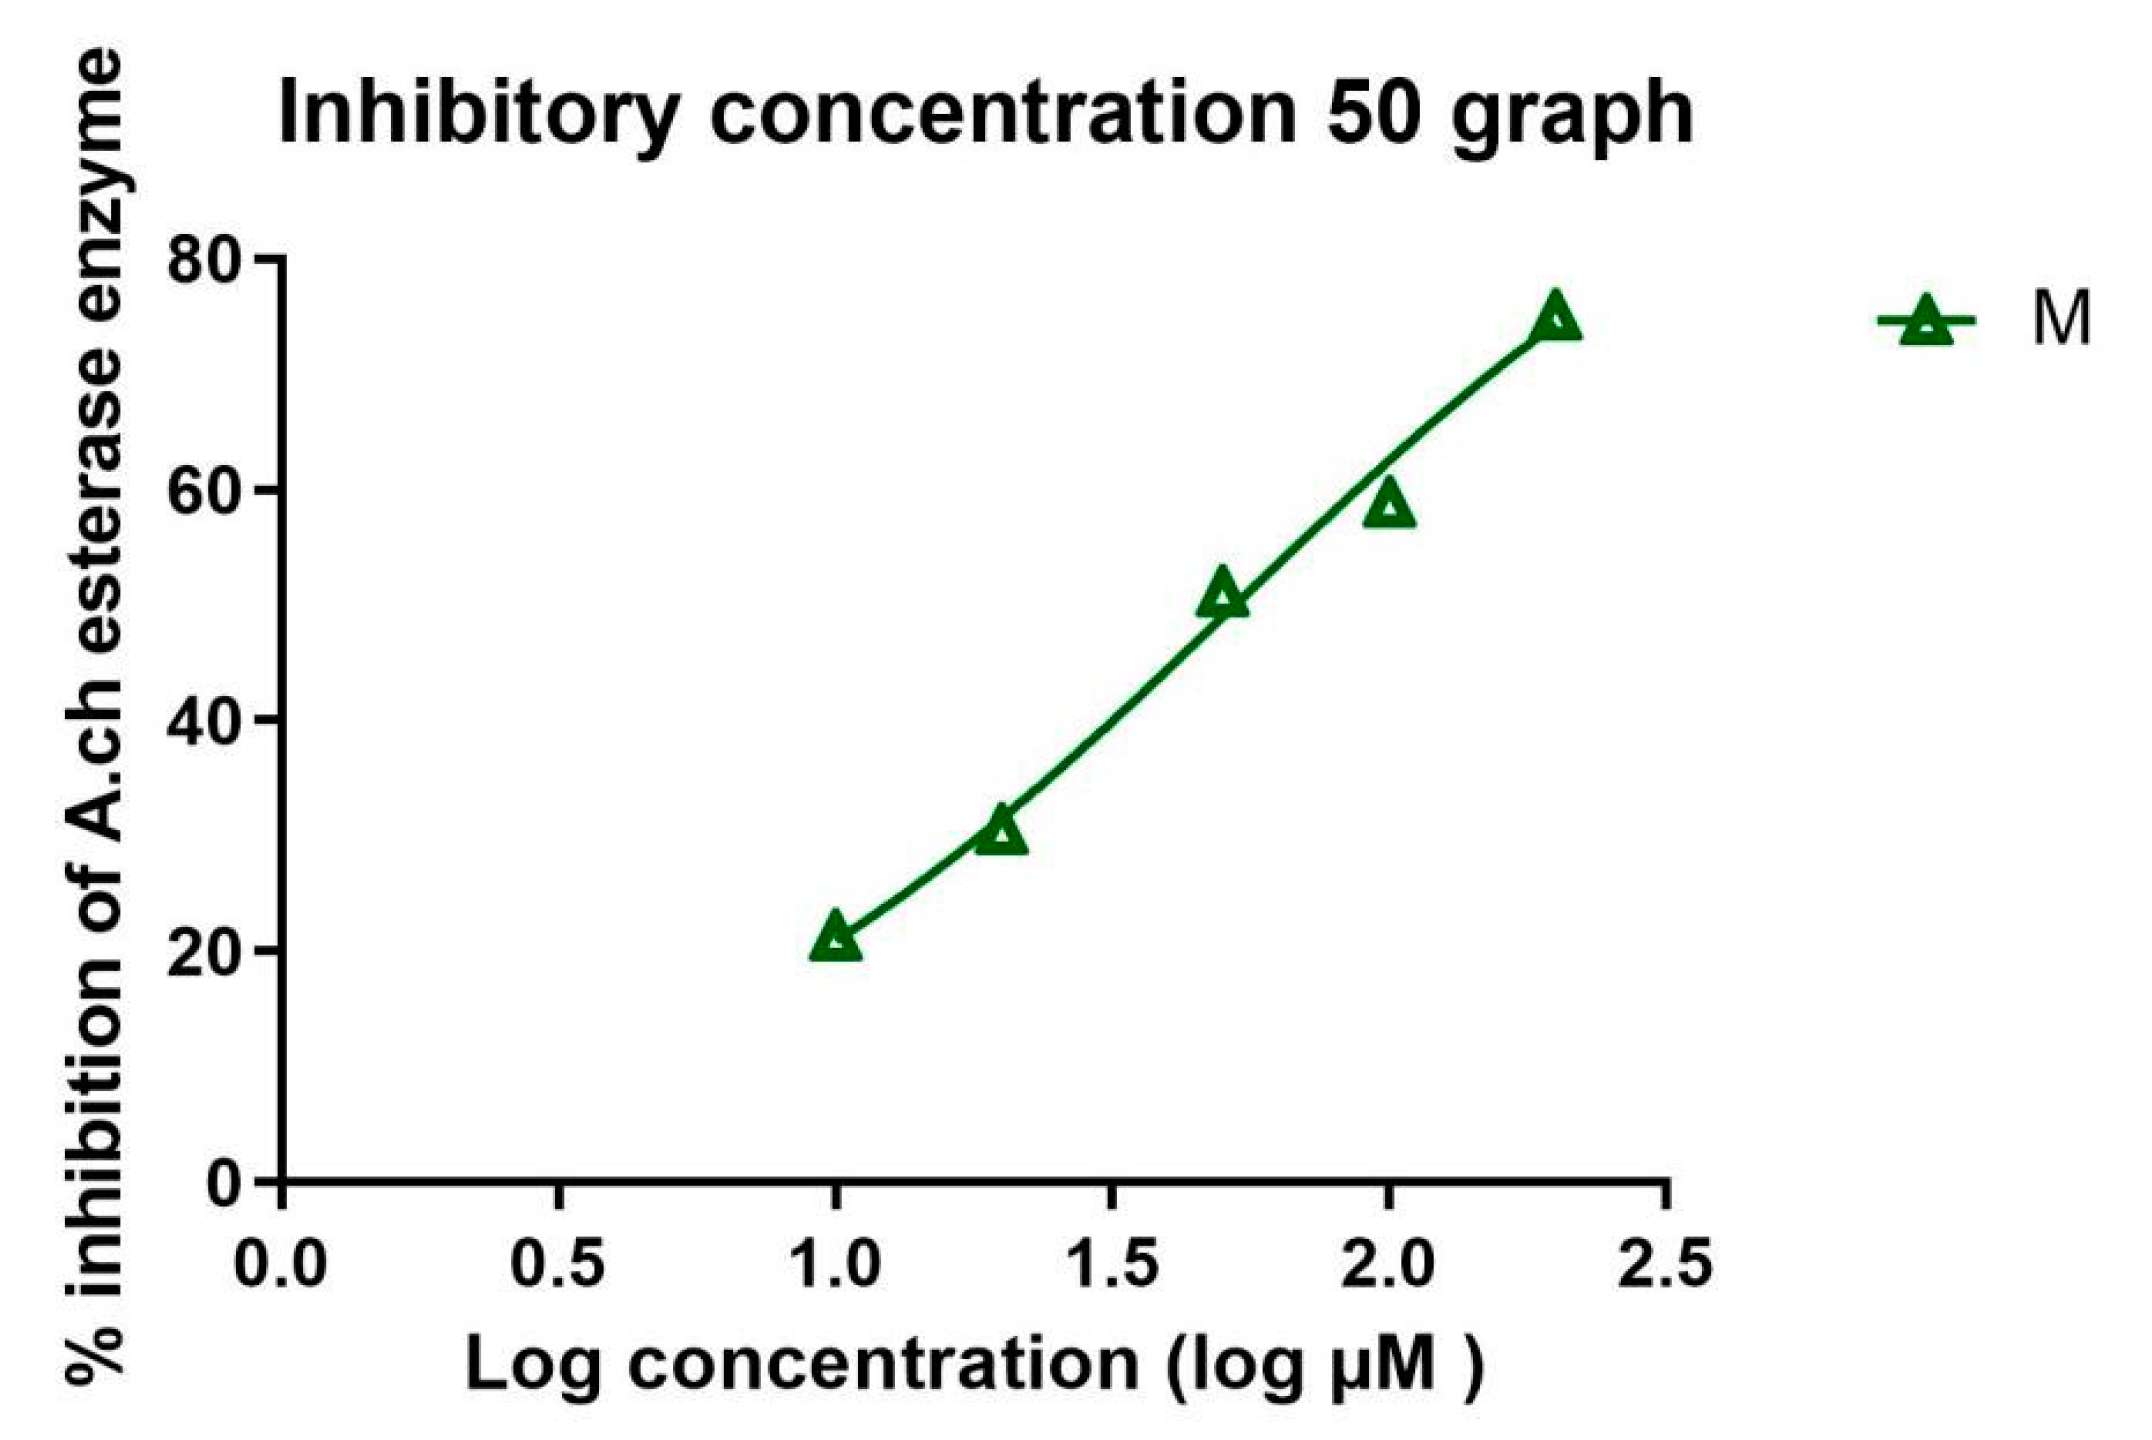
| Crude methanolic extract | 89.31 (µg/mL) | 7.27 |
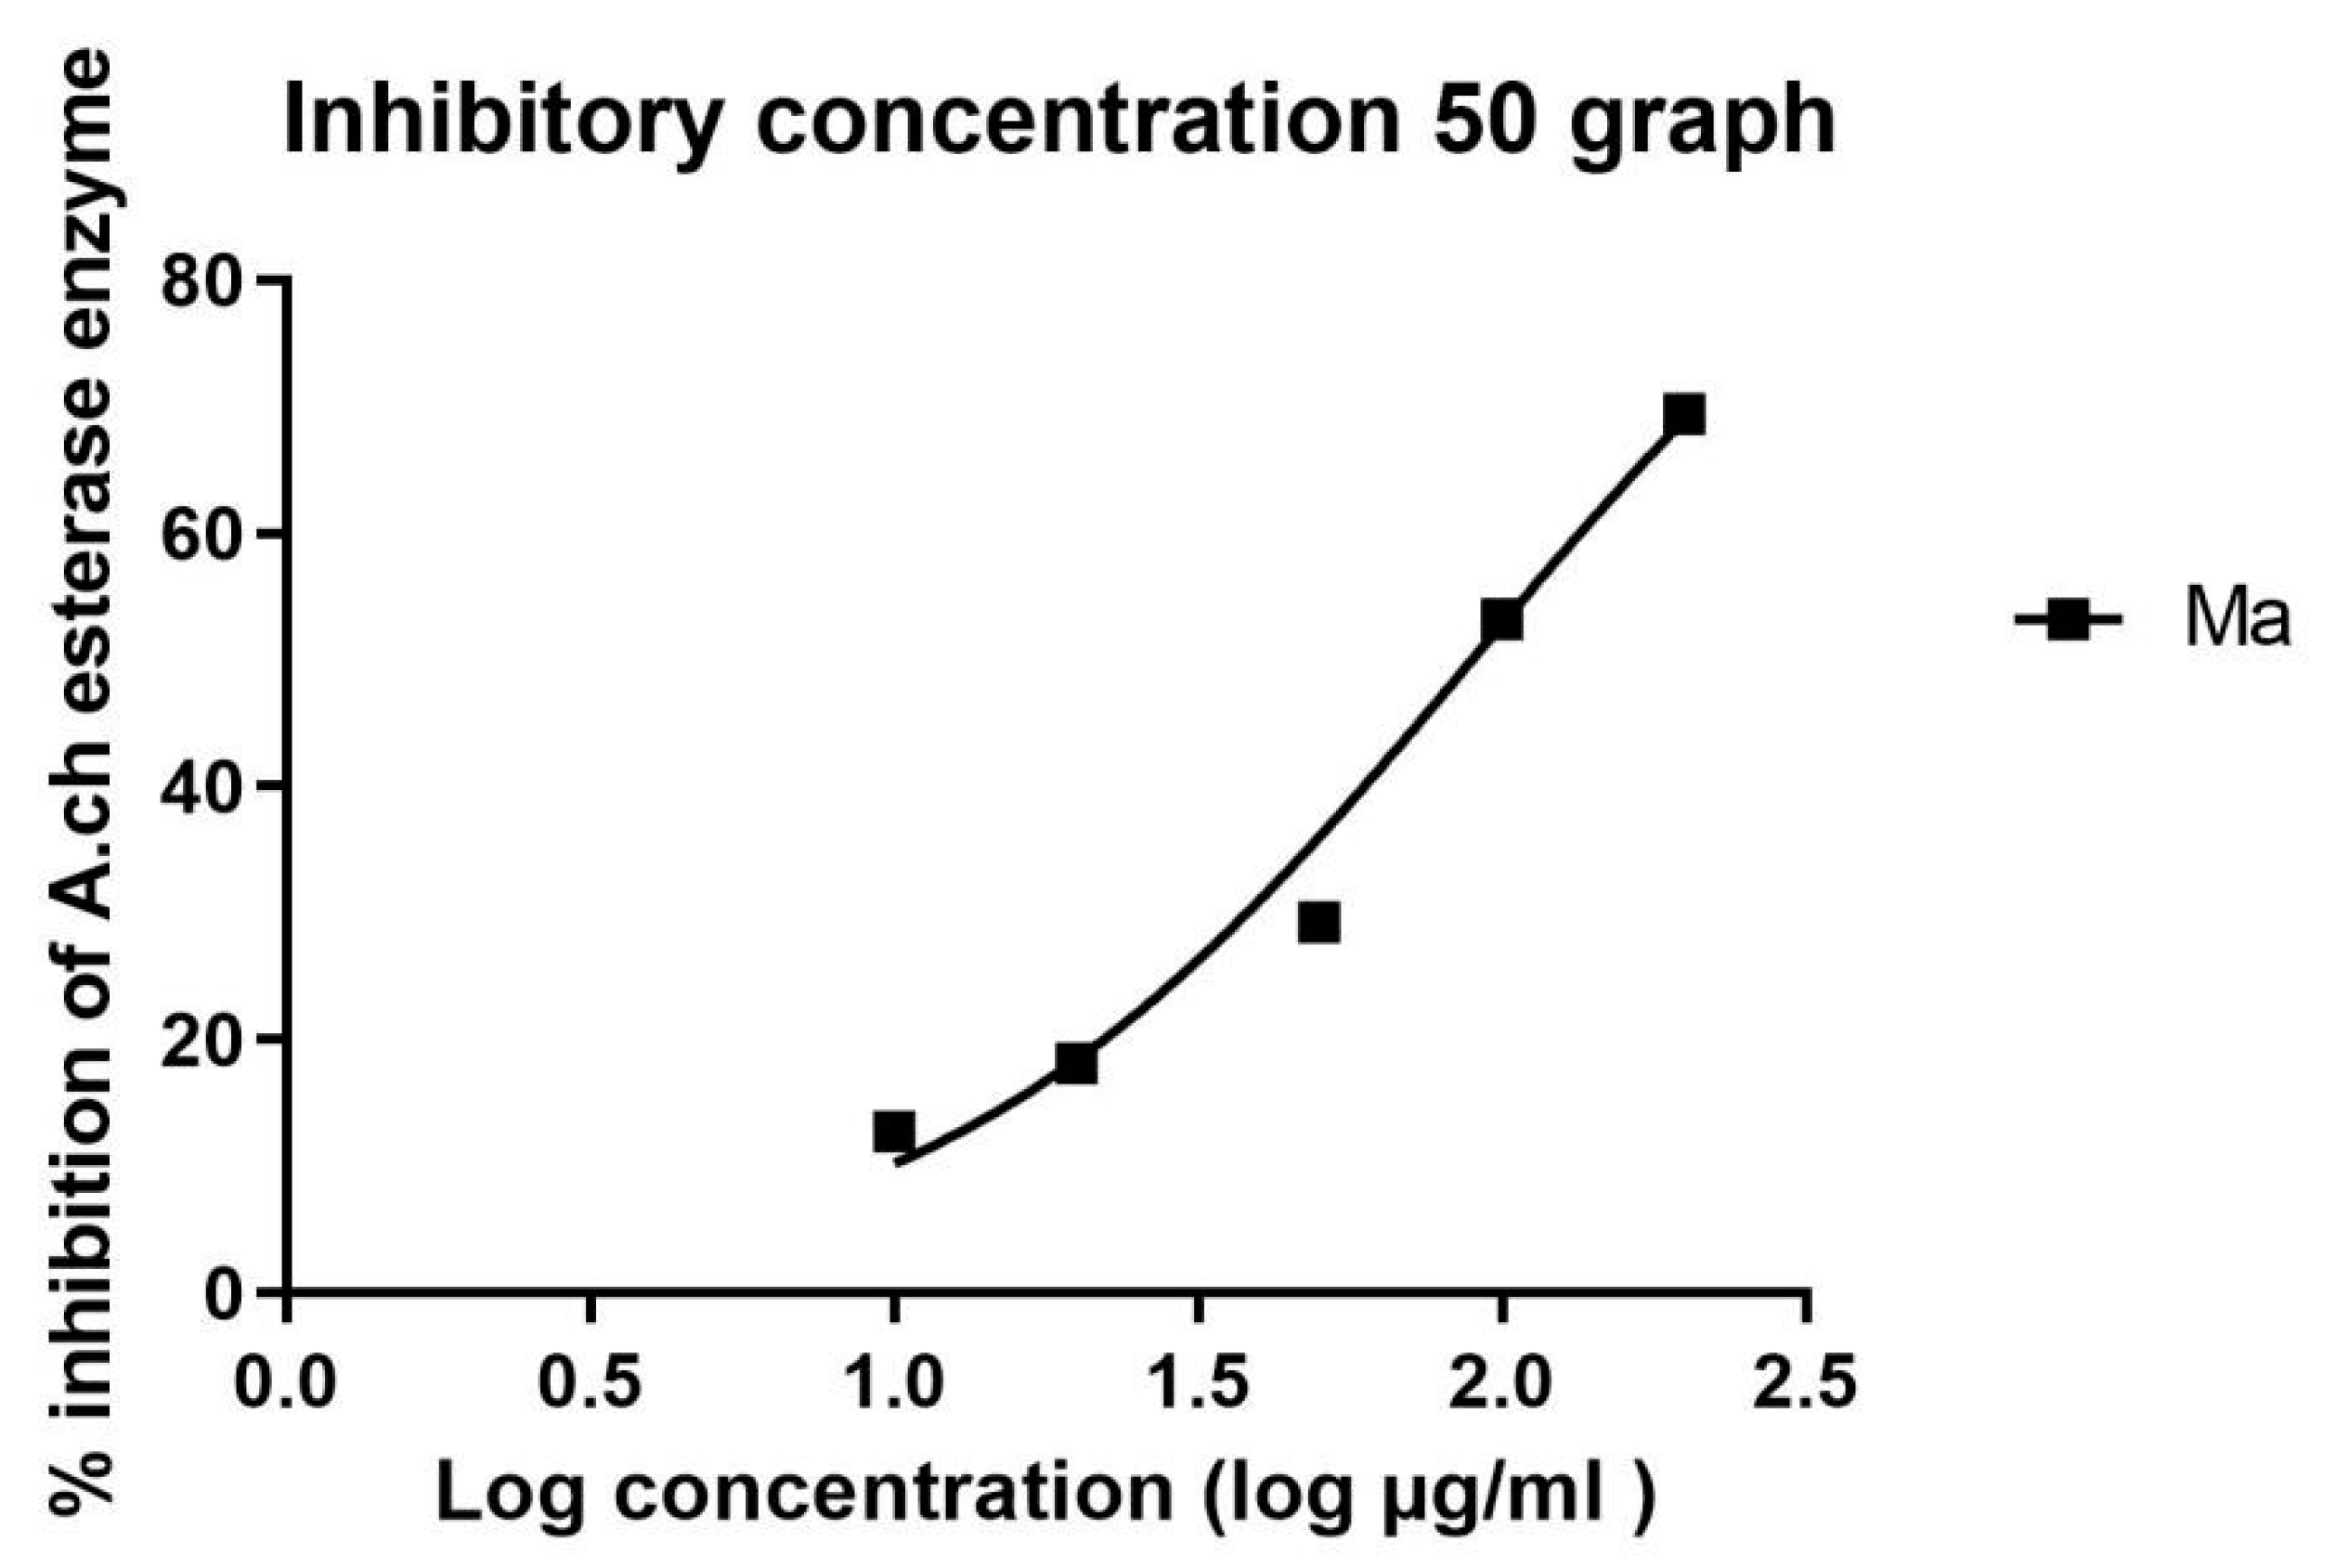
| Non-polar fraction | 102.2 (µg/mL) | 7.60 |
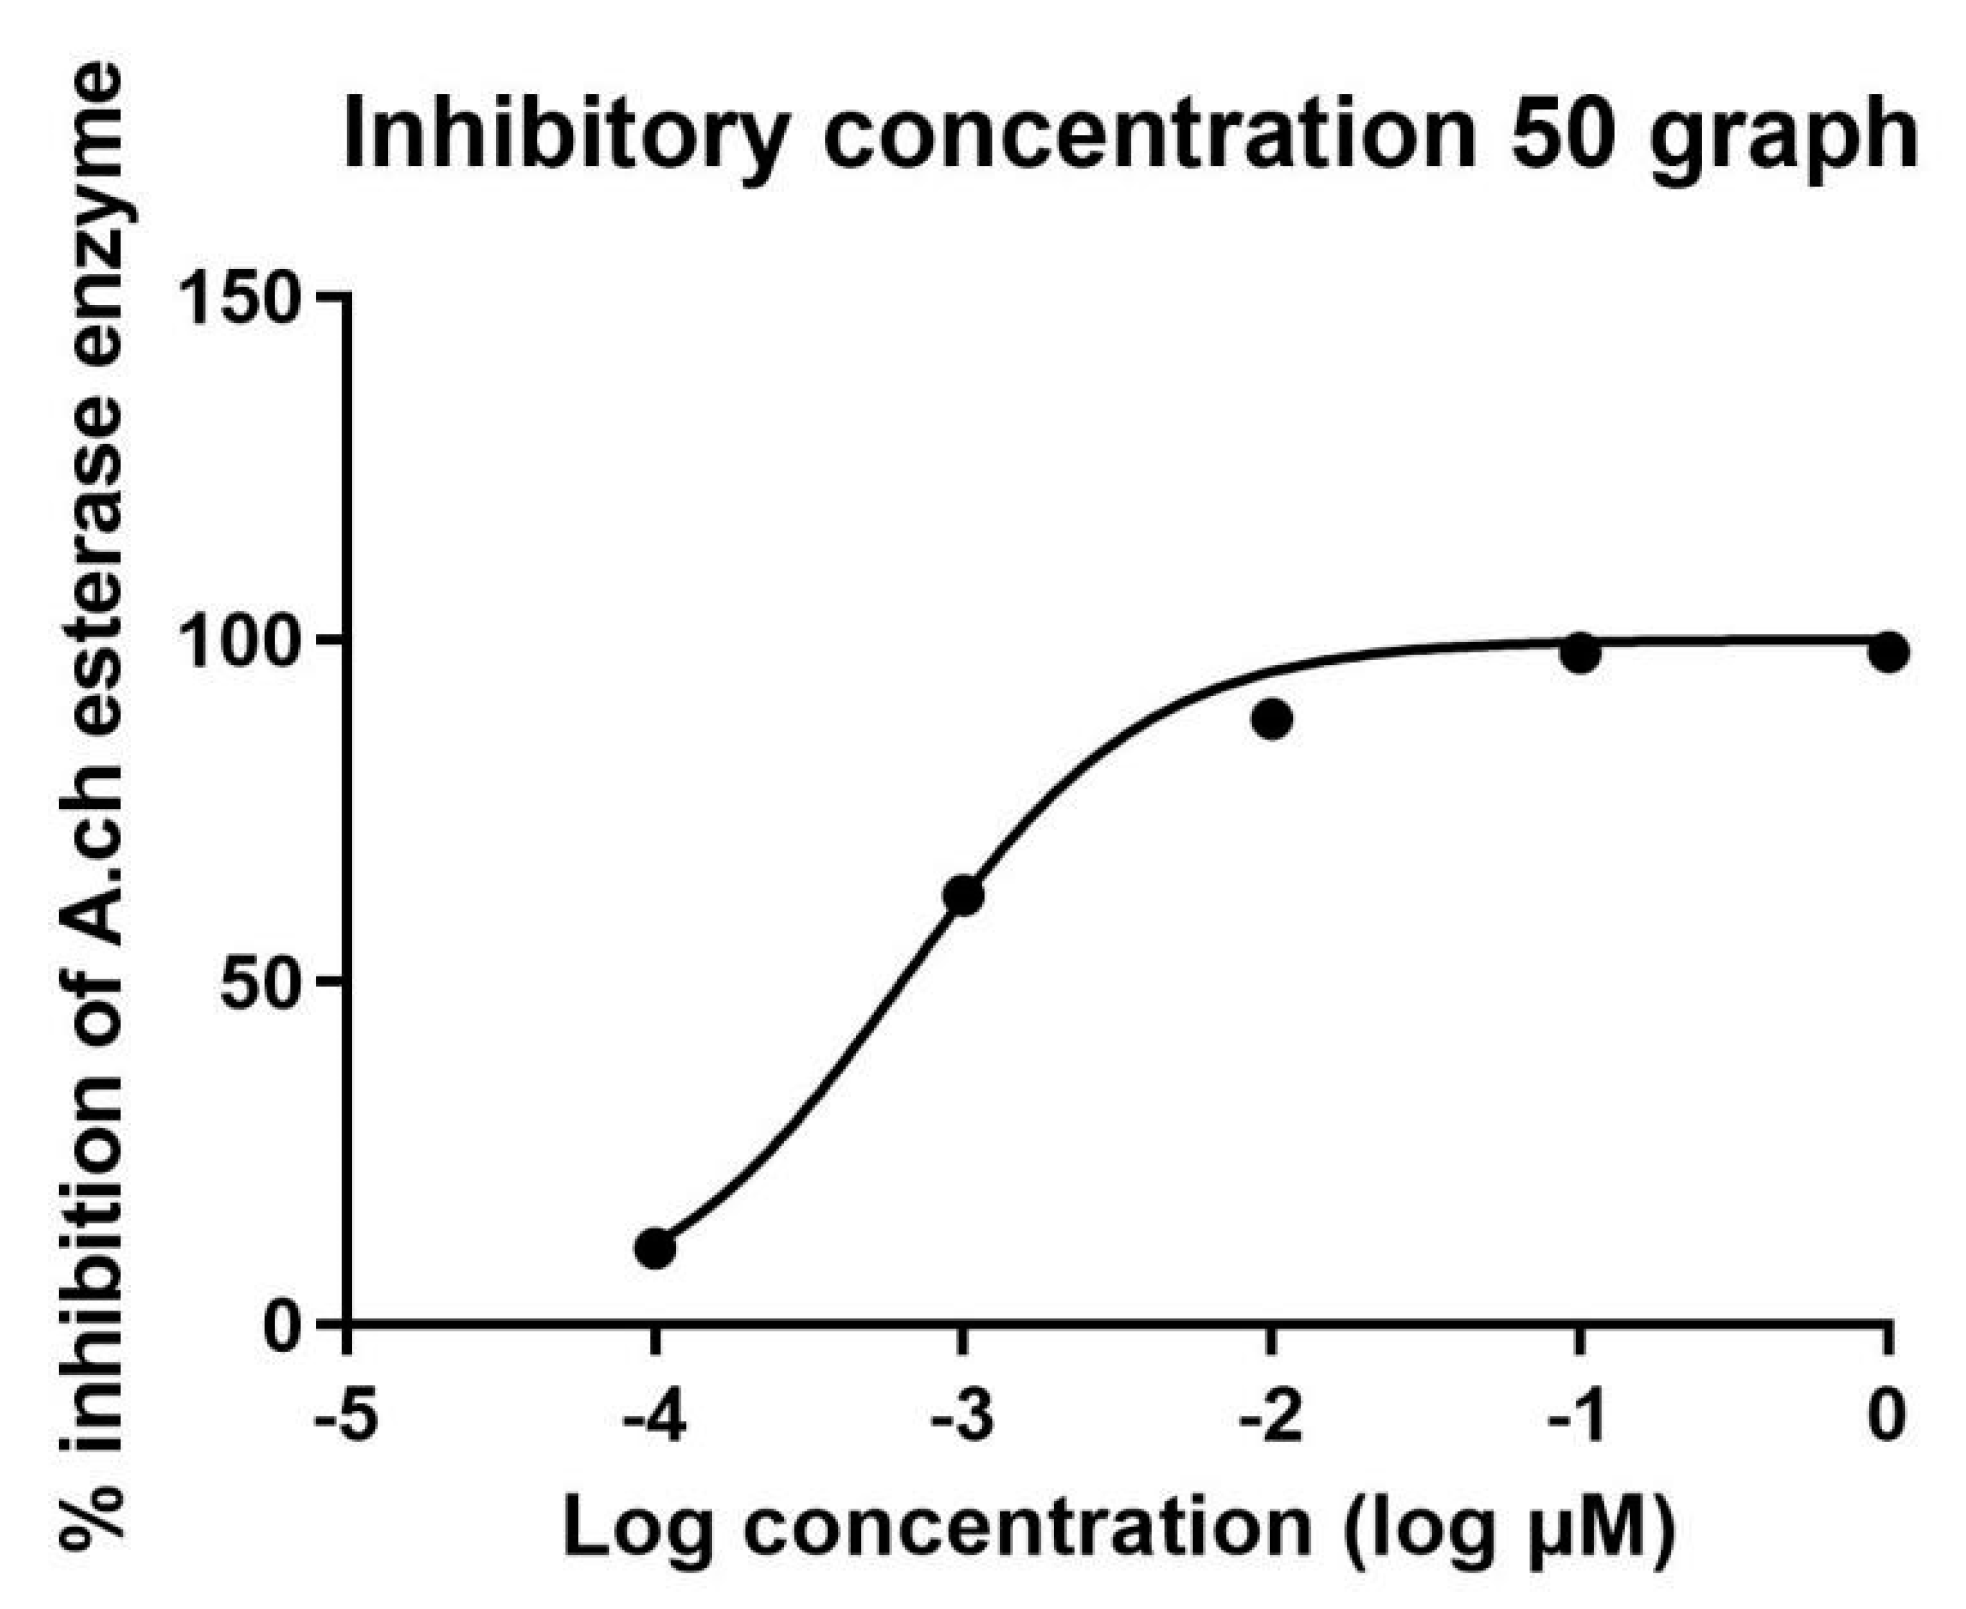
| Marrubiin | 52.66 (µM) | 5.66 |
| Crude Methanolic Extract | |||||
|---|---|---|---|---|---|
| Conc (µg/mL) | 10 | 20 | 50 | 100 | 200 |
| % Inhibition | 13.23683 | 18.94838 | 28.40949 | 49.33729 | 71.74747 |
| 12.41716 | 16.5068 | 33.46704 | 52.82525 | 64.07394 | |
| 12.62644 | 19.12278 | 26.05511 | 57.53401 | 72.61946 | |
| Av. Inhibition | 12.76014 | 18.19265 | 29.31055 | 53.23218 | 69.48029 |
| Marrubiin | |||||
| % Inhibition | 20.29795 | 37.5789 | 51.6946 | 56.98324 | 77.43017 |
| 22.97952 | 25.81006 | 47.89572 | 60.18622 | 74.97207 | |
| 20.74488 | 27.07635 | 53.85475 | 61.97393 | 78.24953 | |
| Av. Inhibition | 21.34078 | 30.1551 | 51.14836 | 59.71446 | 76.88392 |
| Non-Polar Fraction | |||||
| % Inhibition | 21.25916 | 33.03104 | 37.34253 | 47.5061 | 62.63516 |
| 18.38158 | 28.23509 | 34.77503 | 42.88455 | 64.29194 | |
| 22.91594 | 31.98465 | 39.57098 | 45.13463 | 64.98954 | |
| Av. Inhibition | 20.85223 | 31.08359 | 37.173 | 45.17509 | 64.4489 |
| Name | Binding Energy (Kcal/mol) | Ligand–Receptor Interactions |
|---|---|---|
| Co-crystallized ligand | −18.6 | 1 H-bond with Tyr 124 Van der Waals forces with Trp 286 and Tyr 341 |
| Marrubiin | −19.34 | 1 H-bond with Tyr 124 Van der Waals forces with Tyr 341 and Trp 286 |
Disclaimer/Publisher’s Note: The statements, opinions and data contained in all publications are solely those of the individual author(s) and contributor(s) and not of MDPI and/or the editor(s). MDPI and/or the editor(s) disclaim responsibility for any injury to people or property resulting from any ideas, methods, instructions or products referred to in the content. |
© 2023 by the authors. Licensee MDPI, Basel, Switzerland. This article is an open access article distributed under the terms and conditions of the Creative Commons Attribution (CC BY) license (https://creativecommons.org/licenses/by/4.0/).
Share and Cite
Eltahawy, N.A.; Ali, A.I.; Ibrahim, S.A.; Nafie, M.S.; Sindi, A.M.; Alkharobi, H.; Almalki, A.J.; Badr, J.M.; Elhady, S.S.; Abdelhameed, R.F.A. Analysis of Marrubiin in Marrubium alysson L. Extract Using Advanced HPTLC: Chemical Profiling, Acetylcholinesterase Inhibitory Activity, and Molecular Docking. Metabolites 2024, 14, 27. https://doi.org/10.3390/metabo14010027
Eltahawy NA, Ali AI, Ibrahim SA, Nafie MS, Sindi AM, Alkharobi H, Almalki AJ, Badr JM, Elhady SS, Abdelhameed RFA. Analysis of Marrubiin in Marrubium alysson L. Extract Using Advanced HPTLC: Chemical Profiling, Acetylcholinesterase Inhibitory Activity, and Molecular Docking. Metabolites. 2024; 14(1):27. https://doi.org/10.3390/metabo14010027
Chicago/Turabian StyleEltahawy, Nermeen A., Asmaa I. Ali, Salma A. Ibrahim, Mohamed S. Nafie, Amal M. Sindi, Hanaa Alkharobi, Ahmad J. Almalki, Jihan M. Badr, Sameh S. Elhady, and Reda F. A. Abdelhameed. 2024. "Analysis of Marrubiin in Marrubium alysson L. Extract Using Advanced HPTLC: Chemical Profiling, Acetylcholinesterase Inhibitory Activity, and Molecular Docking" Metabolites 14, no. 1: 27. https://doi.org/10.3390/metabo14010027