


DBoTPM: A Deep Neural Network-Based Botnet Prediction Model

Department of Computer Science, College of Computer and Information Sciences, Majmaah University, Al-Majma’ah 11952, Saudi Arabia
Electronics 2023, 12(5), 1159; https://doi.org/10.3390/electronics12051159
Submission received: 3 January 2023
/
Revised: 19 February 2023
/
Accepted: 20 February 2023
/
Published: 27 February 2023
(This article belongs to the Special Issue Artificial Intelligence Technologies and Applications)
Abstract
:Internet of things (IoT) devices’ evolution and growth have boosted system efficiency, reduced human labour, and improved operational efficiency; however, IoT devices pose substantial security and privacy risks, making them highly vulnerable to botnet attacks. Botnet attacks are capable of degrading the performance of an IoT system in a way that makes it difficult for IoT network users to identify them. Earlier studies mainly focused on the detection of IoT botnets, and there was a gap in predicting the botnet attack due to their complex behaviour, repetitive nature, uncertainty, and almost invisible presence in the compromised system. Based on the gaps, it is highly required to develop efficient and stable AI models that can reliably predict botnet attacks. The current study developed and implemented DBoTPM, a novel deep-neural-network-based model for botnet prediction. The DBoTPM was optimized for performance and less computational overhead by utilizing rigorous hyperparameter tuning. The consequences of overfitting and underfitting were mitigated through dropouts. The evaluation of the DBoTPM demonstrated that it is one of the most accurate and efficient models for botnet prediction. This investigation is unique in that it makes use of two real datasets to detect and predict botnet attacks with efficient performance and faster response. The results achieved through the DBoTPM model were assessed against prior research and found to be highly effective at predicting botnet attacks with a real dataset.
1. Introduction
IoT infrastructure and its implementations have grown exponentially in recent years as communication efficiency has improved, costs have decreased, and demand has increased. IoT devices have been developed and deployed in a variety of industries, including smart living, intelligent security, real-time data acquisition; logistics, smart agriculture, etc. [1,2]. The number of smart sensory gadgets capable of automated communication on the internet has increased significantly over recent years. By 2050, it is expected to reach approximately 30 billion [2]. However, the tremendous growth in the number of IoT devices and their global presence has created a chance for hackers to exploit the IoT infrastructure’s security and privacy by utilizing irregular entities, such as botnets. The biggest threat to infrastructure security is botnet-based assaults, in which unauthorized users insert harmful code into IoT infrastructure.
Botnets can be categorized into two categories: firstly, traditional botnets, and secondly, IoT botnets. A traditional botnet consists of infected servers, computers, or personal computers, whereas an IoT botnet consists of malware-infected IoT devices, such as smart TVs, smartwatches, wearables, and cameras. This malware enables an attacker to take control of the devices and perform tasks similar to those performed by a traditional botnet. Botnet operators or herders can control infected machines through a covert channel or peer-to-peer communication [2]. There are various types of botnet attacks, including scan, DDoS, flooding (TCP, UDP and acknowledgement), and hybrid attacks [2].
2. Earlier Studies
Several studies have focused on botnet detection and classification. Autoencoder-based models were developed by [2] to detect and classify IoT botnet attacks. Ref. [3] used ANN for botnet detection and DDoS attacks. Ref. [4] used k-nearest neighbours (KNN) to identify IoT DDoS attacks and discovered that KNN provides better accuracy with low overhead due to its feature-reduction capability. Ref. [5] detected botnet attacks using a decision tree and observed that dimensionality reduction enhanced time complexity. Ref. [6] used a machine learning model to detect botnets using a honeypot strategy to analyse hacker behaviour by enticing an attacker to discover botnet attacks. Ref. [7] detected intrusion using a model with PCA.
Different algorithms, including BotHunter, CAMNEP, and BClus, were compared on normal vs. botnet traffic [8]. Binary classification was accomplished using the ANN technique [9]. Additionally, binary modelling for botnet and normal traffic was proposed by [10]. A decision-tree-based approach was utilized to detect a P2P botnet effectively (Khan et al., 2019). Ref. [11] detected the IoT botnet based on MQTT protocol. To identify Android malware, a deep-learning neural network was created that also makes use of a recurrent neural network [12].
Deep learning (DL) is very commonly employed in the cybersecurity field. Ref. [1] developed a PCNN model for IDS detection. Before deploying the CNN, PCA was used to reduce the size of the feature vector [1]. The BotShark approach based on convolutional neural networks (CNNs) was developed by [13]. The investigation by [14], employed a convolutional neural network (CNN) to extract valuable features for prediction analysis. Over time, researchers demonstrated that the bidirectional approach provides a superior model [15]. Additionally, there is a method for detecting botnets utilizing graph nodes. It clusters the characteristics using a SOM approach [16]. Additionally, some researchers employ transfer learning by integrating multiple botnet datasets [17]. Another study by [18] secured IoT fleet management with the deployment of a lightweight container-based botnet detection technology (C-BotDet). Reinforcement learning is utilized to classify packets as normal traffic or botnet attack using a real-world dataset [17]. Additionally, different feature selection approaches are performed on a botnet dataset, followed by the discovery of the optimal feature combination for binary classification [19]. Another study by [20], used graph-based features based on static analysis for botnet detection and classification and achieved accuracies of 98.1% and 91.99% for detecting and classifying botnets, respectively. The major issue for [20] was the implementation of the models on a very limited dataset of 8330 samples. One study from [21], used the K-means clustering technique as a feature selection with SVM, LR, and DT models for botnet detection. The accuracy achieved by [21] was good, at 99.99%, and their study displayed fast computational speed for the obvious reason of using the ML models with reduced features through K-means clustering; however, a single dataset was used, and hyperparameter tuning of the models was absent. The investigation by [22], used two approaches for botnet detection; the first approach used a sliding window approach to detect anomalies in network traffic, while the second approach was based on graphs to estimate the interaction of the nodes.
Botnet detection has been the subject of numerous studies. However, very limited research investigated botnet prediction due to their complex behaviour, repetitive nature, uncertainty, and almost invisible presence in the compromised system. Additionally, limited research has properly addressed the concerns of proper data preprocessing, overfitting, rigorous parameter optimization, and—most importantly—computational cost of the model to utilize these models in real time. To examine botnet detection, the present investigation used two real datasets. The novelty of the current study is to develop a novel deep neural network model, i.e., DBoTPM, to predict botnet attacks with the inclusion of two real datasets, systematic data pre-processing, rigorous hyperparameter optimization, overfitting prevention, and low computational overhead in order to make the current model usable in real-time applications.
3. Datasets
The present investigation used two datasets to model and predict the botnet attacks. The first dataset was the Context Computer Network Traffic (CCNT) dataset, which contains network traffic data with 20,803 records and ten local workstation IP addresses. The dataset spans three months between 2006-07-01 and 2006-09-30. During this time, half of these local IPs were hacked and became members of various botnets. There were four features in the first dataset: date, I_ipn, r_asn, and f. The date contains data records from 2006-07-01 to 2006-09-30. I_ipn stands for local IP address, which was coded as an integer from 0–9. The feature r_asn represents autonomous system number (ASN) from a remote location; it identifies the remote internet service provider (ISP) based on an integer value, e.g., 701 or 714. The count of connections for the day was represented by fluxes (f). This dataset was acquired from Stanford data and can be accessible at https://www.kaggle.com/datasets/crawford/computer-network-traffic, (1 August 2022).
The dataset was grouped by date to observe the net flow of the day based on all logs for the same day (Table 1). In Table 1, yday and wday represented the day of the year and day of the week, respectively.
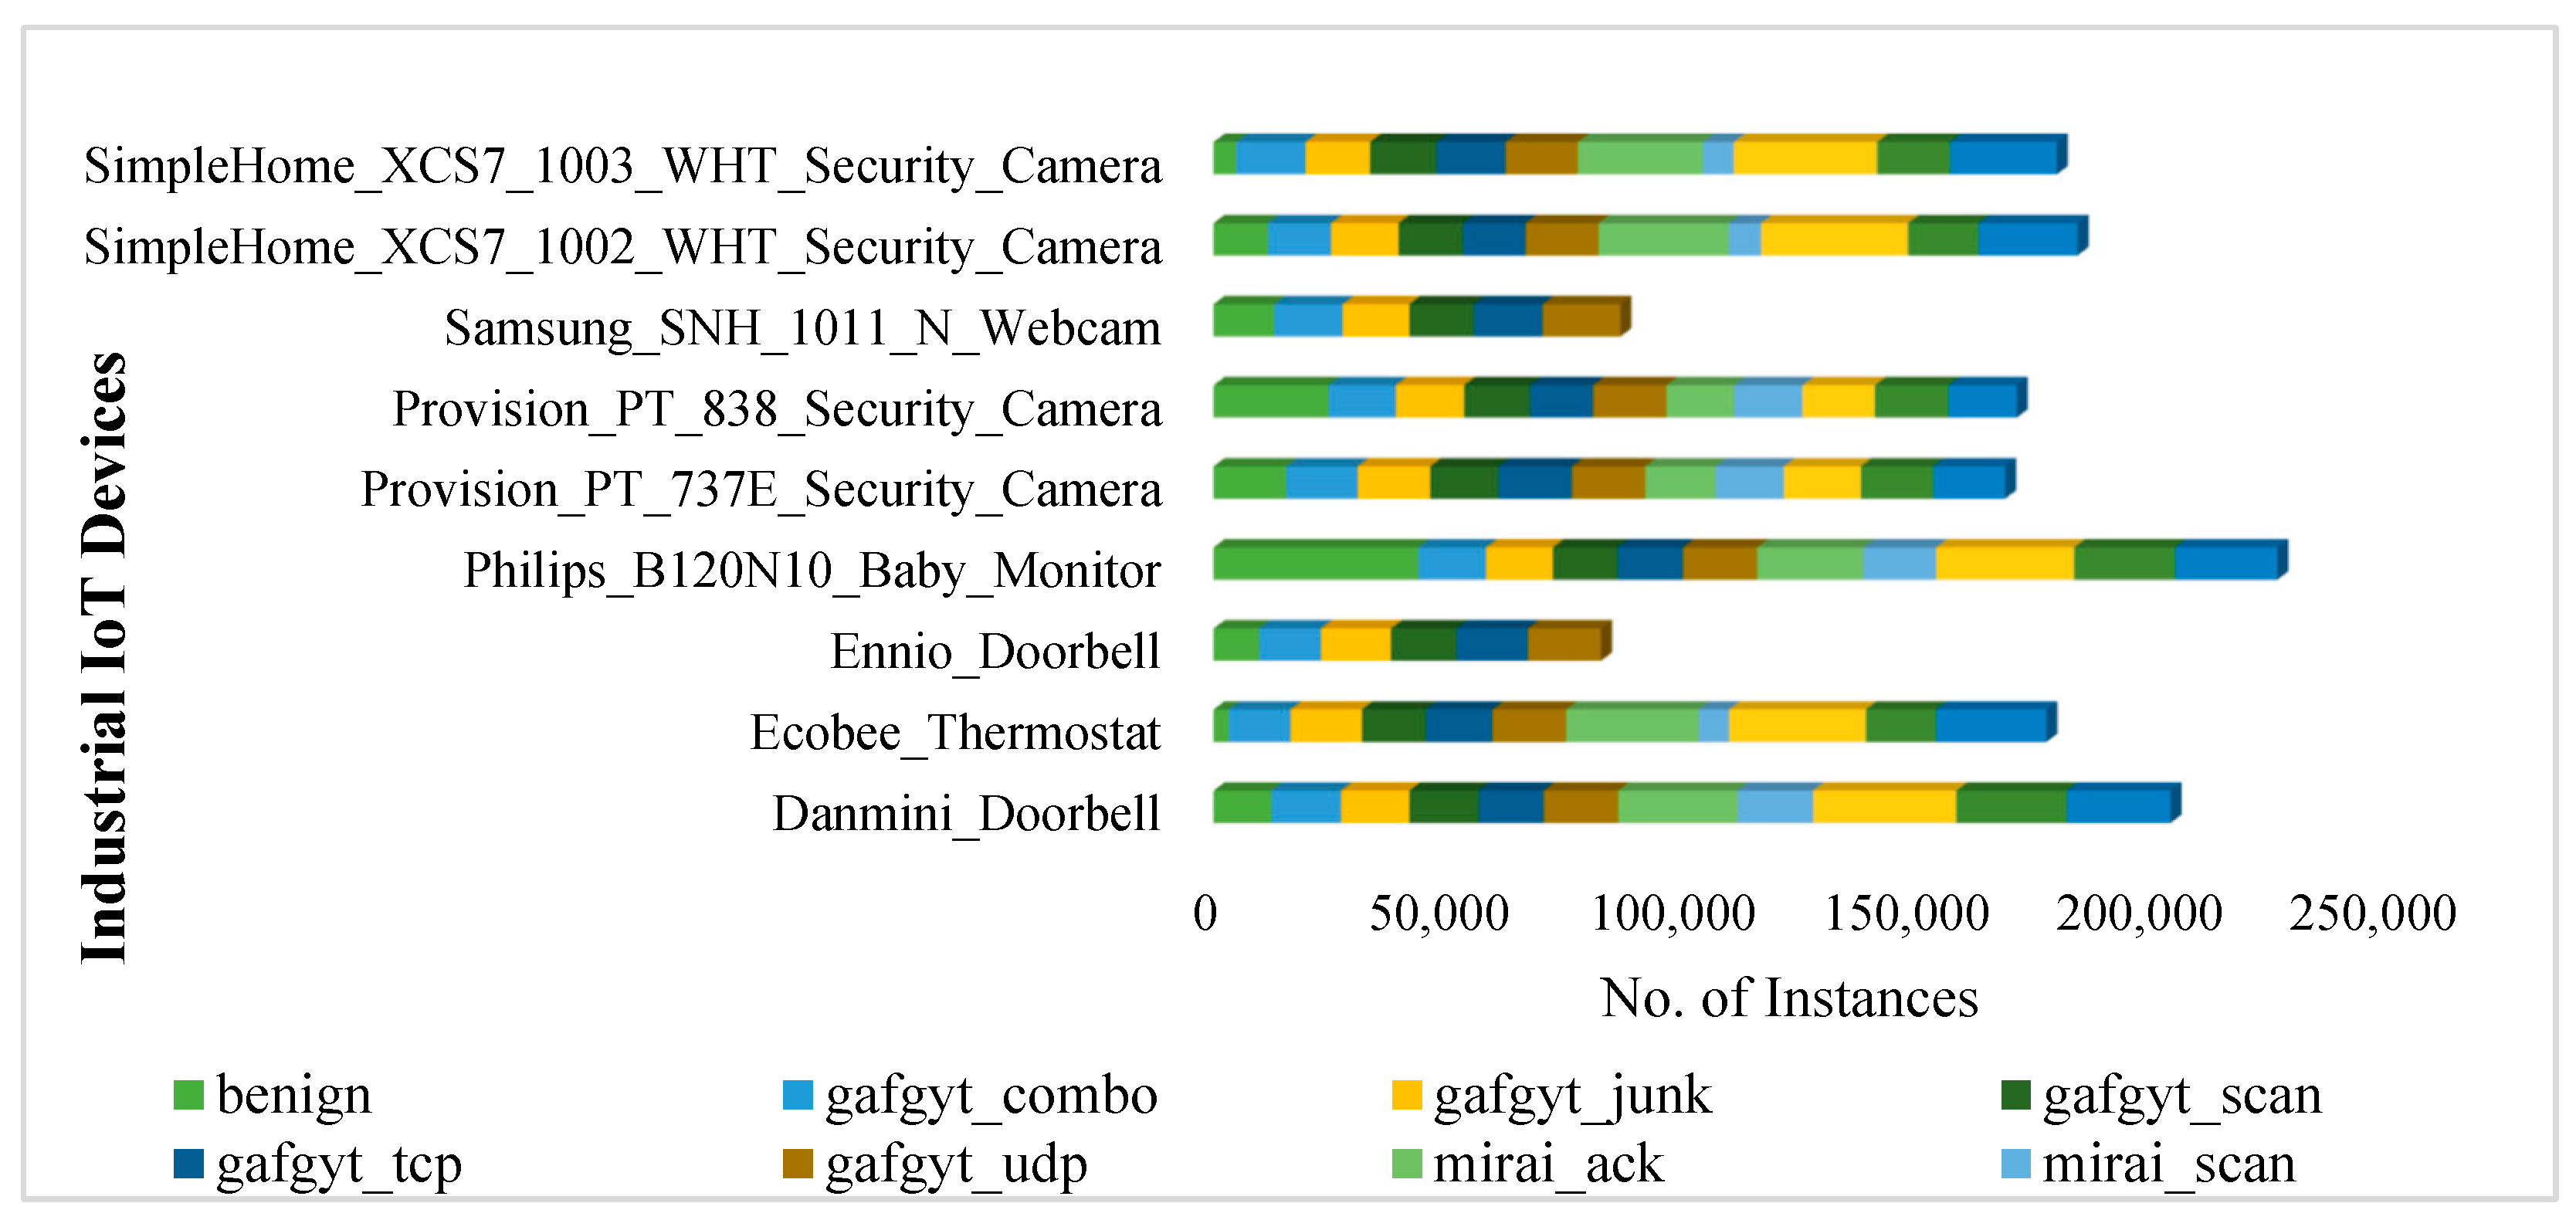
The CCNT dataset was from 2006; the reason for choosing the CCNT dataset in the present investigation is that it contains a significant number of records which were less explored to that could be analysed concerning the botnet attacks. In addition to this, the more recent N-BaIoT dataset was also used in this investigation. N-BaIoT contains traffic data from nine industrial IoT devices [2]. The data comprise benign traffic and a variety of malicious attacks such as scan, TCP, UDP, and SYN [2]. There were 1,486,418 instances in the second dataset, with 115 features for each file comprising a total of 7.58 GB data in size for benign and attack occurrences. Raw network traffic data were recorded using Wireshark before and after the infection on the switch [2]. The components of two MIRAI and BASHLITE botnet attacks were implemented in a private lab setting [2]. MIRAI and BASHLITE botnet attacks were classified into ten attacks and one non-attack category (see, Figure 1). The behaviours of the considered attacks fall into three categories: (1) scan instructions used to identify weak IoT devices; (2) ACK, SYN, UDP, and TCP flooding; and (3) combined attack used to initiate a connection and send spam to it [2].
4. Methodology
4.1. Data Pre-Processing
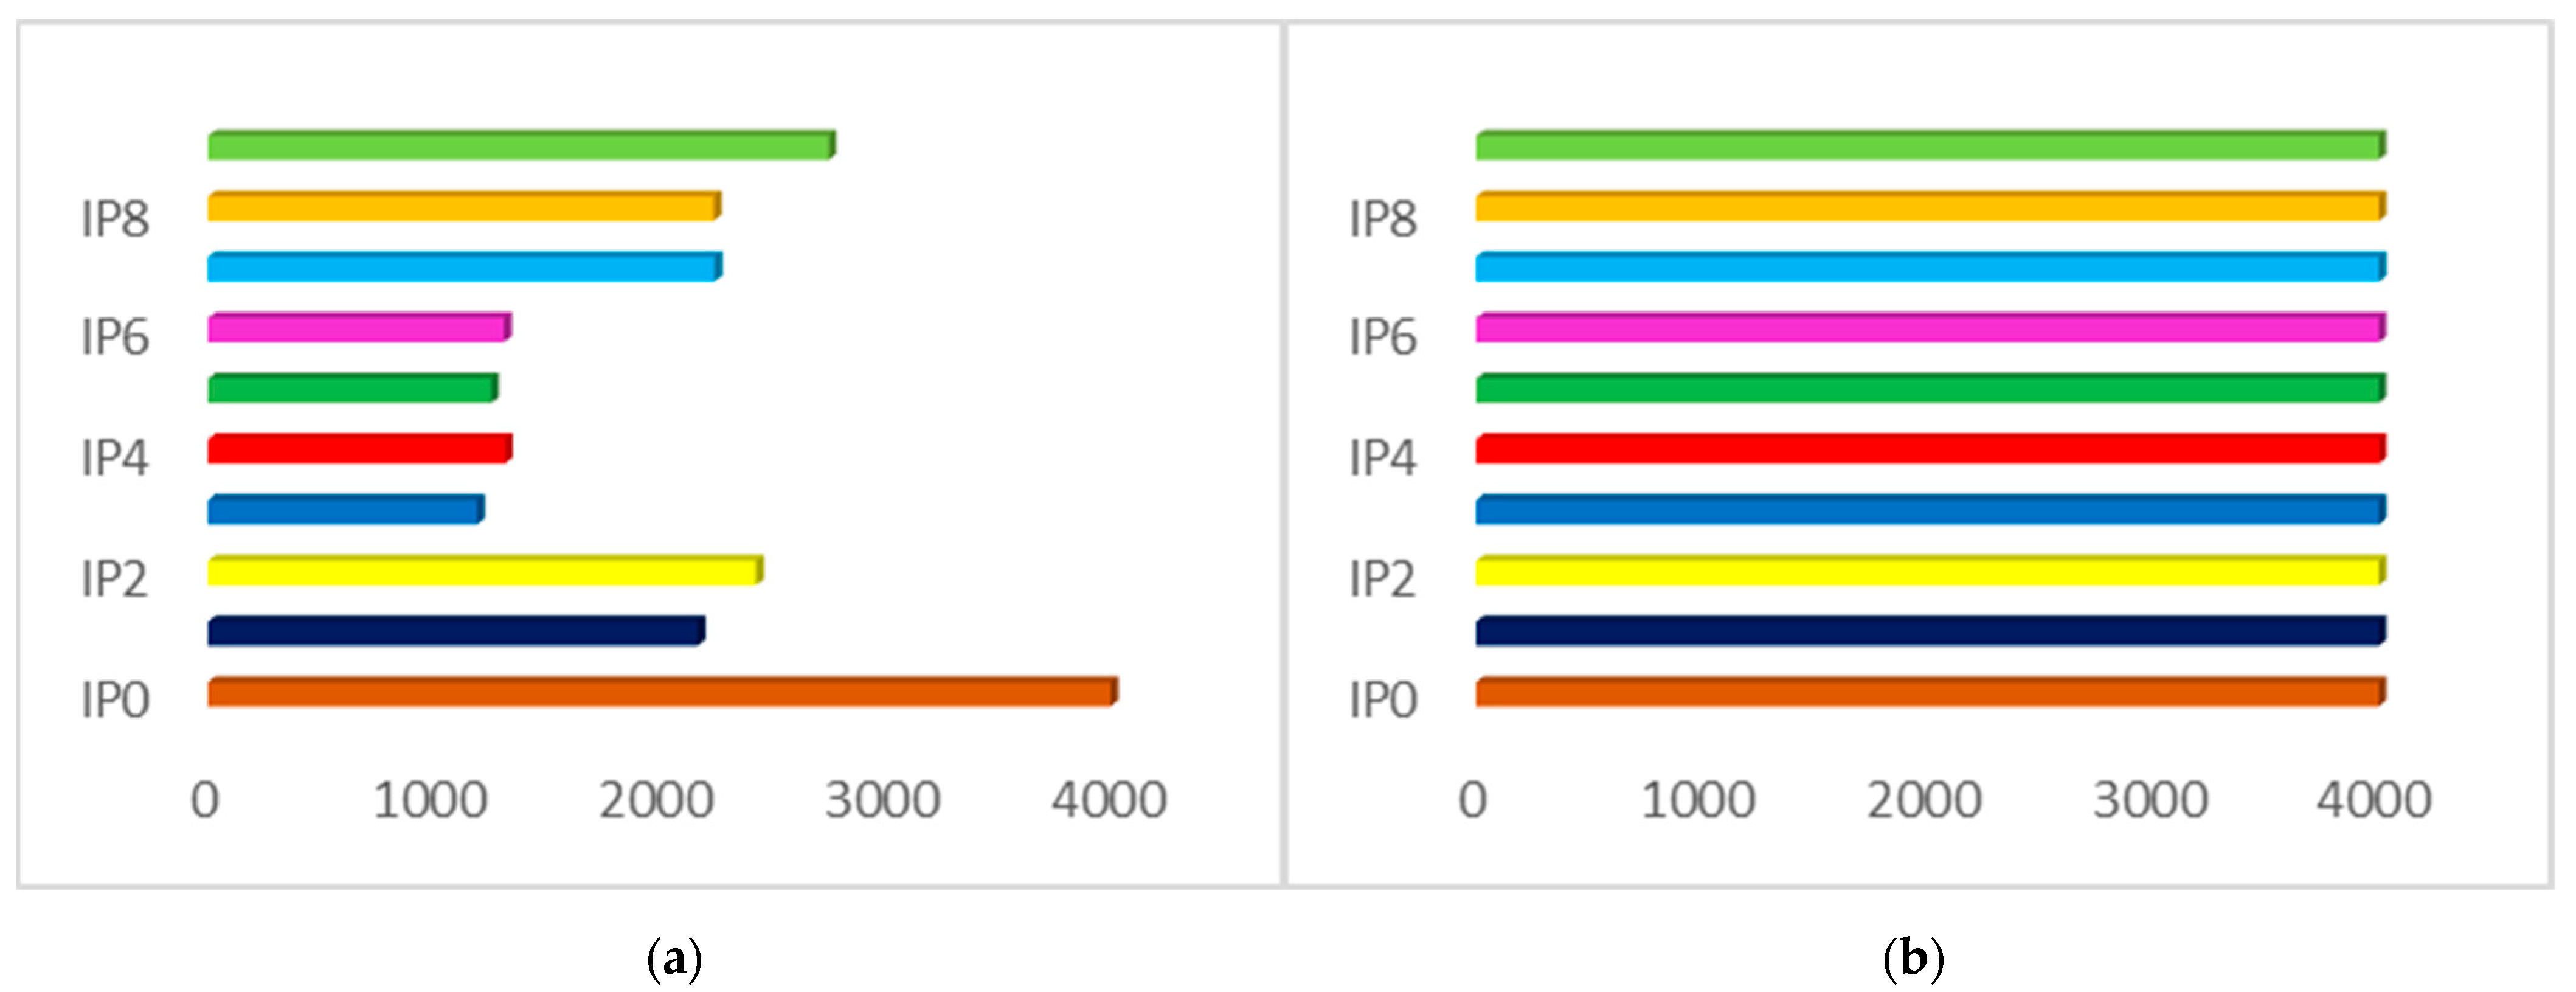
In this section, we explored the datasets before deploying the DBoTPM model. The class imbalance issue was found with the CCNT dataset. IP0 had a higher value of 3980 records for 3 months, while IP 3 had only 1186 records for the same period (Figure 2). Previous research has concentrated on obtaining better accuracy values, with less emphasis on the illusory accuracy caused by the dataset’s class imbalance [23]. Classification on an imbalanced dataset revealed that minority classes had lower accuracy, while majority classes had higher accuracy. In the current investigation, SMOTE was performed before the data was fed into the DBoTPM model to address the issue of class imbalance. SMOTE generates synthetic data using the k-nearest neighbour method. SMOTE begins by selecting random data from the minority class and then sets the data’s k-nearest neighbours. The random data would then be combined with the randomly chosen k-nearest neighbour to create synthetic data (see Figure 2) [23]. The number of values for all minor IPs was increased as per the value of the major class with synthetic values using SMOTE to overcome the issue of class imbalance.
There are various RNN algorithms, and the rationale of choosing LSTM is that it offers more memory capability, which remembers the output results of each node for a longer period in order to efficiently produce the output for the next node. LSTM networks also address the issue of vanishing gradient in RNNs. LSTMs work better with normalized data, so the transformation was applied [24]. Min–max scaling was performed, which transforms the time series data between -1 and 1. After the prediction stage, this transformation was inverted to return the values to their original scale, allowing the uncertainty calculation to be properly assessed.
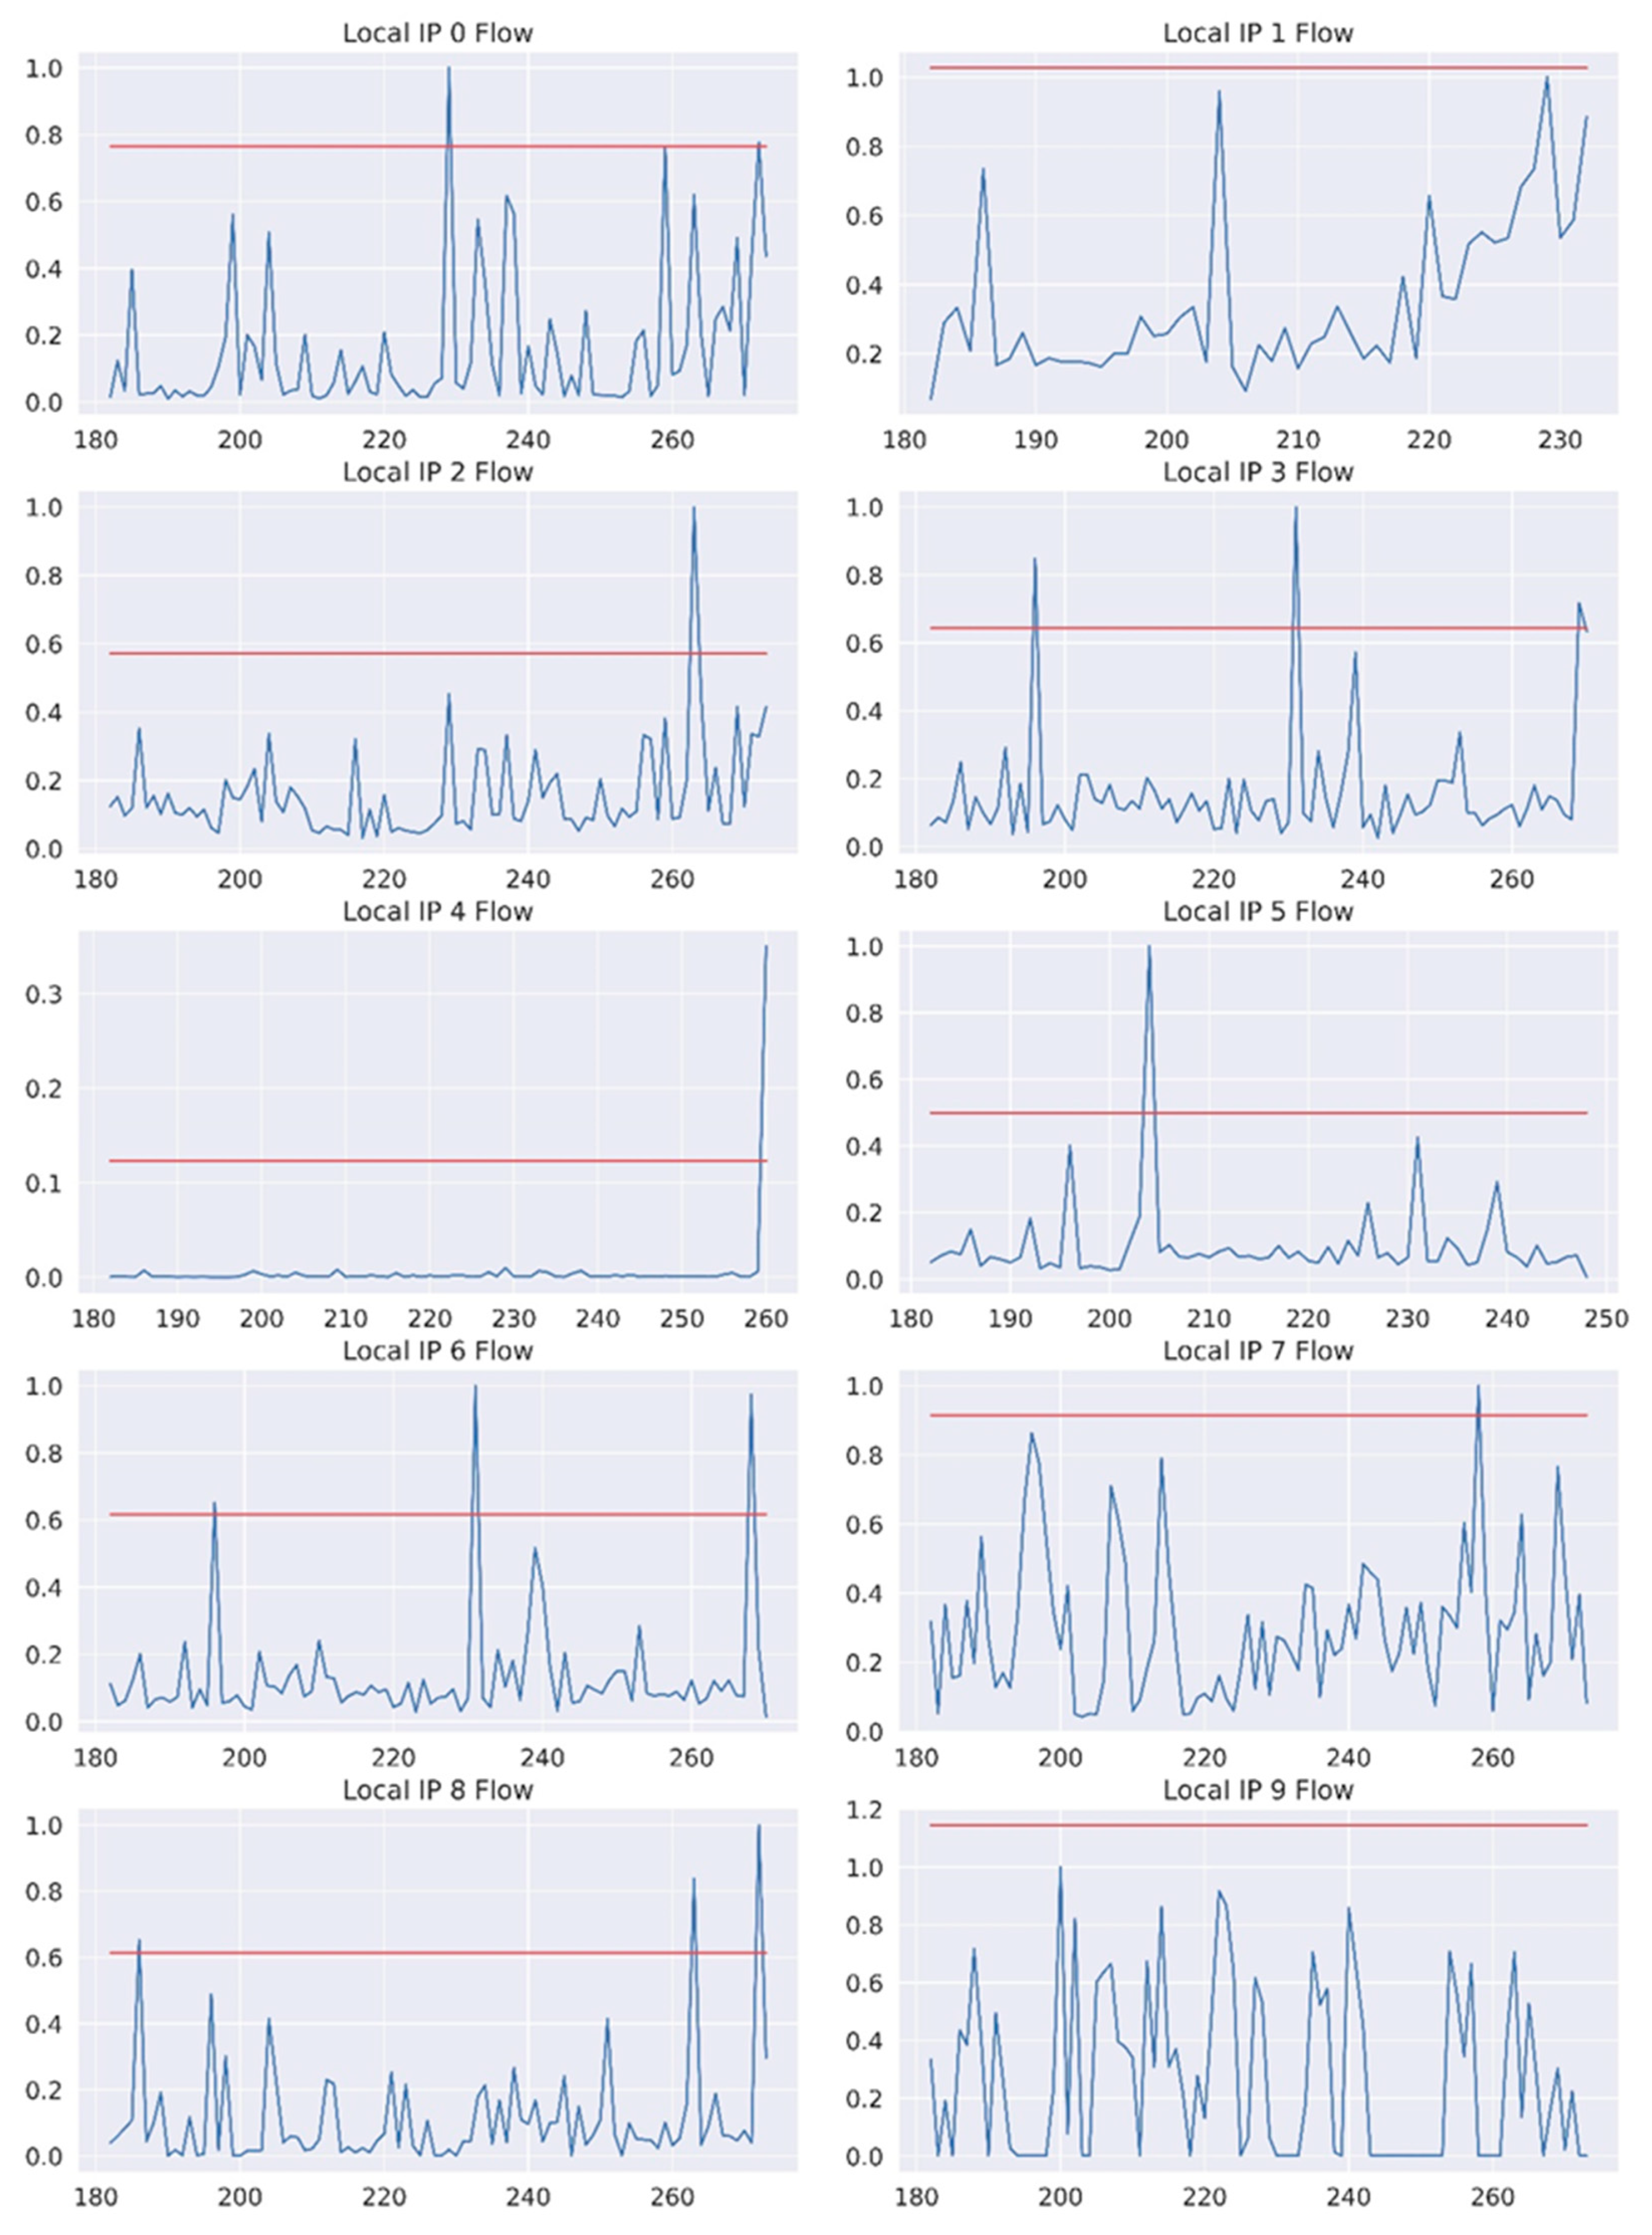
To understand and visualise the daywise traffic flow for all 10 IPs Figure 3 was generated, with the x-axis showing the year of the day starting from 181 and going to 271. The red line shows the mean combined with the standard deviation along with the length of days. Figure 3 revealed that the IP4 showed much less traffic from day 180 to 259; however, there was a sudden spike on days 259 and 260, which showed the abnormal behaviour of traffic. All four features from the first dataset—date, I_ipn, r_asn, and f—were used to feed the ML models. For the N-BaIoT dataset, the columns with NaN were dropped, and the columns which contained more than one unique value were kept. The total number of features was 115 in the N-BaIoT dataset, earlier work from [2] applied principal component analysis (PCA) to reduce the dimension of the data, and the number of PCs was selected based on the CEVR (cumulative explained variance ratio). The first PC was selected for the N-BaIoT dataset to feed in the ML models to trade off between the dimensionality and efficiency in the present investigation. Another study which introduced the N-BaIoT dataset [2] extracted 23 features [25].
4.2. Botnet Detection using Approximate Entropy (AE)
AE was developed to analyse the randomness in time series data [26]. Network anomalies detection and monitoring can be effectively understood using flow entropy. The present investigation used AE to evaluate the time series. Suppose a time series of measurements a(1), a(2), …, a(K) which is K equally spaced. Suppose two parameters b and r where b is a positive integer demonstrating the length of consecutive measurements that must be compared and r is a positive real number demonstrating the tolerance level. Another study [27], suggested that the value of b should be 2 and that r should be 20% of the σ (SD) of the time series. AE allocates a positive number to the time series, and smaller values show regularity in the data, while higher values correspond to irregularity in the data. AE is calculated using the four steps procedure:
Step 1: Calculate a sequence of real b-dimensional vectors s(1), s(2), …… s(K – b + 1) such that
Step 2: For each i, calculate = number of s(j): j {1,…K − b + 1} such that , where is a distance metric between vectors s(i) and s(j) given by
Step 3: Calculate .
Step 4: Calculate AE (K, b, r) = .
The values of parameters b and r were selected as 2 and 3, respectively. The AE calculates the logarithmic empirical likelihood that is near the observations within the range of r for b consecutive observations following incremental comparison [26]. AE has been used for a long time and due to its utility, it has been employed more recently in applications including the volatility of bitcoin [28], electrochemical noise measurement [29], and neuronal spike sorting [30].
4.3. Development and Implementation of the DBoTPM Model
Tensorflow 2.0 backend, Keras 2.3.0 API, Python 3.8 with, pandas, NumPy matplotlib, sklearn, and SNS libraries were utilized to develop the DBoTPM model. Sklearn was used for feature scaling and estimation of errors, while Keras was used to import models, including LSTM.
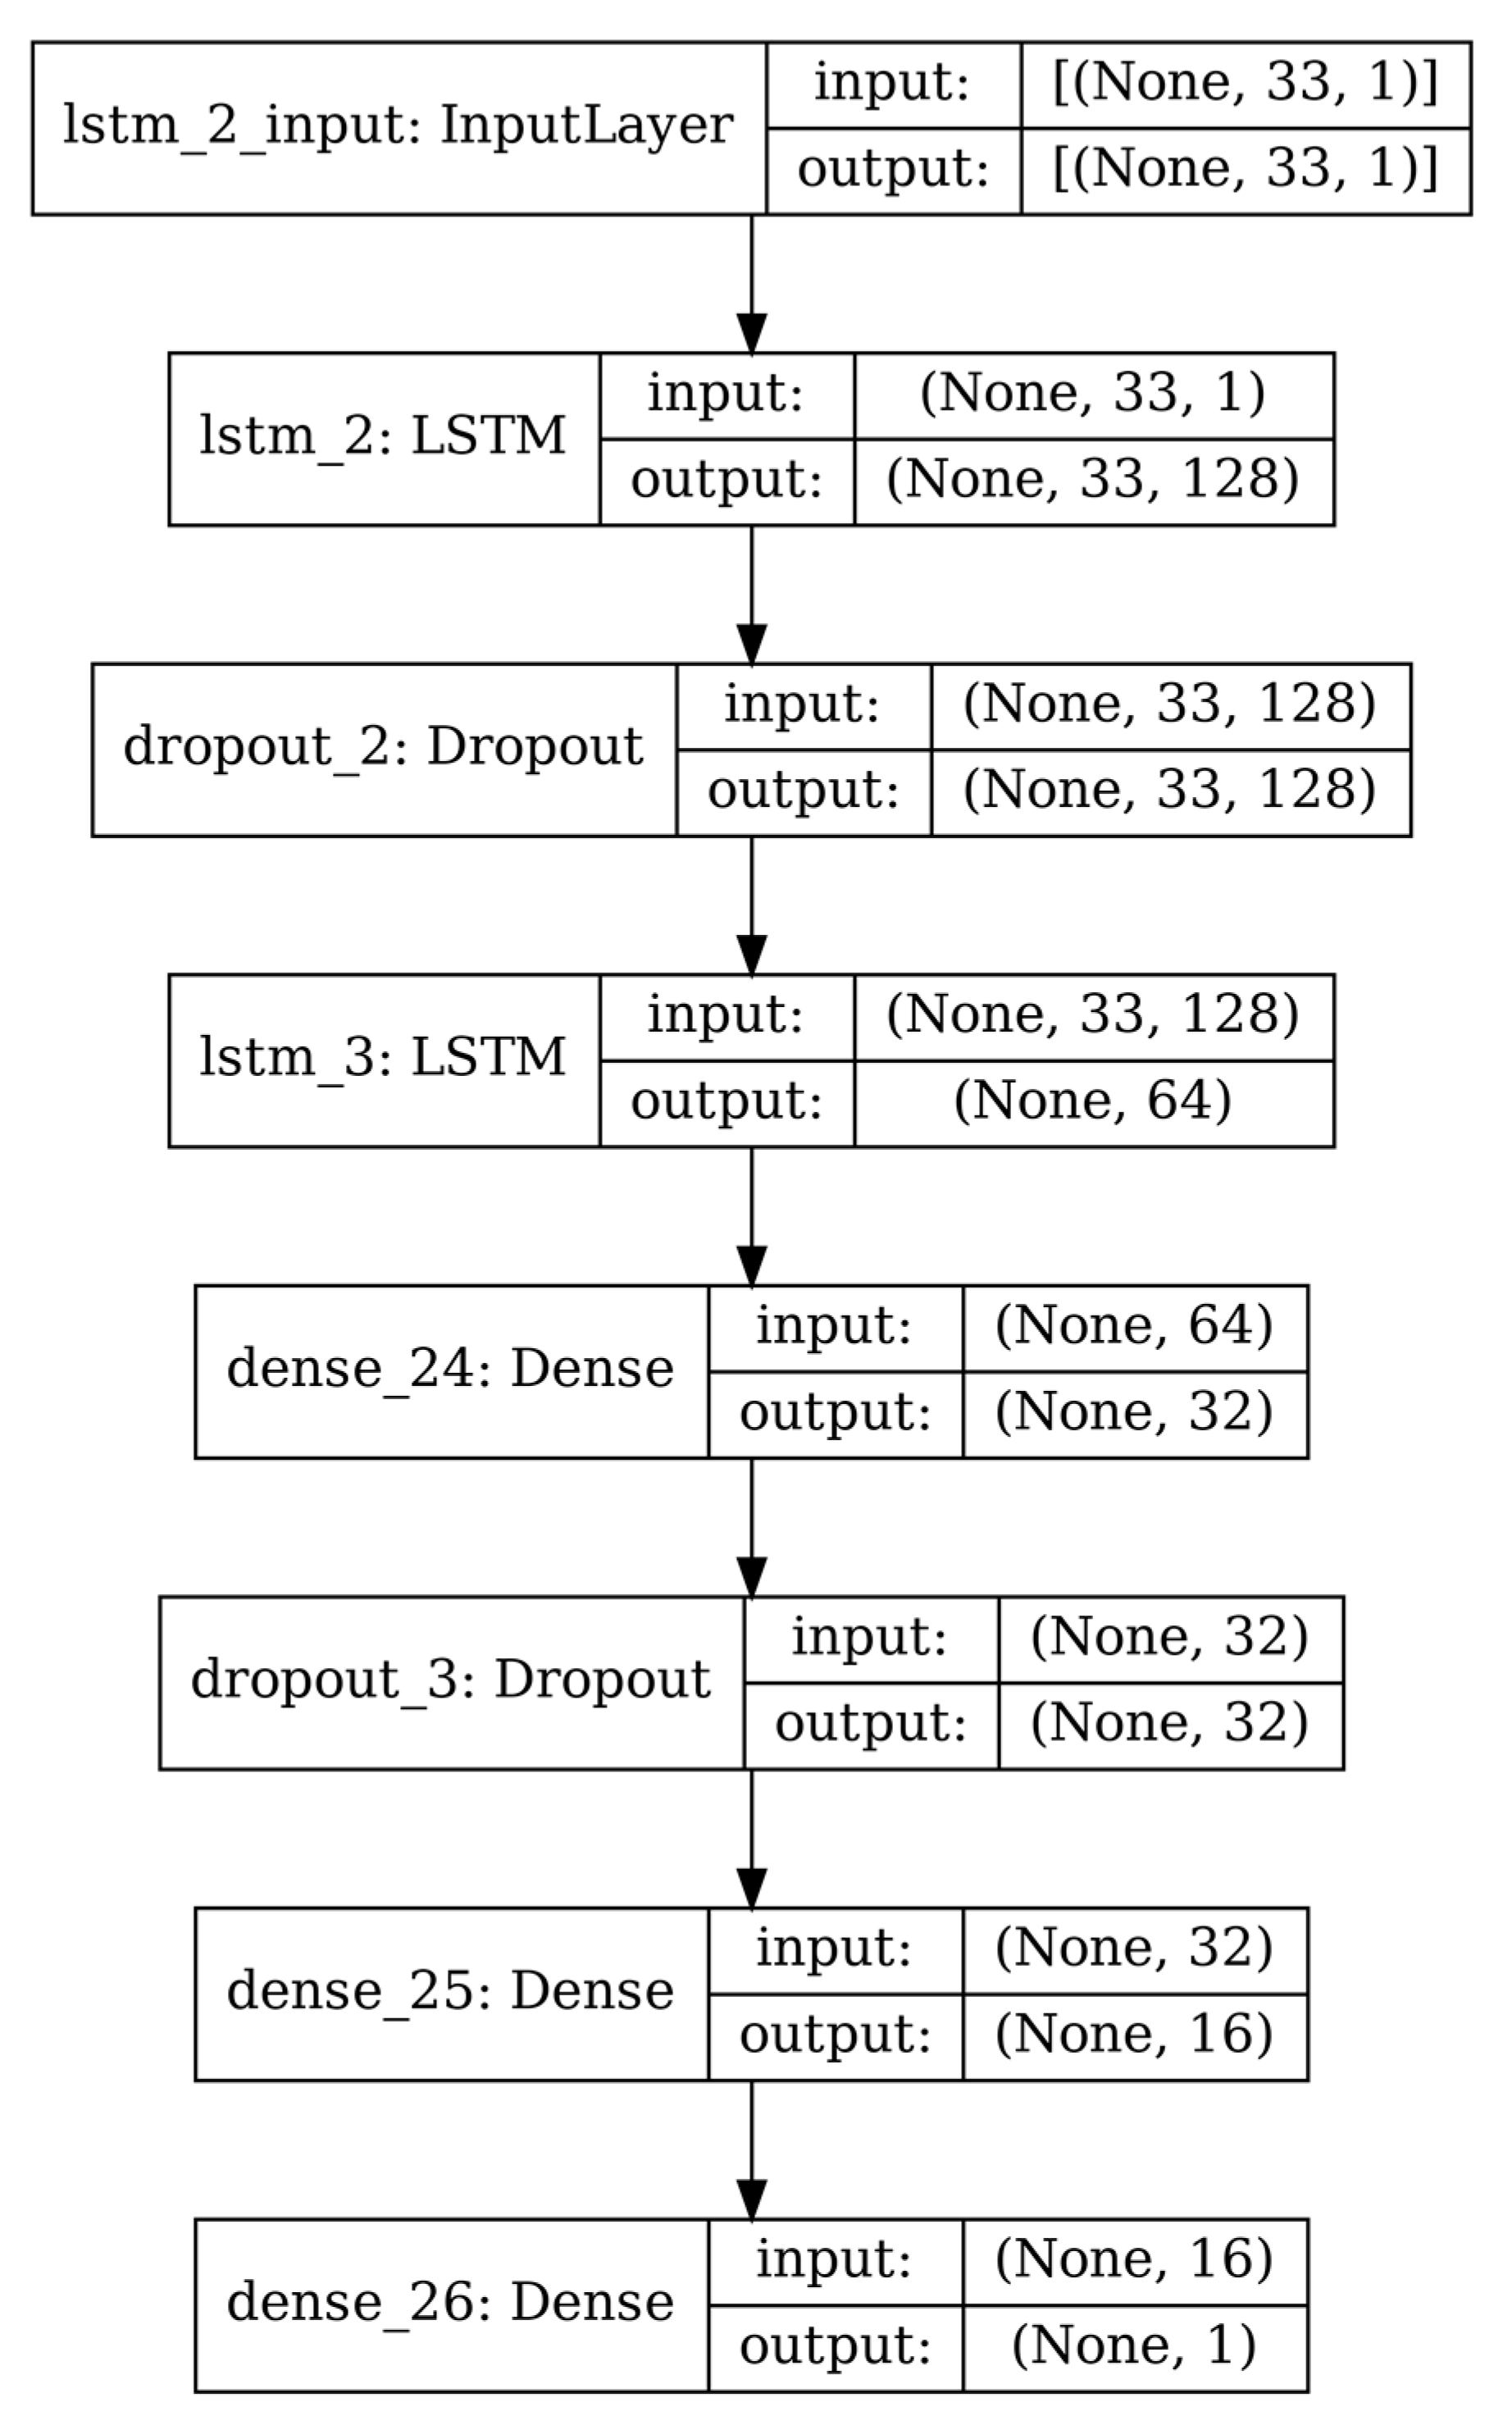
Three auxiliary methods were coded in the current study to develop and implement the DBoTPM model. The first method (create_fdataset) was used to create the list of features and targets for our model. The method create_fdataset created the feature dataset, with each row containing the sequence of the previous observations (lookback) represented as a day of the week. The target value (y_train) was the traffic flow that needed to be predicted for the current day. The second method (tModel) was used to train, compile, and fit the developed LSTM model on the feature dataset. The model architecture is given in Figure 4.
The hyperparameters, including the batch size, number of units, and activation functions, must be chosen initially. Activation functions are used to map the input value to an output signal; that output signal is then used as an input in the following layer. Between two LSTM layers, a dropout layer was added to avoid overfitting. It drops out input variables from a layer, which could be from a preceding layer. With two dropout layers, a value of 0.5 was chosen. Compiling the network was the next step after model architecture. The compilation needs some parameters such as an optimization algorithm for network training and a loss function for network evaluation. After compilation, the next step was to fit the LSTM model. The weights are adjusted via model fitting, which depends on the train set. It necessitates both inputs and outputs be specified with training data. The number of epochs was set to 50 at the start, along with a validation split of 0.2, which means that 20% of values were used for internal model validation.
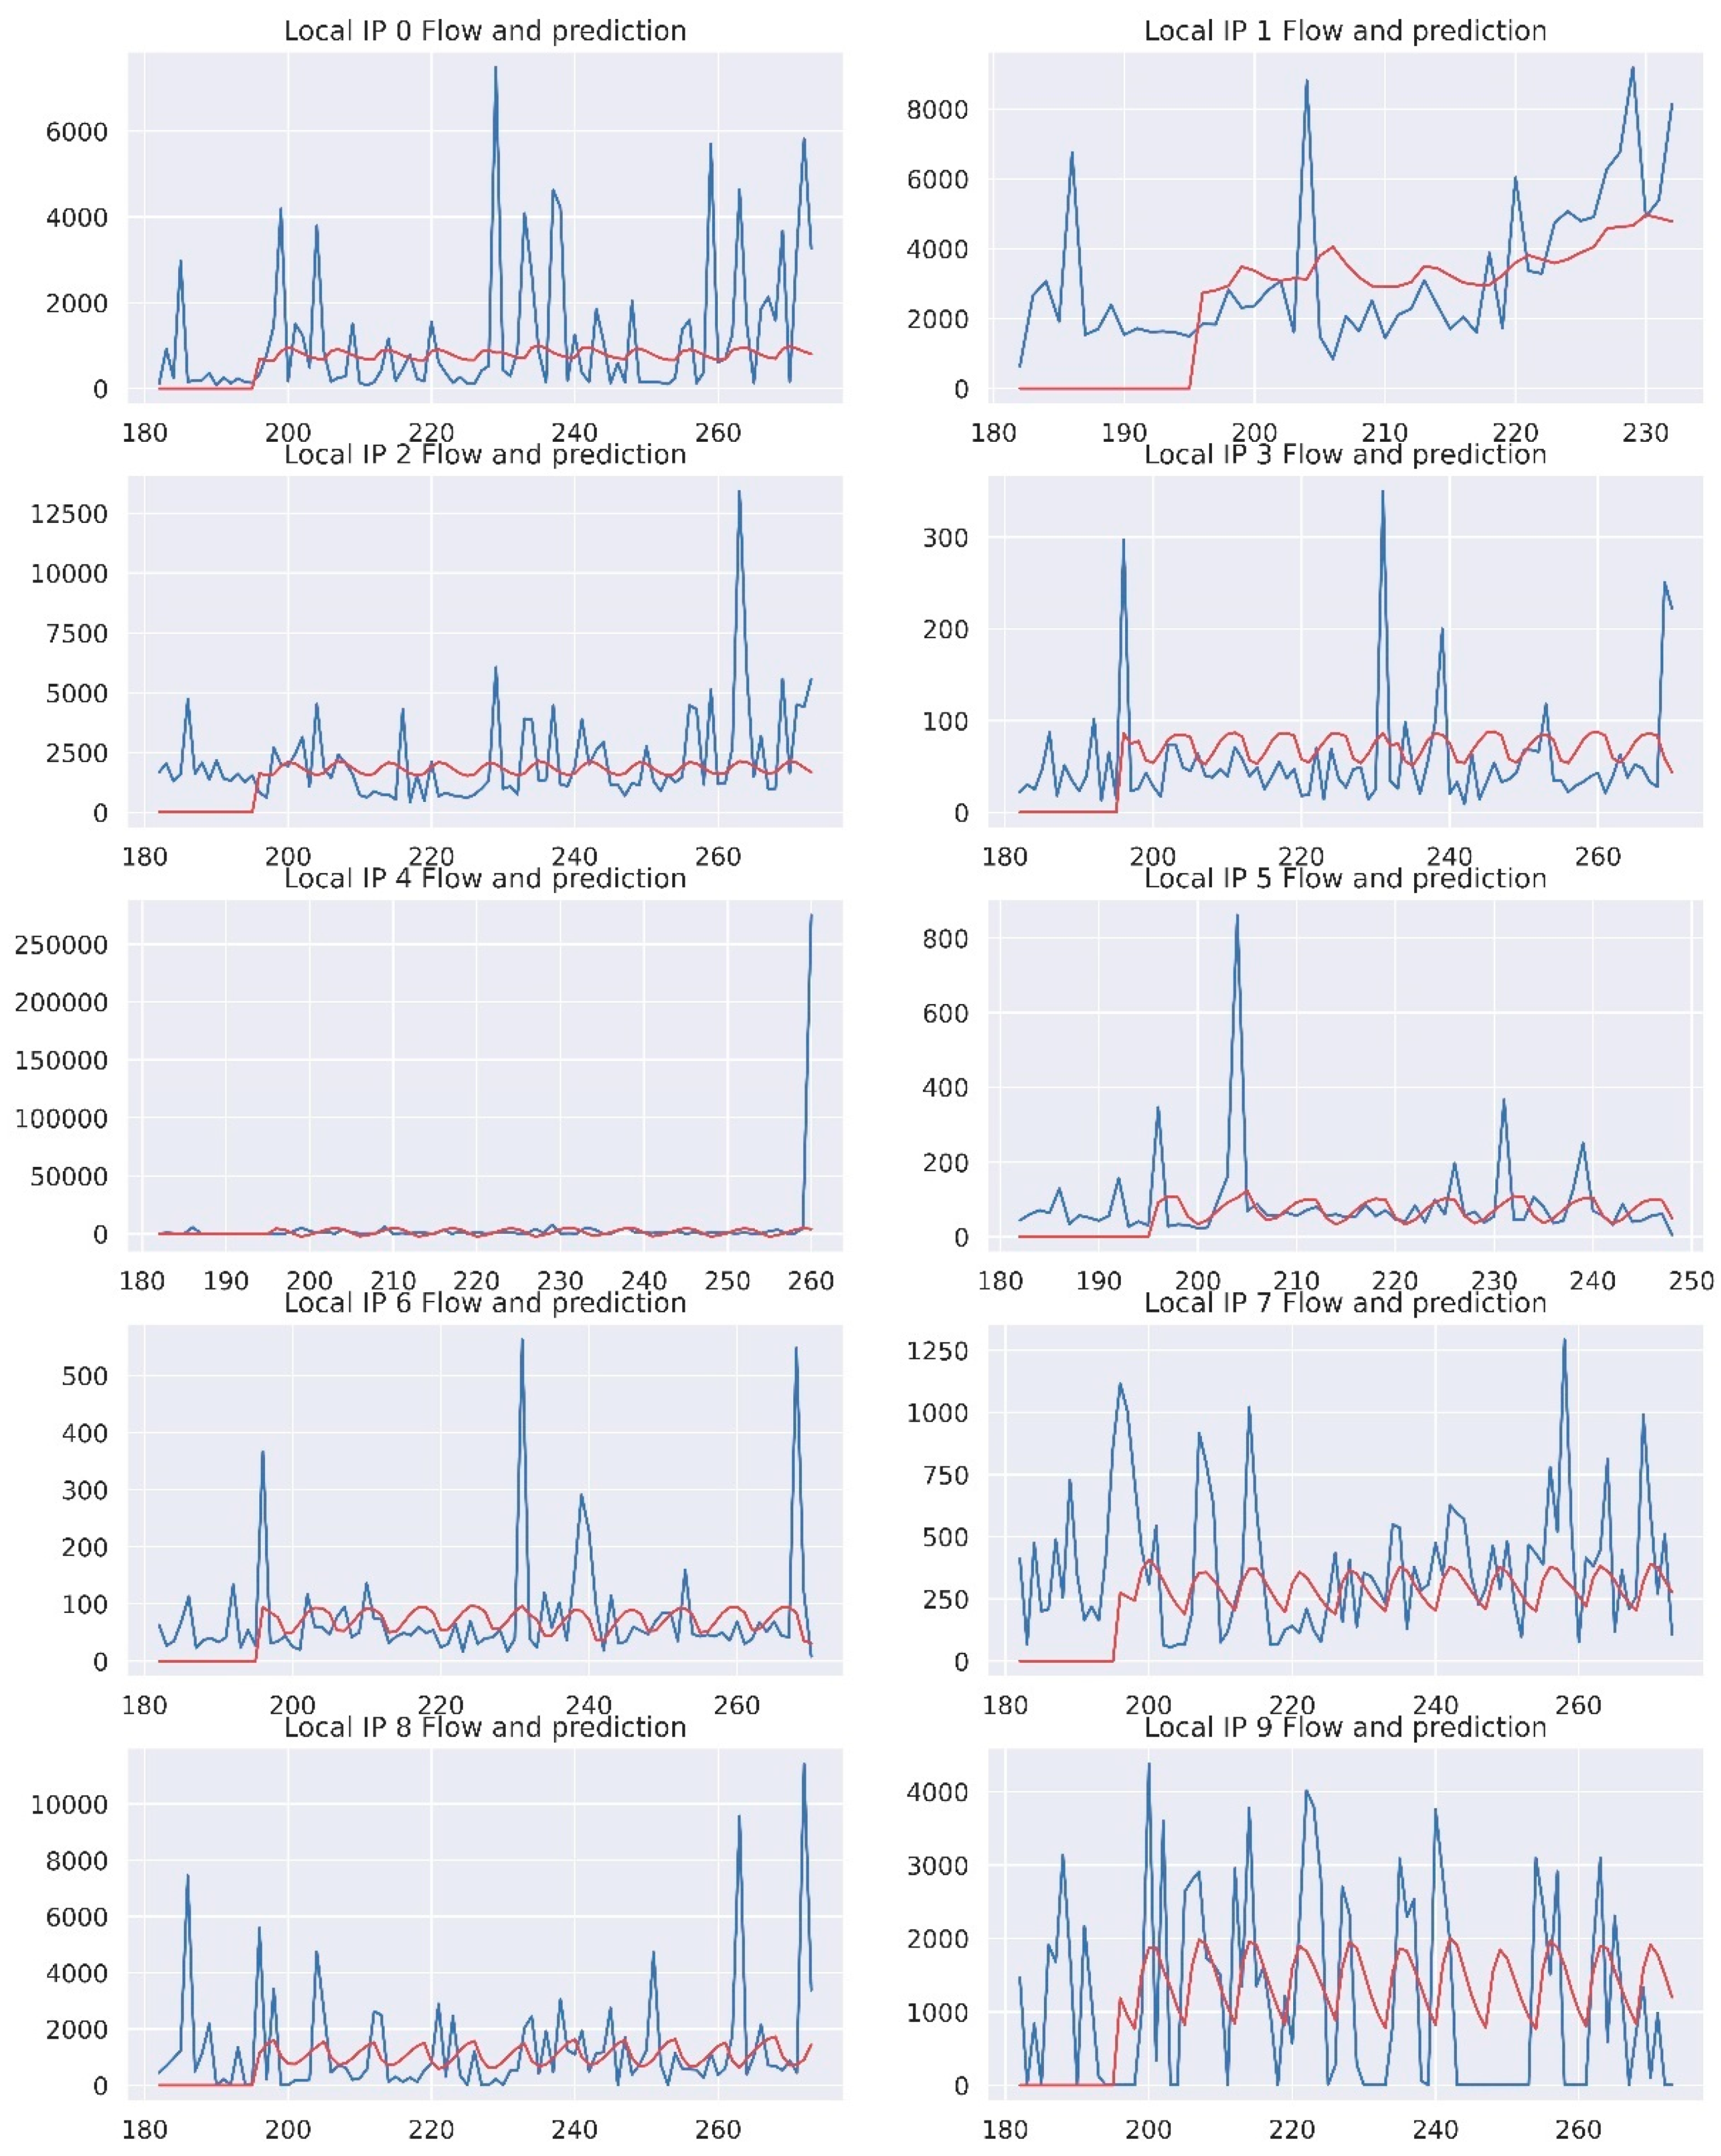
The third method we developed was used to perform a prediction (Flow_pred) with our trained model. The tmodel trained output for each IP traffic for wday was copied to separate variables (t0, t1, …, t9). The predicted flow for each IP from the developed model and the original dataset is shown in Figure 5 below. The SGD optimizer was used with mean squared error (MSE) as a measure of loss.
The hyperparameters of any ML model must be tuned before the model can be evaluated and appraised. (1) Batch size, (2) the number of nodes and epochs, and (3) optimizer choice were the primary hyperparameters of LSTM optimized in this study. For various setup values, a walk-forward approach to optimizing the hyperparameters was evaluated [21]. The optimization algorithm attempted in the present investigation were Adam, (SDG), AdaDelta, and RMSProp, among the optimization techniques assessed. In the current study, the optimized DBoTPM model containing seven layers trained for 100 epochs and with a batch size of 16 with an SGD optimizer exhibited encouraging results in terms of RMSE and computational efficiency. The external evaluation of the model prediction was conducted using a separate dataset of 30 pieces of time step data that were kept separate from the training and testing traffic data.
Seven layers of a deep neural network model have been employed in the present investigation that function on all ten IPs traffic. Two LSTM, two dropouts, and three dense layers were used. Defining the LSTM network architecture with layers is important. LSTM requires input data to be in a 3D form including the number of features, batch size, and timesteps. The batch size specifies the number of samples in each batch during training and testing. The term “timesteps” refers to the number of values in a sequence and the number of dimensions used to represent data in a single time step is represented through the features. The reshape function converts our data into a three-dimensional shape composed of training samples, time steps, and features. In the input layer, PC1 was fed as a feature with 33 timesteps. The number of inputs and outputs was 1 and 128 in the first LSTM unit with 33 timesteps. The dropout layer was used to prevent overfitting; it works by terminating the connections between neurons. The second LSTM layer contains 128 and 64 as the number of inputs and outputs with 33 timesteps. Rectifier activation function (ReLU) was used as an activation function. For all positive values, ReLU functions as a linear function, and for all negative values, it returns zero.
y = max(0, x)
The architecture of the developed DBoTPM is shown in Figure 4.
4.4. Uncertainty Assessment
5. Results and Discussions
The DBoTPM model was developed to predict the expected flow of each host given the previous number of days. To assess the botnet prediction performance, the predicted data vs. actual data were compared to understand whether the host belonged to a botnet or normal traffic data. In this section, the results were discussed based on the performance and computational complexity. For proper verification and validation of the DBoTPM model, the data which were kept separate from the training phase were utilized.
The major aim of the present investigation was botnet prediction using the DBoTPM model based on the real dataset CCNT that compromised botnet attack traffic data for 10 IPs (Figure 5). Figure 5 showed the actual flow and predicted flow for all 10 IPs. The performance of the developed novel DBoTPM model was given in Table 3 based on R2, MCC, RMSE, MAPE, and NSE for all 10 IPs. The comparison of the DBoTPM model with other well-known studies is presented in Table 4. Due to the interesting and significant statistical utility of AE was implemented to detect the botnet attack (Table 5). The AE calculates the logarithmic empirical likelihood that is near the observations within the range of r for b consecutive observations following incremental comparison (Figure 5). The comparison of botnet detection using AE in the present investigation with other studies was shown in Table 6. Table 6 showed that the AE performance was better compared to the earlier investigations based on accuracy and computational cost. The time duration of the datasets used in the present investigation was large compared to other datasets, such as SysNet and ISCX, which have durations between 8 h and 3 days as used by [28,29]. Table 4 shows that the developed DBoTPM shows better accuracy than other existing studies for botnet prediction.
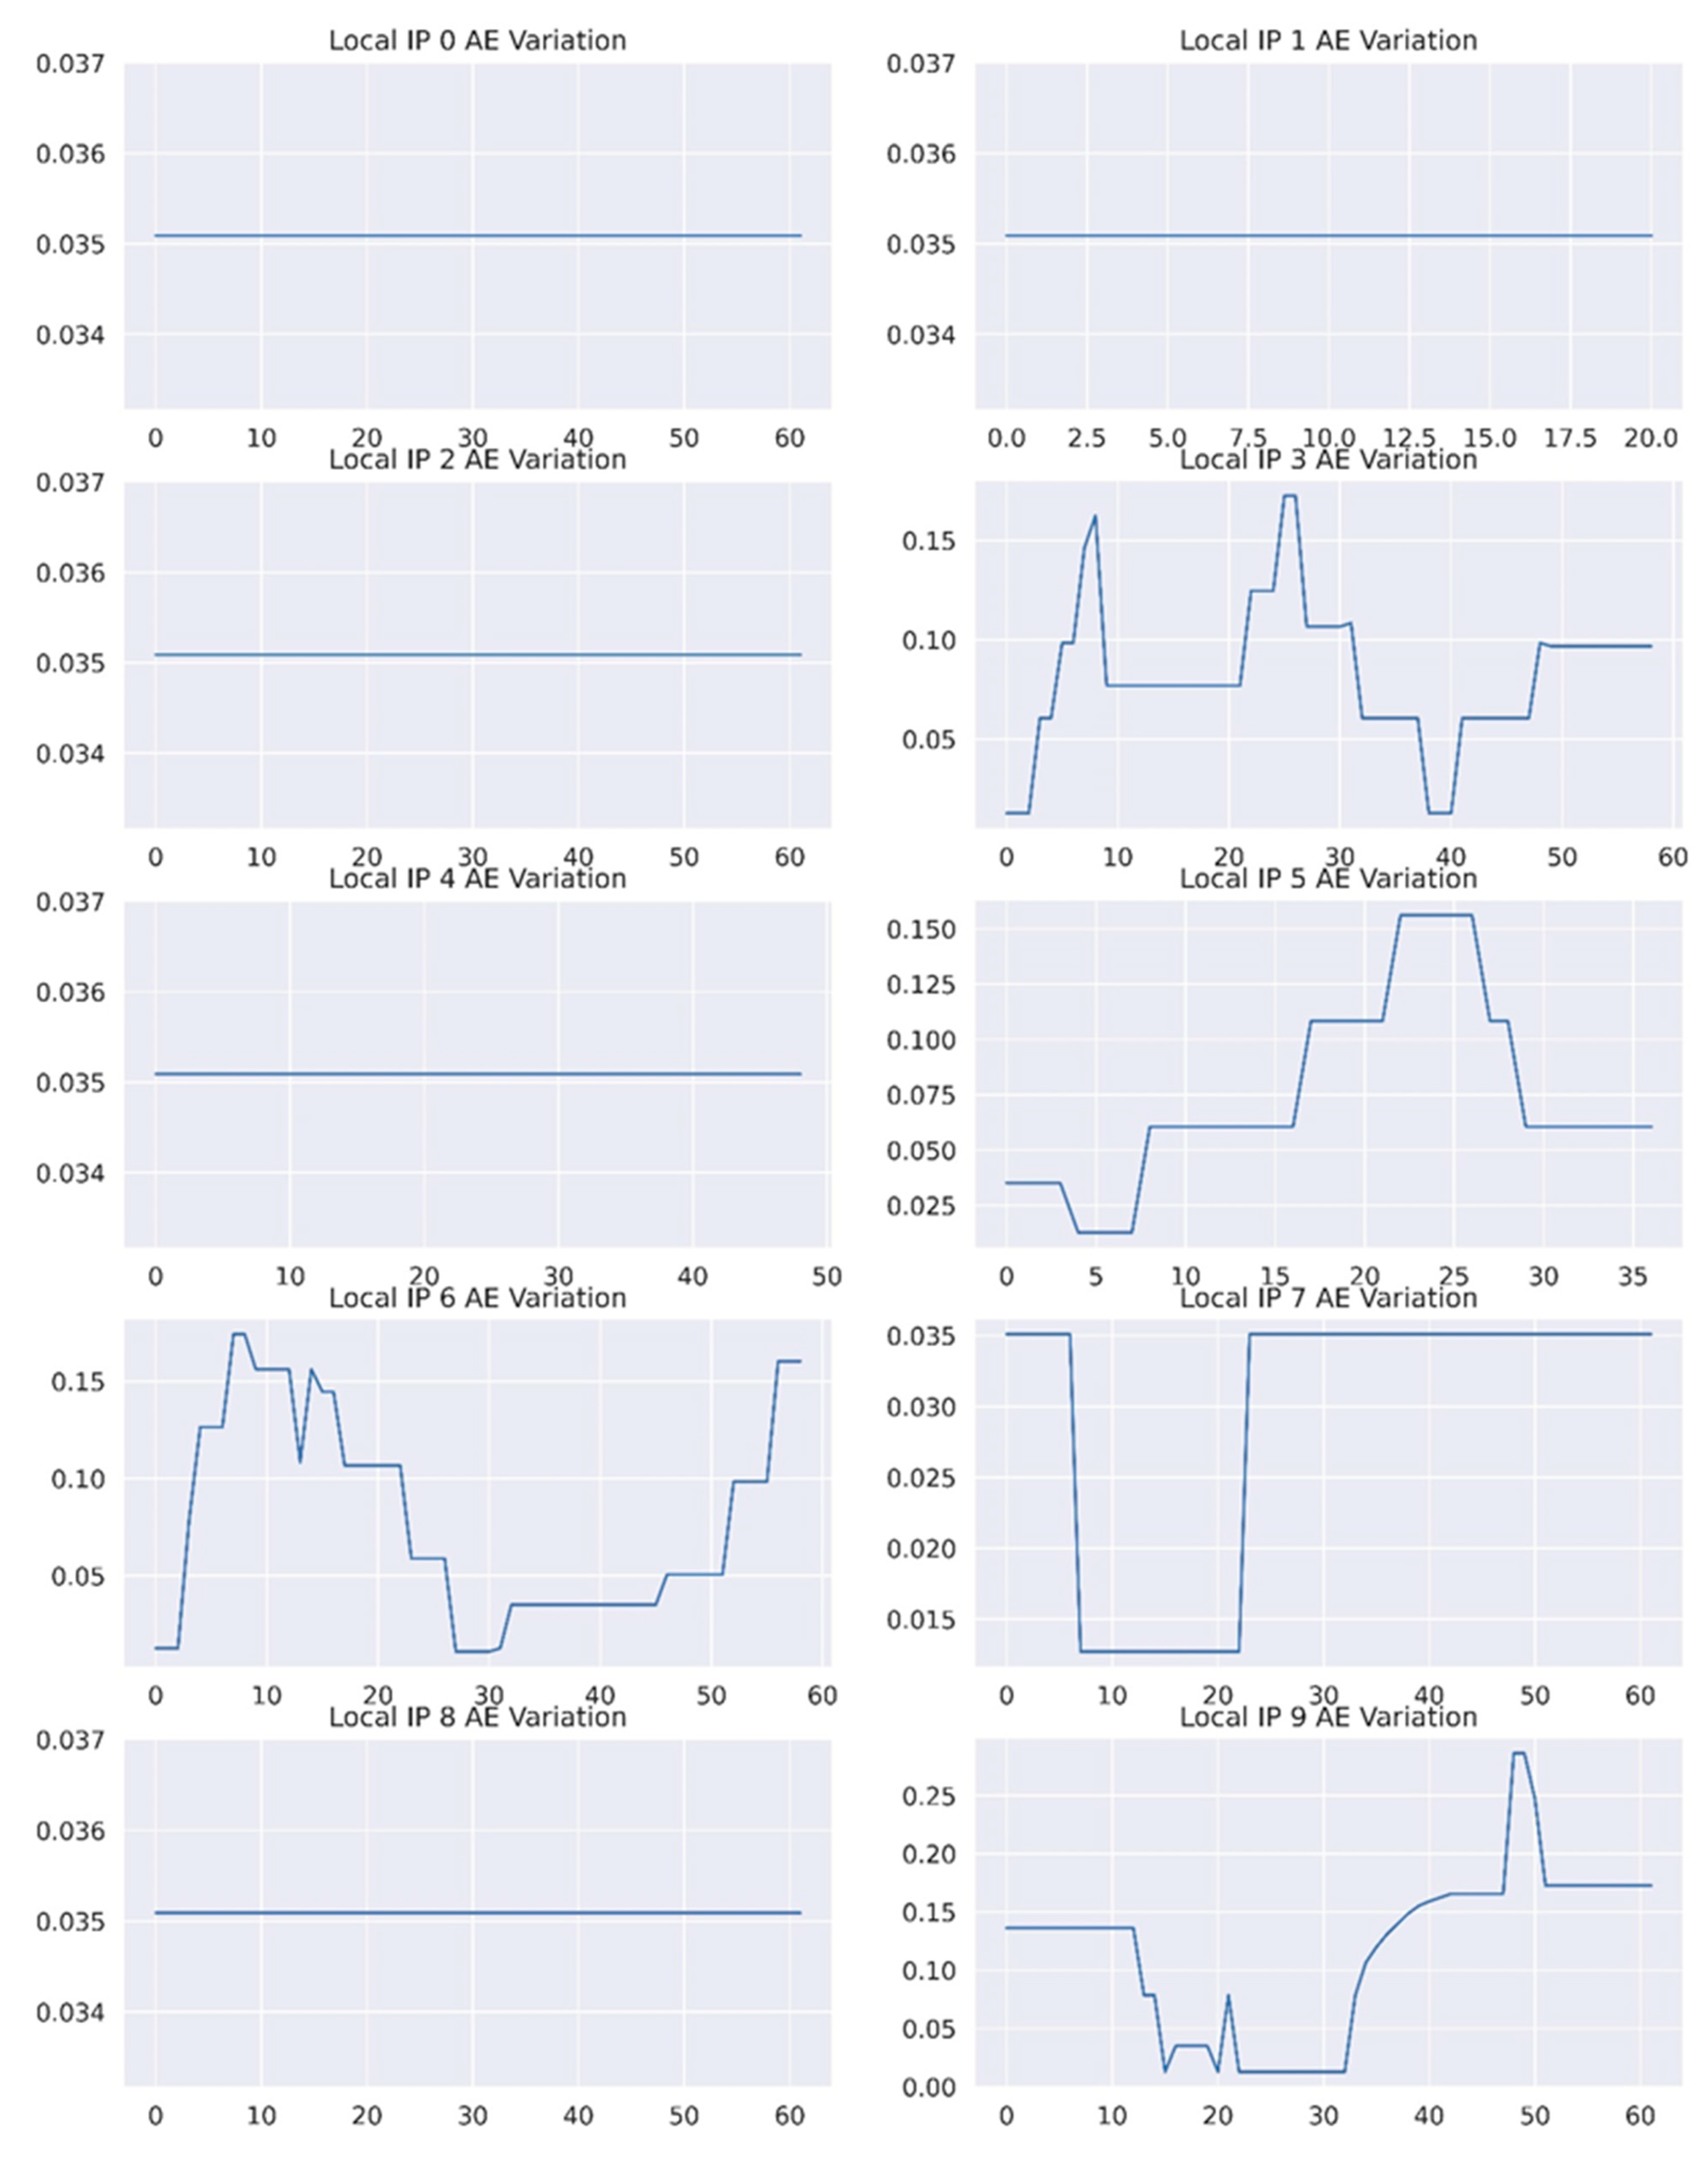
The AE values for all 10 IPs were shown in Table 5 and Figure 6. AE was utilized to investigate the randomness network traffic dataset. It assigns lower values to indicate regularity in the traffic and higher values to indicate anomaly or irregularity in the traffic. The higher AE values were observed with values of 0.36, 0.17, 0.29, and 0.26 for IP3, IP5, IP6, and IP9, respectively. Hence, these IPs joined the botnets during the observational period. Figure 6 interestingly shows that the AE values for IP 0, 1, 2, 4, and 8 are shown as a straight line, which indicated normal activity. However, IPs 3, 5, 6, and 9 showed changes in values with time and were probably associated with botnets. IP 7 also looks abnormal. However, based on its value of 0.0, it was predicted as normal. The AE method can only detect if a specific node has been affected by a botnet attack, whereas the DBoTPM model can classify the attacks into three types: scan instructions used to identify weak IoT devices; ACK, SYN, UDP, and TCP flooding; and combined attack used to initiate a connection and send spam to it.
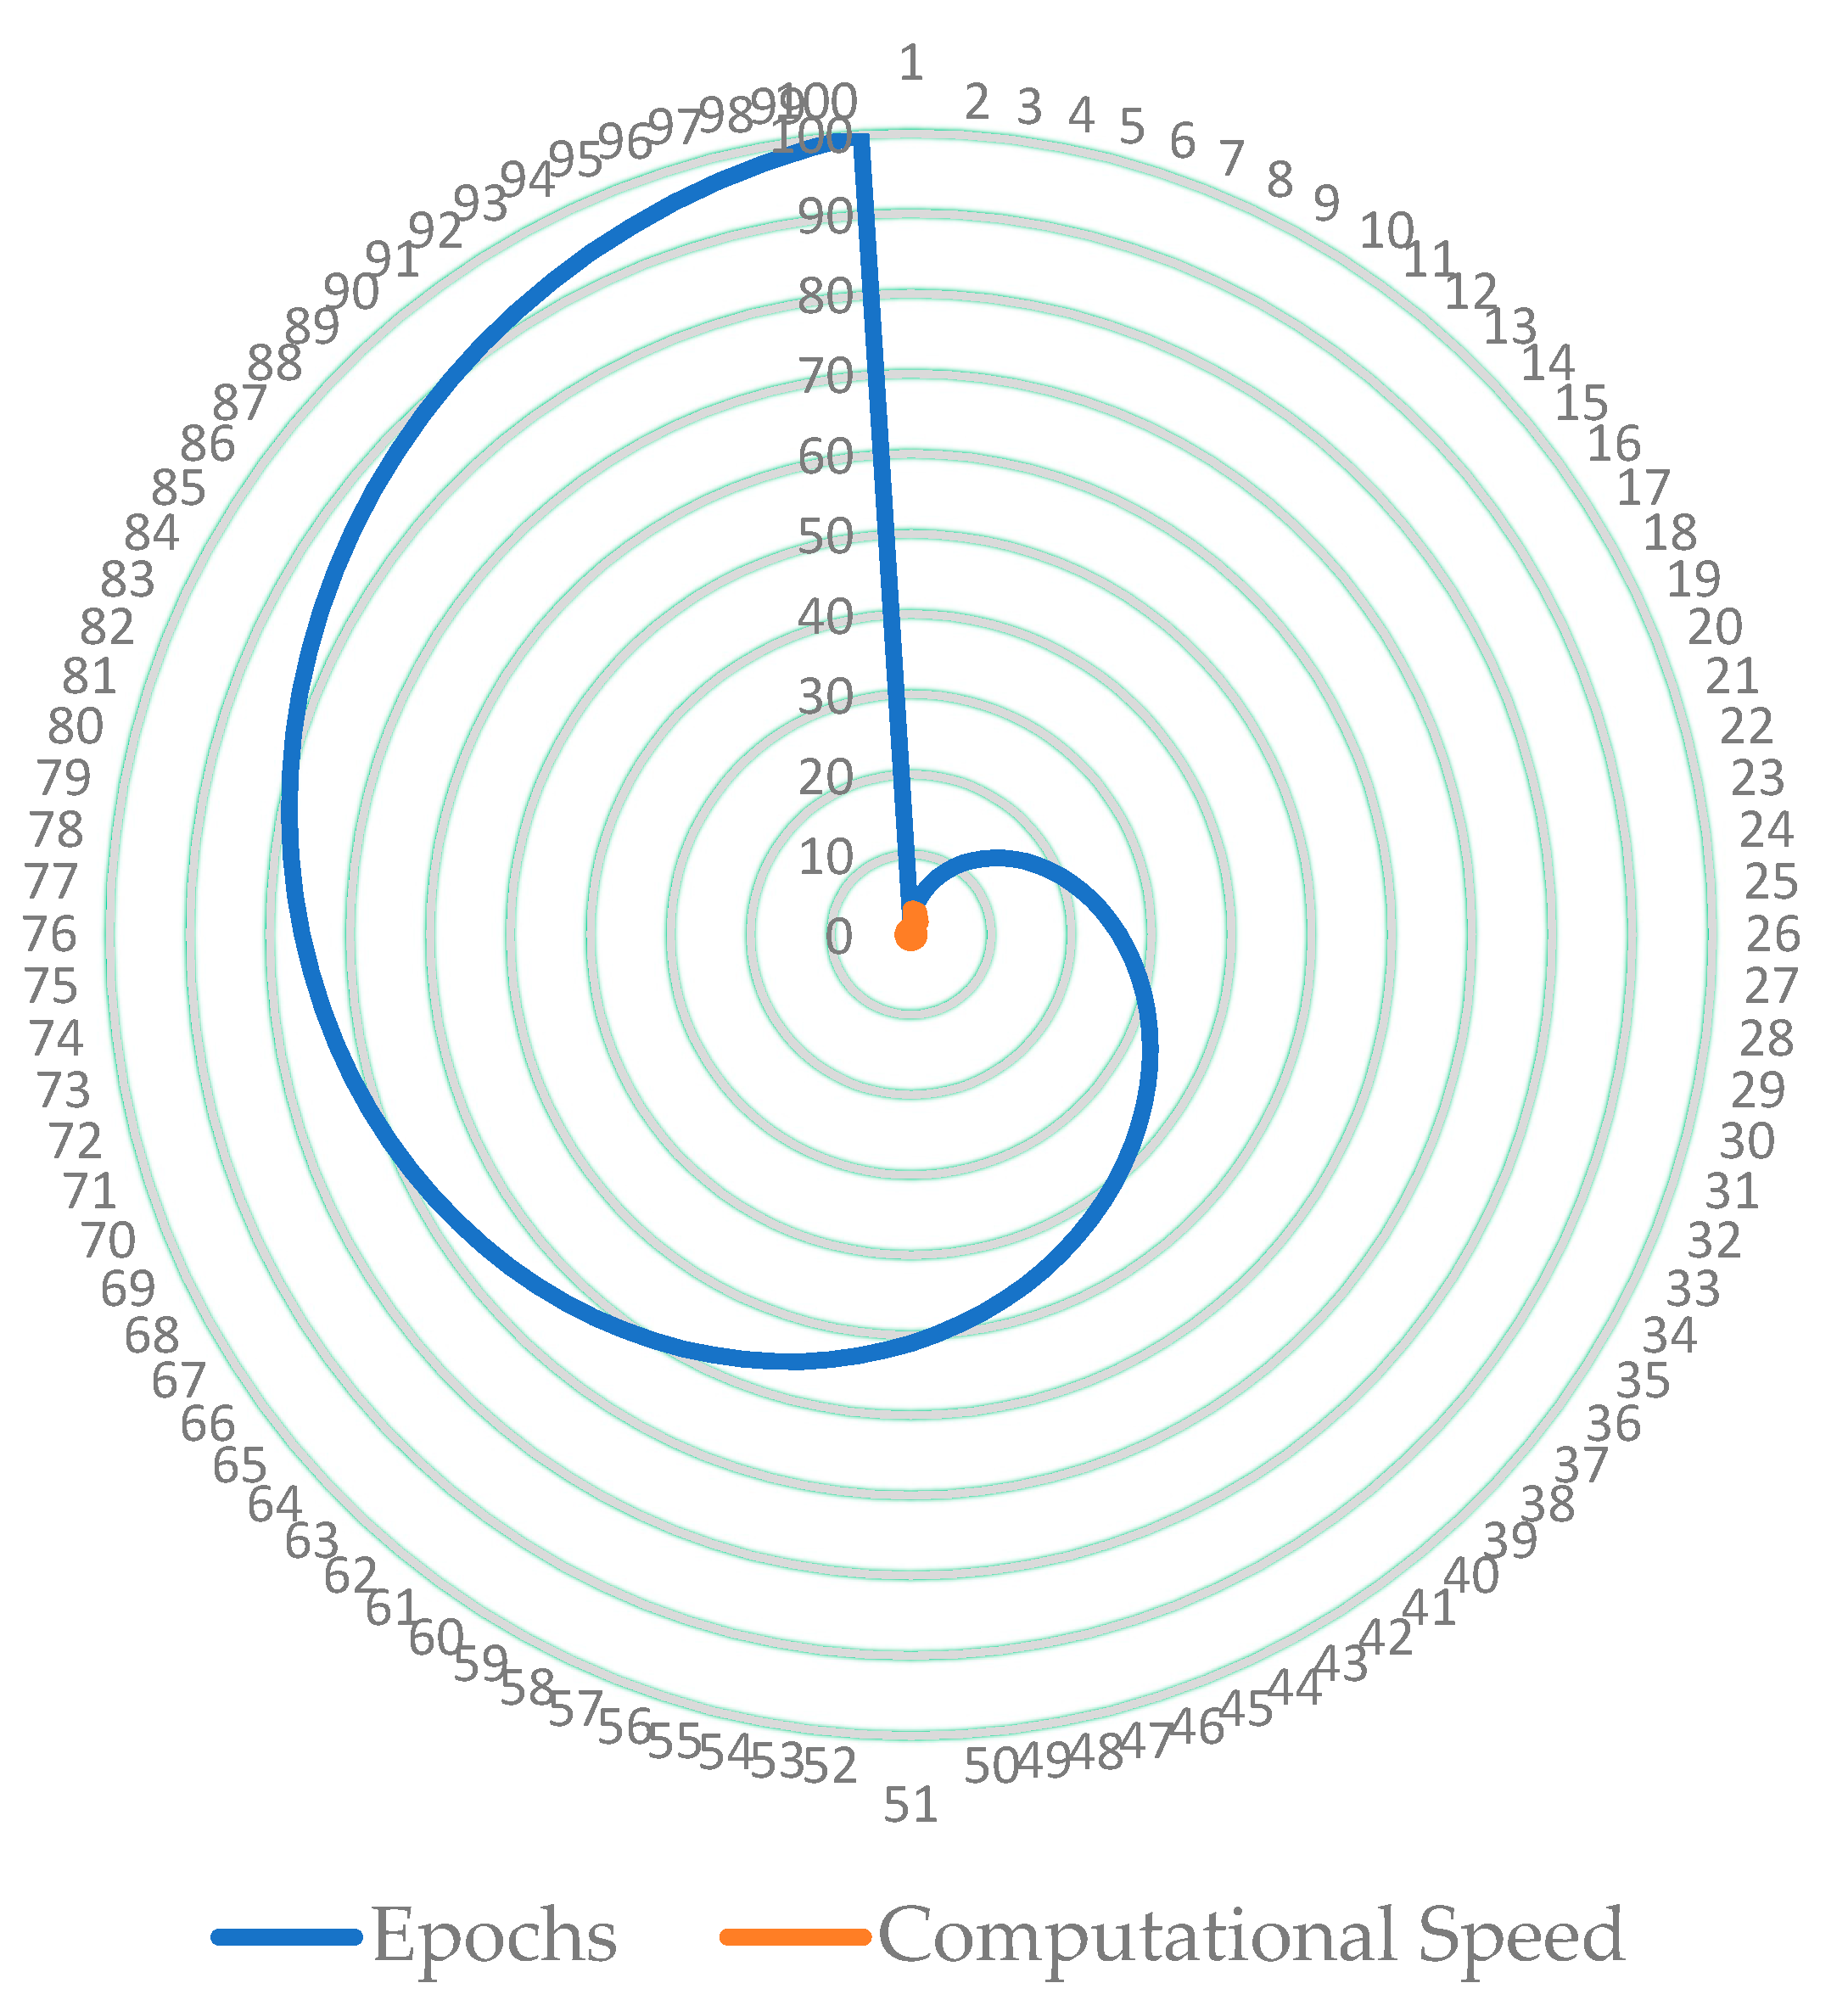
The computation speed and accuracy of the model are compared to those of previous studies. The current study made use of Tensor Processing Units (TPUs) version 2–8. The TPU used in this experiment had eight cores and 64 GB of memory. It was frequently observed that the optimal DBoTPN model consumed around 1 s for each epoch in the current investigation (see Figure 7), but the LSTM model developed by [38] consumed 85 s per epoch, and the LSTM model developed by [24] consumed 3 s per epoch. The major reason for the higher computational speed was due the reduced number of features using PCA.
6. Conclusions
A botnet is a severe cybersecurity issue since it has control over many infected hosts and can use them to carry out numerous attacks. Despite numerous earlier attempts at botnet detection, botnet attack prediction has received little attention. The major contribution of the present investigation was botnet attack prediction using the developed DBoTPM model based on a real botnet attack dataset for 6 months of traffic datasets for 10 hosts. The R2 value for 10 hosts for botnet prediction was between 0.1 to 0.72, with an average R2 value of 70% and an efficient computation time of 119 s for 100 epochs. Botnet detection was also performed using the AE model in the present investigation with 100% accuracy. Unbiased assessment of the DBoTPM model’s performance was based on the unanticipated data that were kept separate from the training procedure. Both models demonstrated superior performance and efficiency in terms of time. The current investigation’s future scope is to implement existing models using publicly available datasets.
Funding
Mohd Anul Haq would like to thank the Deanship of Scientific Research at Majmaah University for supporting this work under Project No. R-2023-132.
Data Availability Statement
All the data used in the present investigation is open source and the link were given in the relevant sections.
Conflicts of Interest
The author declares that they have no conflict of interest to report regarding the present study.
References
- Haq, M.A.; Khan, M.A.R.; AL-Harbi, T. Development of Pccnn-Based Network Intrusion Detection System for Edge Computing. Comput. Mater. Contin. 2022, 71, 1769–1788. [Google Scholar] [CrossRef]
- Meidan, Y.; Bohadana, M.; Mathov, Y.; Mirsky, Y.; Shabtai, A.; Breitenbacher, D.; Elovici, Y. N-BaIoT—Network-Based Detection of IoT Botnet Attacks Using Deep Autoencoders. IEEE Pervasive Comput. 2018, 17, 12–22. [Google Scholar] [CrossRef] [Green Version]
- Soe, Y.N.; Santosa, P.I.; Hartanto, R. DDoS Attack Detection Based on Simple ANN with SMOTE for IoT Environment. In Proceedings of the 2019 Fourth International Conference on Informatics and Computing (ICIC), Semarang, Indonesia, 16–17 October 2019; pp. 1–5. [Google Scholar]
- Aamir, M.; Zaidi, S.M.A. DDoS Attack Detection with Feature Engineering and Machine Learning: The Framework and Performance Evaluation. Int. J. Inf. Secur. 2019, 18, 761–785. [Google Scholar] [CrossRef]
- Bahşi, H.; Nõmm, S.; La Torre, F.B. Dimensionality Reduction for Machine Learning Based IoT Botnet Detection. In Proceedings of the 2018 15th International Conference on Control, Automation, Robotics and Vision (ICARCV), Singapore, 18–21 November 2018; pp. 1857–1862. [Google Scholar]
- Dietz, C.; Castro, R.L.; Steinberger, J.; Wilczak, C.; Antzek, M.; Sperotto, A.; Pras, A. IoT-Botnet Detection and Isolation by Access Routers. In Proceedings of the 2018 9th International Conference on the Network of the Future (NOF), Poznań, Poland, 19–21 November 2018; pp. 88–95. [Google Scholar]
- Bhattacharya, S.; Maddikunta, P.K.R.; Kaluri, R.; Singh, S.; Gadekallu, T.R.; Alazab, M.; Tariq, U. A Novel PCA-Firefly Based XGBoost Classification Model for Intrusion Detection in Networks Using GPU. Electronics 2020, 9, 219. [Google Scholar] [CrossRef] [Green Version]
- García, S.; Grill, M.; Stiborek, J.; Zunino, A. An Empirical Comparison of Botnet Detection Methods. Comput. Secur. 2014, 45, 100–123. [Google Scholar] [CrossRef]
- Ahmed, A.A.; Jabbar, W.A.; Al-Shakarchi, A.; Patel, H. Deep Learning-Based Classification Model for Botnet Attack Detection. J. Ambient Intell. Humaniz. Comput. 2020, 13, 3457–3466. [Google Scholar] [CrossRef]
- Alshamkhany, M.; Alshamkhany, W.; Mansour, M.; Khan, M.; Dhou, S.; Aloul, F. Botnet Attack Detection Using Machine Learning. In Proceedings of the 14th International Conference on Innovations in Information Technology IIT, Virtual Conference, 17–18 November 2020; pp. 203–208. [Google Scholar] [CrossRef]
- Alaiz-Moreton, H.; Aveleira-Mata, J.; Ondicol-Garcia, J.; Muñoz-Castañeda, A.L.; García, I.; Benavides, C. Multiclass Classification Procedure for Detecting Attacks on MQTT-IoT Protocol. Complexity 2019, 2019, 6516253. [Google Scholar] [CrossRef] [Green Version]
- Pei, X.; Yu, L.; Tian, S. AMalNet: A Deep Learning Framework Based on Graph Convolutional Networks for Malware Detection. Comput. Secur. 2020, 93, 101792. [Google Scholar] [CrossRef]
- Conti, M.; Dargahi, T.; Dehghantanha, A. Cyber Threat Intelligence: Challenges and Opportunities; Springer: Berlin/Heidelberg, Germany, 2018; Volume 70, ISBN 9783319739502. [Google Scholar]
- Chen, C.; Zhang, P.; Liu, Y.; Liu, J. Financial Quantitative Investment Using Convolutional Neural Network and Deep Learning Technology. Neurocomputing 2020, 390, 384–390. [Google Scholar] [CrossRef]
- McDermott, C.D.; Majdani, F.; Petrovski, A. V Botnet Detection in the Internet of Things Using Deep Learning Approaches. In Proceedings of the 2018 International Joint Conference on Neural Networks (IJCNN), Rio de Janeiro, Brazil, 8–13 July 2018; pp. 1–8. [Google Scholar]
- Chowdhury, S.; Khanzadeh, M.; Akula, R.; Zhang, F.; Zhang, S.; Medal, H.; Marufuzzaman, M.; Bian, L. Botnet Detection Using Graph-Based Feature Clustering. J. Big Data 2017, 4, 14. [Google Scholar] [CrossRef] [Green Version]
- Alothman, B.; Rattadilok, P. Towards Using Transfer Learning for Botnet Detection. In Proceedings of the 2017 12th International Conference for Internet Technology and Secured Transactions (ICITST), Cambridge, UK, 11–14 December 2017; pp. 281–282. [Google Scholar]
- Salim, M.M.; Singh, S.K.; Park, J.H. Securing Smart Cities Using LSTM Algorithm and Lightweight Containers against Botnet Attacks. Appl. Soft Comput. 2021, 113, 107859. [Google Scholar] [CrossRef]
- Joshi, C.; Bharti, V.; Ranjan, R.K. Analysis of Feature Selection Methods for P2P Botnet Detection; Springer: Singapore, 2020; Volume 1244 CCIS, ISBN 9789811566332. [Google Scholar]
- Nguyen, T.N.; Ngo, Q.-D.; Nguyen, H.-T.; Nguyen, G.L. An Advanced Computing Approach for IoT-Botnet Detection in Industrial Internet of Things. IEEE Trans. Ind. Informatics 2022, 18, 8298–8306. [Google Scholar] [CrossRef]
- Lefoane, M.; Ghafir, I.; Kabir, S.; Awan, I.-U. Unsupervised Learning for Feature Selection: A Proposed Solution for Botnet Detection in 5G Networks. IEEE Trans. Ind. Informatics 2023, 19, 921–929. [Google Scholar] [CrossRef]
- Wang, J.; Paschalidis, I.C.; Ch, I. Botnet Detection Based on Anomaly and Community Detection. IEEE Trans. Control Netw. Syst. 2017, 4, 392–404. [Google Scholar] [CrossRef]
- Haq, M.A. SMOTEDNN: A Novel Model for Air Pollution Forecasting and AQI Classification. Comput. Mater. Contin. 2021, 71, 1403–1425. [Google Scholar]
- Haq, M.A.; Jilani, A.K.; Prabu, P. Deep Learning Based Modeling of Groundwater Storage Change. Comput. Mater. Contin. 2022, 70, 4599–4617. [Google Scholar] [CrossRef]
- Yadav, C.S.; Singh, J.; Yadav, A.; Pattanayak, H.S.; Kumar, R.; Khan, A.A.; Haq, M.A.; Alhussen, A.; Alharby, S. Malware Analysis in IoT & Android Systems with Defensive Mechanism. Electronics 2022, 11, 2354. [Google Scholar] [CrossRef]
- Pincus, S.M. Approximate Entropy as a Measure of System Complexity. Proc. Natl. Acad. Sci. USA 1991, 88, 2297–2301. [Google Scholar] [CrossRef] [Green Version]
- Pincus, S.; Kalman, R.E. Irregularity, Volatility, Risk, and Financial Market Time Series. Proc. Natl. Acad. Sci. USA 2004, 101, 13709–13714. [Google Scholar] [CrossRef] [Green Version]
- Dehouche, N. Revisiting the Volatility of Bitcoin with Approximate Entropy. Cogent Econ. Financ. 2022, 10, 2013588. [Google Scholar] [CrossRef]
- Chen, J.; He, J.; Li, L. Modified Approximate Entropy Analysis for Data Processing of Electrochemical Noise with High-Time Resolution Toward Corrosion Monitoring. SSRN Electron. J. 2022, 205, 110425. [Google Scholar] [CrossRef]
- Farashi, S. Offline Spike Sorting Using Approximate Entropy. SN Comput. Sci. 2022, 3, 134. [Google Scholar] [CrossRef]
- Abaid, Z.; Sarkar, D.; Kaafar, M.A.; Jha, S. The Early Bird Gets the Botnet: A Markov Chain Based Early Warning System for Botnet Attacks. In Proceedings of the 2016 IEEE 41st Conference on Local Computer Networks (LCN), Dubai, United Arab Emirates, 7–10 November 2016; pp. 61–68. [Google Scholar]
- Abaid, Z.; Kaafar, M.A.; Jha, S. Early Detection of In-the-Wild Botnet Attacks by Exploiting Network Communication Uniformity: An Empirical Study. In Proceedings of the 2017 IFIP Networking Conference (IFIP Networking) and Workshops, Stockholm, Sweden, 12–16 June 2017; pp. 1–9. [Google Scholar]
- Hatada, M.; Scholl, M. An Empirical Study on Flow-Based Botnet Attacks Prediction; NIST Technical Note 2111; U.S. Department of Commerce: Washington, DC, USA, 2020; pp. 1–18. [Google Scholar]
- Khurma, R.A.; Almomani, I.; Aljarah, I. SS Symmetry IoT Botnet Detection Using Salp Swarm and Ant Lion Hybrid. Symmetry 2021, 13, 1–20. [Google Scholar]
- Haq, M.A.; Khan, M.A.R. Dnnbot: Deep Neural Network-Based Botnet Detection and Classification. Comput. Mater. Contin. 2022, 71, 1729–1750. [Google Scholar] [CrossRef]
- Naveed, K.; Wu, H. Poster: A Semi-Supervised Framework to Detect Botnets in IoT Devices. In Proceedings of the 2020 IFIP Networking Conference (Networking), Virtual Conference, 22–25 June 2020; pp. 649–651. [Google Scholar]
- Popoola, S.I.; Adebisi, B.; Ande, R.; Hammoudeh, M.; Anoh, K.; Atayero, A.A. SMOTE-DRNN: A Deep Learning Algorithm for Botnet Detection in the Internet-of-Things Networks. Sensors 2021, 21, 2985. [Google Scholar] [CrossRef]
- Wunsch, A.; Liesch, T.; Broda, S. Groundwater Level Forecasting with Artificial Neural Networks: A Comparison of LSTM, CNN and NARX. Hydrol. Earth Syst. Sci. Discuss. 2020, 552, 1–23. [Google Scholar] [CrossRef]
Figure 1.
Number of instances in each IoT device.

Figure 2.
The number of records for each IP during the observation period (a) before SMOTE; (b) after SMOTE.
Figure 2.
The number of records for each IP during the observation period (a) before SMOTE; (b) after SMOTE.

Figure 3.
Traffic flow for all 10 IPs for the observation period.

Figure 4.
Developed DBoTPM model for predicting botnet attack.

Figure 5.
Prediction of botnet attack using the developed DBoTPM model for 10 hosts. Blue lines show actual flow, and red lines shows the botnet prediction.
Figure 5.
Prediction of botnet attack using the developed DBoTPM model for 10 hosts. Blue lines show actual flow, and red lines shows the botnet prediction.

Figure 6.
AE values for all IP addresses during the observation period.

Figure 7.
The computational speed of DBoTPM model for botnet prediction.


Table 1.
Dataset after grouped by daywise flux.
| Features | Date | I_ipn | r_asn | f | yday | wday |
|---|---|---|---|---|---|---|
| 0 | 2006-07-01 | 0 | 436,704 | 106 | 182 | 5 |
| 10 | 2006-07-02 | 0 | 460,025 | 920 | 183 | 6 |
Table 2.
Uncertainty assessment metrics.
| Metrics | Formula | Description |
|---|---|---|
| MCC | X, y, and n are original, predicted, and the number of samples, respectively. | |
| RMSE | , and n represent the predicted value, actual value, and number of samples, respectively. | |
| MAPE | , and n represent the predicted value, actual value, and number of samples, respectively. | |
| NSE | and y represent the actual time series, mean of the actual time series, and predicted series, respectively. |
Table 3.
Performance evaluation of developed DBoTPM model for botnet prediction based on different accuracy metrics.
Table 3.
Performance evaluation of developed DBoTPM model for botnet prediction based on different accuracy metrics.
| IP | R2 | MCC | RMSE | MAPE | NSE |
|---|---|---|---|---|---|
| IP0 | 0.17 | 0.93 | 1.17 | 66.80% | 0.24 |
| IP1 | 0.72 | 0.21 | 0.35 | 12.30% | 0.78 |
| IP2 | 0.32 | 0.86 | 0.77 | 52.87% | 0.39 |
| IP3 | 0.58 | 0.53 | 0.59 | 17.87% | 0.65 |
| IP4 | 0.48 | 0.49 | 0.41 | 35.87% | 0.57 |
| P5 | 0.1 | 0.92 | 1.09 | 72.89% | 0.16 |
| IP6 | −0.58 | 0.75 | 0.83 | 17.62% | 0.66 |
| IP7 | −0.49 | 0.77 | 0.79 | 21.96% | 0.58 |
| IP8 | 0.09 | 0.93 | 1.27 | 73.98% | 0.14 |
| IP9 | −0.57 | 0.64 | 0.87 | 15.94% | 0.69 |
Table 4.
Comparison of the DBoTPM model for botnet prediction used in the present investigation with other studies.
Table 4.
Comparison of the DBoTPM model for botnet prediction used in the present investigation with other studies.
| Studies | Model | Dataset | R2 | RMSE | Remarks | Limitations |
|---|---|---|---|---|---|---|
| Current Study | DBoTPM | CCNT, N-BaIoT | 71% | 0.81 | Less computation time (119 s) | Three IPs (0, 5, and 8) showed less predictive accuracy due to their abrupt behaviour caused by the botnet attack. |
| [2] | Autoencoders | N-BaIoT | 100% | - | TPR | Computational overhead for training was high with more than 45 min |
| [31] | Markov chain | SysNet, ISCX | 98% | - | Accuracy | The dataset utilized in this study had a high state change probability from communication to attack when it was first created. |
| [32] | Analyzers | SysNet | 20% | - | Predictive capability | Lower prediction capability |
| [33] | psLSTMs | NIST | 76% | 0.83 | Accuracy and precision | Training time was very high for the DL model (8.17 h). |
| [33] | SVM | 71% | 0.26 | Accuracy and precision | Training time was high for the ML model (4.57 min). | |
| [34] | SSA-ALO | N-BaIoT | 99% | - | TPR | Data from one node which was the security camera took 23 s alone to detect a botnet attack. |
Table 5.
AE values for all 10 IP’s.
| AE0 | AE1 | AE2 | AE3 | AE4 | AE5 | AE6 | AE7 | AE8 | AE9 |
|---|---|---|---|---|---|---|---|---|---|
| 0.01 | 0.02 | 0.01 | 0.36 | 0.01 | 0.17 | 0.29 | 0.00 | 0.01 | 0.26 |
Table 6.
Comparison of AE-based botnet detection used in the present investigation with other studies.
Table 6.
Comparison of AE-based botnet detection used in the present investigation with other studies.
| Model | Detection Accuracy | Limitation | Source |
|---|---|---|---|
| Deep Autoencoders | 84% | Unable to detect less-known botnets | [2] |
| DL technique | 99.6%, | Less feasible for real-time data | [9] |
| Proof of concept, analysers | 77% | Lower accuracy, only 8 h of the dataset | [32] |
| DNNBoT | 90.71% | Computational speed of 3 s/epoch | [35] |
| Semi-Supervised | 80% | Lower accuracy | [36] |
| SMOTE-Recurrent Neural Network (DRNN) | 99.98% | Lack of data pre-processing | [37] |
| AE | 100% | Computational speed of 50 s | (Current study) |
Disclaimer/Publisher’s Note: The statements, opinions and data contained in all publications are solely those of the individual author(s) and contributor(s) and not of MDPI and/or the editor(s). MDPI and/or the editor(s) disclaim responsibility for any injury to people or property resulting from any ideas, methods, instructions or products referred to in the content. |
© 2023 by the author. Licensee MDPI, Basel, Switzerland. This article is an open access article distributed under the terms and conditions of the Creative Commons Attribution (CC BY) license (https://creativecommons.org/licenses/by/4.0/).
Share and Cite
MDPI and ACS Style
Haq, M.A. DBoTPM: A Deep Neural Network-Based Botnet Prediction Model. Electronics 2023, 12, 1159. https://doi.org/10.3390/electronics12051159
AMA Style
Haq MA. DBoTPM: A Deep Neural Network-Based Botnet Prediction Model. Electronics. 2023; 12(5):1159. https://doi.org/10.3390/electronics12051159
Chicago/Turabian StyleHaq, Mohd Anul. 2023. "DBoTPM: A Deep Neural Network-Based Botnet Prediction Model" Electronics 12, no. 5: 1159. https://doi.org/10.3390/electronics12051159
Note that from the first issue of 2016, this journal uses article numbers instead of page numbers. See further details here.