1. Introduction
Recent breakthroughs in text analysis and natural language processing (NLP) as well as digital technologies have led to the creation of a slew of new applications [
1]. Expanding the number and variety of textual data created on a daily basis and new artificial intelligence approaches can dramatically advance research in terms of practical concerns. One of the fundamental ideas in text analysis and NLP is text classification. The definition of the text categorization issue is associating pertinent material with existing labels. In this sort of labeling, the dataset structure is crucial. A text can be represented with a unique label or a bundle of labels, depending on the type of problem. As a result, many techniques for text classification have emerged.
Table 1 displays the many text categorizations that resulted from various methodologies. Text classification relying on the structure is frequently performed with binary classification, a simple method. Each text is divided into categories so that it can only be identified by several of the two labels. The applications for binary text categorization include authorship verification [
2] and the recognition of untruthful news [
3]. Unlike binary classification, multiclass text classification has more than two labels. The only thing multiclass and binary text classification have in common is that a single label in both models represents each text. Topic modeling [
4], synonym extraction [
5], and SA [
6] are a few instances of multiclass textual classification tasks.
People’s reviews are necessary for certain situations, such as arranging events, product marketing, and categorical text categorization, whilst having information on all aspects enables one to produce successful results; however, these results are not satisfactory due to the more complex meanings of the language we employ and the expressions we create in these contexts. Even if it is feasible, there are situations wherein confining documented representation with a particular label averts further precise data retrieval. Multi-label information is necessary due to digital technology advancements to satisfy individual expectations. Numerous text mining methods are used to analyze various labeling texts. However, each text with a various labeling text classification system may contain one, two, or more labels.
As visible in human actions, applications of artificial intelligence, and advancements in digital technologies, people extensively rely on the Internet for travel, learning, marketing, etc. In other words, it is true that, across society, people have incorporated the Internet into regular activities, as evidenced in the processes of Internet commerce, digitalization, and daily digital life during the COVID-19 pandemic.
The author in [
7] enlightened us to the fact that 94.6% of Internet users are engaged in electronic commerce. Furthermore, 42% of consumers in the US receive at least one delivery from Amazon each week. This number increases to 50% for customers between the ages of 18 and 25 and 57% for those between the ages of 26 and 35 [
8]. By 2040, it is predicted [
9] that e-commerce will account for 95% of all transactions. Product reviews strongly influence customers’ Internet purchases; 55% of online buyers let their relatives and friends know when they are unhappy with a company’s product [
10]. Additionally, 90% of customers research products online before buying. Researchers have thus been interested in the daily volume of data and its impact on customers.
Techniques for categorizing online store customer reviews and prospective labels allow the seller to ship it out right away [
11]. Such a person might benefit from reading evaluations by categorizing them according to their priorities. This makes it crucial to consider consumer feedback’s emotive and qualitative aspects. Most existing research relies on sentiment polarity assessment, while extracting many labels with the help of review exploration is yet considerable in research [
12]. Our novel model will help in the identification of numerous labels, which is based on input reviews.
The suggested method employs a linguistic approach to conduct sentiment analysis at the sentence level to ascertain the strength and polarity of sentiment for the various components of a movie. Both domain-specific vocabulary (derived from SentiWordNet [
12]) and a general opinion lexicon (derived from the subjectivity lexicon) are used in this method to give each word in a phrase a predetermined sentiment score. From the syntactic structure of a phrase, a collection of grammatical dependencies is created between the words, and a dependency tree is built. The sub-trees of the dependency graph indicate individual clauses that address specific issues in the film. Then, we utilize the grammatical dependencies and previous sentiment ratings of the individual phrases to deduce the contextual sentiment score of each sentence. A phrase such as “I love the tale but not the music” may be broken down into its parts. A contextual emotion score is then produced for each movie component (such as the plot or the music) based on the clauses separated from the original statement. Contextual sentiment scores for each phrase are computed, then scores for each review component are calculated, and finally, an overall contextual sentiment score for the sentence is determined.
Compared to usual categorization strategies, multi-label studies of these data are crucial since thorough analyses may yield insightful results for consumers looking to buy items and businesses looking to enhance their management of customer relationships through user evaluations. Let us take the scenario of someone shopping for an urgently needed item. Their primary inquiry is regarding the merchandise during this procedure. In this work, we performed multi-labeling based on aspect-based analysis. Multi-labeling categorization is carried out with the vectorization of data. The vectorized data are classified using the tuned classifier for multi-layering. Lastly, compare the suggested classifier to the current methodologies.
Section 2 discusses major work by other academics on multi-label learning.
Section 3 of the conceptual approach for multi-labeling, which employs a ResNet-based ensembler, discusses the mechanics of our process.
Section 4 summarizes the framework and thoroughly explains the experiment’s findings. The report’s results and research recommendations are included in
Section 5 of the study.
Research questions:
How should a sentence containing positive and negative sentiment be handled?
How can data with multiple features and multiple dimensions be effectively handle?
How accurately does the classifier classify the multi-label?
2. Related Work
Through SA, people’s attitudes, beliefs, and sentiments toward a specific object are methodically evaluated [
13]. In the NLP domain, SA is widely used by many researchers to evaluate customer input reviews. Polarity analysis has been the focus of nearly all of these studies. In [
14], the author used uni-gram for feature extraction and grid search ensemble with the support vector machine (SVM) to increase the categorization accuracy effectiveness for real-time input user review. They used datasets that contained both favorable and unfavorable Lazada and Amazon evaluations. According to their experimental findings, employing grid search with SVM and uni-gram may increase the correctness of the reviews of Amazon users by 27.5% to 81.9% and the reviews of Lazada users by 5.37% to 91.24%. The learning accuracy of the multi-labeling method and handling the multidimensional data of the user’s review, the author utilizes naïve Bayes [
15]. They used sentiment datasets from Amazon’s movies and consumer comments for their research. Their test findings showed that their approach might use prior domain expertise to support learning in new areas. It was more capable of dealing with constantly updated reviews from multiple domains.
The author in [
16] used Amazon customer review data to analyze aspect-level sentiment and investigated whether the feedback was positive, negative, or neutral. In their comparison investigation, the author obtained an accuracy of 0.9023 using naive Bayes. The author in [
17] presented the real-time sentiment classification of online website reviews. The author presented a model based on the SVM mechanism, which will analyze the trends of products among Amazon users and classify them into bad and good reviews. With SVM’s help, the evaluations’ SA produced an F1 score of 0.9354%. Women’s e-commerce reviews were subjected to SA by [
18] utilizing probabilistic latent Dirichlet allocation. For any new review on online websites, the researcher gathered the textual phrase in the review on online e-commerce axioms, which is approximately 36, in which 4 of 17 websites had varied helpfulness votes. The author utilized a random forest classifier, which produced an accuracy of 0.945%. The author in [
19] focused on extracting customer feedback from online retailers such as Amazon. The author applied a machine learning model including naïve Bayes to classify the review’s sentiment. Furthermore, the author utilized SentiWordNet and logistic regression to draw the link association between the comments. Naïve Bayes achieved accurate text classification with link association using opinion mining. In other research, the reviews of Japanese products were analyzed with a formulation of semantic orientation [
20]. For review sentiment classification, the researcher in [
21] employed a deep learning strategy to classify the 1500 reviews in their analysis as either excellent or negative. The author gathered Amazon reviews and separated the sentiment into positive and negative groups. The review SA accuracy of their deep learning technique is 0.866.
For e-commerce reviews, [
22] employed a directed weighted multivariate categorization technique. The 10,000 reviews of Amazon Review Data were utilized. Multi-label classification was used to analyze the review sentiment. Their directed weighted approach has an average recall of 0.82. The author [
23] developed a deep neural network strategy to include user feedback while creating recommendation systems. They utilized a dataset of 143.8 million reviews from Amazon Review Data. A brand-new SA model termed MBGCV was proposed by [
24]. A total of 31,107 reviews that had been positively or negatively scored were included in the survey. Their suggested model has a review SA accuracy score of 0.94. Another memory model, i.e., long short-term model (LSTM), was employed to evaluate the reviews of consumers of the Turkish language [
25]. Two different datasets of the reviews are made to analyze the SA. They acquired a brand-new corpus of more than 7000 evaluations to perform an SA of Turkish users’ preferences. The deployment of the LSTM model classified the data into good or bad reviews. It is found that LSTM can better perform binary SA with an accuracy of 0.912. Another in [
26] presented a methodology for unlabeled sentiment classification in Turkish texts.
To categorize the polarity of movie reviews, they used their framework. In [
27], the researcher used BERT to analyze the sentiment in movie and product reviews employing positive and negative labeling. Their study’s best outcome was an accuracy of 93.3%. An improved result achieved by the author in [
28] using gated recurrent unit SA to classify Turkish e-commerce customers’ opinions as neutral, negative, and positive was 0.95. Ref. [
29] used latent Dirichet analysis to investigate the underlying sentiment of Turkish reviews by looking at several features of the reviews. The researchers analyzed 1292 user reviews to determine the top nine characteristics shared by smartphones. They found that the F-score was 82.39% after applying the appropriate adjustments.
Aspect-oriented SA aims to classify sentiment occurrences by comprehending how they appear in reviews and identifying each sentiment’s originator. This process may be carried out in phases or as a component of a multifunctional process. Aspect extraction is used to solve the user view summary [
30] task, after which an overview is created using item characteristics specified as the objectives expressed in item comments. Statements are condensed from remarks. When extracting information, one may categorize them either automatically or explicitly. They used 32,207 reviews, both positive and negative, for their investigation. Their recommended model had an accuracy of 0.94 when the reviewed SA was performed. Turkish customer evaluations were subjected to LSTM approach-based text SA. SA was performed on two independent datasets. To conduct the text analytics on Turkish clients’ preferences, they obtained a brand-new corpus of over 7000 assessments. They used an LSTM-based model to classify the data as positive or negative and discovered that the accuracy for binaries’ sentiment classification was 0.905%.
The author in [
31] devised a methodology for unlabeled sentiment text analysis in Turkish. The author applied their framework, which they developed from the public’s personalized remarks, to categorize the polarity of movie reviews. Aspects are handled implicitly if they are included in the input comment and explicitly if they are mentioned in the comment, even if they are not explicitly expressed. For instance, the word “cost” in the statement “this phone is pricey” refers to the price of the phone, but the term “price” in the phrase “this phone is expensive” refers to the cost of the phone. Although implicit components are frequently disregarded, most published works have focused on explicit aspects, as seen in [
32]. There are four main approaches to this problem, according to the literature. One method uses the word frequency to characterize the elements in a specific area [
33]. The aspect that shows up the most is a contender for that aspect when dealing with the collection of related annotations. Aspect word proportions in the target domain and throughout a multi-domain corpus varied drastically recently, which has led to the introduction of algorithms that draw on this concept [
34]. In the second approach, remarks exploit the grammatical relationship between nouns and adjectives. This approach is known as two-fold propagation, and it is used frequently. Using the third technique, a supervised learning model is produced. Hidden Markov models (HMM) and conditional random fields (CRF) [
35] are two effective and succinct iterative learning methods.
The aspect extraction technique uses words and comment phrases as markers. The primary states are expressed viewpoints. Training data are labeled with symbols that match examples, and model parameters are fed examples to accurately present analysis findings. In the first three stages, we frequently encounter various problems. Typically, we use terminology to define elements. It is reasonable to suppose that many people use specific words to express a notion. This problem is solved by classifying the obtained dimension keywords [
36] using synonyms, synonym similarity, and distance. To tackle this problem, the fourth strategy—simultaneous selection and grouping—using the topic model—is being investigated. Topic models determine the subjects of a group of documents (and how they are distributed). Thus, a topic is often a collection of words. The proportion of articles that cover a topic is known as the topic distribution. Online reviews are regarded as details which are captured during extraction, and subjects may contain pertinent review material. As a result, the subject may be described as representing a variety of features. These dimensions determine the elements. The approach has both explicit and implicit qualities [
37]. The results of using several thematic methods for extracting emotions and characteristics, such as the probabilistic latent assignment of Dirichlet and latent semantic analysis, were impacted by these techniques and differences in the delivery [
38]. Although the comments on a specific subset of issues will be included in product assessments, the delivery of themes is comparable. The aspect extraction thematic model must also be expanded to account for this problem and choose the proper aspect because it is often constructed on top of the global thematic model. For a topic model, terms belonging to a particular dimension, global-level words, context words, and understanding words are often designated independent categories. The most crucial information will be removed while producing fresh concepts. One of the standard techniques to adapt classification algorithms is to modify the current algorithm to handle multi-label problems.
Compared to state-of-the-art ABSA techniques, the limitations of machine learning-based approaches become clear.
Although lexicon-based approaches need minimal training, they perform poorly in terms of accuracy because of the scope of the lexicon. Furthermore, lexicon-based approaches cannot be used in fields where definitive lexicons do not exist.
Most ABSA algorithms that rely on machine learning split the categorization of attributes and attitudes into two distinct phases. To maximize efficiency, it is best to think of both processes as a whole and not try to untangle their many logical and semantic links.
Earlier research in this area has extracted features and attitudes at the word level [
7,
10], while other research has relied on linguistic patterns among words [
6,
11]. However, keeping the sentences’ meanings’ intact requires considering them as sequences (of words).
Polarized opinions are sometimes expressed in reviews, although they are more often directed at the specific features of goods or services than at the companies or people being evaluated (e.g., restaurants and movies). However, these feelings may be directed against the entities, with specific factors considered (e.g., a certain type of restaurant or genre of movies). Traditional sentiment analysis and ABSA techniques have mostly ignored this sort of study up to date.
3. Proposed Methodology
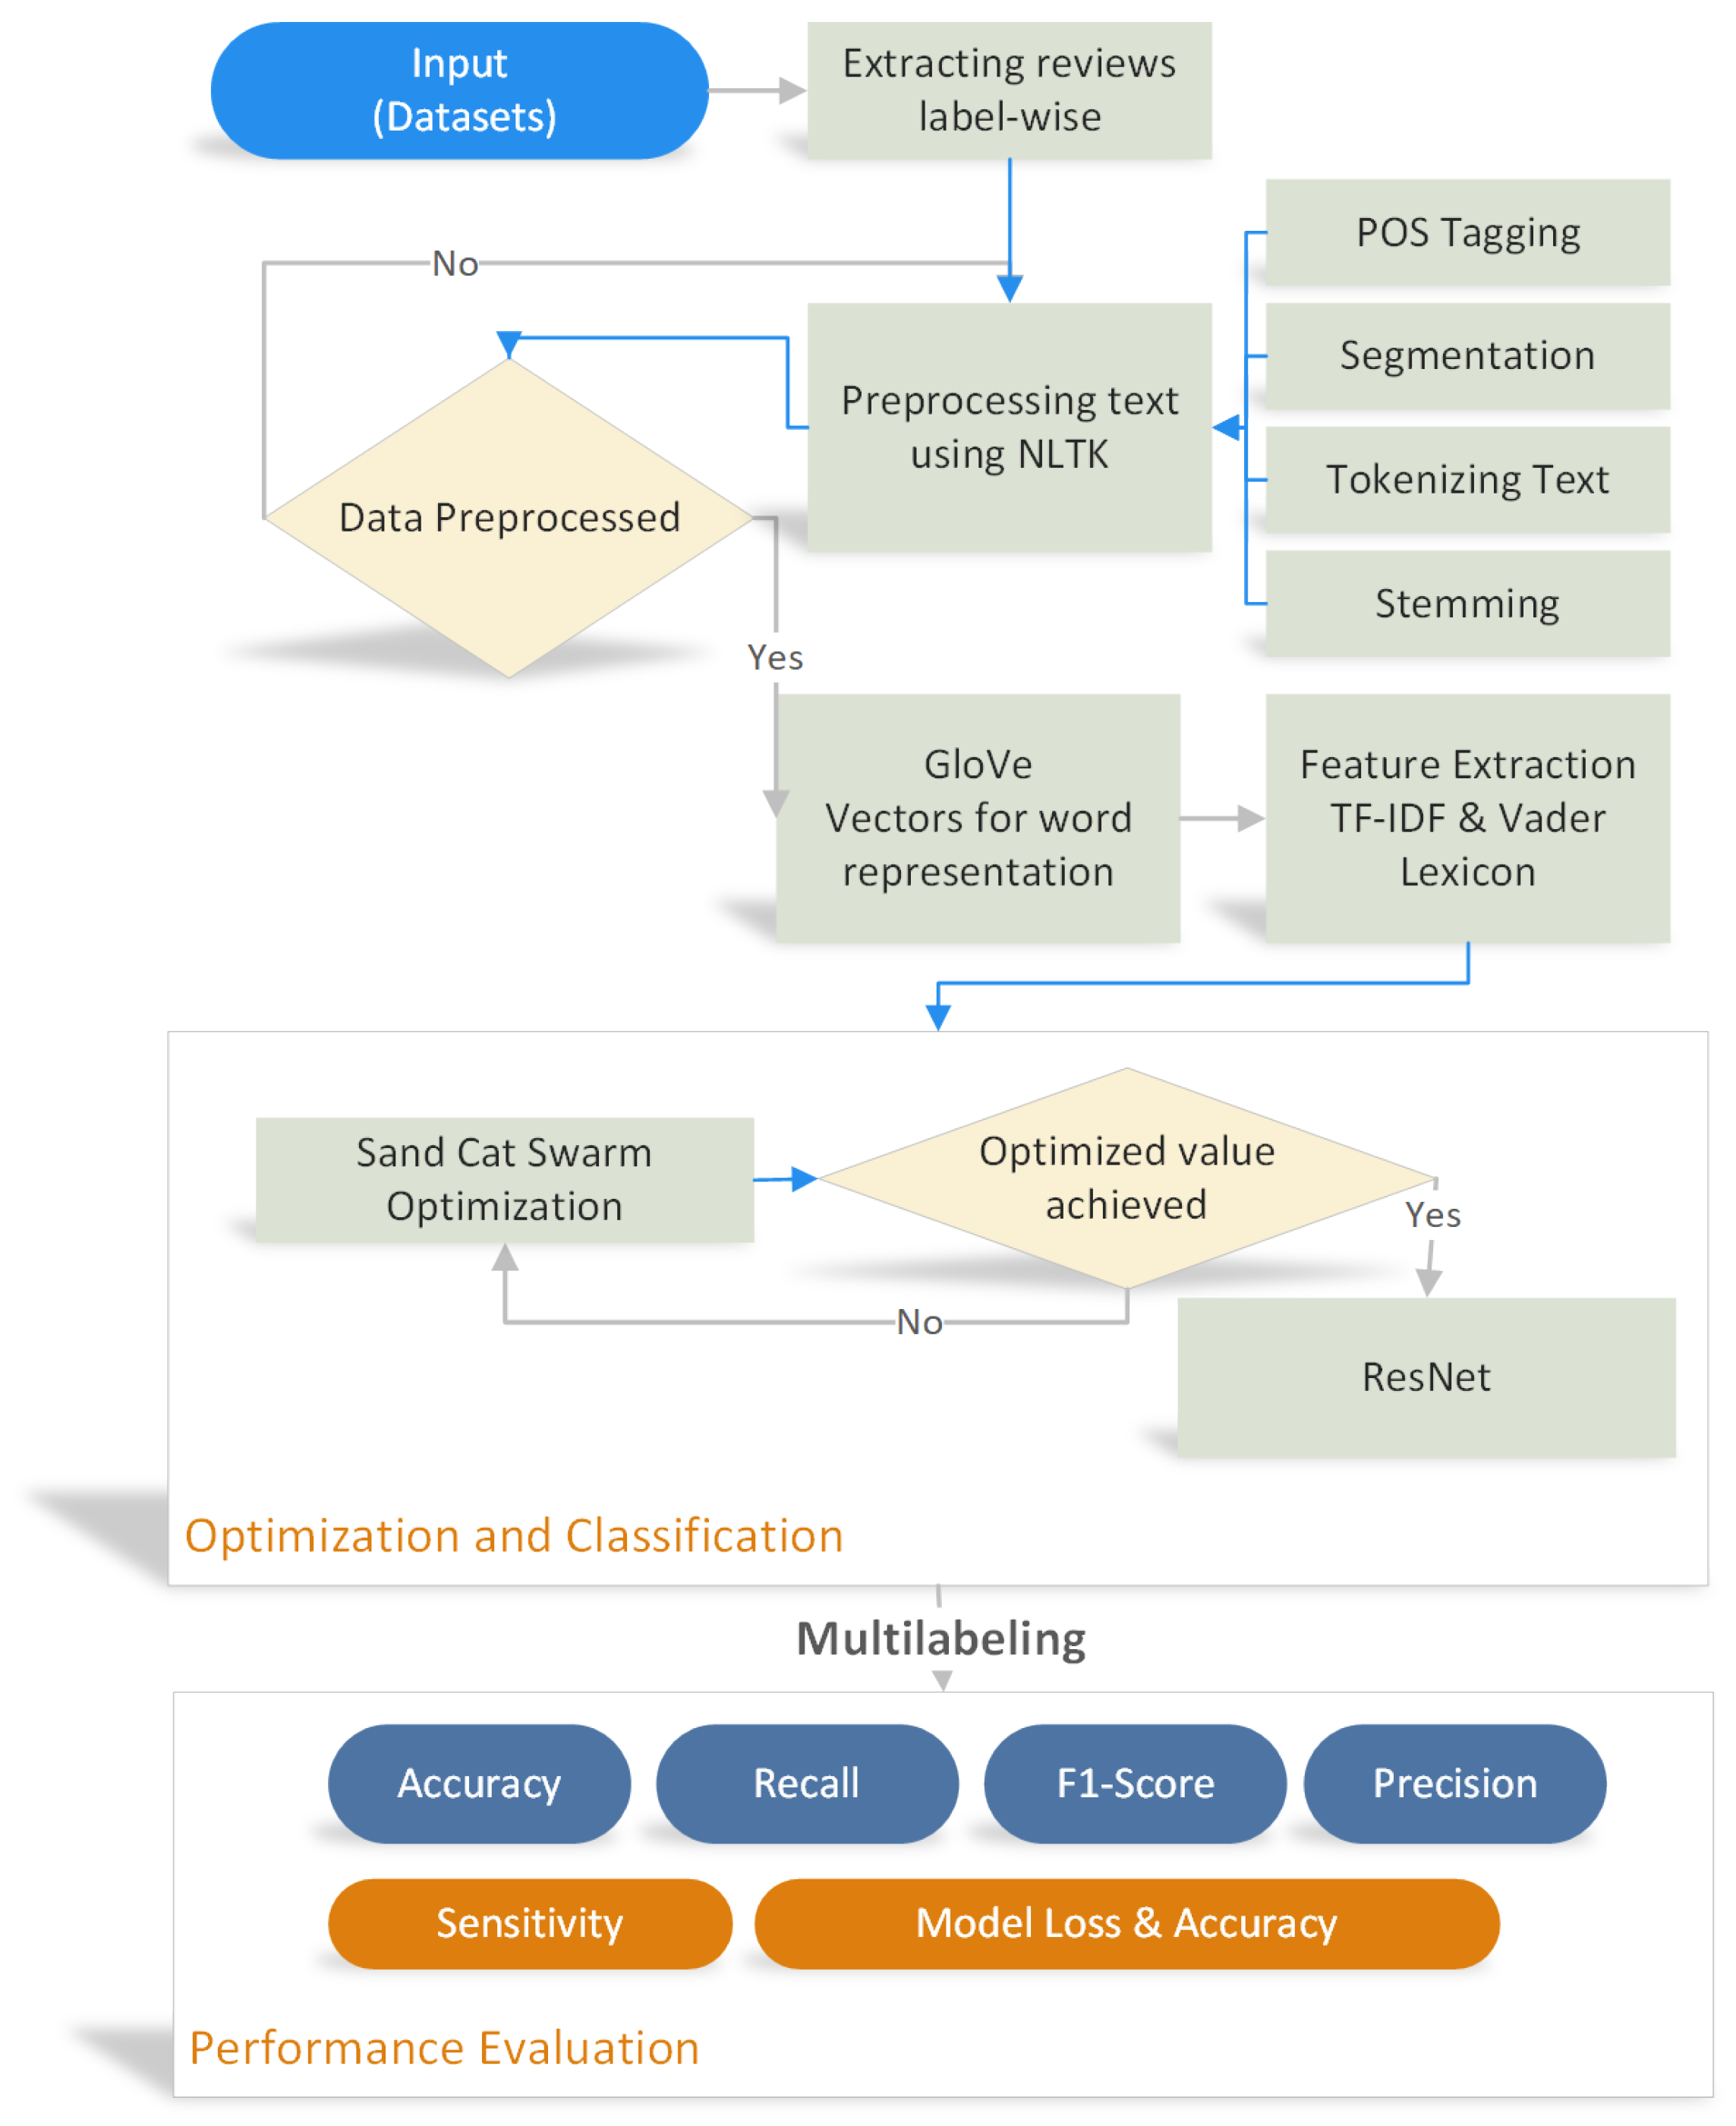
To resolve the issue of multi-labeling discussed above, we proposed a model which includes preprocessing, word2vec representation and swarm hybrid technique implementation, as shown in
Figure 1. First, scrape the web for data before using online data repositories to obtain data.
Secondly, the reviews are extracted label-wise from the dataset. Thirdly, using the NTLK library, the data are preprocessed; POS tagging, Tokenizing, segmentation, and stemming, etc. The attributes of the updated data are then retrieved and contrasted. The fact that we are combining vectorized and multi-labeled data presents a challenge. Fourthly, the data are created into vectors using the data representation GloVe and word2vec. Fifthly, the features/aspects are extracted using TF-IDF and Vader Lexicon. The extracted features are then passed to the tuned classifier ResNet-SCSO. The SCSO provides the optimum values to the ResNet, which makes it better for the input classification. Before multi-labeling is attempted, the data are trained and assessed using the proposed method.
3.1. Aspect-Based Sentiment Analysis
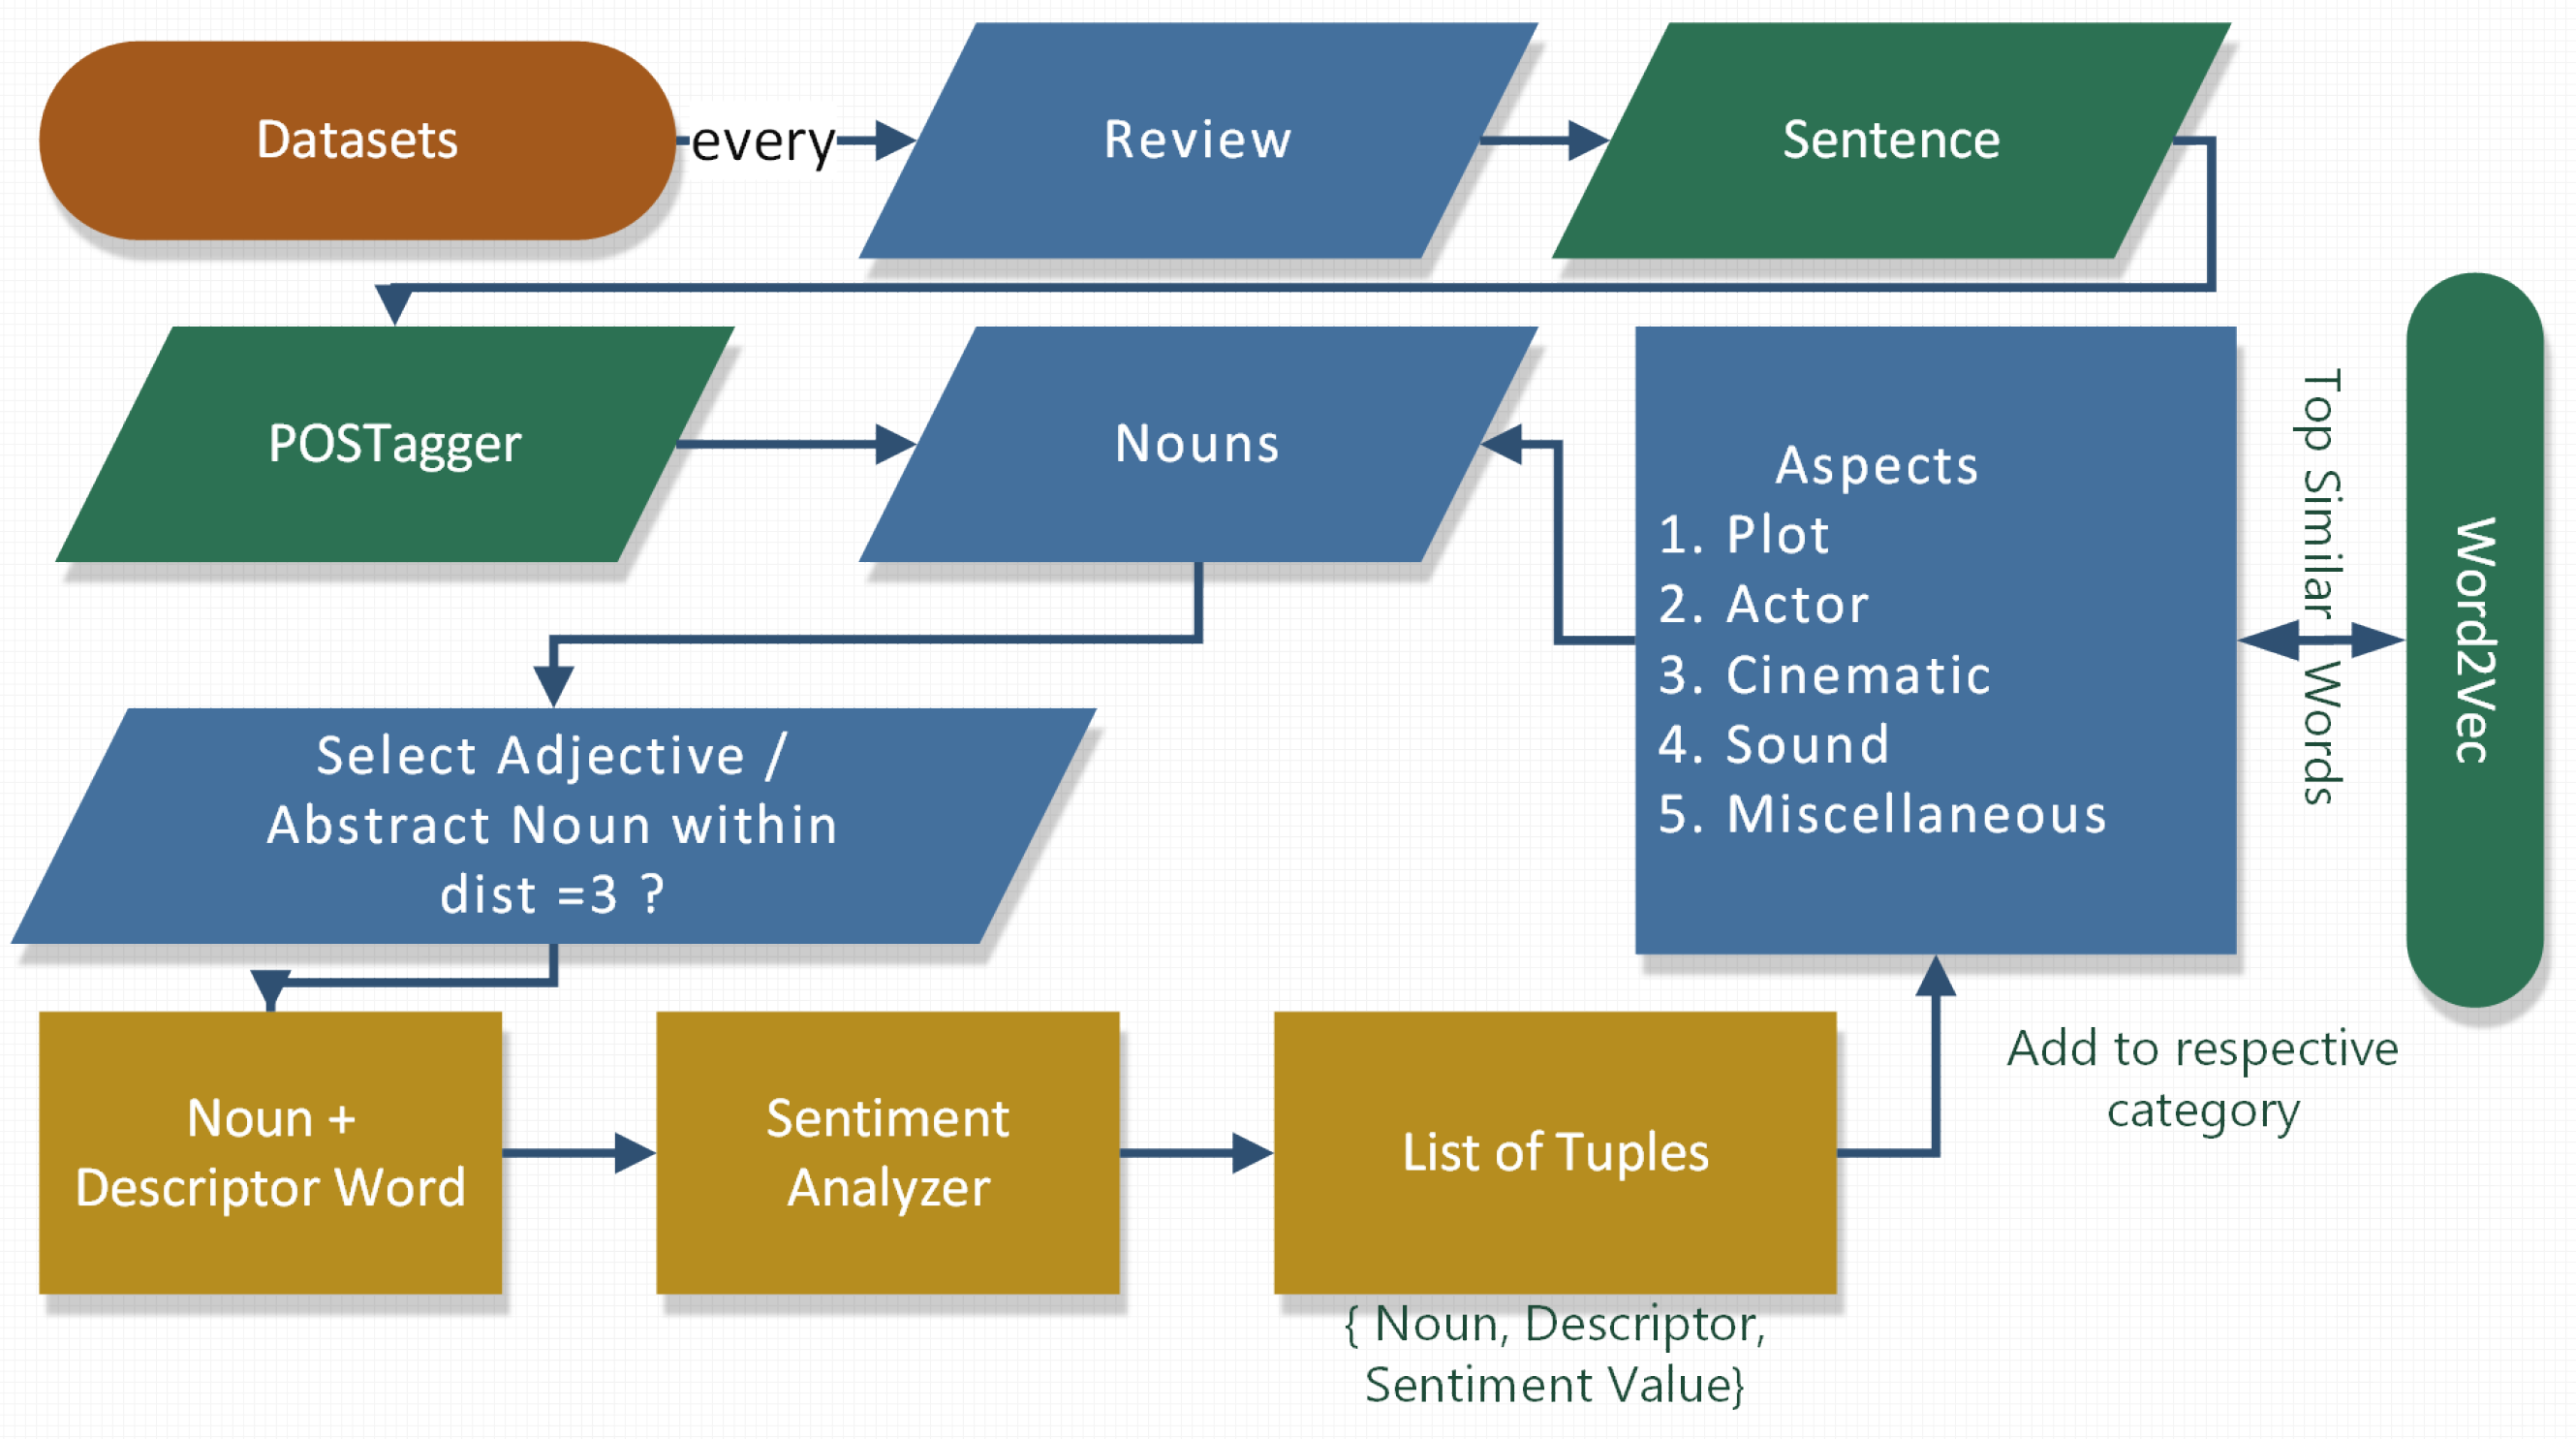
In aspect-based sentiment analysis, information is first categorized into “aspects”, and then, the emotional tone associated with each “aspect” is determined. Aspect-based sentiment analysis makes it easier to evaluate customer feedback by associating certain emotions with the individual characteristics of a product or service. When researchers talk about something such as “the user experience of a new product”, “the response time for an enquiry or complaint”, or “the ease of integration of new software”, they are talking about the aspects of those things. Some of what an aspect-based sentiment analysis could reveal is as follows:
Sentiments: judgments, either favorable or negative, on a certain feature;
Aspects: anything which is being discussed; the object of discussion.
Aspect sentiment analysis has various uses for organizations, including the automated categorization and analysis of customer data, the automation of processes such as customer service duties, and acquiring actionable insights in real time. People in the market are more vociferous than ever. They take pleasure in interacting with businesses and providing positive and negative comments. Customers leave a plethora of information about what they like and do not like about a company with every mention and remark they make. However, finding what one needs amid all these data may be challenging. On the other hand, aspect-based sentiment analysis automatically performs all the heavy lifting.
Teams cannot possibly go through thousands of tweets, customer service discussions, or customer evaluations by hand, particularly if they want to perform fine-grained analyses. Businesses may save time, money, and resources by using aspect-based sentiment analysis to automatically examine large volumes of data in great depth.
Using aspect-based sentiment analysis, companies may quickly address consumer concerns about the specific features of a product or service. Does a program have a bug? Has there been a serious glitch in recently released software? Is a certain aspect of the service or product causing consumers the most ire? Sentiment analysis based on features may help one see and respond to situations like these in real time.
Humans can identify many facets and emotions inside a text; however, we sometimes lack objectivity. The degree to which we agree on the emotions conveyed by a given passage of literature heavily depends on the individual reader, as impacted by their background, outlook, and experiences. Employing a centralized model for aspect analysis allows firms to apply the same standards to all texts, leading to more reliable findings.
The process of aspect-based sentiment analysis is shown in
Figure 2.
3.2. Data Collection
Five multi-label datasets are used in this article: movie, research article, protein, bird, and medical. These datasets were collected from Kaggle’s website, UCI repository, and web scrapping method. In this article, a novel method is proposed, which is a format based on aspects and a correlation measurement between labels before nominal scaling is achieved. We gathered five datasets with a wide range of label types to examine the performance of the suggested model. A wide range of application areas are benchmarked against each other to determine the proposed ResNet-SCSO. Various categories are available, including research articles and medicine, which are frequently used to categorize texts based on these datasets. Research articles contain 1800 evaluation instances as a dataset, providing a context for comparisons. Movies represent 1300 distinct sorts of movies, each with one example, and six protein classes, which classify a wide range of proteins.
3.3. Processing of Data
Data preparation is the process of transforming acquired data into a usable format. This stage converts raw data into structured data. For data retrieved by scraping, there may be blank lines and columns. The pandas library then examines the data and preserves pertinent information. Multi-labeling necessitates extensive preprocessing since it has a direct impact on multi-labeling. When an attribute or attributes are missing, there are abnormalities or outliers in the data, or the information is null or inaccurate, the data are called impure. The findings’ credibility would be jeopardized if the aforementioned situations occurred.
3.4. Feature Extraction and Vectorization of Words
Words in the top layer of the network provide lexical and structural information to feature vectors. While Vwords gives the character vocabulary, Vchar provides the word vocabulary. Character-level embedding aims to obtain shape and morphological information, whereas word-level embedding aims to obtain semantic and syntactic information. Words are encoded in a matrix using column vectors and encrypted in an embedding matrix
. Individual columns Wword and Rword correspond with column-embedded
and
. The
ith vocabulary word is created in this location. As illustrated in Equation (
1), Word
W is embedded at the word level by multiplying matrix-vector pairs.
Word2vec uses a vec function to perform natural language processing. For learning word connections from a large corpus of literature, the word2vec approach employs a neural network model. This approach works exceptionally effectively in difficult-to-reach areas. Furthermore, it performs as well when the content is too short or consists of only one word. Using a huge corpus description and word2vec, it is possible to generate meaningful words while operating more efficiently on large datasets. Deep learning is heavily focused on the meanings of words. The word2vec tool makes dealing with word meaning issues easier since it breaks a phrase down into its essential components. Vector papers are prepared to meet the vector format training criteria. The word2vec model’s 3 million words vocabulary provides the same words and phrases as the vec framework. Finding an appropriate relationship between keywords is simple when dealing with a wide range of words and phrases.
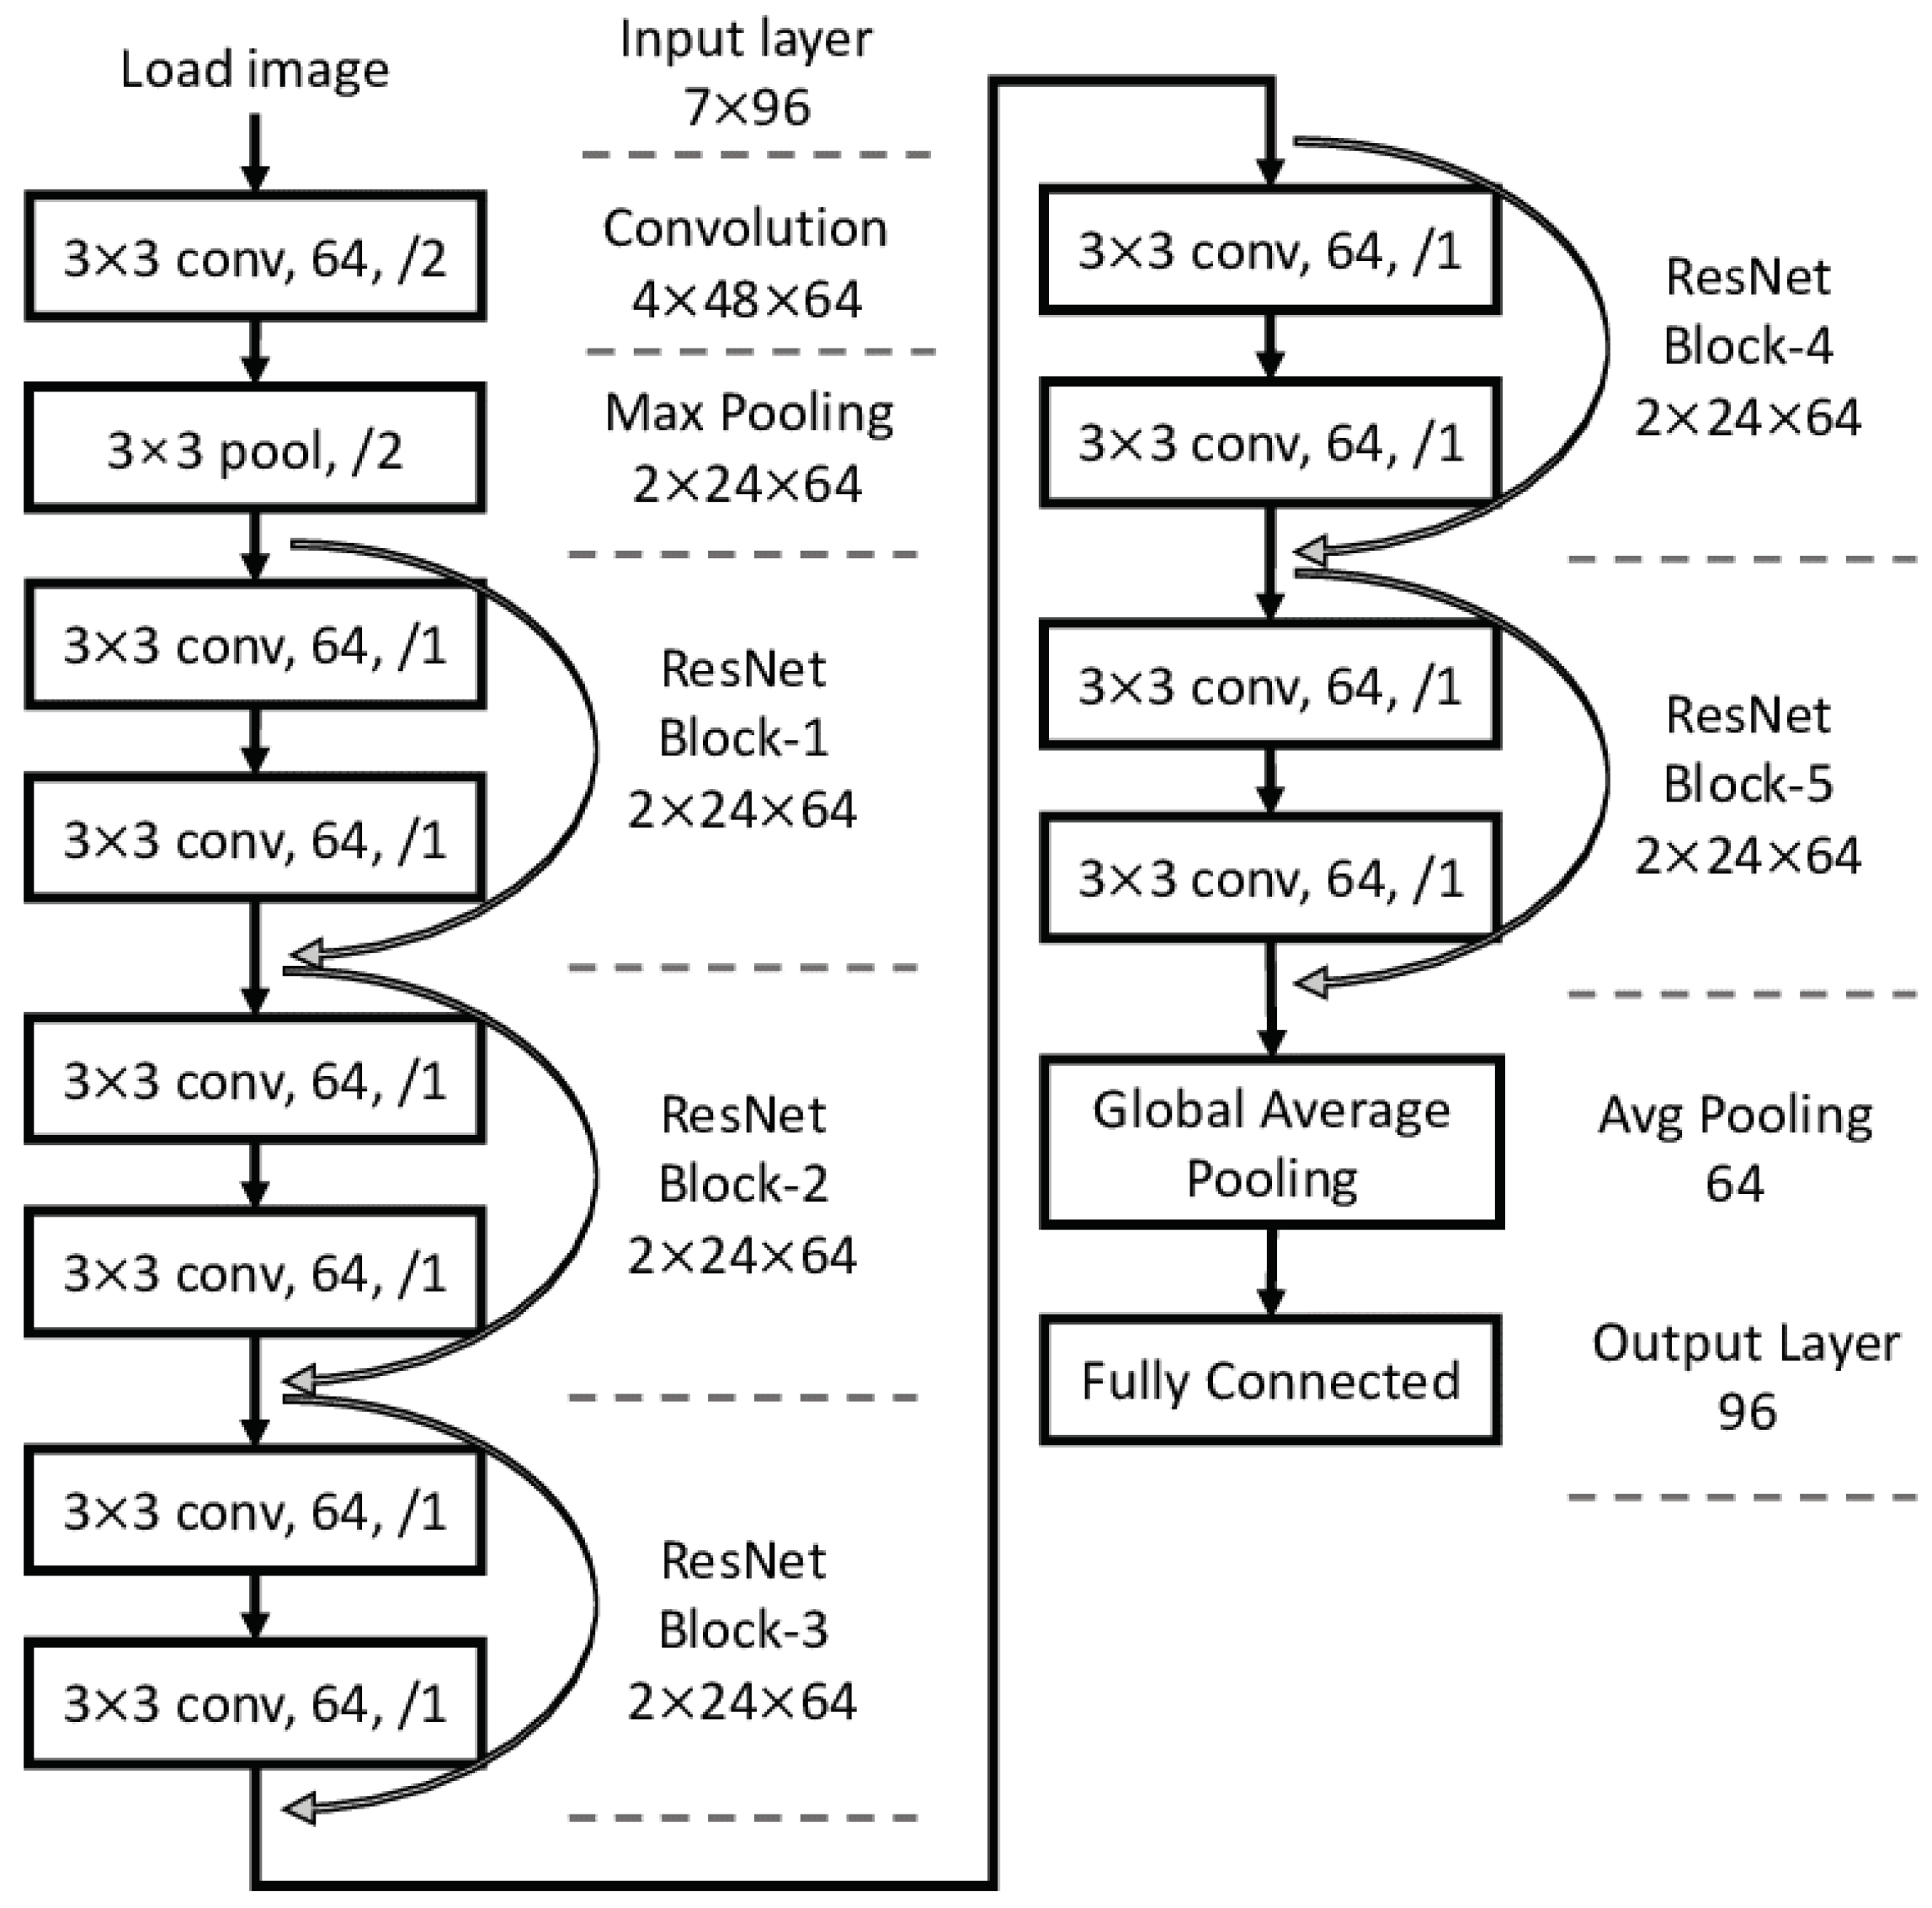
3.5. Swarm-Based Hybrid ResNet Classifier
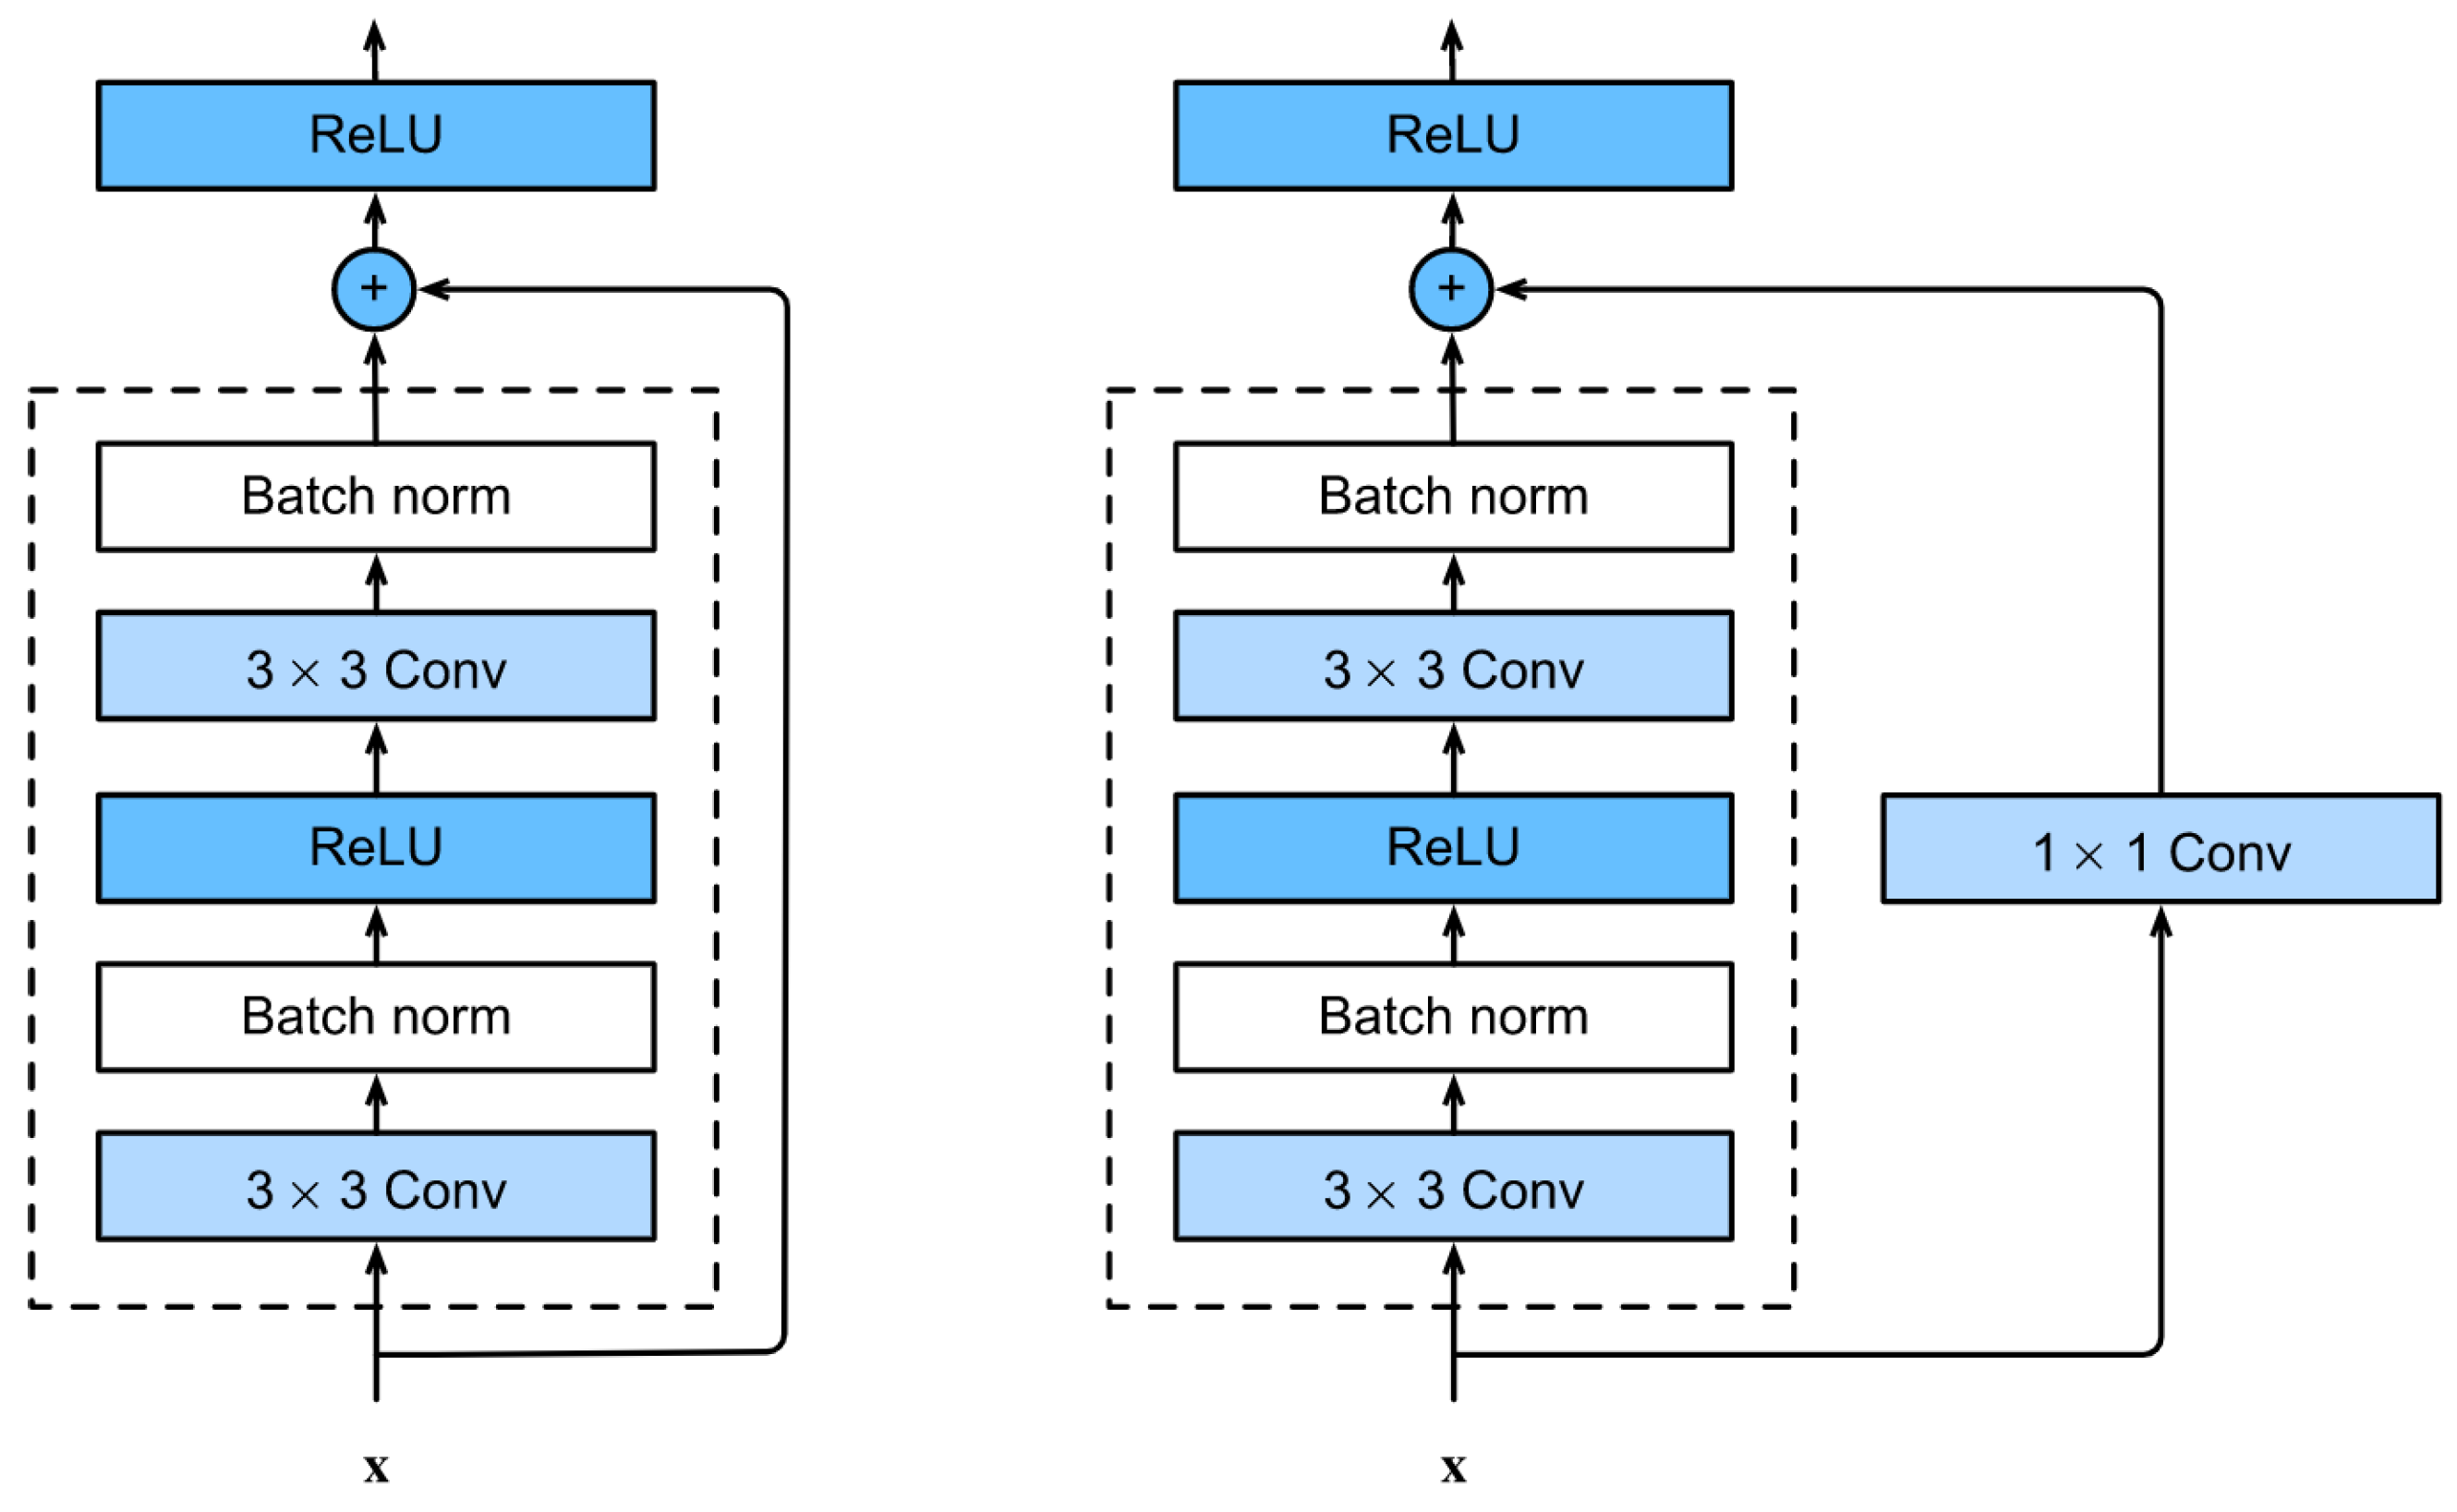
The purpose of this project is to construct a classification system for the categorization of aspects-based multi-labeling from data collection. A ResNet classifier is built to categorize labels from a dataset by extracting data characteristics. This activity also necessitates the use of deep-learning libraries. Torchvision is a pre-trained data learning model that provides maximum control overfitting while also boosting the optimization of results from the start. ResNet is a residual neural network (RNN) design. The consistent links of a residual network define it. An identically coiled arrow instantly connects each leftover brick to the following block. The ResNet-50 model has five stages with a residual block. Three-layered residual blocks have three convolutions: one 1 × 1 and two 3 × 3 convolutions. In typical neural networks, each layer feeds into the one above it, which is how residual blocks function. Identity connections are directly connected to the layer immediately underneath it and levels 2–3 hop away.
Figure 3 depicts a high-level overview of the ResNet model.
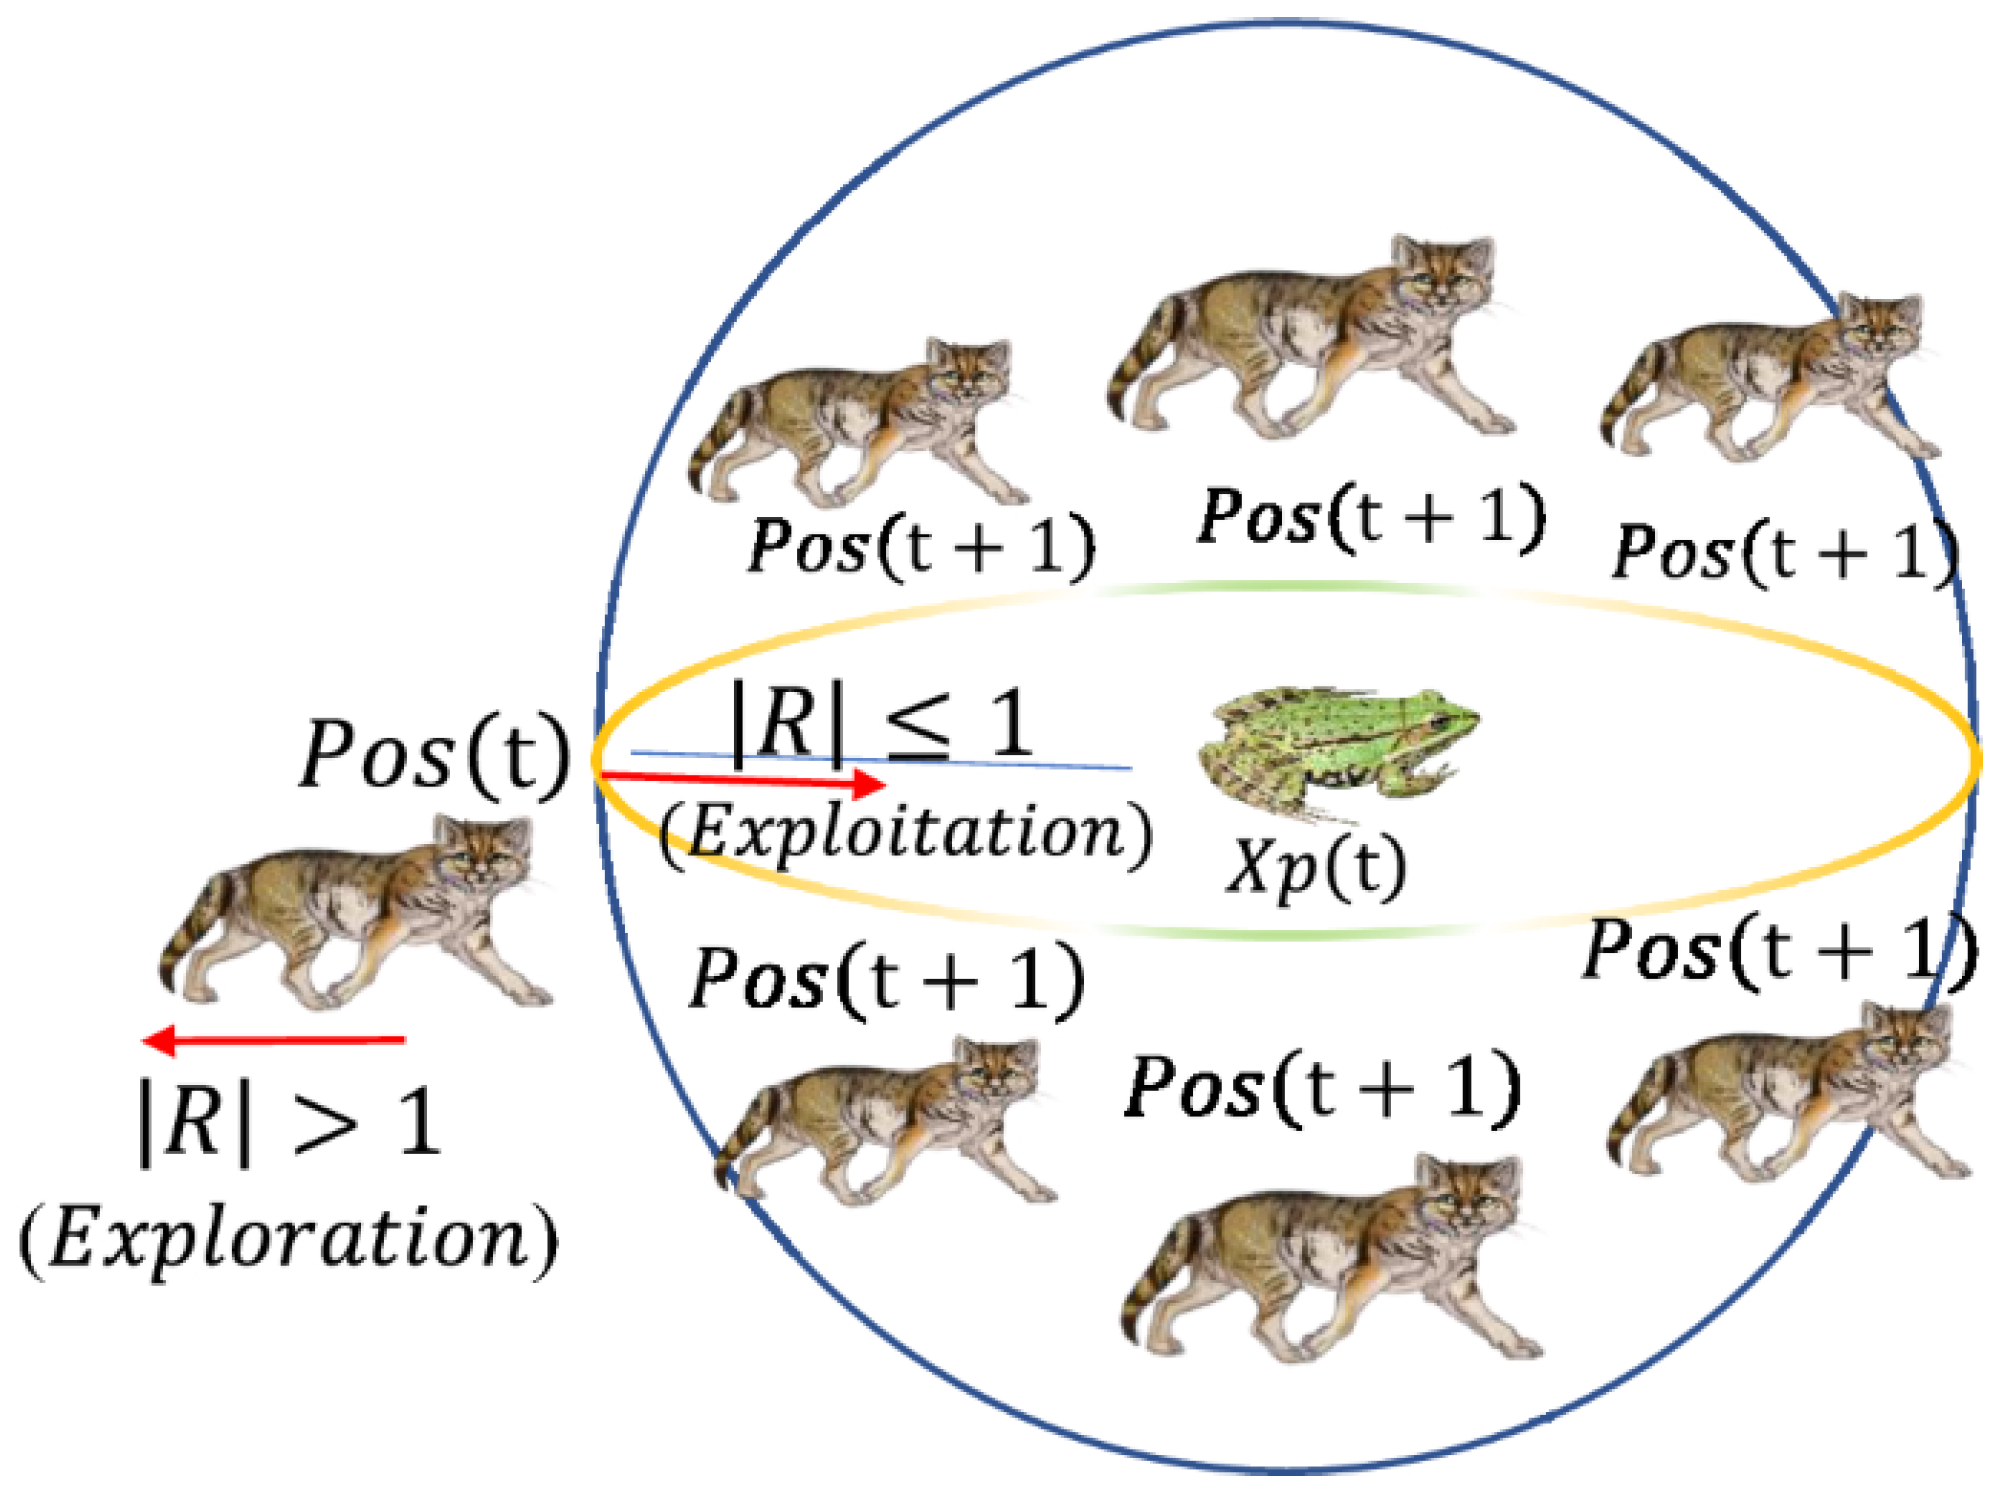
3.5.1. Sand CAT Swarm Optimization Algorithm (SCSO)
The hyperparameters of ResNet are tuned with the SCSO meta-heuristic method. The steps of SCSO are:
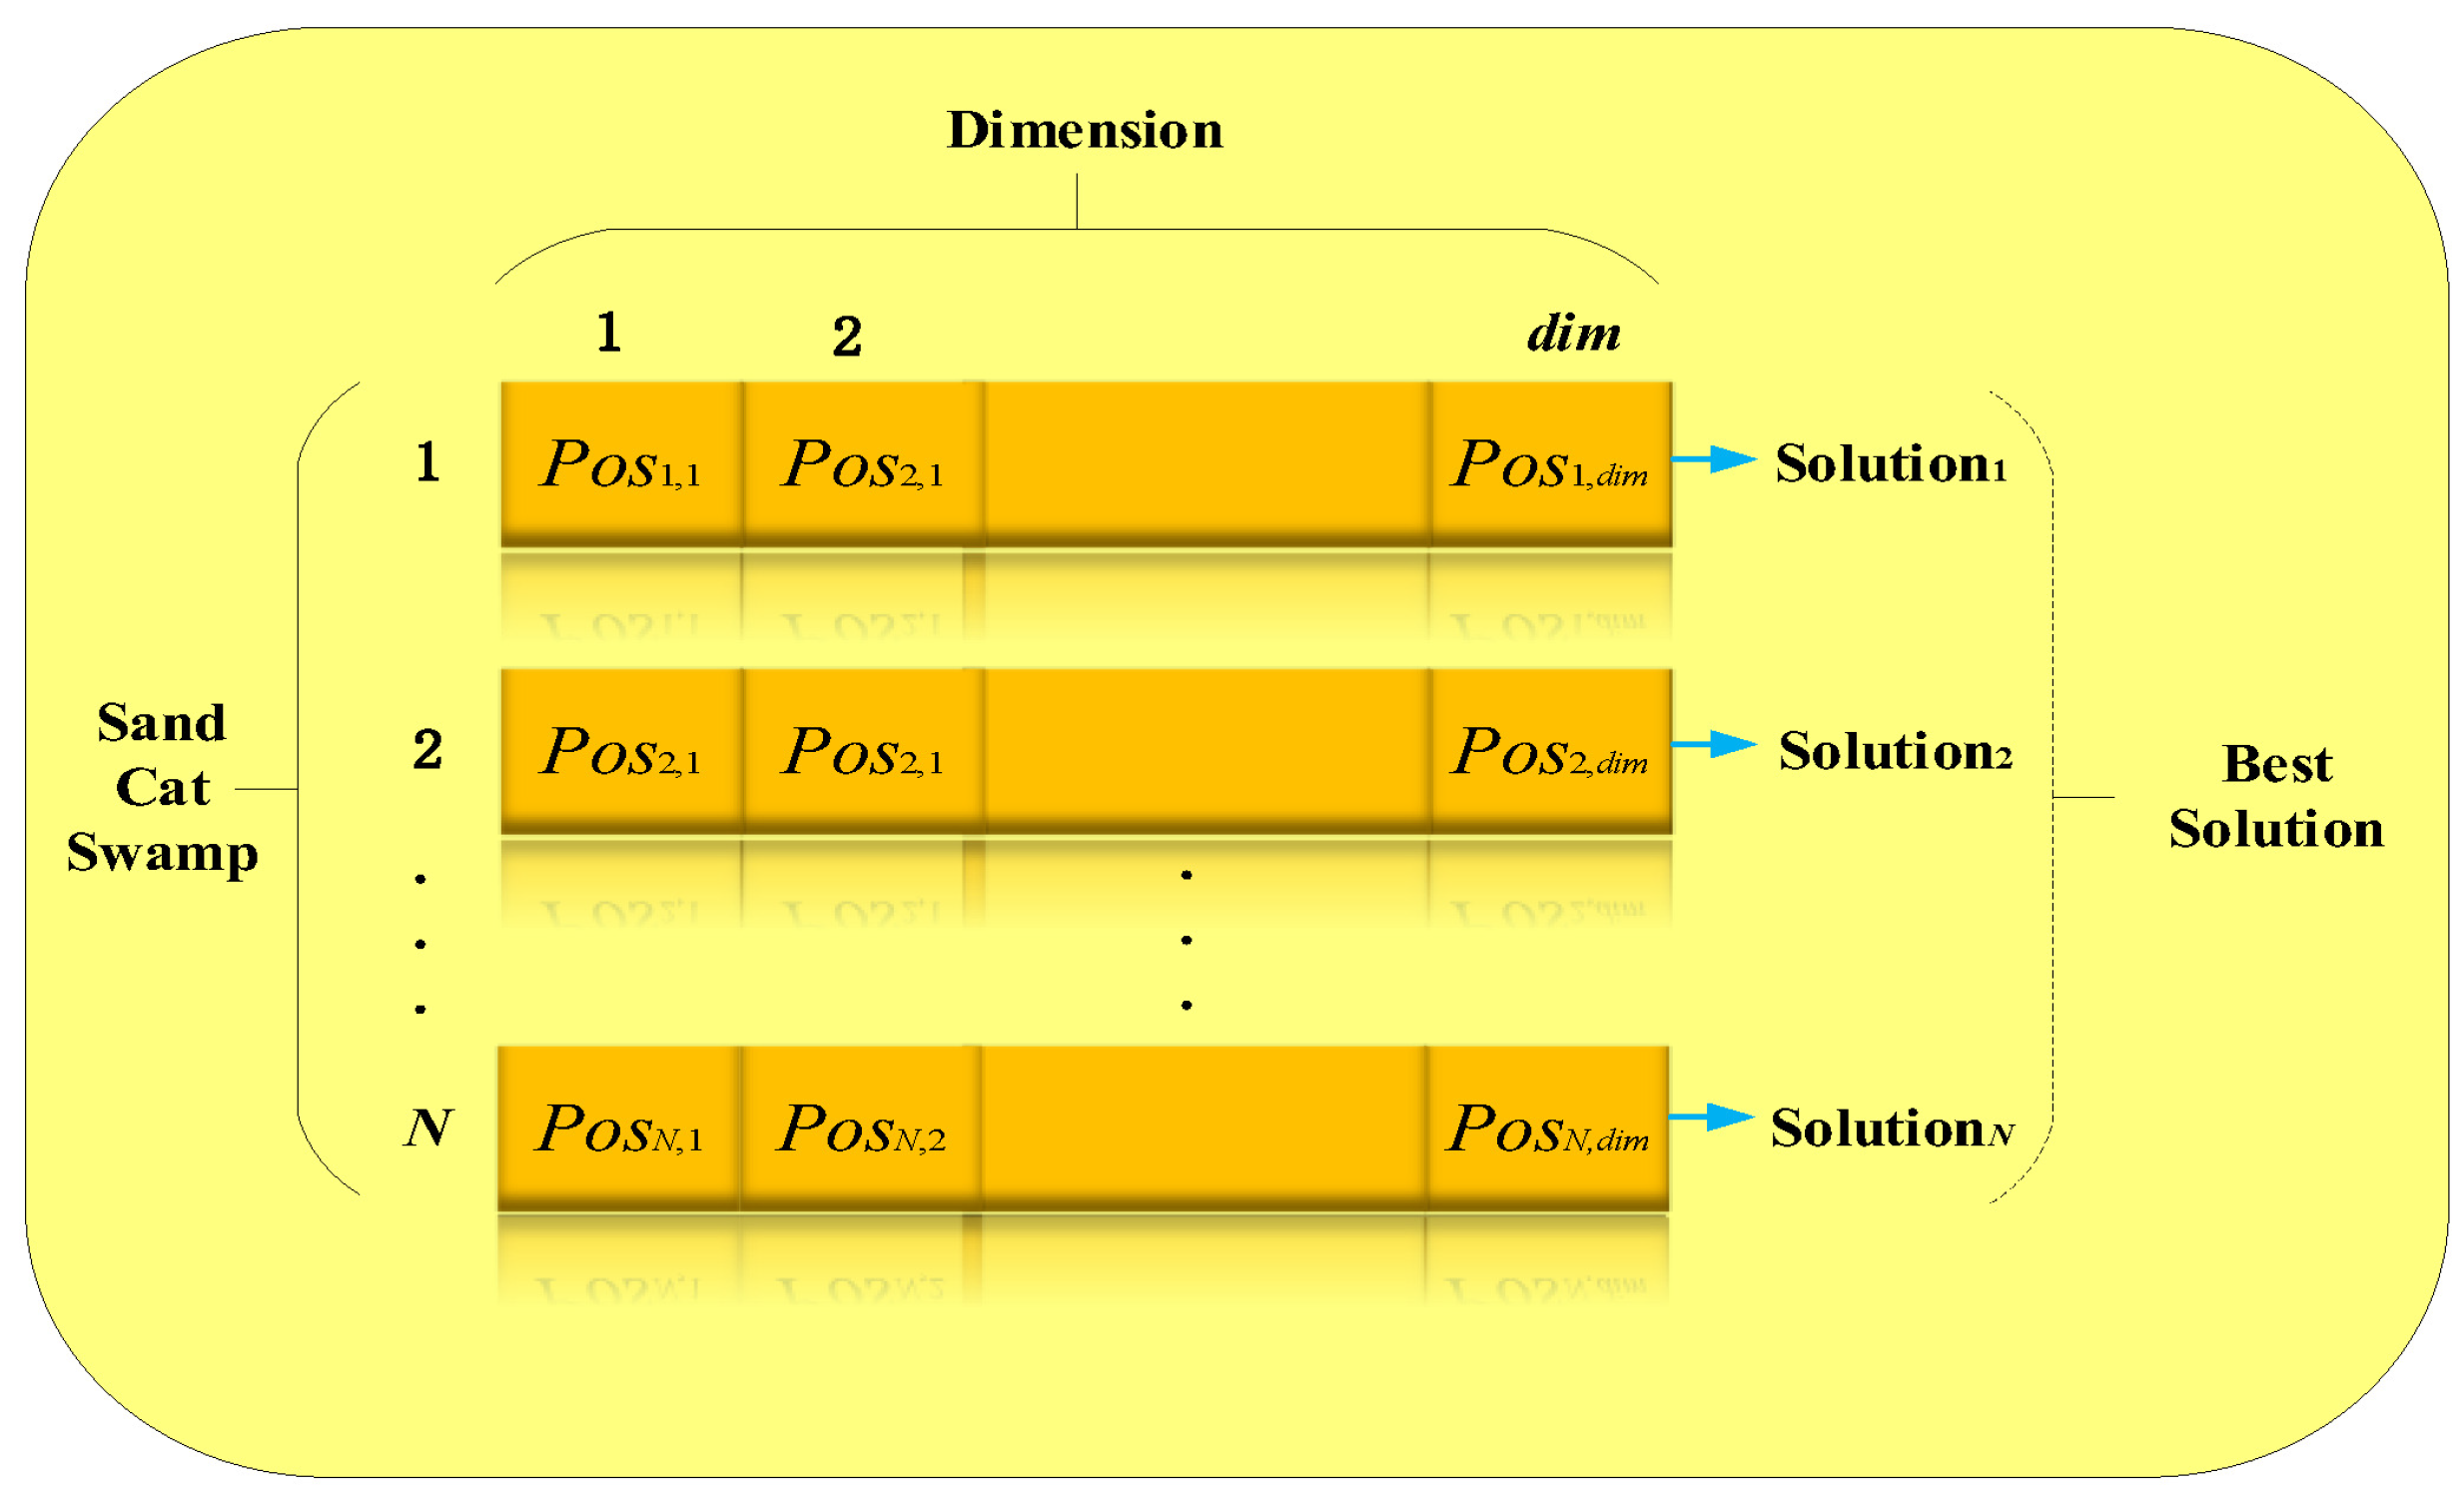
Population Initialization: A dim array inside the dim dimensions optimal solution is equivalent to one sand cat. The answer to the problem is illustrated in
Figure 4. Each Pos in a set of variable values (
,
, …,
) must be between the bottom and higher boundaries. Initialization generates a matrix based on the issue size (N dim). Furthermore, in each iteration, the relevant answer will be output. The current solution will be abandoned if the following output value is better. The current iteration’s answer will not be stored if a better solution is not identified in the subsequent iteration.
Prey Search (Exploration Phase): denotes the location of an individual sand cat. In low-frequency detection, the SCSO method uses sand cats’ listening skills. Each sand cat is capable of detecting low frequencies below 2 kHz. Equation (
2) describes the sensitivity
in mathematical modeling. The sand cat’s sensitivity range is from 2 to 0 kHz. Additionally, Equation (
3) derives the parameter
R, and the algorithm’s ability to explore and exploit is controlled.
where
T is the maximum number of iterations and
is 2. Every time a sand cat hunts for food, it will choose a new spot within its detection range, simplifying the development of hunting algorithms. Each sand cat has a diverse sensitivity range
r to avoid sliding into the local optimum, according to Equation (
4).
where
stands for the
r’s guiding parameter. The present location (
, ideal candidate position (
), and sensitivity range will all be taken into consideration when a sand cat searches for prey (
r). Equation (
5) displays the precise Formula.
Prey Attack (Exploitation Phase): Equation (
6) shows the separation (Posrnd) between the sand cat and its prey to recreate the sand cat’s hunting strategy. Given that the sand cat’s sensing range is a circle and the movement direction is determined using a roulette wheel selection mechanism, as described by Equation (
6), we can say that the sand cat is sensitive to changes in the surrounding environment. The value of the randomly selected angle is between 1 and 1 since all angles between 0 and 360 degrees have values of 1. Consequently, as seen in
Figure 5, every given sand cat in the search area may move in several circumferential directions. Once the target is located, the predatory Equation (
7) pounces. The dune cat may now fall within shooting range.
Execution SCSO Method: The SCSO algorithm’s exploitation and exploration are modulated by
R and
, two adaptive parameters. Using equation refeq08, we see that
linearly decreases from 2 to 0 as the cycle continues. Parameter
R is assigned the random number in the range [4, 4]. If
R is greater than 1, the sand cat will give up the pursuit of its prey. The sand cat will hunt for food when that is not the case, as shown by Equation (
8).
In Equation (
8), the current location of each sand cat is depicted as it evolves during the exploration and exploitation phase. If
R ≤ 1, the sand cat will launch an assault. In any case, the sand cat’s mission is to hunt globally for new prey. The pseudocode is shown in Algorithm 1.
| Algorithm 1 Pseudocode of SCSO Algorithm |
- 1:
Population initiation - 2:
Using the goal function as a foundation, calculate the fitness function - 3:
Set up the t, and T - 4:
while E ≤ max iteration do - 5:
for Every search agent’s do - 6:
Get a random angle using the Roulette Wheel Selection - 7:
if then - 8:
Adjust the search agent position in accordance with Formula (4) - 9:
else - 10:
Adjust the search agent position in accordance with Formula (6) - 11:
end if - 12:
- 13:
end for - 14:
end while
|
3.5.2. ResNet Mechanism
Residual Networks (ResNets) are a kind of deep neural network design that has shown impressive performance across a variety of computer vision applications. ResNet is based on the premise that information may more efficiently flow over a network if skip connections are used. The vanishing gradients, which may arise in very deep neural networks, may be alleviated in certain cases by doing so.
The original ResNet design was upgraded to the more effective optimized ResNet. Using the concept of residual learning as its foundation, ResNet is an architecture for deep neural networks. In traditional neural network architectures, each layer is responsible for learning a new set of features. The input to a layer is transformed using a set of learned weights and biases, and the output is then passed on to the next layer. In very deep neural networks, however, this process can lead to a problem known as the vanishing gradient problem.
The vanishing gradient problem occurs when the gradients used to update the weights and biases in the earlier layers of the network become very small. This can make it difficult for these layers to learn meaningful features and lead to poor performance on the task.
ResNet addresses the vanishing gradient problem by introducing skip connections. These connections allow information to flow directly from the input of a layer to the output of the last layer. By doing this, ResNet ensures that the gradients used to update the weights and biases in the earlier layers are not lost.
The objective of a ResNet process is illustrated in
Figure 5, which combines numerous transition layers and dense blocks to group incoming review information to determine the type of work being provided. When a text is sent into the ResNet, it is processed through dense blocks, each with its filters. It moves to the next layer after passing through a thick block. The transition layer is called a “convolution” or “pooling” layer.
Figure 6 presents the ResNet flow chart overview.
3.5.3. ResNet-SCSO Optimization
It was first put to the test to determine how accurate the initial training data with a batch size of 32 would be on the selected dataset. After optimizing the ResNet model with a maximum of 32 trials and 25 epochs using the SCSO method, the network was finally ready to be used in a real-world setting. Then, we trained the ResNet model to find the best values for the following settings:
“Version of ResNet” determines which version of ResNet is used in the training process;
“Batch size” means the total amount of data being processed simultaneously. A slow convergence will occur if the mini-batch size is too small, and a slow speed will occur if the mini-batch size is too high [
18];
“Conv3_depth” corresponds to the third convolutional layer’s depth;
“Conv4_depth” corresponds to the fourth convolutional layer’s depth;
“Pooling type”;
“Learning rate” is a crucial hyperparameter that controls the increment size between successive iterations. Convergence will be slow if the learning rate is too low, and divergence is possible if it is too high [
18];
This is the “optimizer” implemented in the fully linked layer.
Hyperparameter settings for SCSO optimization are provided in
Table 2.
The Residual Network (ResNet) model’s hyperparameters were then modified using SCSO optimization to determine the optimal hyperparameters for aspect-based multi-labeling. The best model is found by experimenting with different values for the ResNet architecture’s hyperparameters until the desired level of accuracy is reached. As a final step, features were retrieved with the help of the optimized hyperparameters, and classification scores were obtained with the aid of the fully connected layer. During training, many hyperparameter combinations were tried out, and the one that yielded the highest accuracy was ultimately selected as the optimal one for the dataset.
3.5.4. Theoretical Innovation Analysis of Optimized ResNet
Optimized ResNet is an improved version of the original ResNet architecture. The primary innovation of optimized ResNet is the use of a multi-branch architecture. In the original ResNet architecture, each block consists of two convolutional layers and a skip connection. In optimized ResNet, each block consists of multiple branches, each with its convolutional layers.
The idea behind the multi-branch architecture is to enable the network to learn more diverse and rich features. Each branch in the block can learn a different set of features, and the outputs of these branches can then be combined in a weighted manner to form the final output of the block. One of the key advantages of the multi-branch architecture is that it can help to reduce the number of parameters in the network. In traditional ResNet architectures, the number of parameters increases with the depth of the network. This can make it difficult to train deep networks, leading to overfitting. The multi-branch architecture of optimized ResNet can help to mitigate this problem by reducing the number of parameters required in each block.
Another advantage of the multi-branch architecture is that it can help reduce the computation required to train the network. Each branch in the block can be trained independently, and the outputs of these branches can then be combined using a simple weighted sum. This can help reduce the computation required to train the network, which can be an important consideration for large-scale NLP applications.
The multi-branch architecture of Optimized ResNet also enables the network to learn more diverse and rich features. By allowing each branch to learn different features, the network can capture more complex and nuanced patterns in the data. This can lead to improved performance on a wide range of NLP tasks.
Technical novelties: This research categorizes multiple labels into groups. Thus, we modify three existing deep learning models to accommodate this. In particular, this research suggests the following technological advances:
Improving the activation function of the layer(s) at the output;
Adding a multi-swarm optimization approach to the ResNet mechanism to better accommodate the multi-labeling of large datasets (five datasets used in this study);
Implementing the proposed approach for large datasets with multidimensional data/multi-labels requires less time and effort;
Aspect-based multi-labels for processing and classifying textual data at the document and sentence levels;
The proposed model has achieved improved accuracy on aspect-based multi-labeling.
The softmax function is used in the original ResNet design to activate the output layers, which calculates a conditional probability distribution in which the total of the probabilities is 1. The softmax function is the optimal activation function for a neural network taught to perform single-label classification. When determining a categorization, only the most likely class is used. In this scenario, the categories cannot be combined. However, our choice of activation function is based on an optimization technique. With the ResNet Method as a basis, our proposed model may choose the activation function that best matches the data for every dataset.
4. Experiments and Discussion
This section describes the experiments and the conclusions drawn from them.
4.1. Dataset Description
Webscrapping method has been applied to gather the data, and some of the datasets are gathered from the Kaggle website. The real-world multi-label categorization data we used in our research are shown in
Table 3. The dataset in [
39], the first of its sort in biology, measures the prevalence of diseases in the general population. The Kaggle website was used to obtain this information. A combination of Kaggle and IMDB records (where a record represents a movie or a movie review) [
40] represents the pertinent films in this dataset. We are entrusted with identifying which topics each document belongs to in the second Kaggle dataset [
41].
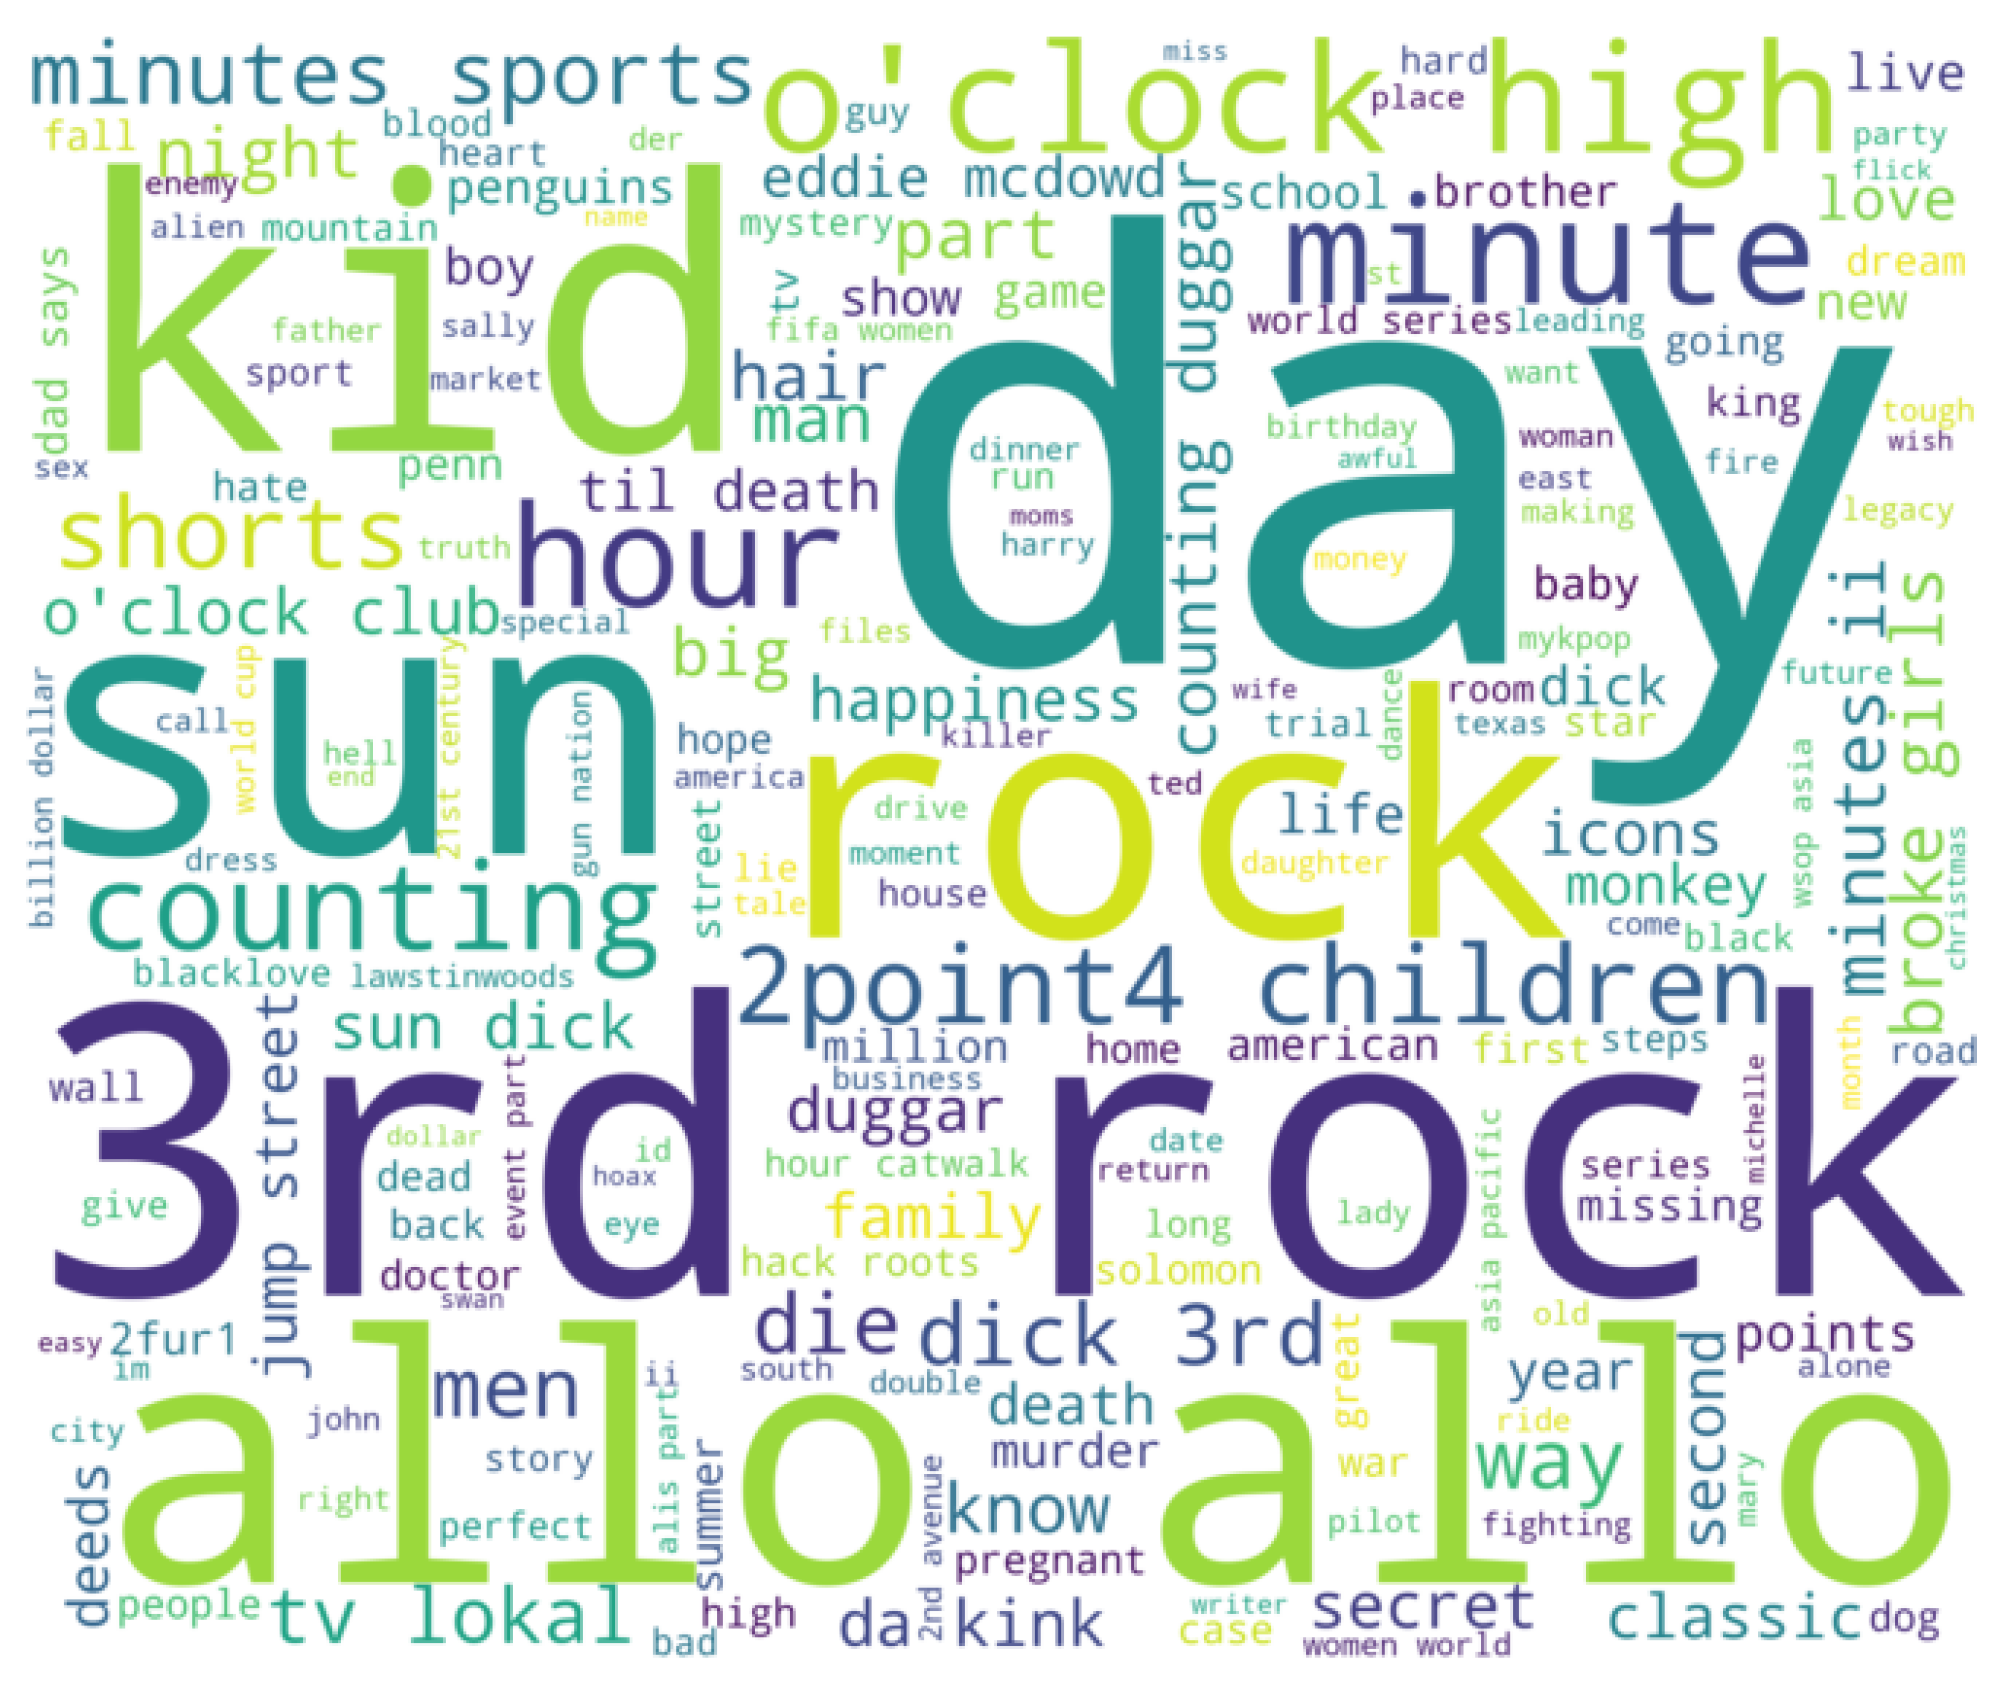
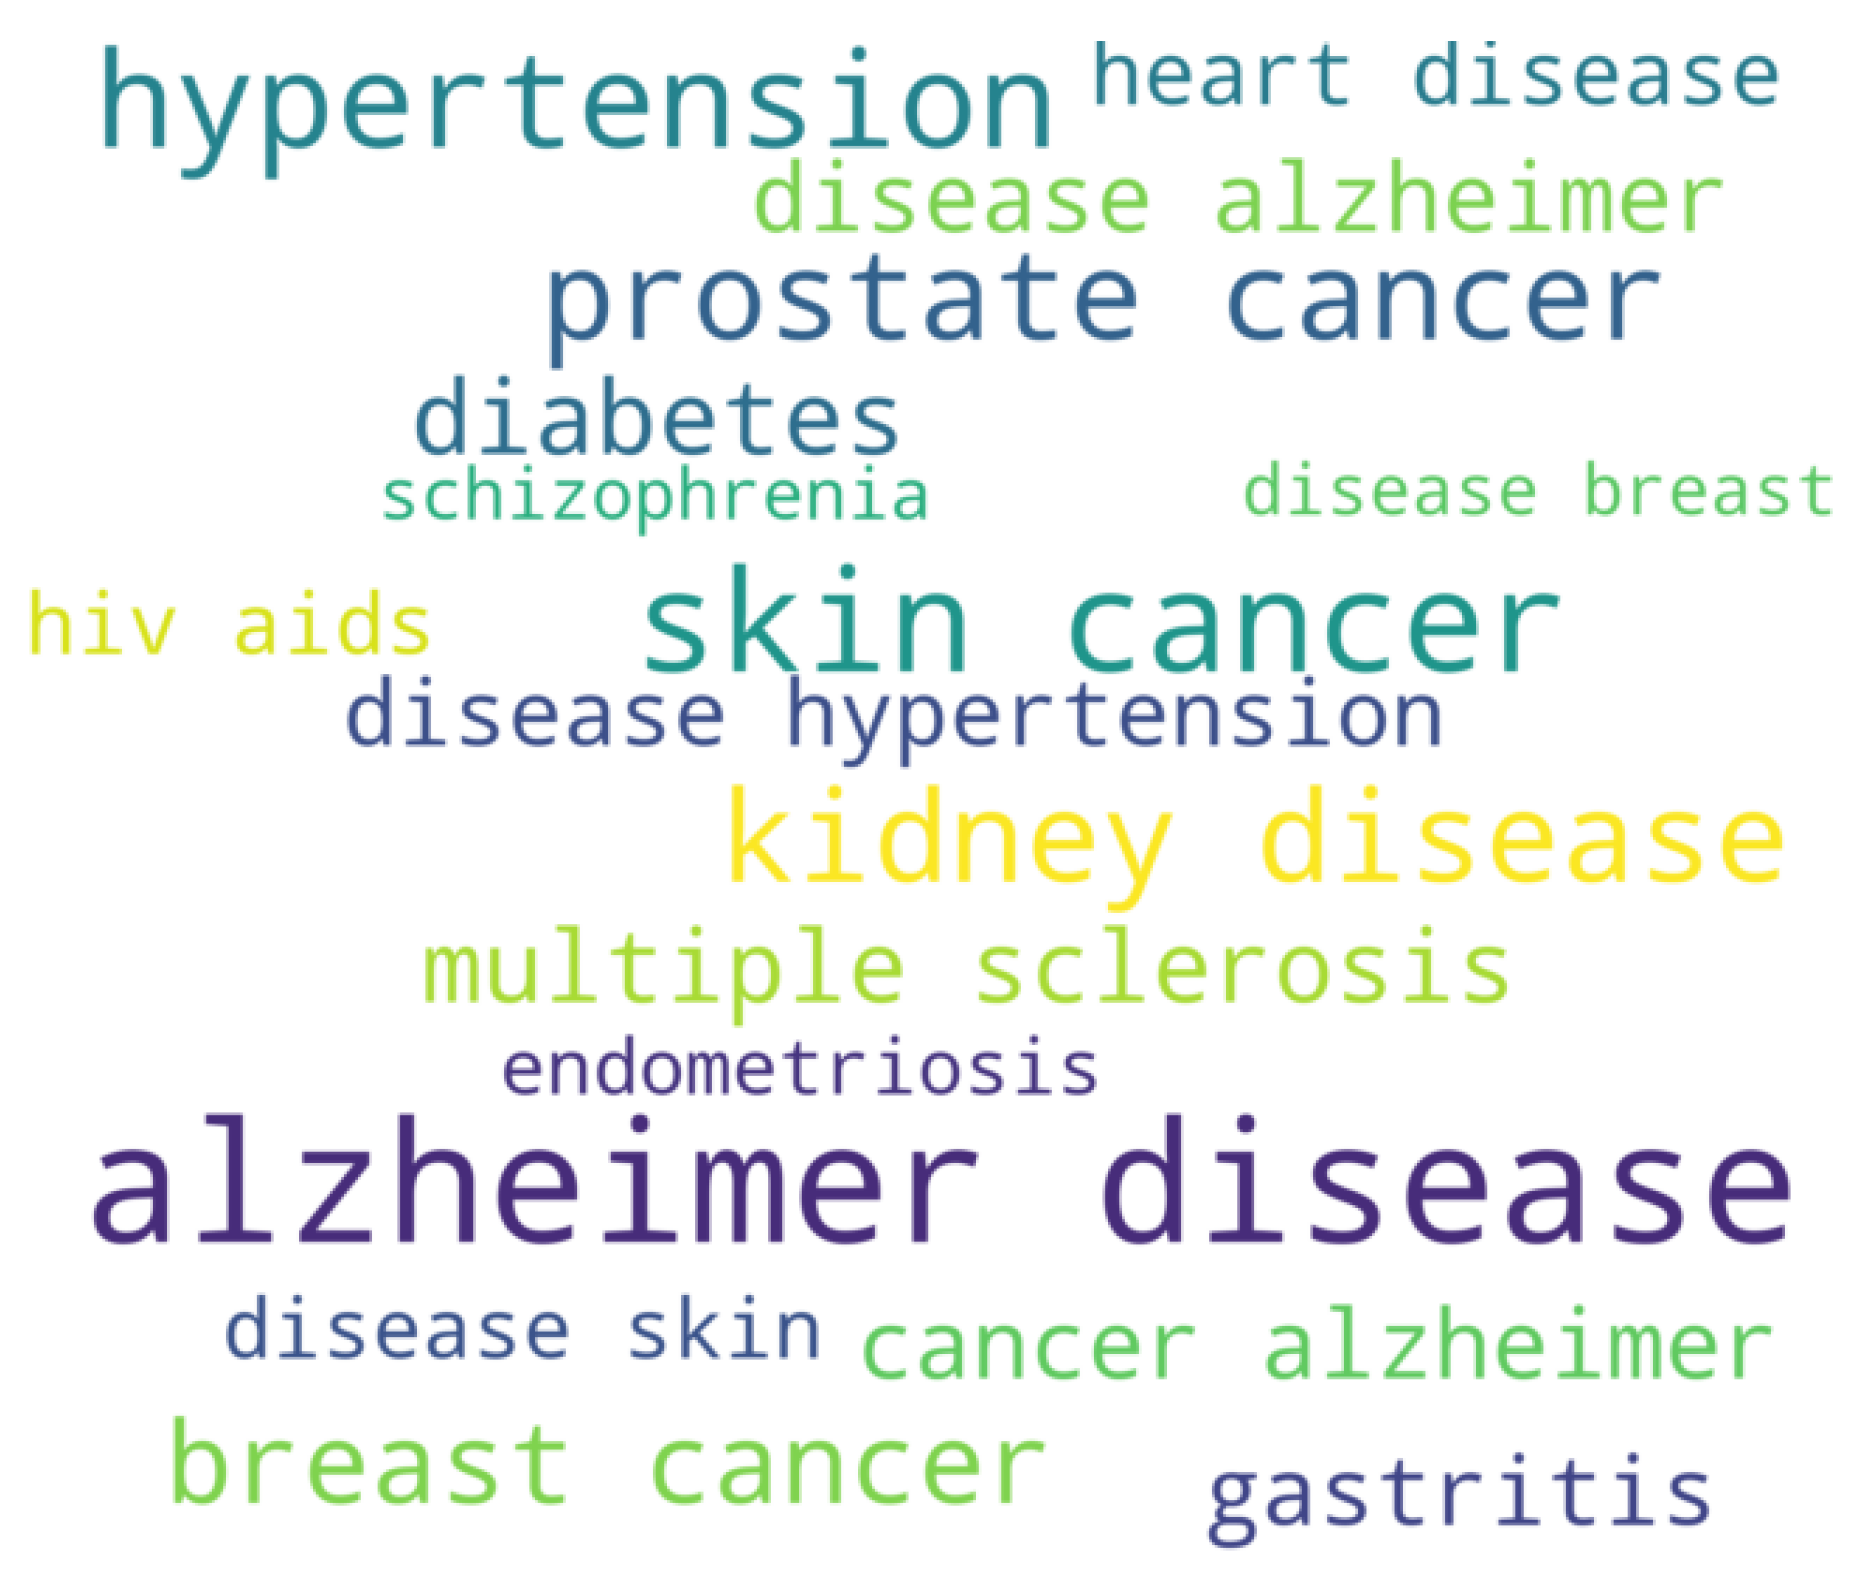
Figure 8 shows the aspects extracted and sentiment analyzed from the medical dataset.
Figure 9 shows the same results for news data and
Figure 10 for the research articles dataset.
4.2. ResNet-SCSO Optimization
This research results in a newly optimized ResNet model since the SCSO optimization has not previously been applied with ResNet aspect-based sentiment analysis or any other application. Therefore, this combination may be used to multi-label other datasets, with the researchers incurring significantly lower computing costs to accomplish the multi-labeling in this instance.
The best set of hyperparameters for a residual network, as determined by a random search optimization approach, is shown in
Table 4. This network was tailored to the chosen database, and it obtained a training accuracy of 99.0%, a validation accuracy of 99.5%, and a testing accuracy of 98.97%.
4.3. Metrics for Performance Evaluation
The five multi-label vital metrics that were previously discussed will be used in this section. These are the modern literary masterpieces that are most often read. Consider yourself in the following circumstance: Each label appears n times in a multi-label U dataset. The performance metrics are calculated based on the confusion matrix particulars, i.e., true negative as correctly false (CF), true positive as correctly true (CT), false positive as incorrectly true (IcT), and false negative as incorrectly false (IcF).
Accuracy: Predicted observations divided by the total number of observed data points provide a readily available indicator of performance (or observations), as shown in Equation (
9). The models closest to perfection are the most accurate (high accuracy). Only if the dataset is asymmetrical is it necessary to have the ability to prevent numerous false positives and false negatives [
42].
Precision: This determines what proportion of instances meets particular criteria for classification. The proportion of all correctly predicted positive observations to all correctly predicted and expected positive observations is known as the precision ratio, as shown in Equation (
10). A low rate of false positives influences the diagnostic accuracy of a medical test [
43].
Recall: It calculates the percentage of instances that meet particular criteria when identified. Precision is the ratio of all properly forecasted positive observations to all accurately predicted and expected positive observations, as described in Equation (
11). The amount of false positive results influences the accuracy of a measurement test [
44].
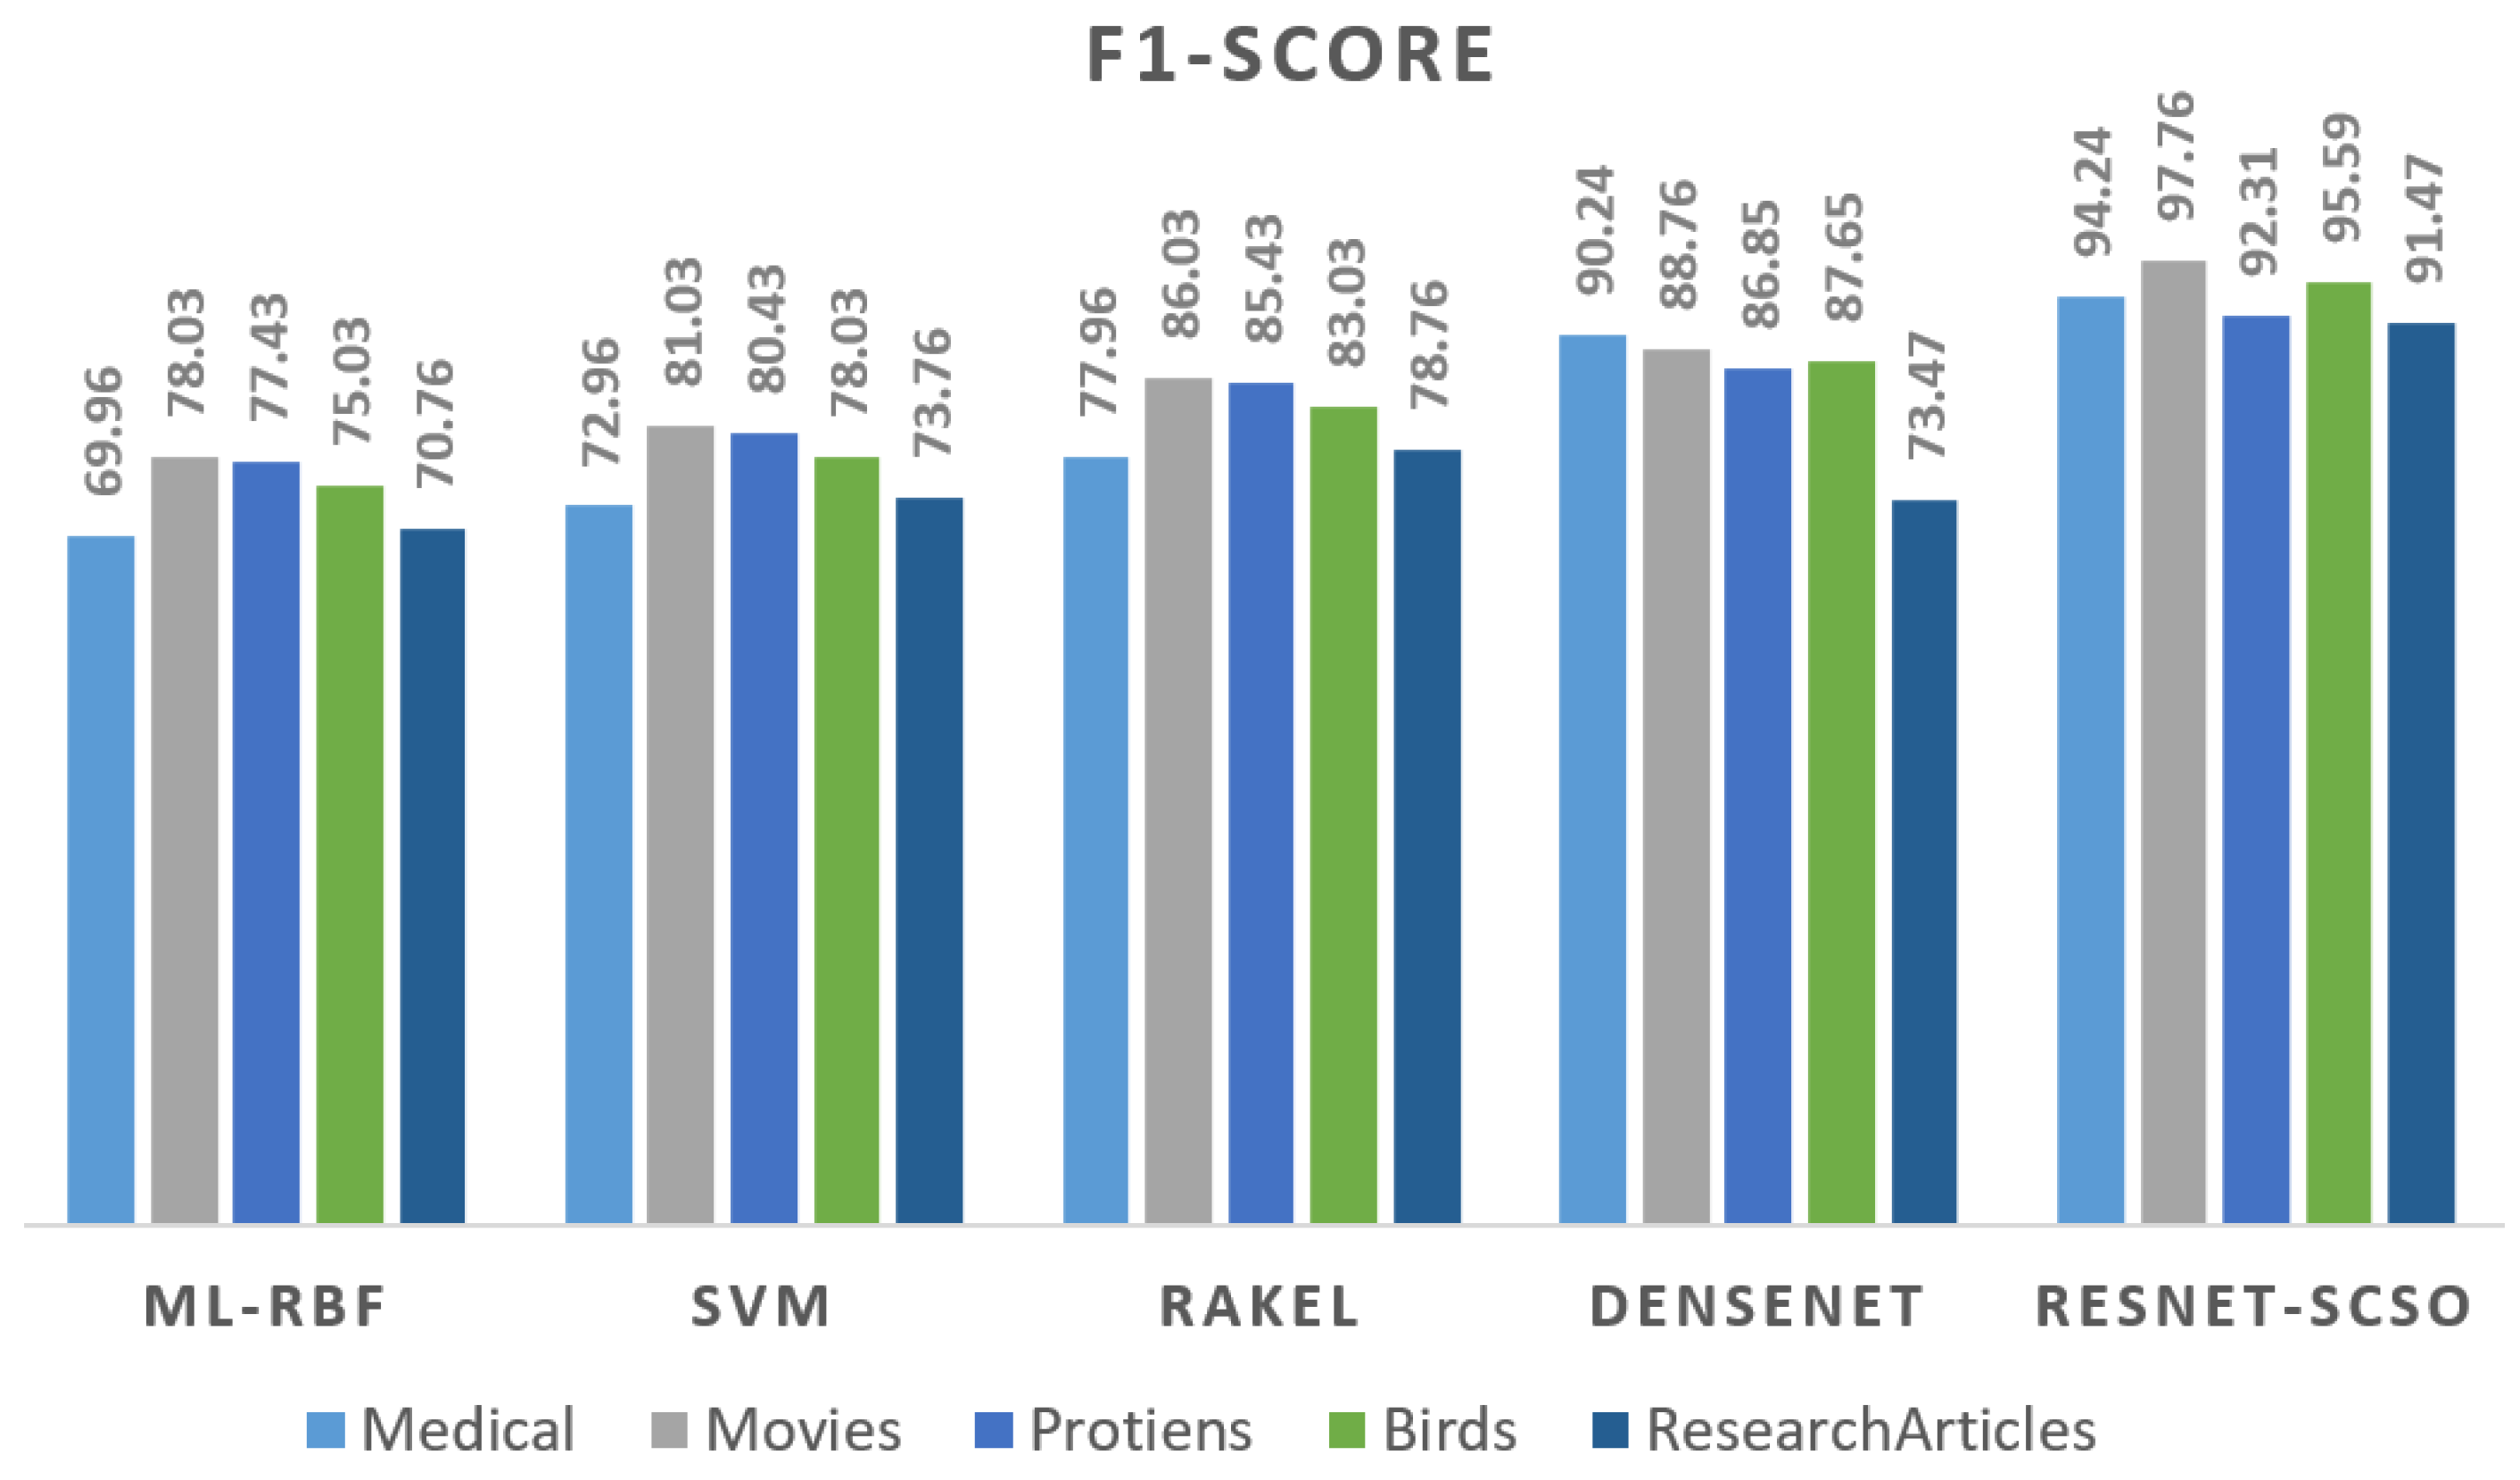
F1-Score: The harmonic mean of accuracy and recall is produced by combining recall and precision. We shall examine the standard F1-score. To calculate the harmonic mean, we use the formula below: The geometric mean, in this instance, is determined by multiplying the geometric mean by the square of the arithmetic mean. It expresses the average of two values inside a certain set of figures. The F-score might be exposed to a range of problems, such as claims of bias. The F1 measure is the precision–recall measure (precision and recall are both given equal weight). Equation (
12) describes the required Formula of the F1-score [
45].
where Rcc represents recall and Prc represents precision.
4.4. Compared Models
To illustrate its efficacy, the proposed ResNet-SCSO was put through its paces in a complete comparison with the most regularly utilized MLL approaches. DenseNet and MLRBF are two additional DNN model scenarios to test the objective function by optimizing one target. The following sections provide a summary of each of these methods.
4.5. Performance Comparison
Cross-validation is performed ten times for each experimental data collection. Calculate the approach’s standard deviation and average productivity for the full dataset. All tests were run on an Intel Xeon 2.24 GHz processor with 16 GB of RAM.
Table 5,
Table 6,
Table 7 and
Table 8 compare the output of five techniques. The suggested model outperforms the ML-RBF technique and the RAKEL and ML-RBF combination procedures.
Our technique is constant, regardless of how many datasets it is applied to. Our Hybrid Classifier ResNet-SCSO has shown that it can improve the generalization effectiveness of DNN compared to non-ensemble methods.
Our analysis of the advantages of RESNET-SCSO in comparison to other multi-component learning strategies such as ML-RBF and DenseNet led us to this conclusion. Combining learners with machine learning outperforms single-label learning to generalize MLL systems. The success of ResNet may be attributed to the diversity-related goals set by SCSO which were not fulfilled in multi-label research, resulting in the opportunity for SCSO to pursue diverse multi-label learners. Our proposed method compares two objective functions, RESNET-SCSO and DenseNet, to see which impacts outcomes more.
When looking at the datasets’ findings, the techniques consistently yield the most significant results, as shown in
Table 5,
Table 6,
Table 7 and
Table 8.
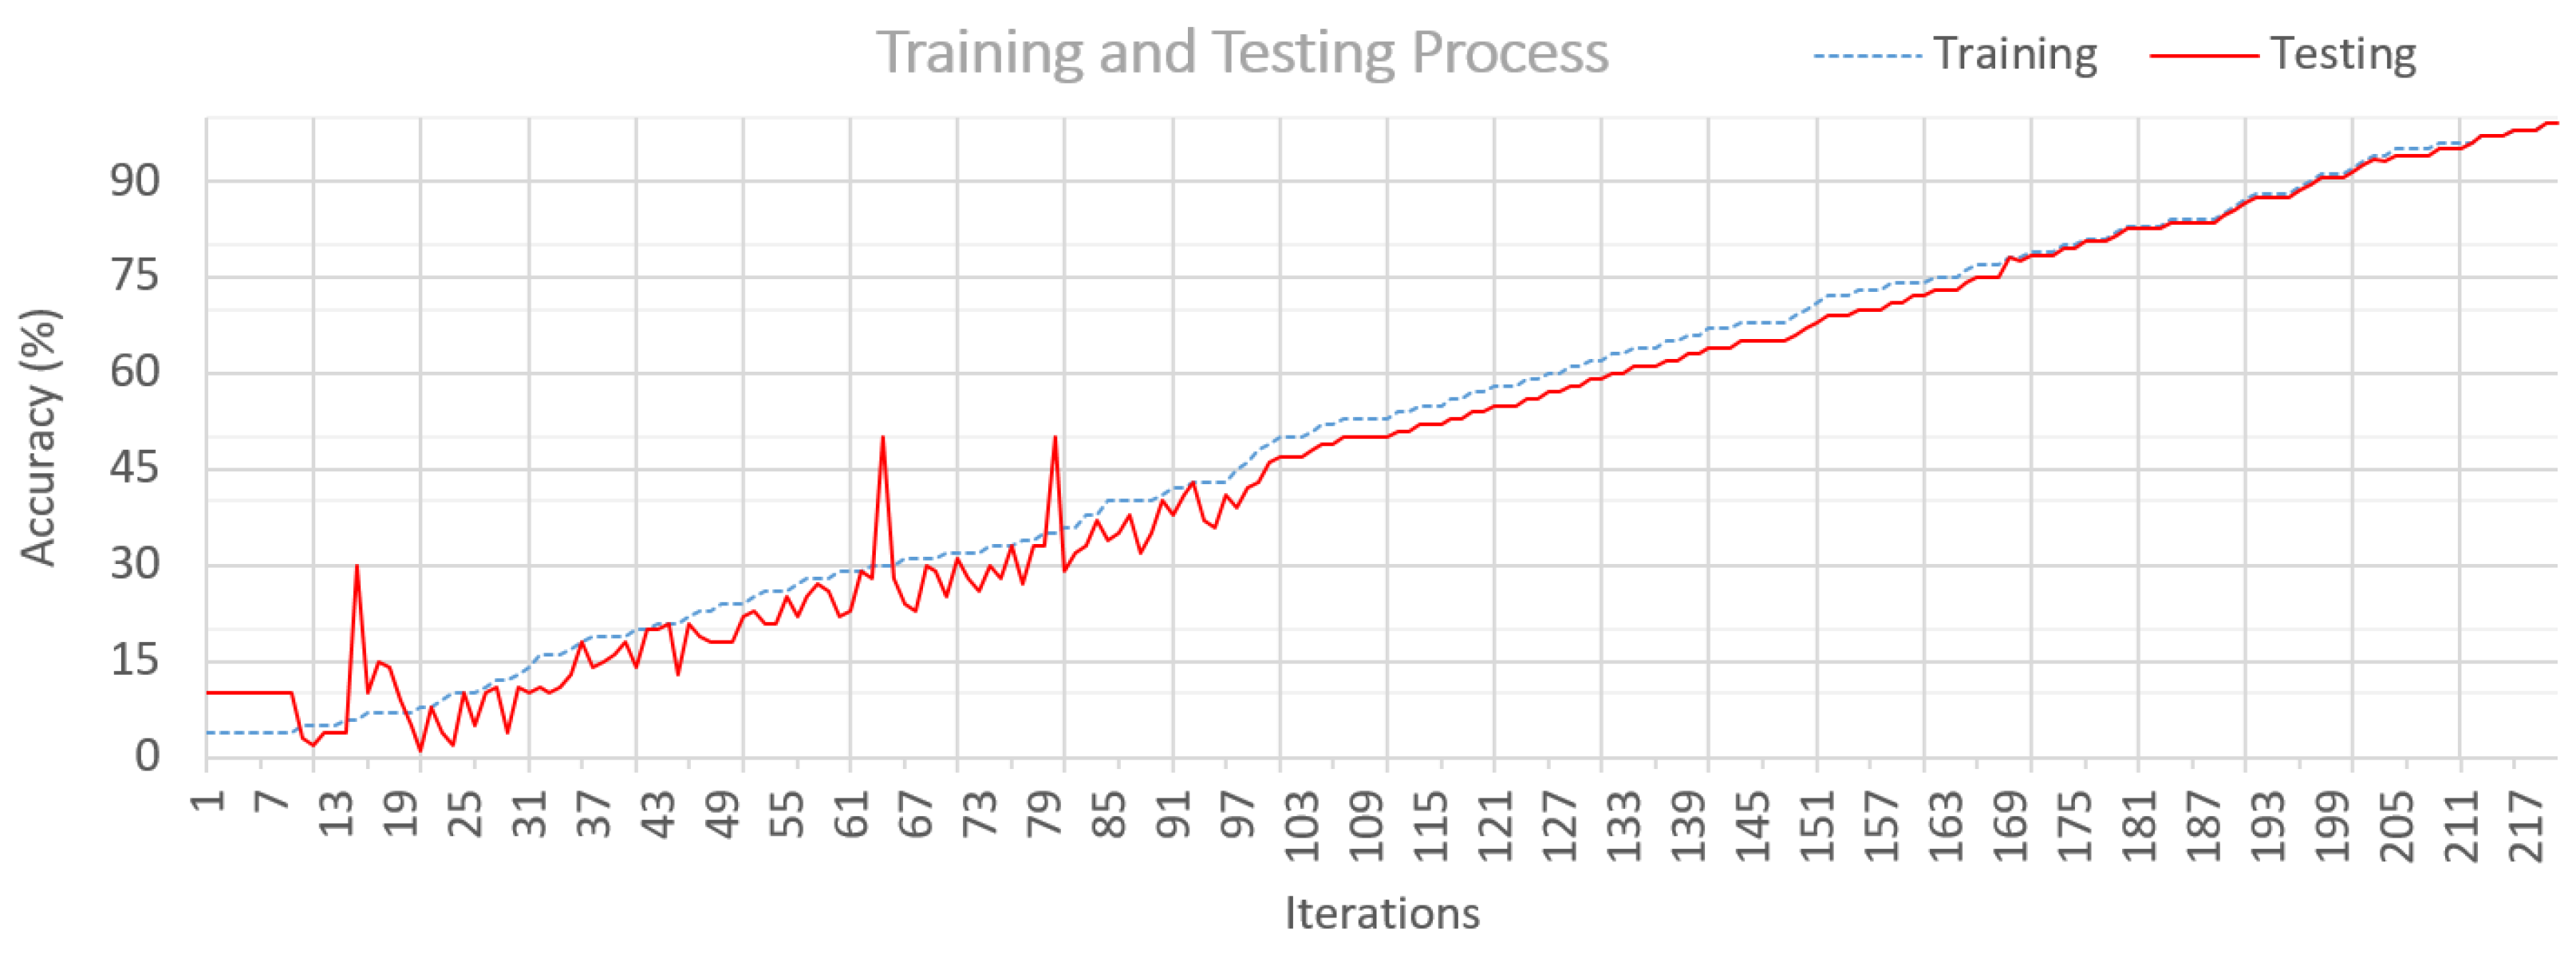
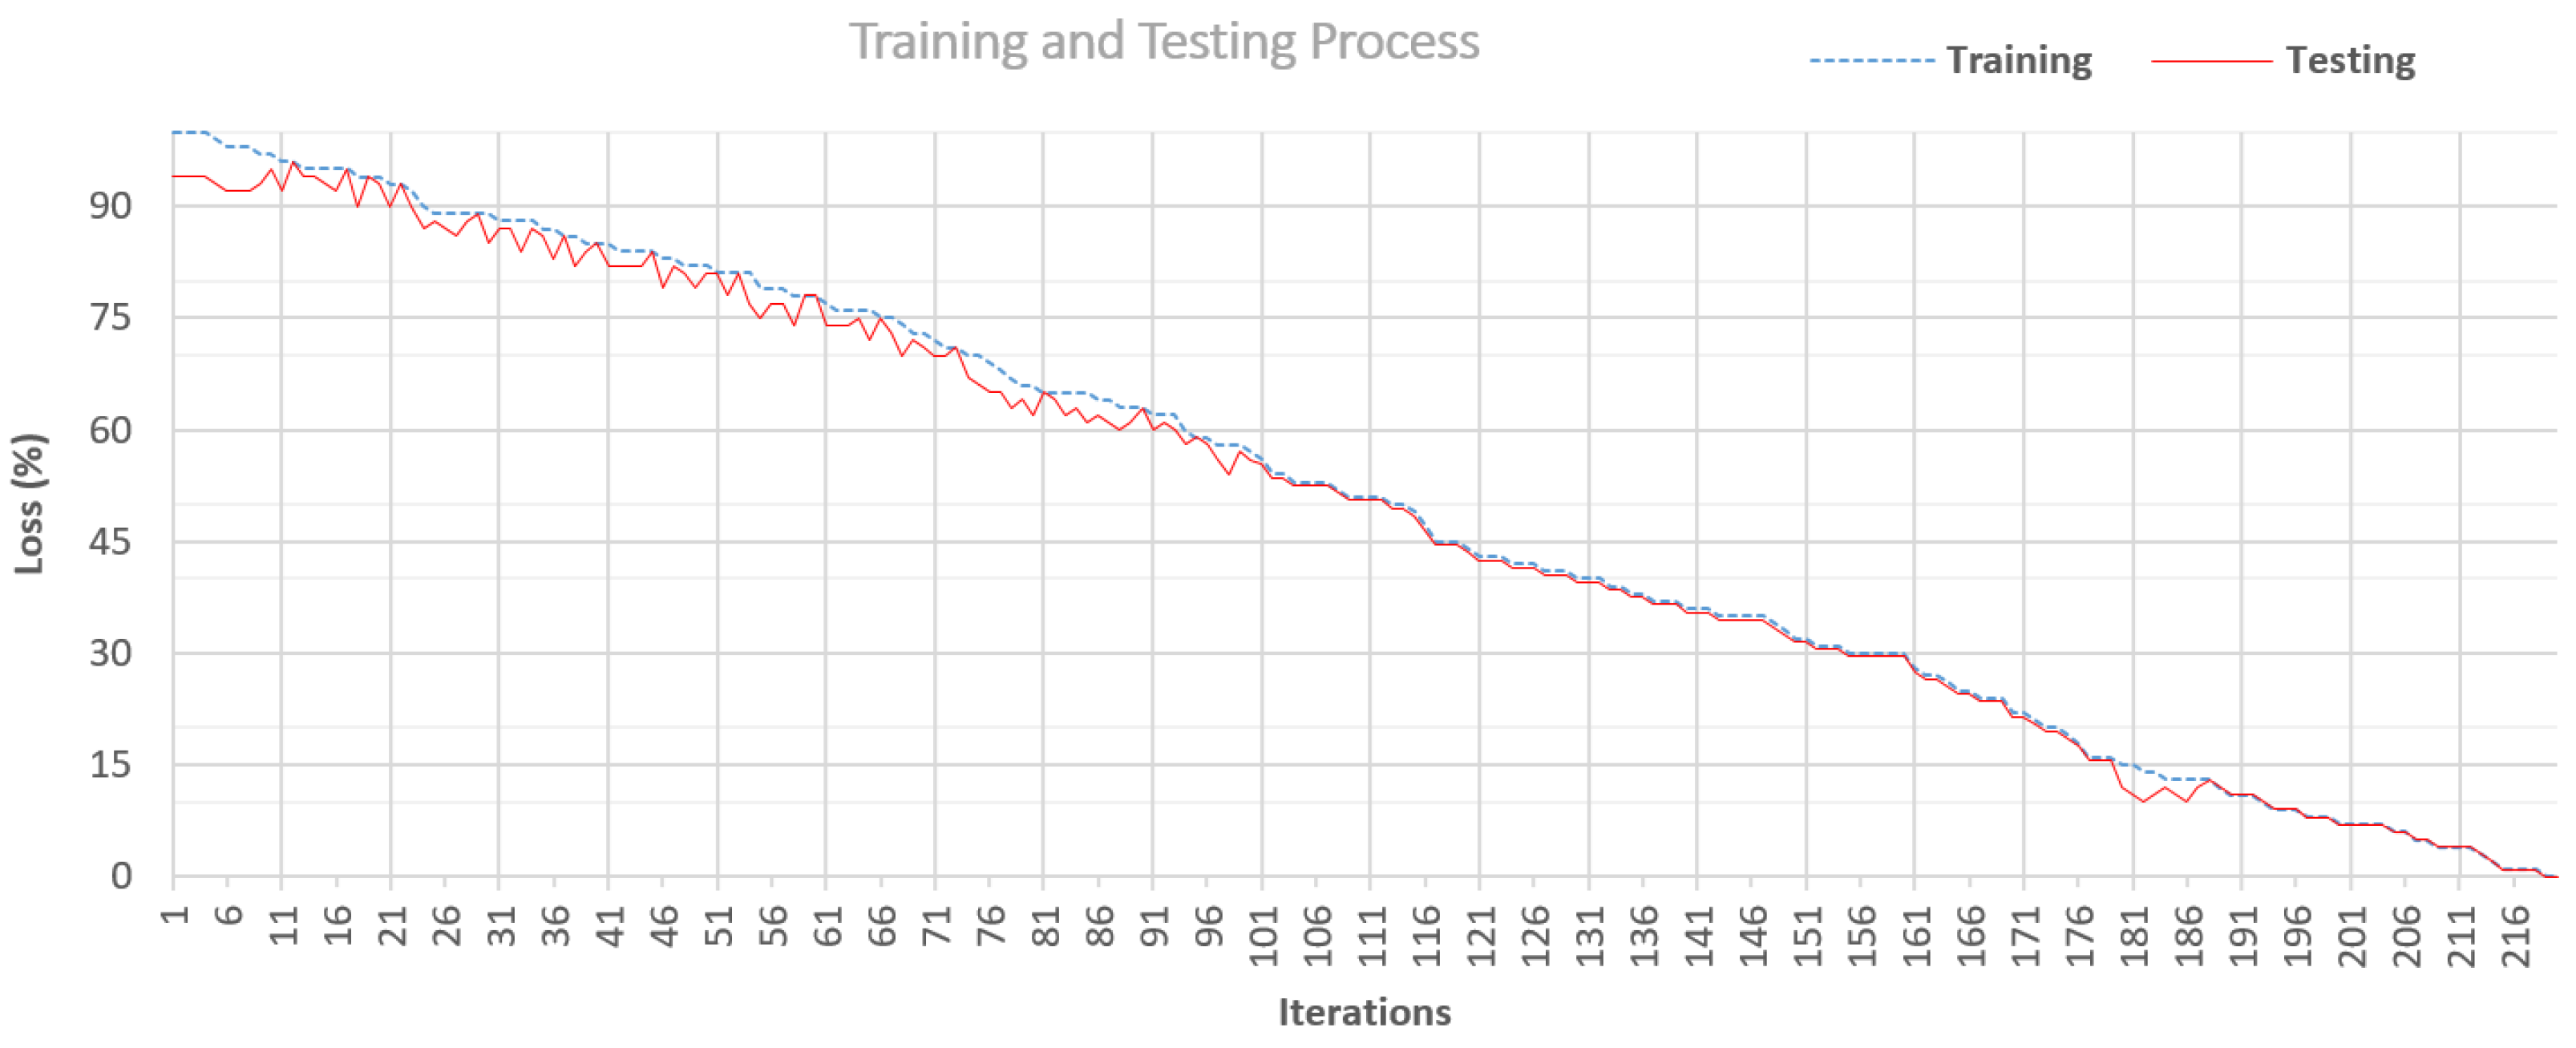
Figure 11 and
Figure 12 depict the proposed technique’s loss and suggested accuracy. Our model’s accuracy improves as the number of iterations/epochs increases while the model’s loss reduces.
Figure 12 shows that initially, the testing process has some deviation from the training set. However, it is still decreasing with the increase in epoch/iterations. At iteration 181, it also shows deviation from the training data. However, it is decreased and approximately equal to the training at iteration 216. Our model has a less overfitting issue, as it has gained the optimum values using the optimization method SCSO. Based on the optimum values, the difference between the accuracy-loss of the training-test model is reduced, which shows the authenticity of our model.
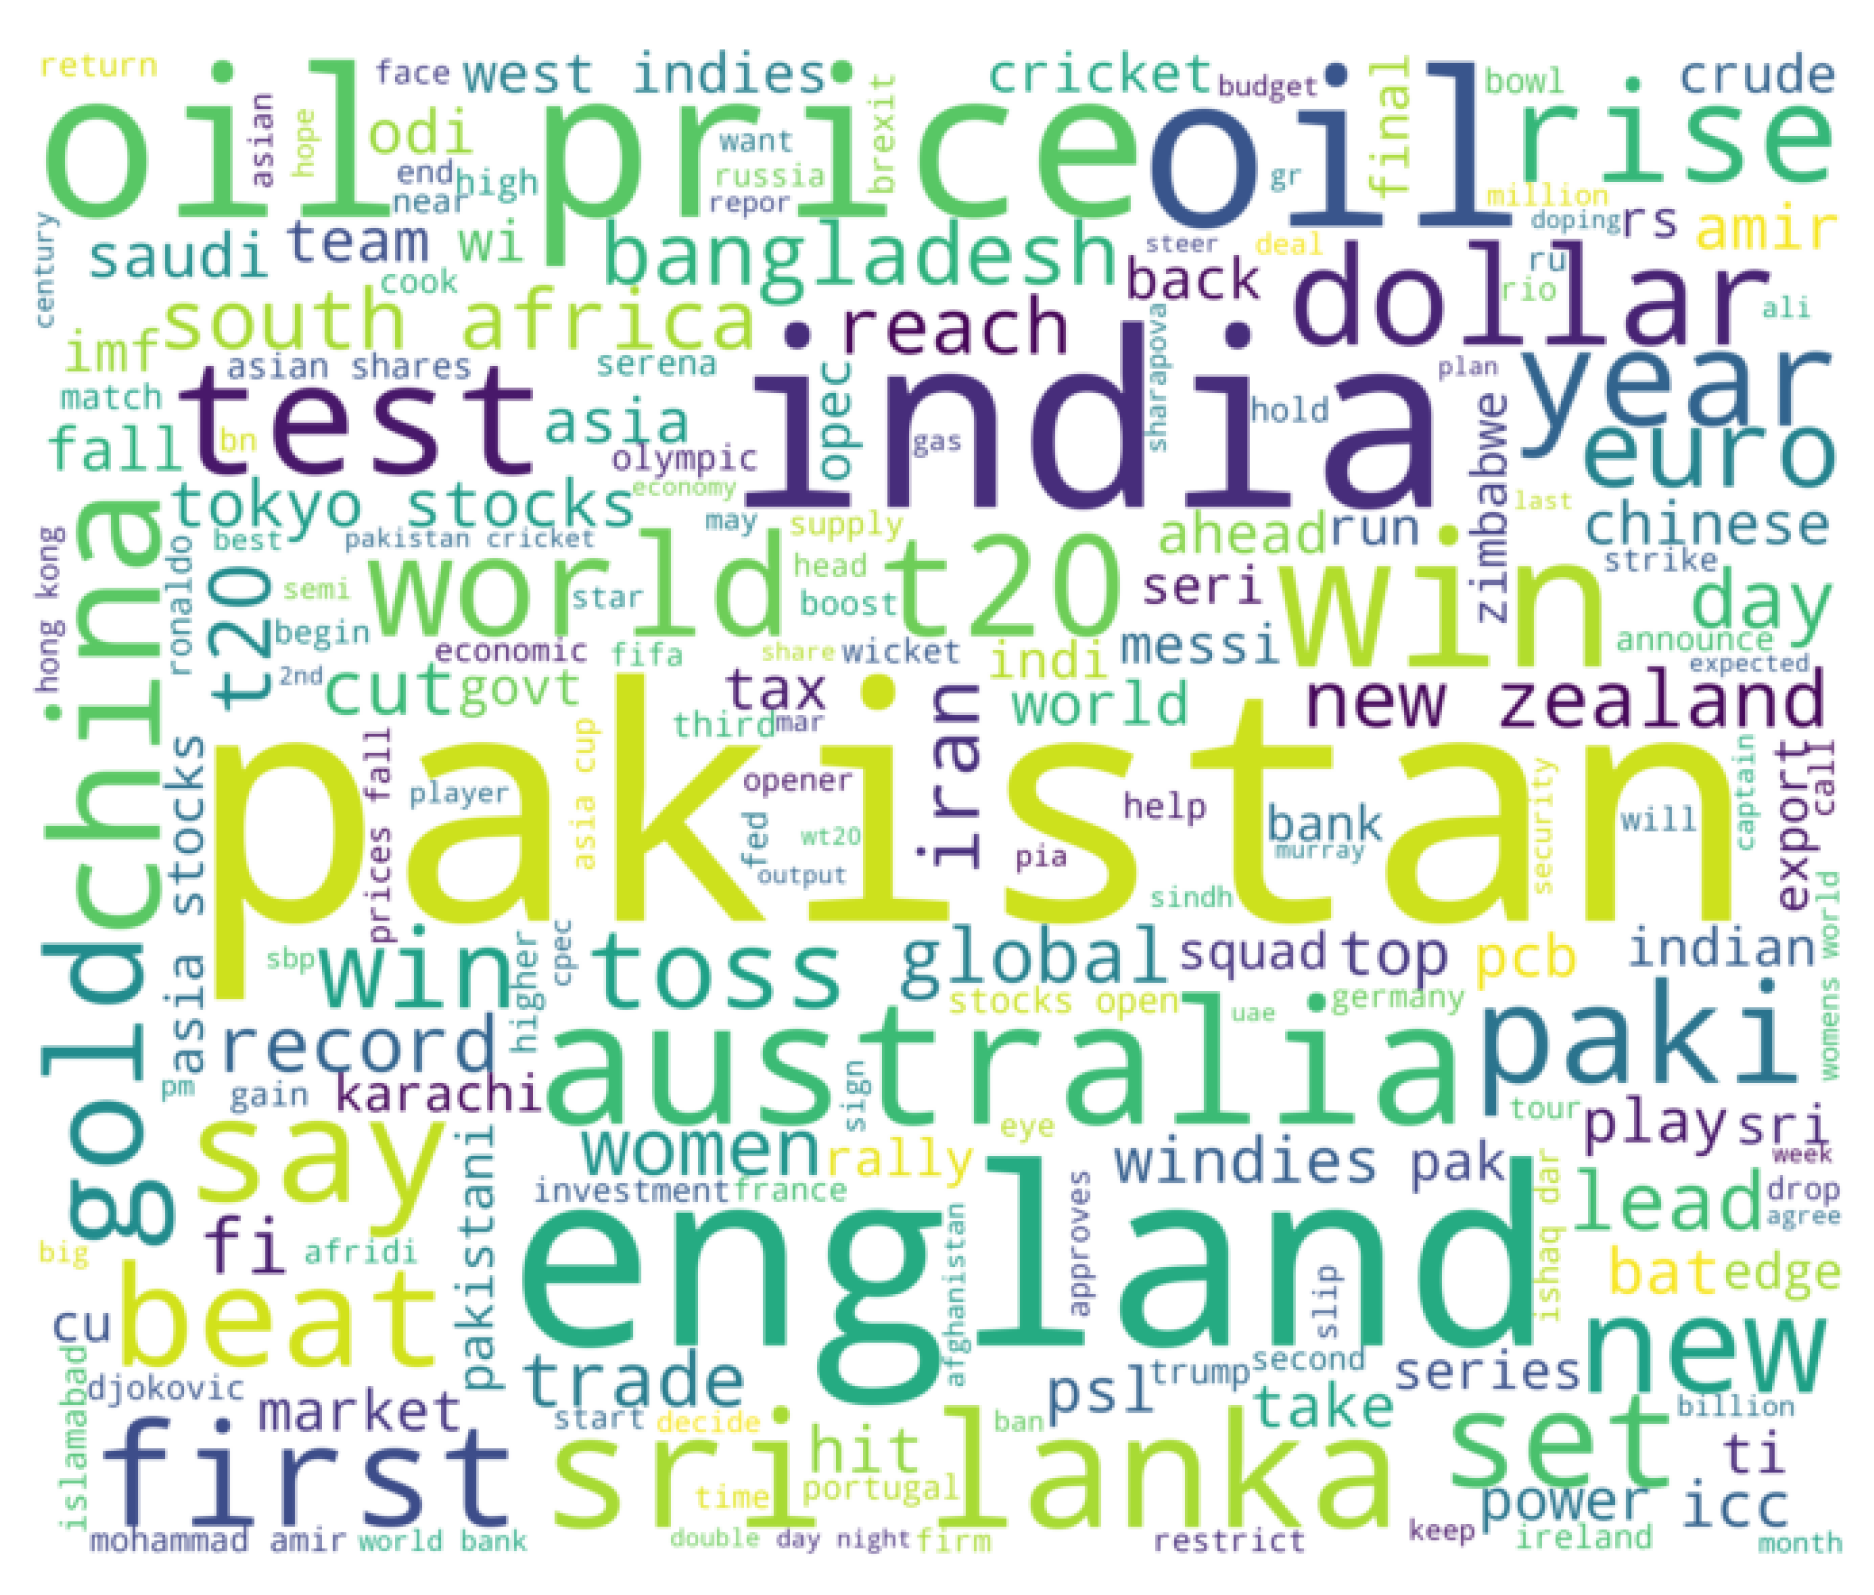
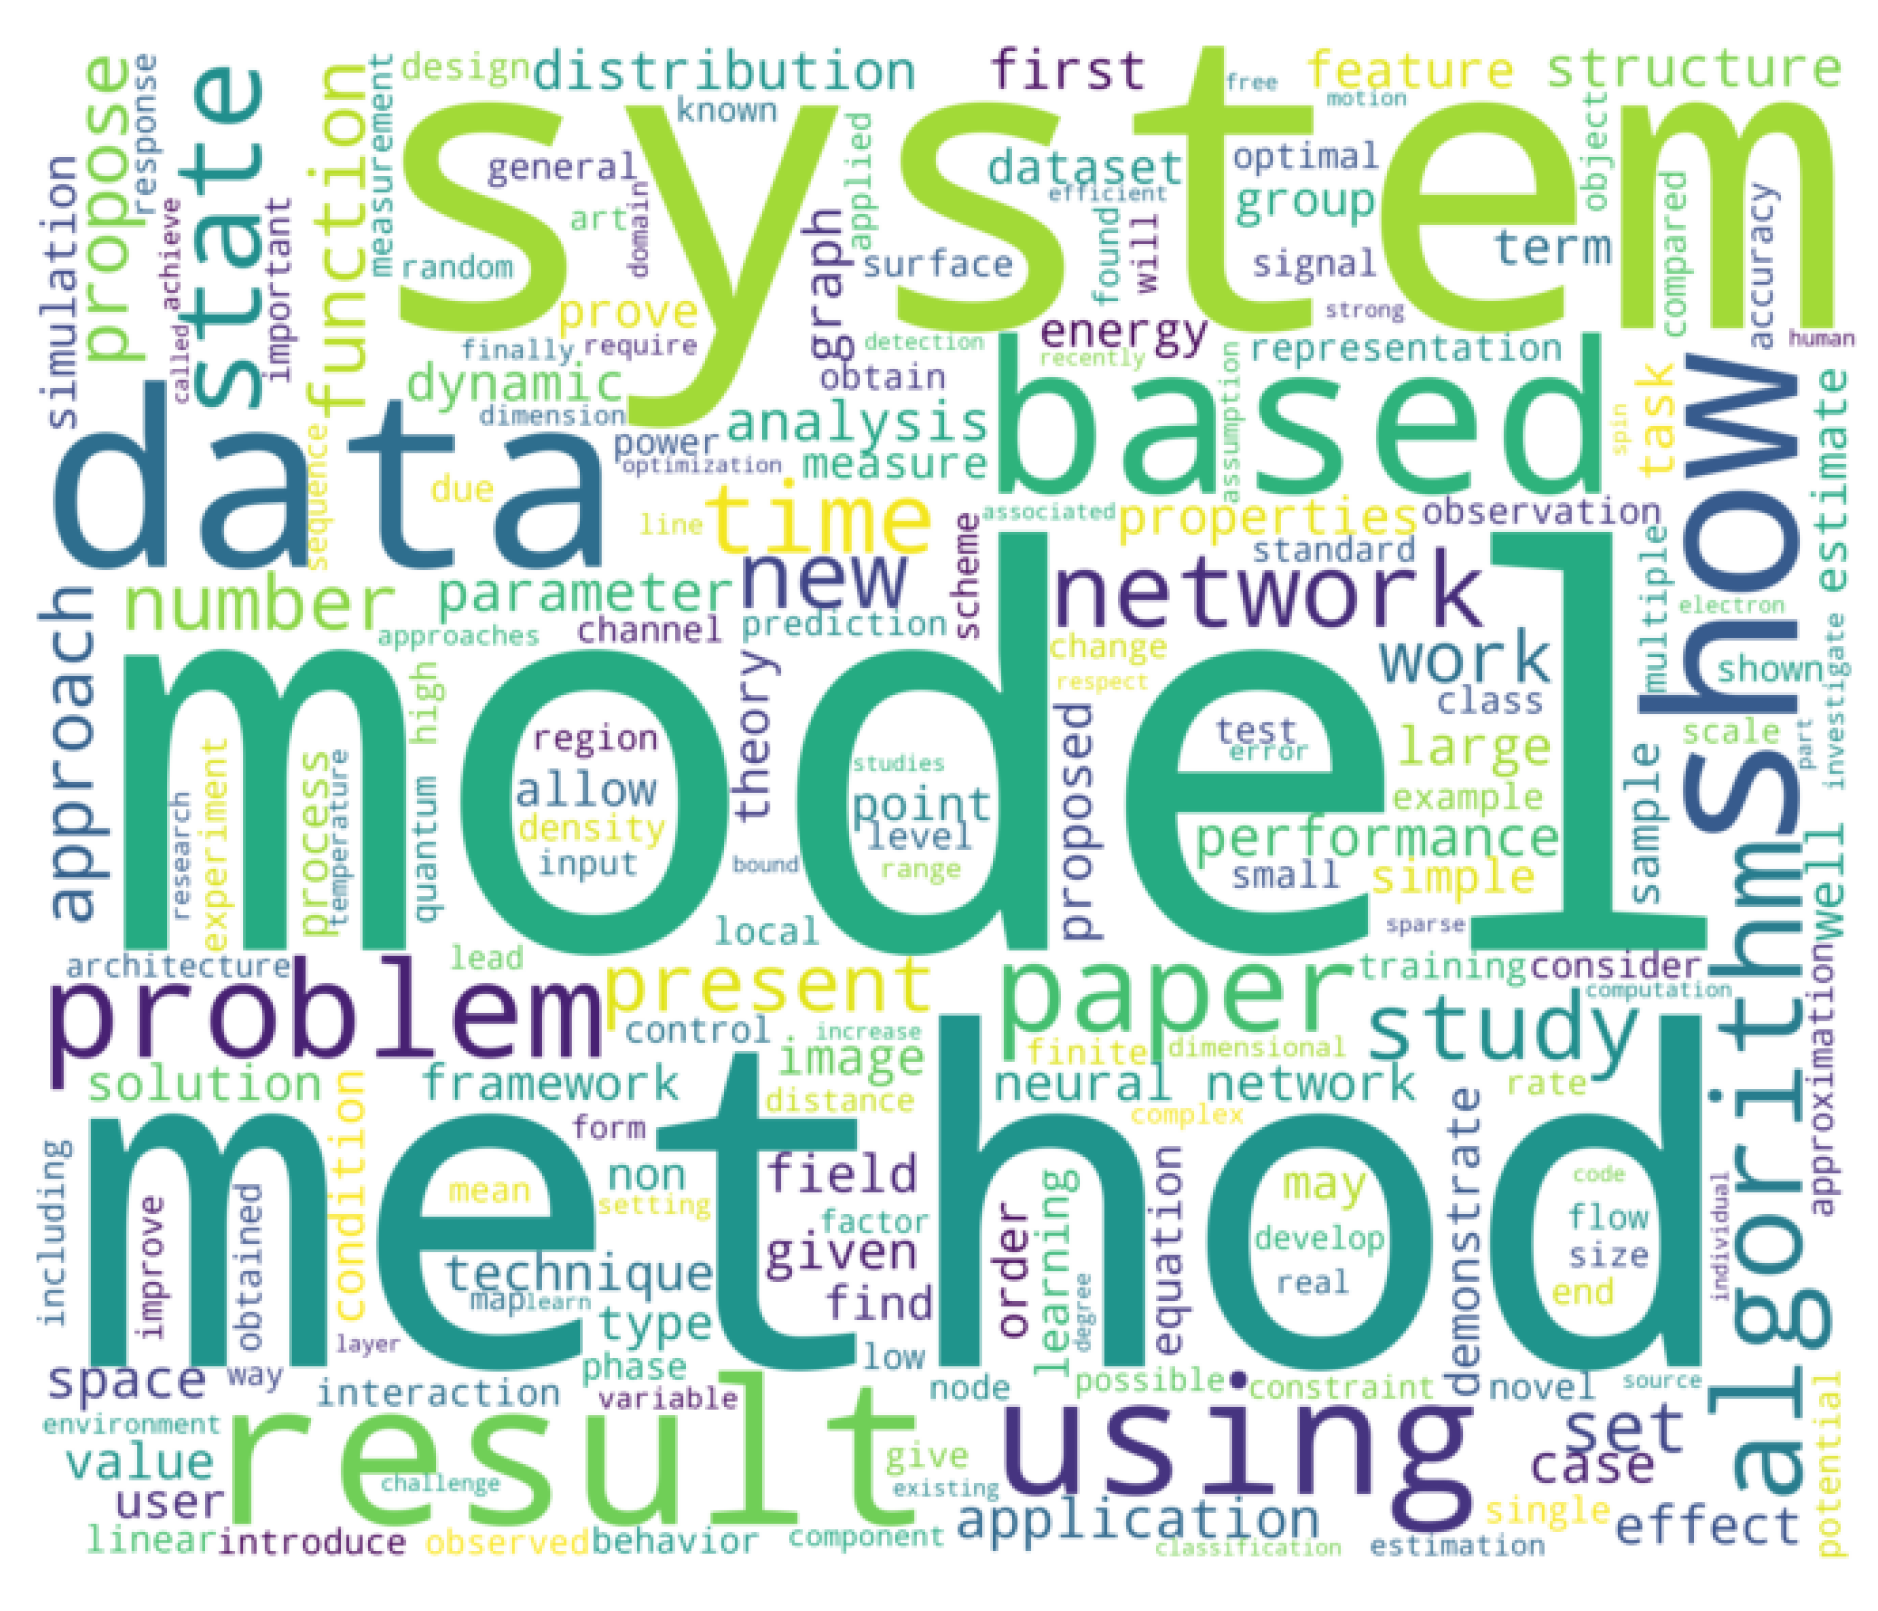
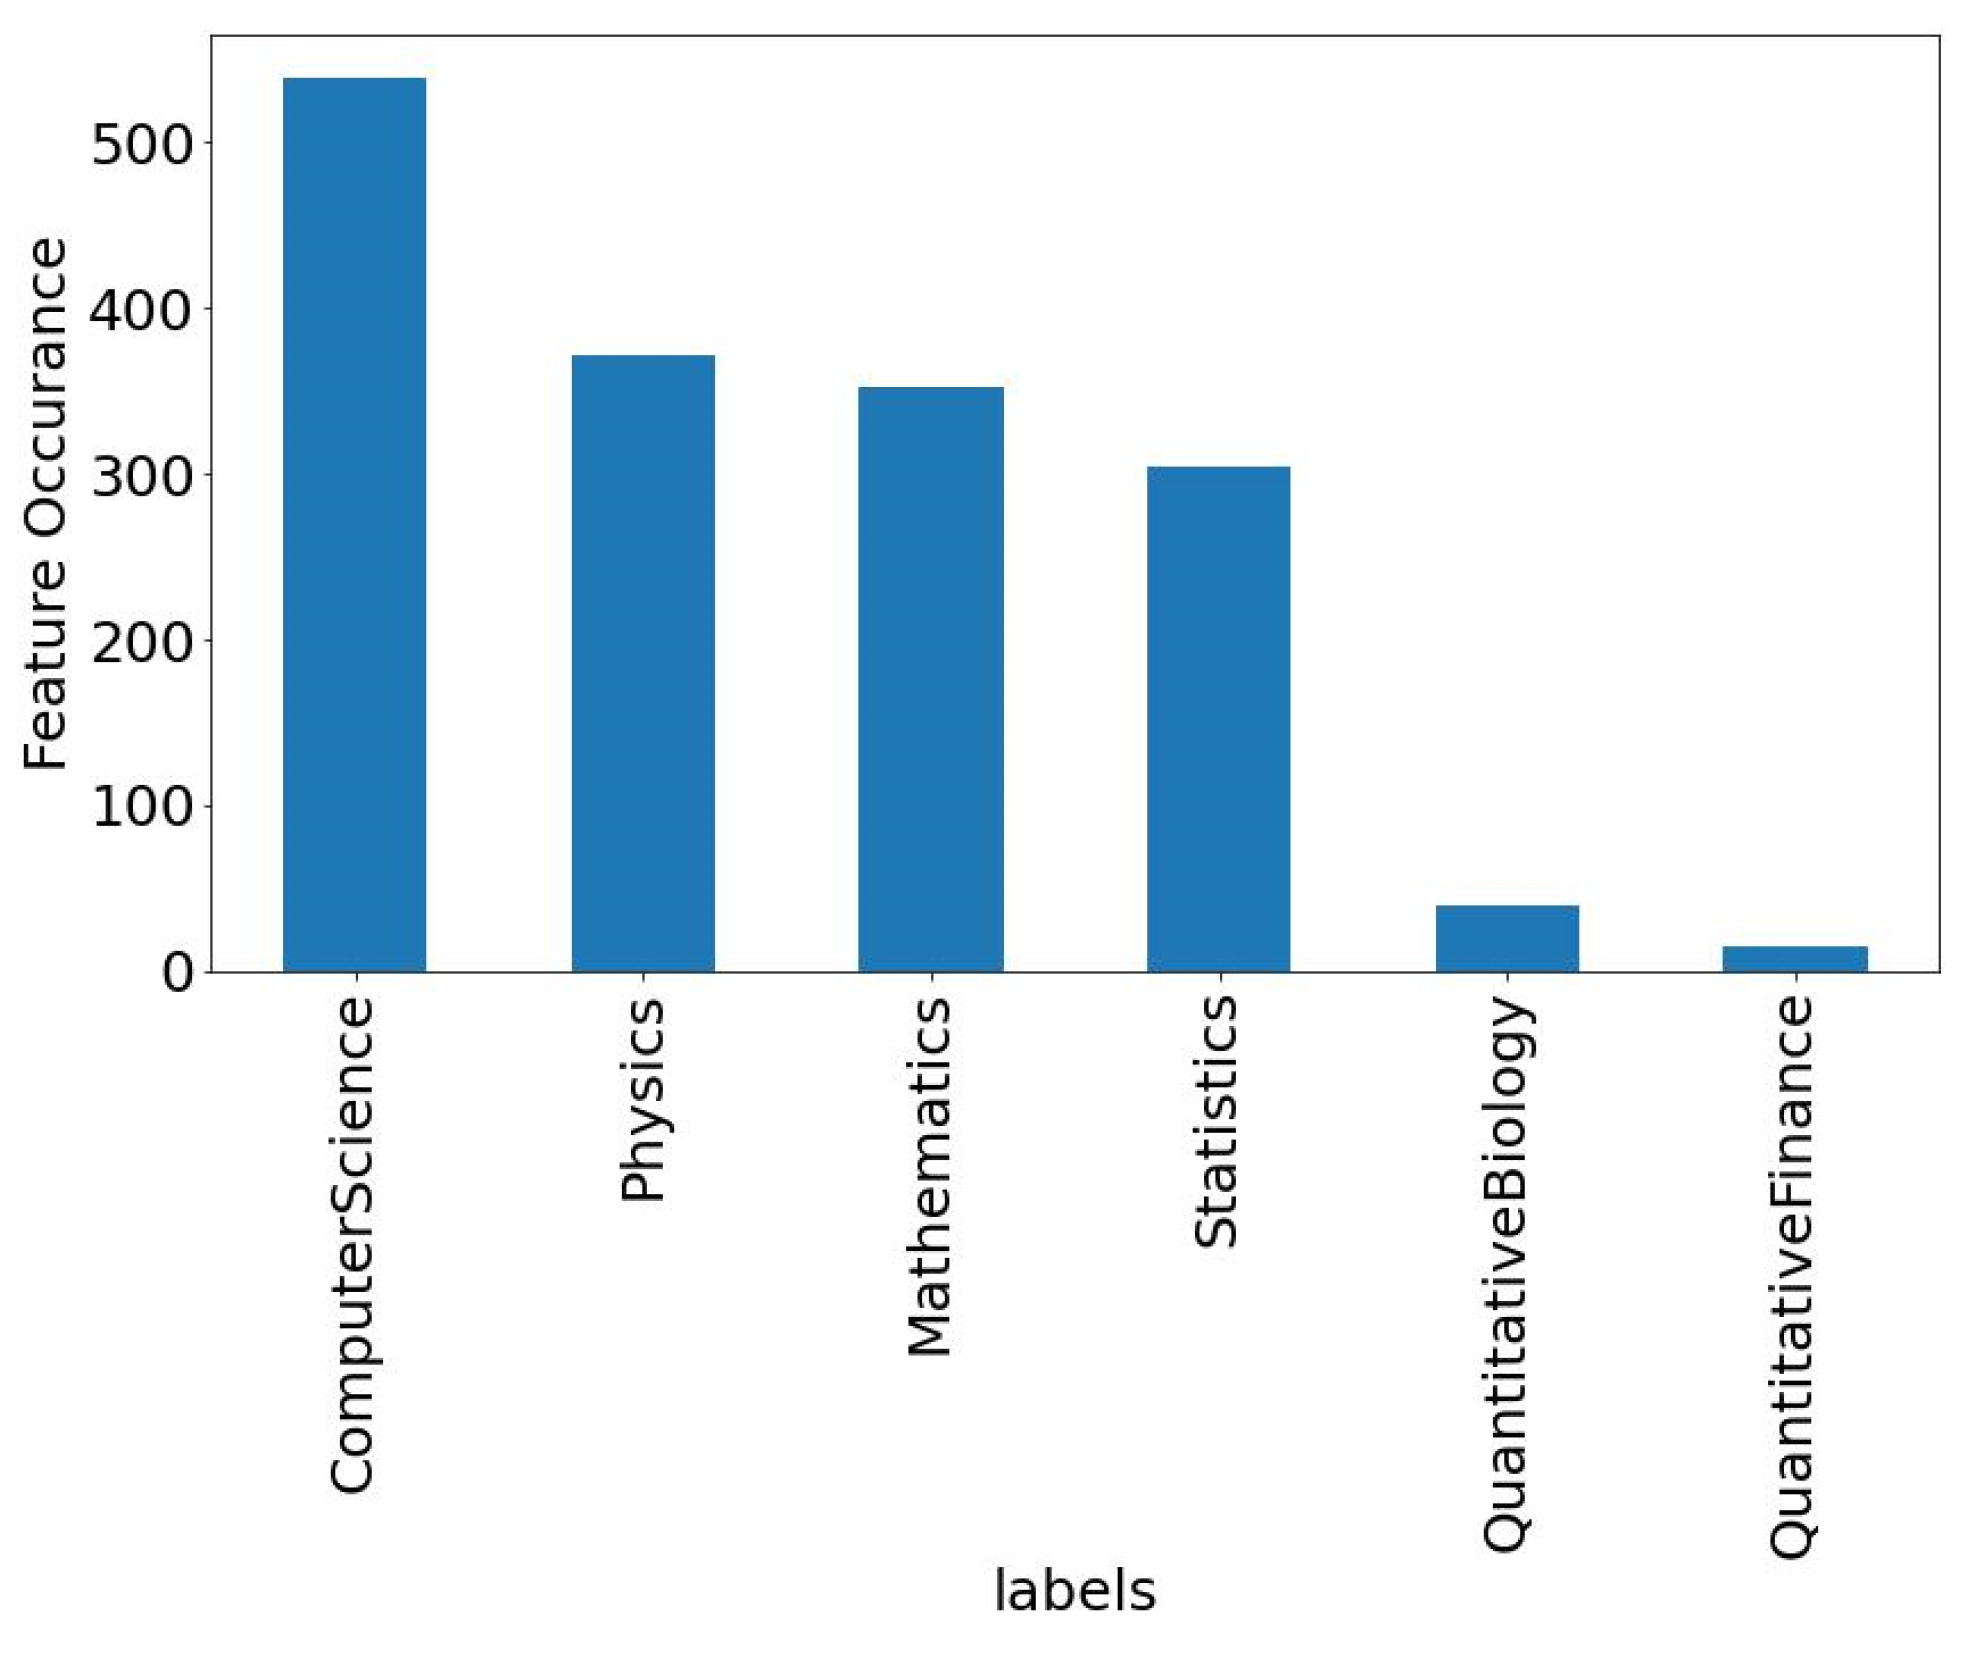
The features of specific datasets are depicted in
Figure 13 and
Figure 14. Furthermore, the occurrence of each label feature is also described. These are the main labels of every dataset which are used as a multi-label for the specific dataset. In
Figure 14, the labels of the research articles dataset are shown. The text/reviews in the research articles dataset will be labeled among those defined labels. Furthermore, all datasets are evaluated using those labels. Performance measures, such as the f1score, accuracy, precision, and recall, are used to evaluate productivity on diverse datasets.
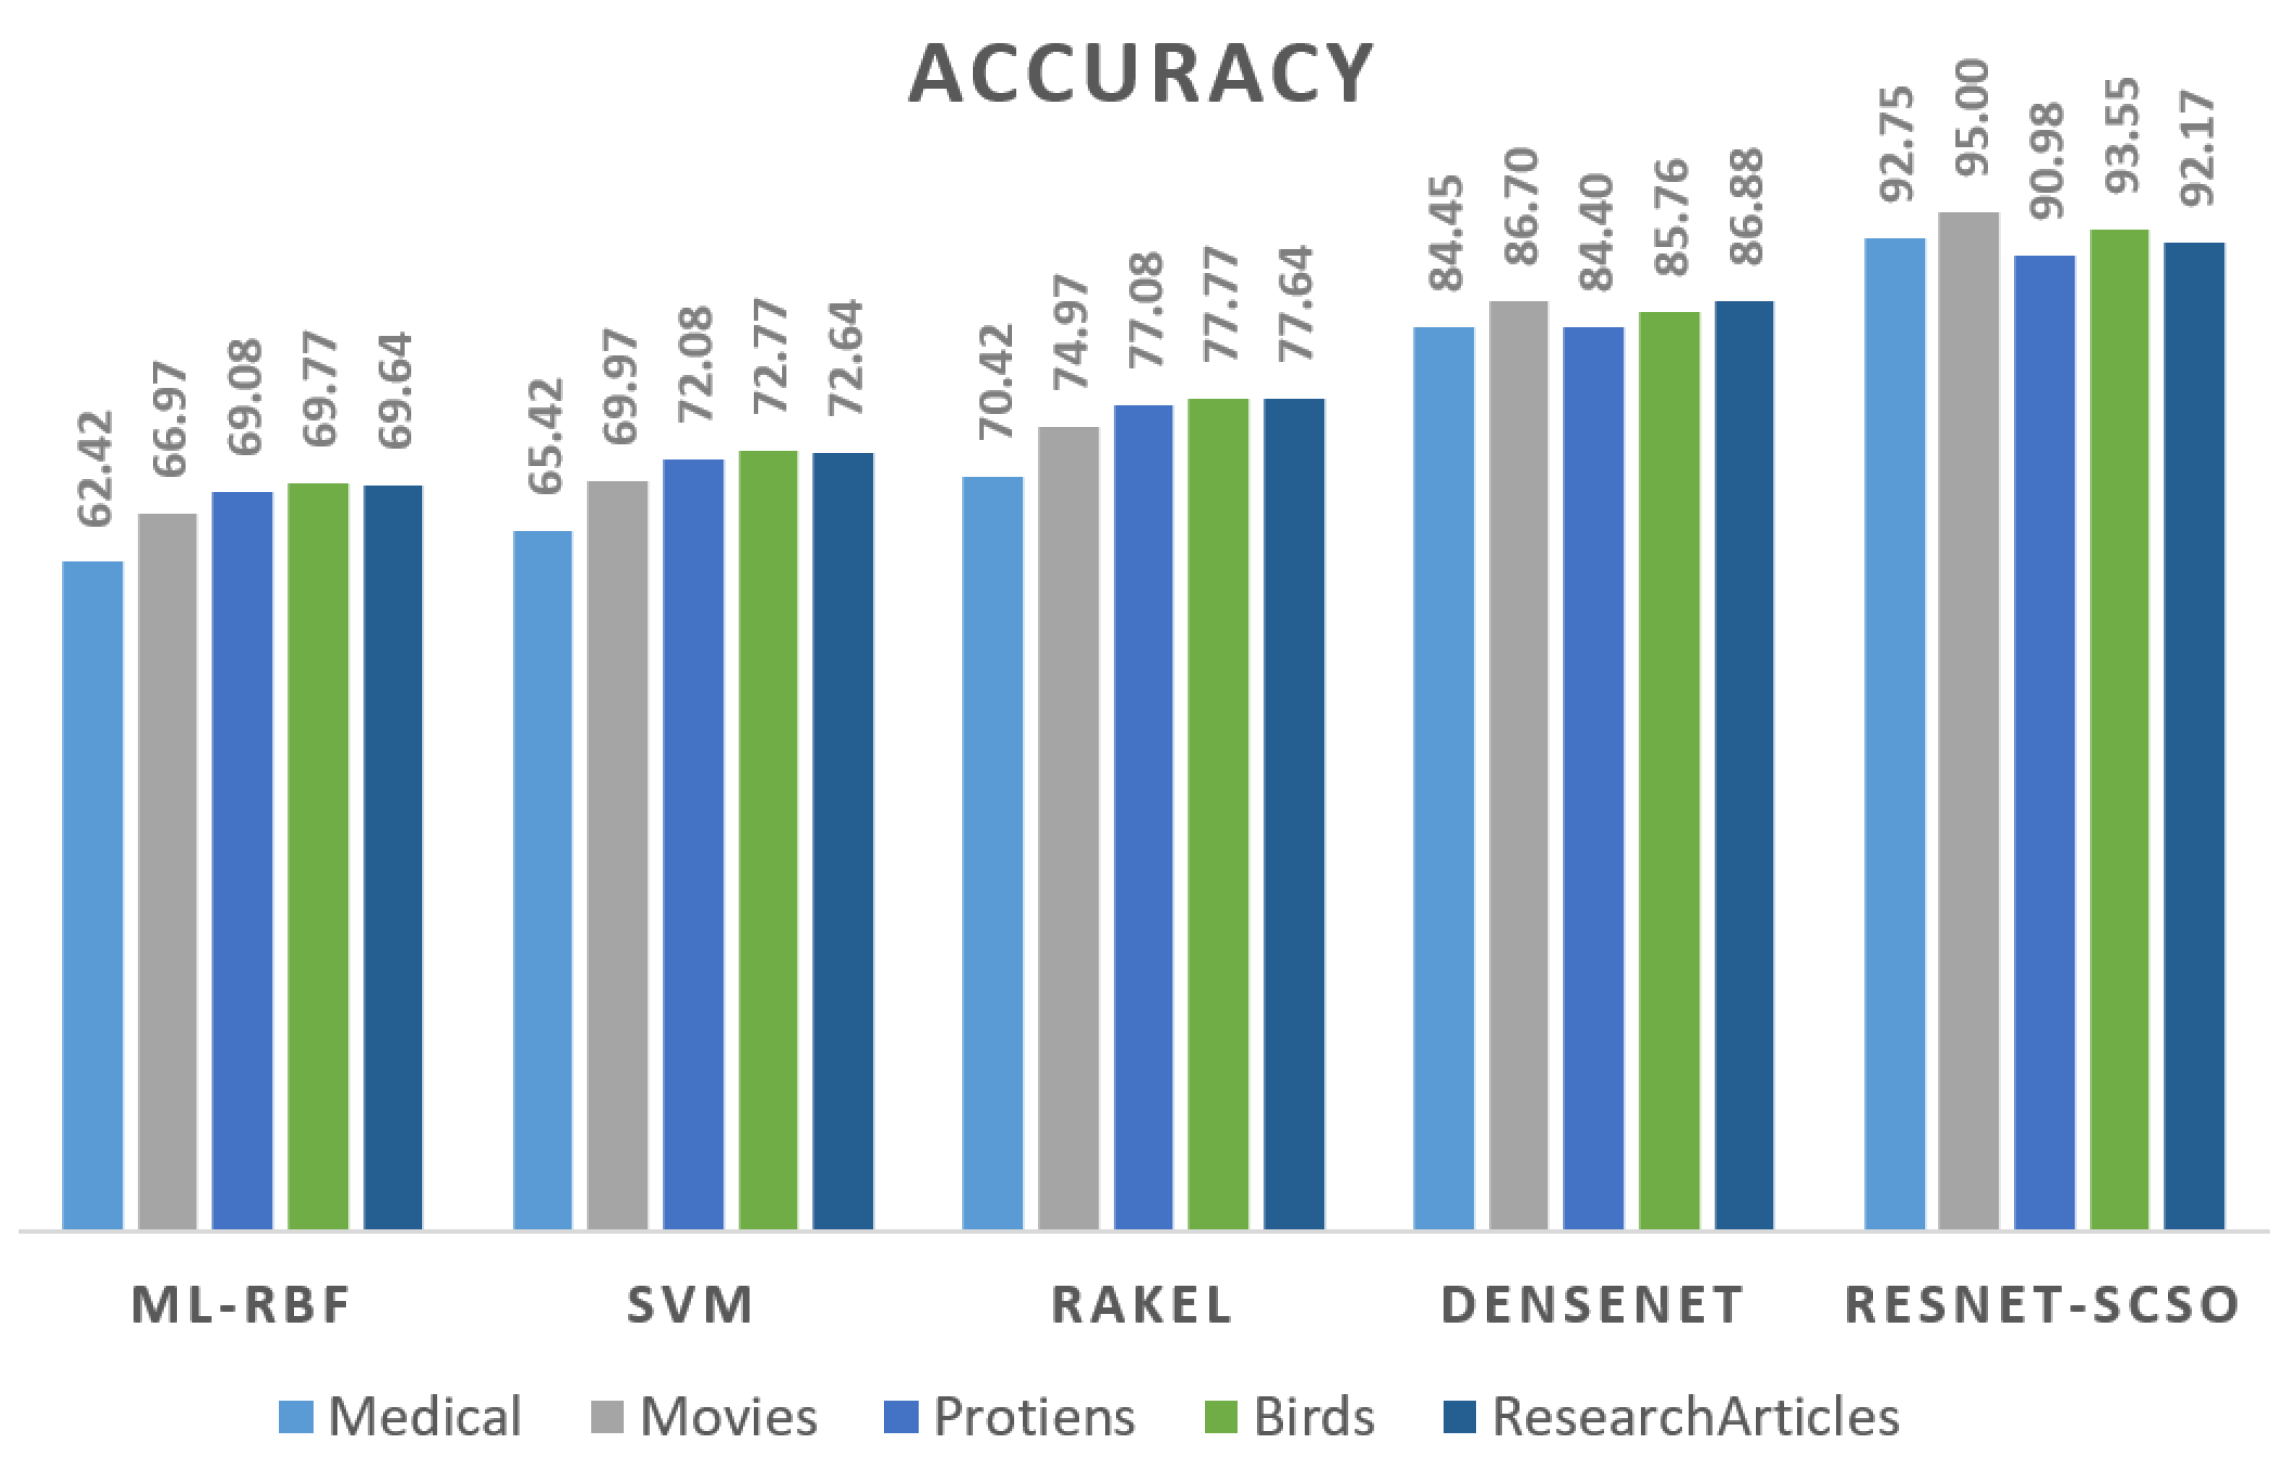
Figure 15 depicts the accuracy of the findings obtained from all six datasets. Regarding accuracy, the suggested model, ResNet-SCSO, outperforms the contrasting approaches. Furthermore, ResNet-SCSO outperforms the ML-RBF and DenseNet on the entire dataset, with DenseNet attaining the lowest accuracy ratings among the four models.
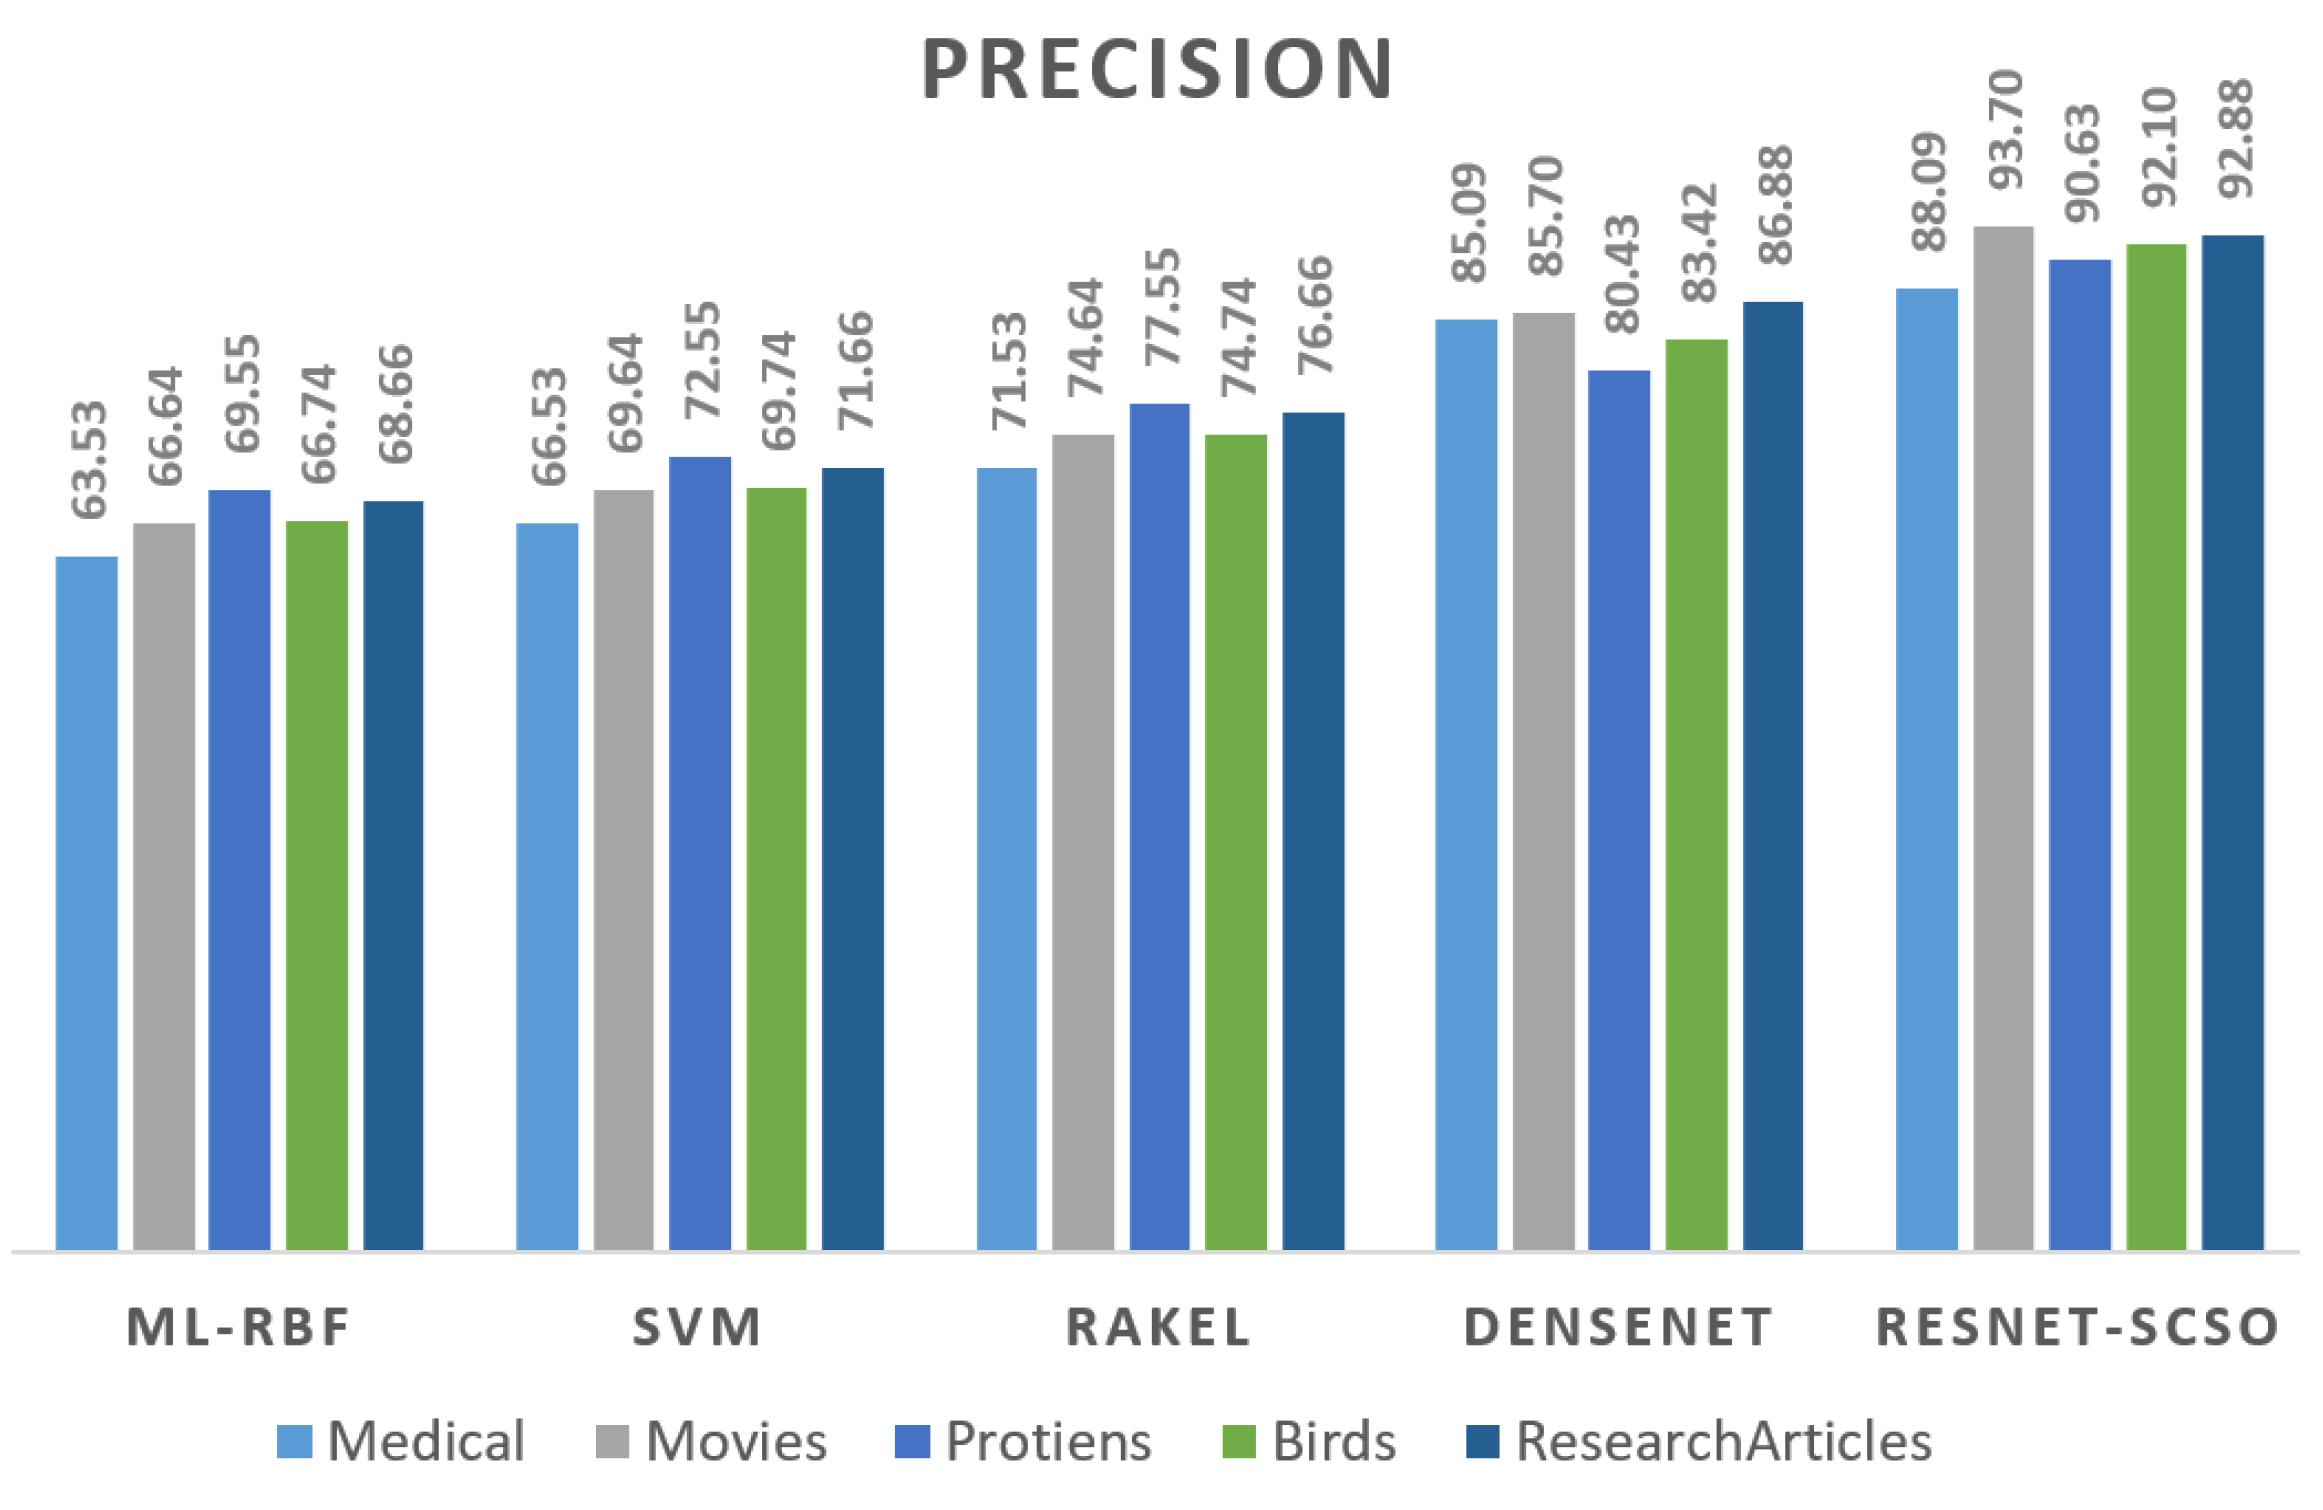
Figure 16 depicts the precision results on all datasets, where the suggested ensemble obtains a better overall score. Even the most complicated technique can produce good results in this dataset.
Figure 17 indicates that the recommended ensemble regularly beats the other techniques in terms of recall.
These findings are encouraging since they show that the suggested ensemble would be strong in multi-labeling datasets.
It can be seen in
Figure 15,
Figure 16,
Figure 17 and
Figure 18 that, as the ResNet-SCSO output rises, the ML-RBF is dropping. It may be concluded from
Figure 10,
Figure 11,
Figure 12 and
Figure 13 that RESNET-SCSO is improving. A divergence in each of these objectives implies that they are mutually exclusive. ML-RBF optimization ensures that the expected baseline learner labels correctly intersects with the labels. As a consequence, it is difficult to identify who these primary learners are. At the other extreme, ML-RBF maximization gives the base learners the most flexibility regarding training mistakes. Stated objectives are in direct conflict with one another under most circumstances. The dispute allows us to reconcile ML-objective RBFs by finding a workable population balance. While doing this exercise, it is critical to remember that DenseNet and SVM are not analyzing the ensemble’s overall performance. This reduction in ML-RBF is not a sign of a declining ensemble.
Despite this, the rise in the RESNET-SCSO (standard error of measure) indicates that the base learners receive a more comprehensive range of knowledge, impacting group performance. A tuning method is used to adjust the ensemble’s tuning settings. As a consequence of these findings, multi-labeling is more precise. Thereby, because of RESNET-SCSO, the multi-label ensemble can better generalize, thus increasing the capacity to categorize across multiple labels.
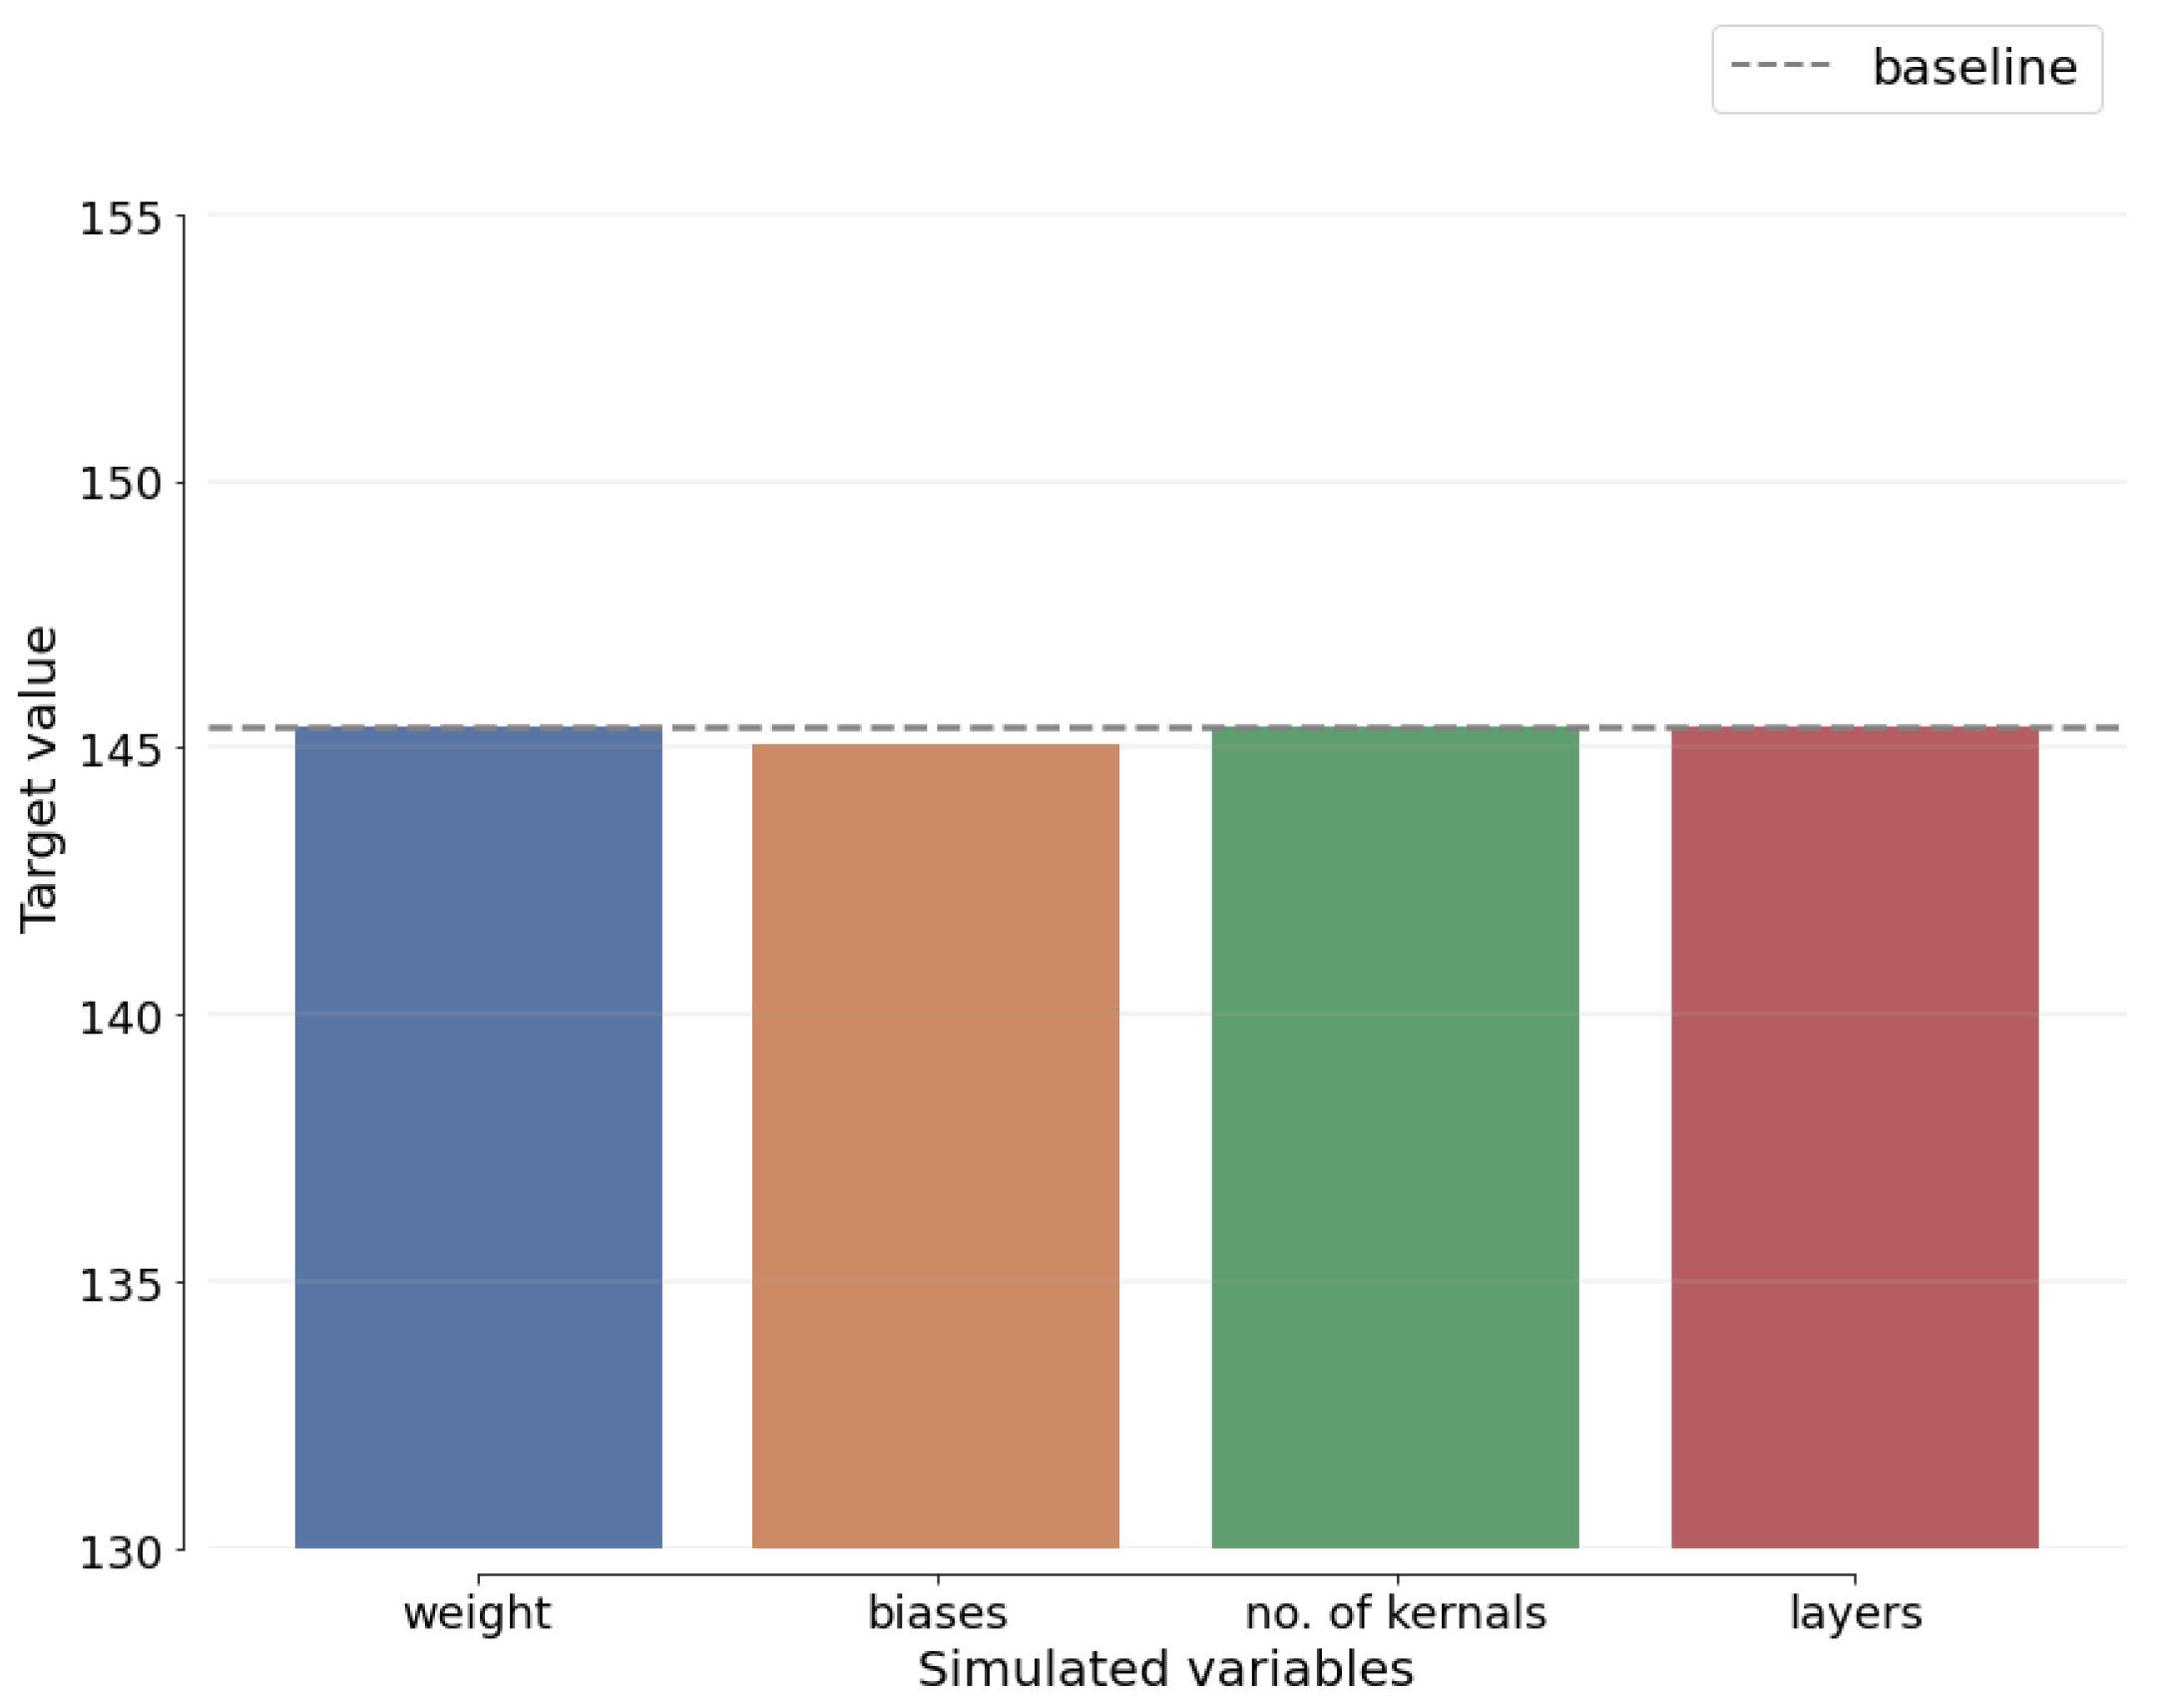
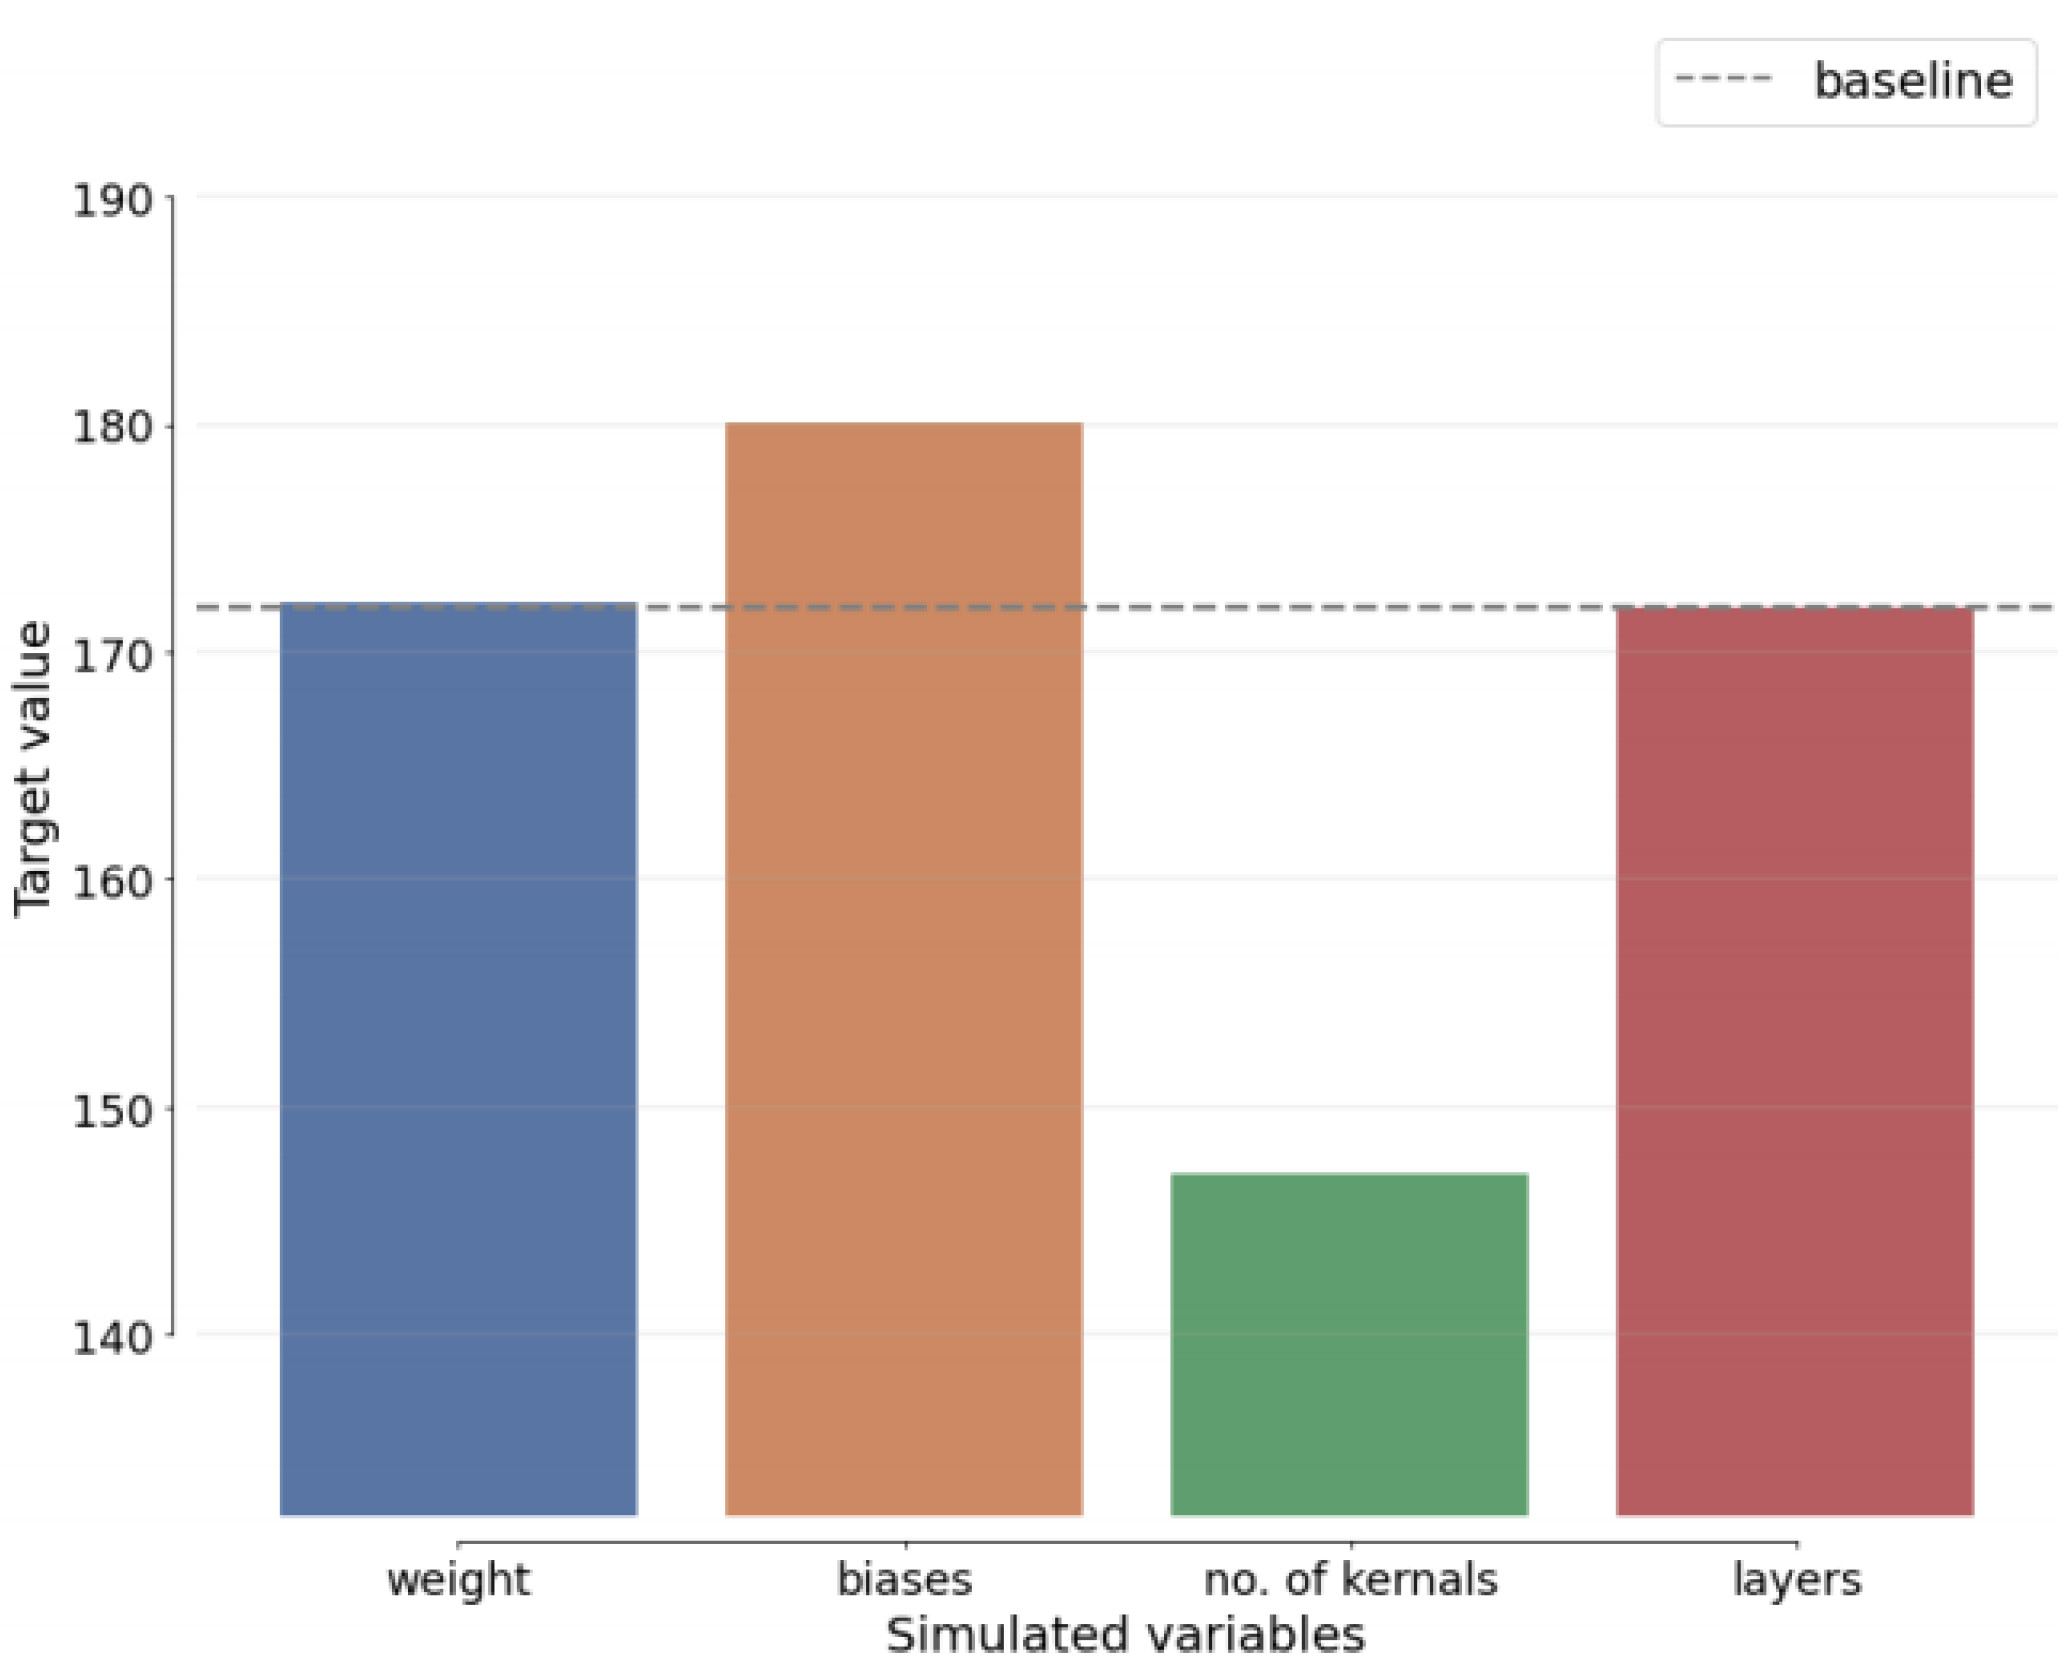
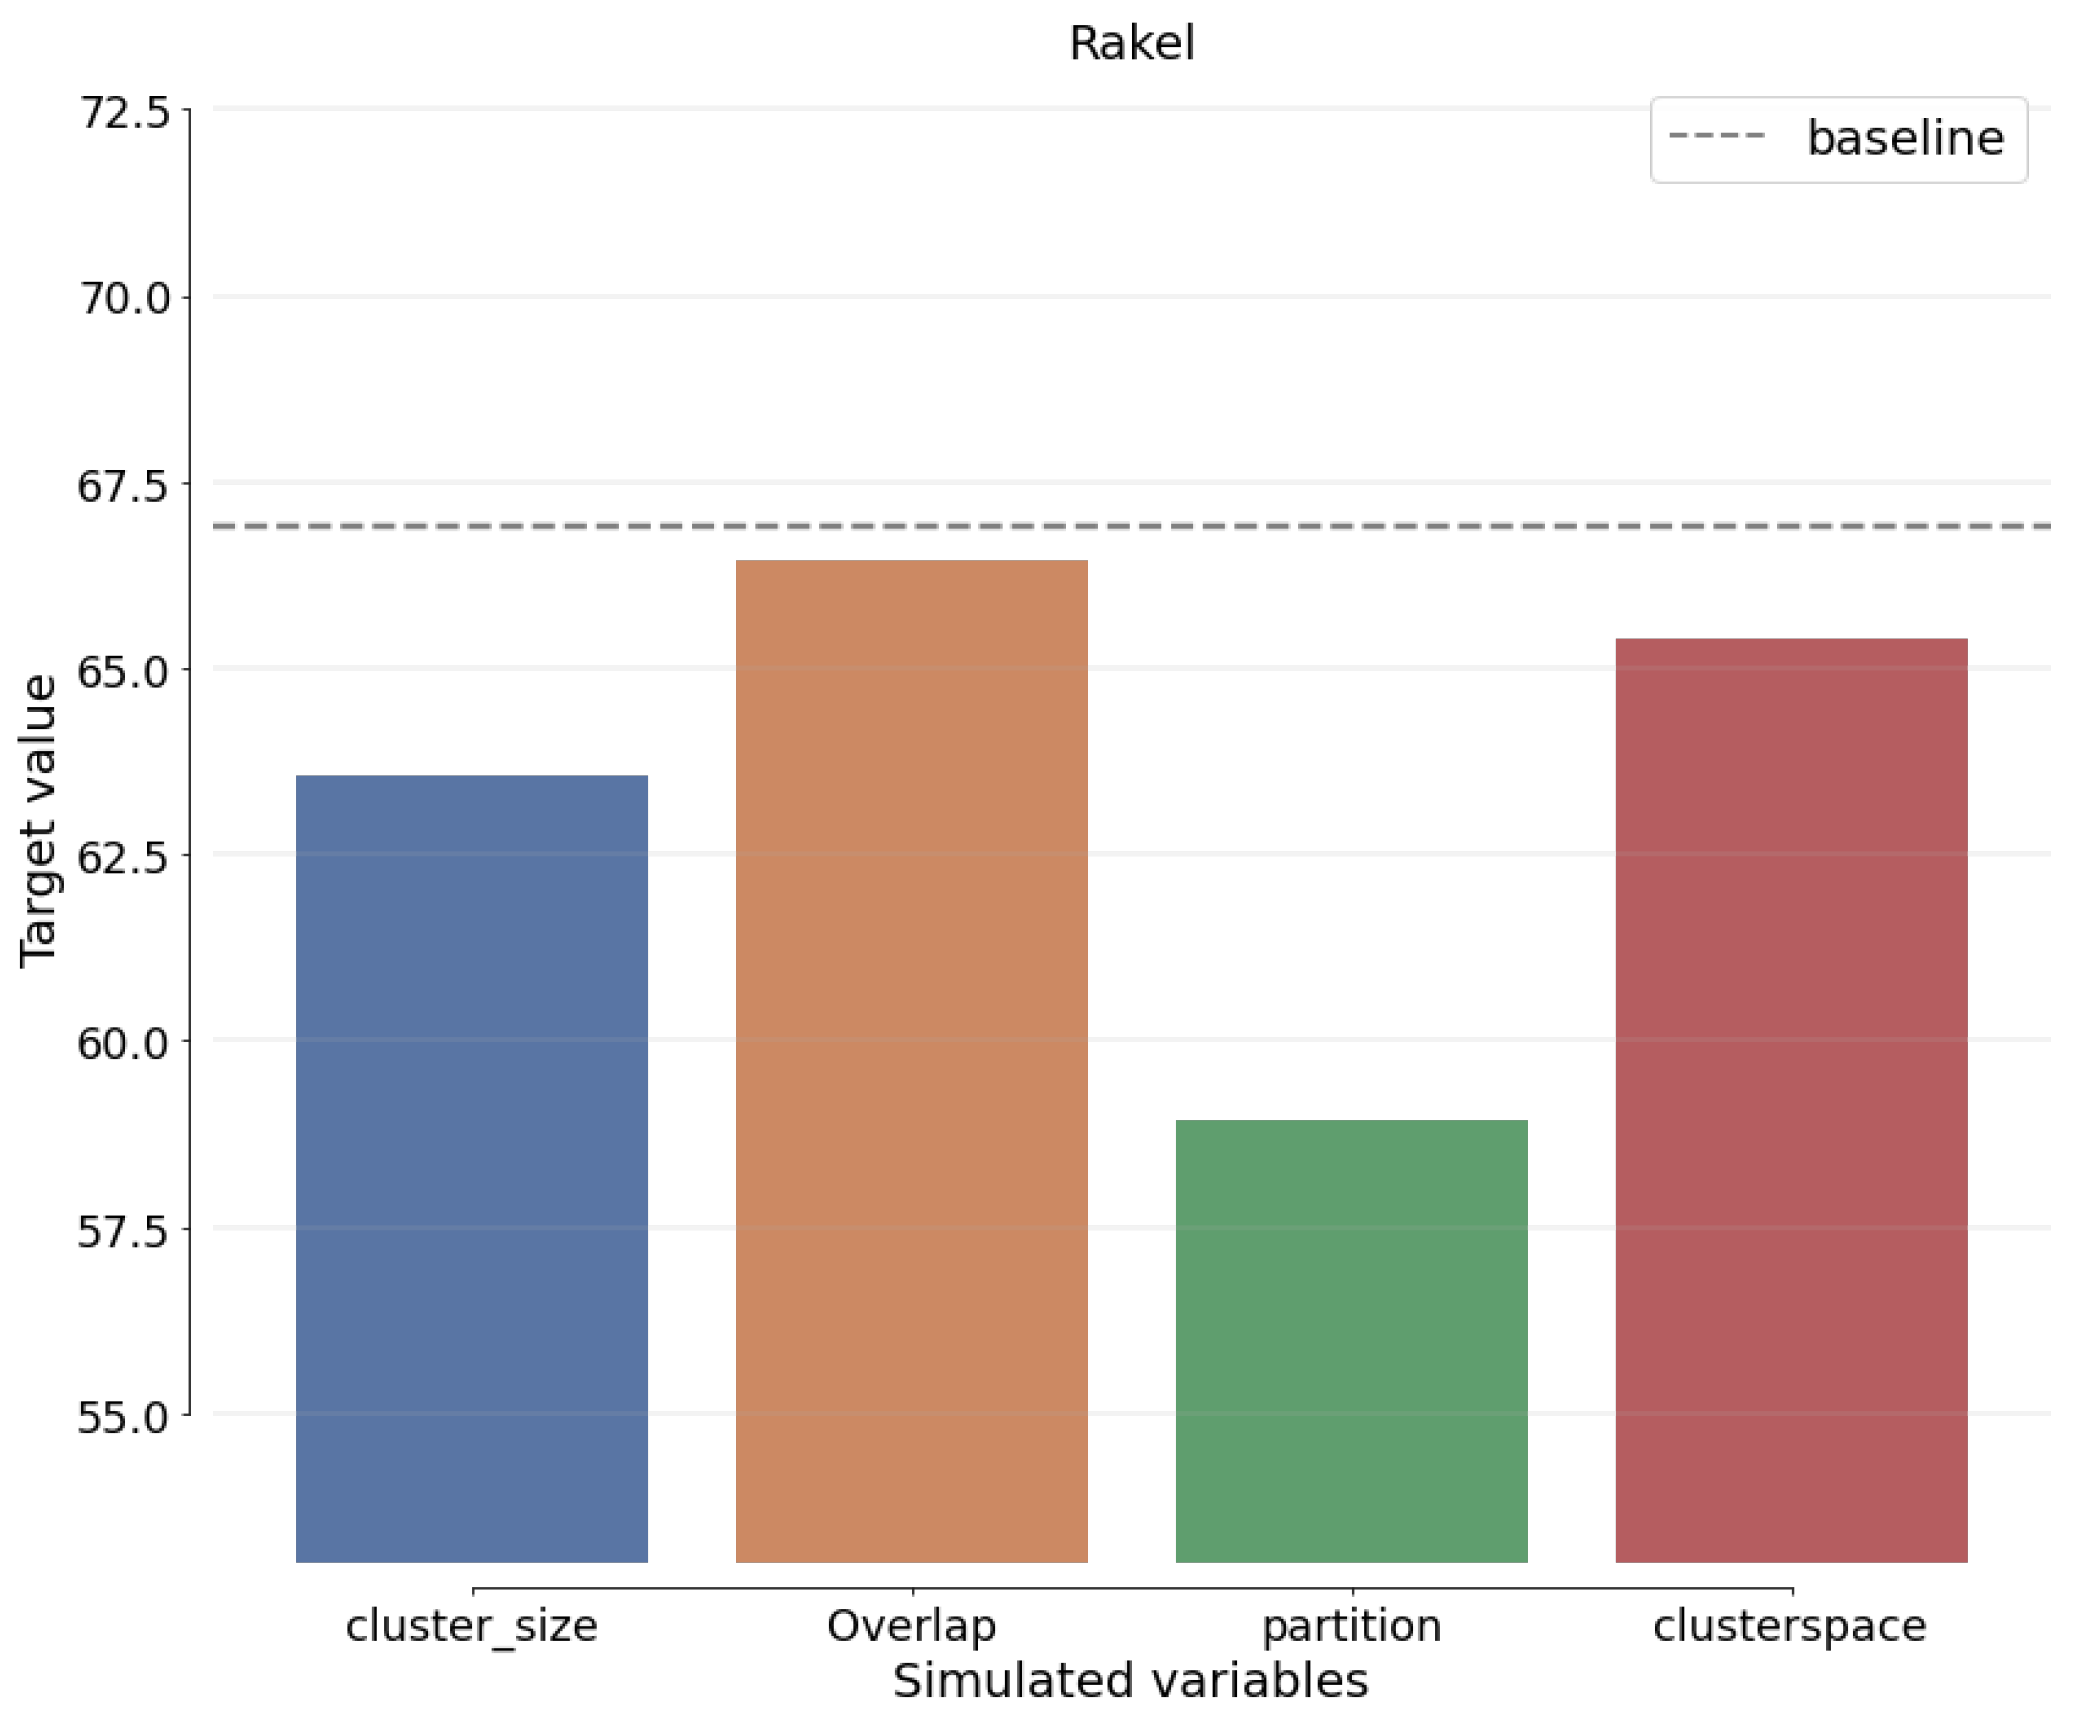
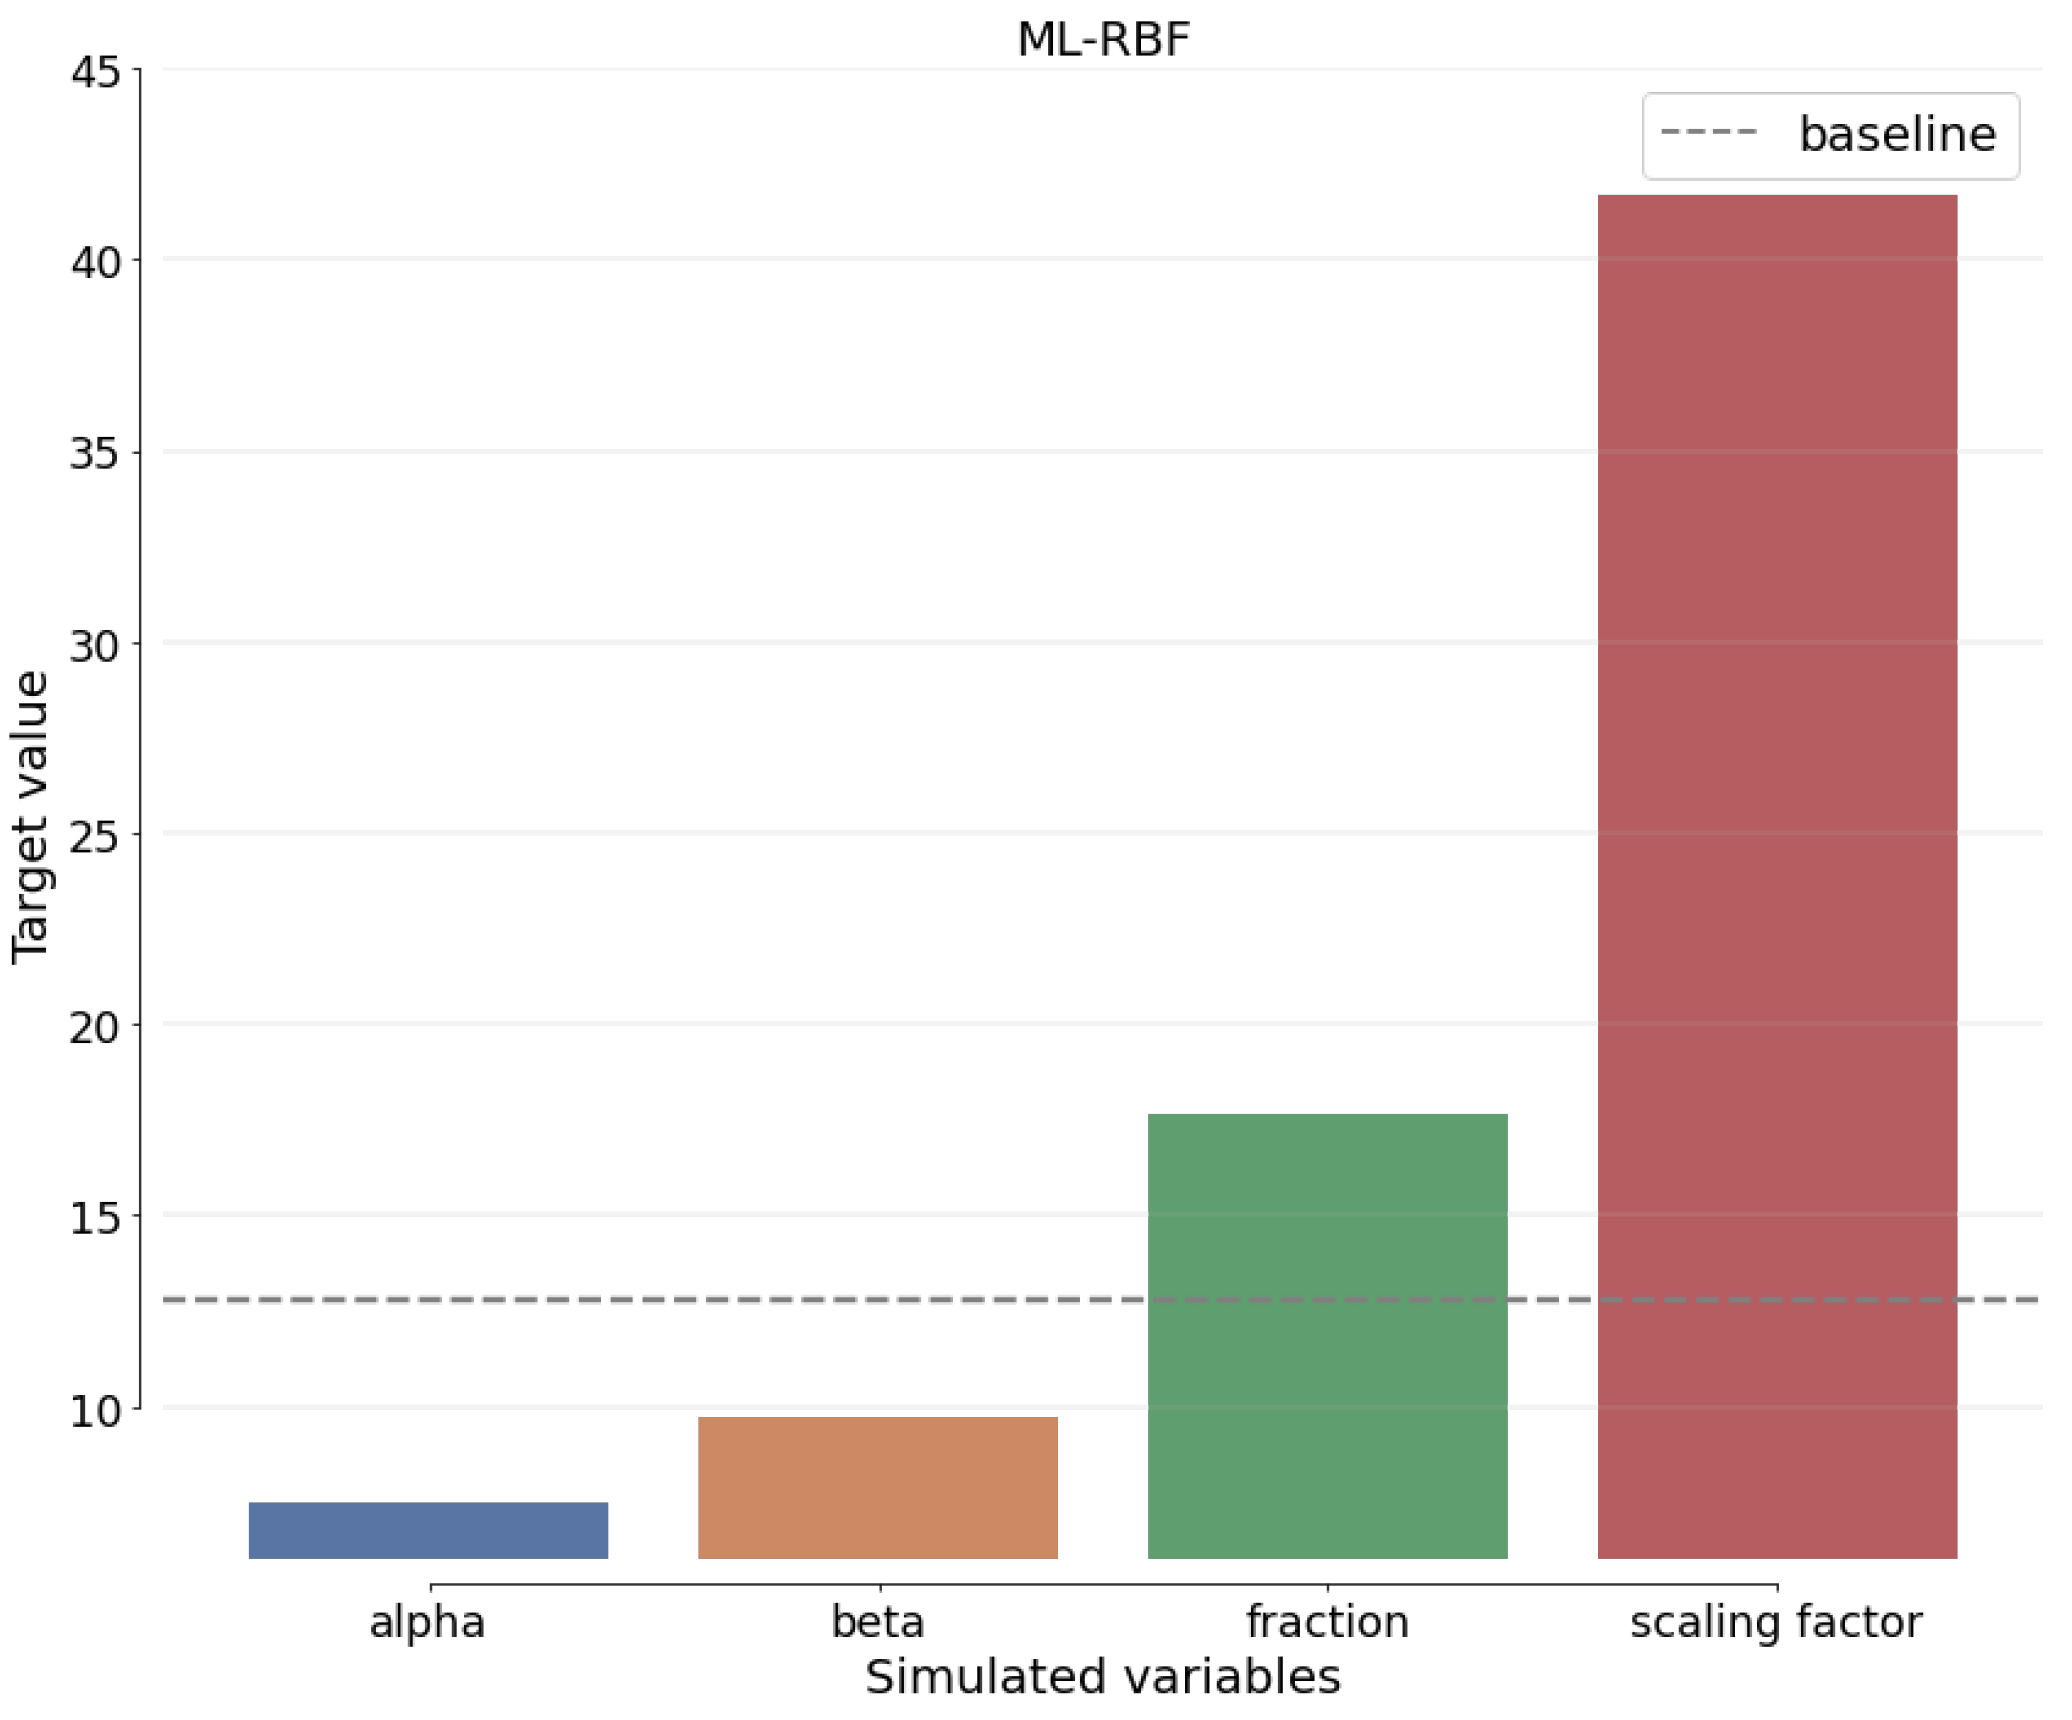
Sensitivity analysis (SAn) is concerned with determining how the alternative values of an independent variable impact a dependent variable under specific assumptions and conditions. This means that sensitivity studies examine the many uncertainties in a statistical model and how they impact the model’s overall uncertainty. Before moving around, SAn estimates the predicted change for each unknown element. The best estimates for each variable are provided to demonstrate how the assumptions for each technique differ from the baseline.
Figure 19,
Figure 20,
Figure 21 and
Figure 22 show how the SAn of the proposed approach is calculated.
Figure 20,
Figure 21 and
Figure 22 depict the estimated sigma of the most recent benchmark approaches to demonstrate this claim when comparing ResNet-SCSO to other networks.
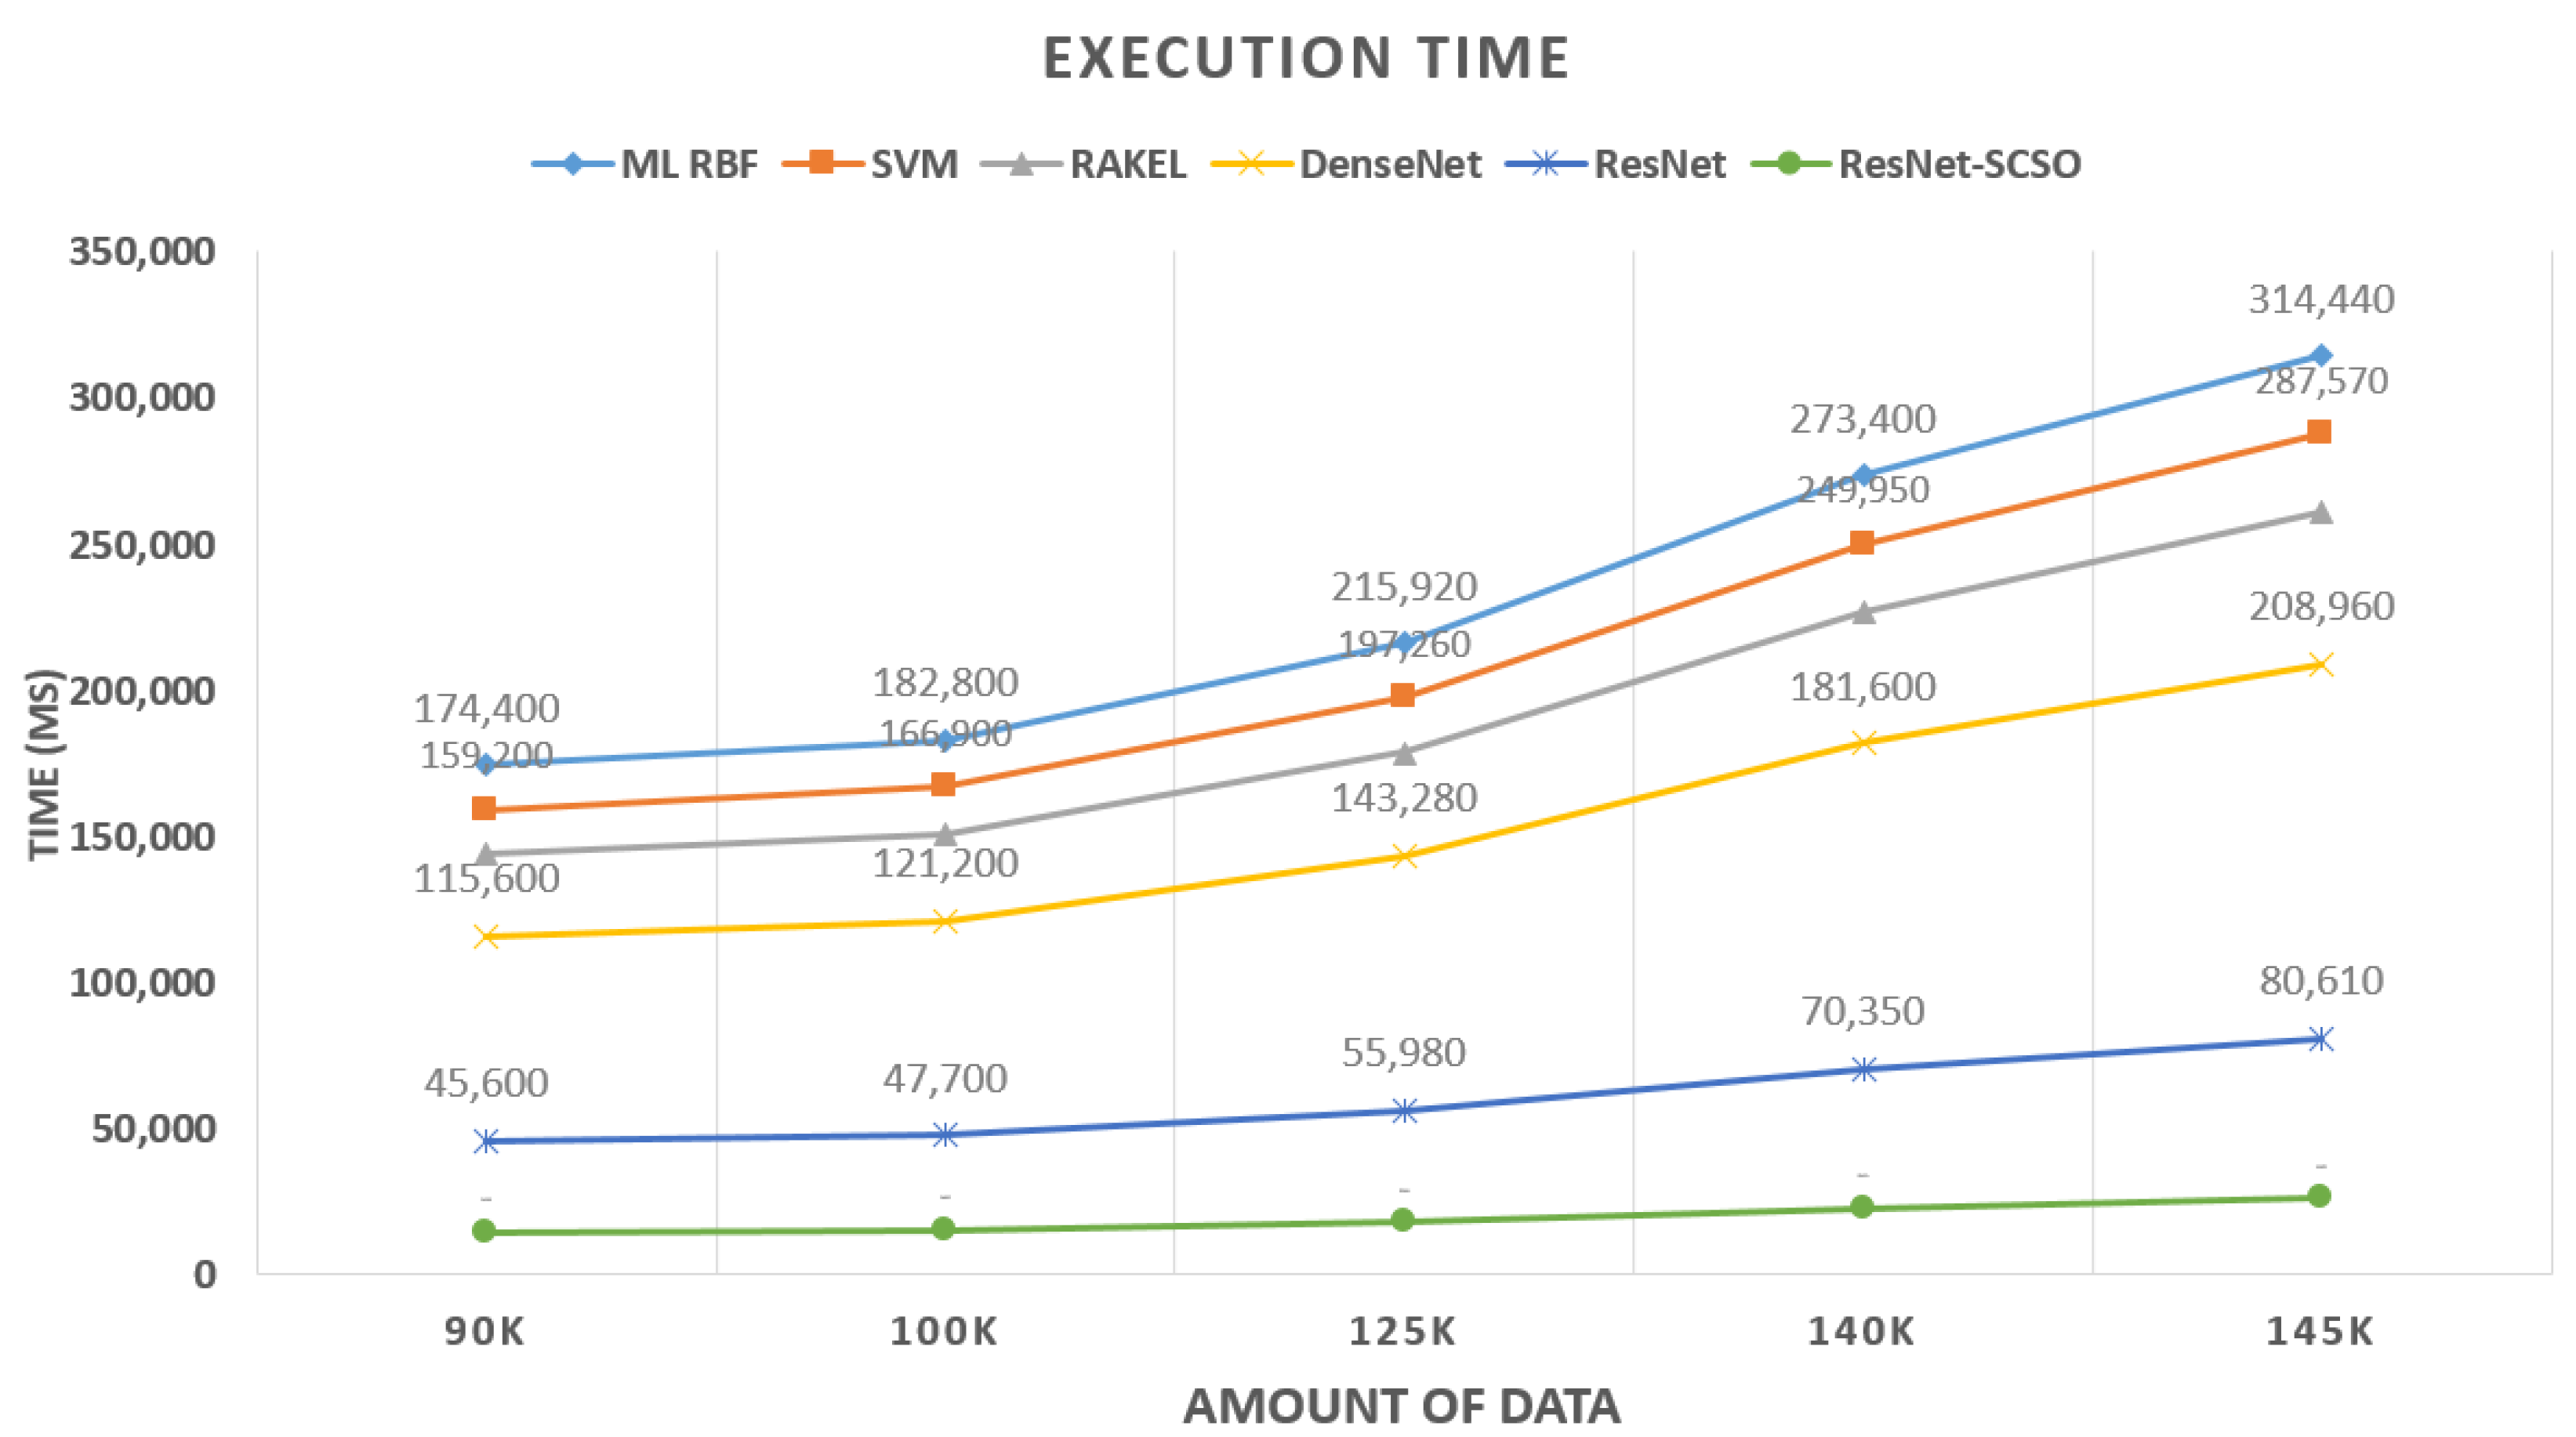
To assess the efficiency of the proposed model, we also evaluated the proposed framework based on the execution time and increase in the data as shown in
Figure 23. The optimized ResNet mechanism has the lowest execution time compared to the other state-of-the-art models. In multi-labeling data, the original ResNet time is increasing more than ResNet-SCSO.


 ,
, 


