1. Introduction
Risk management and the selection of protective schemes for critical infrastructure operators, especially in Electrical Power and Energy Systems (EPES), are challenging tasks. Vulnerabilities play a central role in the security ecosystem of an organization, as they relate to the assets, the threats, the countermeasures and the cost–benefit analysis. Vulnerabilities may belong to different classes, depending on the nature of the assets they affect. The identification and assessment of vulnerabilities is a key aspect of risk management. While repositories of vulnerabilities currently exist, they are not easily oriented towards critical infrastructures, and the level of granularity may not support a flexible risk assessment. Furthermore, there is a need for integrated environments, allowing vulnerability identification, association with assets and assessment, with capabilities of profiling, visualization, and analysis.
In this work, we have identified an extensive set of vulnerabilities, with a focus on the electrical sector, considering systematized knowledge as reflected upon relevant standards, acquired experience, and active inspection. The objective of this work is to identify, in a structured process, a set of vulnerabilities relevant to EPES infrastructure out of an extensive and complex set of available vulnerabilities and how this set can be linked with assets of specific classes. A solid double-mapping scheme of associating vulnerabilities with asset(s) has been designed, allowing for the semi-automatic characterization of vulnerabilities into three classes, namely, Physical, Cyber and Human/Organizational. In this respect, we wanted to equip energy operators with an integrated vulnerability identification and assessment tool designed to provide historized assessments and support interoperability scenarios. Furthermore, we aimed to provide some deeper analysis and insights on the vulnerability types and the assessment scorings.
Having the above as the basis, we also describe the design and development of a web-based, extensible tool called Cybersecurity Vulnerability Identification and Assessment Tool (CVIAT). CVIAT consolidates a set of vulnerabilities for critical infrastructures and allows for assessment, employing the Common Vulnerability Scoring System (CVSS) methodology [
1]. The assessment has been applied in the RTD project to retrieve the first set of results, which have been statistically processed for insights into the vulnerability types and assessment scorings. These assessments have served as a high-value dataset, which has been further analysed to better understand correlations and associations between assessment criteria and selections of the operators.
In addition, the information elements employed in the CVIAT tool have been modelled using the open, JSON-based, Structured Threat Information eXpression (STIX) format [
2] to serve as reusable and interoperable Cyber Threat Intelligence (CTI) information.
The added value of the work can be summarized as follows:
- -
Provision of a consolidated and extensible pool of assets and vulnerabilities tailored to energy-related critical infrastructures.
- -
Seamless integration of the pool of assets and vulnerabilities, offering vulnerability identification and assessment functionalities combined with visual, analytical, and historization capabilities.
- -
Contribution to collaborative and interoperable scenarios through the modelling and employment of the STIX language so that assets, vulnerabilities, and assessment results can be understood and used as CTI information.
- -
Transformation of the assessments into a dataset and consequent processing, employing correlation analysis and association rule learning, to better understand and extract insights on the assessments of the operators.
The structure of the document is as follows: In
Section 2, we discuss the positioning of the current work in the broad area of risk assessment and the connection with similar efforts.
Section 3 describes the methodological aspects, including the sources of the identified vulnerabilities, the assessment methodology, and the dataset-processing framework.
Section 4 discusses the design of the implemented tool, CVIAT, with a focus on the scalable architecture, the extensible data model, and the STIX-based modelling.
Section 5 describes the results of the vulnerability identification and assessment, including the findings of the statistical processing and analysis. Finally,
Section 6 discusses some concluding remarks and the direction of future work.
2. Positioning and State of the Art
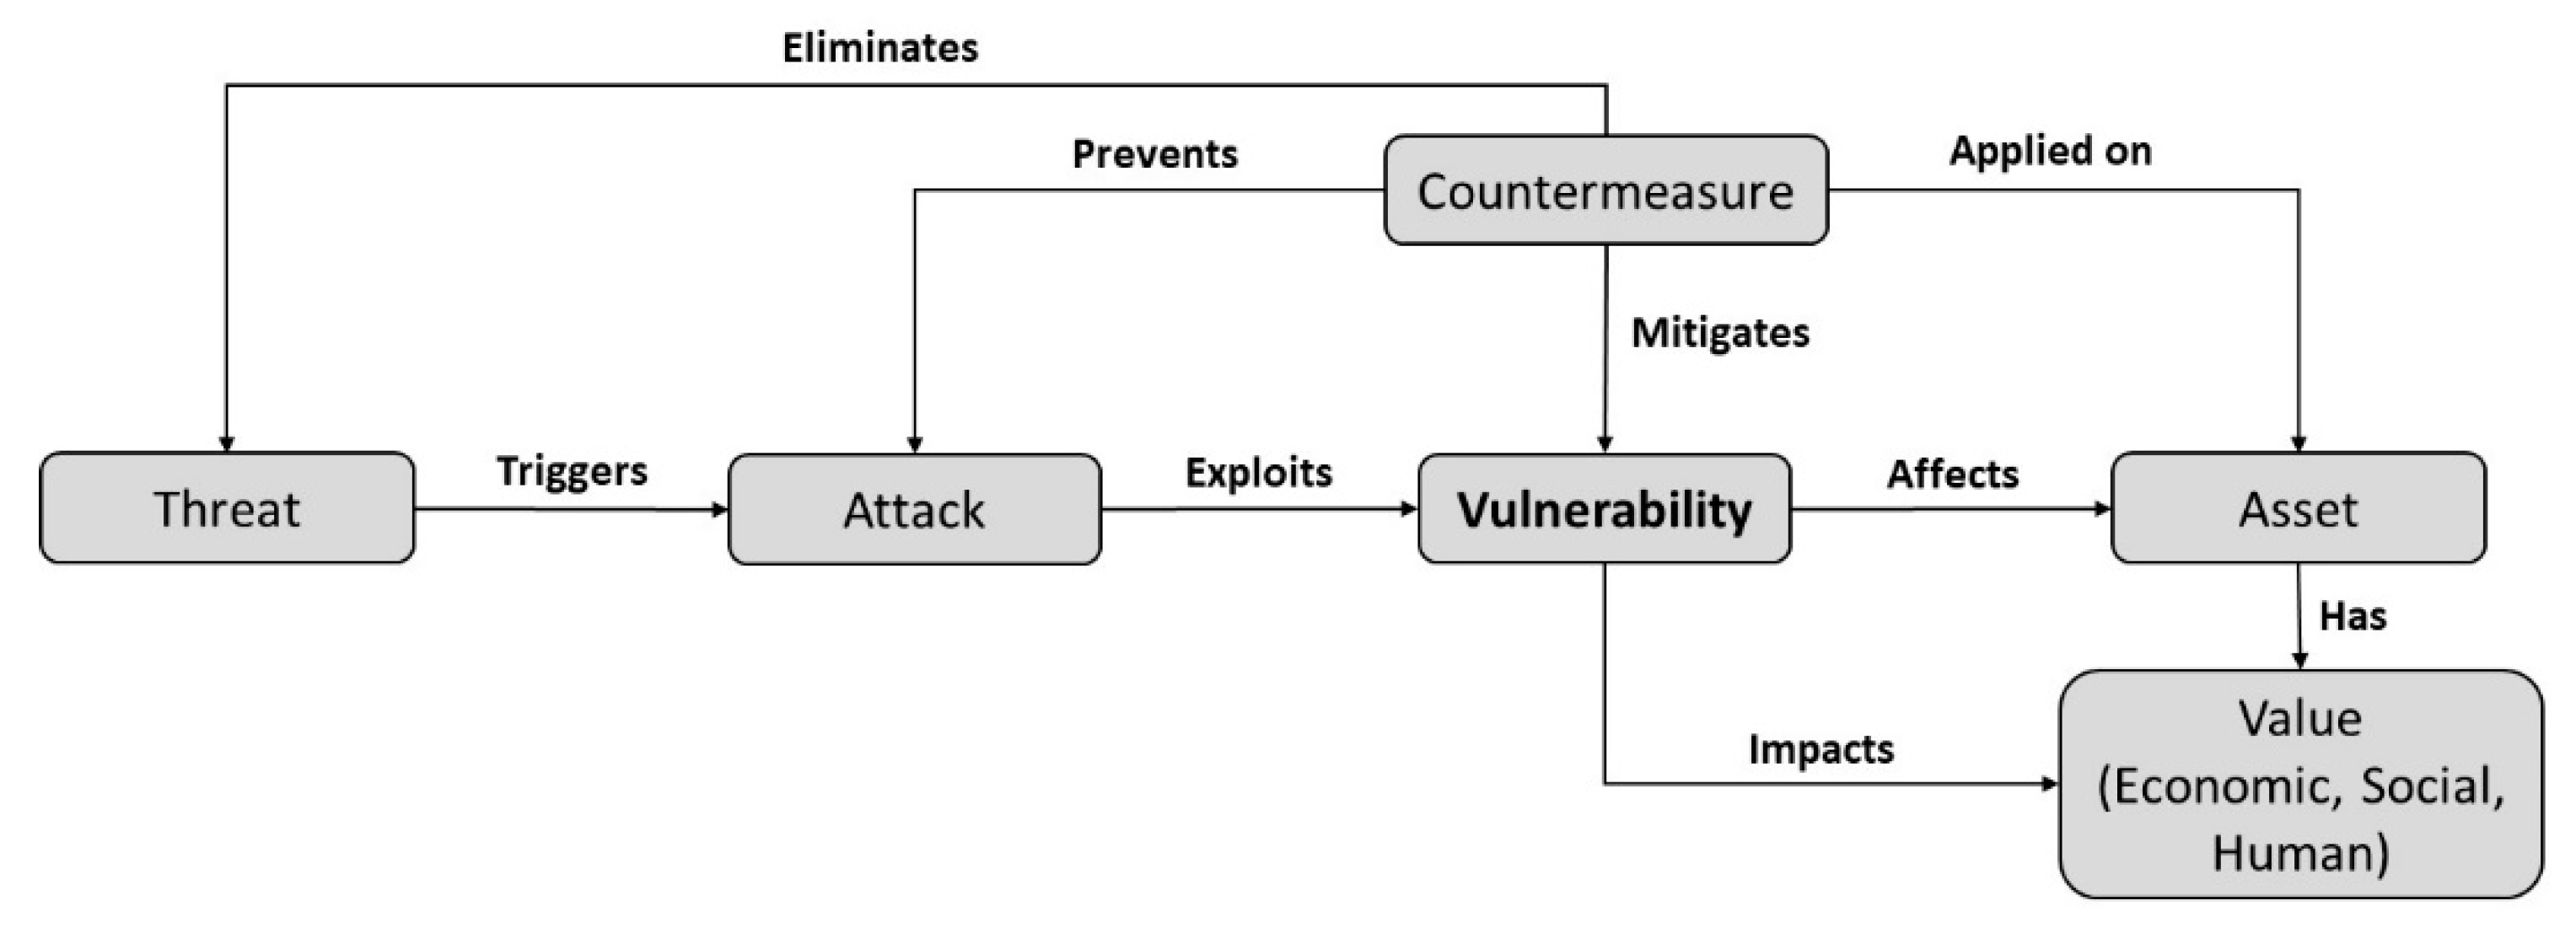
Confidentiality, integrity, and availability, also known as the CIA triad, are the core information security properties of communication networks, services, and data. A security threat may negatively impact those properties by carrying out an attack, which aims to exploit vulnerabilities potentially present in the underlying assets. As a consequence, the CIA properties are diminished, affecting the economic, social, or human value of the affected assets. To fight against or mitigate vulnerabilities, countermeasures are implemented on assets to prevent an attack and eliminate potential threats. The previous relationships, depicted in
Figure 1, give vulnerabilities a central role in information security and, subsequently, in the risk-management process.
According to ISO/IEC 27005 [
3], determining what can happen to cause a potential loss and assessing it in terms of applied controls and CIA consequences facilitates risk identification and assessment, which are two core activities of risk management. Risk management also involves risk evaluation, which compares the level of assessed risk with risk acceptance criteria and risk treatment, which focuses on mechanisms to modify/reduce, retain, avoid or share the risks. Efficient risk management calls for insight into the infrastructure and the identification/selection of relevant vulnerabilities (respecting existing asset categorizations), along with a mechanism to assess them, as well as an integrated environment, allowing for profiling and historized versions.
The identification of vulnerabilities has attracted research, analytical, and standardization work, including the National Vulnerability Database (NVD) and Common Vulnerabilities and Exposures (CVE), which details vulnerabilities found in a wide range of software and hardware [
4].
The Common Vulnerabilities and Exposures—CVE list is maintained by MITRE and provides a reference method for publicly known information-security vulnerabilities and exposures [
4]. It defines CVE Identifiers (also called “CVE names”, “CVE numbers”, “CVE-IDs”, and “CVEs”) as unique, common identifiers, for publicly known information-security vulnerabilities, in publicly released software packages. CVEs are related to software that has been publicly released. However, custom-built software that is not distributed would generally not be given a CVE. Additionally, services are not assigned CVEs for vulnerabilities found in the service, unless the issue exists in an underlying software product that is publicly distributed.
The National Vulnerability Database—NVD [
5,
6], is a U.S. government repository of standards-based vulnerability management data, represented using the Security Content Automation Protocol (SCAP). These data enable the automation of vulnerability management, security measurement, and compliance. NVD includes databases of security checklists, security-related software flaws, misconfigurations, product names, and impact metrics. SCAP provides the means to collect and assess the state of devices, supporting vulnerability checking, patch installation verification, security configuration checking, and assessment for indicators of compromise [
7].
The ISO/IEC 27005 [-] is prepared by the Technical Committee of ISO/IEC JTC 1. The standard focuses on information security, providing guidelines for risk management. Furthermore, it includes, in its Annex D—Vulnerabilities and methods for vulnerability assessment, a set of vulnerabilities organized in six areas: hardware, software, network, personnel, site, and organization.
The identification and assessment of vulnerabilities within specific scopes, and especially the critical infrastructures, present challenges. Vulnerabilities have been explored and assessed in critical infrastructure systems based on topological properties, including degree, betweenness, average path length, network diameter, and clustering coefficients [
8]. The characteristics of critical infrastructures, including the heterogeneity of components and the dimensionality of connectivity, have been associated with vulnerability and risk analysis [
9].
Vulnerability assessment methodologies, which act as a framework for quantifying the impact of vulnerabilities, include the Common Vulnerability Scoring System (CVSS) [
1] and the operationally critical threat, asset, and vulnerability evaluation (OCTAVE) [
10]. CVSS is an open-ranking framework used for characterizing the severity of software vulnerabilities. The OCTAVE methodology has been applied to assess the security risks of smart homes and identify critical information assets associated with threats [
11]. Algorithms for vulnerability analysis have considered the operational capability, the intent, the activity, and the overall operational environment [
12].
The identification of vulnerabilities typically leads to mitigation techniques. Mapping between vulnerabilities and mitigation techniques can take place manually or in a (semi) automatic way, e.g., through the association of vulnerabilities (from CVE list) with MITRE ATT&CK mitigation techniques for malicious tactics, using textual descriptions and natural language processing [
13]. The cybersecurity standard IEC 62443 provides instructions for designing industrial system cyber defence frameworks to ensure operational safety [
14]. Based on this standard (IEC 62443), a framework has been proposed [
15] to verify the conformity of the objects with security requirements, mainly in the context of IoT Industrial networks.
To enhance their security capabilities, organizations need to collaborate with peers or other entities. One of the ways to achieve this is through the extraction and sharing of structured CTI (Cyber Threat Intelligence) information. STIX [
2], developed by MITRE and currently maintained by the Organization for the Advancement of Structured Information Standards (OASIS), is a standardized language and format. It models CTI information in a human-understandable way, enabling the exchange and sharing of intelligence information between different organizations and tools. It is a machine-readable, semi-structured, JSON-based format for structuring and exchanging CTI information using STIX Domain and Relationship Objects (SDOs and SROs, respectively). CTI information has been assessed in terms of quality at attribute, object, and report levels [
16]. Contextualized filtering of CTI info for actionable threat information has been elaborated, measuring the equivalence (i.e., estimating the similarity above a threshold) between the context of the shared threat information and the organizational context [
17].
In terms of tools, the electricity subsector cybersecurity Risk Management Process (RMP) guidelines [
18] and Cybersecurity Risk Management Framework (CRMF) [
19] address an organization’s risk posture evaluation and situational awareness. The Cyber Security Evaluation Tool (CSET), version v11.5, is a desktop software tool for asset owners and operators to evaluate industrial control system (ICS) and information technology (IT) network security practices [
20].
At the same time, as machine-learning technologies swiftly advance, their application finds their way into security-related areas. In this direction, datasets from intrusion detection systems (IDS) can be explored, through machine learning, to proactively indicate signals of potentially upcoming or already ongoing attacks [
21]. The work converts a classic IDS dataset into a time-series format and uses predictive models to forecast the future (forthcoming malign packets).
According to the previous analysis, although there is an increasing pool of vulnerabilities offered for various thematic areas, there is still room for a consolidated and manageable set of vulnerabilities tailored for EPES critical infrastructure, combined with assessment functionalities and analytical, visual, and historization capabilities, seamlessly integrated with a pool of EPES critical assets. Furthermore, vulnerability assessments can be transformed into valuable CTI information, enabling collaboration and interoperability scenarios. In addition, transforming the assessments into datasets and processing them using statistical tools can offer insight into the ways the vulnerabilities are perceived, connected, and assessed. Such interoperability capabilities are largely missed or partially available in current tools.
3. Methodology
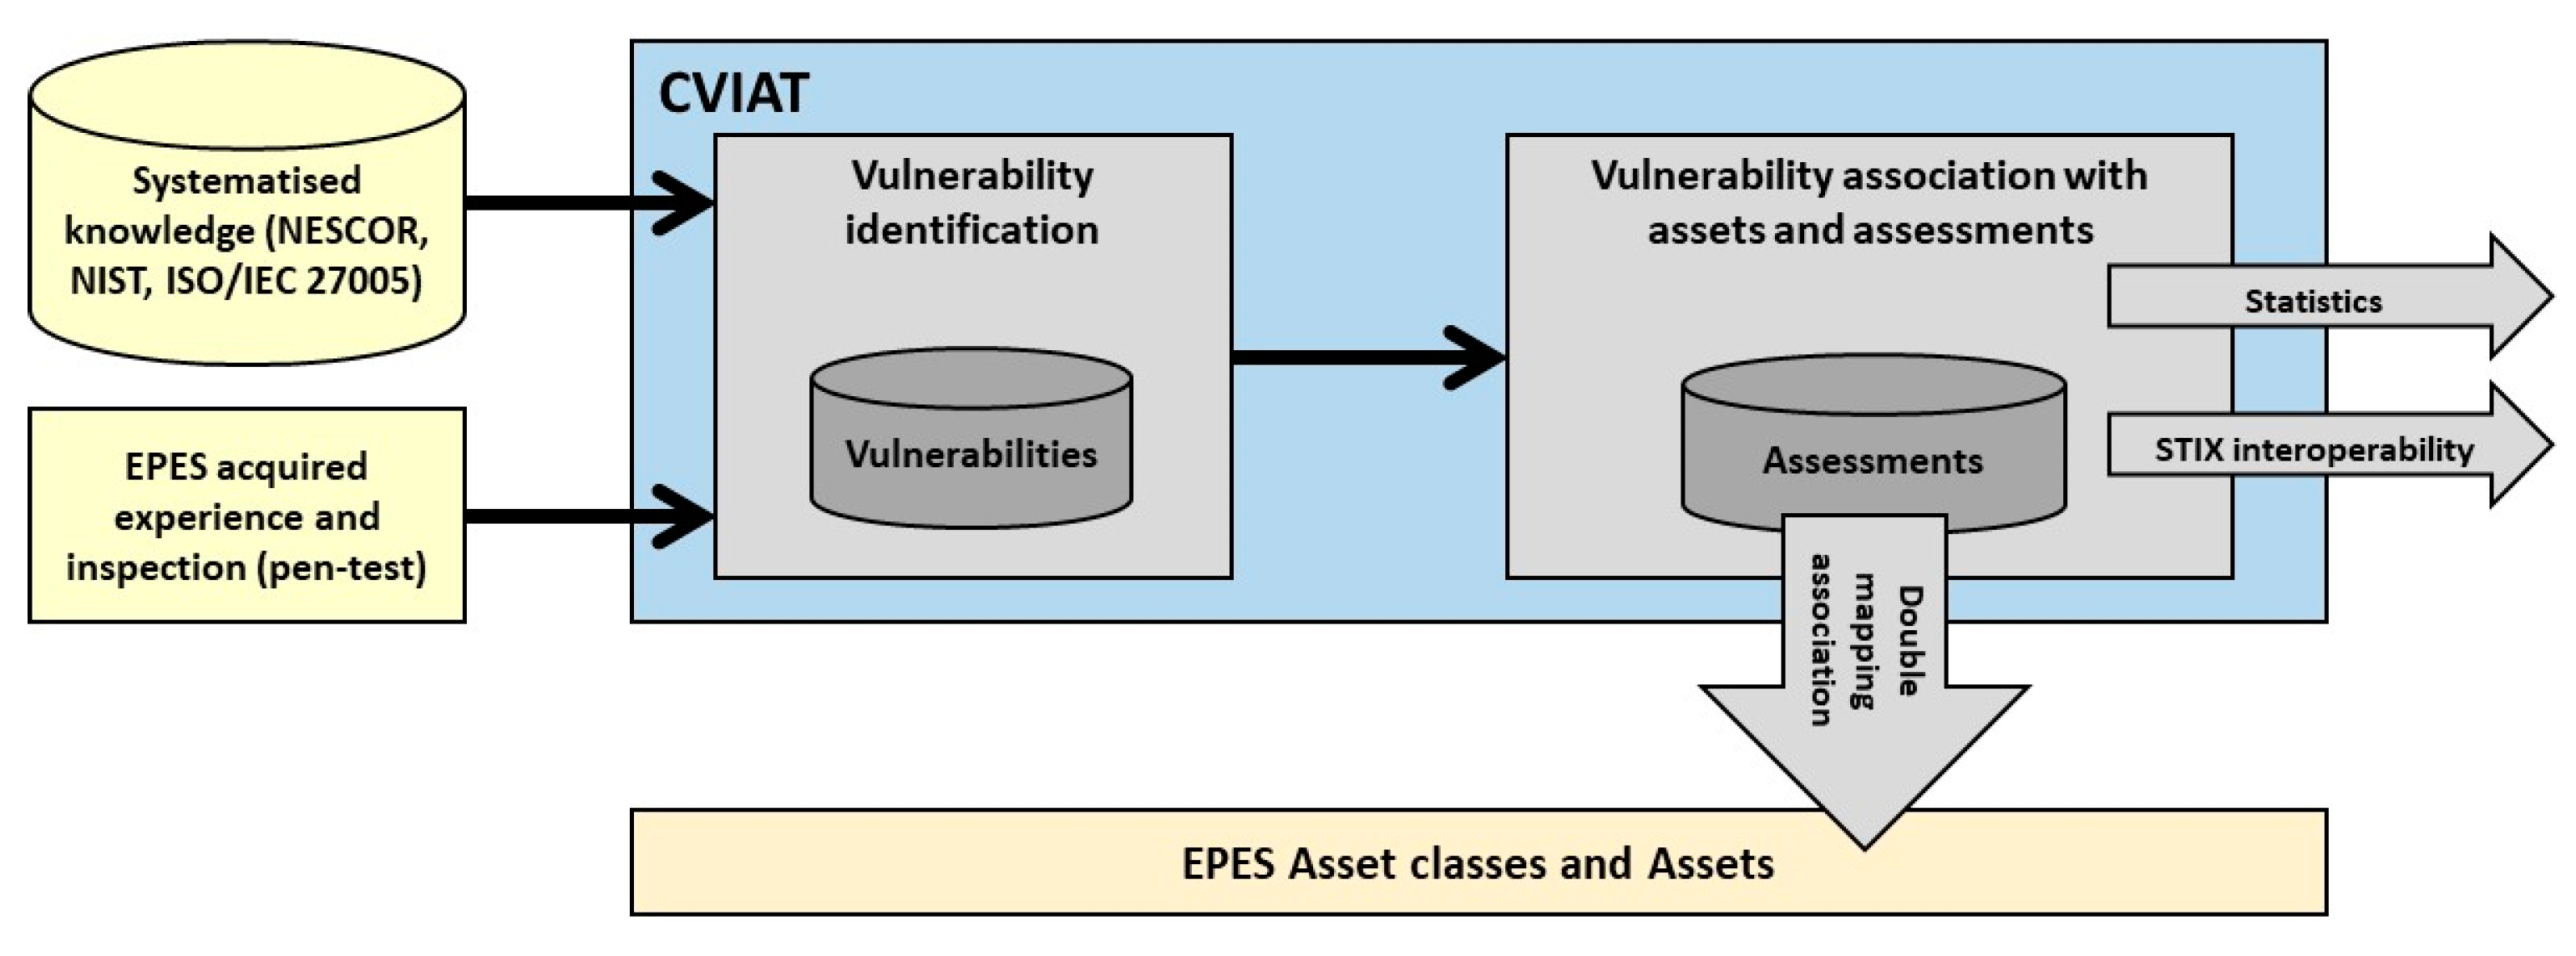
The methodological steps are depicted in
Figure 2. The first phase includes the identification of vulnerabilities potentially related to energy-critical infrastructures and their characterization into three types. The second phase includes the association of the vulnerabilities with asset classes and instances and their assessment, in terms of criticality, using the CVSS scoring. The information elements employed in the process, including the assessments, are modelled and exported using the interoperable STIX format.
In the third phase, the assessment results are statistically processed to sketch an approximation of the vulnerability profile of the organization while correlation and association rules are applied to the CVSS fields to extract insight in the assessment approach.
3.1. Vulnerability Identification
To produce a representative domain of vulnerabilities, different sources can be explored:
- -
Systematized knowledge in the form of standards relevant to energy sector security, which identify vulnerabilities.
- -
Acquired experience based on existing knowledge of the energy organization operator.
- -
Inspection involving active analysis of the energy infrastructure to discover vulnerabilities, e.g., through penetration testing.
The first considers an external source, as opposed to the other two, which exploit internal knowledge or experience of the energy organization. Additionally, the first two sources, namely, systematized knowledge and acquired experience, are static in the sense that vulnerabilities are determined through a stationary process. On the contrary, the vulnerabilities determined through inspection presuppose an active investigation, making the third source a dynamic one.
In the following paragraphs, we focus on the first category, which is applicable to all infrastructures and has been used for the initialization of the platform. Three contributing sources of standards are identified and used: the National Electric Sector Cybersecurity Organization Resource (NESCOR), the National Institute of Standards and Technology (NIST), and the ISO/IEC 27005.
NESCOR has documented in [
22] a total of 127 failure scenarios for the electric sector. They are organized according to the functional domains discussed in [
23], namely, Advanced Metering Infrastructure (AMI); Distributed Energy Resources (DER); Wide Area Monitoring, Protection and Control (WAMPAC); Electric Transportation (ET); Demand Response (DR) and Distribution Grid Management (DGM); Generation (GEN); and Generic. The analysis of a failure scenario considers the relevant vulnerabilities, a description of the impact, as well as potential mitigations. NESCOR determined 82 common vulnerabilities, which, when considered in different contexts, can result in more than 250 unique vulnerabilities. To have a more generic approach, in our work, we have considered the 82 common vulnerabilities from NESCOR [
22].
NIST in [
24] presents four vulnerability classes that can impact the electric grid. The classes of potential vulnerabilities focus on (a) people, policy, and procedure, (b) platform software/firmware, (c) the platform, and (d) the network. Each of those classes comprises two additional levels of vulnerability classes. The common vulnerabilities of NESCOR, discussed before, are already linked with a NIST vulnerability class from [
24]. For the rest of the NIST vulnerability classes (i.e., those not associated with a NESCOR vulnerability) in [
24], we researched to find relevant vulnerabilities. In this regard, we considered two interlinked sources of vulnerabilities: (a) the Common Vulnerabilities and Exposures (CVE) Dictionary for publicly known vulnerabilities [
4] and (b) the National Vulnerability Database ([
5,
6]). In this respect, we have considered the NIST vulnerability classes from [
24]—relevant for the electric grid—and used them as pivots to identify vulnerabilities from MITRE and the national vulnerability DB of NIST that can be relevant for or fit in those classes.
3.2. Vulnerability Classification
Vulnerability assessment requires the association with assets, and, given their large numbers, as well as the potentially different categorization of assets and vulnerabilities, there is a need for a (semi-automatic) mapping between assets and vulnerabilities. Specifically, assets and vulnerabilities are grouped into asset and vulnerability classes, respectively, and we need to determine which vulnerability classes are relevant to the asset classes through a mapping. Such mapping must be flexible and configurable, as the initial asset categorizations can be standard-based or arbitrary, depending on the specificities of the infrastructure.
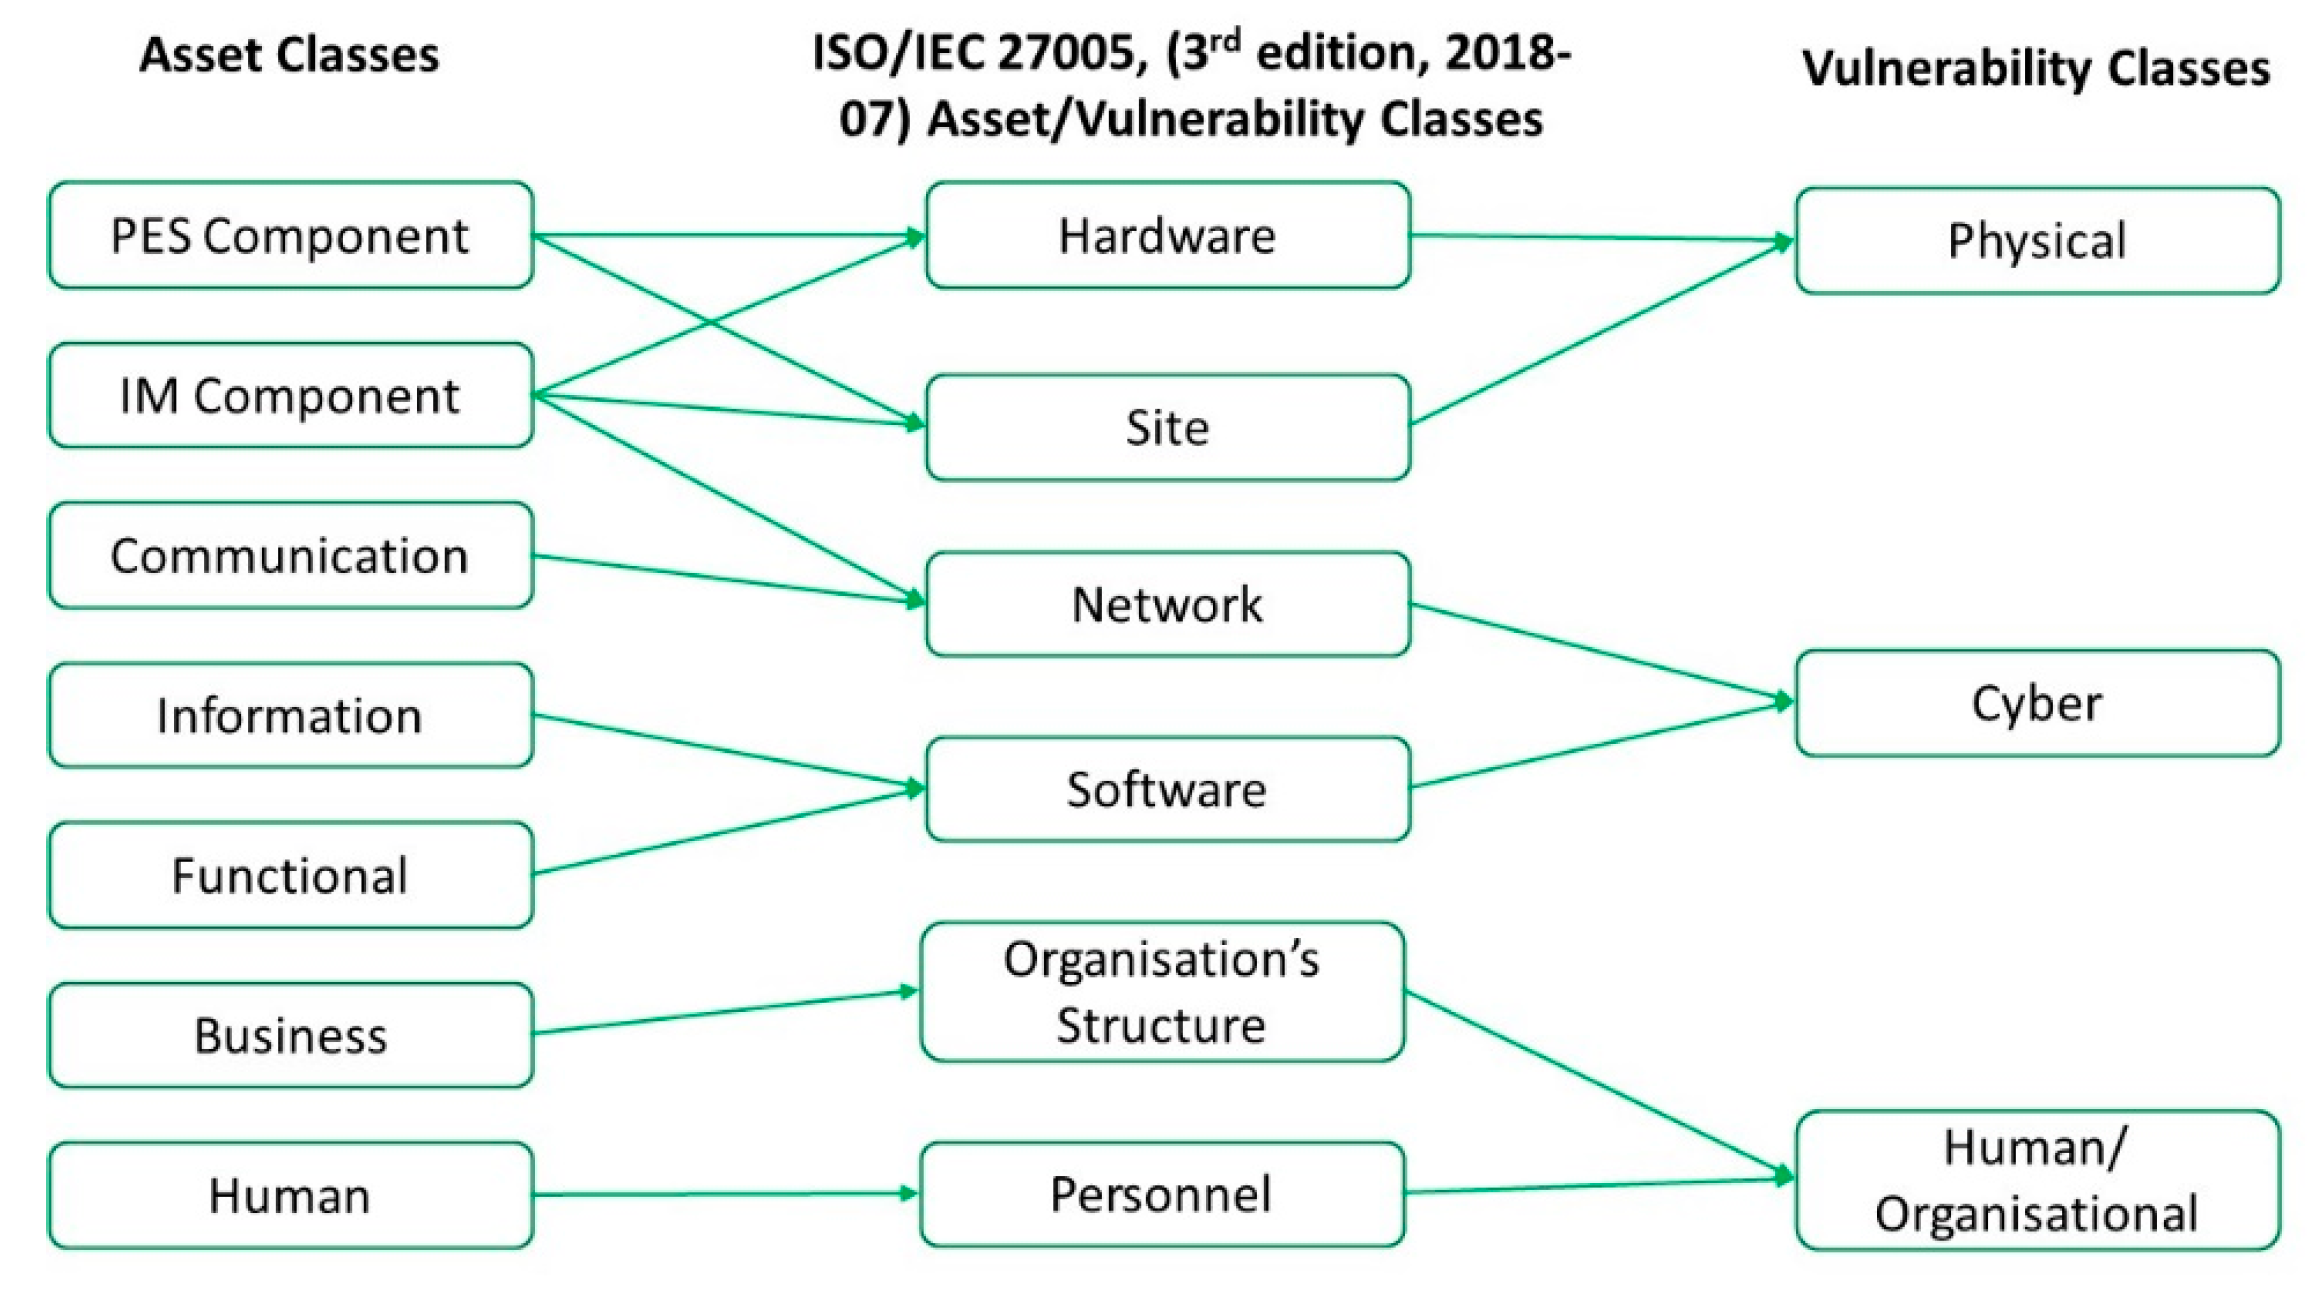
In terms of asset categorization, we have considered SGAM ([
25,
26]), which classifies EPES assets into Power and Energy Systems (PES) Components, IM Components, Communications, Information, Functional, Business and Human. At the same time, ISO/IEC 27005 [
3] proposes classifying the vulnerabilities according to the class of the affected asset into Hardware, Site, Network, Software, Organization Structure and Personnel. In this respect, an asset class corresponds to a vulnerability class and vice versa, according to [
3]. The vulnerabilities are grouped into three classes, namely, Physical, Cyber, and Human/Organizational.
The mapping between the assets and vulnerabilities can be achieved using an interconnector, the ISO/IEC 27005, which can enable double mapping between asset and vulnerability classes. This is depicted in
Figure 3, where the asset classes (depicted in the left column) are mapped to the ISO/IEC 27005 asset/vulnerability classes (middle column) and, subsequently, to the vulnerability classes (right column). The first mapping has been performed considering each of the asset types belonging to an asset class. For example, the PES Component class includes, among others, (a) the generators and (b) the EV fleet charging infrastructure. The former belongs to hardware, while the latter to site. This way, the PES Component class can be associated with both Hardware and Site. A similar analysis has been performed for the other asset classes. For the second mapping, both hardware and site correspond to the physical vulnerability class.
3.3. Vulnerability Assessment
The assessment of the identified vulnerabilities has been based on the Base metric group of the Common Vulnerability Scoring System (CVSS version 3.1) [
1]. CVSS is composed of three metric groups: Base, Temporal, and Environmental. The Base group consists of the Scope metric and two additional sets of metrics: the Exploitability metrics and the Impact metrics, and produces a score ranging from 0 to 10.
The Scope metric explores whether a vulnerability may have an impact on resources or components different from those that are vulnerable. The exploitability metrics capture how easily a vulnerability can be exploited. It is expressed through the attack vector (the context by which vulnerability exploitation is possible), the attack complexity (the conditions beyond the attacker’s control that must exist to exploit the vulnerability), the required privileges, and the user interaction (separate user, other than the attacker, involvement is required).
The Impact metrics reflect the direct consequence of a successful exploit and represent the consequence to the related asset (impacted component). They include the dimensions of confidentiality (unauthorized access), integrity (accuracy and consistency of data), and availability (access when needed) of the information.
The Base group is also accompanied by (a) the Temporal metric group, which refers to “the characteristics of a vulnerability that change over time”, and (b) the Environmental metric group, which refers to “the characteristics of a vulnerability that are unique to a use’s environment”. The Temporal and Environmental group rankings can modify the score of the Base metric group if needed. The exact formulas and parameters for the Base Score Calculation can be found in [
1].
3.4. Analysis Methodology
Vulnerability assessments have formulated a dataset, which has been analysed using statistical processing, as well as correlation analysis and association rule learning. Correlation analysis determines the degree of association between two nominal variables—in our case, the CVSS metrics of the assessed vulnerabilities. Association rule learning is a rule-based machine-learning method for discovering relations between variables in large databases, enabling, in this manner, educated, data-driven decisions.
To examine the association between two or more variables, we employ Cramer’s V [
27], which measures association for nominal variables. It ranges from 0 to 1, where 0 indicates no association, while 1 indicates a perfect association. Cramer’s V is based on the chi-squared statistic and considers the sample size (
n) and the number of categories of each variable. Mathematically, Cramer’s V can be expressed as
where
is the chi-squared statistic,
n is the sample size,
k is the number of categories of one variable, and
r is the number of categories of the other variable. The use of Cramer’s V in correlation analysis provides a quantitative tool to investigate the intercorrelation of discrete variables.
Association rule learning is a machine-learning technique that uses mathematical measures to discover relationships between variables in large datasets. The technique involves finding frequent item sets in a dataset and then generating rules that indicate the likelihood of one itemset leading to another. The support and confidence measures are commonly used in association rule learning to evaluate the interestingness of rules.
Mathematically, support (supp) is defined as the proportion of transactions in the dataset that contains a given itemset
X, as shown in the equation below:
Confidence (conf) is defined as the conditional probability of the consequent itemset
Y given the antecedent itemset
X, as shown in the equation below:
Association rule-learning algorithms, such as Apriori [
28] and FP-Growth [
29], use these measures to generate rules that meet certain thresholds of support and confidence. For example, a rule with a support of 0.5 and a confidence of 0.8 indicates that the consequent itemset is present in 80% of transactions that contain the antecedent itemset and that the antecedent itemset is present in 50% of all transactions.
4. Cybersecurity Vulnerability Identification and Assessment Tool—CVIAT
As a first result of our methodology, the CVIAT tool has been designed and implemented. In this section, we present the design, the data, the model, and the STIX-based interoperability feature.
4.1. Architecture
CVIAT supports (a) the creation of assets relevant for energy operators, selected from the pool of asset classes; (b) the correlation of assets with vulnerabilities, taken from the pool of available and EPES-relevant vulnerabilities; (c) the interactive scoring of vulnerabilities, together with historical preservation of the evolution of the scores, through successive assessments; and (d) the logical segregation of customer data, so that assets, vulnerabilities, and respective scores are made available only to the users of the specific energy operator.
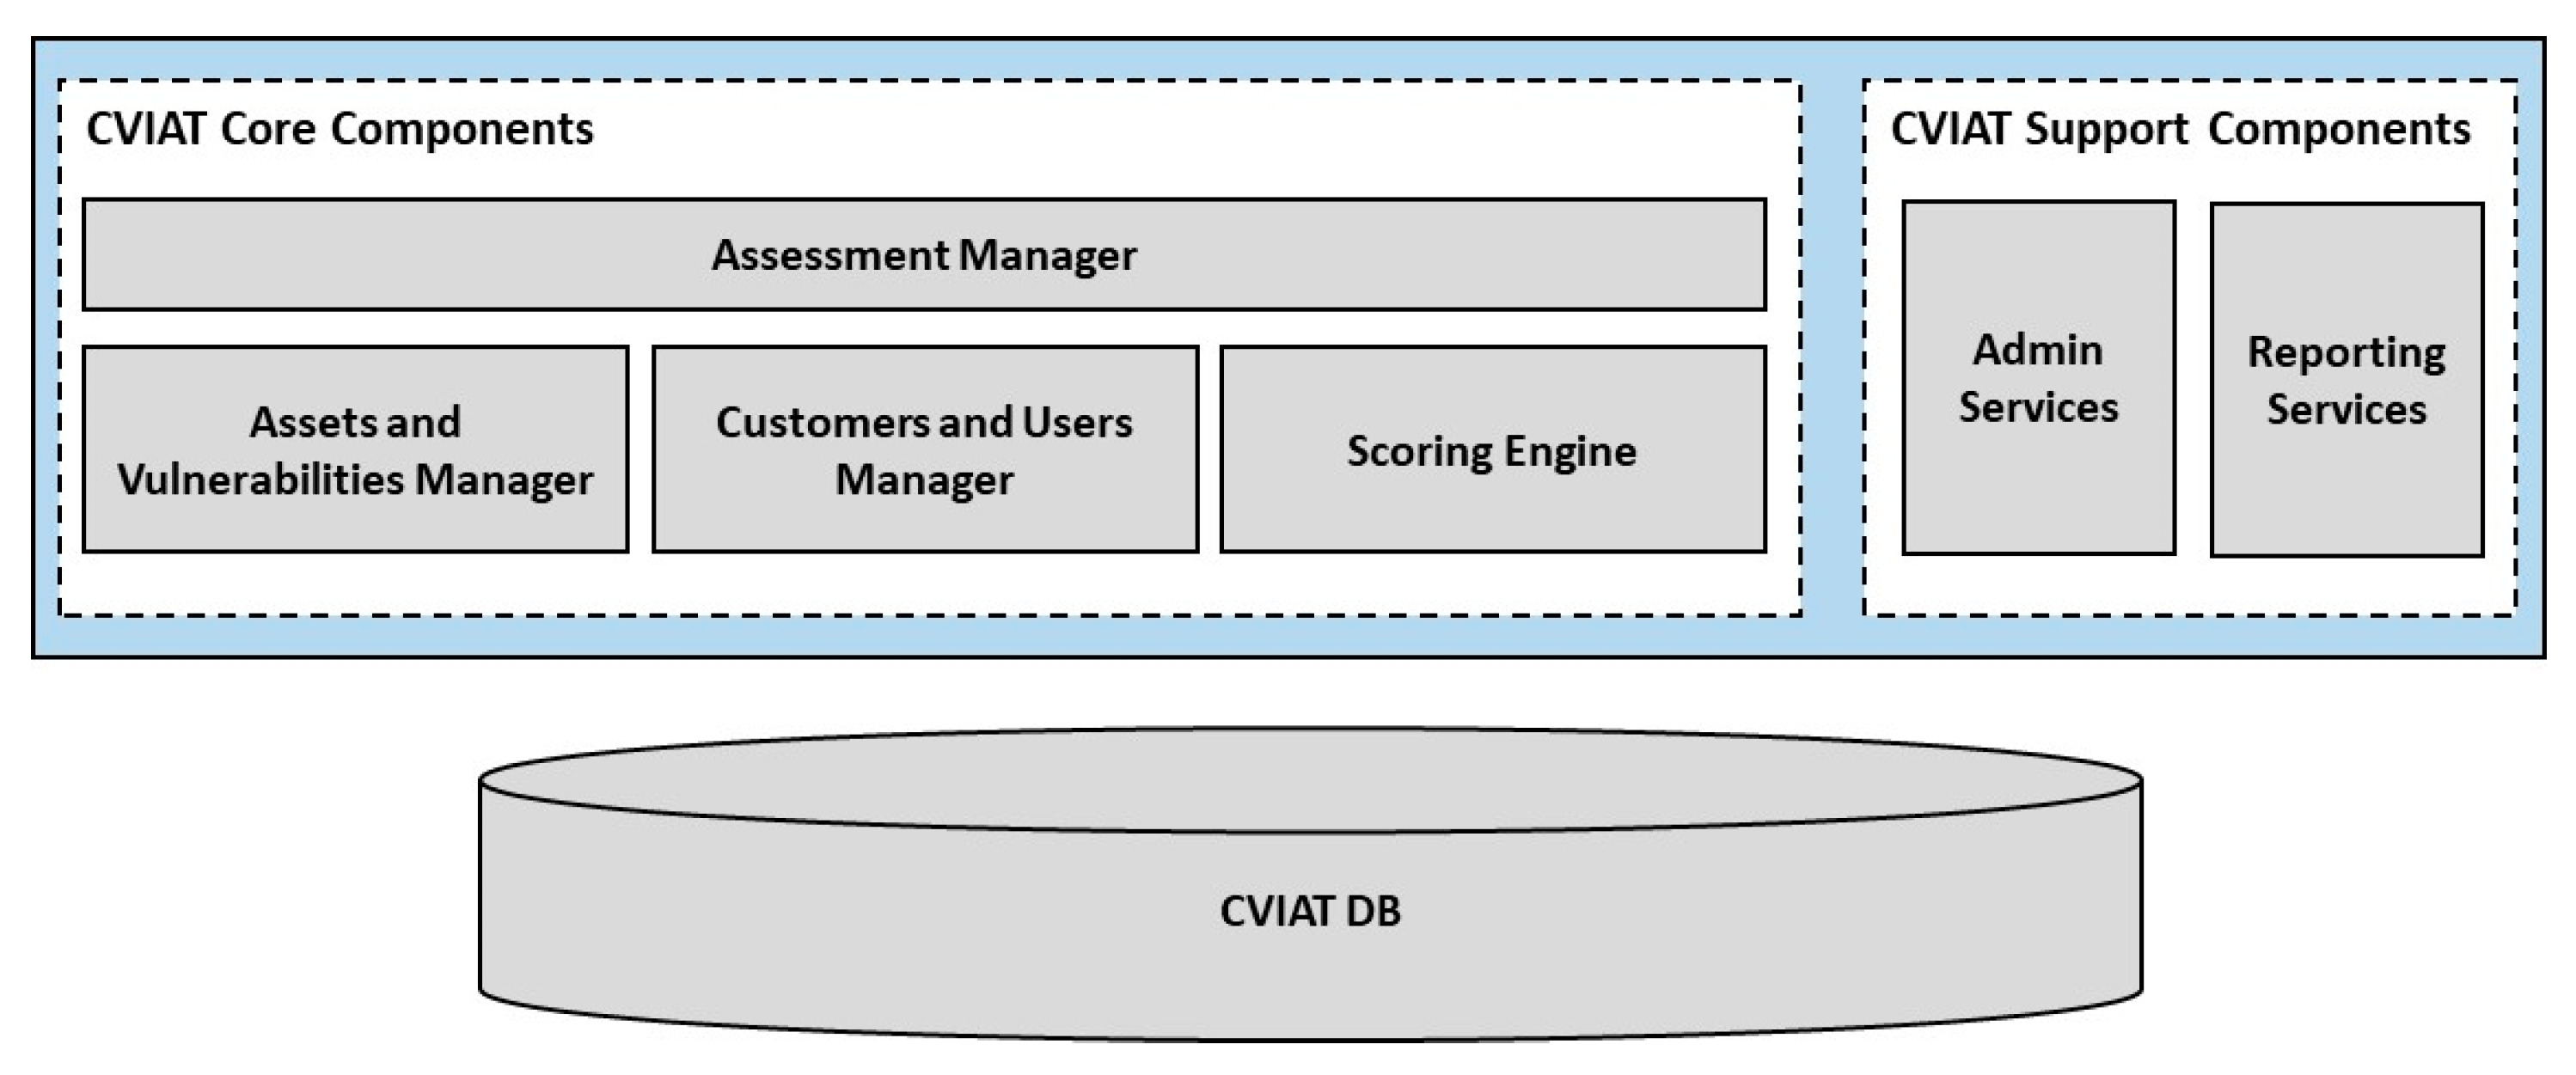
It is designed in a modular manner, consisting of components grouped in two functional areas, namely Core Services and Support Services, as well as a database. These components are responsible for materializing the business logic, while the database provides the structural organization of the data. The overall architecture of CVIAT is depicted in
Figure 4 and consists of the following components:
Assessment Manager, in charge of the workflow required for performing an assessment. It links together an asset, a vulnerability, and the respective score, implementing necessary controls.
Assets and Vulnerabilities Manager, responsible for maintaining Assets and Vulnerabilities, both as part of the available pool offered by CVIAT for selection, as well as part of the collection of Assets and Vulnerabilities pertaining to specific energy operators.
Customer and Users Manager, which undertakes the registration and management of energy operators (organization) and their respective users.
Scoring Engine, which calculates the scoring of a vulnerability according to provided criteria, utilizing the base metrics of CVSS version 3.1 [
1]. However, the Scoring Engine is flexible enough to accommodate additional scoring methodologies.
Admin Service, which takes care of any administrative related functionality, like controlling configuration parameters, importing/exporting data, or performing parametrization of the application.
Reporting Service, responsible for creating reports required for the end-user. It combines the necessary data and produces reports for end-users.
Database (DB), which provides the structural organization of the information.
4.2. Data Model
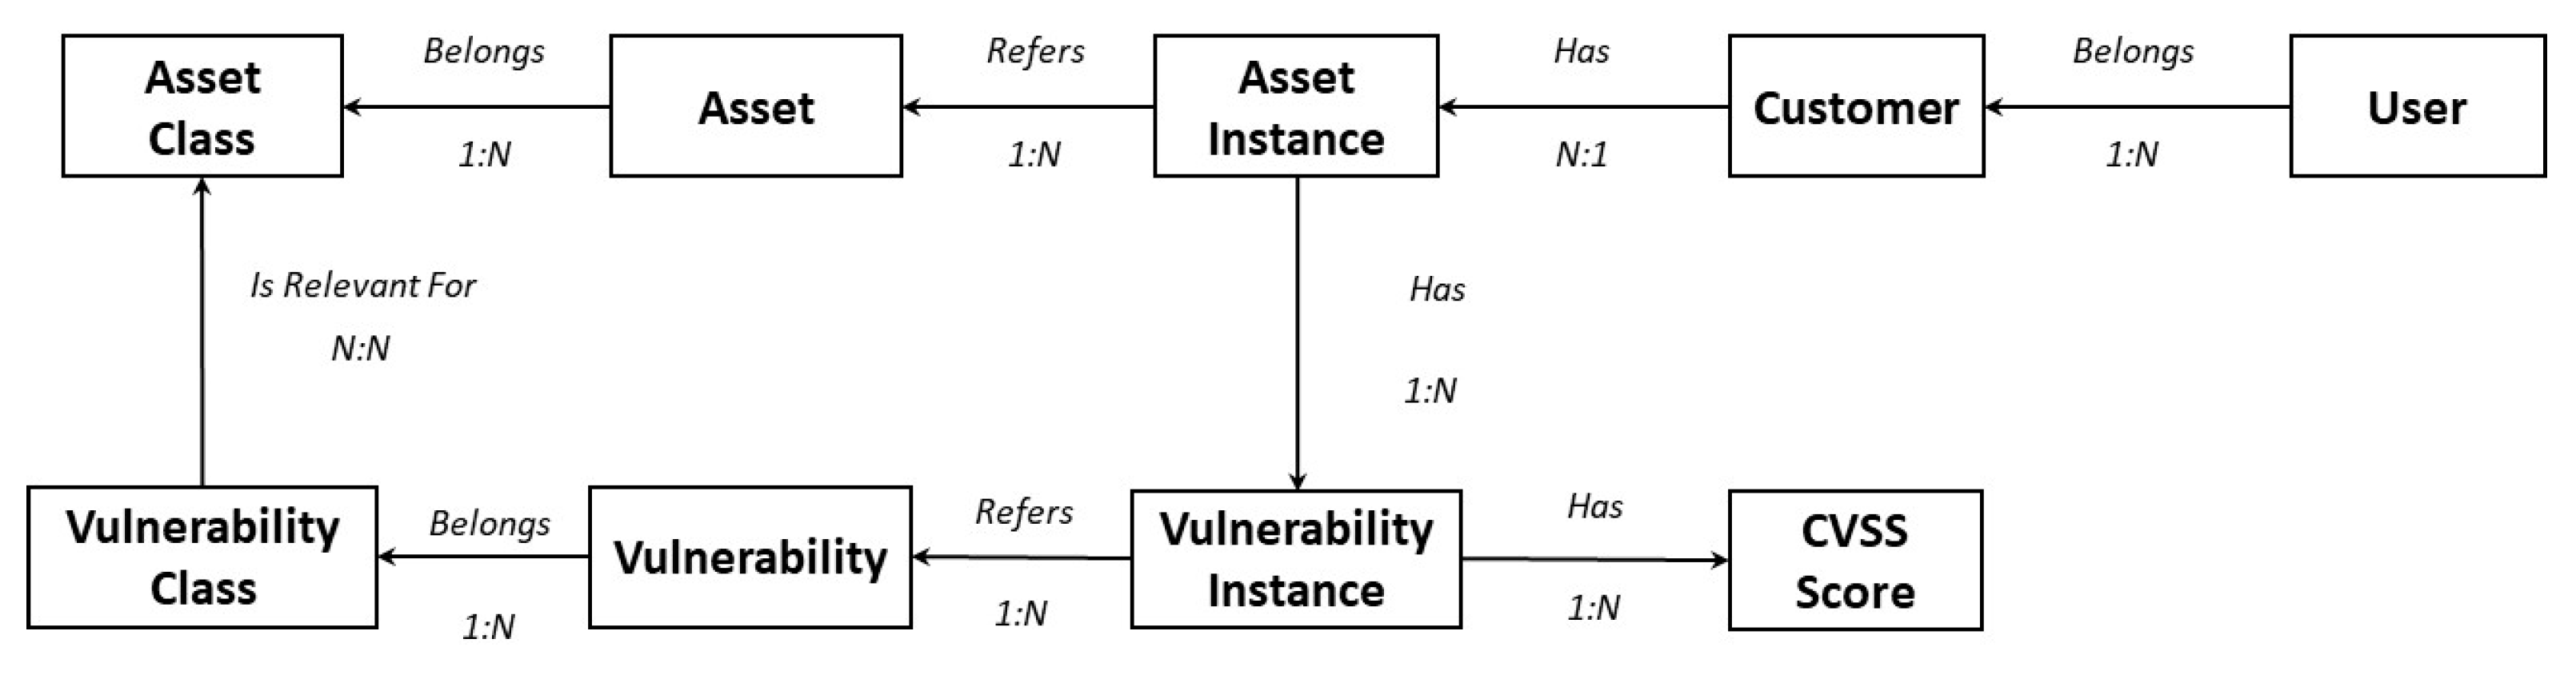
The data model is depicted in
Figure 5 as an entity relationship diagram. The boxes represent the basic data elements considered in CVIAT, while the arrows represent the relationship—indicated above the arrow—between the data elements, with the cardinality of the relationship mentioned below the arrows.
The Asset Class data element represents the Asset Categories, namely, PES Component, IM Component, Communication, Information, Functional, Business, and Human. The Asset data element represents the different assets that can be considered. It serves as a repository of possible assets that can be instantiated (in the sense of being present) in the operational environment of a specific energy operator.
The Asset Instance data element is used to represent all the actual assets (instances of the Asset data element) that have been identified as relevant for the vulnerability assessment process and for which at least one vulnerability is present. A record of the Asset Instance is associated with one or more records of the Vulnerability Instance data element. Additionally, a record of the Asset Instance is associated with only one record from the Customer data element, indicating the owner of the specific Asset Instance record.
Similarly, the Vulnerability Class represents the Vulnerability Classes, namely, Physical, Cyber and Human/Organizational. The Vulnerability data element represents the different vulnerabilities that can be considered. It serves as a repository of possible vulnerabilities that can be instantiated (in the sense of recognized as being present) in the operational environment of a specific energy operator.
The Vulnerability Instance data element represents the actual vulnerabilities identified as being present in the operational environment—as part of (in the sense of affecting) a specific Asset Instance. A record from the Vulnerability Instance data element might be associated with one or more records from the Score data element, each one referring to a different assessment in time. Additionally, each record of the Vulnerability Instance data element is associated with only one record from the Asset Instance data element, indicating, in this way, the specific asset within the operational environment that is affected by the specific Vulnerability Instance.
The Score data element is used to store the CVSS score of a vulnerability. Considering that a vulnerability can be assessed in different time periods, many scores can be present for each record of the Vulnerability Instance data element. In this manner, the history of assessments is maintained, while the latest score in time represents the current score.
The Customer data element is used to represent the different energy providers (organizations) that are registered in the tool. A Customer can have many different Asset Instances, which are part of its operational environment, as well as many different Users, which are authorized to handle the data of the specific Customer. Additionally, the User data element maintains information about the specific Users of the tool. A record of the User data element can be associated with only one record of the Customer data element.
4.3. CTI Interoperability
STIX semantic models facilitate informed decisions on behalf of operators in the context of collaborative scenarios for cybersecurity [
30]. To support such collaboration and interoperability features, we adapted and extended STIX vocabulary to model and represent the main information entities of CVIAT, namely, Organizations, Assets, and assessed Vulnerabilities (which correspond, respectively, to the Customer, Asset Instance, and Vulnerability Instance data elements, as discussed in
Section 4.2) as CTI information.
More particularly, the Organization (Customer data element) is represented by the Identity STIX Domain Object (SDO), while for the respective assets (Asset Instance data element) of an Organization, we have used the Infrastructure SDO. Within the Infrastructure SDO, we also captured the relevant asset class (namely, the PES Component, IM Component, Communication, Information, Functional, Business, and Human) and the exact type of the asset, using the custom properties feature of STIX, as well as the status of the asset, being active or inactive, through the revoked property of STIX. To represent the relationship between an Asset and the Organization to which it belongs, the created_by_ref STIX property (from the Infrastructure SDO to the respective Identity SDO) was used.
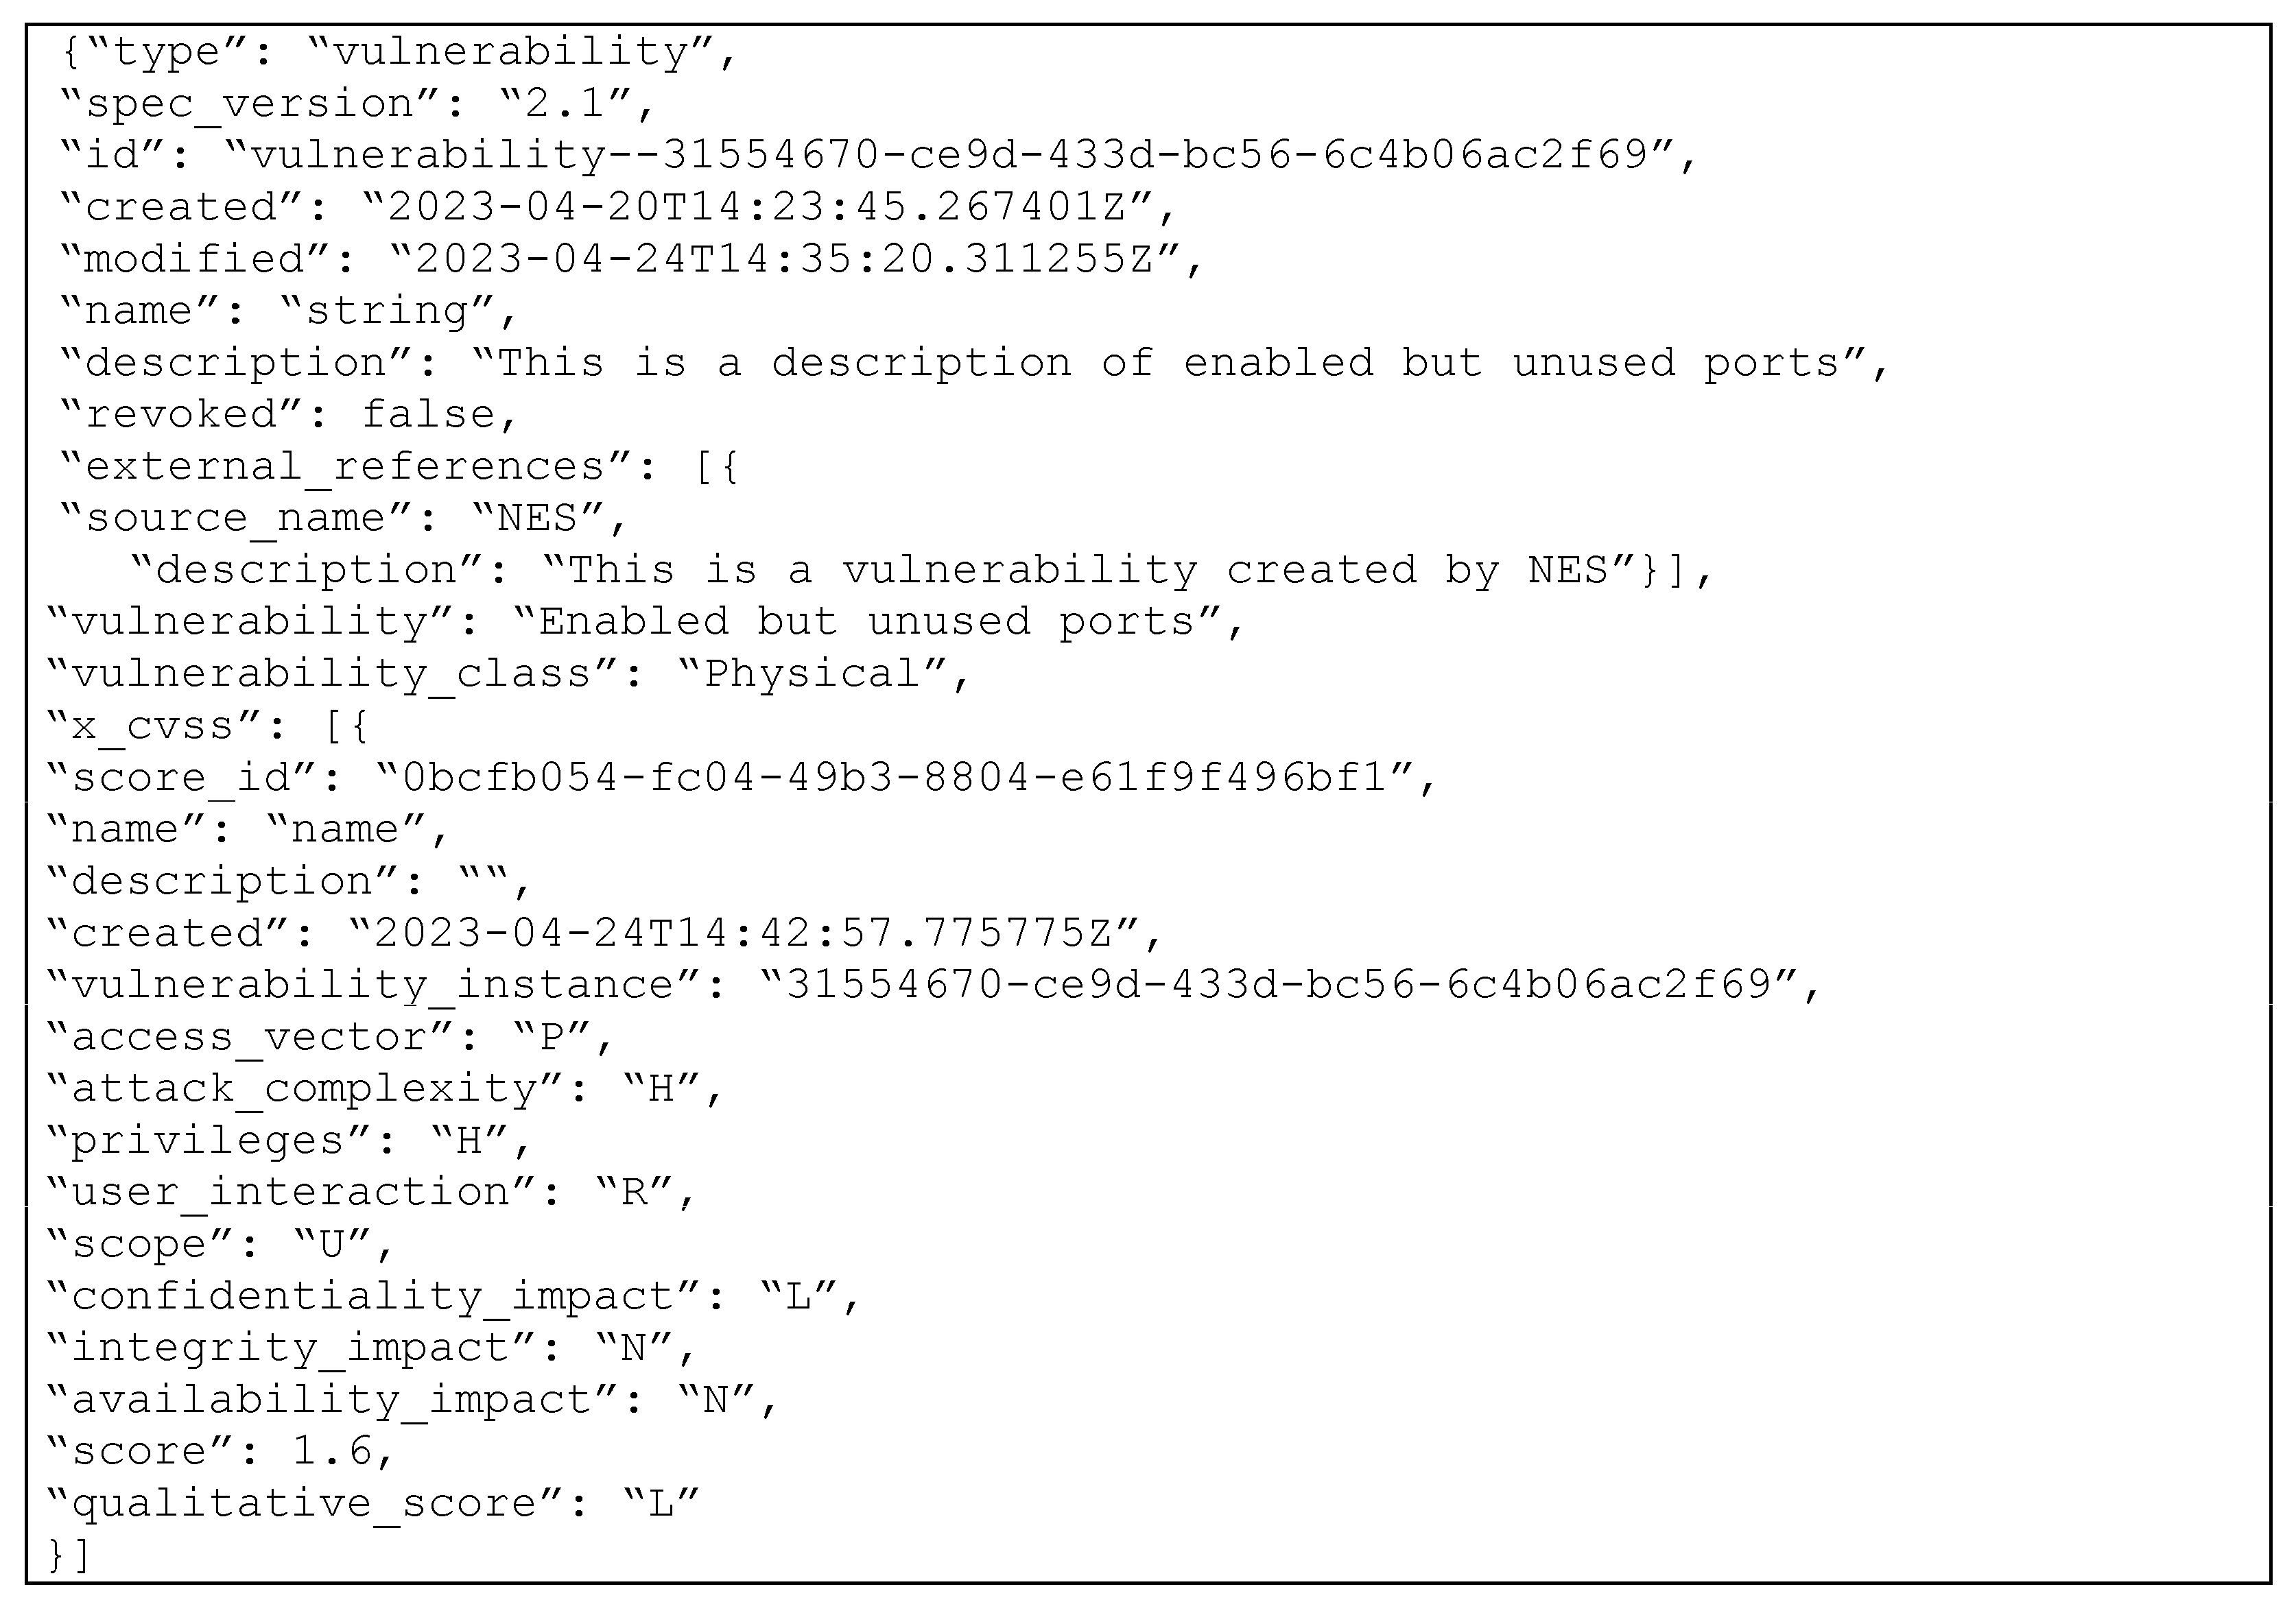
Furthermore, for the assessed Vulnerabilities (Vulnerability Instance data element), the Vulnerability SDO was used, augmented by a custom vulnerability_class property, to represent the different vulnerability classes, namely, Physical, Cyber and Human/Organizational. Additionally, we introduced in the Vulnerability SDO a custom property called x_cvss, which captures the CVSS scores of the vulnerability. x_cvss is defined as a list of score objects, having as sub-properties the basic metrics used to calculate the CVSS Score.
To represent the relationship between an Asset and a Vulnerability, we utilized the STIX predefined relationship “has” from the Infrastructure SDO to the Vulnerability SDO. The relationship consists of the source_ref and a target_ref that correlate the Infrastructure and the Vulnerability SDOs.
Figure 6 below provides an indicative sample of a Vulnerability SDO, modelling an assessed Vulnerability, including the CVSS fields, exported from CVIAT.
5. Results
This section discusses the results of our work, focusing on vulnerability identification and assessment analysis, as well as the statistical processing and analysis of those results.
5.1. Identified Vulnerabilities
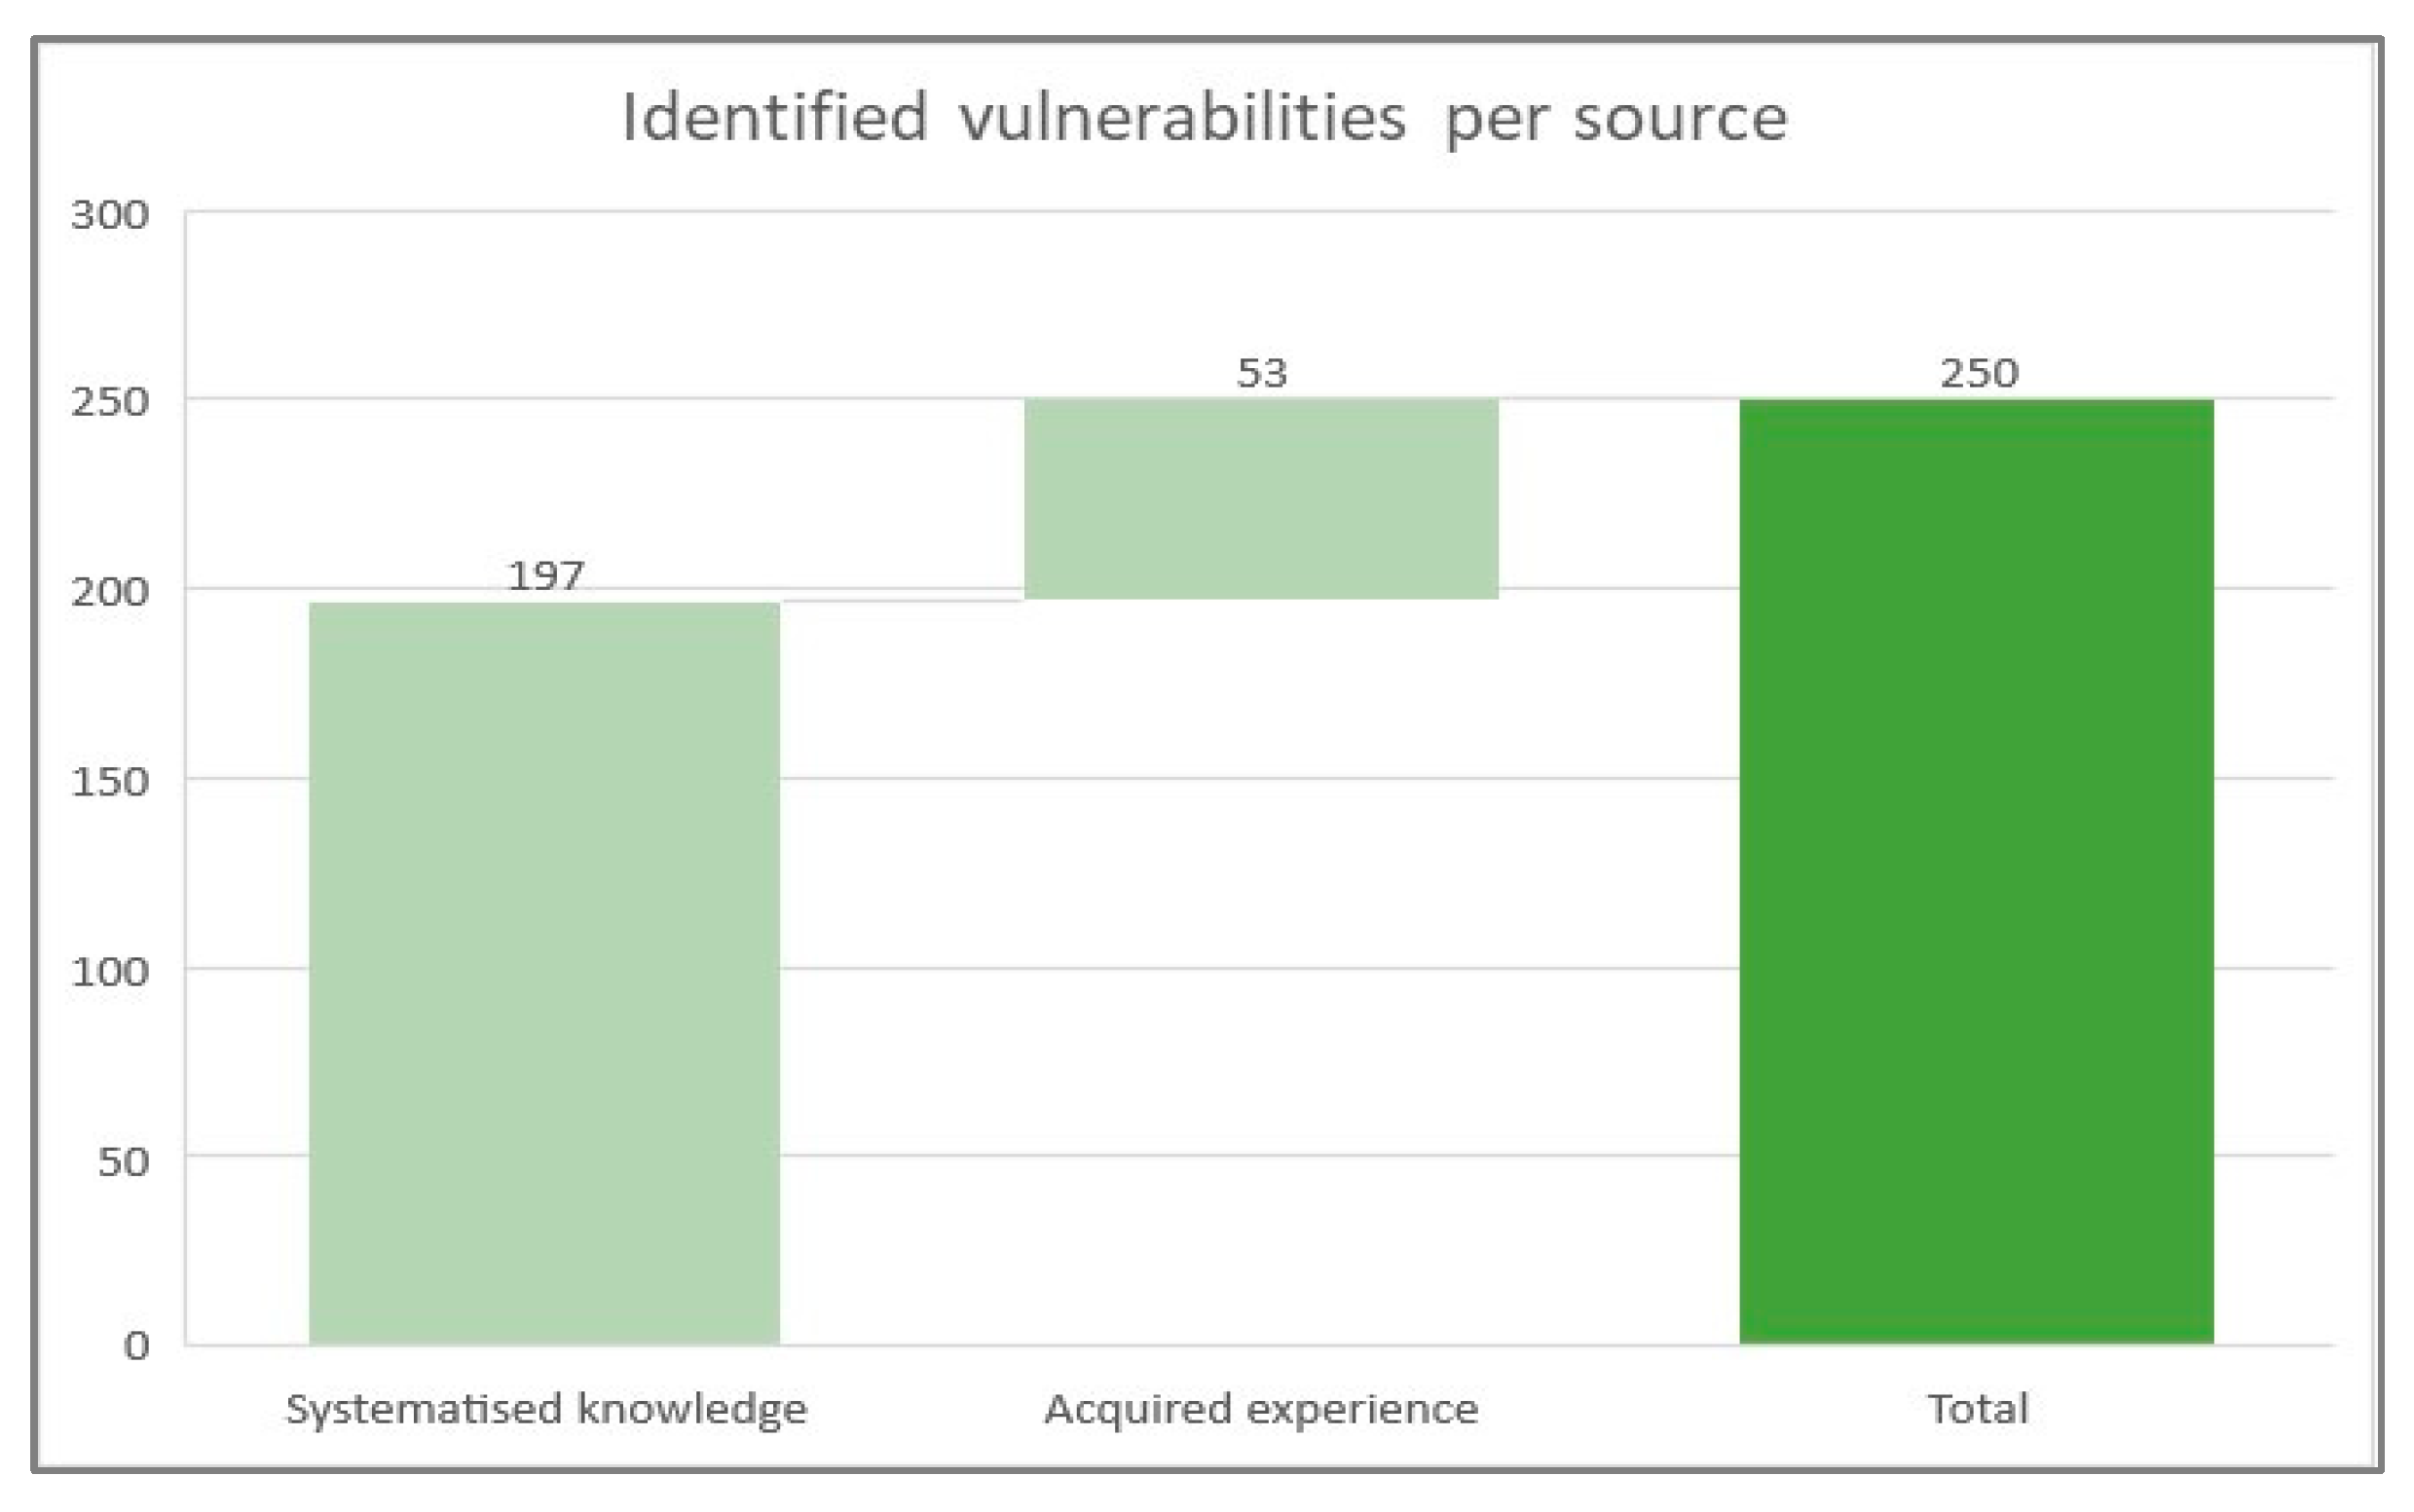
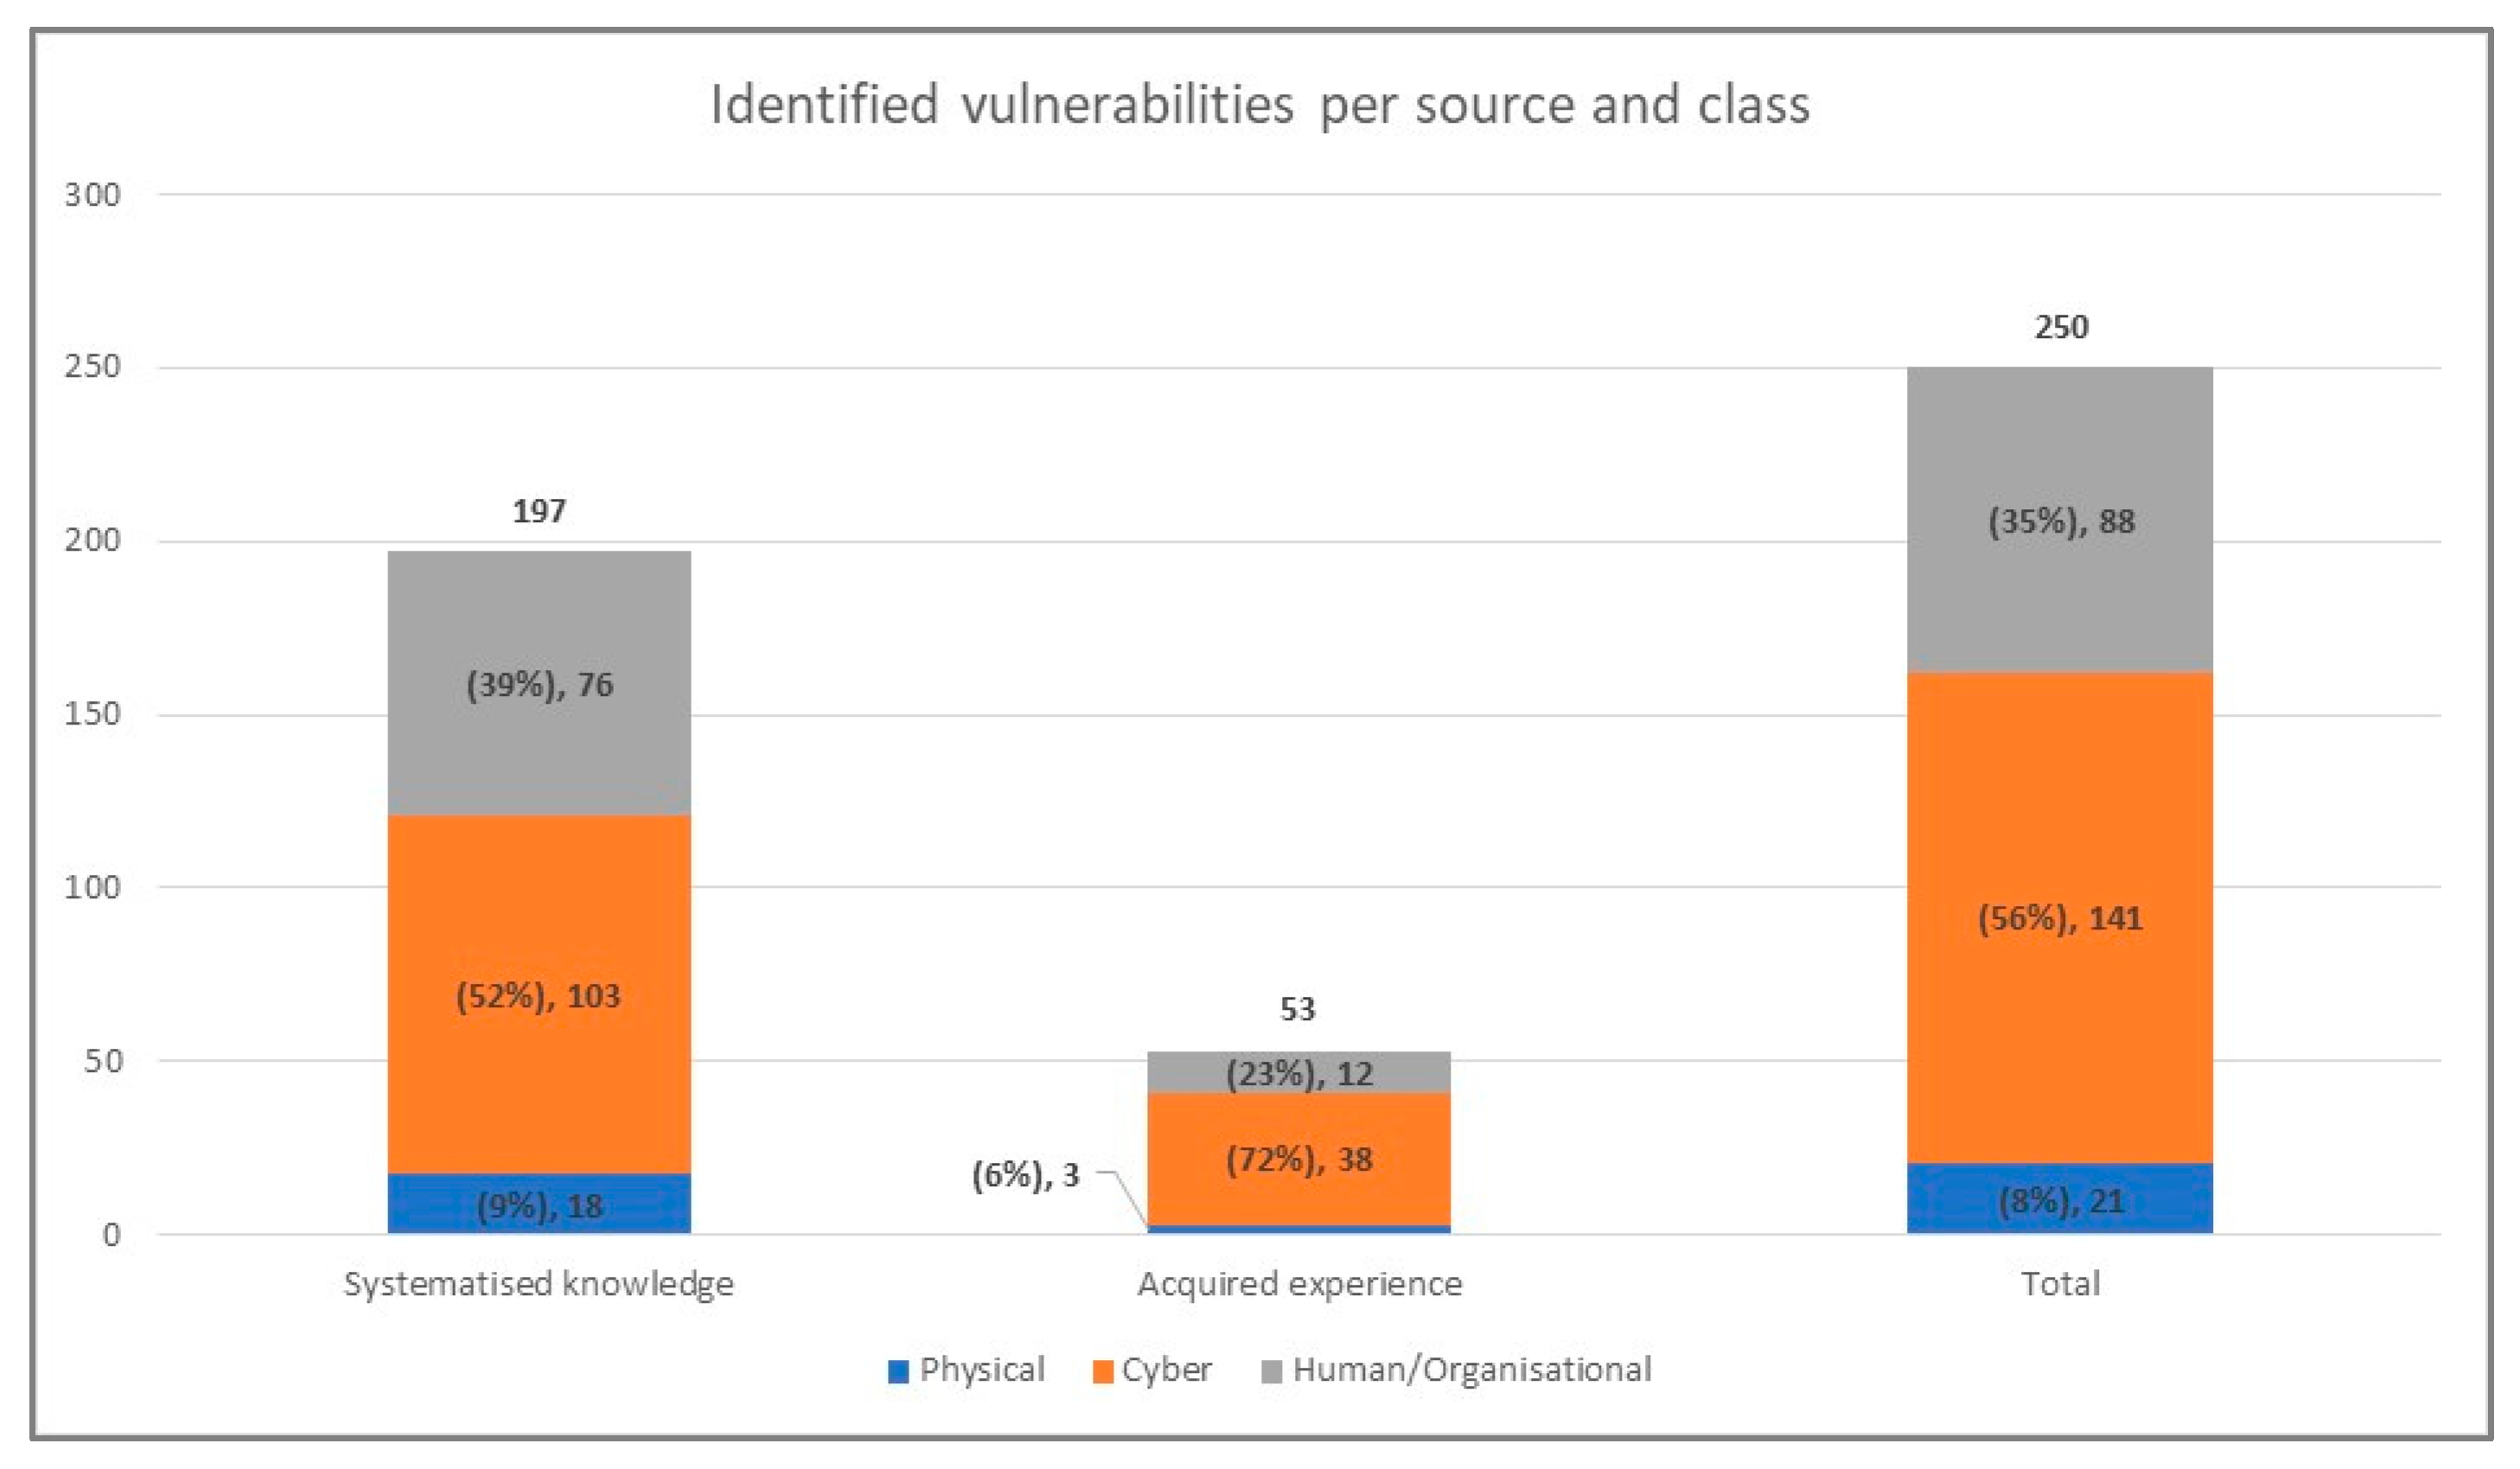
Following the vulnerability identification methodology, we created a pool of 250 unique vulnerabilities relevant for operators of energy-related infrastructures. Most of those vulnerabilities, 197 (or 79%), are derived from systematized knowledge, namely, NESCOR, CVE/NVD with a NIST vulnerability class, and ISO/IEC 27005, while the rest are based upon previous knowledge, including inspections, accounting for 53 vulnerabilities (or 21%). A graphical summary of the source of origination is shown in
Figure 7.
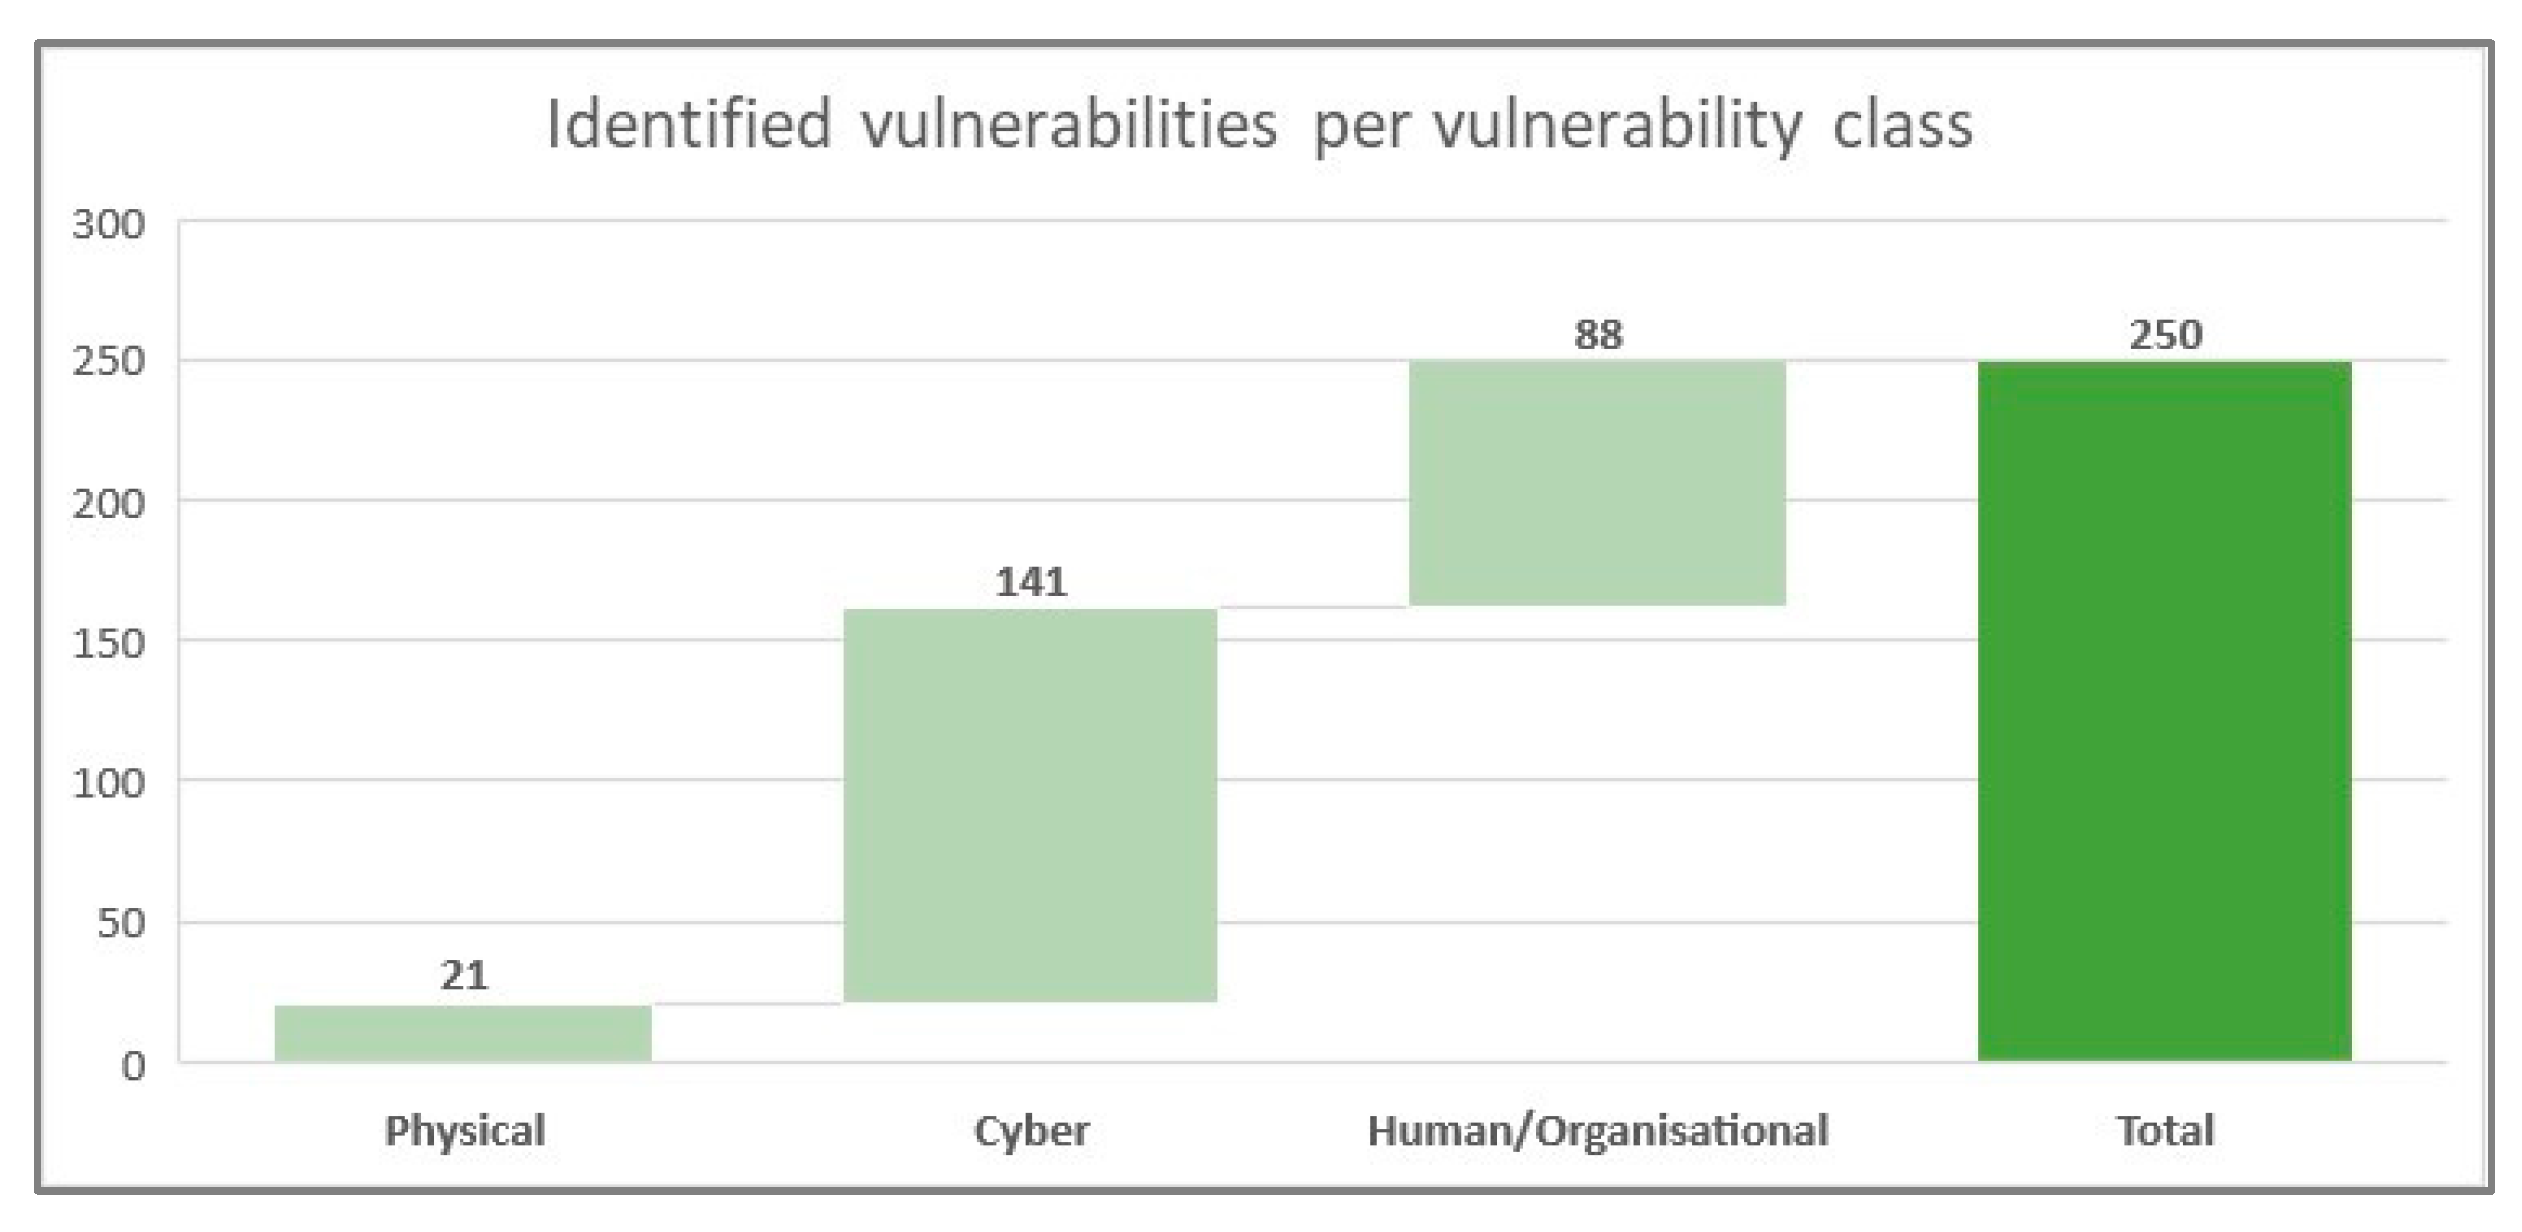
Considering the vulnerability classes discussed in
Section 3.2, the largest portion of identified vulnerabilities, 141 (or 56%), belong to the Cyber class, while more than 1 out of 3 vulnerabilities (88 or 35%) are from the Human/Organizational class. Finally, the remaining 21 vulnerabilities (or 8%) belong to the Physical class.
Figure 8 provides a cumulative representation of the identified vulnerabilities according to their classes.
The 2 types of vulnerability sources contribute to identifying vulnerabilities that belong to the different vulnerability classes, as depicted in
Figure 9. More particularly, for systematized-knowledge-originated vulnerabilities, the majority, 103 (or 52%), belong to the Cyber class, followed by 76 vulnerabilities (or 39%) from the Human/Organizational class, while the remaining 18 vulnerabilities (or 9%) belong to the Physical class. Regarding acquired experience originated vulnerabilities, including inspections, the majority belong to the Cyber class, 38 vulnerabilities (or 72%), followed by 12 vulnerabilities (or 23%) from the Human/Organizational class, while the remaining 3 vulnerabilities (or 6%) belong to the Physical class.
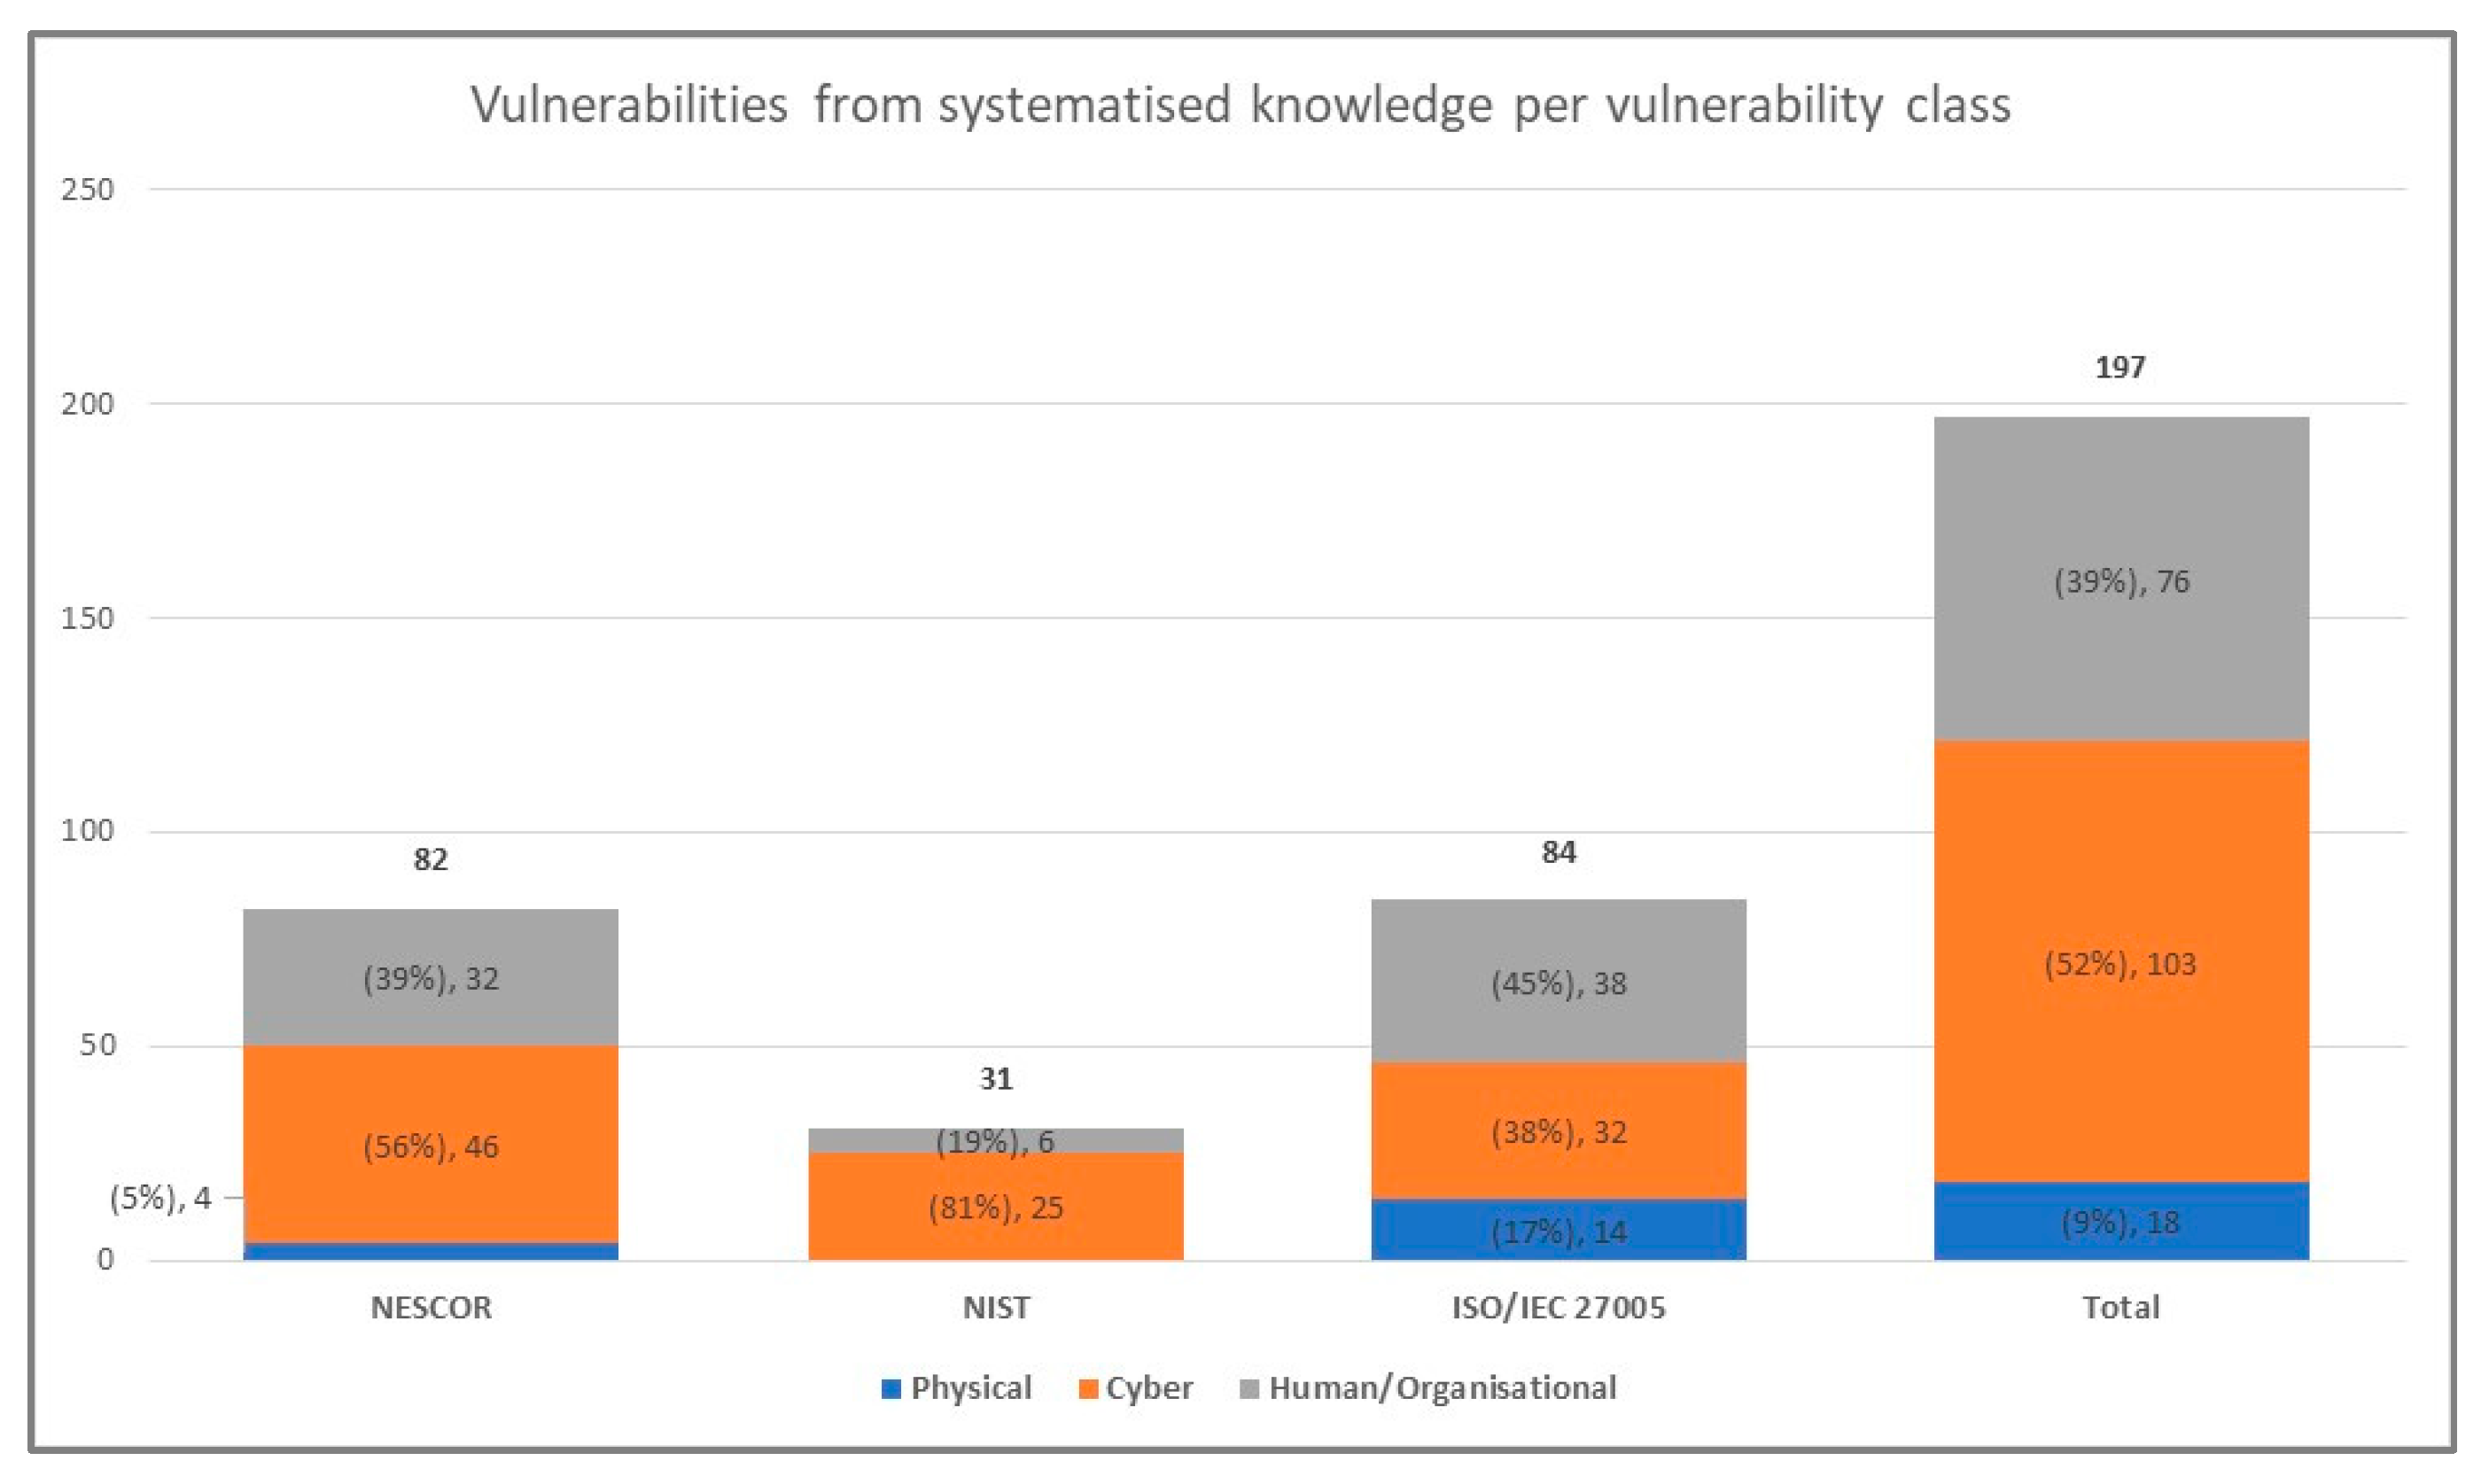
Considering the vulnerabilities identified through the source of systematized knowledge, we present in
Figure 10 how they are distributed over the three vulnerability classes.
More particularly, in the case of NESCOR vulnerabilities, the majority of them, 46 (or 56%), belong to the Cyber class, while 32 vulnerabilities (or 39%) are Human/Organizational, with the rest of them, 4 (or 5%), belonging to the Physical class. As far as the NIST vulnerabilities are concerned, they are either Cyber, 25 (or 81%), or Human/Organizational, 6 (or 19%). Regarding vulnerabilities from ISO/IEC 27005 source, the majority of them, 38 (or 45%), belong in the Human/Organizational class, while 32 vulnerabilities (or 38%) are Cyber, with the rest of them, 14 (or 17%), belonging to the Physical class. Overall, the source of systematized knowledge provided a total of 197 vulnerabilities, with the majority of them, 103 (or 52%), belonging to the Cyber class, followed by 76 (or 39%) vulnerabilities from the Human/Organizational class, with the rest, 18 (or 9%), belonging to the Physical class.
5.2. Assessment Results
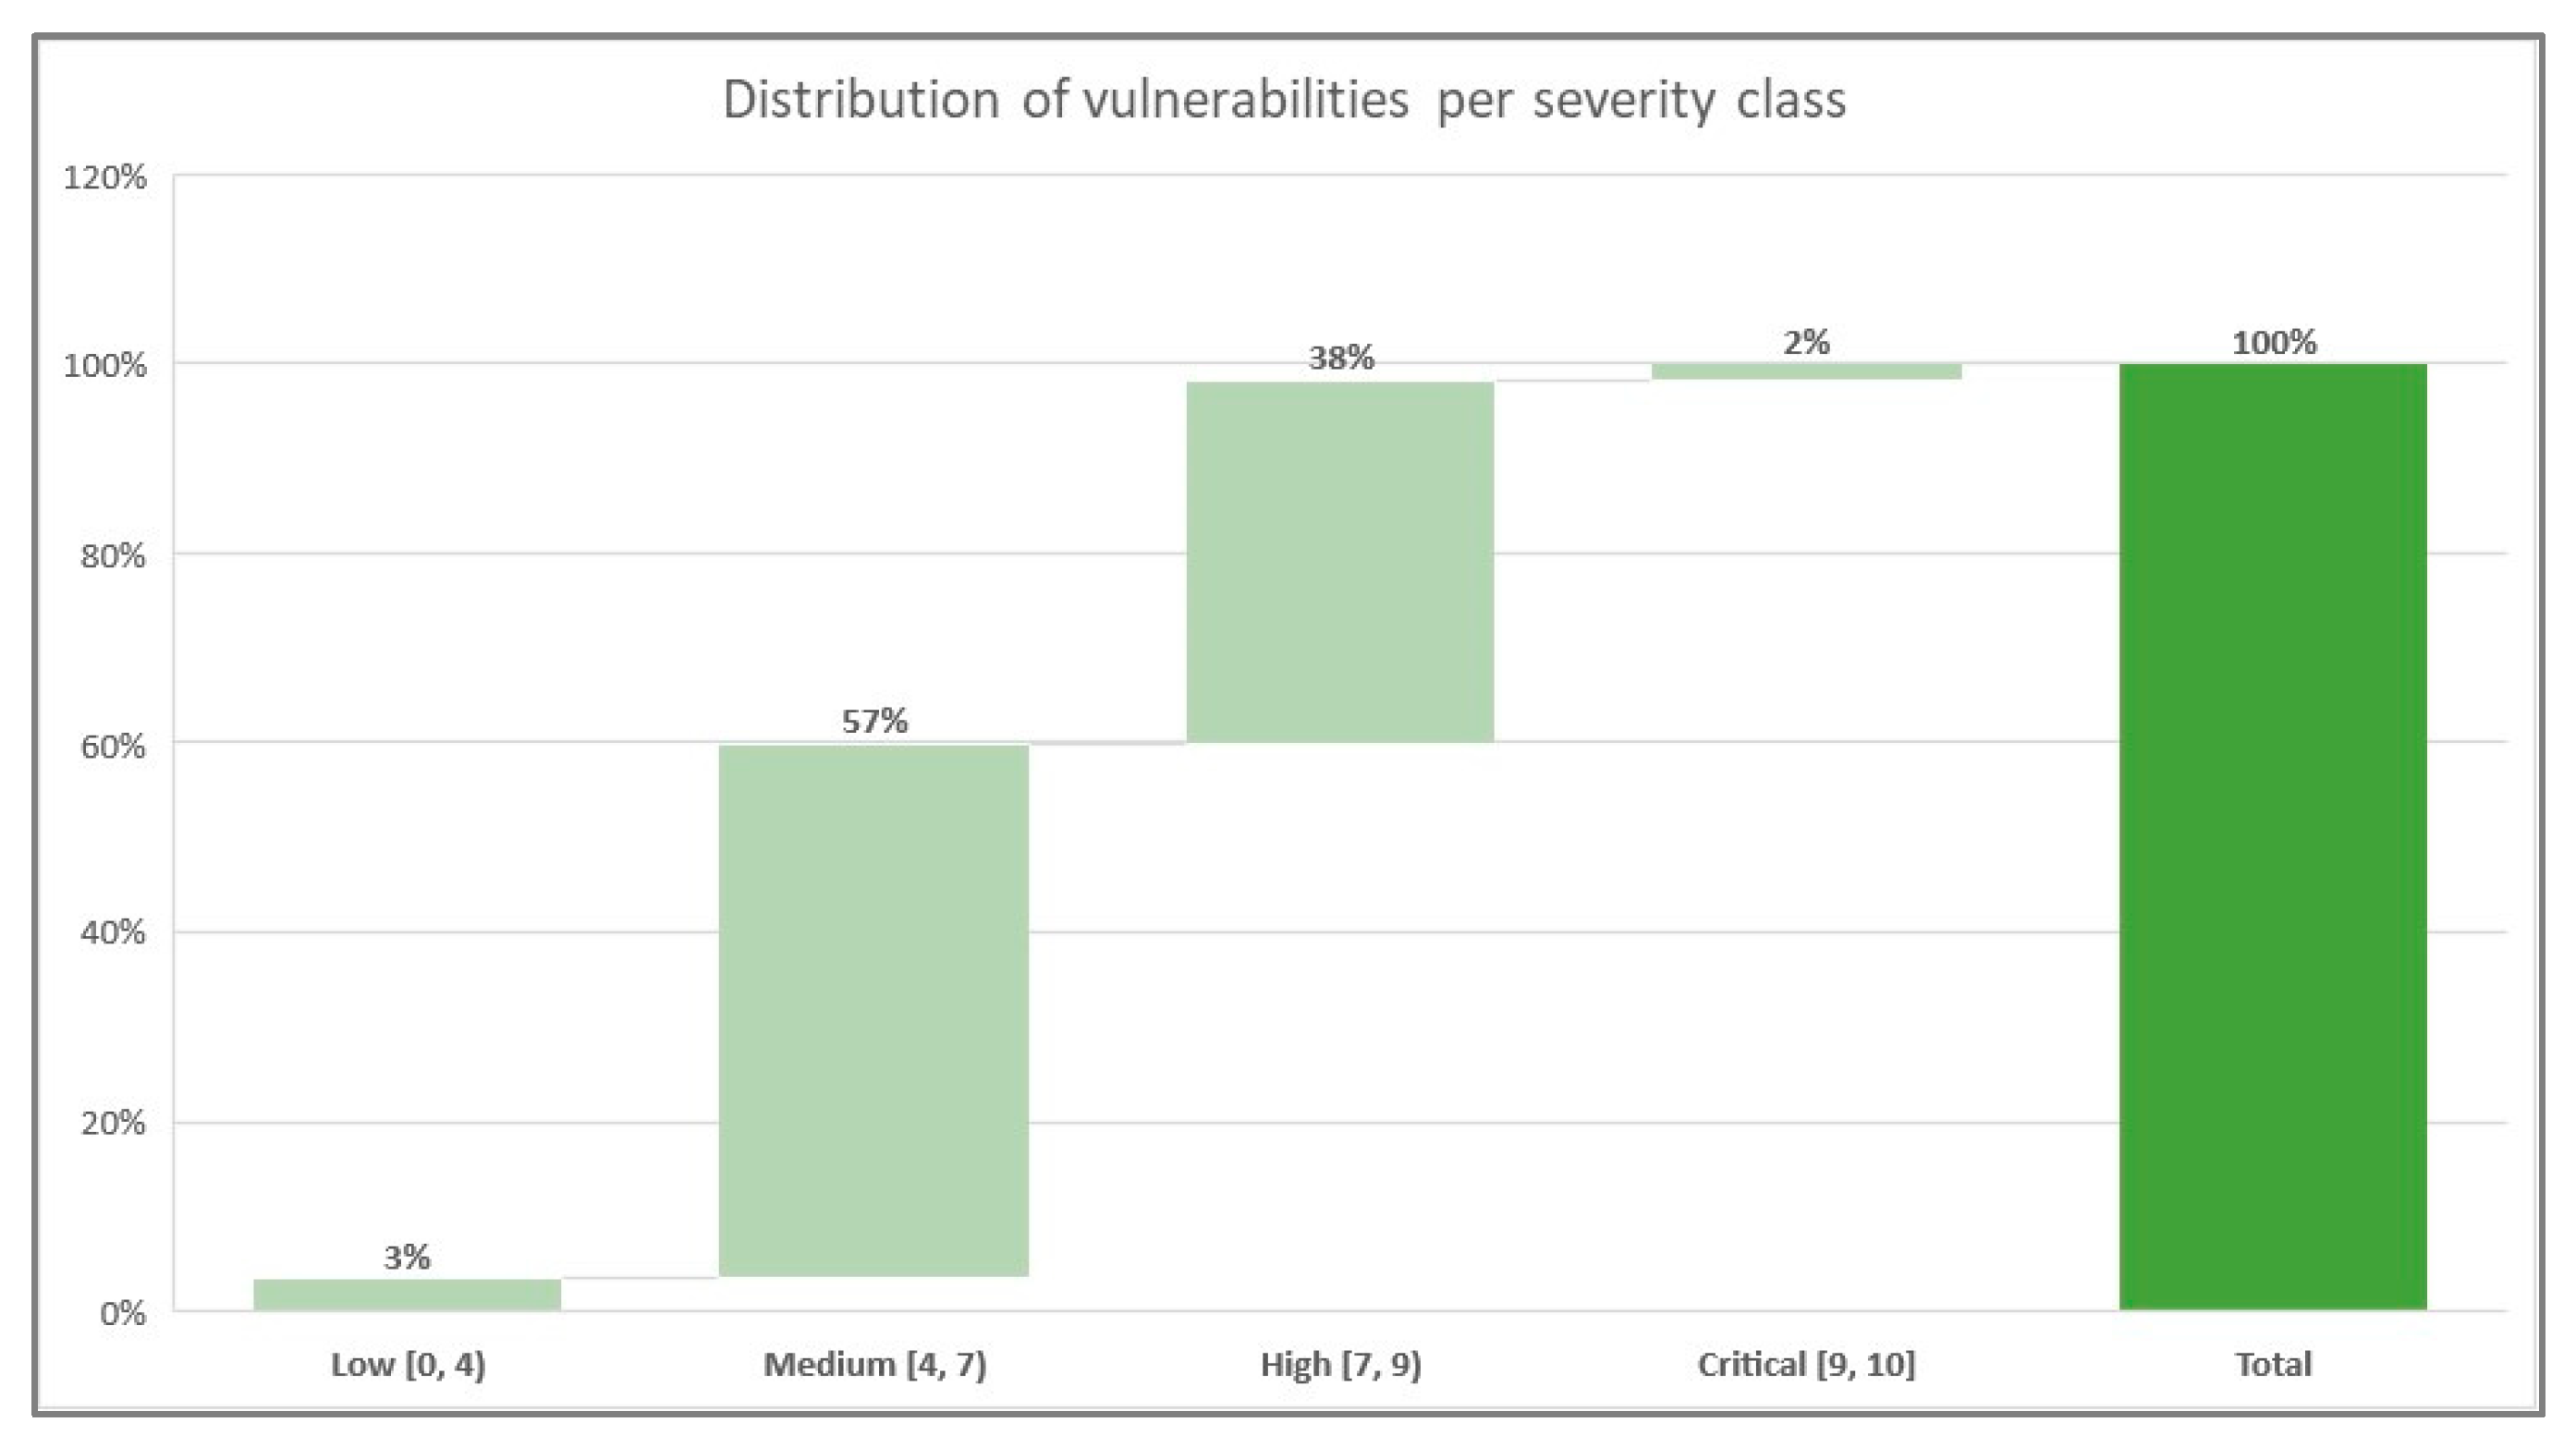
Through a joint analysis of the identified vulnerabilities, following the assessment principles of CVSS scoring, we managed to populate the system with scored vulnerabilities. The scorings were mapped to four qualitative rating groups, Low (from 0 to 4), Medium (from 4 to 7), High (from 7 to 9), and Critical (from 9 to 10).
Figure 11 provides the distribution of assessed vulnerabilities according to their qualitative severity class.
Almost 6 out of 10 (57%) vulnerabilities were scored as Medium, and 4 out of 10 (38%) vulnerabilities were scored as High. Only 3% of the vulnerabilities were scored as Low, while the class Critical contained 2% of the assessed vulnerabilities.
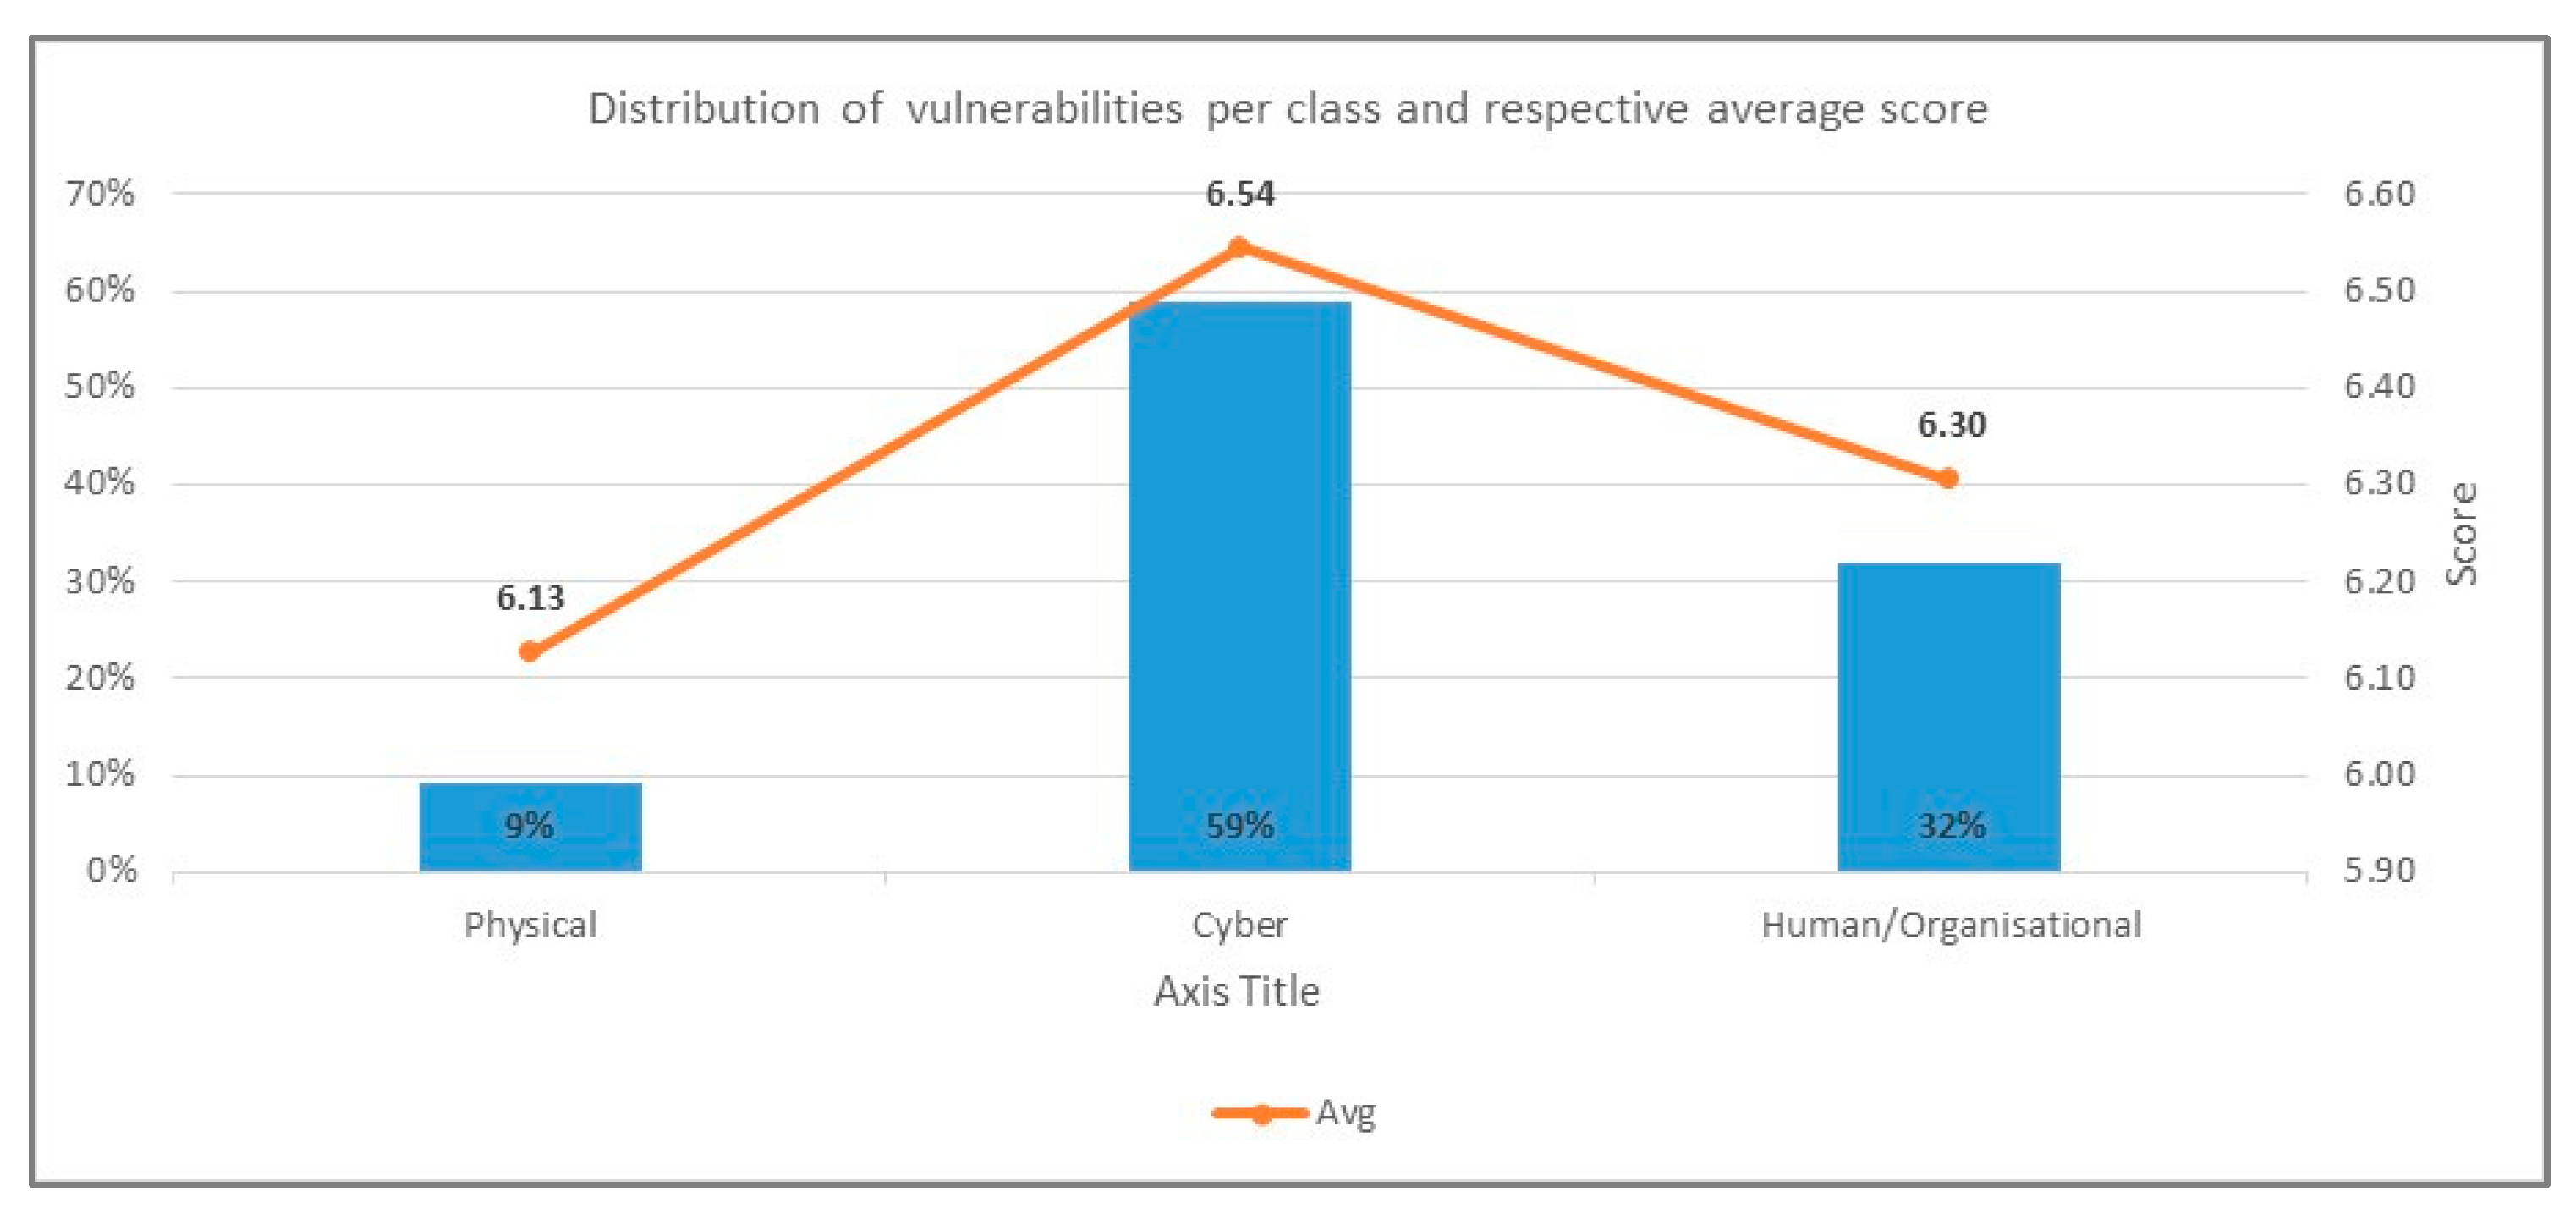
The distribution of assessed vulnerabilities per vulnerability class, together with the average value of the vulnerability assessment scores, are depicted in
Figure 12. In principle, Cyber and Human/Organizational were assessed to have higher criticality than Physical vulnerabilities.
The top five vulnerabilities per class, based on their average score in the context of the CyberSEAS project, as well as their source and the asset class and assets affected, are depicted in
Table 1,
Table 2 and
Table 3.
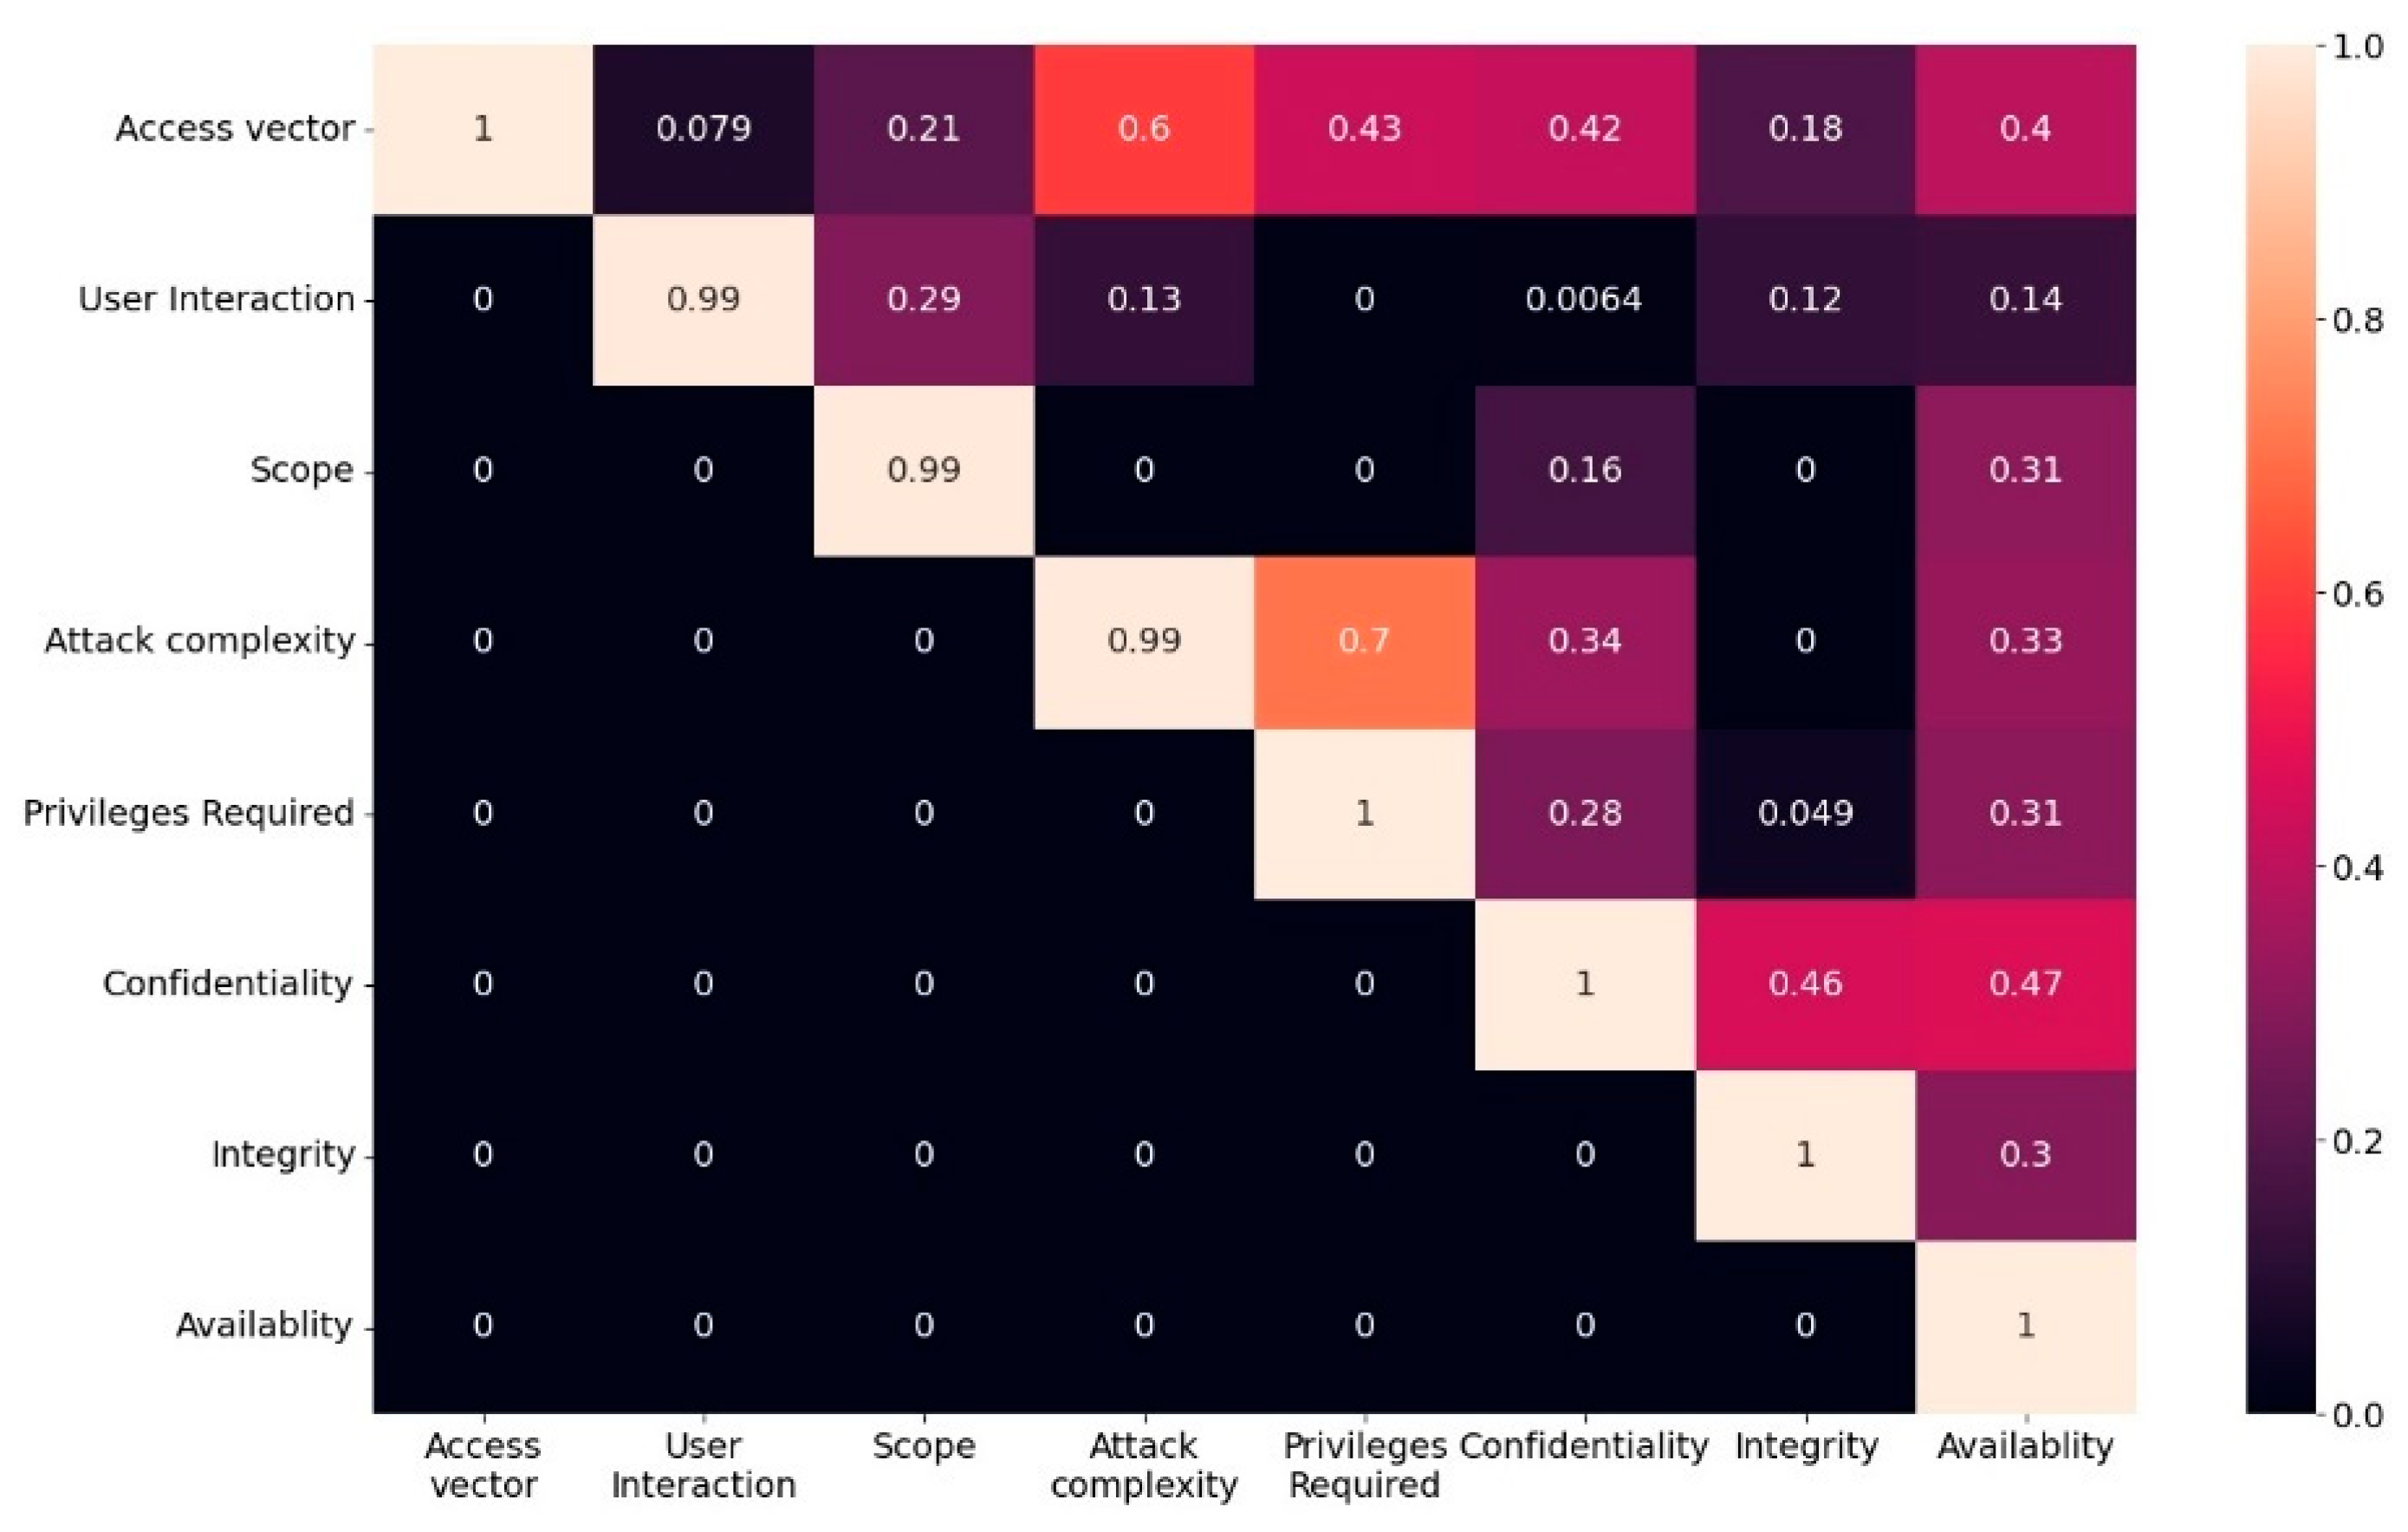
5.3. Correlation Analysis
The vulnerability assessments, considering the Base group metrics from CVSS [
1], coming from independent (anonymized) organizations, were processed using correlation analysis on the input features with Cramer’s V statistic. This way, a numerical value (correlation index) was obtained for each feature pair and a heatmap was produced, as displayed in
Figure 13.
We observed a high correlation between privileges required and attack complexity, namely, 0.7. This is to be expected since a system that enforces stricter privilege requirements needs a more complex pattern to carry out an attack against it. The attack complexity also has a strong correlation (0.6) with the Access vector metric. If the Attack Vector is remote (i.e., the vulnerability can be exploited over a network connection), it usually means that the attack complexity is lower because an attacker can remotely exploit the vulnerability without needing to gain physical access to the targeted system. In contrast, if the Attack Vector is local (i.e., the vulnerability can only be exploited by an attacker who has physical access to the targeted system), it usually means that the attack complexity is higher because an attacker needs to gain physical access to the targeted system before being able to exploit the vulnerability.
On the other hand, the Scope metric and the Required Privileges have no correlation. The reason is that they assess different aspects of a vulnerability. The Scope metric evaluates the possible reach of the vulnerability and its impact on the overall system, while the Attack Complexity metric gauges the level of difficulty that an attacker would encounter when exploiting the vulnerability.
The Scope metric and Attack Complexity metric do not have a direct correlation because they measure different aspects of the vulnerability. The Scope metric measures the potential impact of the vulnerability on the overall system while the Attack Complexity metric measures how difficult it is for an attacker to exploit the vulnerability. For example, a vulnerability may have a “Change” Scope metric, which means that the vulnerability can affect other components of the system beyond the one that is being attacked. However, the Attack Complexity metric may be “Lo”, which means that the vulnerability is easy to exploit. In this case, the vulnerability can have a significant impact on the overall security of the system, even though it is easy to exploit.
5.4. Association Rule Learning
In this section, we present the results of an association rule analysis conducted on a dataset related to computer security.
Table 4 summarizes the key association rules identified in our analysis, along with their corresponding support, confidence, and lift metrics. The antecedents and consequents of each rule are presented in separate columns, where the antecedent refers to the condition or pattern that precedes the arrow, and the consequent refers to the outcome or event that follows the arrow.
One interesting pattern that emerged is the strong association between the Access vector “Network” and the requirement for high privileges. This association has a support value of 0.47, indicating that the pattern is present in nearly half of the dataset. The confidence value of 0.74 suggests that the rule is accurate in 74% of the cases where the pattern is present, while the lift value of 1.4 indicates that the association between the access vector and high privileges is 1.4 times stronger than would be expected by chance.
Another notable finding is the association between low confidentiality and low availability, which has a support value of 0.47 and a lift value of 1.51. This suggests that there is a strong relationship between these two metrics.
6. Conclusions
The identification and assessment of vulnerabilities is a critical step in the risk-assessment process. In this work, we are confronted with three main challenges: (a) a methodological one regarding how to identify, in a structured way, a set of vulnerabilities relevant to EPES infrastructure from an extensive and complex set of available vulnerabilities and, subsequently, associate them with asset classes; (b) a technological one related to the design and implementation of a holistic environment, to support the historized and interoperable identification and assessment of vulnerabilities; and (c) an analysis and interpretation one related to the findings from assessment on behalf of EU EPES infrastructure and the consolidation of a pool of statistics for the processing and understanding of the assessments.
Although there are multiple pools of vulnerabilities, a consolidated and manageable set, which is also tailored for and linked to EPES critical infrastructure, is a valid need. Additionally, the results of vulnerability assessments can be further utilized for statistical analysis and as valuable CTI information, enabling collaboration and interoperability scenarios. In this respect, transforming the assessments into datasets and processing them using statistical tools offered insights into the ways vulnerabilities are perceived, connected, and assessed.
The methodological framework employs three types of vulnerability sources, resulting in a pool of 250 unique and characterized vulnerabilities. The vulnerability classification scheme (Physical, Cyber, and Human/Organizational) has been adequate for characterizing all vulnerabilities. The challenge of mapping vulnerability and asset classes has been confronted with the double-mapping mechanism, using the ISO/IEC 27005 as a pivot classification.
The CVSS scoring mechanism has allowed interactive and coherent scoring and assessment of vulnerabilities after their association with assets. The set of assessments has allowed for statistics related to the types of vulnerabilities and their criticality in typical infrastructures.
The CVIAT environment allows for interoperability capabilities using the STIX format for reusable CTI. Historical preservation of score evolution through successive scorings contributes to a better understanding of the levels of exposure for the Energy operator over time. Furthermore, the extension of the historized vulnerability assessment scorings as a dataset allowed for correlation and association rule analysis. These have provided insights into the patterns and relationships. By identifying these associations, we can better understand the factors that contribute to computer security vulnerabilities and develop more effective strategies for mitigating them.
In terms of future work, we expect to expand the framework with further vulnerability sources, such as [
31], and consolidate the vulnerabilities coming from internal organization sources into new libraries. Furthermore, the interoperability capabilities can extend the processing of the results as the assessments can serve as datasets. This can be processed by third-party tools to identify more complex patterns and correlations between (a) the evolution of the scoring of a vulnerability in subsequent assessments and (b) the external conditions for proactive notifications.


 ,
, 


