1. Introduction
Electrospinning can be used to prepare nanofiber mats from polymer solutions or melts as well as from polymer blends and combinations with non-polymeric materials, e.g., by adding metallic or ceramic nanoparticles [
1,
2]. Among the different electrospinning techniques, the needle-based one is the simplest and is widely used because it enables spinning from a broad variety of solutions with polymers and polymer blends, and relatively inexpensive devices can be used [
3,
4,
5]. On the other hand, needleless techniques, such as wire-based electrospinning and some other electrode forms, allow for the production of larger quantities of nanofibers in a given time [
6,
7].
The nanoparticles that can be added to a spinning solution are usually selected according to the desired physical or chemical properties of the nanofiber mats produced, e.g., to achieve antibacterial or catalytic properties, to increase electromagnetic shielding or to improve cell adhesion and proliferation on the nanofibrous membranes [
8]. Magnetic nanofibers can be produced by embedding especially ferri- or ferro-magnetic nanoparticles, e.g., those made of magnetite, nickel ferrite, iron, cobalt, or similar materials. Their magnetic anisotropies differ not only depending on the material and type of added nanoparticle, but also on the filler rate and on the distribution of the nanoparticles in the nanofibers [
9,
10,
11].
Various research groups reported on a wide range of magnetic materials that are suitable for this application. For example, magnetite (Fe
3O
4) nanoparticles have been embedded in spinning solutions with poly(ethylene oxide) (PEO) [
12], poly(vinyl pyrrolidone) (PVP) [
13] or poly(ɛ-caprolactone) (PCL) [
14] to produce magnetic nanofibers, usually by needle-based electrospinning. Another interesting polymer for the electrospinning of pure polymeric or blended nanofibers is poly(acrylonitrile) (PAN), which has the advantage that it can be electrospun from toxic solvents like dimethylformamide (DMF) [
15] and also from the low-toxic solvent dimethyl sulfoxide (DMSO), which makes PAN very suitable for biomedical or biotechnological applications where no residues of toxic solvents should be available in the final nanofiber mats [
16].
Such magnetic nanofibers can be used for various applications, e.g., for electromagnetic interference (EMI) shielding, as catalysts, or for hyperthermia therapy and other biomedical and biotechnological applications [
17,
18]. In basic research, on the other hand, they can serve as model systems for one-dimensional magnetic composites, or, if the polymeric part is calcinated after electrospinning so that the magnetic nanoparticles are sintered and only the pure magnetic nanofibers remain, for magnetic nanowires [
19,
20,
21]. While the latter are based on uniformly distributed magnetic nanoparticles to enable the formation of pure metallic nanofibers, the former show different magnetic properties with different nanoparticle distributions, as simulations and experiments have revealed [
11,
22]. Agglomerations of the nanoparticles in the nanofibers can be found for many materials and nanoparticle shapes and can only be partially avoided by stirring and ultrasonication during the preparation of the spinning solution, as agglomerations can still form during the electrospinning process, which usually takes several tens of minutes if a relatively thick nanofiber mat is produced. Such agglomerations can influence the slope of a hysteresis curve, which is based on the change from an isotropic magnetic behavior of isolated round nanoparticles to the shape anisotropy of one-dimensional agglomerations [
11]. They can even strongly alter the coercive fields of magnetic hysteresis loops [
11], whereby small magnetic nanoparticles can reach the superparamagnetic limit, i.e., the coercive field approaches zero, while agglomerations exhibit coercive fields larger than zero [
23]. For both practical applications and basic research, it is therefore necessary to know the magnetic nanoparticle distribution in a nanofiber network and to measure the magnetic properties of such magnetic nanofiber mats as a function of the nanoparticle content in the solution and the possible agglomerations.
Another important point for many applications is the content of magnetic nanoparticles within the composite nanofiber mat. The upper limit is usually given by vanishing spinnability, e.g., by the formation of large beads, due to the high viscosity of the solution, or when the electrospun fibers are destroyed by too many “polymer voids”, where magnetic nanoparticles cannot adhere to neighboring nanoparticles or the surrounding polymer matrix anymore, so that either no nanofibers are formed at all, or the resulting nanofibers become too brittle, and the nanofiber mat is easily destroyed by mechanical influences [
24].
In a previous study, nanofiber mats electrospun from 8.7 wt.% PAN and 33.3 wt.% magnetite in DMSO were prepared by needle-based electrospinning, exhibiting very thick and inhomogeneous nanofibers on average, as compared to pure PAN nanofiber mats [
25]. While high magnetite contents are desirable, the inhomogeneity of nanofibers negatively affects the performance of nanofiber mats in some applications, such as magnetically assisted filtration, where highly homogeneous pores are required. Here, we investigate the influence of the overall solid content for a fixed PAN:magnetite mass ratio of 2:1 and show the limitations of electrospinning nanofiber mats with this specific mass ratio.
2. Materials and Methods
Magnetic composite nanofibers were electrospun from solutions of PAN (X-PAN copolymer, consisting of 93.5% acrylonitrile, 6% methylacrylate, and 0.5% sodium methallyl sulfonate from Dralon, Dormagen, Germany; Mn = 90,000 g/mL, Mw = 250,000 g/mol) in DMSO (min. 99.9%, obtained from S3 chemicals, Bad Oeynhausen, Germany). The solutions were prepared under constant stirring at room temperature for 1 day. Magnetite (Fe3O4) nanoparticles (50–100 nm particle size, 97% trace metals basis, Sigma Aldrich, Saint Louis, MO, USA) were then added to the spinning solution as a magnetic component and mixed by manual stirring and a vortexer (RS-VF 10, Phoenix Instrument GmbH, Garbsen, Germany) at 2500 rpm. Five spinning solutions were prepared with a PAN:magnetite mass ratio of 2:1 and overall solid contents of 15 wt.%, 19 wt.%, 20 wt.%, 21 wt.%, and 25 wt.%, which were used to focus on the best spinnable concentration range, while 15 wt.% and 25 wt.% were used to define the limits of the spinnable range.
To prepare nanofiber mats, the needleless electrospinning machine “Nanospider Lab” (Elmarco Ltd., Liberec, Czech Republic) was used. The spinning parameters were slightly optimized for each spinning solution towards the following values: voltage 50–55 kV, current 0.02–0.03 mA, carriage speed 100 mm/s, nozzle diameter 0.8–0.9 mm, spinning duration 38–46 min (30 min in case of 15 wt.% solid content in the spinning solution due to the formation of wet areas on the electrospun membrane, indicating that the solvent did not completely evaporate from the nanofibers on the way from the wire on which the spinning solution was coated to the substrate). The temperature was between 20.4 °C and 22.8 °C, and the relative humidity was reduced to 32–33 wt.% by dry compressed air.
For the macroscopic characterization of the samples, a Sony Cybershot DSC-RX100 IV camera was used. Scanning electron microscopy (SEM) images were taken on nine arbitrarily chosen positions (3 positions on 3 specimens each) per sample, using a DualBeam focused ion beam (FIB) SEM “Helios Nanolab 600i” (FEI Company, Hillsboro, OR, USA) in secondary electron mode after sputtering approximately 7 nm of ruthenium for conductivity. The same instrument was used for energy-dispersive X-ray (EDX) maps. Fiber diameters were evaluated by ImageJ (version 1.53e, 2021, National Institutes of Health, Bethesda, MD, USA), using 50 fibers per specimen (or all visible fibers in the case of the sample spun from 15 wt.% solid content in the solution due to the low number of overall fibers, as shown in
Section 3).
Thermogravimetric analysis (TGA) was performed in a Hi-Res TGA 2950 Thermo-gravimetric Analyzer from TA Instruments (New Castle, DE, USA), using a heating rate of 15 K/min from 40 °C to 750 °C in constant synthetic air flow. For each sample, two specimens of dimensions (20 mm)2 from different positions were examined.
The magnetic properties of the nanofiber mats were measured with an alternating gradient magnetometer (AGM) Princeton MicroMag (LakeShore Cryotronics, Westerville, OH, USA), using sample sizes of (4 mm)².
3. Results
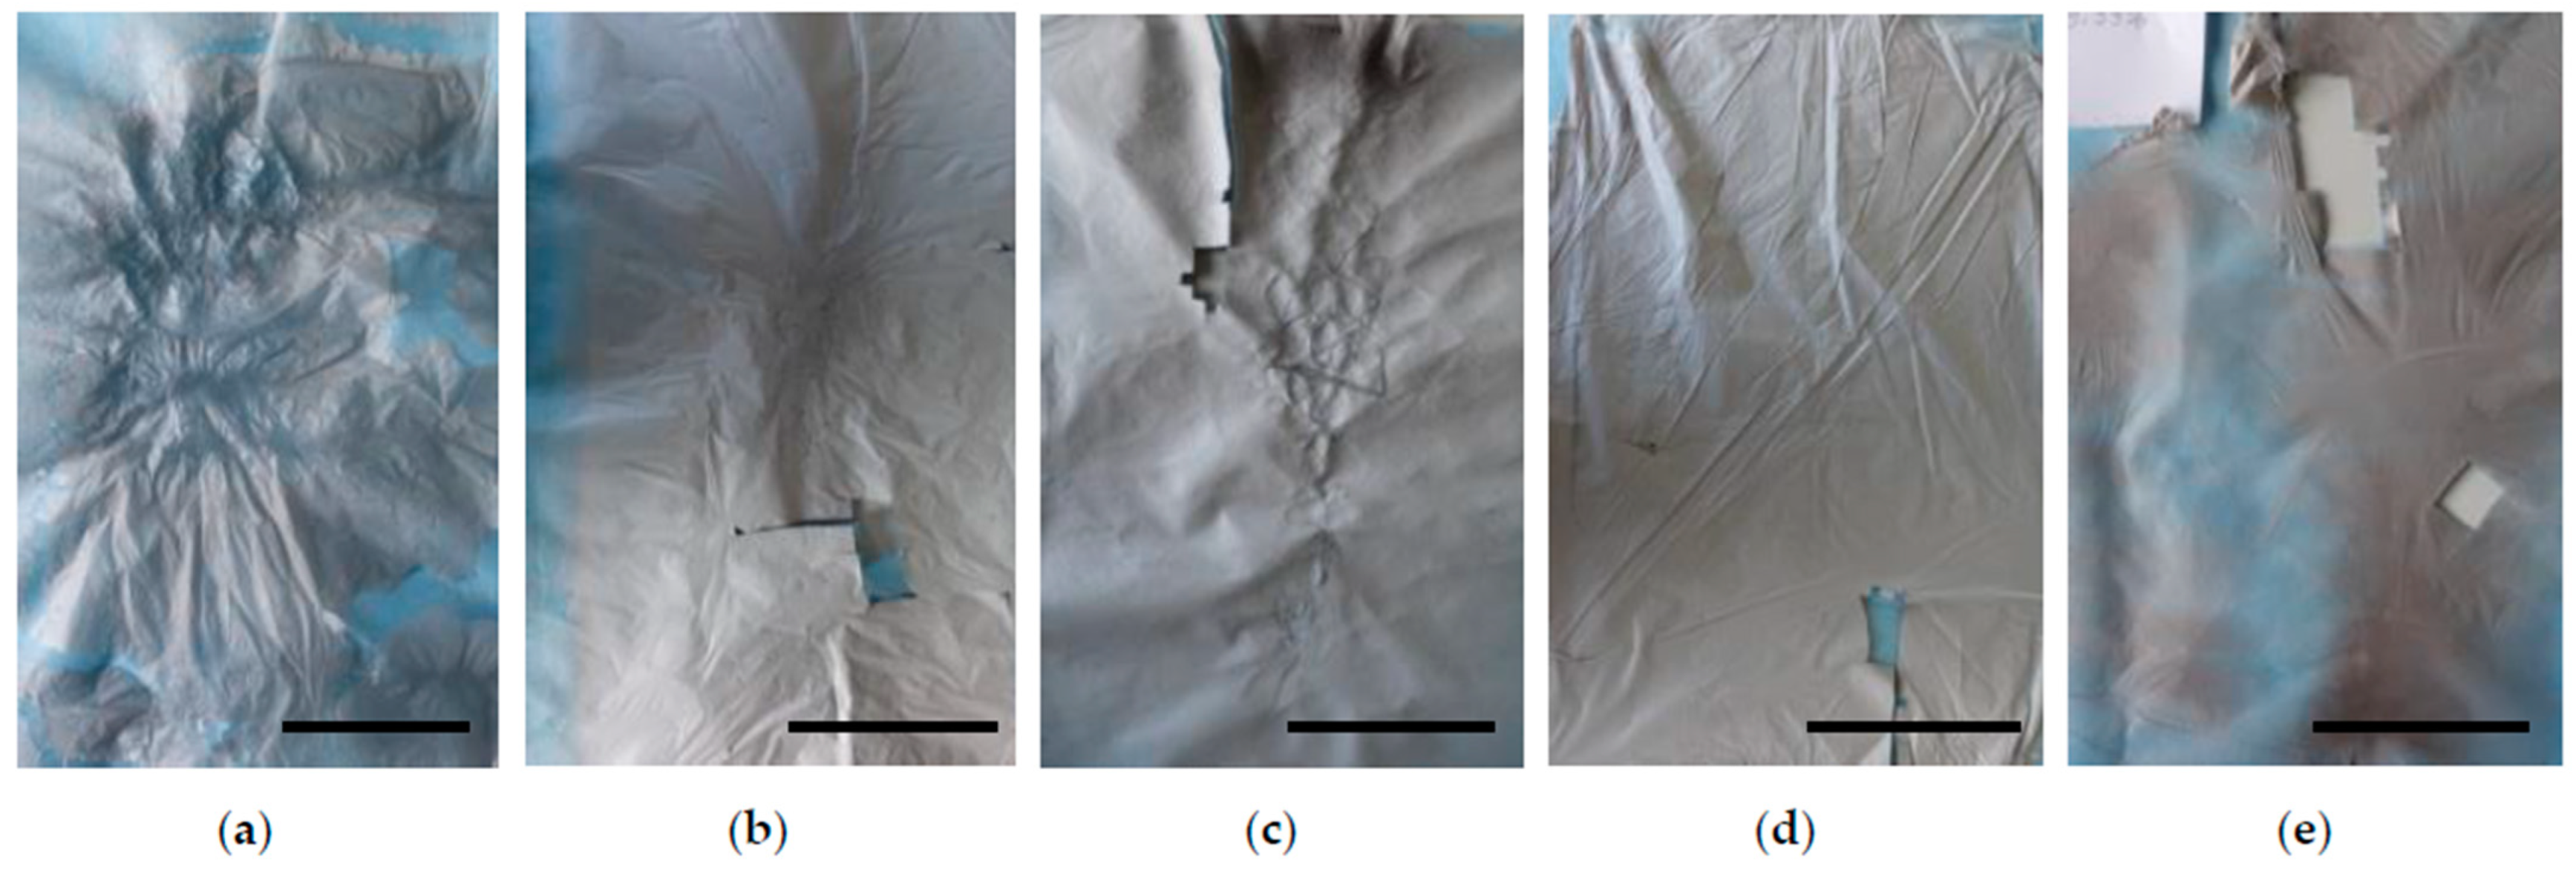
Figure 1 shows macroscopic photographs of the whole nanofiber mats spun from electrospinning solutions with 15 wt.% to 25 wt.% (
Figure 1a–e). In particular, the sample with only 15 wt.% solid content in the spinning solution (
Figure 1a) does not have the usual look and feel of a nanofiber mat, but the gloss and brittleness of a closed membrane, which may exhibit pores but no predominantly fibrous morphology. On the other hand, in the sample with the maximum of 25 wt.% solid content in the spinning solution (
Figure 1e), the inhomogeneity of the membrane along the spinning area is clearly visible. Smaller color inhomogeneities are visible in the samples with 19 wt.% and 20 wt.% solid contents, apart from the “candy-cotton” strings in the middle of
Figure 1c, which can occur when the solvent does not evaporate completely during electrospinning. Assuming that the PAN:magnetite ratio is always homogeneous throughout a spinning process, the darker parts might have more membranous and fewer fibrous properties, since nanofibers generally tend to look white due to the structural colors of their irregularly nanostructured surfaces. On the other hand, the dark color of the sample spun from 25 wt.% solid content in the solution may also be due to a higher amount of magnetite in the nanofiber mat, which was investigated by TGA, as described later. Thus, from a macroscopic point of view, the sample with 21 wt.% solid content (
Figure 1d) is the most homogeneous and therefore the most favorable.
However, this may differ from the microscopic view.
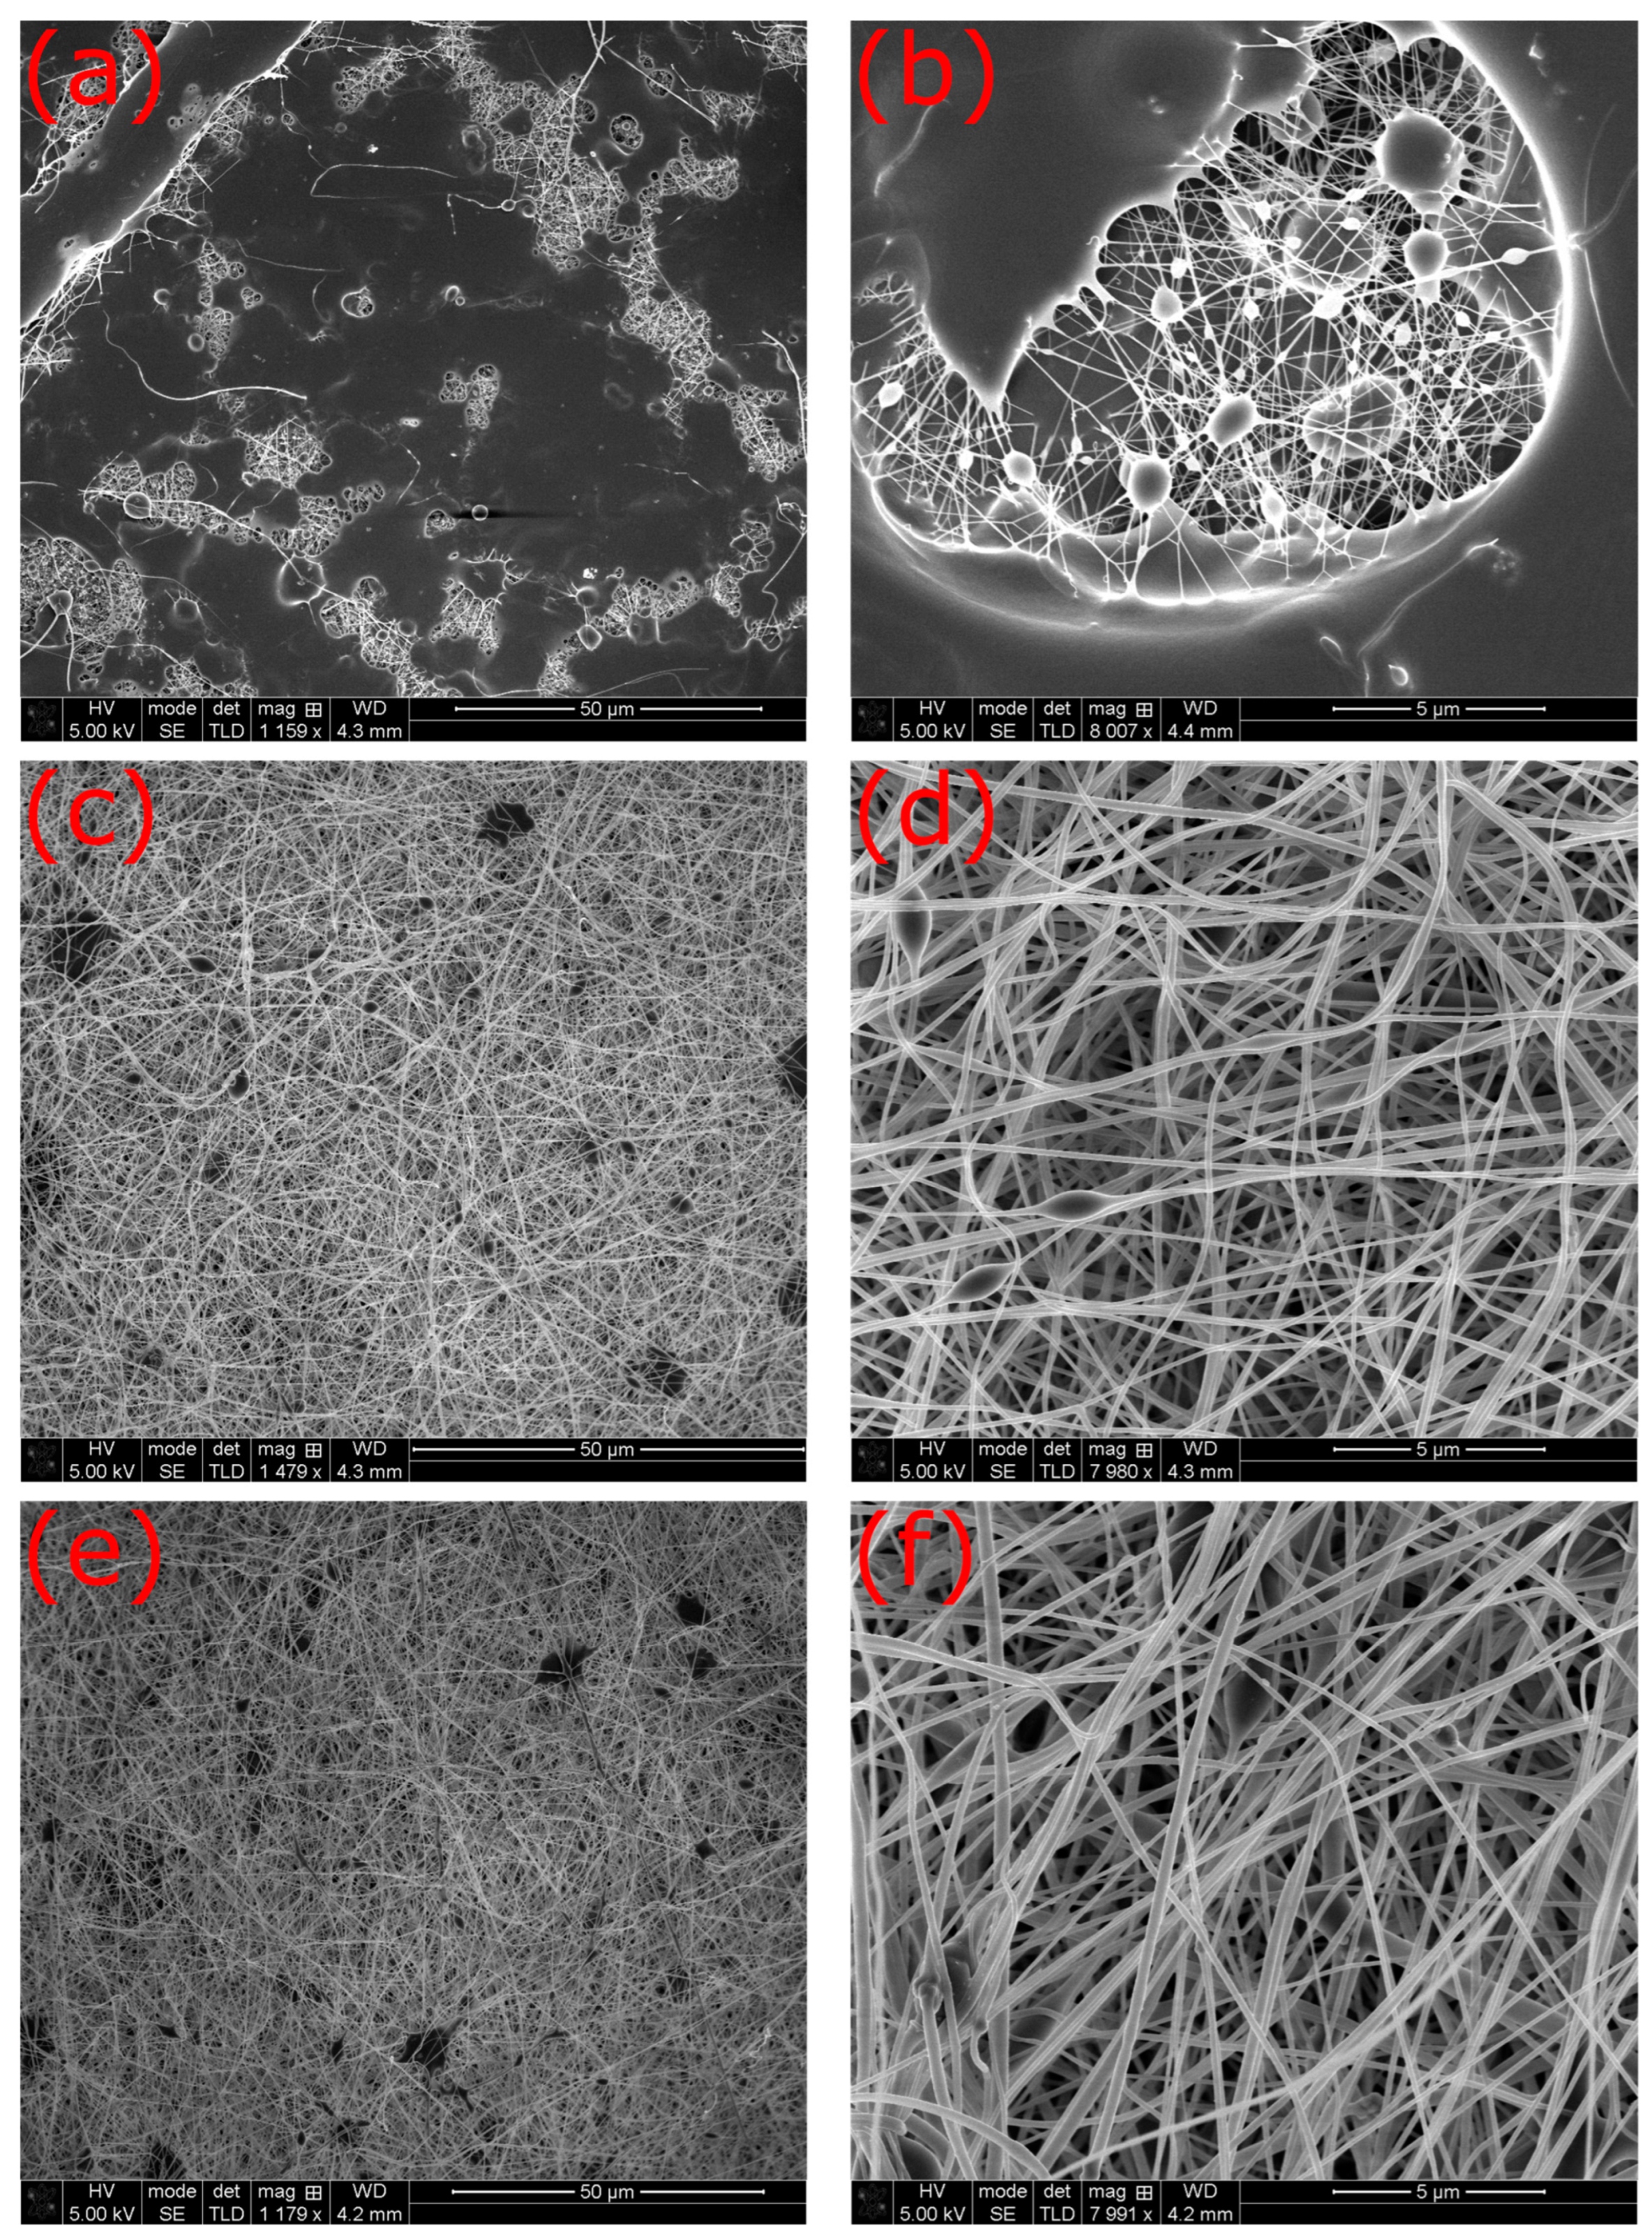
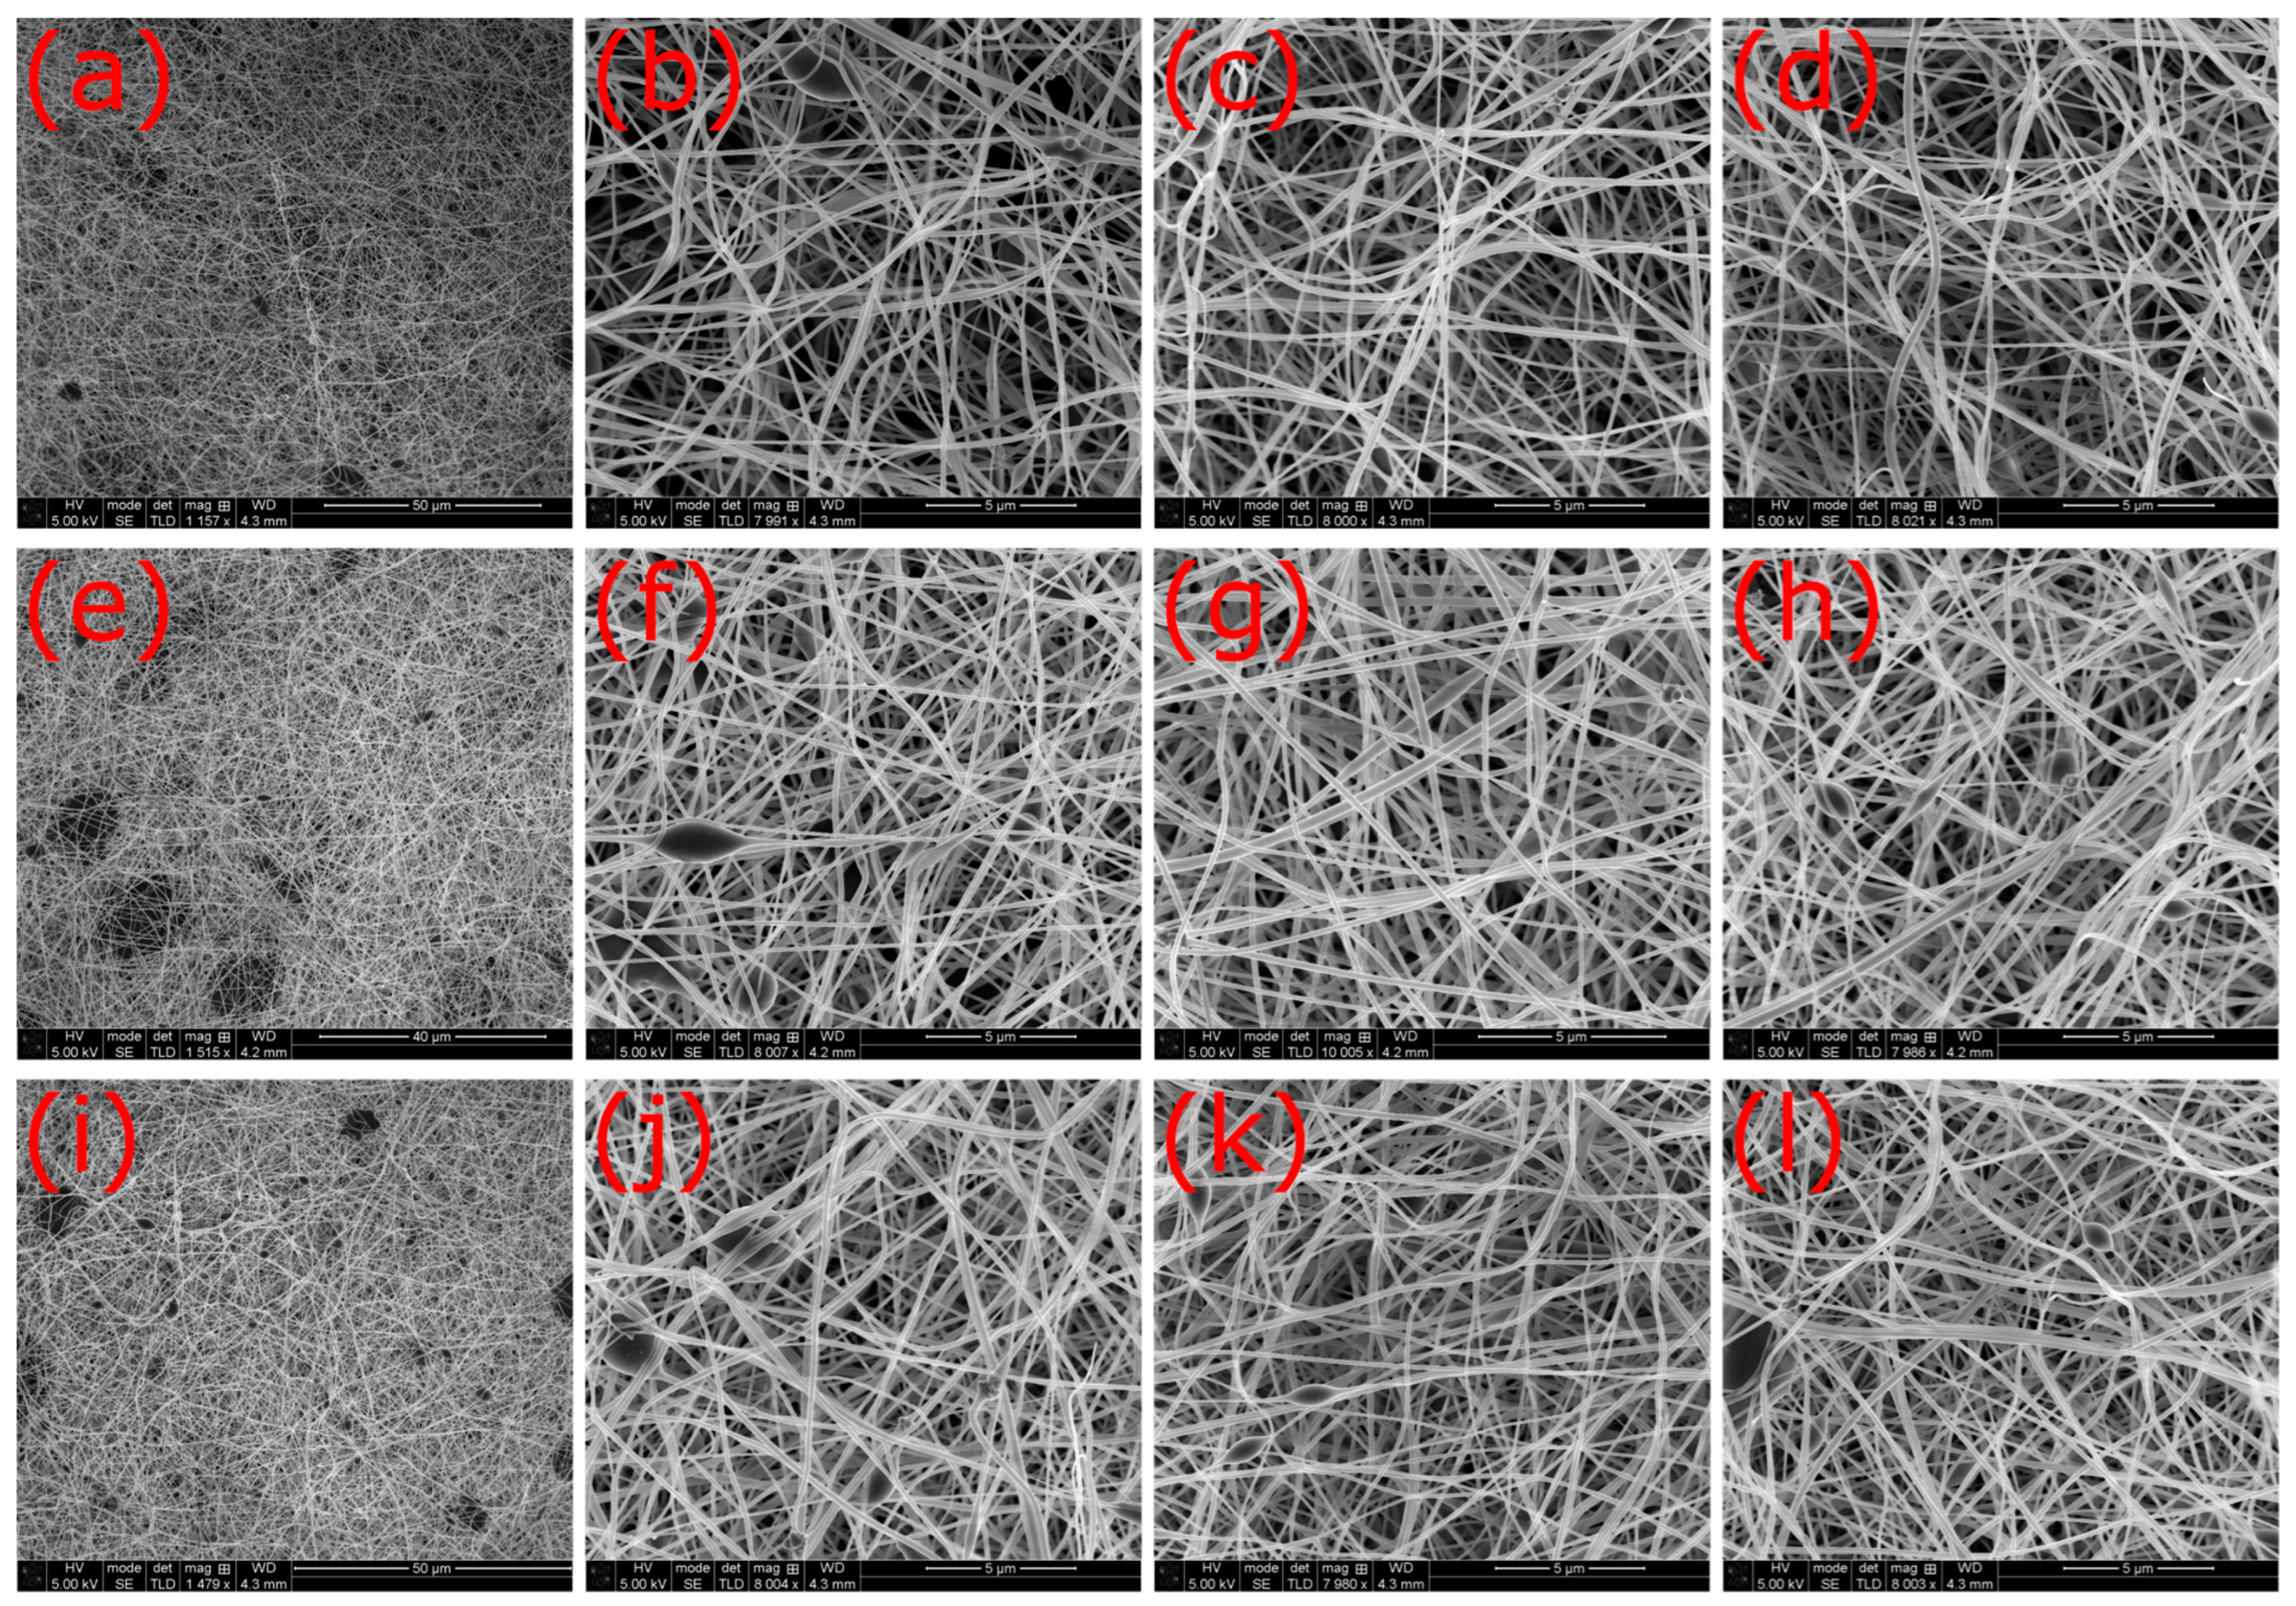
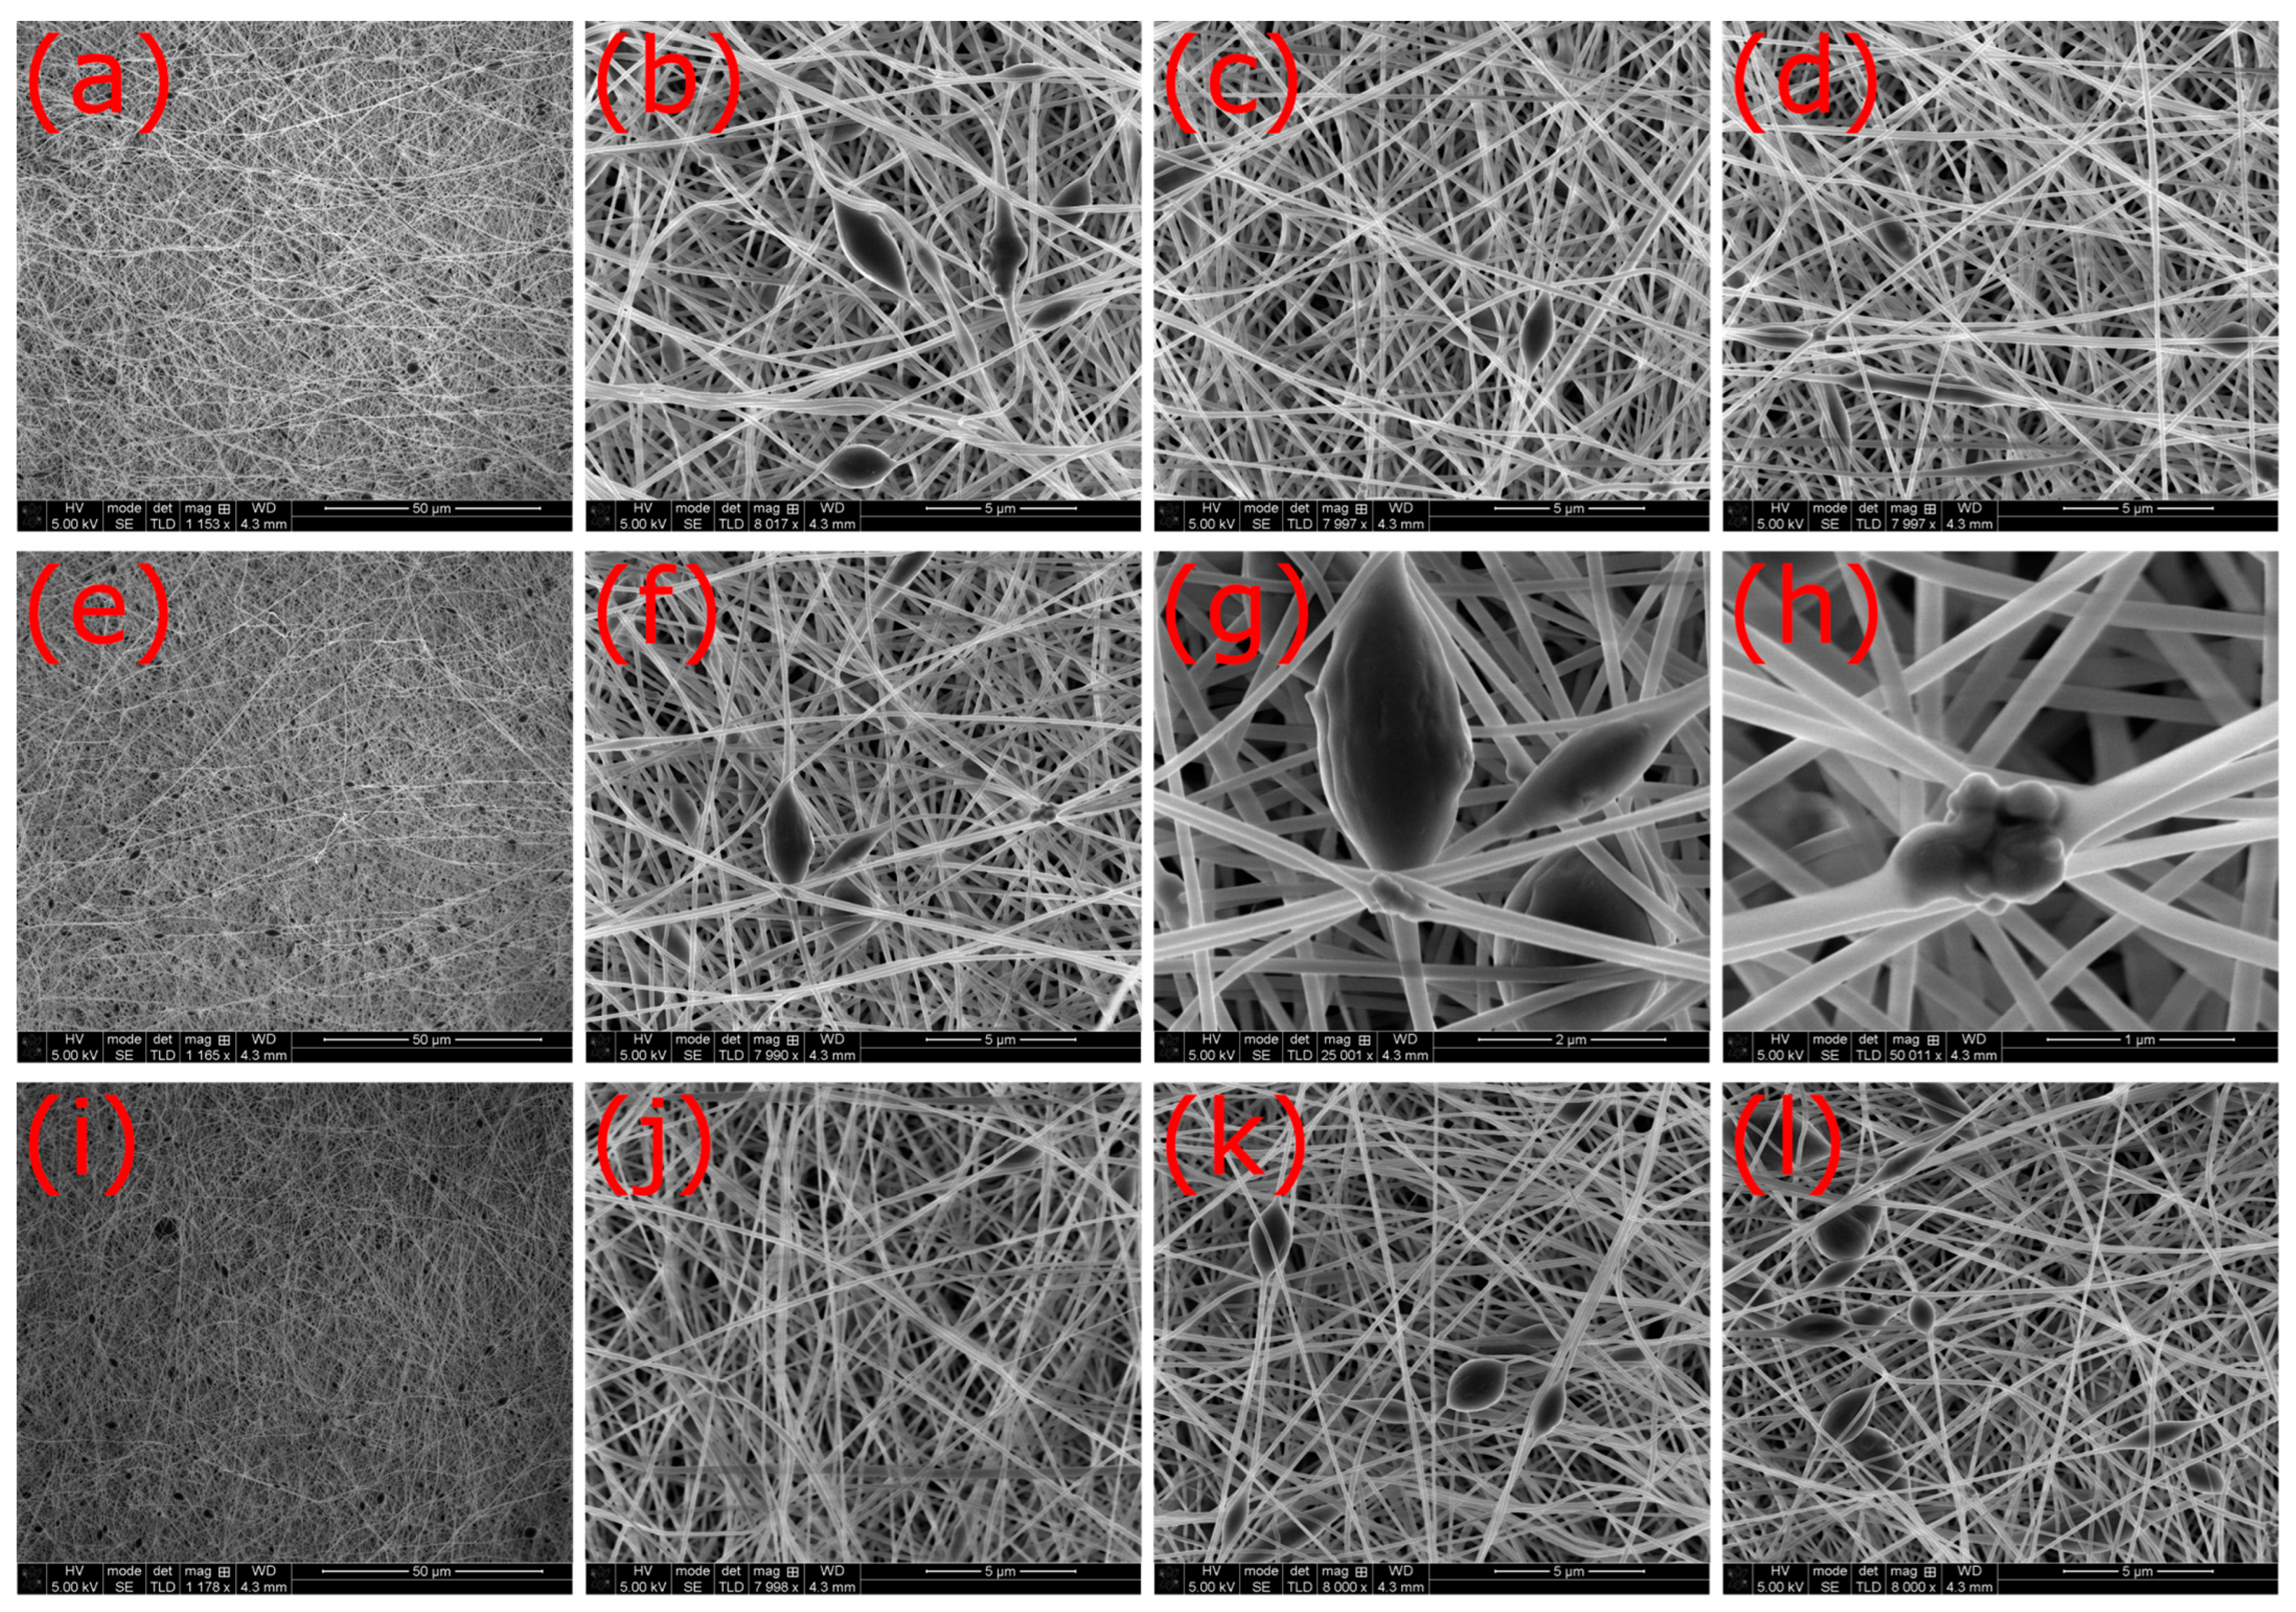
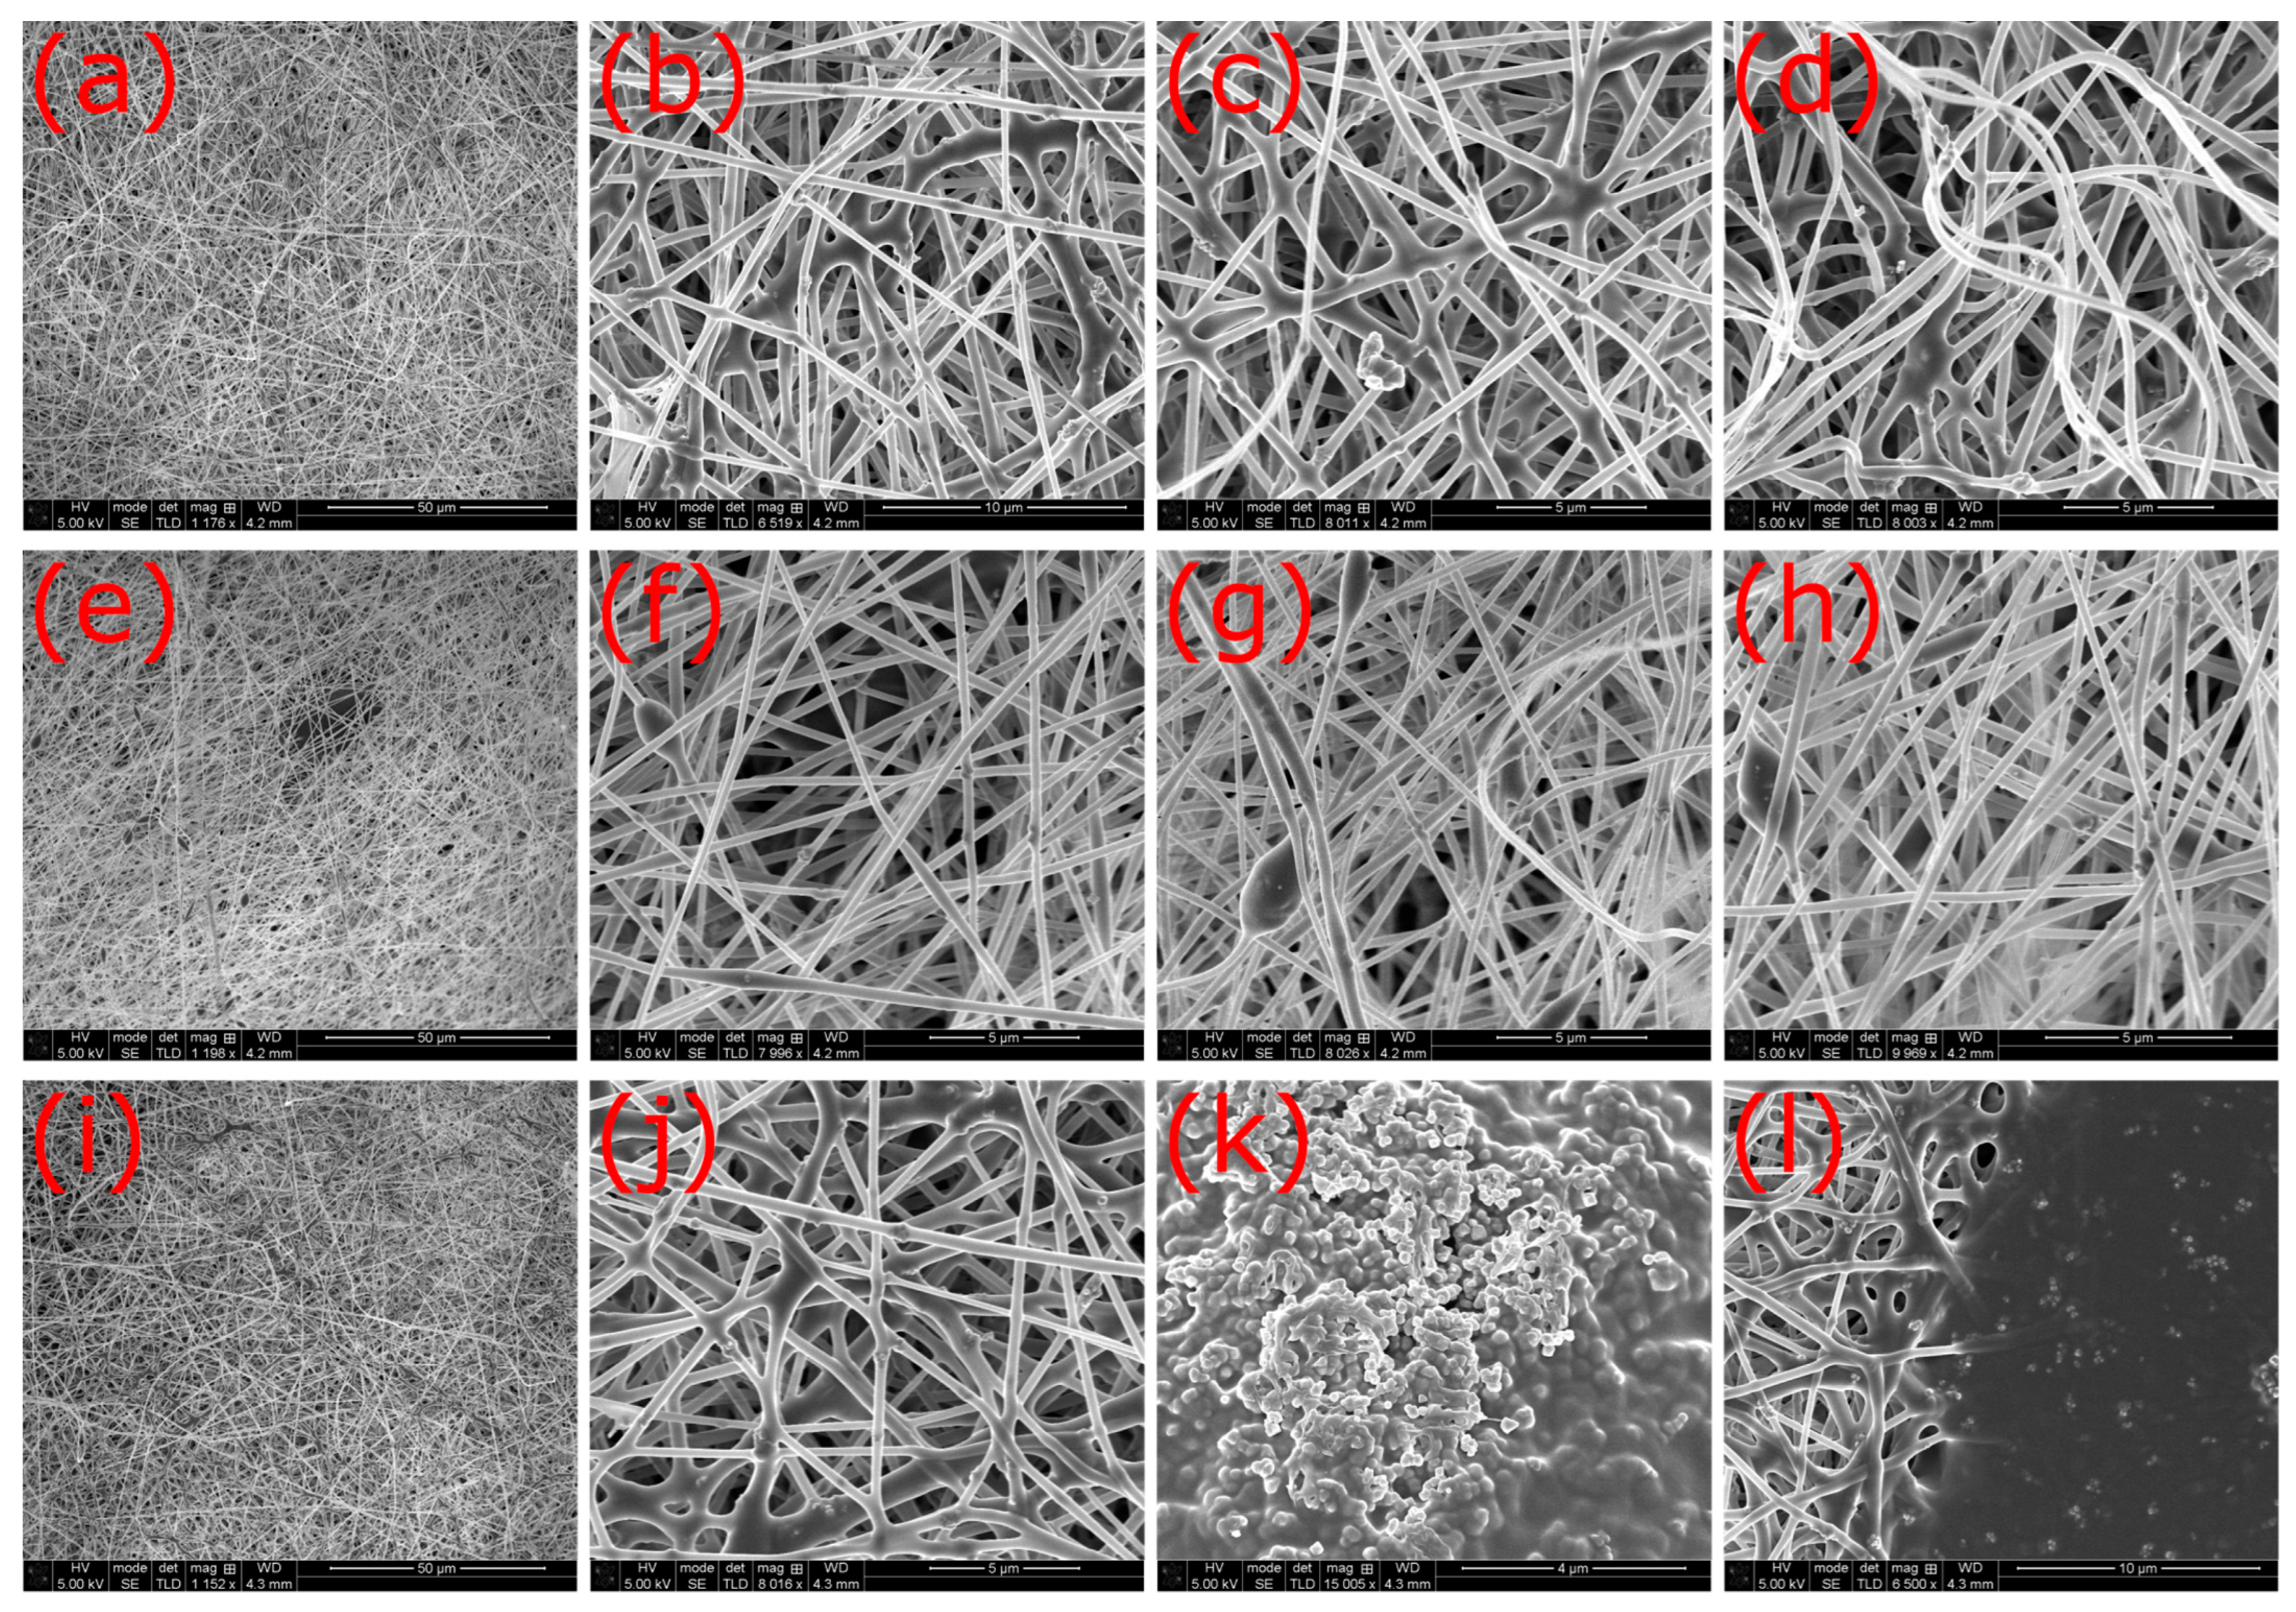
Figure 2 therefore shows SEM images of the various nanofiber mats investigated. For the sample with a solid content of only 15 wt.% in the solution (
Figure 2a,b), the SEM images confirm the conclusion of the macroscopic images and the look and feel of the electrospun product—obviously, most of the sample is indeed a membrane, and only parts show few nanofibers with large beads and without good connections. This spinning solution is obviously not well-suited to preparing proper nanofiber mats as it has a low viscosity, and the high amount of solvent does not evaporate quickly enough during spinning; thus no fibers are formed when the electrospun material reaches the substrate. In addition, the solvent DMSO, which is deposited on the substrate due to insufficient evaporation, even dissolves the previously positioned nanofibers and fuses them into a film. As a result, the nanofiber structure of the nanofiber mat is subsequently deteriorated even further.
The nanofiber mats prepared with spinning solutions containing 19 wt.% (
Figure 2c,d), 20 wt.% (
Figure 2e,f), and 21 wt.% solid contents (
Figure 2g,h), respectively, all show proper nanofiber mats with nanofibers of similar diameters. In the lower magnification SEM images (left panels), the mats prepared from solutions containing 19 wt.% and 20 wt.% solid contents show small dark areas with fewer fibers where membranes appear to have formed due to incomplete evaporation of the solvent. This is not the case for the nanofiber mat prepared with 21 wt.% solid content in the solution, as the other SEM images (cf.
Appendix A) also indicate.
The nanofiber mat spun from the solution with 25 wt.% solid content (
Figure 2i,j) does not exhibit membranous areas, either, which was expected due to the lower amount of solvent that must evaporate from the polymer-coated wire electrode on its way to the substrate, but the nanofibers have obviously higher diameters than those spun with 19–21 wt.% solid contents.
Comparing the results from the macroscopic photographs (
Figure 1) and the microscopic SEM images (
Figure 2), both show that a solid content of 21 wt.% is optimal for wire-based electrospinning with the PAN:magnetite ratio of 2:1 selected here.
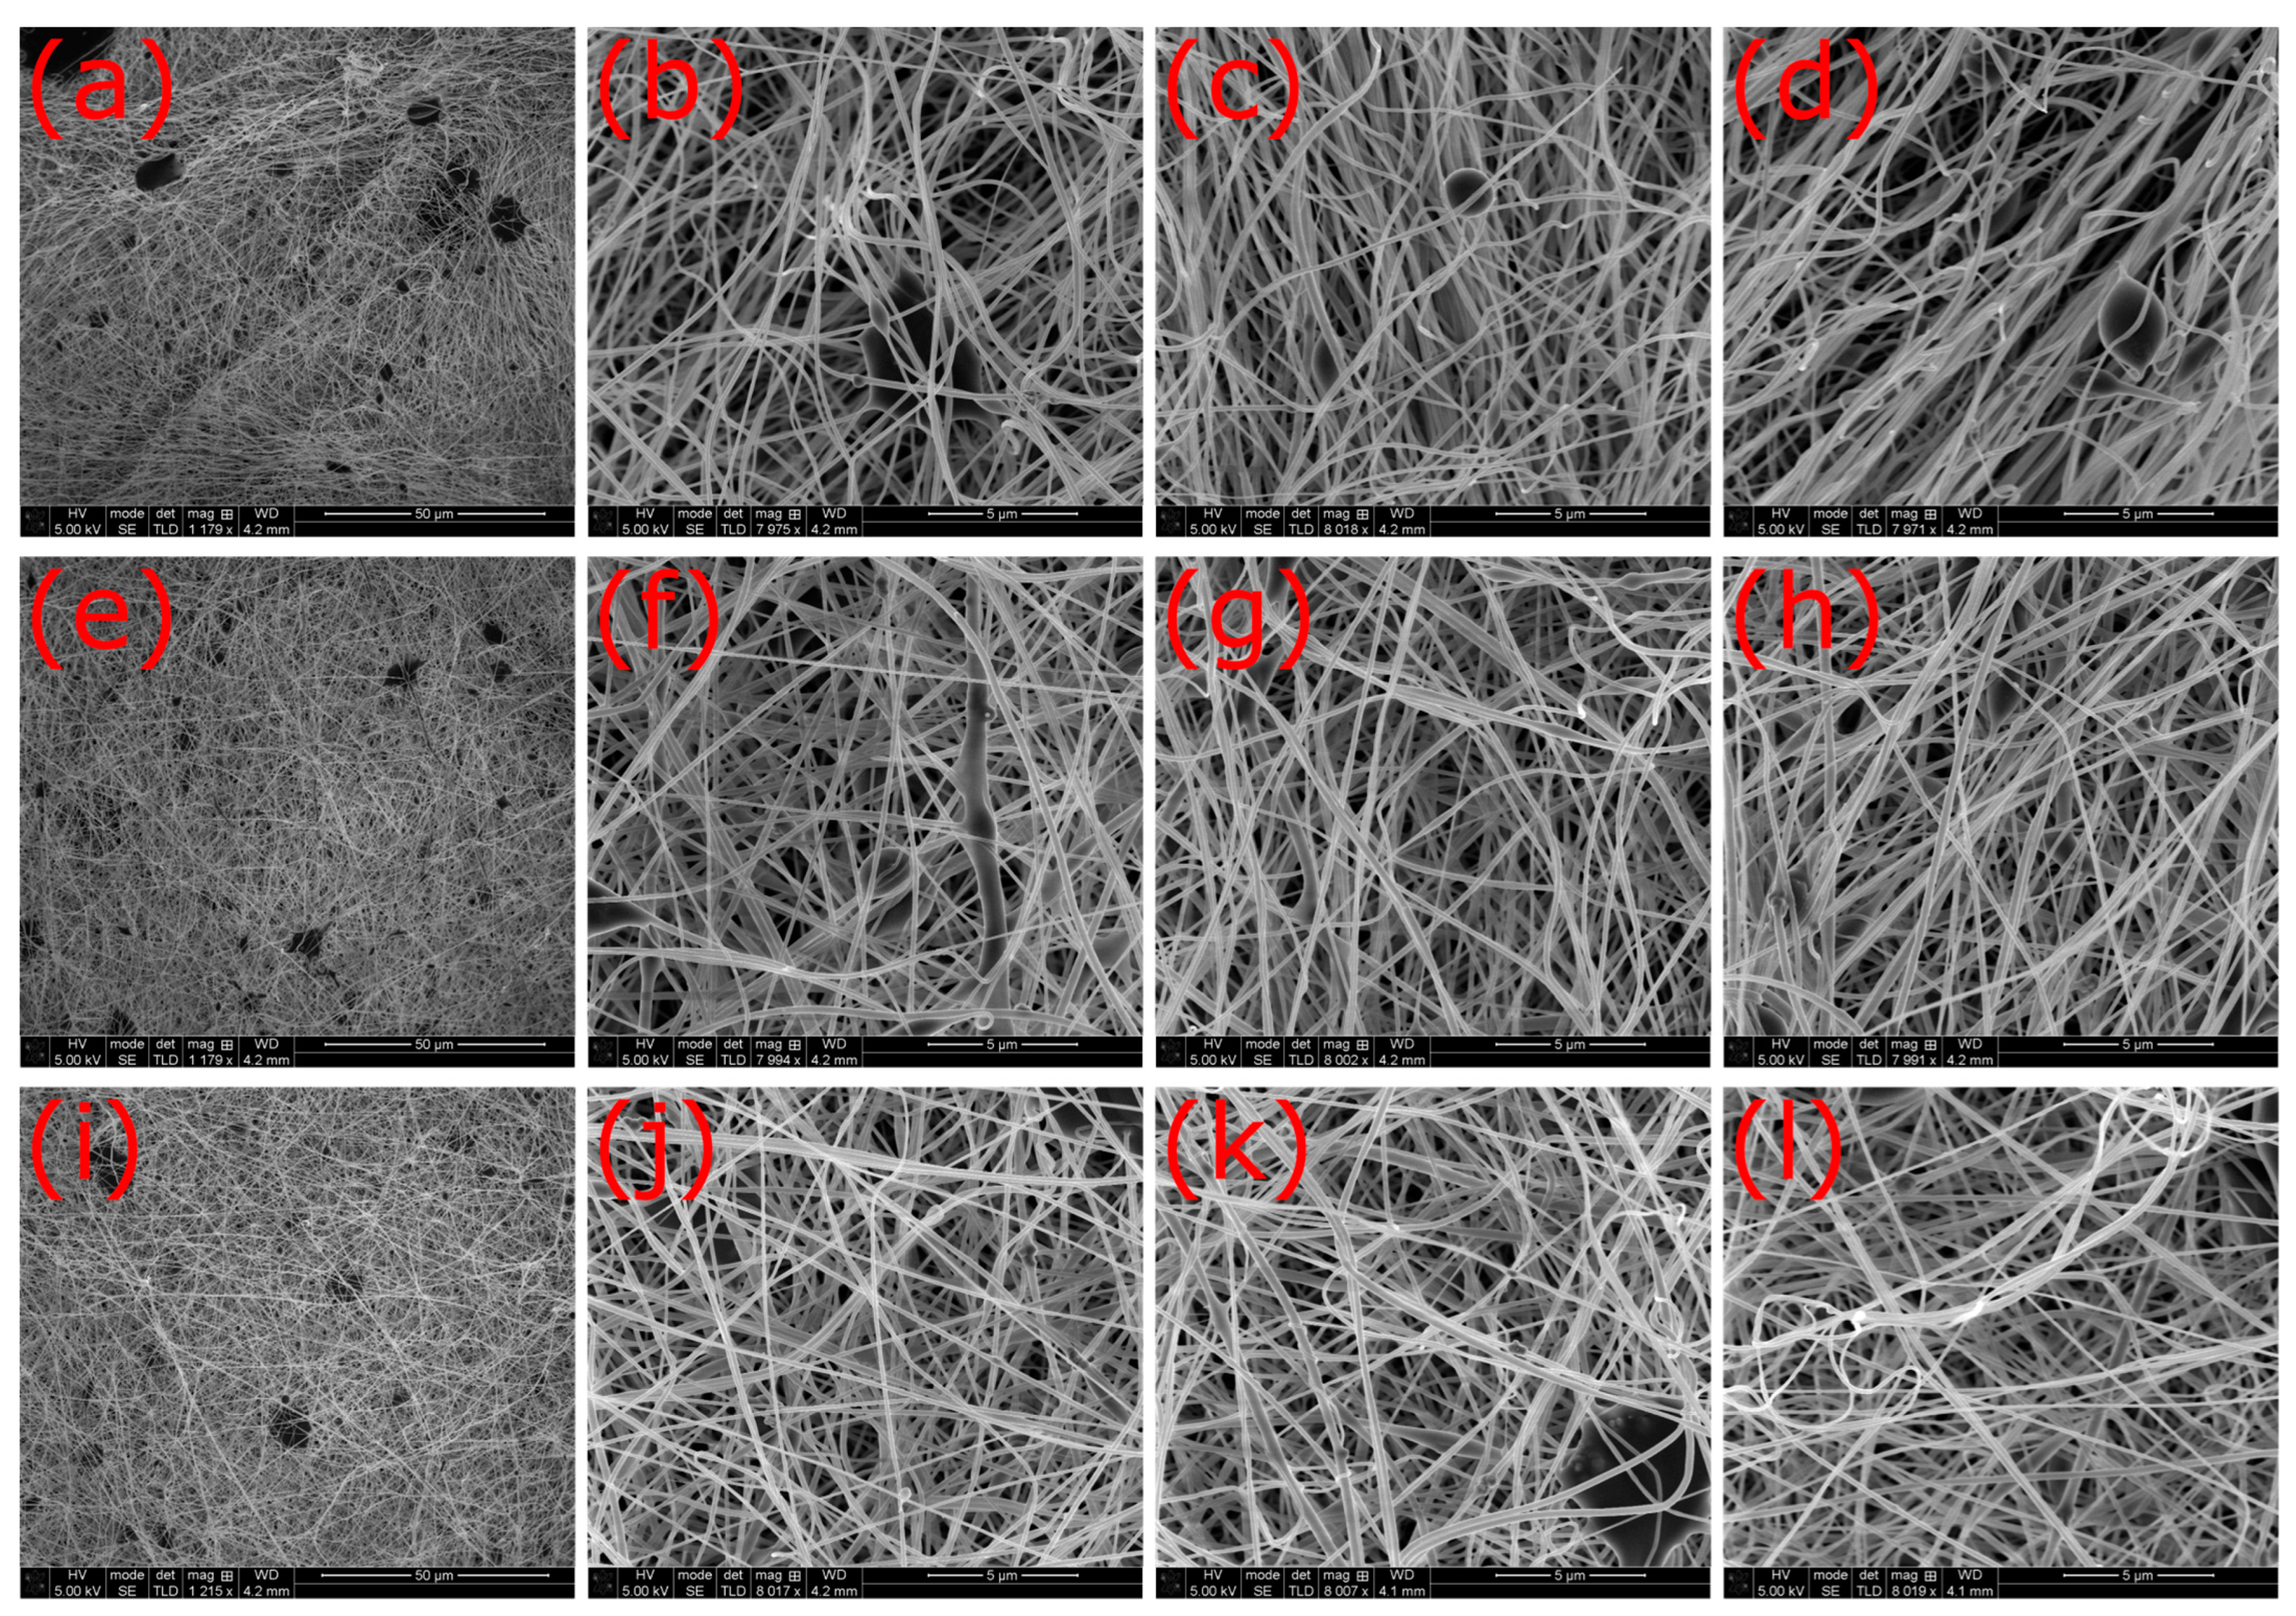
To quantitatively investigate the fiber diameters, three SEM images per sample were examined (as shown in
Appendix A, using the high-magnification images in
Figure A1,
Figure A2,
Figure A3,
Figure A4 and
Figure A5).
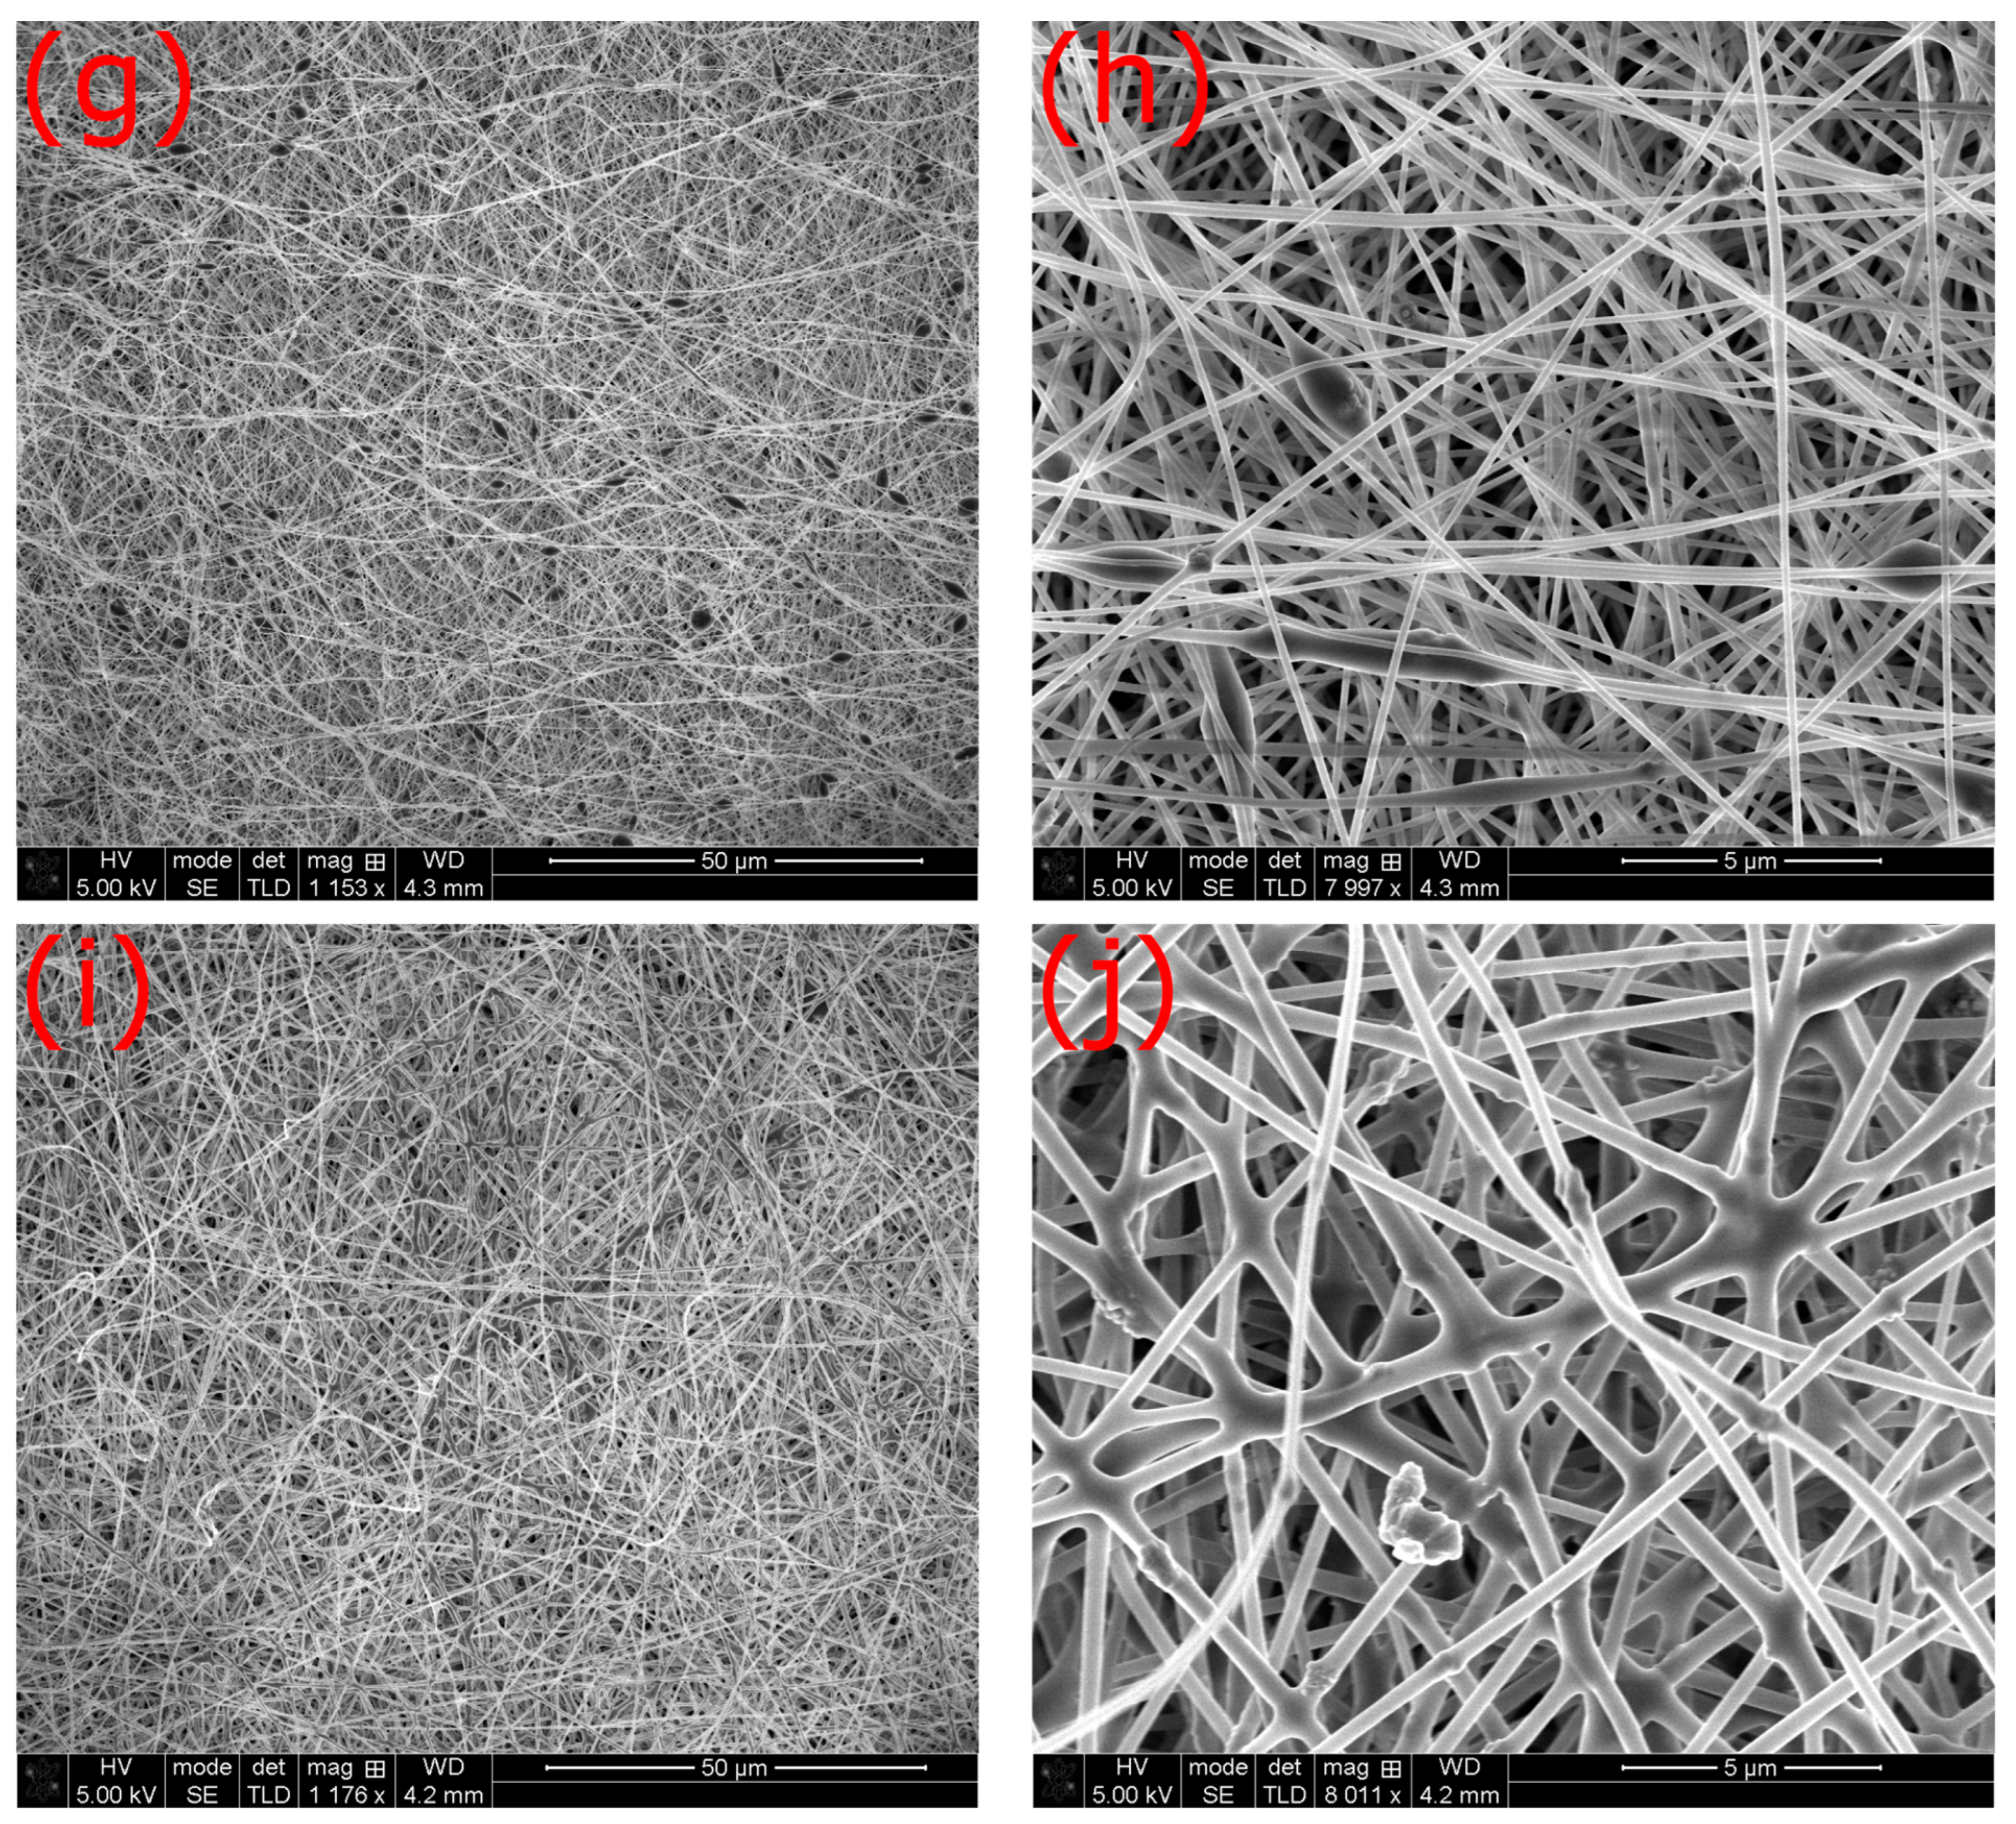
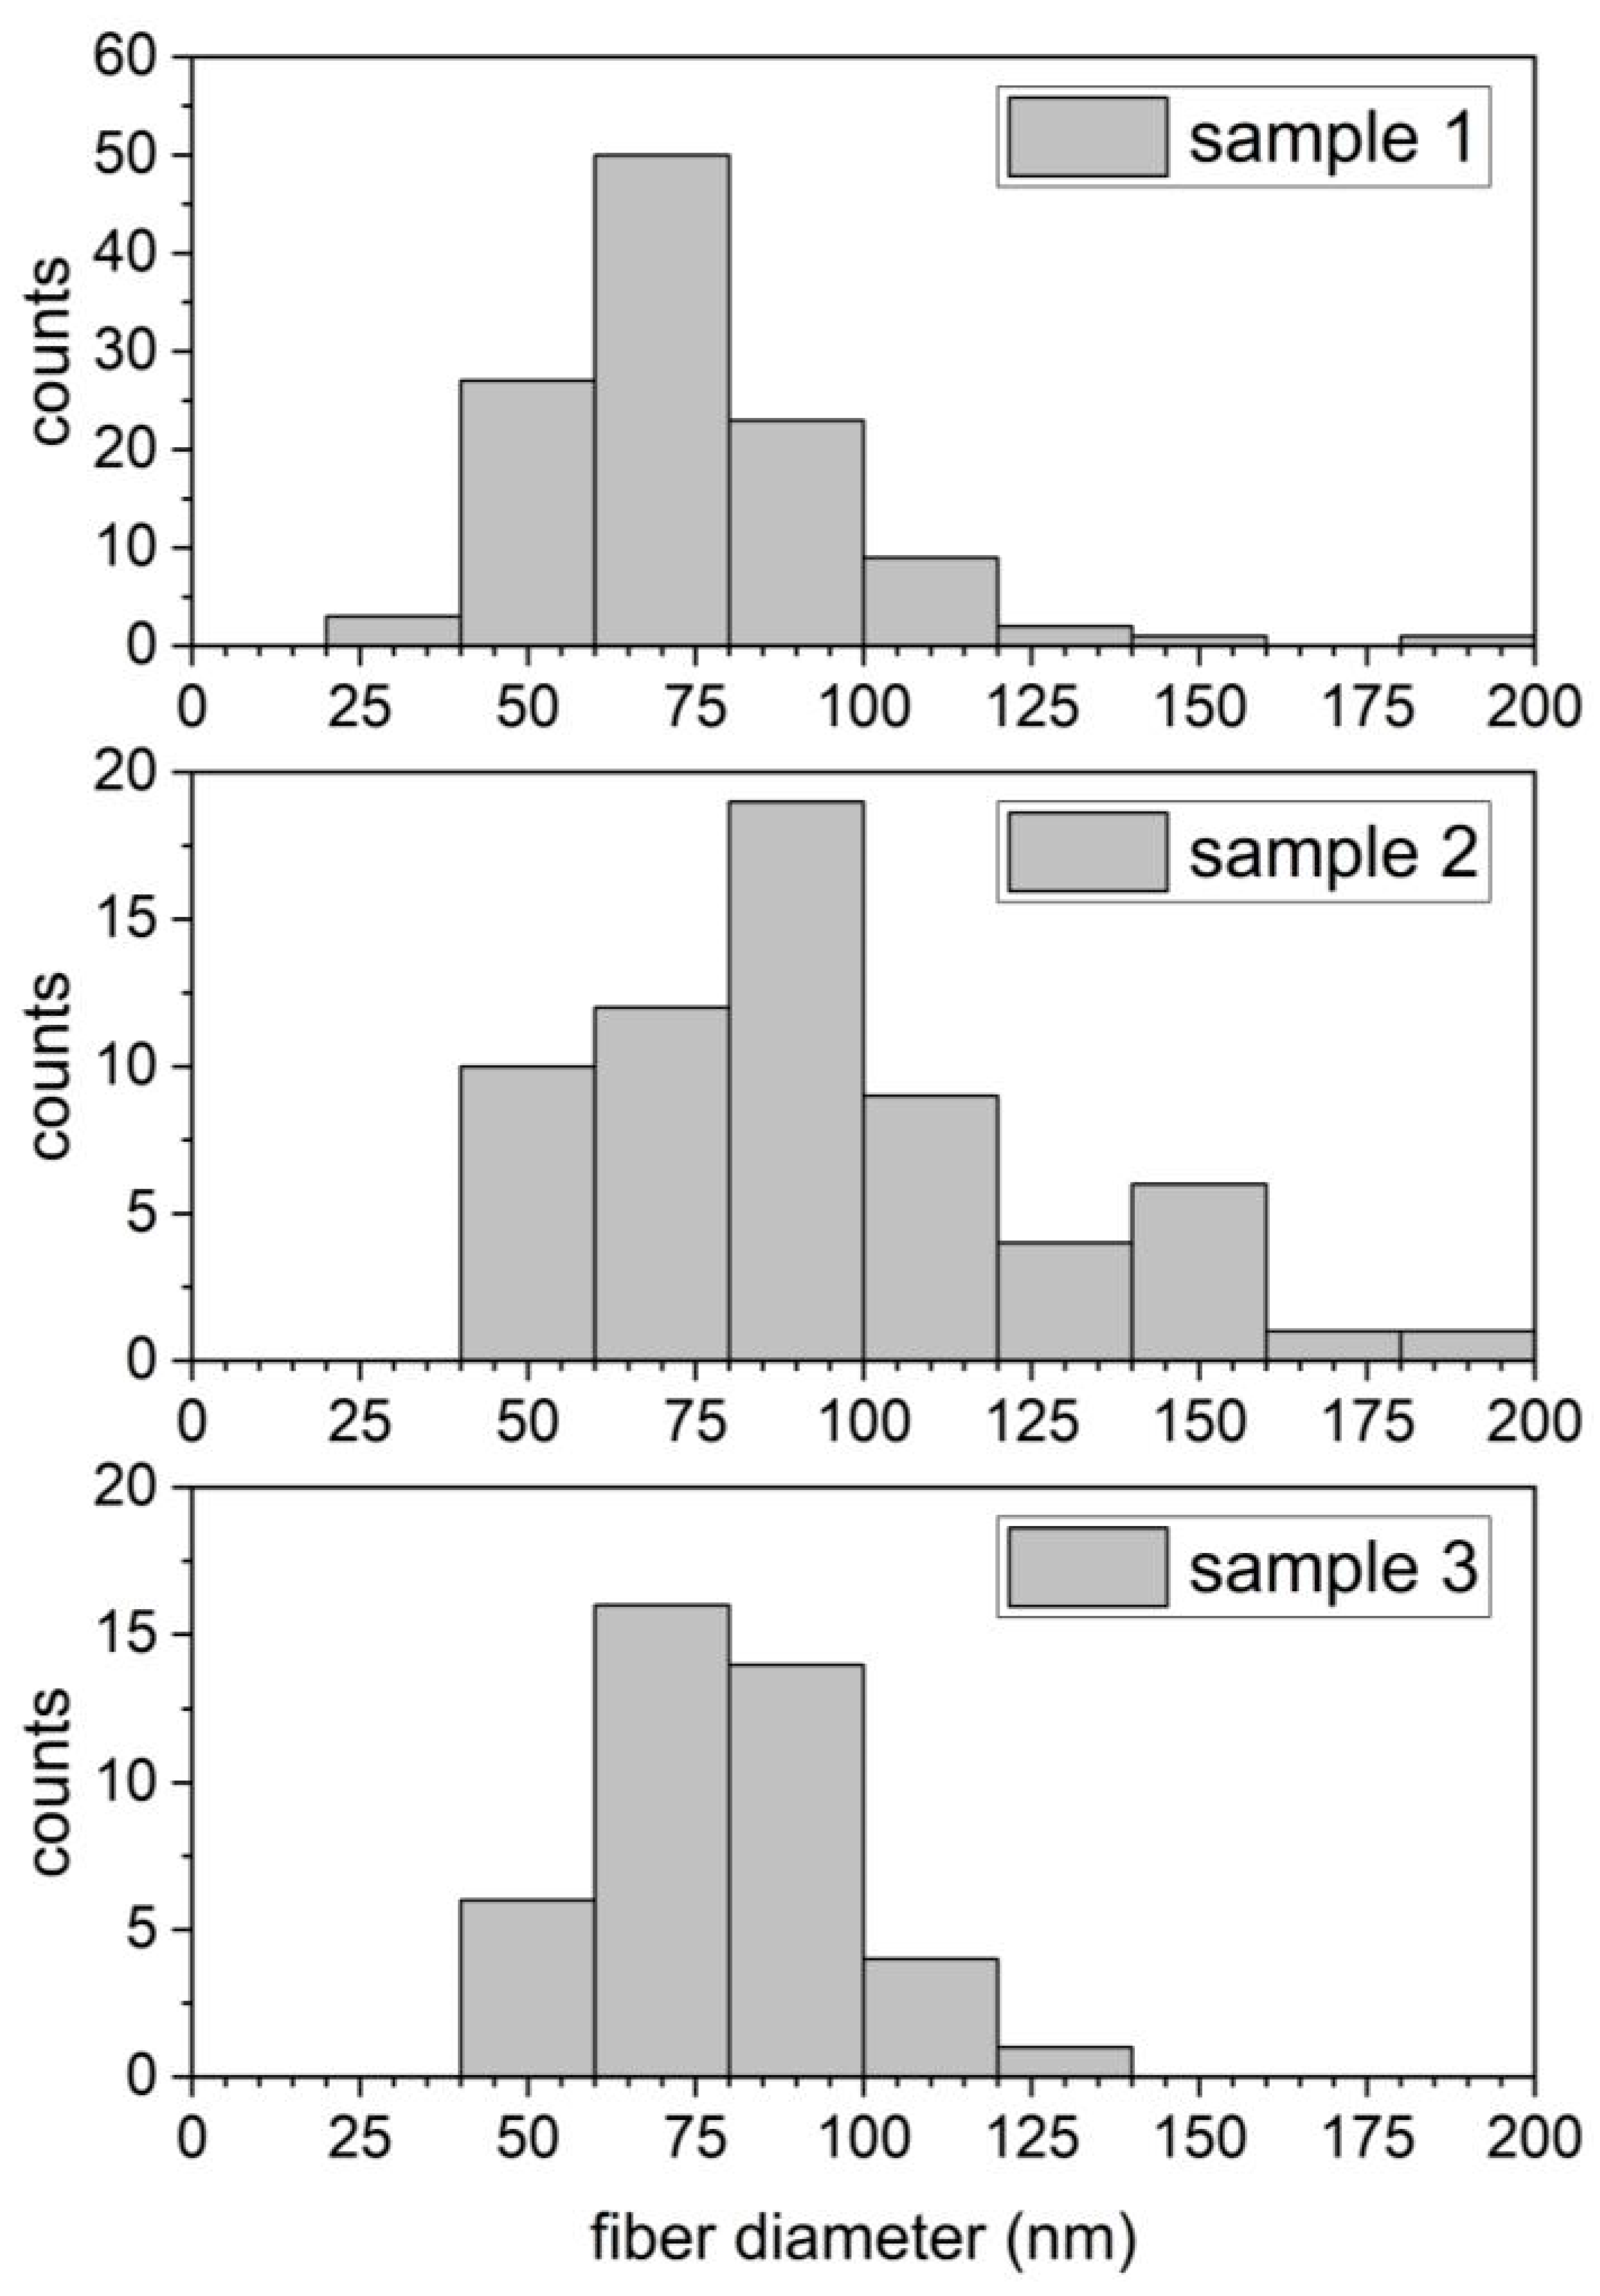
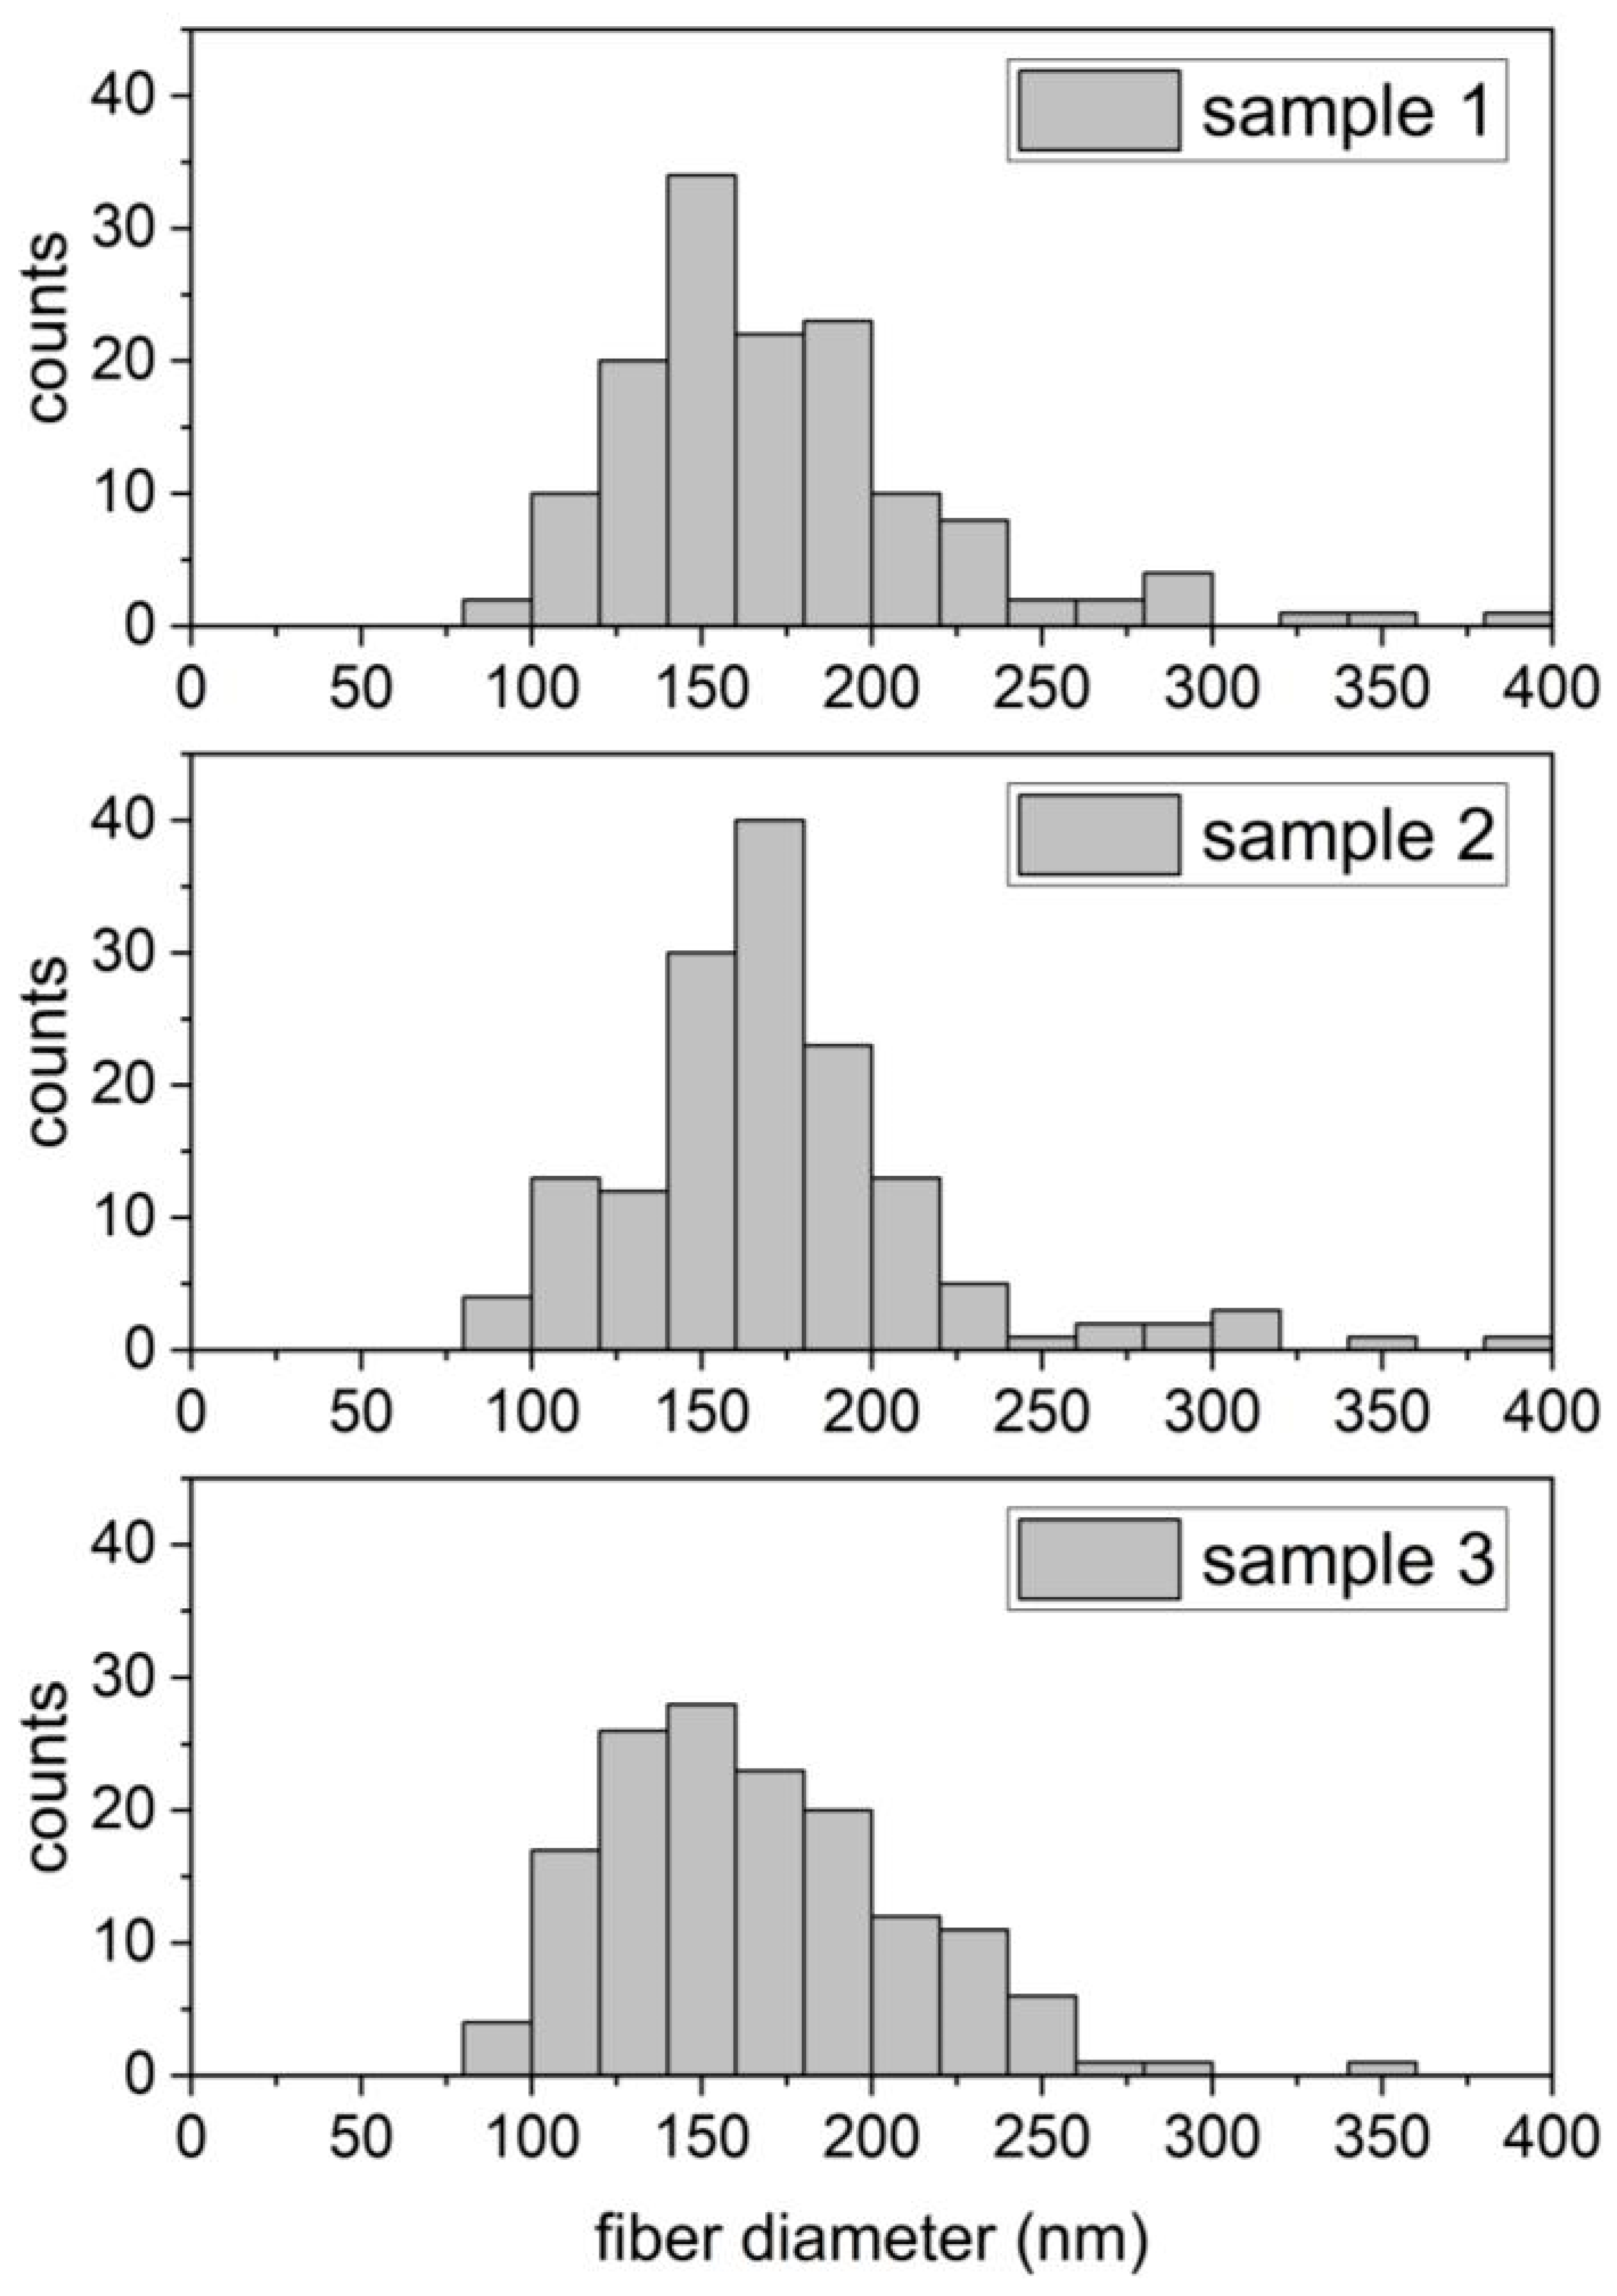
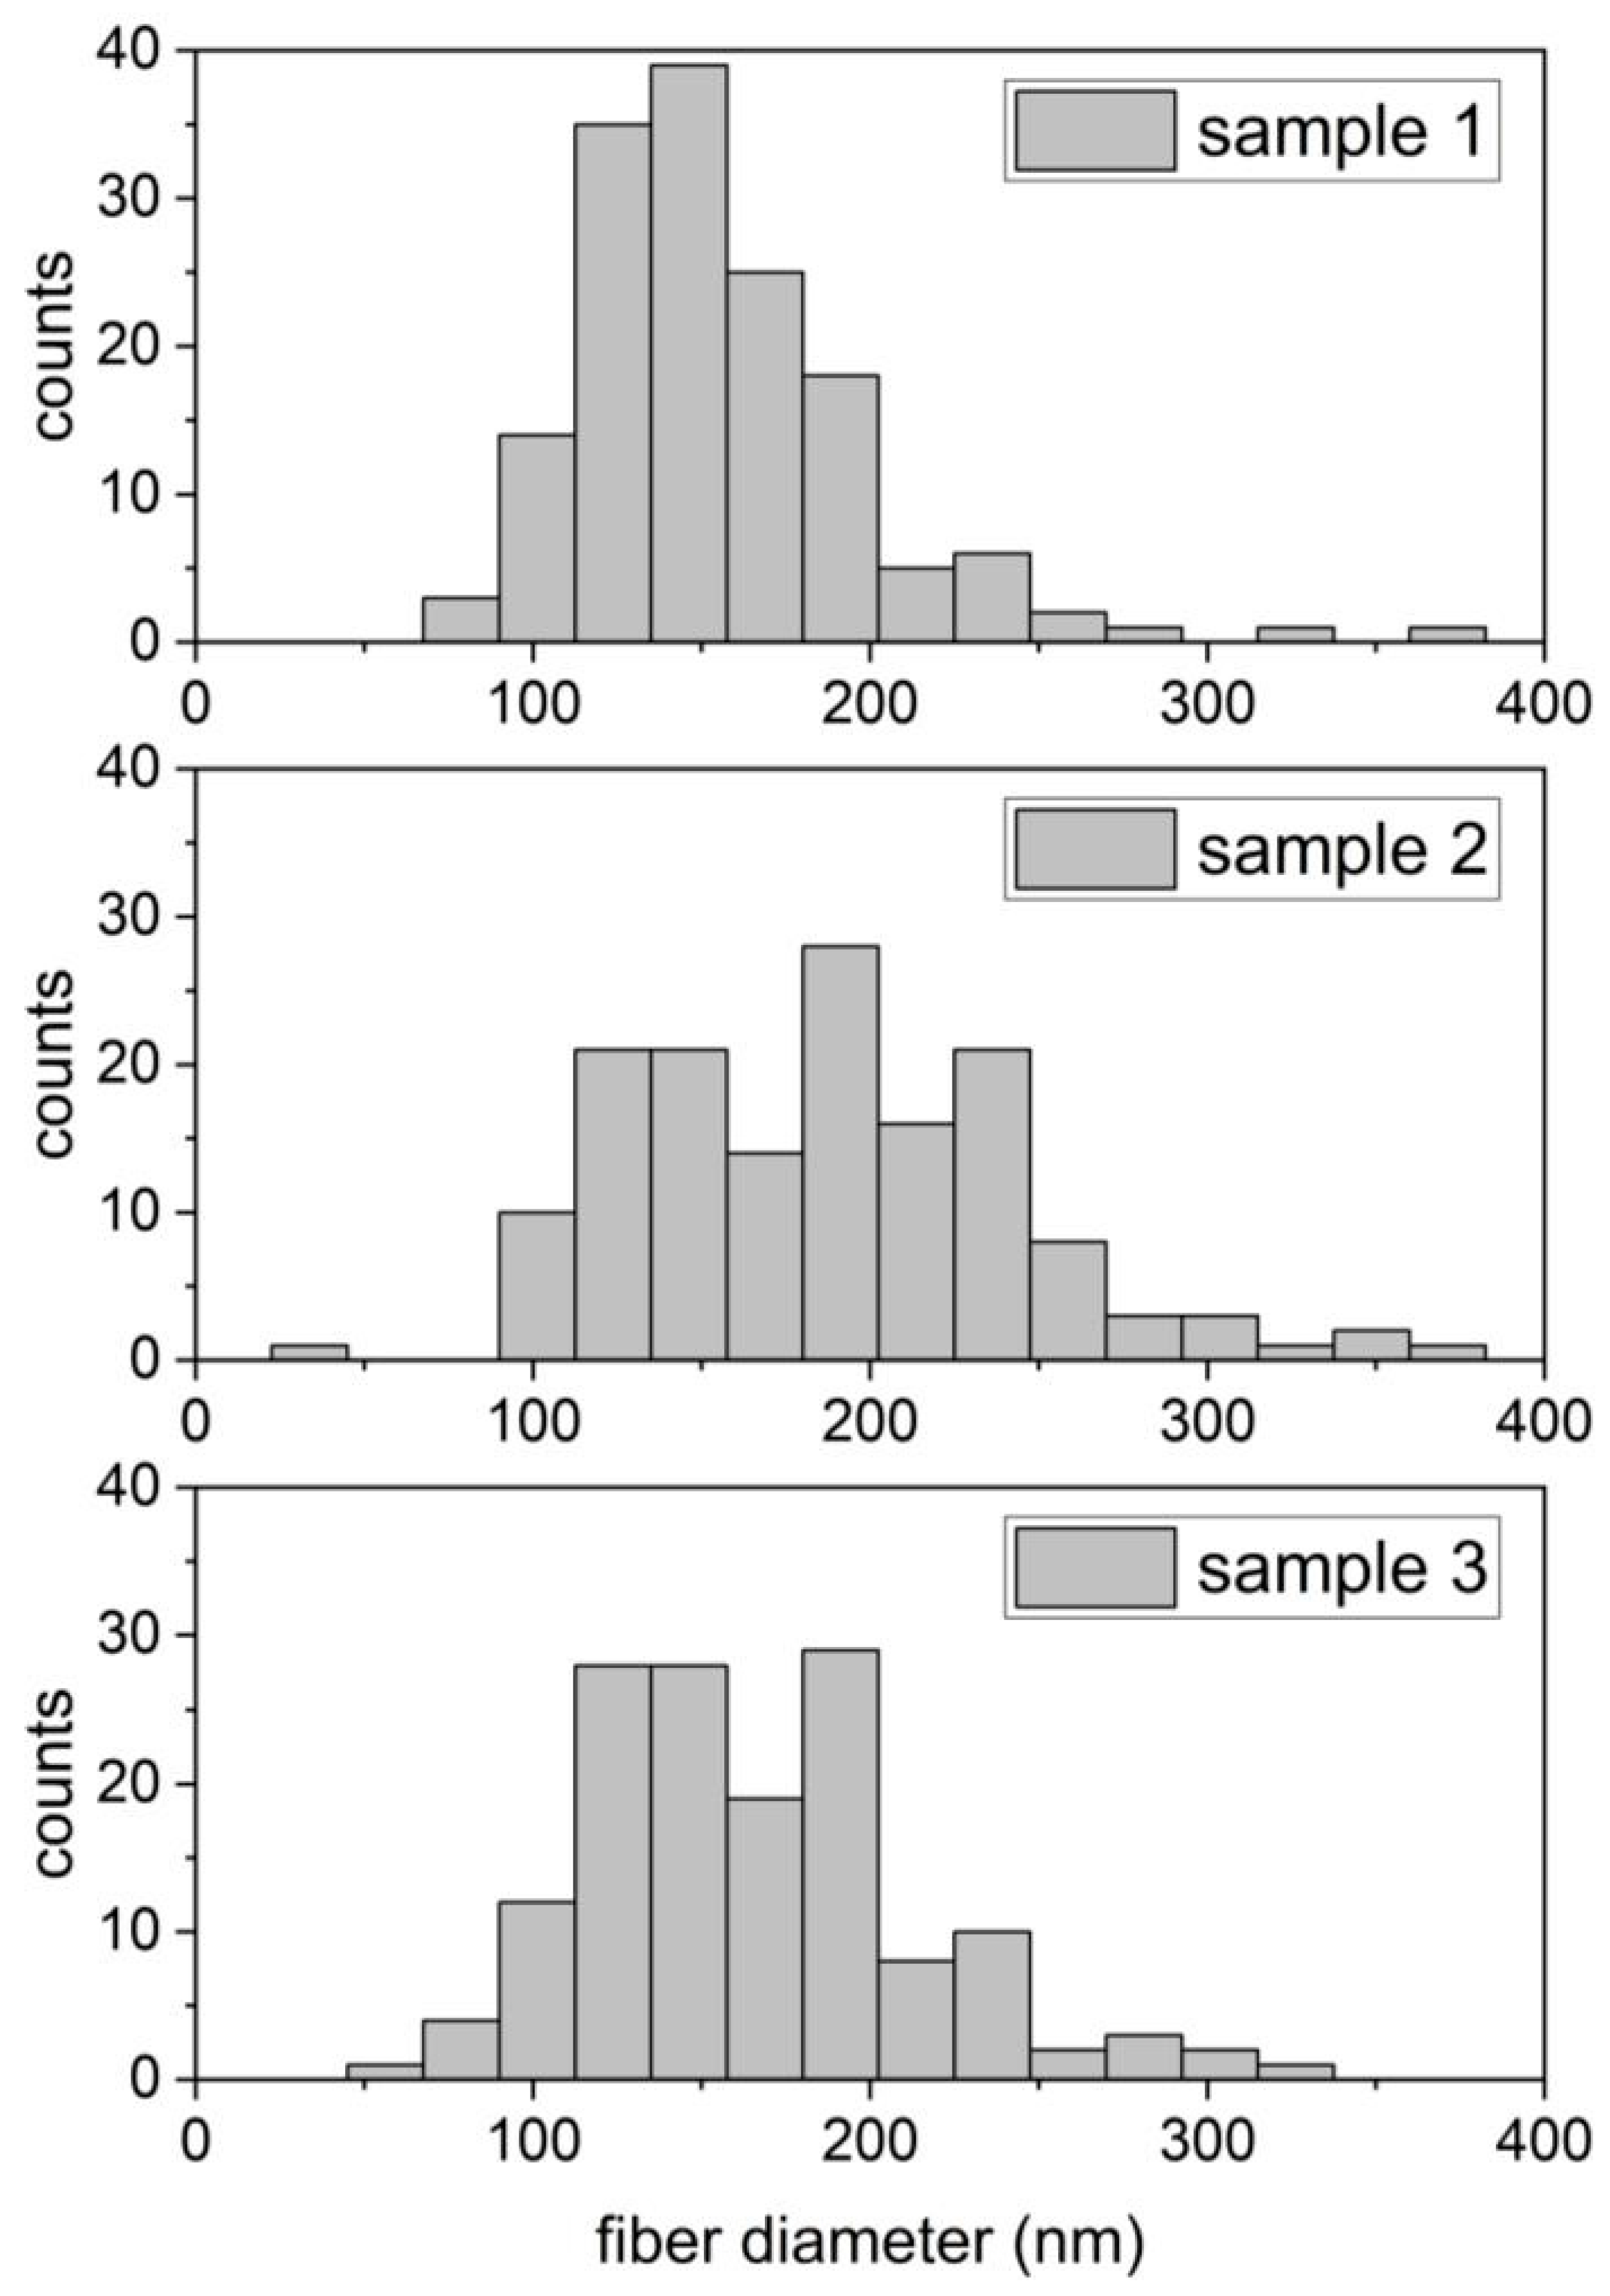
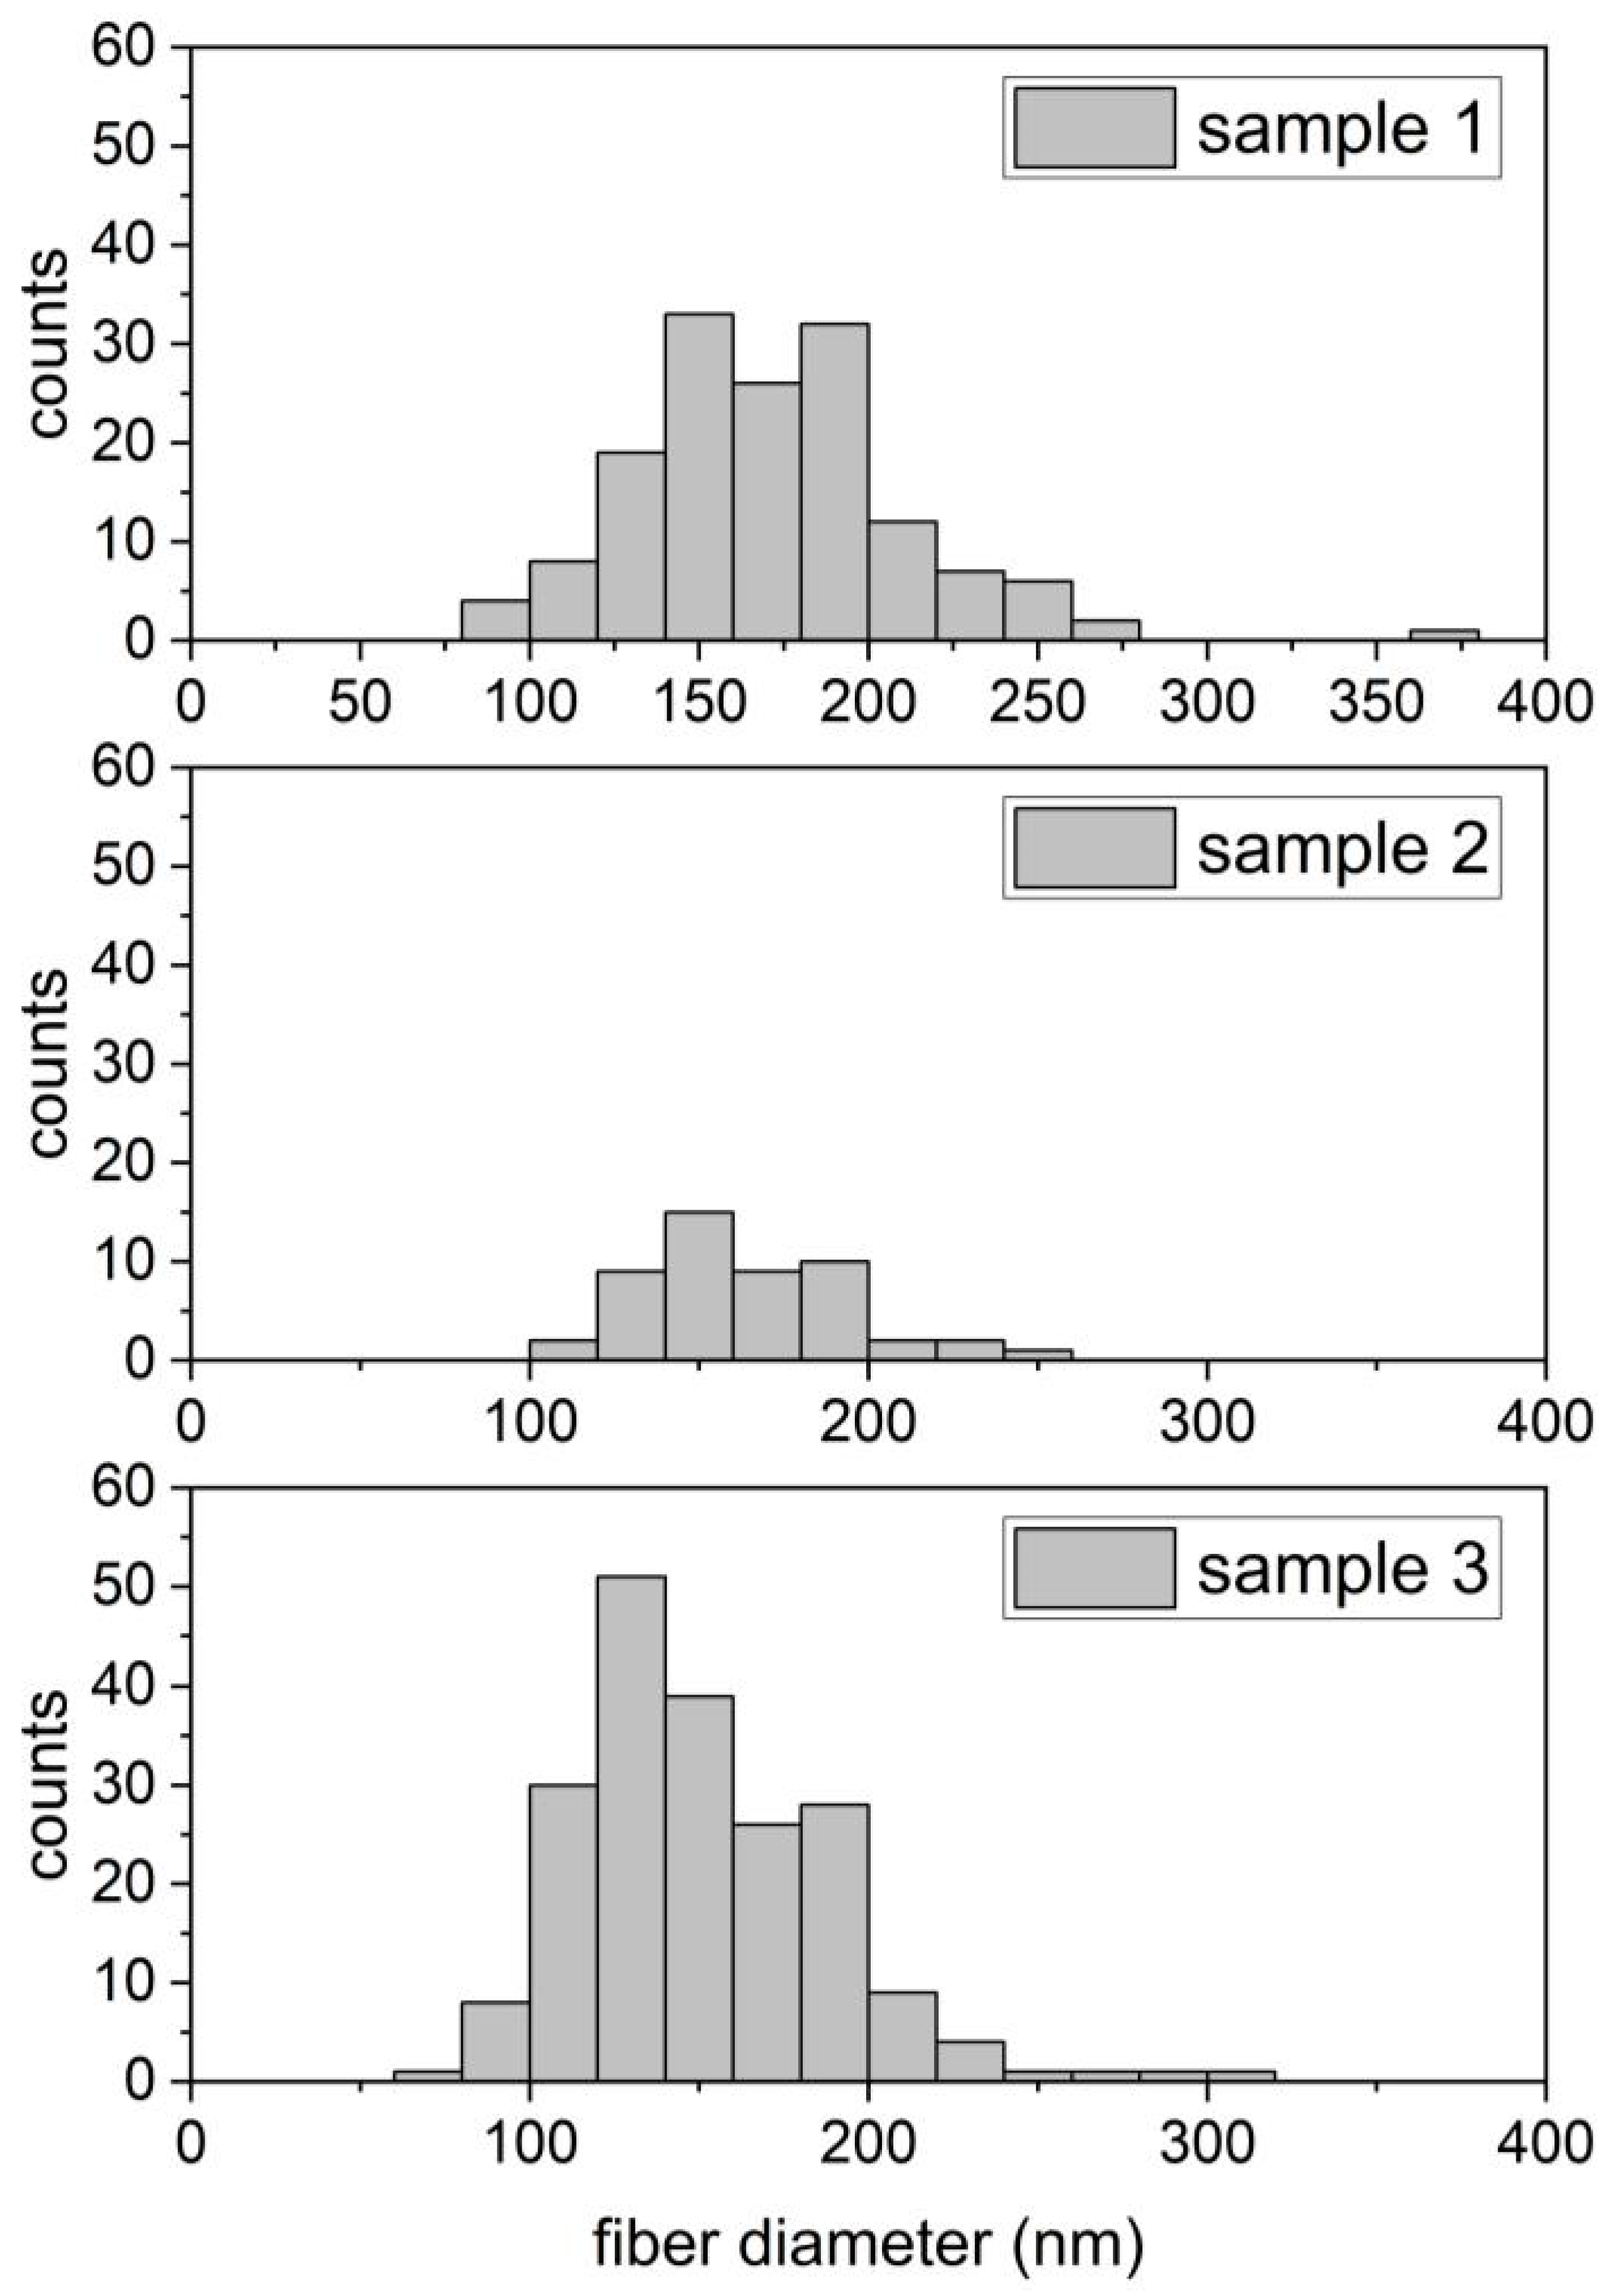
Figure 3 shows the histograms averaged over all SEM images per sample; for a comparison of SEM images taken at different positions on a sample, the detailed histograms for all single SEM images can be found in
Appendix B (
Figure A6,
Figure A7 and
Figure A8). The average fiber diameters were (81 ± 27) nm (for 15 wt.% solid content), (170 ± 47) nm (for 19 wt.% solid content), (171 ± 56) nm (for 20 wt.% solid content), (160 ± 39) nm (for 21 wt.% solid content), and (347 ± 89) nm (for 25 wt.% solid content), respectively.
The general trend that higher solid contents lead to larger diameters has already been described in the scientific literature for pure PAN nanofiber mats [
26,
27]. Furthermore, the smallest standard deviation, i.e., the narrowest distribution, is visible here for the samples prepared from the 21 wt.% solid content, which again indicates that this spinning solution is optimal for the selected material mixture. In contrast, the nanofiber mat spun from the solution with 25 wt.% solid content shows a very broad distribution of fiber diameters, associated with an approximately doubled diameter in comparison with the membranes spun from solutions with 19–21 wt.% solid contents.
It should be mentioned that for all samples, the minimum fiber diameter is well defined, while some thicker fibers are visible, elongating the histogram to the right side. Mathematically, this means that the skew of these distributions is positive. Skew is a measure of the asymmetry of a distribution, with positive values corresponding to more values to the right of the maximum, as seen here (especially in the case of the 19 wt.% solid content in
Figure 3), while a negative skew describes more values to the left of the maximum. For our study, this means that a few thicker nanofibers are present in the nanofiber mats with the best fiber morphologies (i.e., spun from solutions with 19–21 wt.% solid content), but no very thin nanofibers with diameters well below the average can be found.
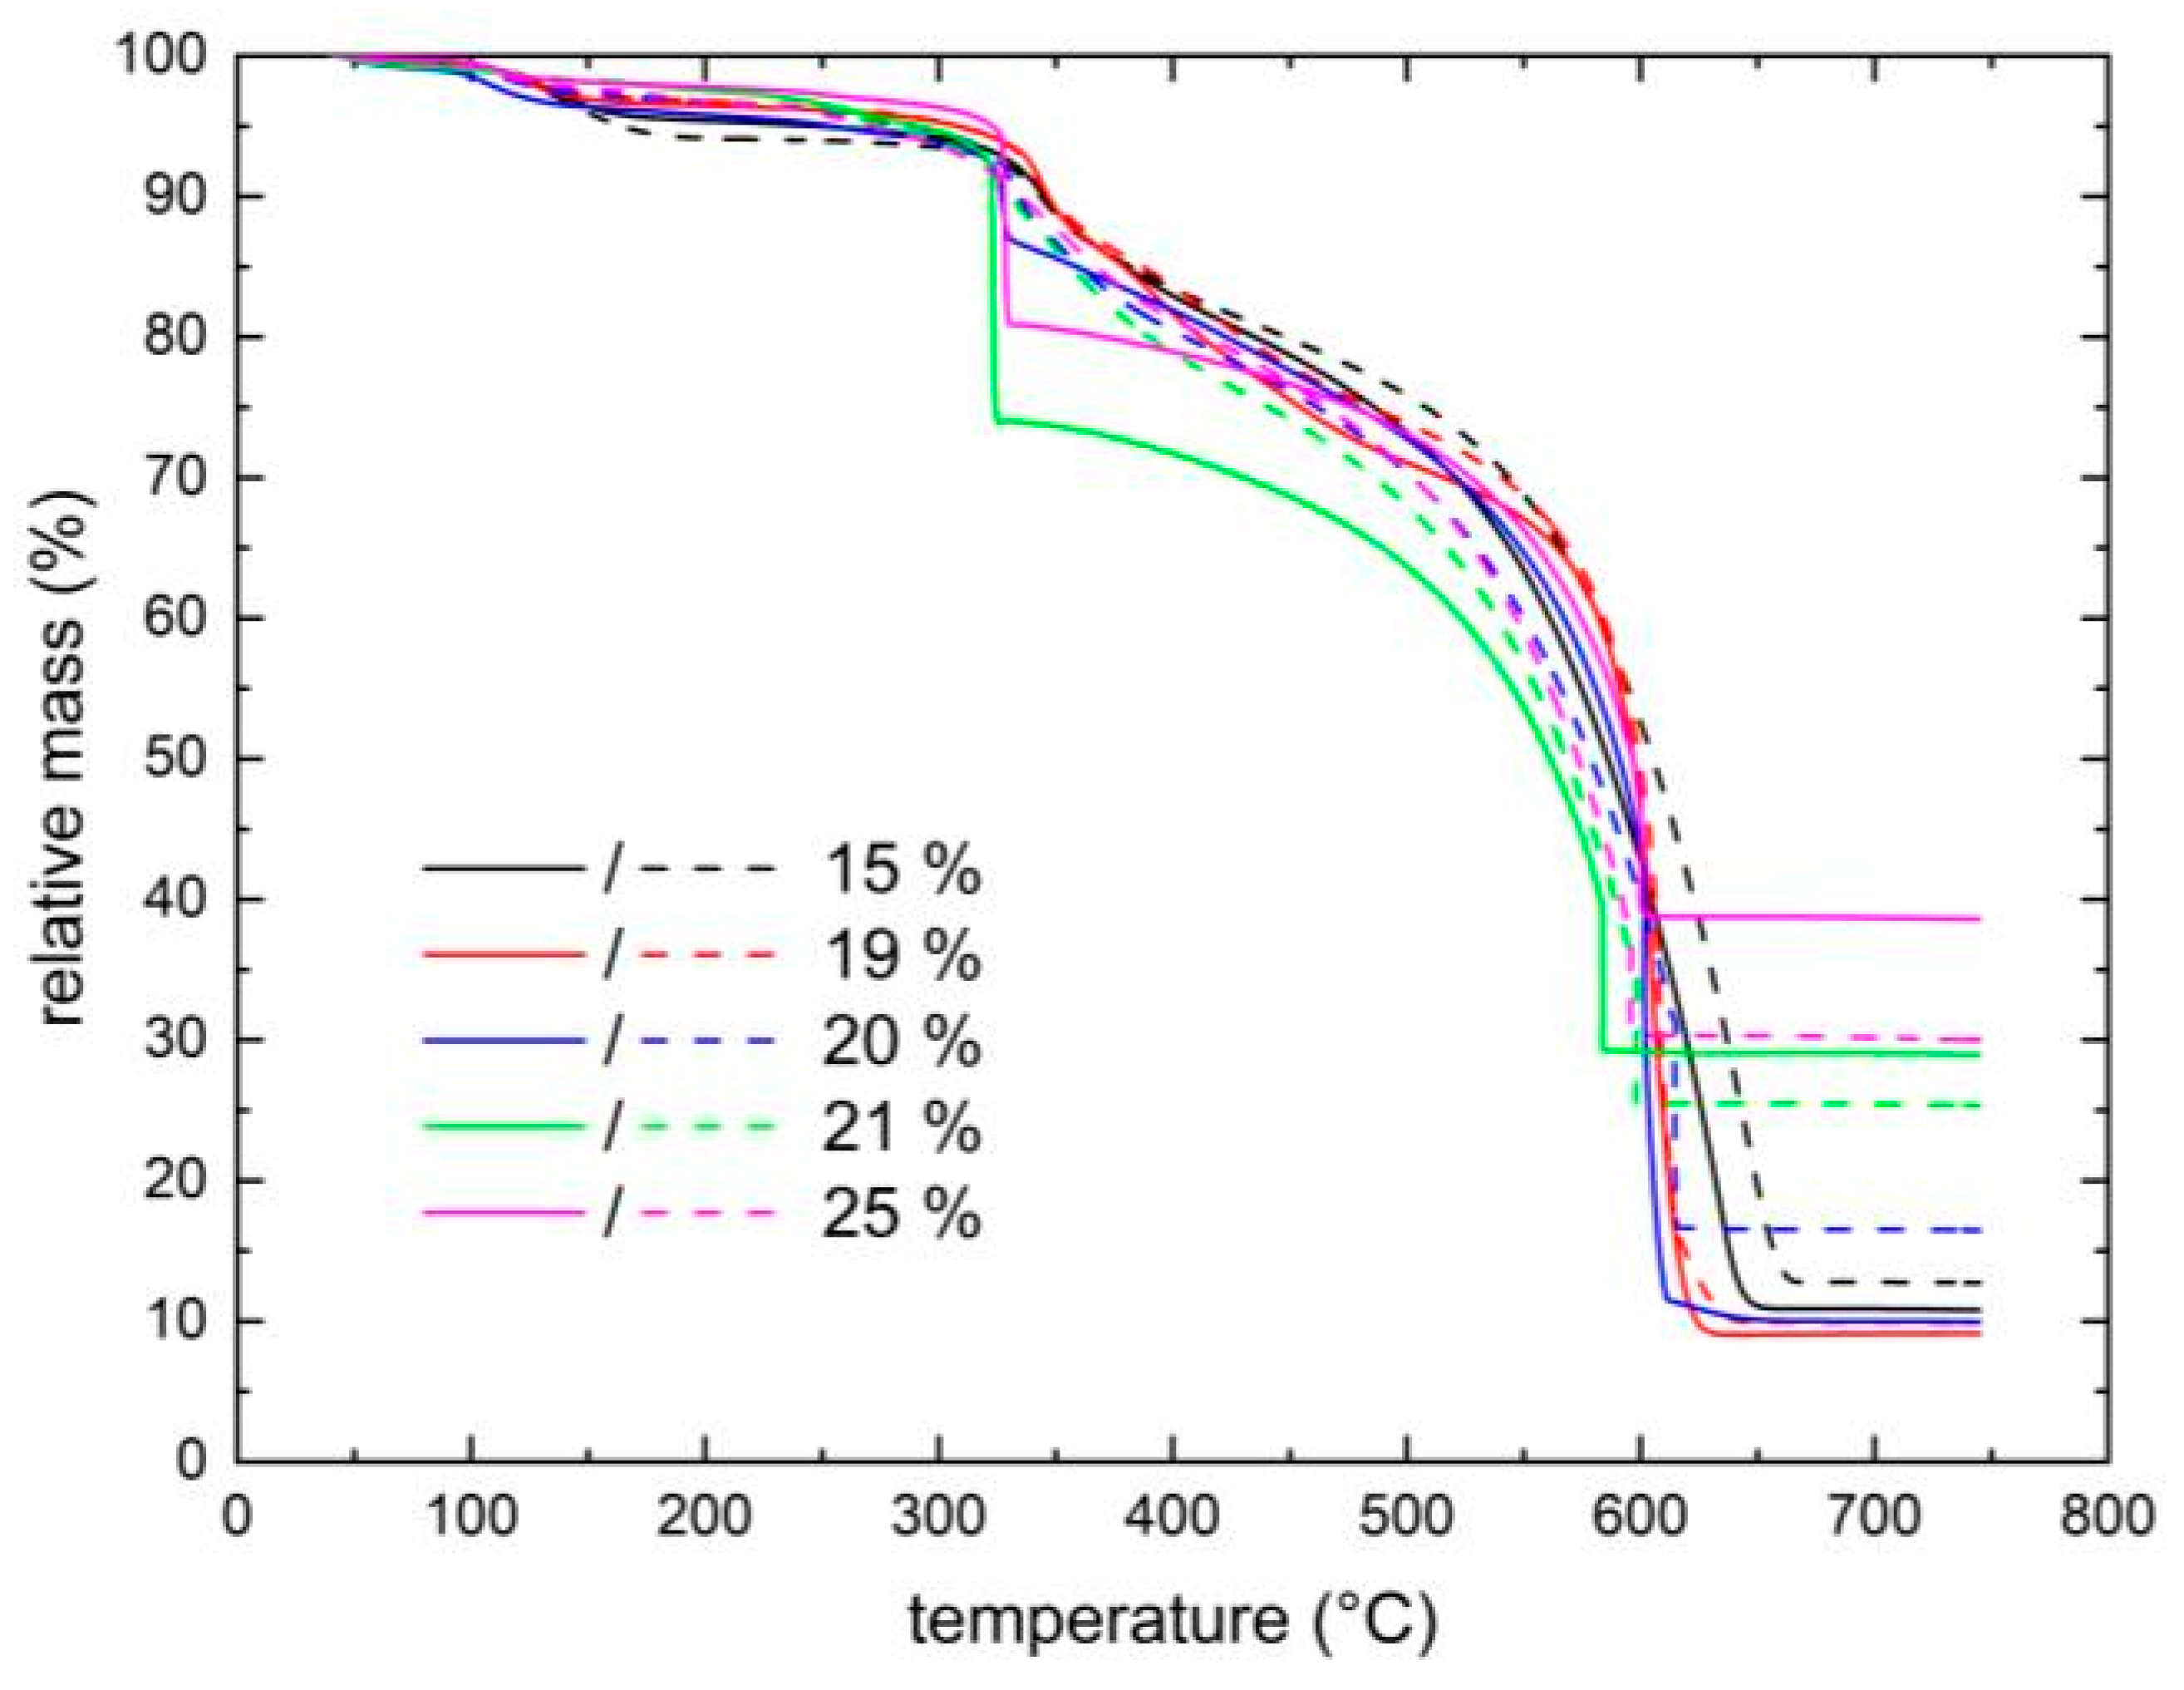
Next, the possible variation of the PAN:magnetite ratio in the samples was examined by TGA. The results of two measurements per sample are depicted in
Figure 4. The general slope of the TGA curves is similar for all samples, with an initial decrease due to the evaporation of water starting at 100 °C, followed by a rapid decrease at around 300–350 °C, which can be attributed to the melting of PAN and the release of volatile gases [
28,
29,
30]. A further decrease in mass up to a temperature of approximately 600 °C can be attributed to further combustion of organic compounds as well as to the evaporation of NH
3 and HCN [
30,
31]. The remaining mass fraction thus corresponds to the magnetite in the spinning solution, since no change occurs in the temperature range up to 750 °C.
While the slope of the curves can generally be explained by these processes, the strong differences between the five samples as well as between the two positions within one sample are unexpected. The general trend of higher magnetite contents in the samples spun from solutions with higher solid contents could already be assumed from the sample colors (
Figure 1) and seems to be based on the spinning process. It can be speculated that, in solutions with higher viscosity, i.e., with higher solid content, the magnetite precipitates more slowly during the electrospinning process, so that more magnetite is embedded in the electrospun nanofiber mat. Only for the highest concentration of 25 wt.% solid content is the expected amount of 33 wt.% magnetite in the nanofiber mat approximately reached on average, while an average value of only 27 wt.% is found for the sample spun from the solution with 21 wt.% solid content, indicating that the nanoparticle distribution within this spinning solution was not stable during the entire spinning time of 38 min. The other samples show significantly lower residues of magnetite, which indicates that precipitation cannot be avoided here and has a greater influence on spinning solutions with lower viscosity.
On the other hand, the 25 wt.% sample also shows the highest variation between the two measurements depicted here, i.e., a high inhomogeneity can be expected for this sample, as was already suspected on the basis of the macroscopic image of this sample (cf.
Figure 1e) and as the investigation of the nanofiber diameters also revealed on a microscopic scale (cf.
Figure 3).
The TGA measurement therefore shows that higher solid contents are advantageous, i.e., values of 21 wt.% or 25 wt.%—or an intermediate value which was not tested here—should be selected. In conjunction with the aforementioned results of the morphological investigations, a solid content of 21 wt.% is advantageous.
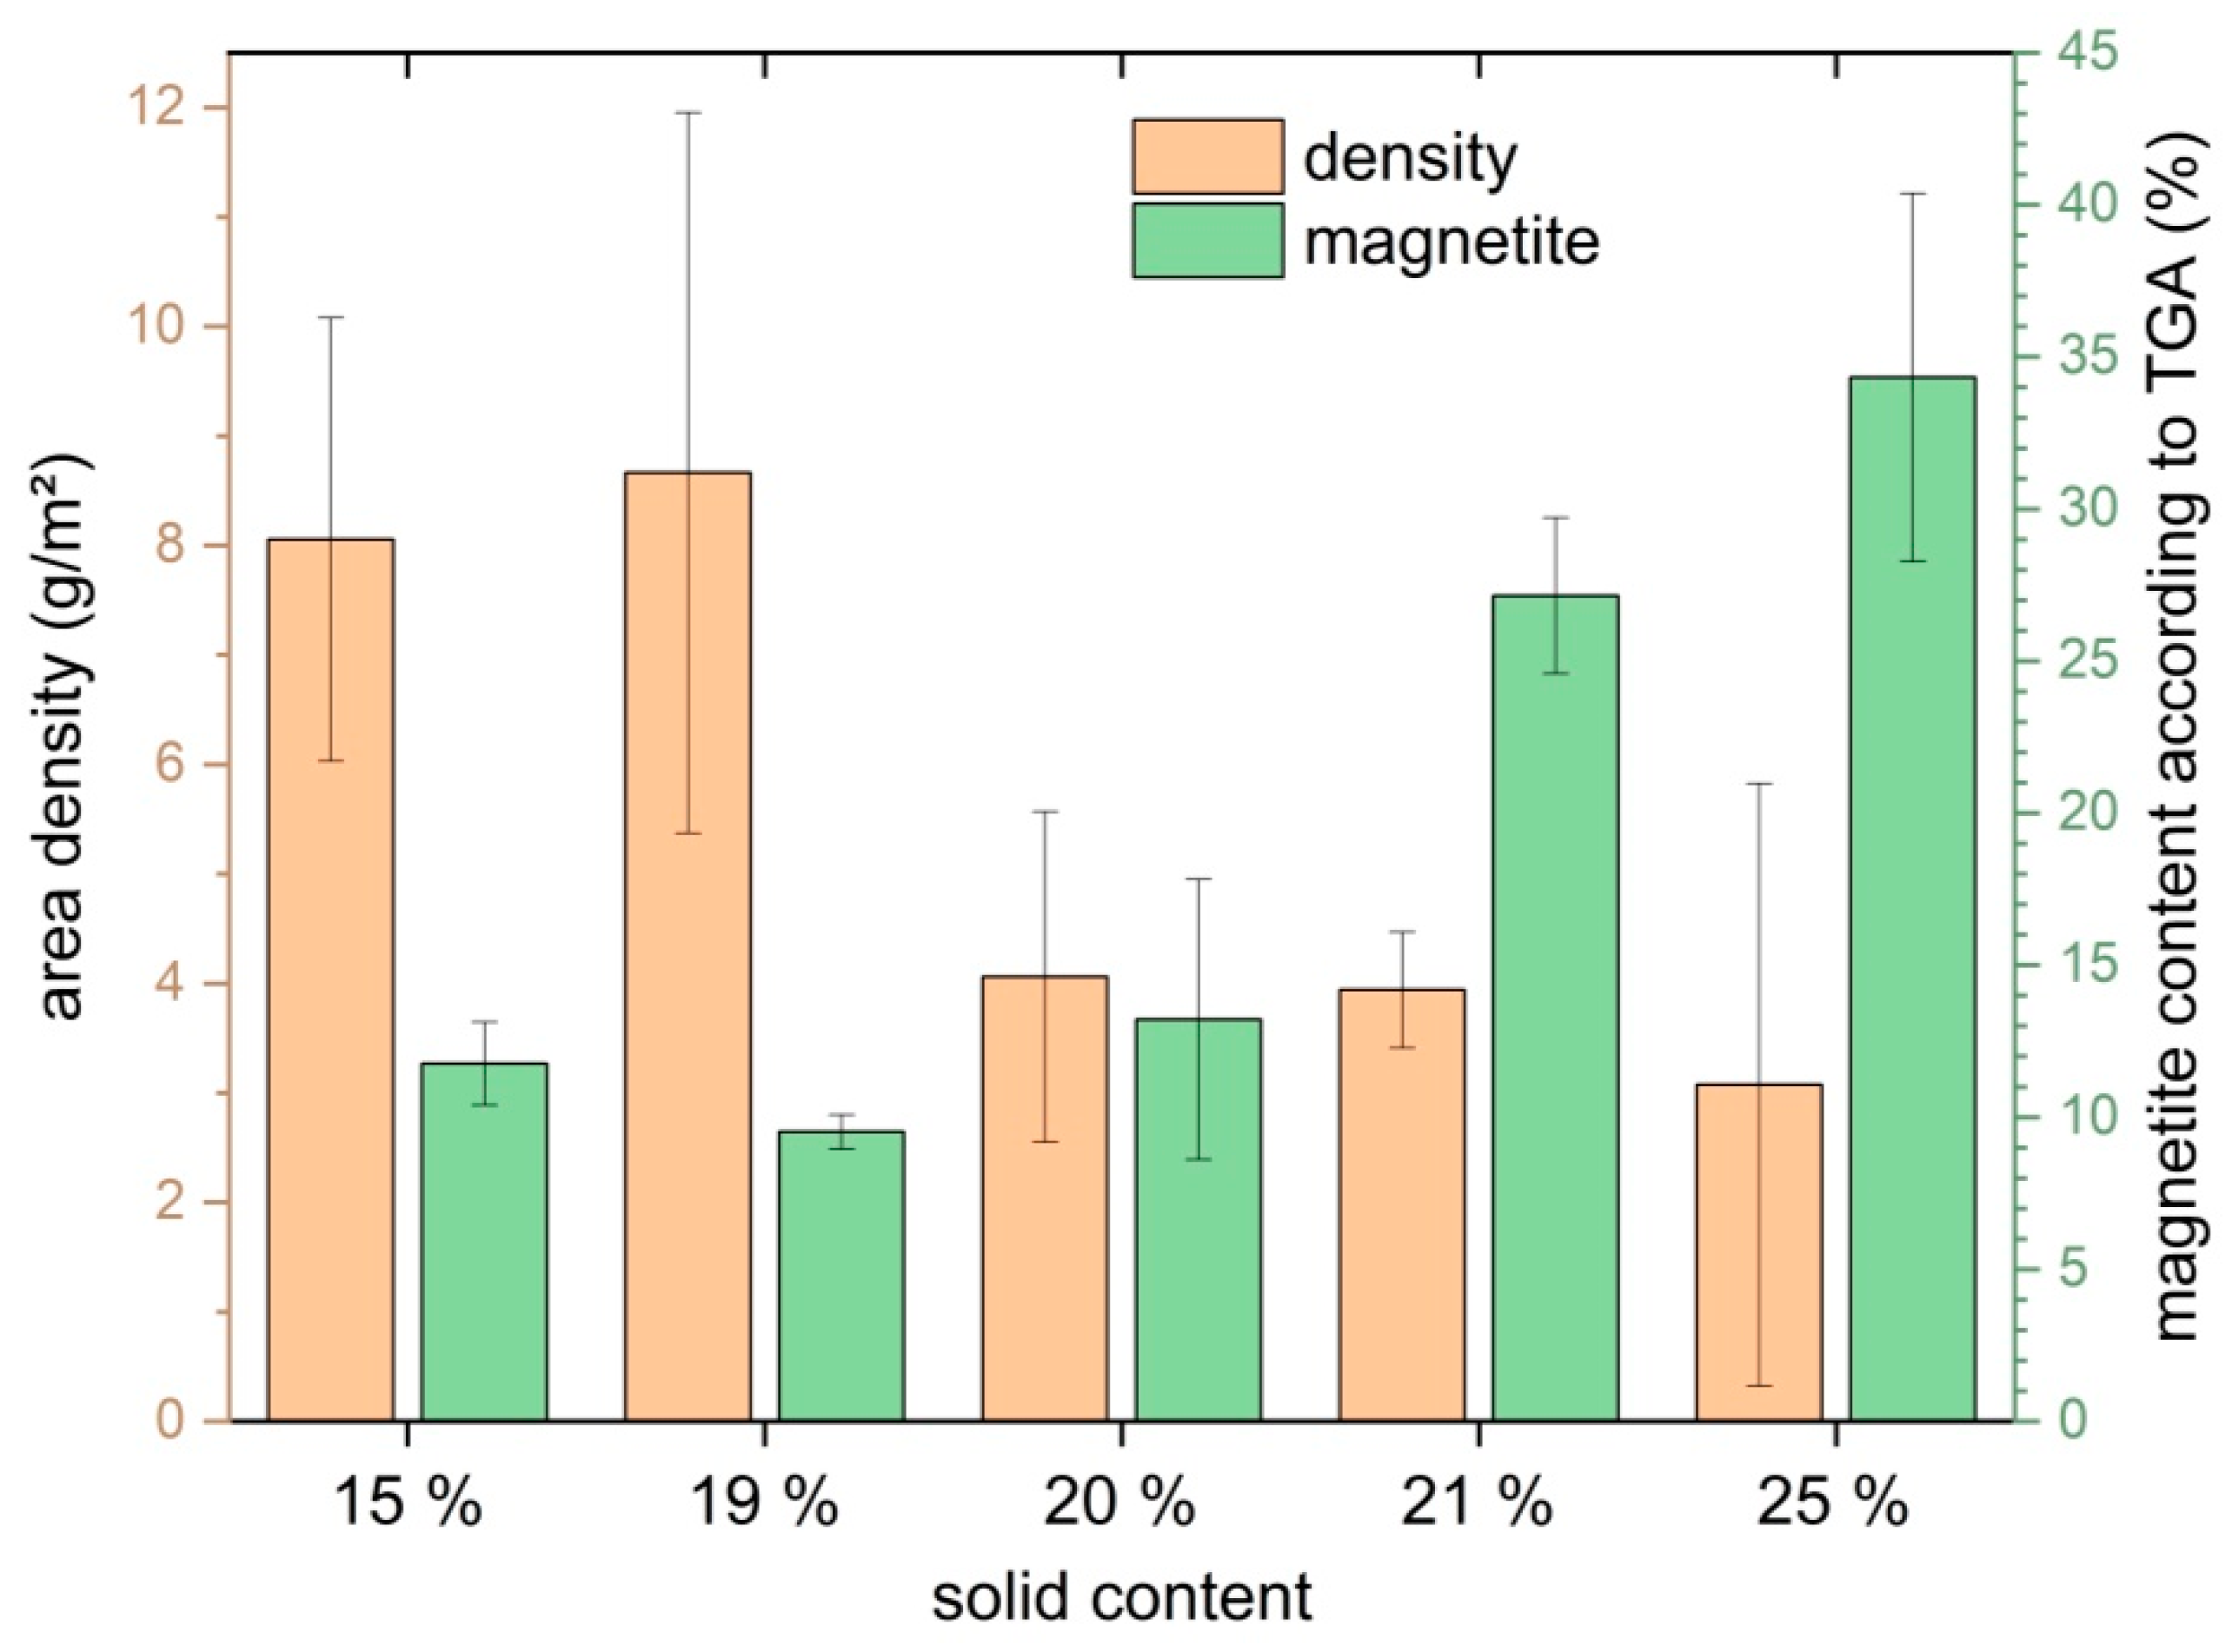
In general, a trend can be observed: with a higher solid content, a higher magnetite content is also present in the nanofiber mat. However, this only applies to solid contents of at least 20 wt.% (
Figure 5). On the other hand, the masses per unit area show the opposite trend, as can be expected, since spinning from lower-viscous solutions leads to a significantly faster transport of the solid content towards the substrate, i.e., a higher mass flow during the electrospinning process.
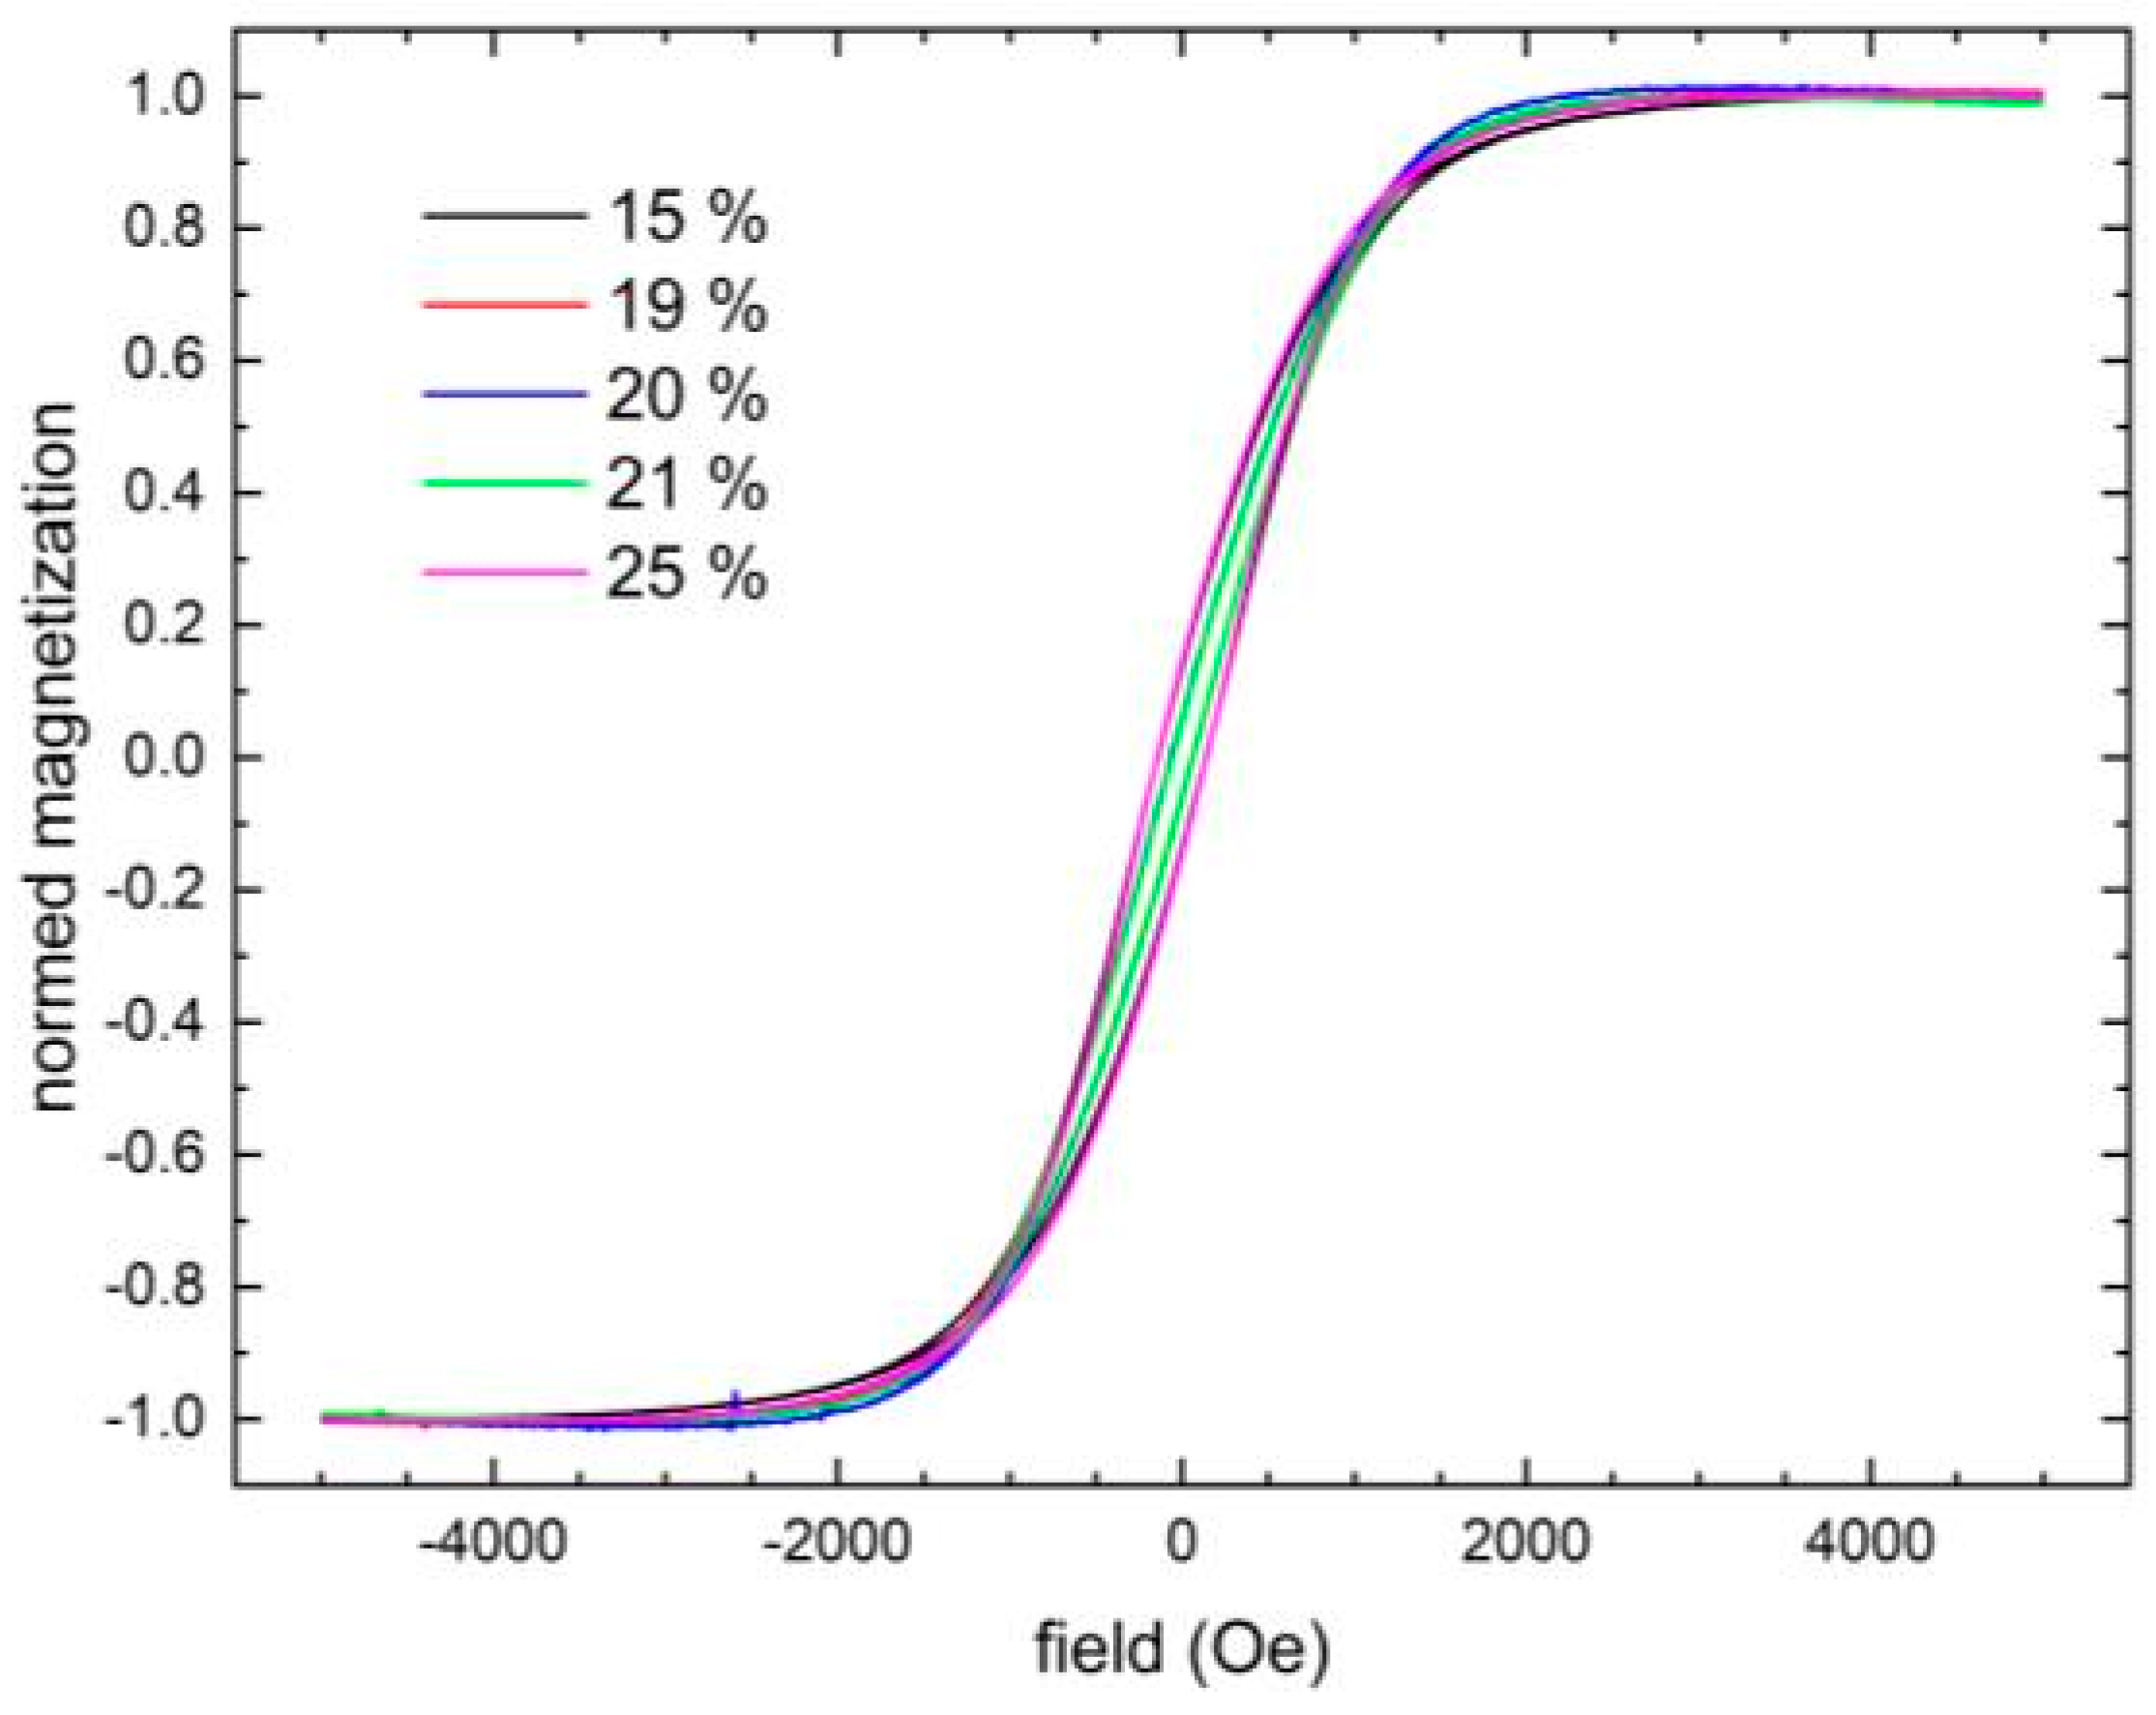
Finally, AGM measurements of the magnetization of the samples are depicted in
Figure 6. All samples show quite similar hysteresis loops and only slightly varying coercive fields, despite the different magnetite contents in the samples, as shown by the TGA measurements (cf.
Figure 4). More precisely, the coercive fields are approximately 140 Oe for 15 wt.% and 25 wt.% solid contents, i.e., for the extreme values of the solid contents, and approximately 60 Oe for solid contents of 19–21 wt.%, i.e., the samples with thin nanofibers. This finding indicates some agglomerations in the samples with intermediate solid content [
11], i.e., the nanoparticles in the samples spun from solutions with solid contents 19–21 wt.% are not expected to reach the superparamagnetic limit, which must be taken into account when discussing practical applications for these magnetic nanofiber mats. Depending on the planned application, agglomerations and the resulting magnetic properties may be advantageous or undesirable; therefore, this factor must be taken into account when selecting the optimum spinning solution.
To investigate whether this interpretation of the magnetic properties of the nanofiber mats is correct, EDX measurements were performed on the samples with 21 wt.% and 25 wt.% solid content in the solution, respectively.
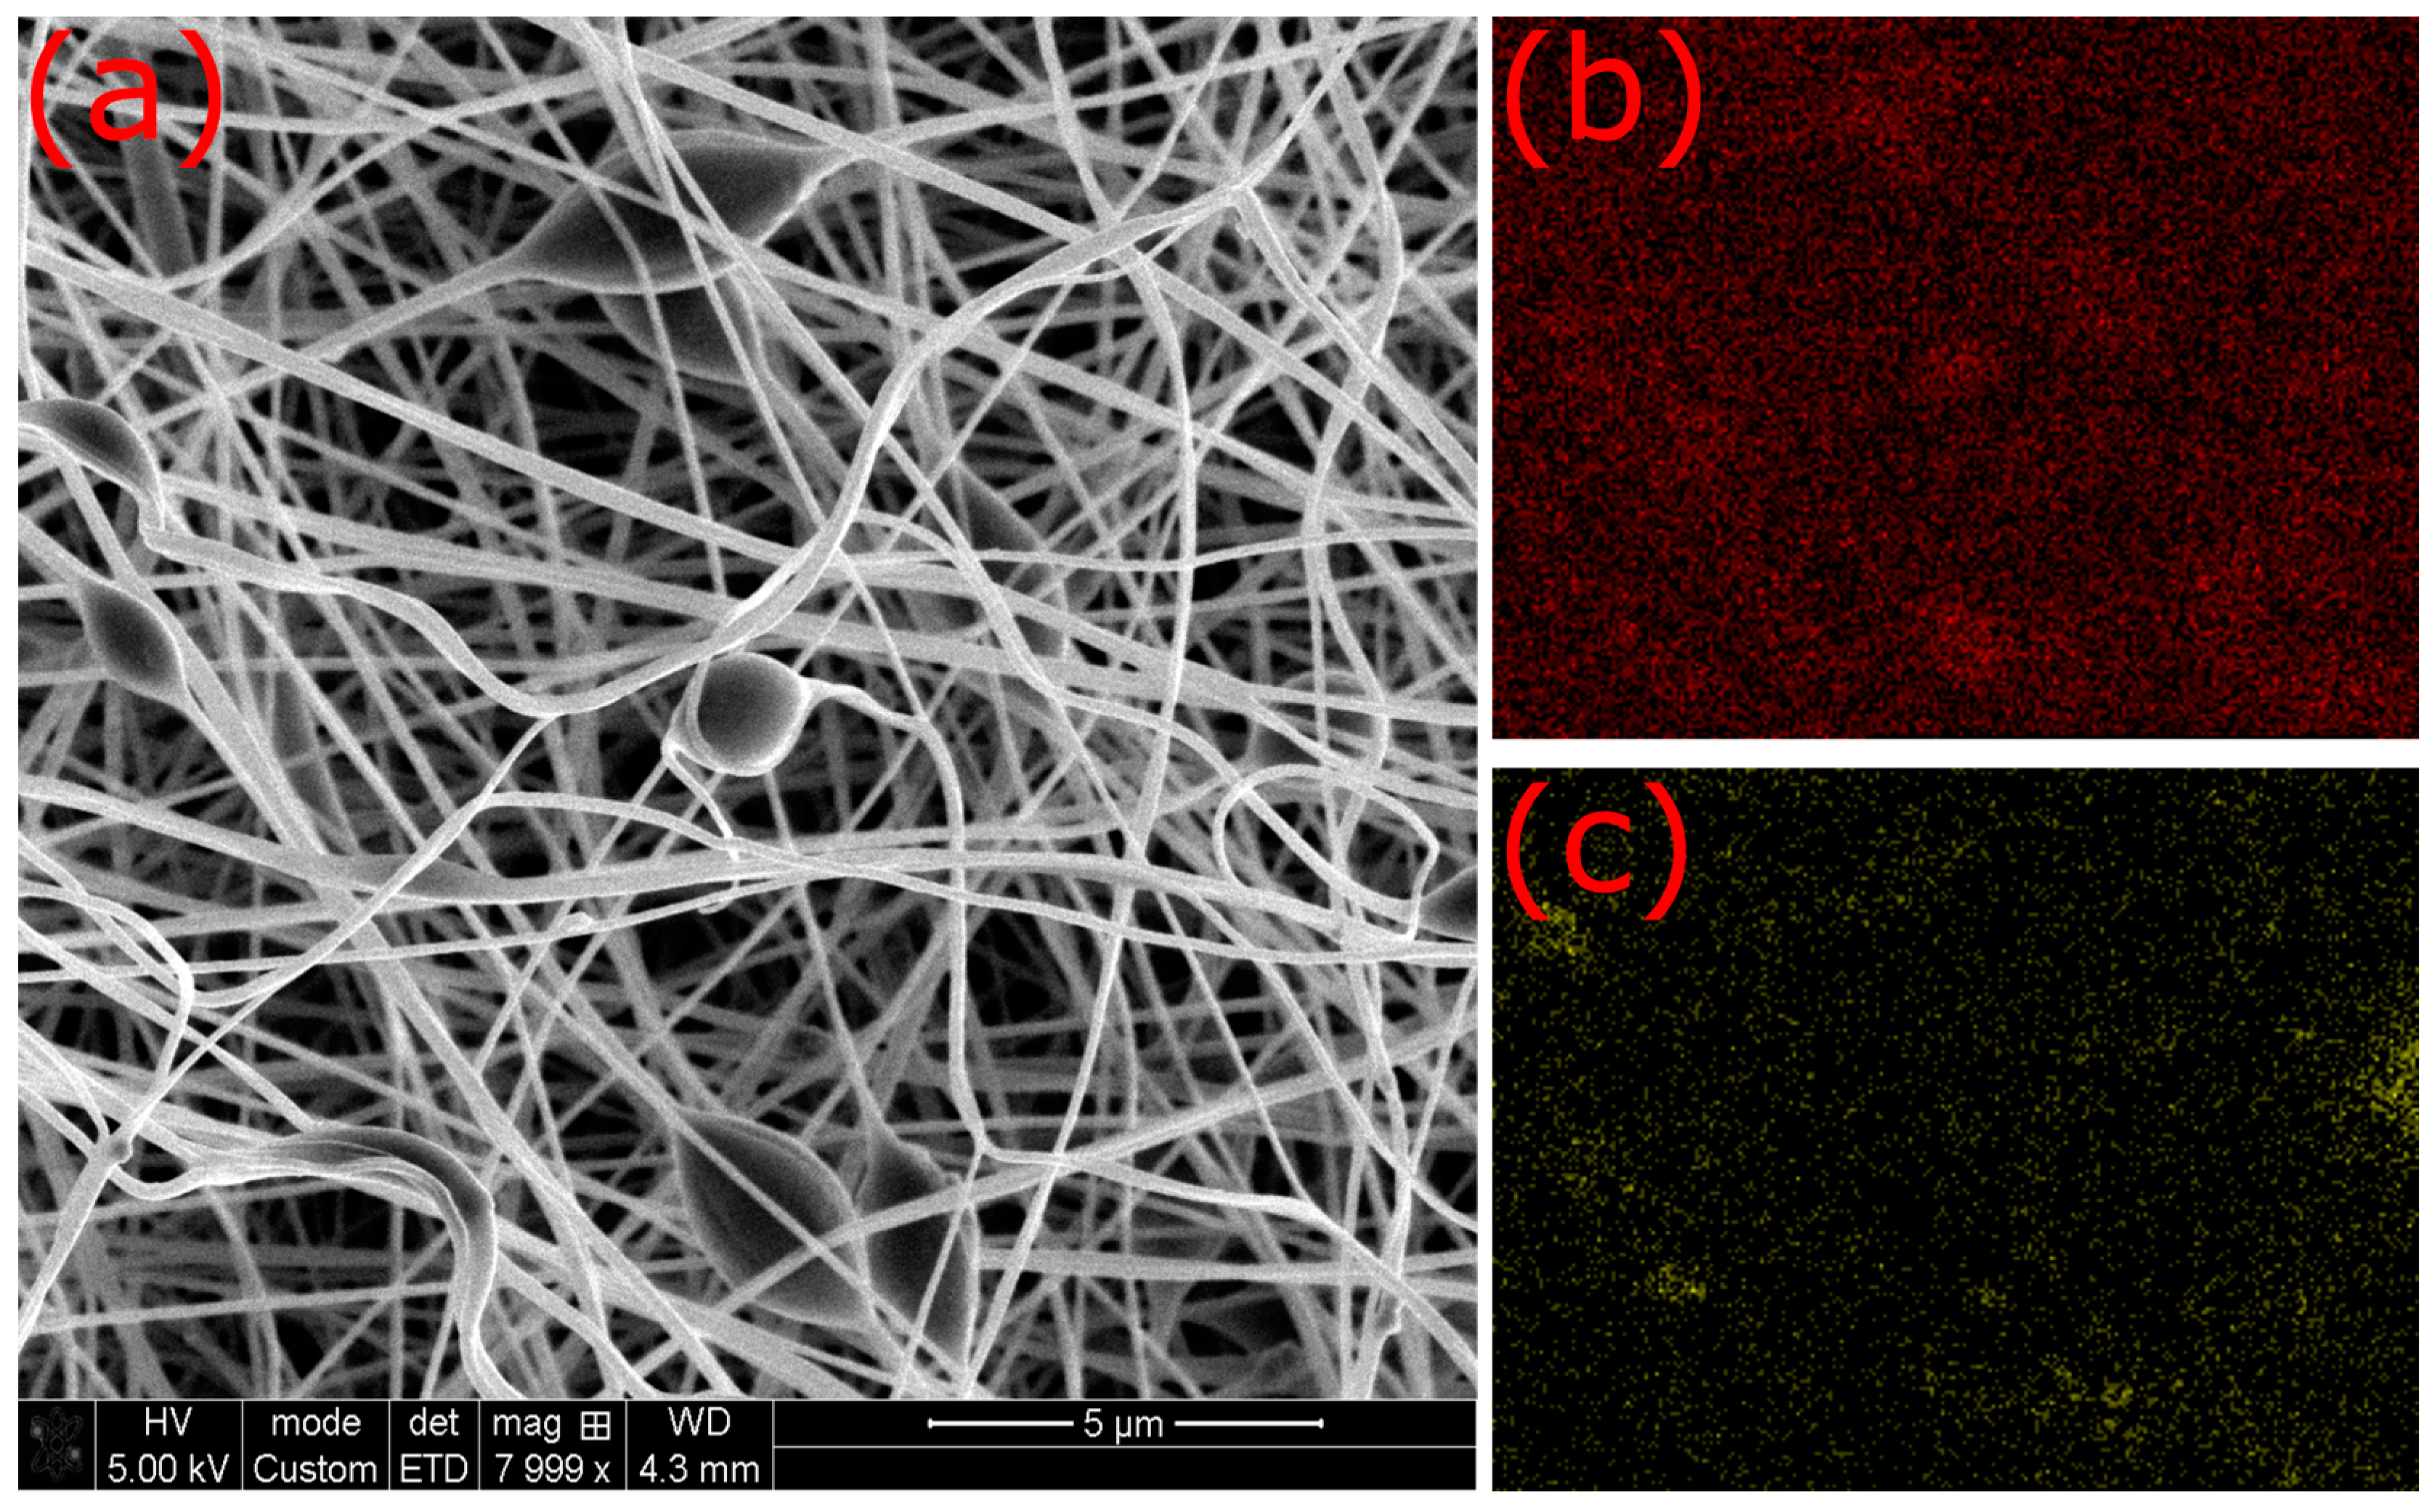
Figure 7 shows SEM images taken with different voltages and the corresponding EDX maps showing carbon, iron, and oxide, respectively. First, it should be mentioned that beads and agglomerations are much more visible in
Figure 7b (measured with 20 kV) than in
Figure 7a (measured with 5 kV), while both images show a similar (slightly shifted) area of the nanofiber mat. In particular, the large irregular agglomerations, e.g., visible in
Figure 7b below the central bead, give clearly visible Fe signals, indicating agglomerations of magnetite. The carbon map shows no clear difference, while the oxide map shows an increased signal in areas with strong Fe signals.
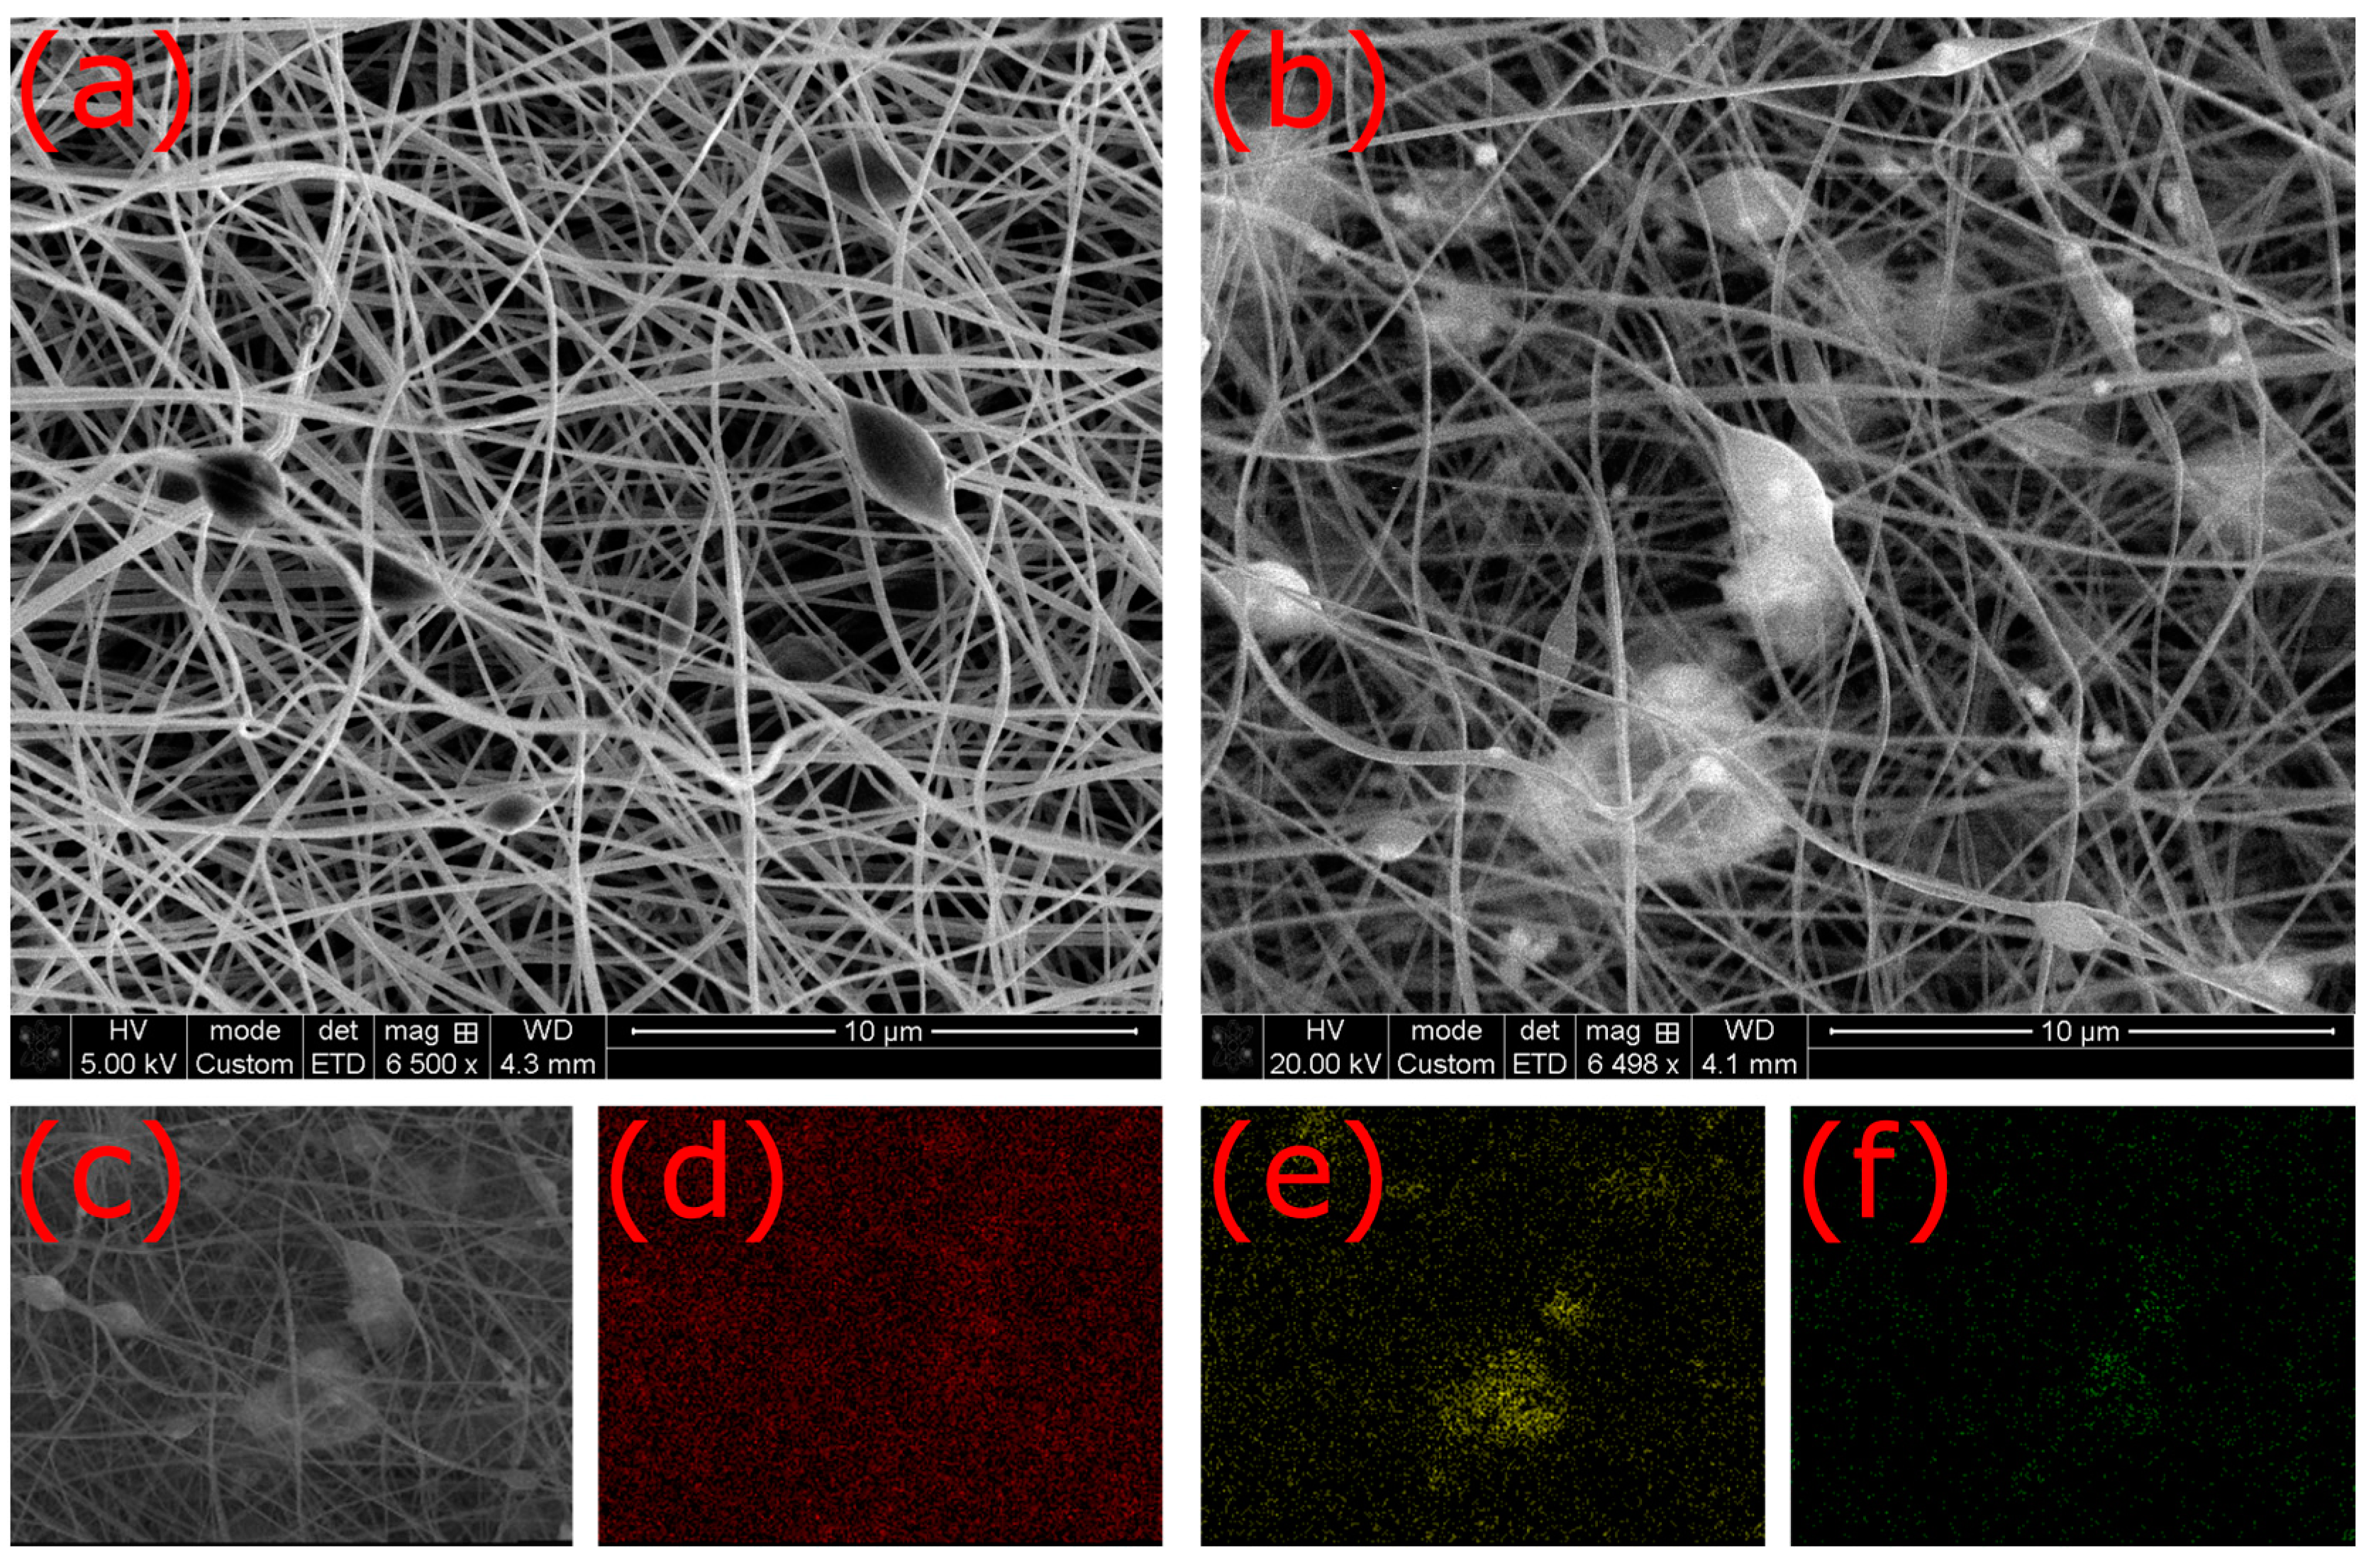
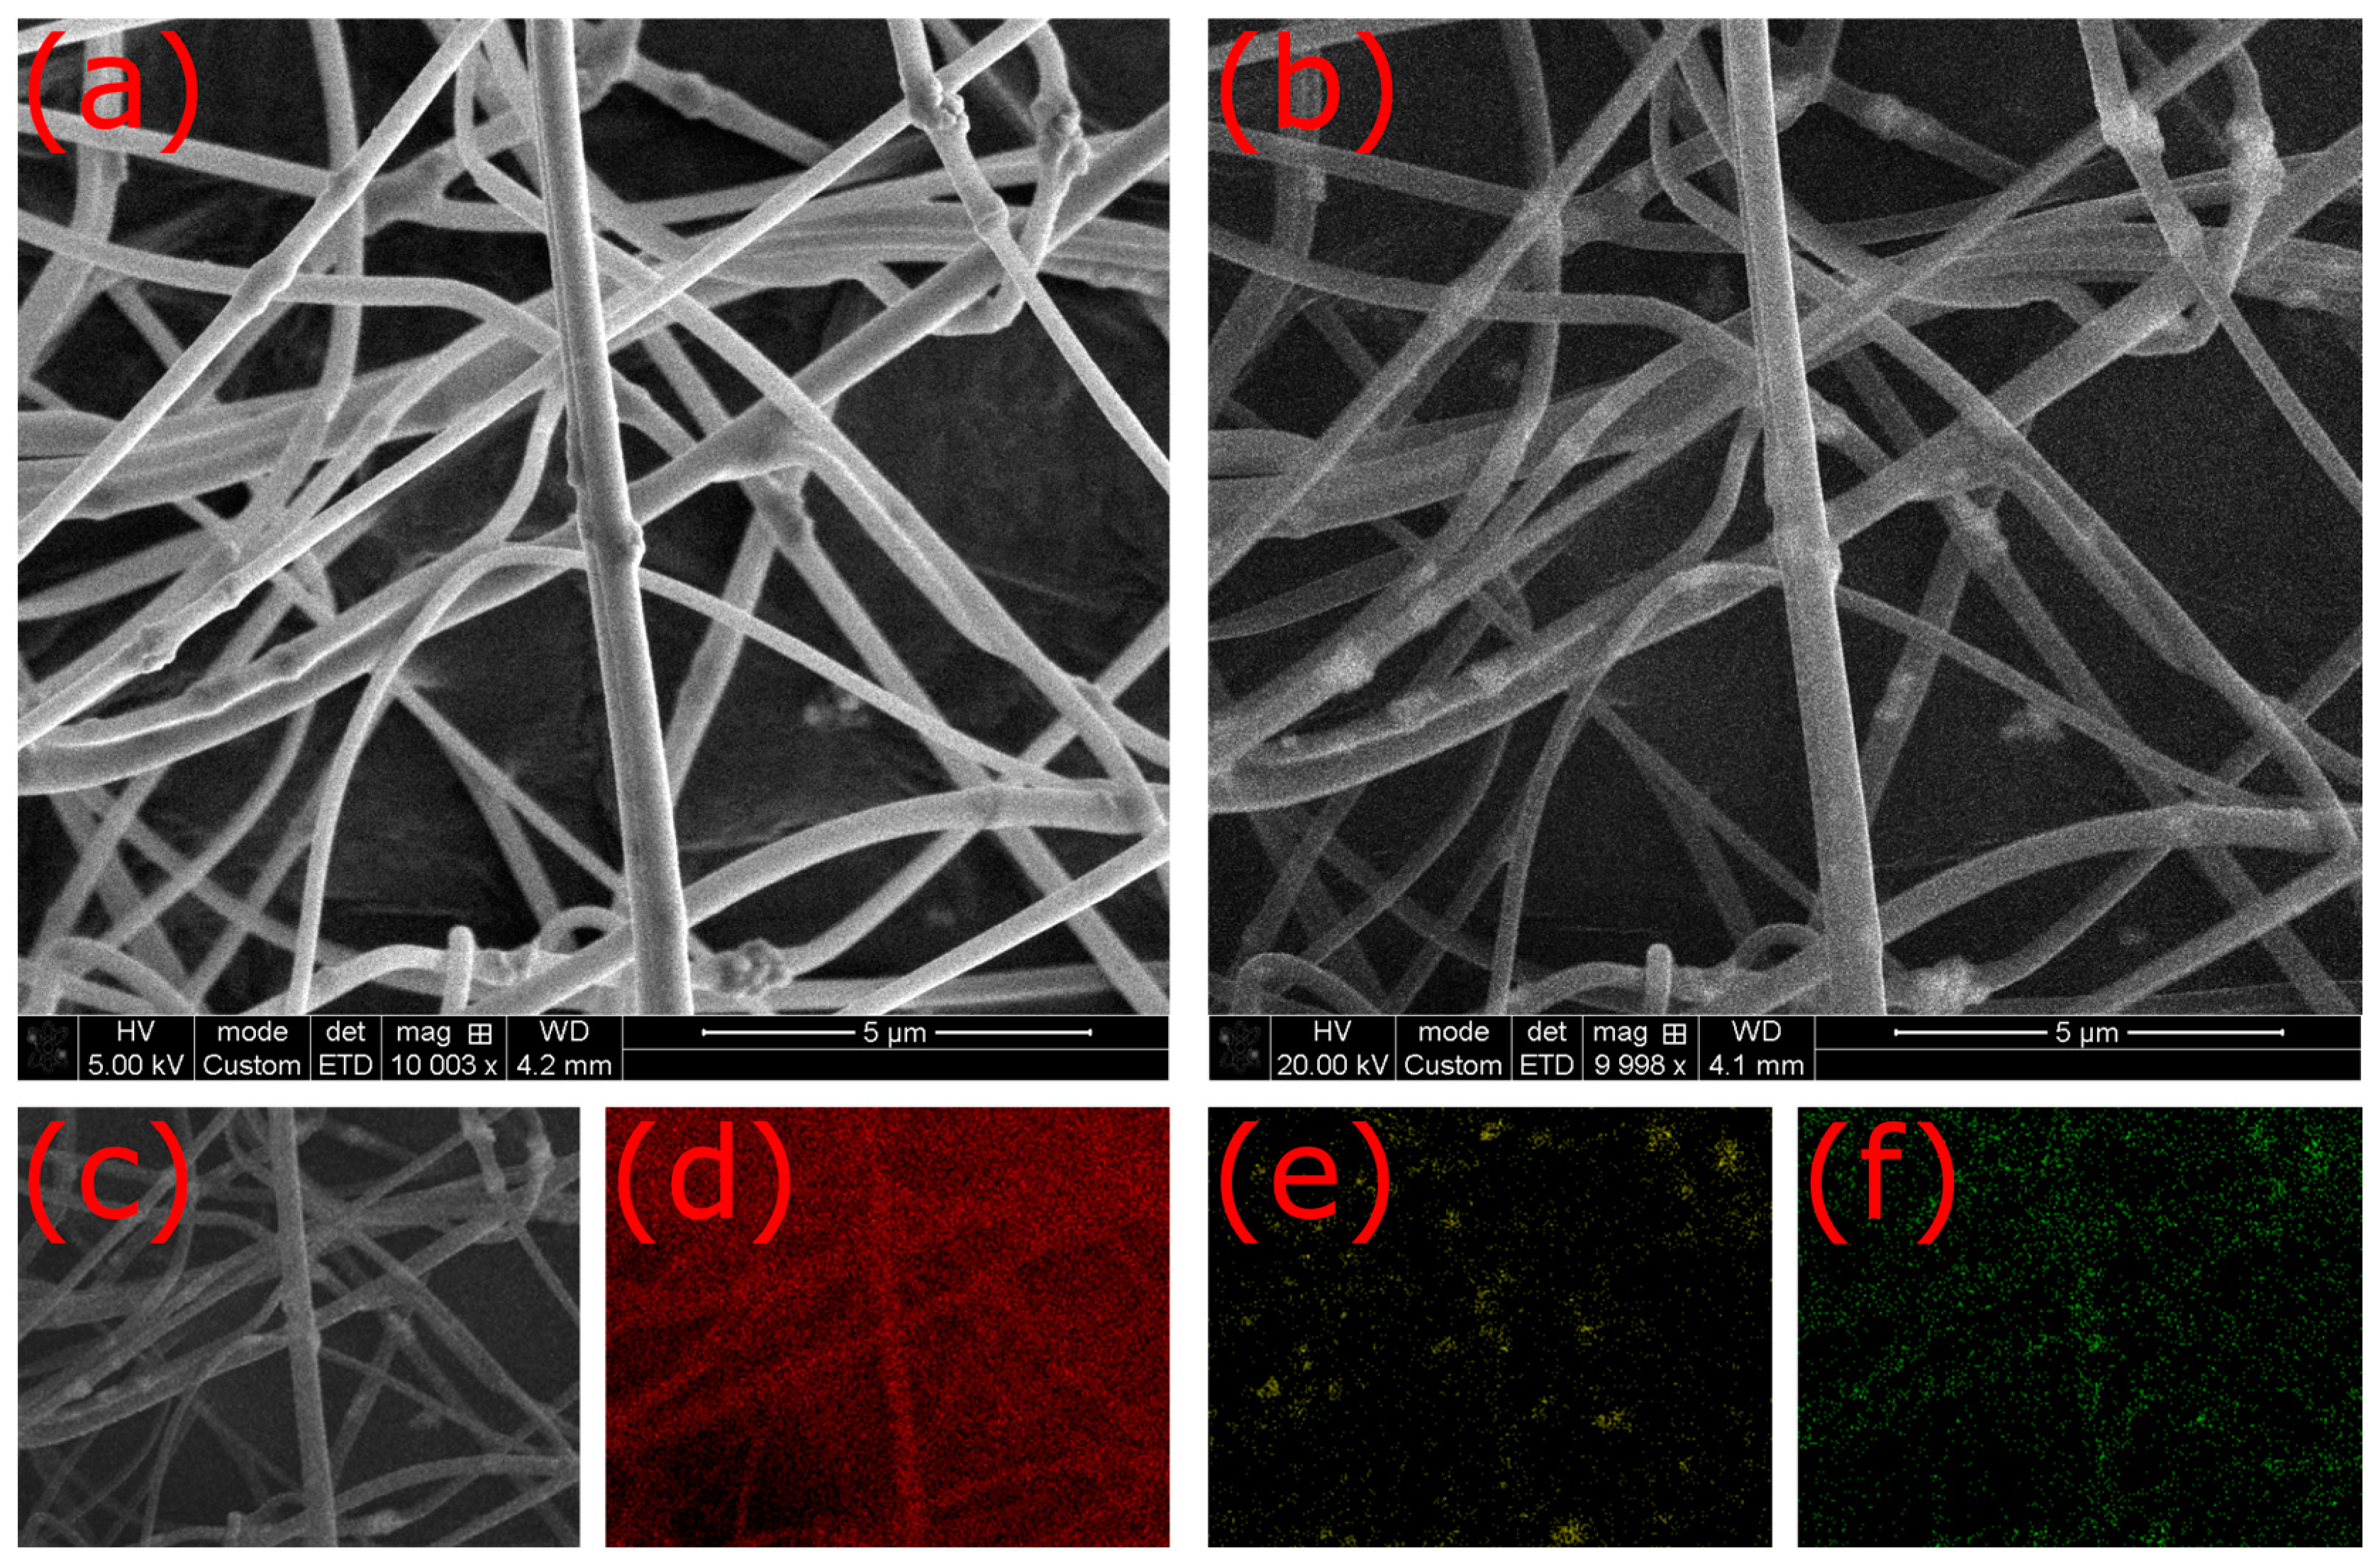
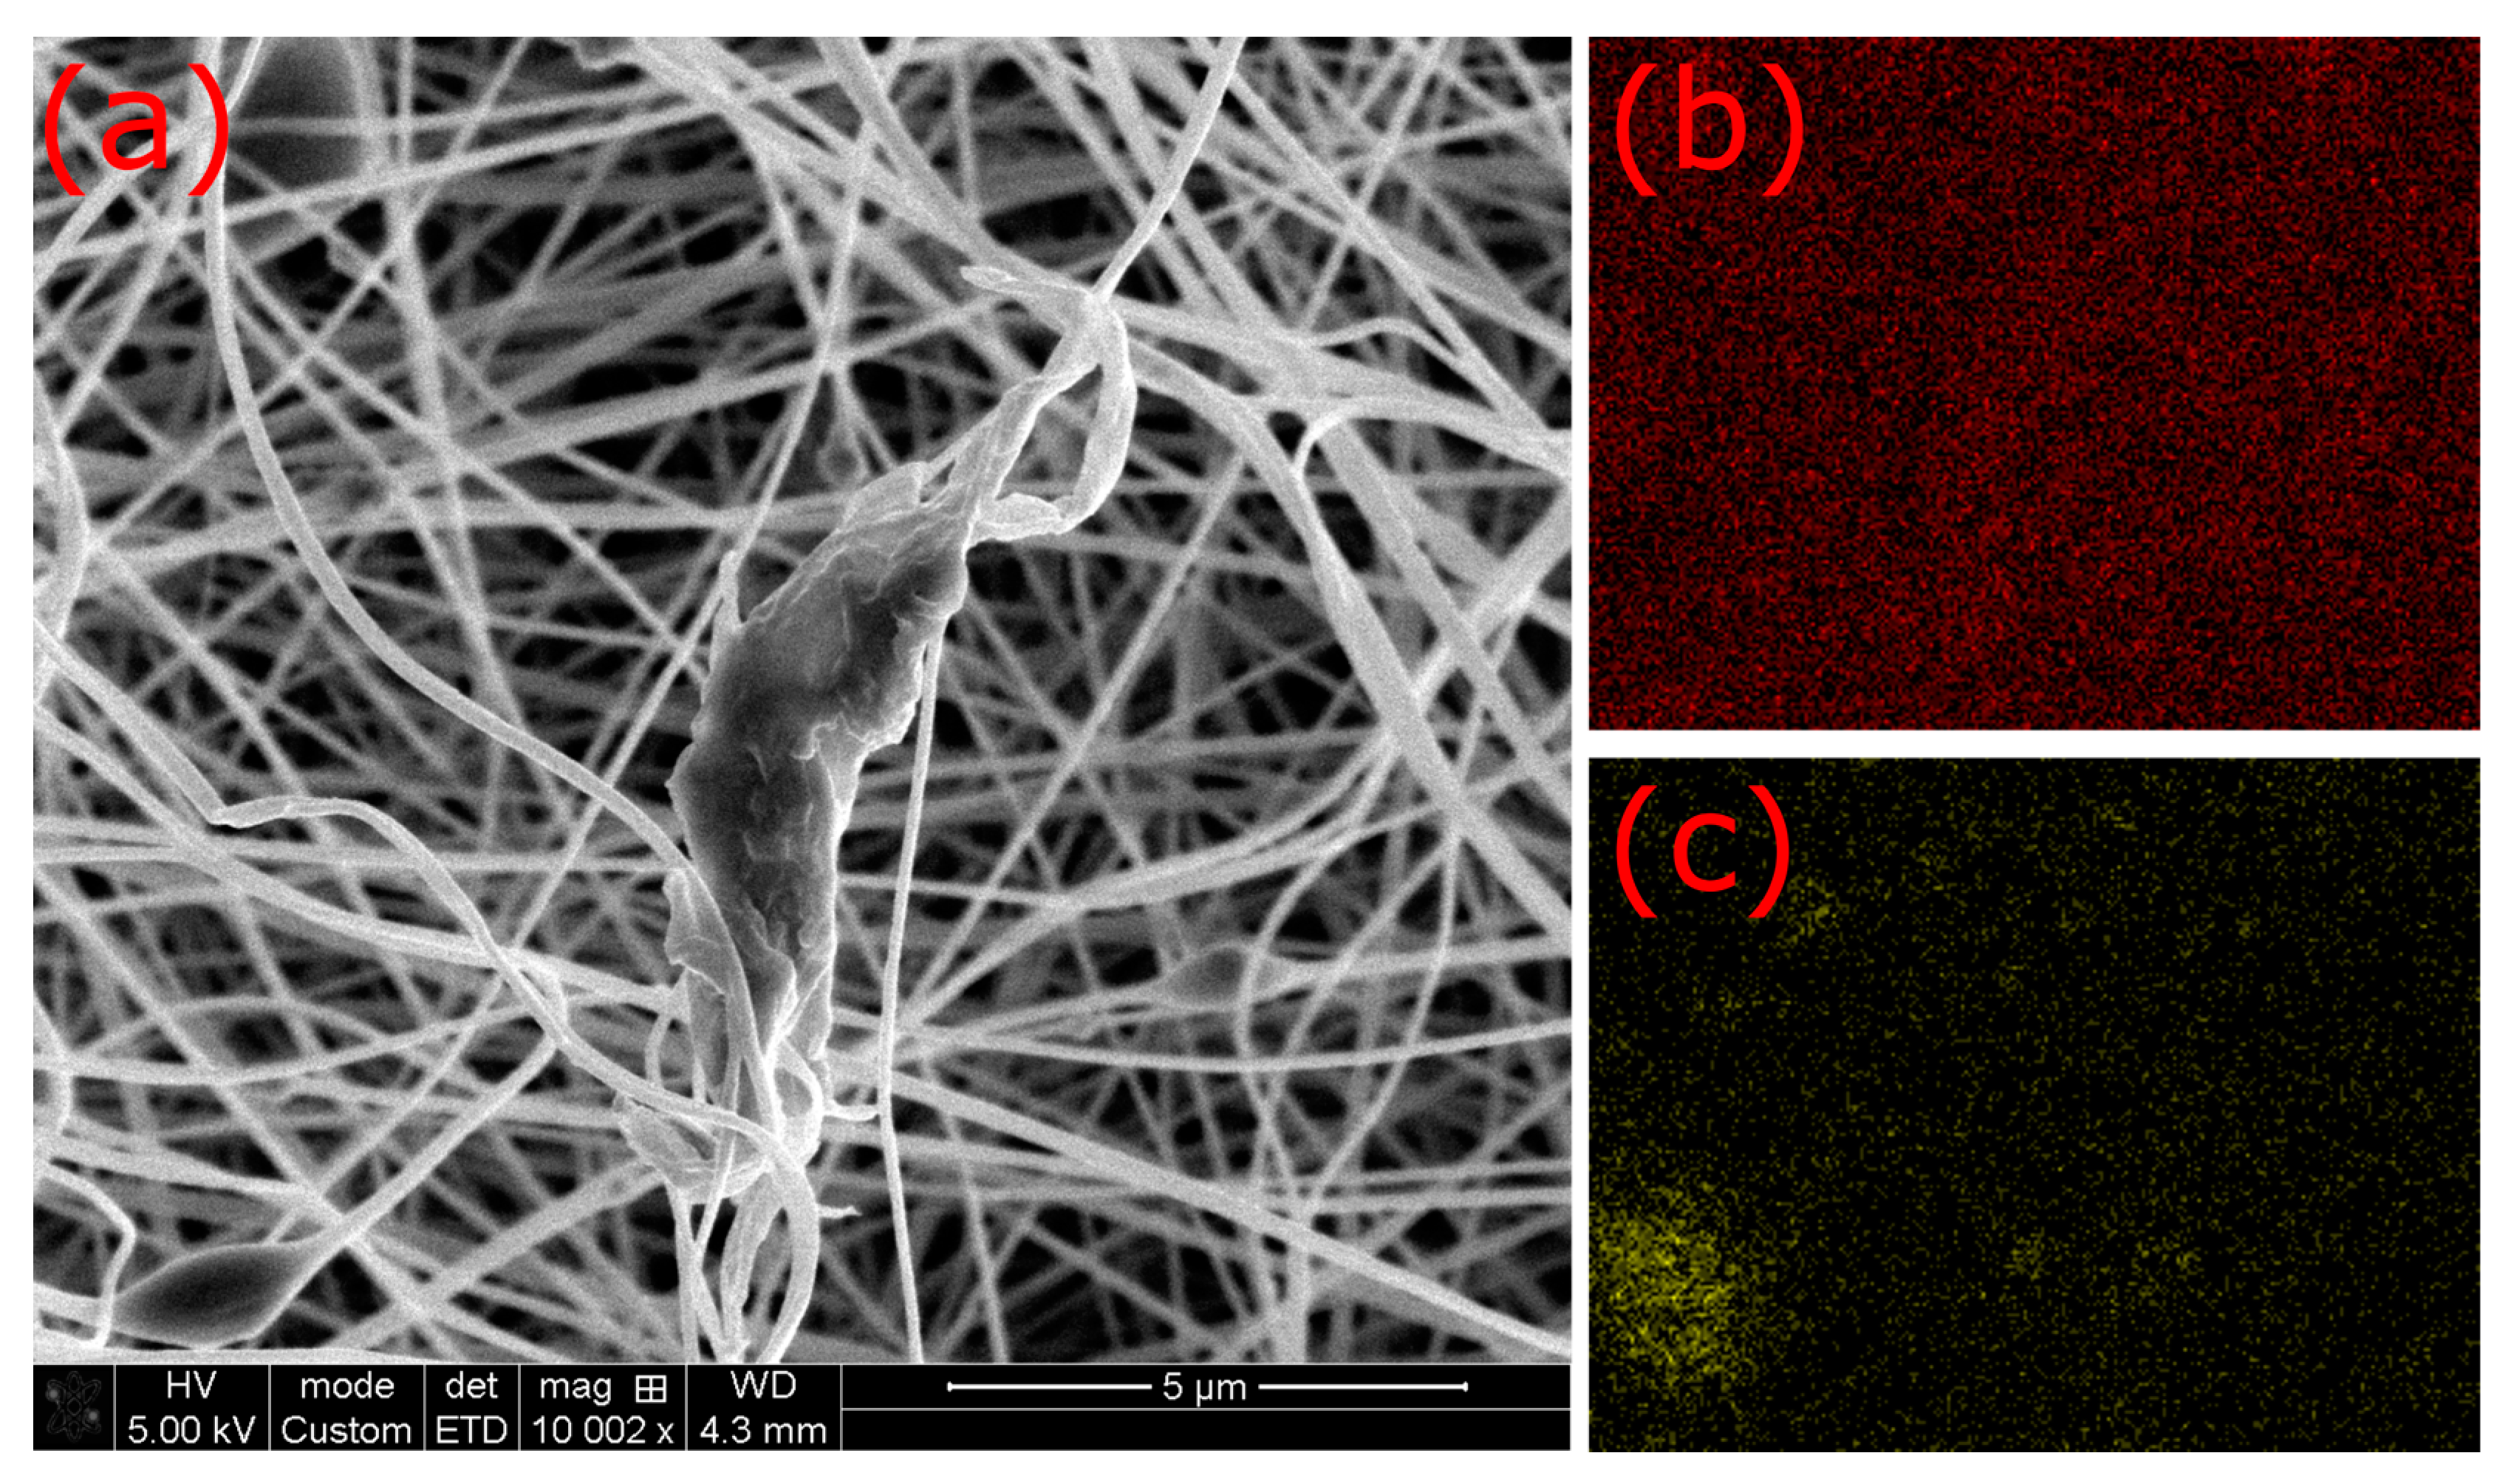
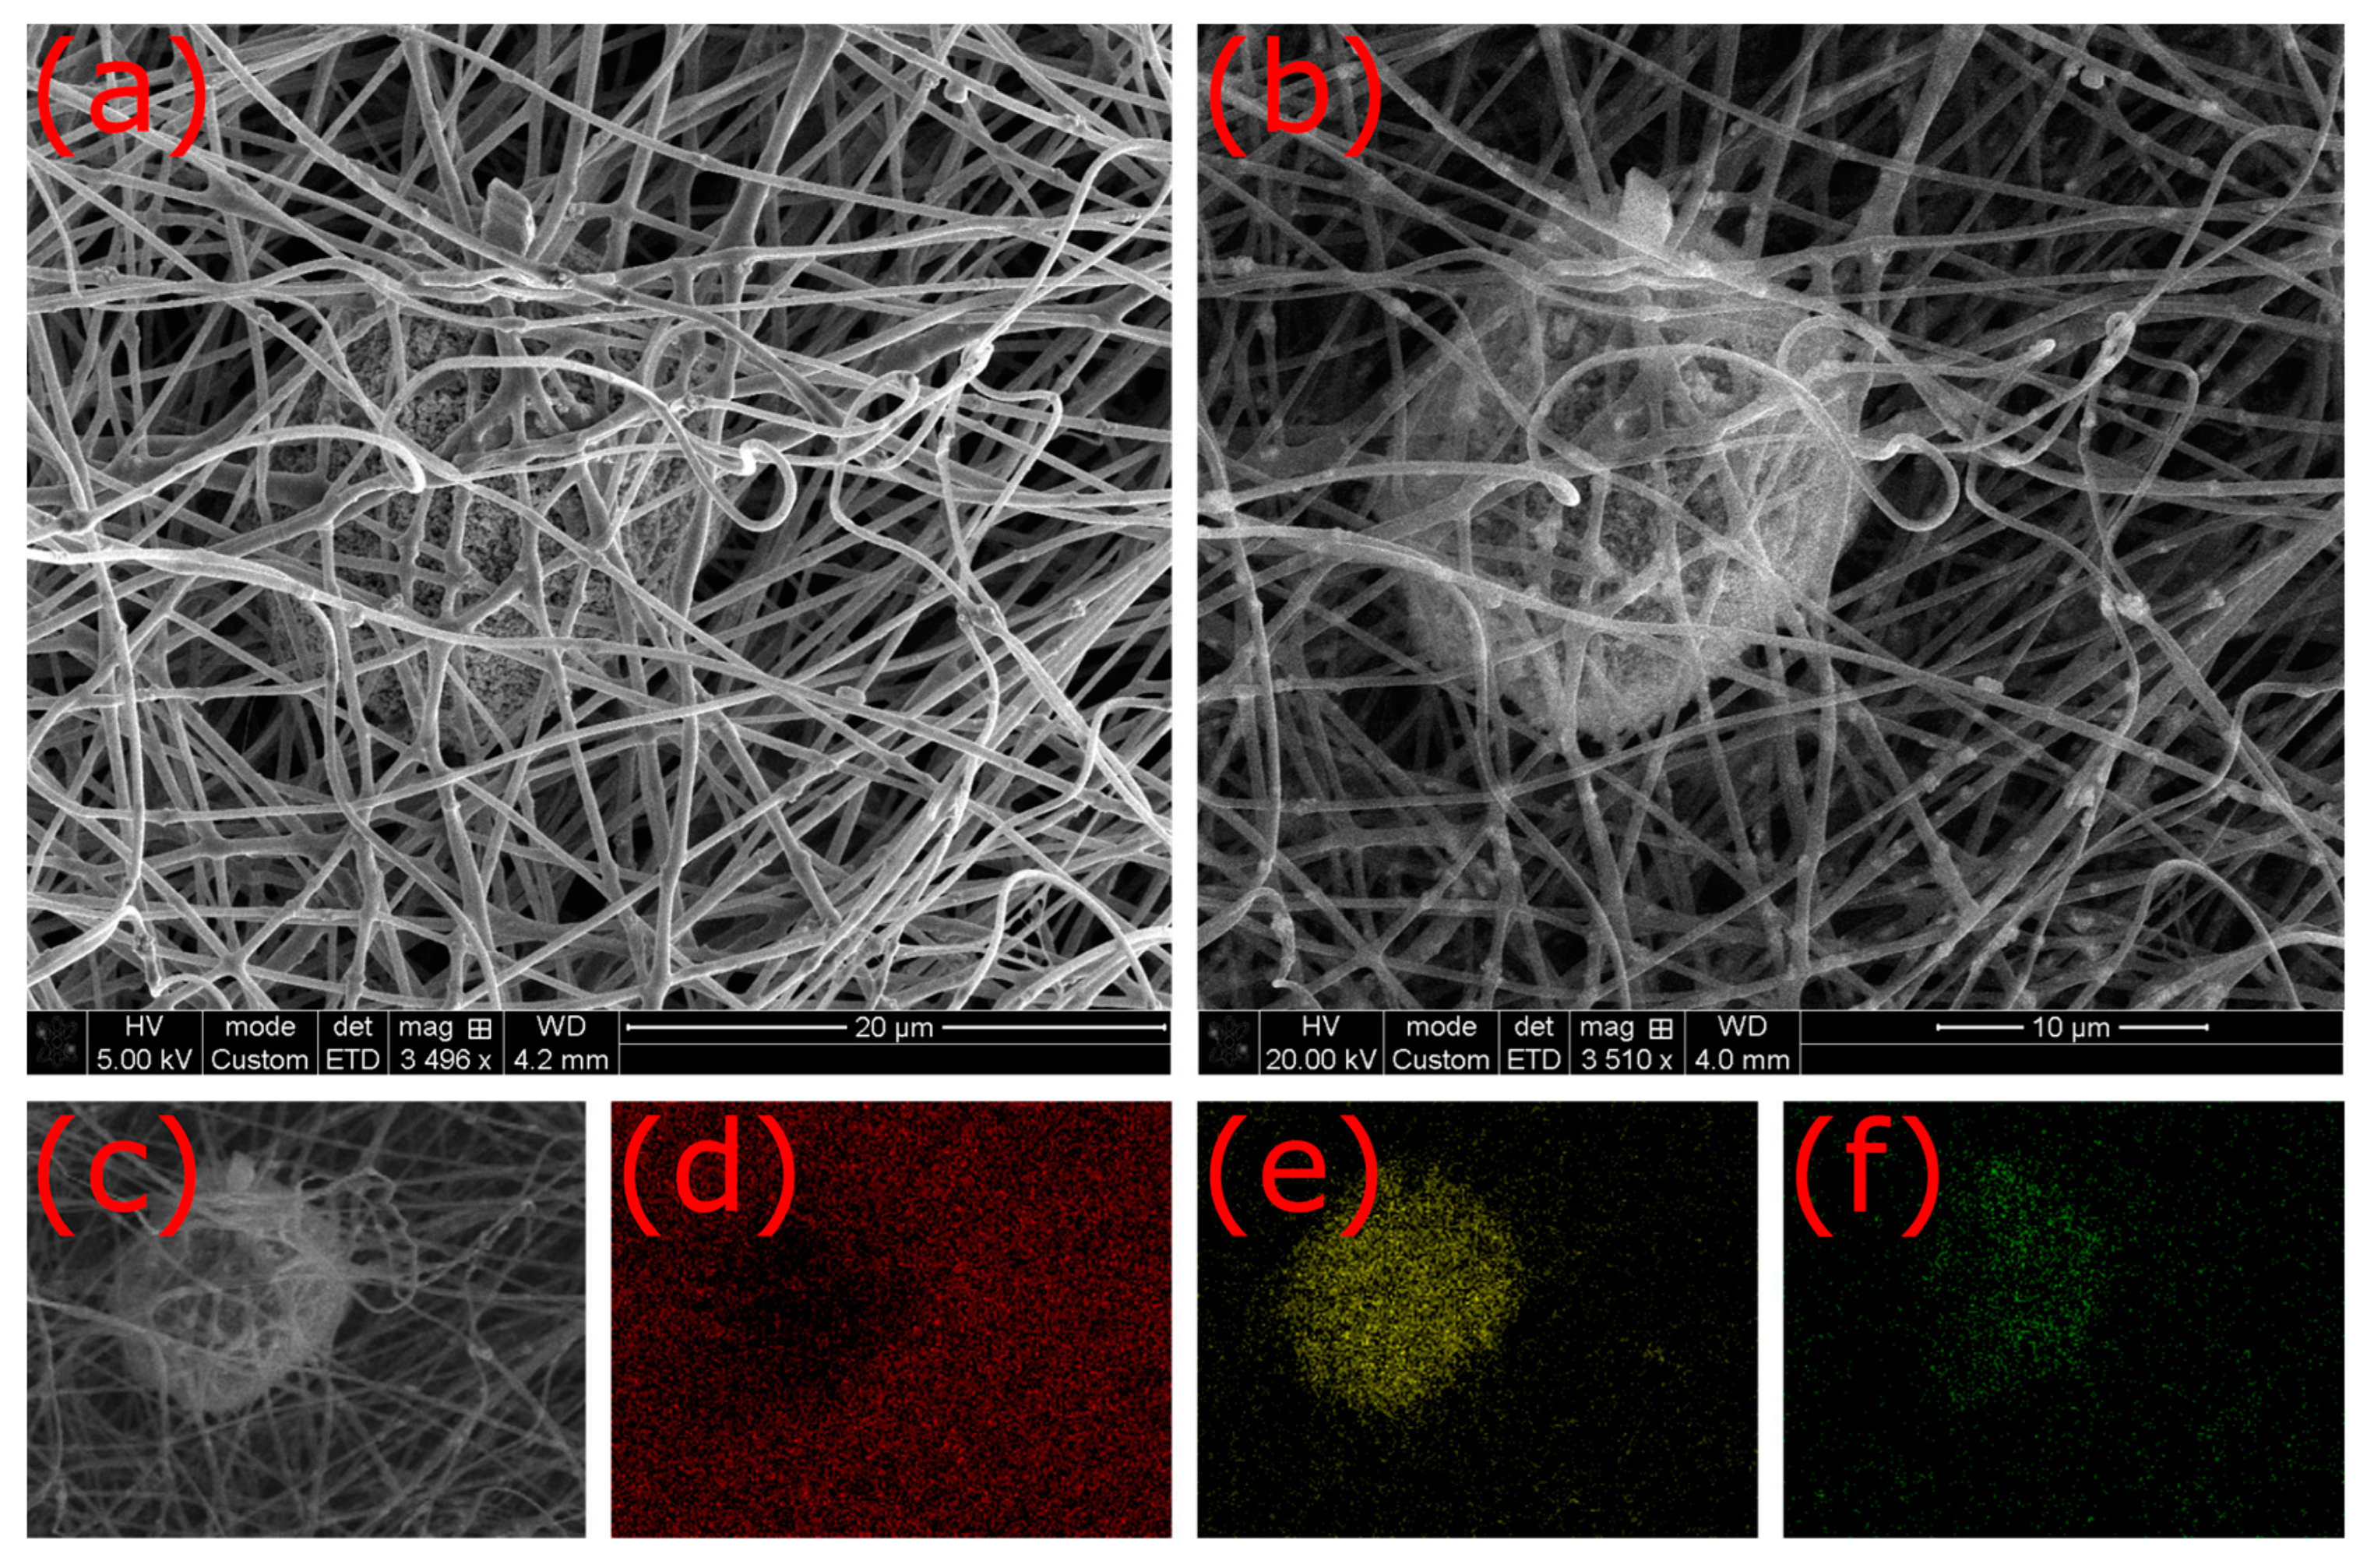
To investigate this further,
Figure 8 depicts a higher-resolution SEM image with carbon and iron maps of an irregularly formed structure. Here, the iron map (
Figure 8c) clearly shows some iron-rich areas, which are not located at the beads visible in
Figure 8a, while the carbon map (
Figure 8b) is relatively homogeneous, with the beads slightly being visible. The same finding—an increased Fe concentration in some areas that are not correlated with beads or other irregular structures on the sample surface—can also be seen in
Figure A11 in the
Appendix C.
It may be concluded that magnetite agglomerations occur more often in lower layers, making them only visible with high-voltage SEM, which is well-known to enable much deeper probing depths [
32]. This corresponds with the results of the TGA measurements, which showed precipitation of the magnetite nanoparticles during the electrospinning process, resulting in lower amounts of magnetite in the upper layers of the nanofiber mat. On the other hand, this makes EDX investigations more complicated, as agglomerations in the very first electrospun layers may often be invisible.
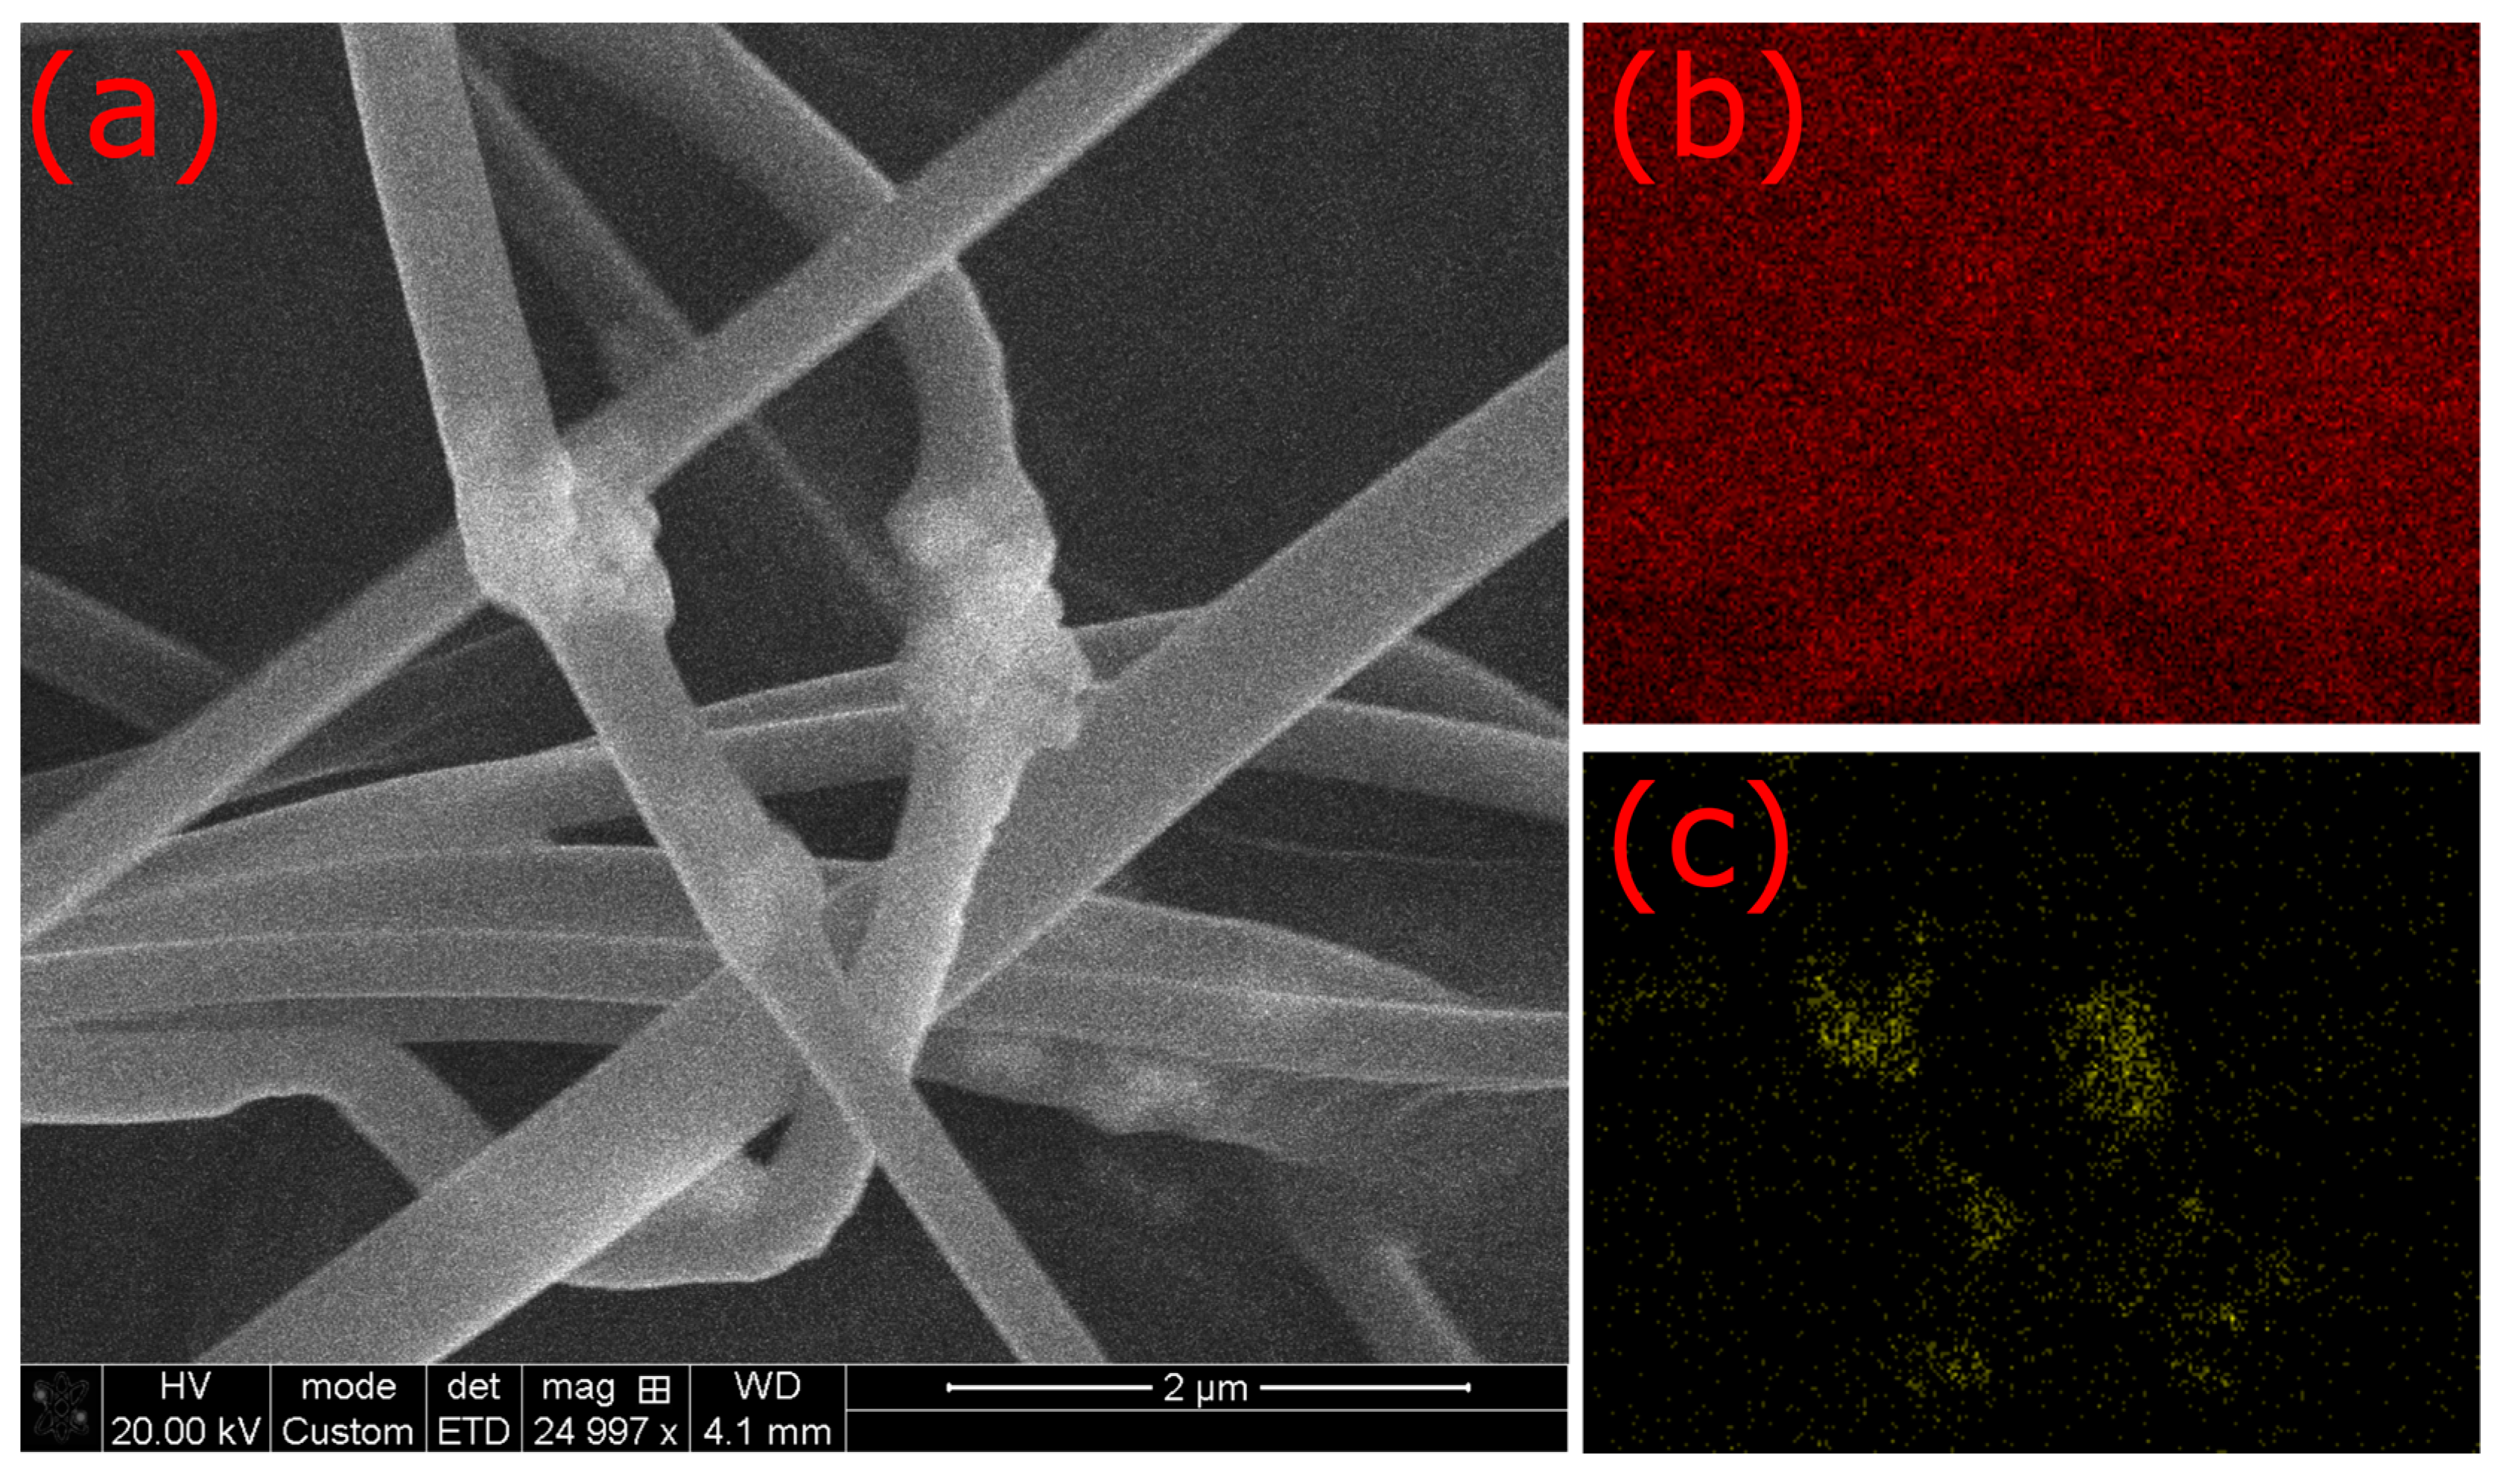
The difference between agglomerations visible in the SEM and EDX can be expected to be reduced in the sample with 25 wt.% solid content in the solution, where the TGA measurements revealed approximately the expected magnetite ratio, indicating reduced precipitation of the nanoparticles during electrospinning.
Figure 9 correspondingly shows SEM images and EDX maps of the sample with 25 wt.% solid content in the solution. First, no large difference between SEM images taken with 5 kV (
Figure 9a) and 20 kV (
Figure 9b) are visible; however, the positions where possibly small agglomerations can be found in the nanofibers are slightly more visible on the latter. These visible deformations of the fibers are also correlated with increased Fe signals and even partly with higher oxide signals. This shows that in the sample spun from the solution with 25 wt.% solid content, the magnetite nanoparticles are also visible in the upper layers that are produced at the end of the electrospinning process. The correlation of the significantly increased Fe content and visible agglomerations in the fibers or between them is also visible in
Figure A12 and
Figure A13 in the Appendix, where higher-magnification SEM images with corresponding EDX maps are shown. This underlines the previous statement that only the nanofiber mats with 25 wt.% solid content in the solution have the expected amount of magnetite nanoparticles in the upper layers.
4. Conclusions
To conclude, we investigated the morphological, chemical, and magnetic properties of nanofiber mats, needleless-electrospun from PAN:magnetite at a ratio of 2:1, with different solid contents from 15–25 wt.% in the DMSO solution. A solid content of 21 wt.% showed the most homogeneous fabric both on a macroscopic level as well as in the microscopic SEM images. At the same solid content, the nanofiber diameter distribution was the narrowest.
Unexpectedly, the TGA measurements revealed higher magnetite concentrations in the samples spun from solutions with higher solid contents, i.e., with higher viscosity, which could reduce the precipitation of magnetite during electrospinning. This effect was also visible in SEM/EDX measurements, where the number of magnetite agglomerations in the upper layers appears to be highest in the sample with the highest solid content.
Magnetic measurements using AGM showed similar shapes of hysteresis loops as well as similar coercive fields for all samples examined.
Overall, for the selected PAN:magnetite ratio of 2:1, a solid content of 21 wt.% in a DMSO solution is optimal for needleless electrospinning, resulting in the most homogeneous samples with a real magnetite content similar to the planned 33 wt.% and similar magnetic properties to the higher or lower solid contents.
In the future, magnetic nanofiber mats with other PAN:magnetite ratios should be investigated to establish a phase diagram of well-spinnable ratios and overall solid contents with good morphological properties. The same should be repeated for nanoparticles from other magnetic materials as well as with other shapes to establish a broad knowledge base for future applications of such magnetic composite nanofibers.

 ,
, 


