Microfluidics as a Ray of Hope for Microplastic Pollution


Abstract
:
1. Introduction
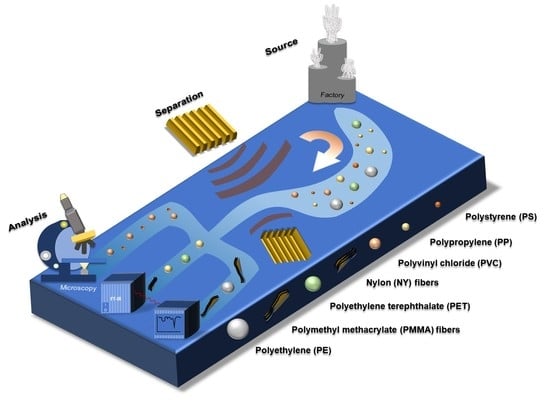
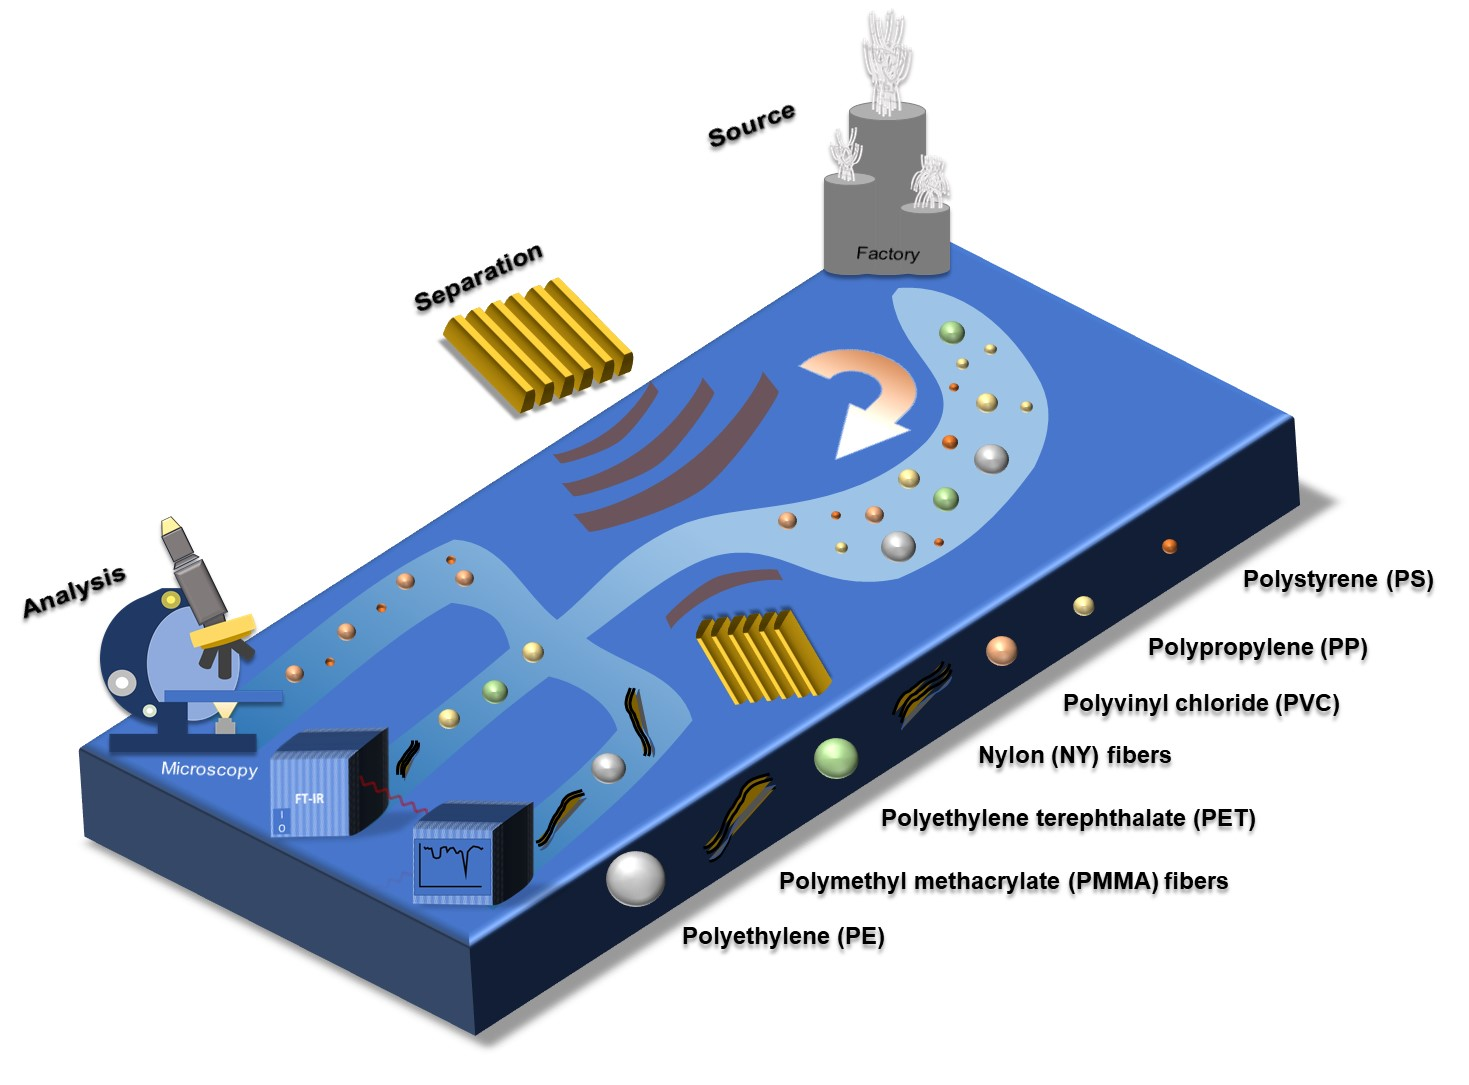
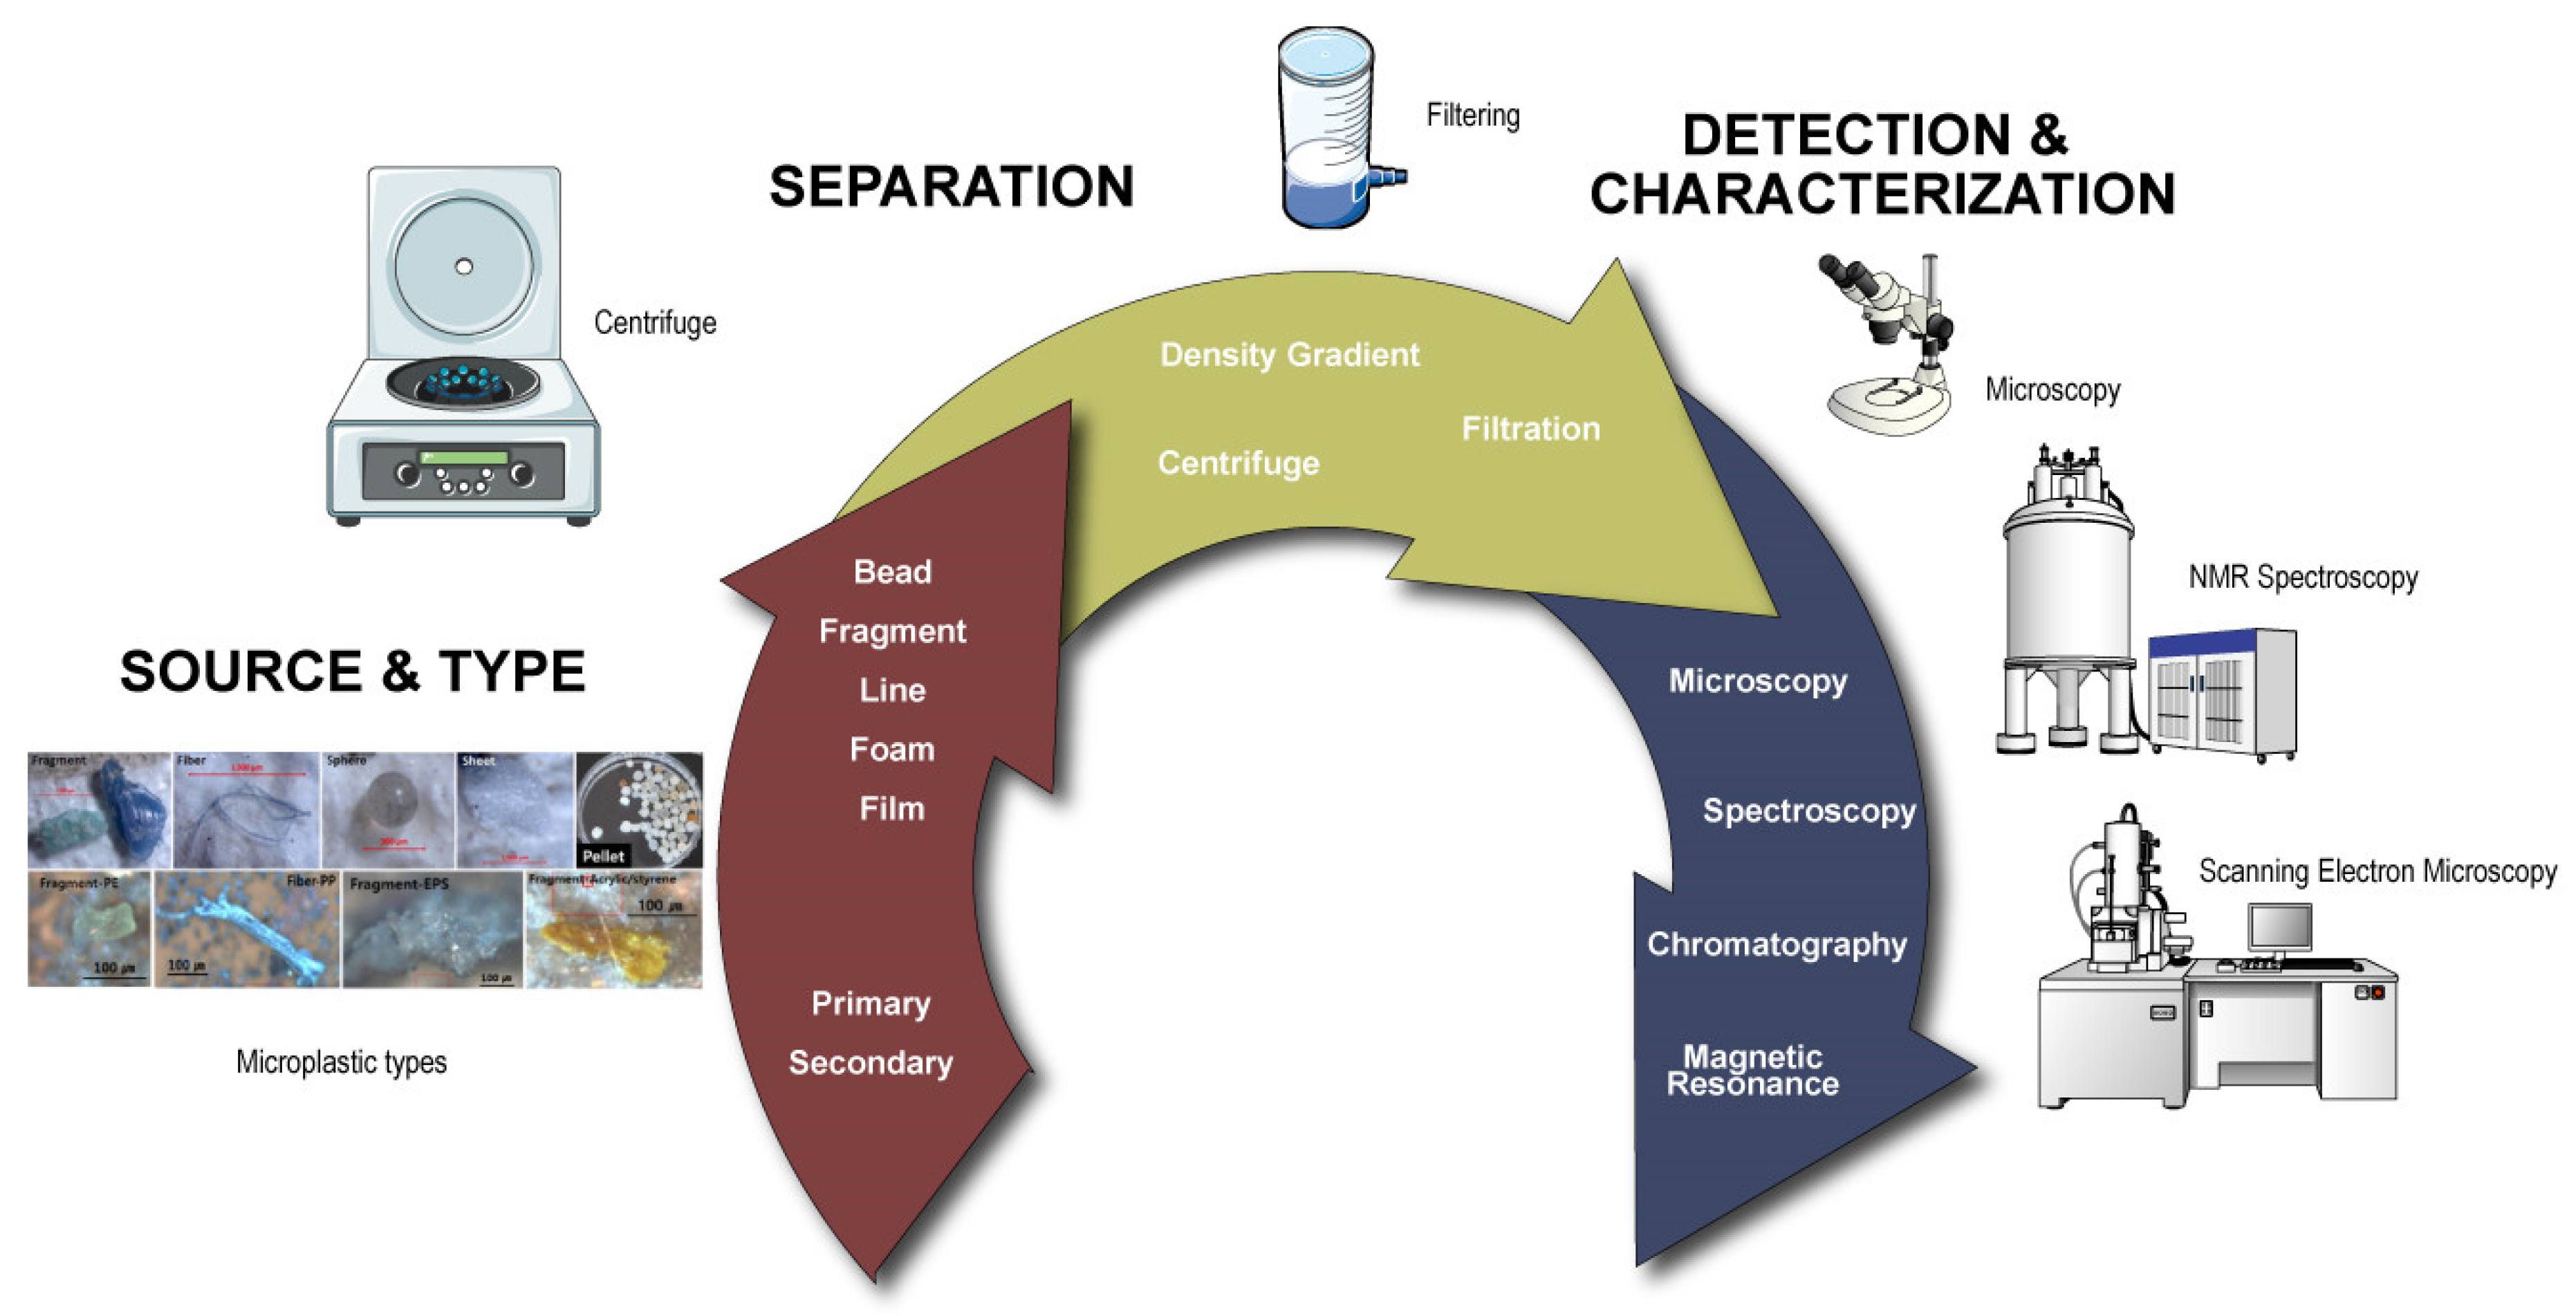
2. Classification of Microplastics
3. Conventional Microplastic Detection Methods
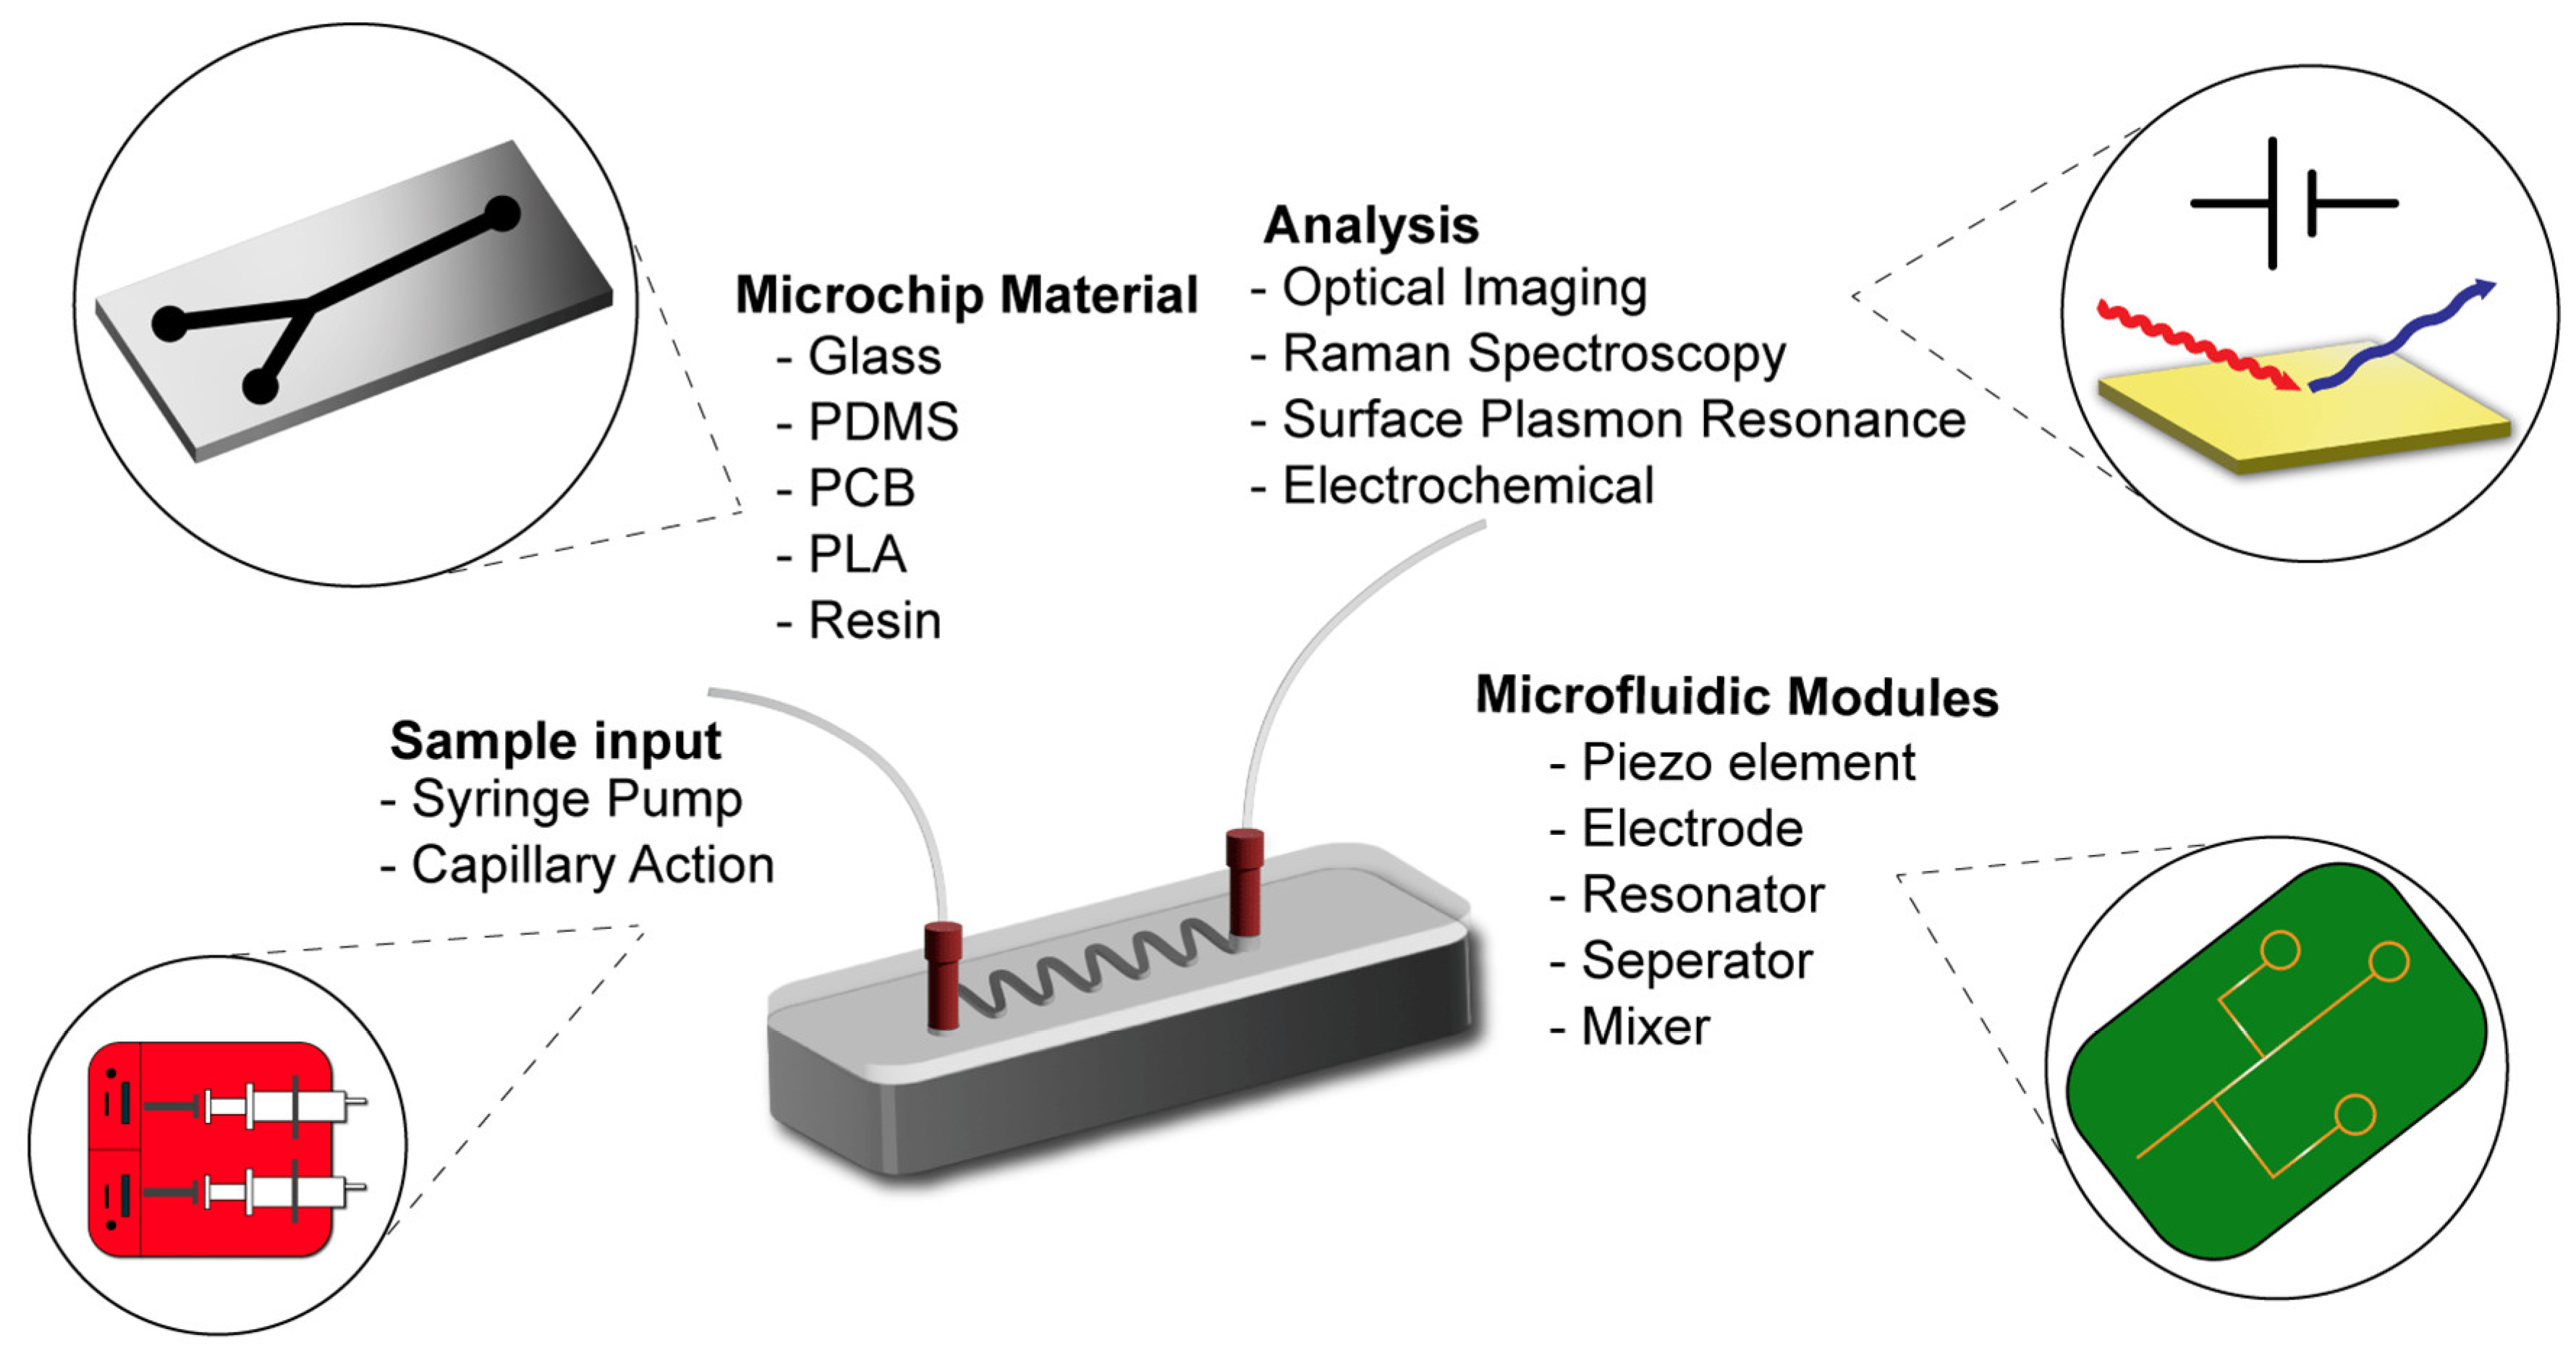
4. Microfluidic Platforms to Tackle MP Pollution
5. Microfluidics as a Separation/Recovery Tool for MPs
6. Detection Strategies for MPs Integrating Microfluidics
7. Microfluidics as a Toxicity Screening Platform for MPs
8. Conclusions and Future Perspectives
Author Contributions
Funding
Institutional Review Board Statement
Informed Consent Statement
Data Availability Statement
Acknowledgments
Conflicts of Interest
References
- Ashby, M. Materials—A Brief History. Philos. Mag. Lett. 2008, 88, 749–755. [Google Scholar] [CrossRef]
- Andrady, A.L.; Neal, M.A. Applications and Societal Benefits of Plastics. Philos. Trans. R. Soc. B Biol. Sci. 2009, 364, 1977–1984. [Google Scholar] [CrossRef] [PubMed] [Green Version]
- Hwang, J.; Choi, D.; Han, S.; Jung, S.Y.; Choi, J.; Hong, J. Potential Toxicity of Polystyrene Microplastic Particles. Sci. Rep. 2020, 10, 7391. [Google Scholar] [CrossRef] [PubMed]
- Iroegbu, A.O.C.; Ray, S.S.; Mbarane, V.; Bordado, J.C.; Sardinha, J.P. Plastic Pollution: A Perspective on Matters Arising: Challenges and Opportunities. ACS Omega 2021, 6, 19343–19355. [Google Scholar] [CrossRef] [PubMed]
- Laskar, N.; Kumar, U. Plastics and Microplastics: A Threat to Environment. Environ. Technol. Innov. 2019, 14, 100352. [Google Scholar] [CrossRef]
- European Commission’s Group of Chief Scientific Advisors. Environmental and Health Risks of Microplastic Pollution; Publications Office of the European Union: Luxembourg, 2019; ISBN 9789276024231. [Google Scholar]
- Lebreton, L.; Royer, S.-J.; Peytavin, A.; Strietman, W.J.; Smeding-Zuurendonk, I.; Egger, M. Industrialised Fishing Nations Largely Contribute to Floating Plastic Pollution in the North Pacific Subtropical Gyre. Sci. Rep. 2022, 12, 12666. [Google Scholar] [CrossRef]
- Hidalgo-Ruz, V.; Gutow, L.; Thompson, R.C.; Thiel, M. Microplastics in the Marine Environment: A Review of the Methods Used for Identification and Quantification. Environ. Sci. Technol. 2012, 46, 3060–3075. [Google Scholar] [CrossRef]
- Enders, K.; Lenz, R.; Beer, S.; Stedmon, C.A. Extraction of Microplastic from Biota: Recommended Acidic Digestion Destroys Common Plastic Polymers. ICES J. Mar. Sci. 2017, 74, 326–331. [Google Scholar] [CrossRef] [Green Version]
- Chen, C.K.; Zhang, J.; Bhingarde, A.; Matotek, T.; Barrett, J.; Hardesty, B.D.; Banaszak Holl, M.M.; Khoo, B.L. A Portable Purification System for the Rapid Removal of Microplastics from Environmental Samples. Chem. Eng. J. 2022, 428, 132614. [Google Scholar] [CrossRef]
- El Hadri, H.; Gigault, J.; Maxit, B.; Grassl, B.; Reynaud, S. Nanoplastic from Mechanically Degraded Primary and Secondary Microplastics for Environmental Assessments. NanoImpact 2020, 17, 100206. [Google Scholar] [CrossRef]
- Hale, R.C.; Seeley, M.E.; La Guardia, M.J.; Mai, L.; Zeng, E.Y. A Global Perspective on Microplastics. J. Geophys. Res. Ocean. 2020, 125, e2018JC014719. [Google Scholar] [CrossRef]
- Zhao, K.; Wei, Y.; Dong, J.; Zhao, P.; Wang, Y.; Pan, X.; Wang, J. Separation and Characterization of Microplastic and Nanoplastic Particles in Marine Environment. Environ. Pollut. 2022, 297, 118773. [Google Scholar] [CrossRef]
- Cheung, P.K.; Fok, L. Evidence of Microbeads from Personal Care Product Contaminating the Sea. Mar. Pollut. Bull. 2016, 109, 582–585. [Google Scholar] [CrossRef]
- An, L.; Liu, Q.; Deng, Y.; Wu, W.; Gao, Y.; Ling, W. Sources of Microplastic in the Environment BT—Microplastics in Terrestrial Environments: Emerging Contaminants and Major Challenges; He, D., Luo, Y., Eds.; Springer International Publishing: Cham, Switzerland, 2020; pp. 143–159. ISBN 978-3-030-56271-7. [Google Scholar]
- Shruti, V.C.; Pérez-Guevara, F.; Elizalde-Martínez, I.; Kutralam-Muniasamy, G. First Study of Its Kind on the Microplastic Contamination of Soft Drinks, Cold Tea and Energy Drinks—Future Research and Environmental Considerations. Sci. Total Environ. 2020, 726, 138580. [Google Scholar] [CrossRef] [PubMed]
- Frias, J.P.G.L.; Nash, R. Microplastics: Finding a Consensus on the Definition. Mar. Pollut. Bull. 2019, 138, 145–147. [Google Scholar] [CrossRef] [PubMed]
- Tirkey, A.; Upadhyay, L.S.B. Microplastics: An Overview on Separation, Identification and Characterization of Microplastics. Mar. Pollut. Bull. 2021, 170, 112604. [Google Scholar] [CrossRef] [PubMed]
- Mariano, S.; Tacconi, S.; Fidaleo, M.; Rossi, M.; Dini, L. Micro and Nanoplastics Identification: Classic Methods and Innovative Detection Techniques. Front. Toxicol. 2021, 3, 636640. [Google Scholar] [CrossRef] [PubMed]
- Shim, W.J.; Hong, S.H.; Eo, S.E. Identification Methods in Microplastic Analysis: A Review. Anal. Methods 2017, 9, 1384–1391. [Google Scholar] [CrossRef]
- Baruah, A.; Sharma, A.; Sharma, S.; Nagraik, R. An Insight into Different Microplastic Detection Methods. Int. J. Environ. Sci. Technol. 2022, 19, 5721–5730. [Google Scholar] [CrossRef]
- Covernton, G.A.; Pearce, C.M.; Gurney-Smith, H.J.; Chastain, S.G.; Ross, P.S.; Dower, J.F.; Dudas, S.E. Size and Shape Matter: A Preliminary Analysis of Microplastic Sampling Technique in Seawater Studies with Implications for Ecological Risk Assessment. Sci. Total Environ. 2019, 667, 124–132. [Google Scholar] [CrossRef] [PubMed]
- Barrows, A.P.W.; Neumann, C.A.; Berger, M.L.; Shaw, S.D. Grab vs. Neuston Tow Net: A Microplastic Sampling Performance Comparison and Possible Advances in the Field. Anal. Methods 2017, 9, 1446–1453. [Google Scholar] [CrossRef]
- Dris, R.; Gasperi, J.; Rocher, V.; Saad, M.; Renault, N.; Tassin, B. Microplastic Contamination in an Urban Area: A Case Study in Greater Paris. Environ. Chem. 2015, 12, 592. [Google Scholar] [CrossRef]
- Vermaire, J.C.; Pomeroy, C.; Herczegh, S.M.; Haggart, O.; Murphy, M. Microplastic Abundance and Distribution in the Open Water and Sediment of the Ottawa River, Canada, and Its Tributaries. Facets 2017, 2, 301–314. [Google Scholar] [CrossRef] [Green Version]
- Monteiro, S.S.; Pinto da Costa, J. Methods for the Extraction of Microplastics in Complex Solid, Water and Biota Samples. Trends Environ. Anal. Chem. 2022, 33, e00151. [Google Scholar] [CrossRef]
- Munno, K.; Helm, P.A.; Jackson, D.A.; Rochman, C.; Sims, A. Impacts of Temperature and Selected Chemical Digestion Methods on Microplastic Particles. Environ. Toxicol. Chem. 2018, 37, 91–98. [Google Scholar] [CrossRef] [PubMed]
- Prata, J.C.; da Costa, J.P.; Duarte, A.C.; Rocha-Santos, T. Methods for Sampling and Detection of Microplastics in Water and Sediment: A Critical Review. TrAC Trends Anal. Chem. 2019, 110, 150–159. [Google Scholar] [CrossRef]
- Courtene-Jones, W.; Quinn, B.; Murphy, F.; Gary, S.F.; Narayanaswamy, B.E. Optimisation of Enzymatic Digestion and Validation of Specimen Preservation Methods for the Analysis of Ingested Microplastics. Anal. Methods 2017, 9, 1437–1445. [Google Scholar] [CrossRef] [Green Version]
- Uurasjärvi, E.; Hartikainen, S.; Setälä, O.; Lehtiniemi, M.; Koistinen, A. Microplastic Concentrations, Size Distribution, and Polymer Types in the Surface Waters of a Northern European Lake. Water Environ. Res. 2020, 92, 149–156. [Google Scholar] [CrossRef] [Green Version]
- Liu, S.; Zheng, J.; Lin, Y.; Liang, K.; Chen, Z.; Ouyang, G. Application of in Vivo Solid Phase Microextraction in Exploring Dynamic Metabolic Alterations in Living Organisms under Exogenous Stimulation. Adv. Sample Prep. 2022, 2, 100021. [Google Scholar] [CrossRef]
- Grbic, J.; Nguyen, B.; Guo, E.; You, J.B.; Sinton, D.; Rochman, C.M. Magnetic Extraction of Microplastics from Environmental Samples. Environ. Sci. Technol. Lett. 2019, 6, 68–72. [Google Scholar] [CrossRef]
- La Nasa, J.; Biale, G.; Mattonai, M.; Modugno, F. Microwave-Assisted Solvent Extraction and Double-Shot Analytical Pyrolysis for the Quali-Quantitation of Plasticizers and Microplastics in Beach Sand Samples. J. Hazard. Mater. 2021, 401, 123287. [Google Scholar] [CrossRef] [PubMed]
- Wagner, J.; Wang, Z.-M.; Ghosal, S.; Rochman, C.; Gassel, M.; Wall, S. Novel Method for the Extraction and Identification of Microplastics in Ocean Trawl and Fish Gut Matrices. Anal. Methods 2017, 9, 1479–1490. [Google Scholar] [CrossRef]
- Fischer, M.; Scholz-Böttcher, B.M. Microplastics Analysis in Environmental Samples—Recent Pyrolysis-Gas Chromatography-Mass Spectrometry Method Improvements to Increase the Reliability of Mass-Related Data. Anal. Methods 2019, 11, 2489–2497. [Google Scholar] [CrossRef]
- Hintersteiner, I.; Himmelsbach, M.; Buchberger, W.W. Characterization and Quantitation of Polyolefin Microplastics in Personal-Care Products Using High-Temperature Gel-Permeation Chromatography. Anal. Bioanal. Chem. 2015, 407, 1253–1259. [Google Scholar] [CrossRef]
- Picó, Y.; Barceló, D. Pyrolysis Gas Chromatography-Mass Spectrometry in Environmental Analysis: Focus on Organic Matter and Microplastics. TrAC Trends Anal. Chem. 2020, 130, 115964. [Google Scholar] [CrossRef]
- Fischer, M.; Scholz-Böttcher, B.M. Simultaneous Trace Identification and Quantification of Common Types of Microplastics in Environmental Samples by Pyrolysis-Gas Chromatography–Mass Spectrometry. Environ. Sci. Technol. 2017, 51, 5052–5060. [Google Scholar] [CrossRef]
- Fu, Q.; Tan, X.; Ye, S.; Ma, L.; Gu, Y.; Zhang, P.; Chen, Q.; Yang, Y.; Tang, Y. Mechanism Analysis of Heavy Metal Lead Captured by Natural-Aged Microplastics. Chemosphere 2021, 270, 128624. [Google Scholar] [CrossRef]
- Tagg, A.S.; Sapp, M.; Harrison, J.P.; Ojeda, J.J. Identification and Quantification of Microplastics in Wastewater Using Focal Plane Array-Based Reflectance Micro-FT-IR Imaging. Anal. Chem. 2015, 87, 6032–6040. [Google Scholar] [CrossRef] [Green Version]
- Anger, P.M.; von der Esch, E.; Baumann, T.; Elsner, M.; Niessner, R.; Ivleva, N.P. Raman Microspectroscopy as a Tool for Microplastic Particle Analysis. TrAC Trends Anal. Chem. 2018, 109, 214–226. [Google Scholar] [CrossRef]
- Vijayalakshmi, R.; Ravindhran, R. Comparative Fingerprint and Extraction Yield of Diospyrus Ferrea (Willd.) Bakh. Root with Phenol Compounds (Gallic Acid), as Determined by Uv–Vis and Ft–Ir Spectroscopy. Asian Pac. J. Trop. Biomed. 2012, 2, S1367–S1371. [Google Scholar] [CrossRef]
- Wang, Z.-M.; Wagner, J.; Ghosal, S.; Bedi, G.; Wall, S. SEM/EDS and Optical Microscopy Analyses of Microplastics in Ocean Trawl and Fish Guts. Sci. Total Environ. 2017, 603–604, 616–626. [Google Scholar] [CrossRef] [PubMed]
- Klein, M.; Fischer, E.K. Microplastic Abundance in Atmospheric Deposition within the Metropolitan Area of Hamburg, Germany. Sci. Total Environ. 2019, 685, 96–103. [Google Scholar] [CrossRef] [PubMed]
- Watteau, F.; Dignac, M.-F.; Bouchard, A.; Revallier, A.; Houot, S. Microplastic Detection in Soil Amended With Municipal Solid Waste Composts as Revealed by Transmission Electronic Microscopy and Pyrolysis/GC/MS. Front. Sustain. Food Syst. 2018, 2, 81. [Google Scholar] [CrossRef] [Green Version]
- Shim, W.J.; Hong, S.H.; Eo, S. Marine Microplastics: Abundance, Distribution, and Composition. In Microplastic Contamination in Aquatic Environments; Elsevier: Amsterdam, The Netherlands, 2018; pp. 1–26. [Google Scholar]
- Park, S.; Zhang, Y.; Lin, S.; Wang, T.-H.; Yang, S. Advances in Microfluidic PCR for Point-of-Care Infectious Disease Diagnostics. Biotechnol. Adv. 2011, 29, 830–839. [Google Scholar] [CrossRef] [PubMed] [Green Version]
- Elsayed, A.A.; Erfan, M.; Sabry, Y.M.; Dris, R.; Gaspéri, J.; Barbier, J.S.; Marty, F.; Bouanis, F.; Luo, S.; Nguyen, B.T.T.; et al. A Microfluidic Chip Enables Fast Analysis of Water Microplastics by Optical Spectroscopy. Sci. Rep. 2021, 11, 10533. [Google Scholar] [CrossRef] [PubMed]
- Pucetaite, M.; Ohlsson, P.; Persson, P.; Hammer, E. Shining New Light into Soil Systems: Spectroscopy in Microfluidic Soil Chips Reveals Microbial Biogeochemistry. Soil Biol. Biochem. 2021, 153, 108078. [Google Scholar] [CrossRef]
- Mohan, J.M.; Amreen, K.; Javed, A.; Dubey, S.K.; Goel, S. Emerging Trends in Miniaturized and Microfluidic Electrochemical Sensing Platforms. Curr. Opin. Electrochem. 2022, 33, 100930. [Google Scholar] [CrossRef]
- Chen, P.; Chen, D.; Li, S.; Ou, X.; Liu, B.-F. Microfluidics towards Single Cell Resolution Protein Analysis. TrAC Trends Anal. Chem. 2019, 117, 2–12. [Google Scholar] [CrossRef]
- Perro, A.; Lebourdon, G.; Henry, S.; Lecomte, S.; Servant, L.; Marre, S. Combining Microfluidics and FT-IR Spectroscopy: Towards Spatially Resolved Information on Chemical Processes. React. Chem. Eng. 2016, 1, 577–594. [Google Scholar] [CrossRef]
- Sierra, I.; Chialanza, M.R.; Faccio, R.; Carrizo, D.; Fornaro, L.; Pérez-Parada, A. Identification of Microplastics in Wastewater Samples by Means of Polarized Light Optical Microscopy. Environ. Sci. Pollut. Res. Int. 2020, 27, 7409–7419. [Google Scholar] [CrossRef]
- Caputo, F.; Vogel, R.; Savage, J.; Vella, G.; Law, A.; Della Camera, G.; Hannon, G.; Peacock, B.; Mehn, D.; Ponti, J.; et al. Measuring Particle Size Distribution and Mass Concentration of Nanoplastics and Microplastics: Addressing Some Analytical Challenges in the Sub-Micron Size Range. J. Colloid Interface Sci. 2021, 588, 401–417. [Google Scholar] [CrossRef] [PubMed]
- Morris, V.J.; Kirby, A.R.; Gunning, P.A. Atomic Force Microscopy for Biologists; World Scientific: Singapore, 2009; ISBN 190897821X. [Google Scholar]
- Burrows, S.D.; Frustaci, S.; Thomas, K.V.; Galloway, T. Expanding Exploration of Dynamic Microplastic Surface Characteristics and Interactions. TrAC Trends Anal. Chem. 2020, 130, 115993. [Google Scholar] [CrossRef]
- Xu, J.L.; Thomas, K.V.; Luo, Z.; Gowen, A.A. FTIR and Raman Imaging for Microplastics Analysis: State of the Art, Challenges and Prospects. TrAC Trends Anal. Chem. 2019, 119, 115629. [Google Scholar] [CrossRef]
- Ly, N.H.; Kim, M.K.; Lee, H.; Lee, C.; Son, S.J.; Zoh, K.D.; Vasseghian, Y.; Joo, S.W. Advanced Microplastic Monitoring Using Raman Spectroscopy with a Combination of Nanostructure-Based Substrates. J. Nanostruct. Chem. 2022, 12, 865–888. [Google Scholar] [CrossRef]
- Peez, N.; Janiska, M.C.; Imhof, W. The First Application of Quantitative 1H NMR Spectroscopy as a Simple and Fast Method of Identification and Quantification of Microplastic Particles (PE, PET, and PS). Anal. Bioanal. Chem. 2019, 411, 823–833. [Google Scholar] [CrossRef]
- Peez, N.; Imhof, W. Quantitative 1 H-NMR Spectroscopy as an Efficient Method for Identification and Quantification of PVC, ABS and PA Microparticles. Analyst 2020, 145, 5363–5371. [Google Scholar] [CrossRef]
- Novotný, J.; Foret, F. Fluid Manipulation on the Micro-Scale: Basics of Fluid Behavior in Microfluidics. J. Sep. Sci. 2017, 40, 383–394. [Google Scholar] [CrossRef]
- Jackson, E.L.; Lu, H. Advances in Microfluidic Cell Separation and Manipulation. Curr. Opin. Chem. Eng. 2013, 2, 398–404. [Google Scholar] [CrossRef] [Green Version]
- Casadevall i Solvas, X.; DeMello, A. Droplet Microfluidics: Recent Developments and Future Applications. Chem. Commun. 2011, 47, 1936–1942. [Google Scholar] [CrossRef]
- Mesquita, P.; Gong, L.; Lin, Y. A Low-Cost Microfluidic Method for Microplastics Identification: Towards Continuous Recognition. Micromachines 2022, 13, 499. [Google Scholar] [CrossRef] [PubMed]
- Akiyama, Y.; Egawa, T.; Koyano, K.; Moriwaki, H. Acoustic Focusing of Microplastics in Microchannels: A Promising Continuous Collection Approach. Sens. Actuators B Chem. 2020, 304, 127328. [Google Scholar] [CrossRef]
- Perera, L.N.; Piyasena, M.E. Acoustic Focusing of Microplastics in Microfabricated and Steel Tube Devices: An Experimental Study on the Effects from Particle Size and Medium Density. Sep. Purif. Technol. 2022, 288, 120649. [Google Scholar] [CrossRef]
- Thompson, J.R.; Wilder, L.M.; Crooks, R.M. Filtering and Continuously Separating Microplastics from Water Using Electric Field Gradients Formed Electrochemically in the Absence of Buffer. Chem. Sci. 2021, 12, 13744–13755. [Google Scholar] [CrossRef]
- Leppänen, I.; Lappalainen, T.; Lohtander, T.; Jonkergouw, C.; Arola, S.; Tammelin, T. Capturing Colloidal Nano- and Microplastics with Plant-Based Nanocellulose Networks. Nat. Commun. 2022, 13, 1814. [Google Scholar] [CrossRef]
- Kitagawa, A.; Ota, M.; Watamura, T.; Tonooka, T.; Murai, Y. Microplastic Particle Trapping through Microfluidic Devices with Different Shaped Pillars. Chem. Eng. Sci. 2022, 264, 118163. [Google Scholar] [CrossRef]
- Zhang, Y.; Zhang, M.; Fan, Y. Assessment of Microplastics Using Microfluidic Approach. Environ. Geochem. Health 2022, 1–8. [Google Scholar] [CrossRef] [PubMed]
- Takahashi, T.; Pawel Herdzik, K.; Nikolaos Bourdakos, K.; Arthur Read, J.; Mahajan, S. Selective Imaging of Microplastic and Organic Particles in Flow by Multimodal Coherent Anti-Stokes Raman Scattering and Two-Photon Excited Autofluorescence Analysis. Anal. Chem. 2021, 93, 5234–5240. [Google Scholar] [CrossRef]
- Colson, B.C.; Michel, A.P.M. Flow-Through Quantification of Microplastics Using Impedance Spectroscopy. ACS Sens. 2021, 6, 238–244. [Google Scholar] [CrossRef]
- Pollard, M.; Hunsicker, E.; Platt, M. A Tunable Three-Dimensional Printed Microfluidic Resistive Pulse Sensor for the Characterization of Algae and Microplastics. ACS Sens. 2020, 5, 2578–2586. [Google Scholar] [CrossRef]
- Wu, T.; Yang, Z.; Hu, R.; Chen, Y.F.; Zhong, H.; Yang, L.; Jin, W. Film Entrainment and Microplastic Particles Retention during Gas Invasion in Suspension-Filled Microchannels. Water Res. 2021, 194, 116919. [Google Scholar] [CrossRef]
- Cacace, T.; Itri, S.; Rani, M.; Federici, S.; Miccio, L.; Bianco, V.; Paturzo, M.; Ferraro, P. Compact Holographic Microscope for Imaging Flowing Microplastics. In Proceedings of the 2021 International Workshop on Metrology for the Sea; Learning to Measure Sea Health Parameters (MetroSea), Reggio Calabria, Italy, 4–6 October 2021; pp. 229–233. [Google Scholar] [CrossRef]
- Youssef, K.; Archonta, D.; Kubiseski, T.J.; Tandon, A.; Rezai, P. Microfluidic Electric Parallel Egg-Laying Assay and Application to in-Vivo Toxicity Screening of Microplastics Using C. Elegans. Sci. Total Environ. 2021, 783, 147055. [Google Scholar] [CrossRef] [PubMed]
- Park, S.J.; Ahn, Y.H. Detection of Polystyrene Microplastic Particles in Water Using Surface-Functionalized Terahertz Microfluidic Metamaterials. Appl. Sci. 2022, 12, 7102. [Google Scholar] [CrossRef]
- Boots, B.; Russell, C.W.; Green, D.S. Effects of Microplastics in Soil Ecosystems: Above and Below Ground. Environ. Sci. Technol. 2019, 53, 11496–11506. [Google Scholar] [CrossRef] [PubMed]
- Chen, L.; Zheng, Y.; Liu, Y.; Tian, P.; Yu, L.; Bai, L.; Zhou, F.; Yang, Y.; Cheng, Y.; Wang, F.; et al. Microfluidic-Based in Vitro Thrombosis Model for Studying Microplastics Toxicity. Lab Chip 2022, 22, 1344–1353. [Google Scholar] [CrossRef]
- Inci, F. Benchmarking a Microfluidic-Based Filtration for Isolating Biological Particles. Langmuir 2022, 38, 1897–1909. [Google Scholar] [CrossRef]
- Thompson, R.C. Microplastics in the Marine Environment: Sources, Consequences and Solutions. In Marine Anthropogenic Litter; Springer International Publishing: Cham, Switzerland, 2015; pp. 185–200. [Google Scholar]
- Granek, E.F.; Brander, S.M.; Holland, E.B. Microplastics in Aquatic Organisms: Improving Understanding and Identifying Research Directions for the next Decade. Limnol. Oceanogr. Lett. 2020, 5, 1–4. [Google Scholar] [CrossRef] [Green Version]
- Akceoglu, G.A.; Saylan, Y.; Inci, F. A Snapshot of Microfluidics in Point-of-Care Diagnostics: Multifaceted Integrity with Materials and Sensors. Adv. Mater. Technol. 2021, 6, 2100049. [Google Scholar] [CrossRef]
- Alhalaili, B.; Popescu, I.N.; Rusanescu, C.O.; Vidu, R. Microfluidic Devices and Microfluidics-Integrated Electrochemical and Optical (Bio)Sensors for Pollution Analysis: A Review. Sustainability 2022, 14, 12844. [Google Scholar] [CrossRef]
- Weisgrab, G.; Ovsianikov, A.; Costa, P.F. Functional 3D Printing for Microfluidic Chips. Adv. Mater. Technol. 2019, 4, 1900275. [Google Scholar] [CrossRef] [Green Version]
- Demirci, U.; Wang, S.; Inci, F.; Chaunzwa, T.L.; Ramanujam, A.; Vasudevan, A.; Subramanian, S.; Chi Fai Ip, A.; Sridharan, B.; Gurkan, U.A. Portable Microfluidic Chip for Detection of Escherichia coli in Produce and Blood. Int. J. Nanomed. 2012, 7, 2591. [Google Scholar] [CrossRef] [Green Version]
- Inci, F.; Saylan, Y.; Kojouri, A.M.; Ogut, M.G.; Denizli, A.; Demirci, U. A Disposable Microfluidic-Integrated Hand-Held Plasmonic Platform for Protein Detection. Appl. Mater. Today 2020, 18, 100478. [Google Scholar] [CrossRef]
- Sturm, M.T.; Myers, E.; Schober, D.; Korzin, A.; Schuhen, K. Development of an Inexpensive and Comparable Microplastic Detection Method Using Fluorescent Staining with Novel Nile Red Derivatives. Analytica 2023, 4, 27–44. [Google Scholar] [CrossRef]
- Fu, W.; Min, J.; Jiang, W.; Li, Y.; Zhang, W. Separation, Characterization and Identification of Microplastics and Nanoplastics in the Environment. Sci. Total Environ. 2020, 721, 137561. [Google Scholar] [CrossRef] [PubMed]


| Instruments | Advantages | Disadvantages | References |
|---|---|---|---|
| Optical Microscopy |
|
| [53] |
| Scanning Electron Microscopy (SEM) |
|
| [43] |
| Transmission Electron Microscopy (TEM) |
|
| [45,54] |
| Atomic Force Microscopy (AFM) |
|
| [55,56] |
| Fourier Transform Infrared (FT-IR) Spectroscopy |
|
| [57] |
| Raman Spectroscopy |
|
| [58] |
| Pyrolysis Gas Chromatography-Mass Spectrometry (Pyro-GC/MS) |
|
| [35] |
| Nuclear Magnetic Resonance (NMR) |
|
| [59,60] |
| Source of MPs | Properties of MPs | Aims of Process | Properties of Microfluidic Platform | Detection Strategies | Validation Parameters, System Advantages, and Highlights of Process | Ref. |
|---|---|---|---|---|---|---|
| Soil | Average diameter of 35 µm. | Capturing of PE pollutants using film thickness. Investigating the motions of MPs at different flow rates and particle volumes. | A PDMS-based chip was designed with a channel width of 400 µm. | An inverted optical microscope was integrated for the quantification and the display of MPs behaviors. | P value was calculated as 0 in the limit of critical number of capillaries (≤1.3 × 10⁻⁴). The increase in the film thickness improved the capture efficiency of MPs. | [74] |
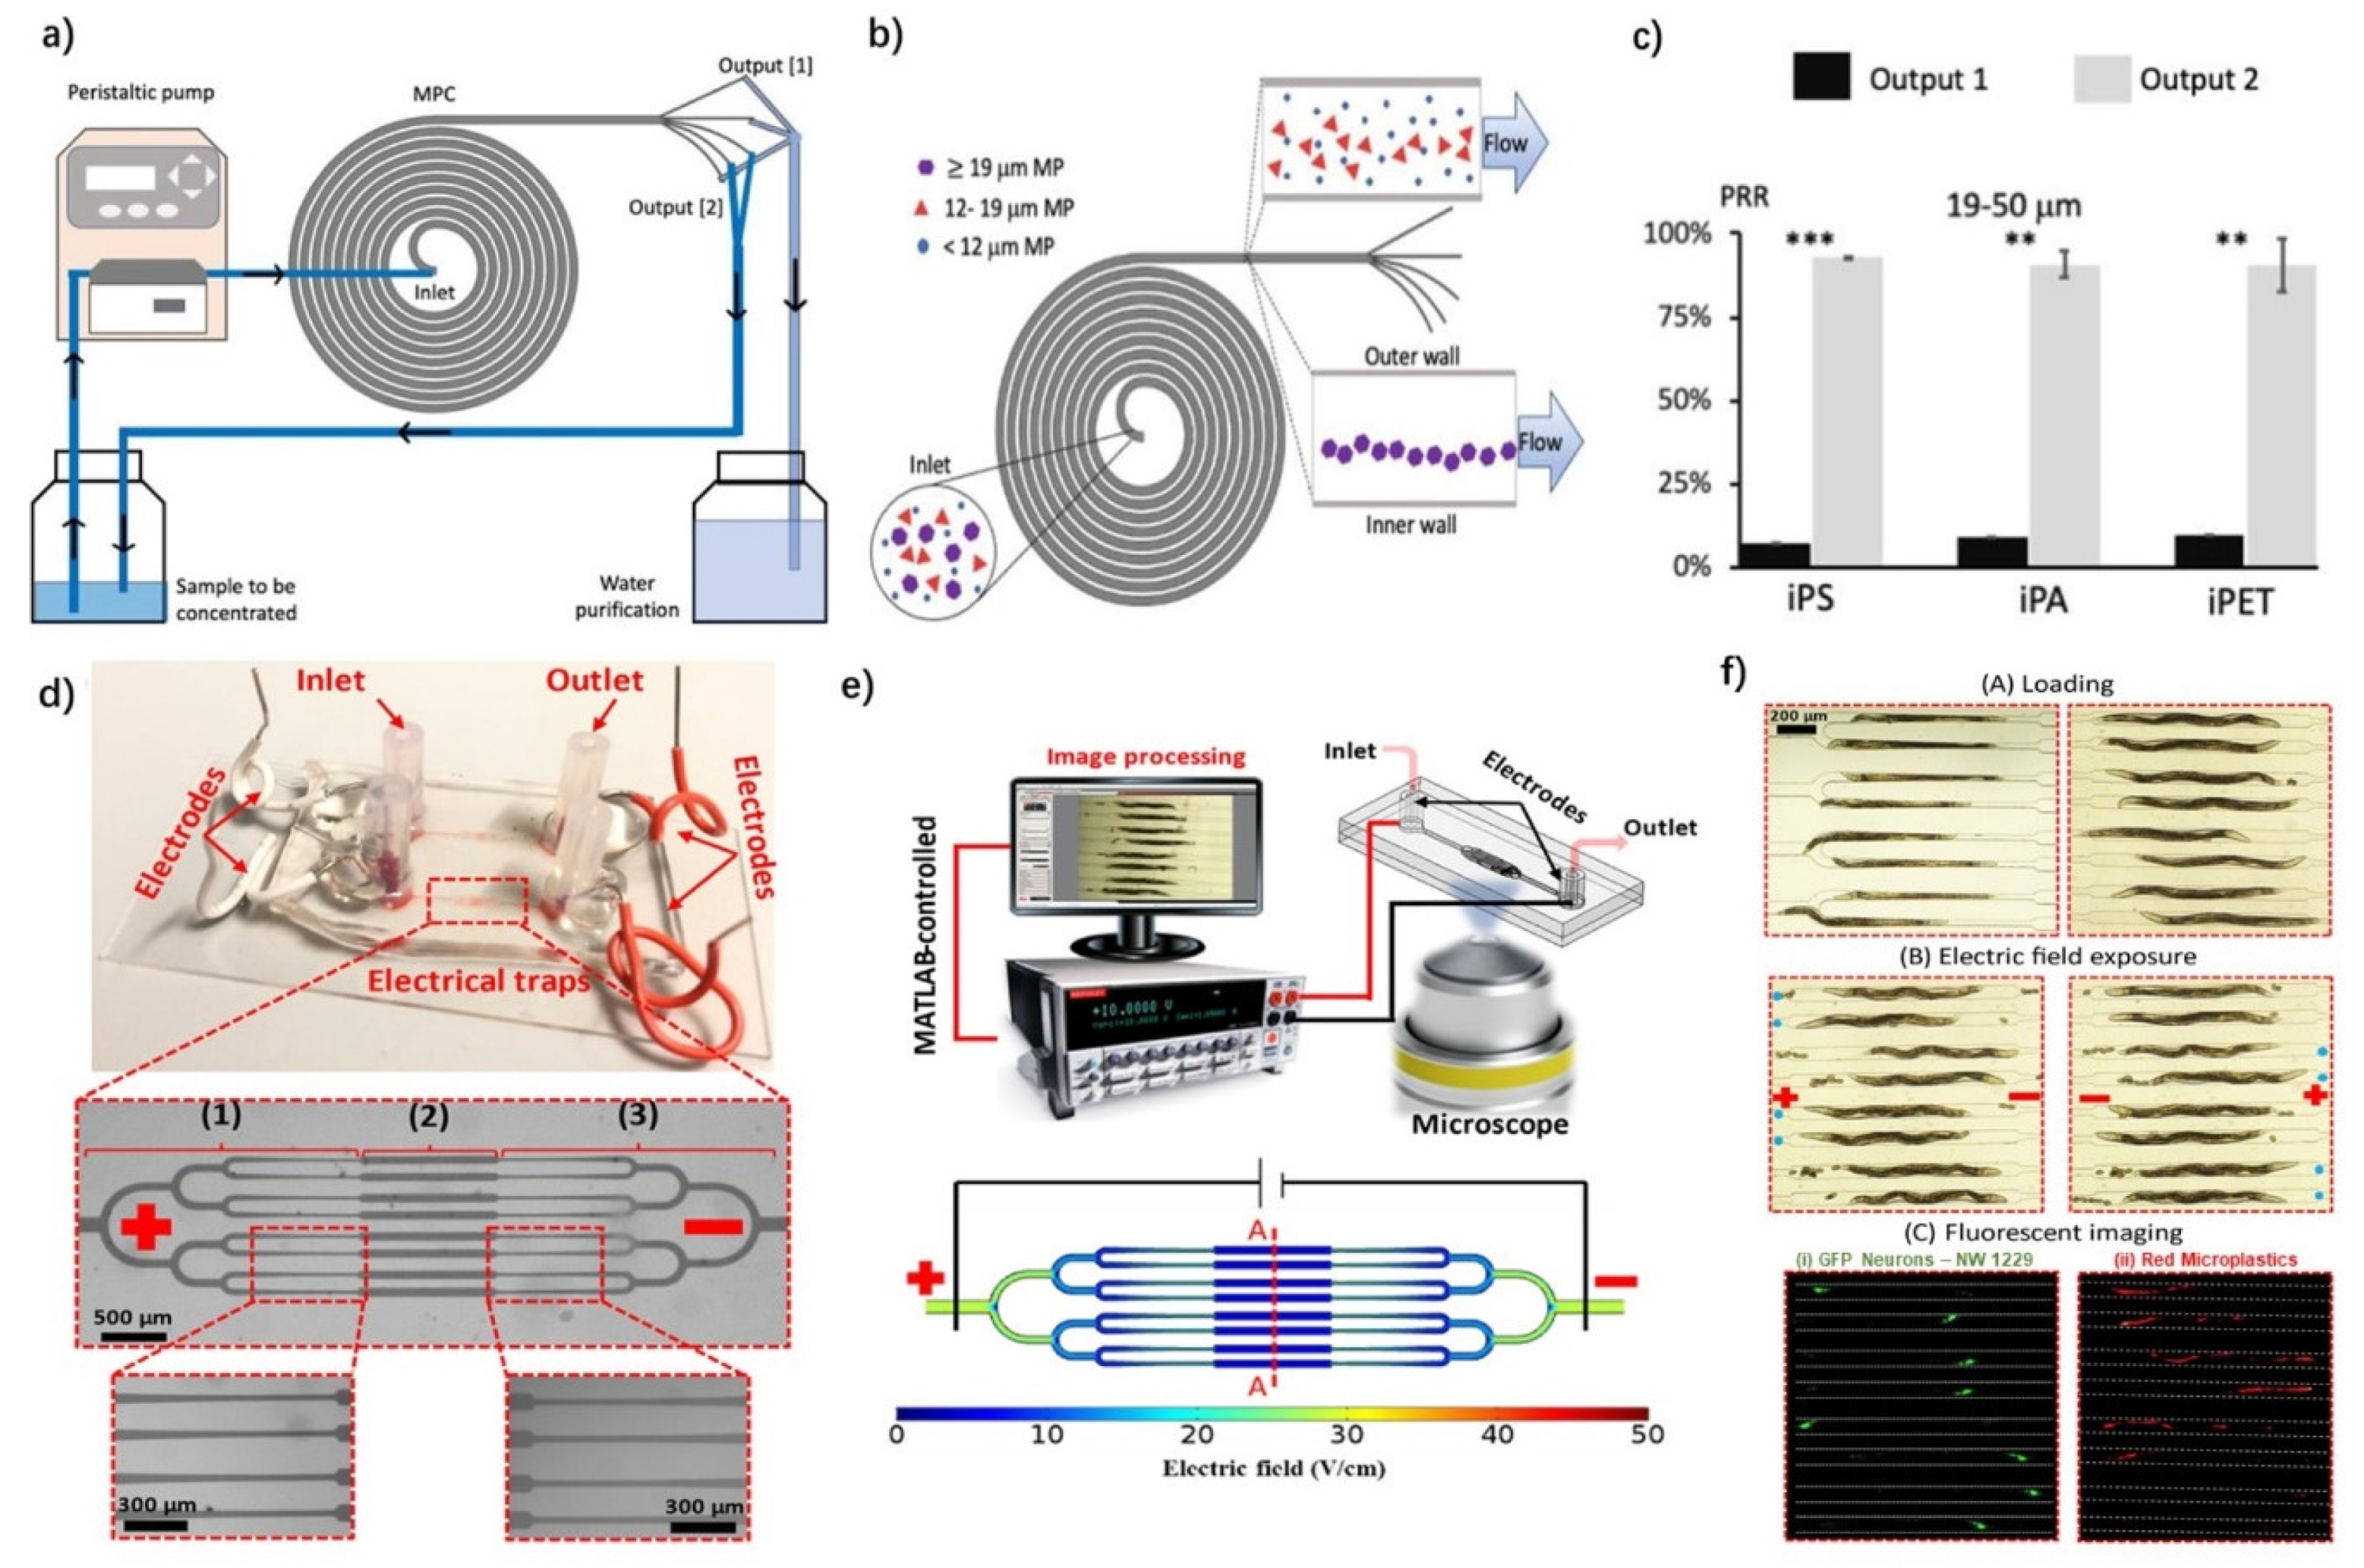
| Soil | PS MPs with sizes of 1 µm at concentrations of 100 mg/L and 1000 mg/L. | Evaluating the effects of PS on egg-laying of Caenorhabditis elegans (C. elegans) | A PDMS-based chip was designed with 8 channels (width of 85 µm). The chip also integrated fluorescence imaging. | Fluorescence imaging was utilized for the detection and monitoring of C. elegans GFP expression and Nile Red-stained MPs. | The analytical limit of the designed device was 40 worms/h. Significant reduction in the egg-laying and size of the worms was observed with the implementation of a PS MP concentration of 1000 mg/L. | [76] |
| Soil | PS MPs with a size of 1 µm with different labels (red, green, and blue fluorescent). | Investigating the impact of PS MPs on thrombosis. | A PDMS-based chip was designed with channels with a width and height of 100 µm. The chip incorporated a fluorescence imaging platform. | A confocal microscope was integrated for fluorescently stained MPs, and the monitoring of MPs with respect to the thrombosis effect. | The consistency of the experiment was demonstrated by obtaining a p-value lower than 0.0001. MP-invaded thrombosis and normal thrombosis were compared using Bland–Altman analysis (n = 16), which revealed a mean bias of 69.10 mg/2 mL with a standard deviation (SD) of 17.43. MPs bound to fibrins reduced the binding between fibrins and platelets. Hence, the formation of thrombosis was demonstrated. | [79] |
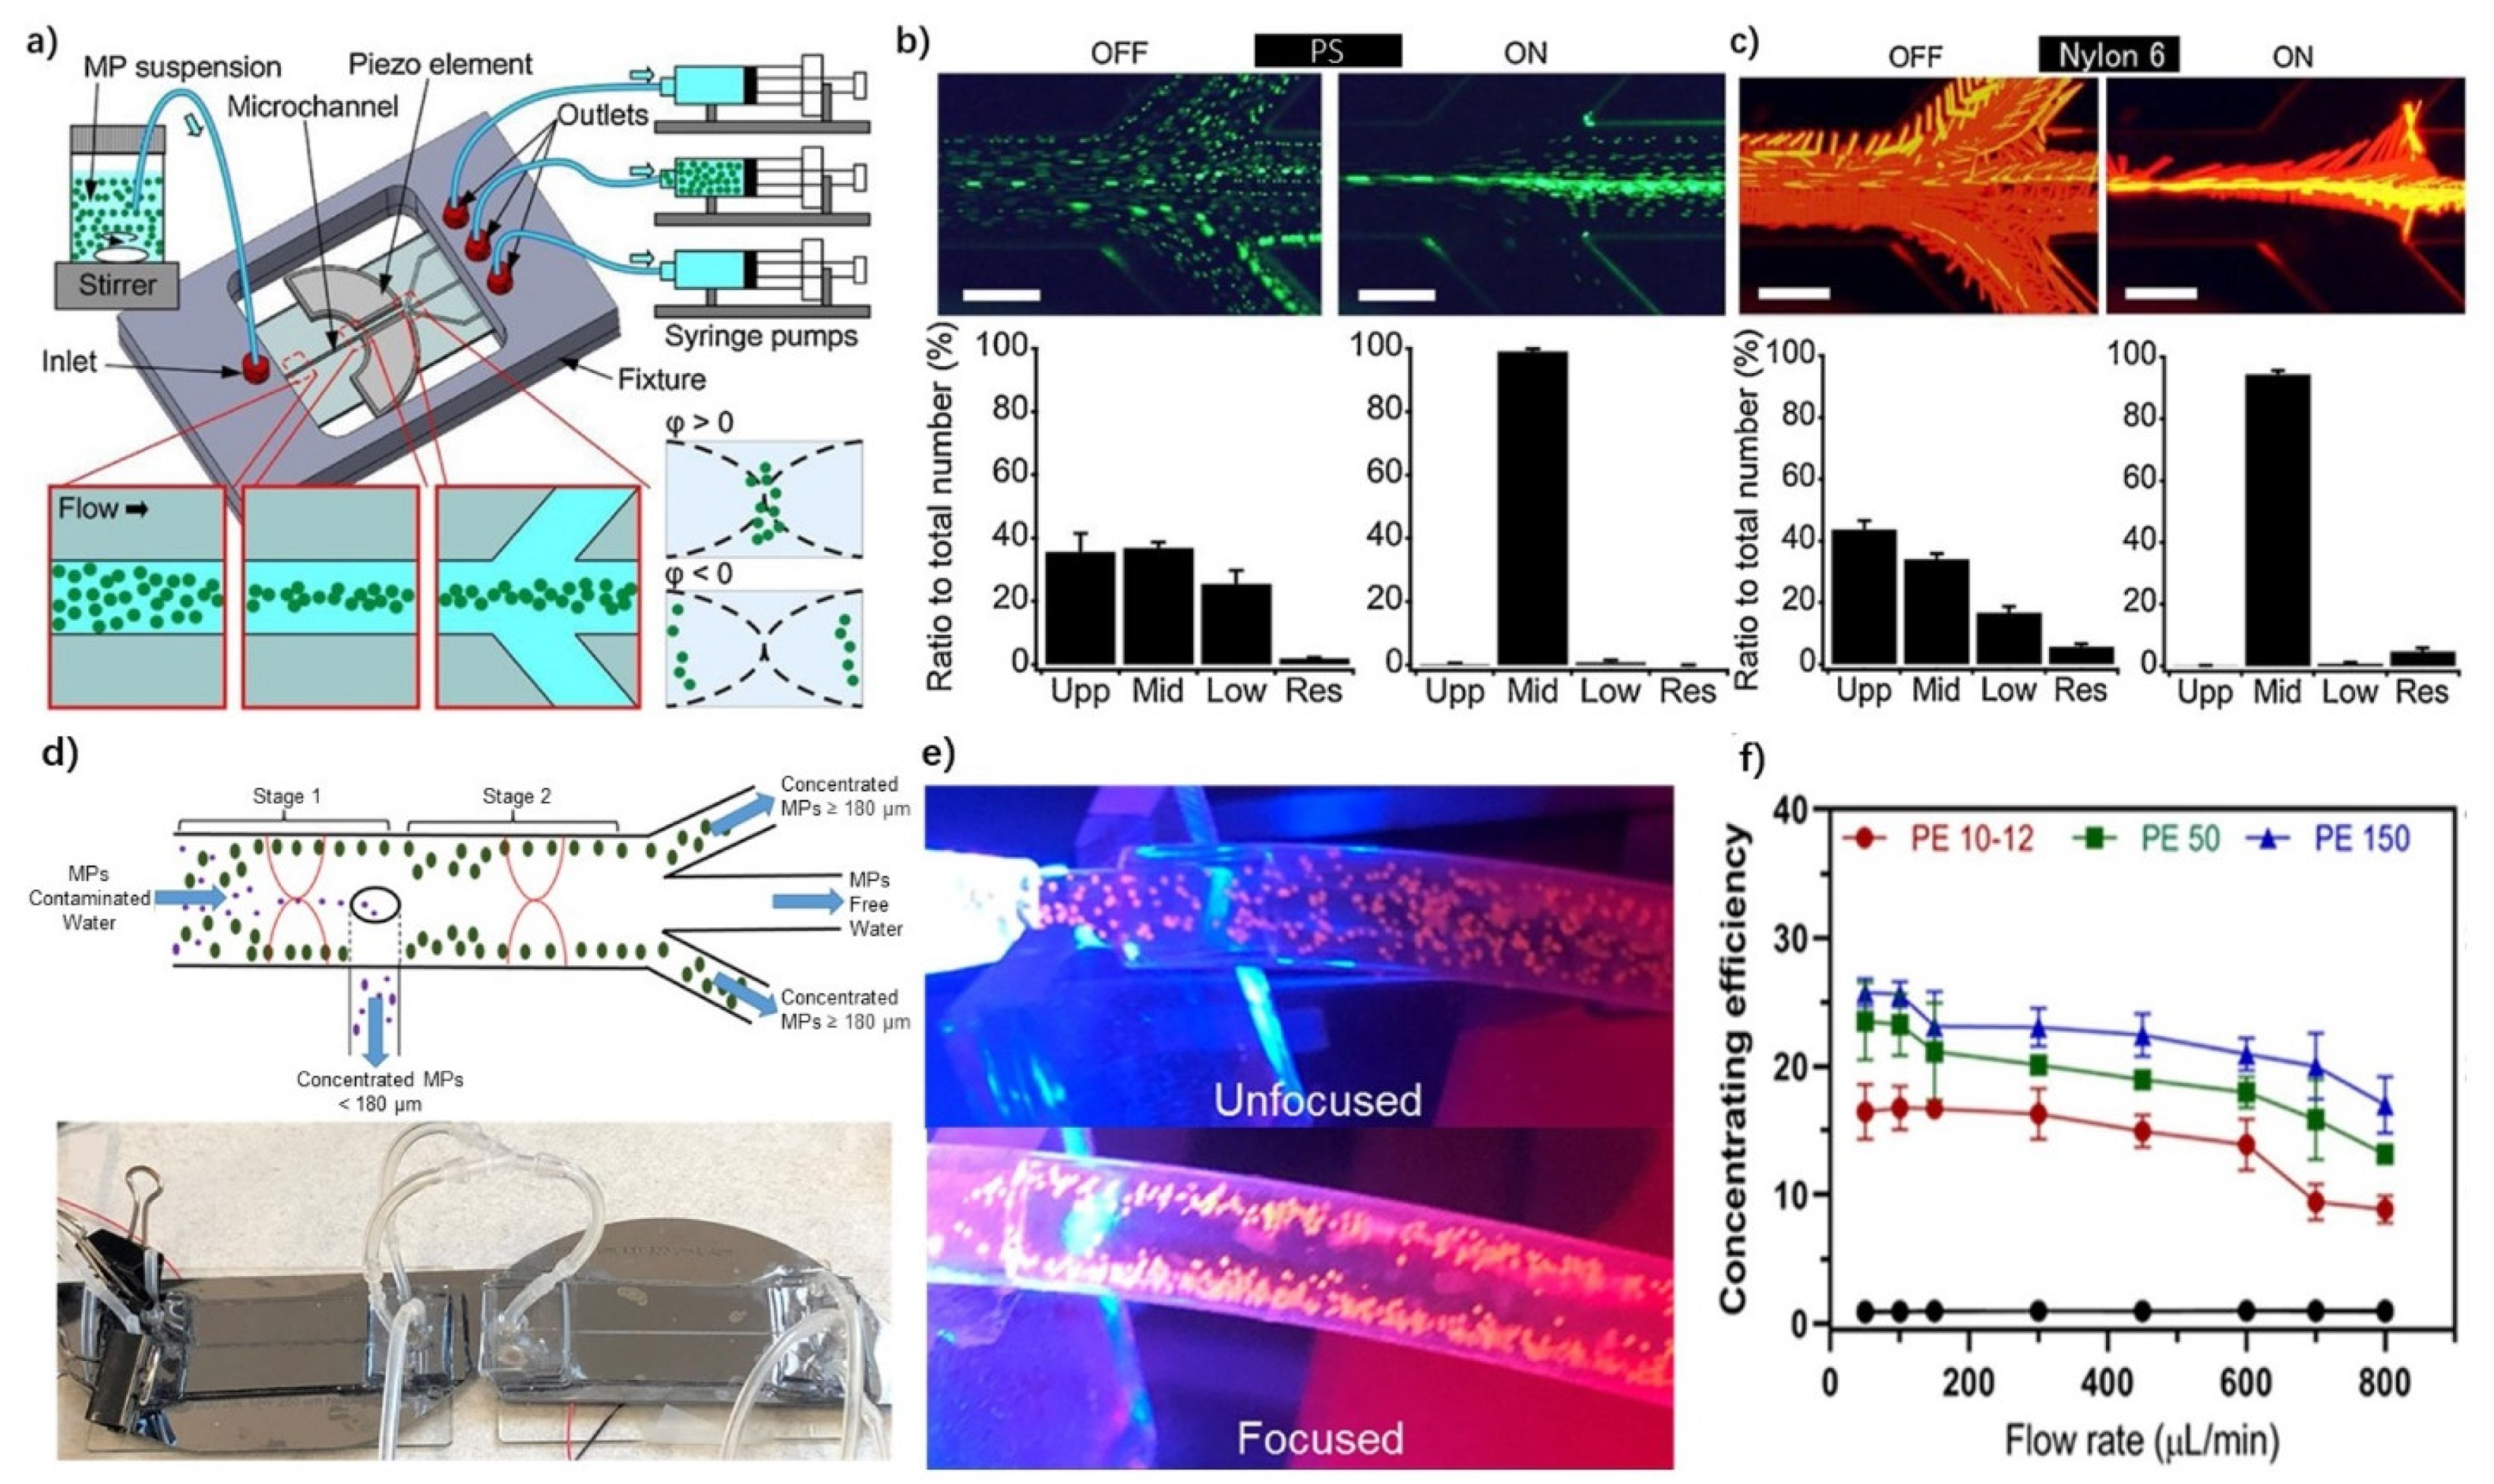
| Wastewater | PS with a diameter of 15 µm, and PET and nylon 6 fibers with a length of 200 µm. | Collecting MPs in the middle of the channel. | A Pyrex glass microfluidic chip with channels having a width of 707 µm and a depth of 505 µm was designed. This platform incorporated an acoustic focusing device. | Nile Red-stained MPs were collected using the acoustic focusing strategy, and these collected pollutants were displayed and analyzed via fluorescence microscopy. | Bulk Acoustic Wave (BAW) provided an enhanced limit of detection (LOD) for the collection of MPs with a diameter of 1 µm. MPs with a diameter of about 5 µm were collected effectively. | [65] |
| Wastewater—laundry outlets | MPs with diameters varying between 6 and 300 µm. | Examining the effect of medium density and particle size on the collection of MPs | A PDMS-based microfluidic platform was designed with steel tube channels possessing a width of 484 µm. | MPs were collected using an acoustic focusing strategy, and epifluorescence microscopy was implemented for dye-free MP monitoring. An automated cell counter was used for MP concentration measurement. | After 10 serial separations were carried out, the results demonstrated 90% reliability. MPs smaller than 180 µm in diameter were isolated with a higher yield. | [66] |
| Seawater, deep-sea sediments, and food containers | MPs with an average diameter of 19 µm. | Collection of MPs at the outlet of the microfluidic system. | A PDMS-based chip was designed with channels with a width of 500 µm and a height of 220 µm. The chip was combined with optical photothermal infrared spectroscopy (O-PTIR). | MP monitoring and size measurement were carried out using fluorescence microscopy and particle recovery rates (PRRs), respectively. In addition to size determinations, O-PTIR and Raman spectroscopy were utilized for the chemical analysis of MPs. | This device exhibited 90% separation and detection efficiency for MPs larger than 19 µm in diameter. p value was calculated as <0.01 with the implementation of Welch’s t-test for all independent experiments. The recovery rate of MPs was higher than that of density separation and filtration methods. | [10] |
| Tea bags | MPs with a diameter of 10, 20, and 30 µm. | Detection of size and quantification of the concentrations of MPs. | A PDMS-based chip was designed with a channel with a width of 750 µm and a length of 400 µm. It incorporated resistive pulse sensors (RPSs). | Optical microscopy and scanning electron microscopy (SEM) were used for MP observation. Resistive pulse sensors (RPSs) were utilized for MP size measurements. | A 10-fold increase in sensitivity allowed the device to identify particles with a diameter of 2 µm and a lowest concertation of 14 particles/mL. The average size and concentration of the MPs were measured as 21.9 µm and 6.52 × 10⁴ particles/mL, respectively. | [73] |
| Water | PS MPs with various densities (2 × 10⁸, 1 × 10⁹, 3 × 10⁹, and 6 × 10⁹ g/mL). | Collection of PS MPs on the HMDS-coated wells and detection using terahertz spectroscopy. | A PDMS-based chip was designed with channels with a width of 2 mm and a height of 20 µm, including wells with a width of 3 µm and a depth of 10 µm. | Terahertz spectroscopy was used in determining the densities of captured PS via alterations in frequency. | For number of PS < 30, the sensitivity coefficient α was calculated as 7.1 × 10⁻⁴. In situ PS detection was accomplished by continuous monitoring via terahertz spectroscopy. This system provides a cost-efficient strategy. | [77] |
| Crumbled coffee and yogurt cups | MPs with a maximum detected size of 125 × 81 µm in the solution. | Imaging of MPs performed for structural analysis and measurement of the number of particles. | A PMMA-based microfluidic platform was fabricated with channels with a width of 1000 µm and a height of 200 µm. This platform incorporated a 3D hologram microscope. | 3D hologram microscope for the monitoring of MPs, and the measurement of their size and morphological properties. | MPs were separated, and their dimensions and shapes were further characterized. | [75] |
| Cotton and Acrylic synthetic fibers, storage containers, and yeast | PE MPs ranging in size from 10 µm to 45 µm, and PS MPs ranging in size from 9.5 µm to 11.5 µm. | Increased selectivity and sensitivity for MPs was achieved using Nile Red fluorescent dye. | A 3D-printed PDMS microfluidic system was fabricated with channels with a length of 400 mm. The 3D-printed platform incorporated an inverted microscope. | Nile Red-stained MPs were monitored with an inverted microscope, and ImageJ software was utilized for MPs identification. | The use of-spherical MPs resulted in higher-quality fluorescence. The highest-intensity fluorescence was obtained at the lowest flow rate and the highest temperature. | [64] |
| Commercial Products; PS (Baseline Chromtech, Tianjin, China), PE (Alfa Aesar, USA), and PP (Kingao Chemical, Hubei, China) | PS with a diameter between 50–200 µm. PE with a diameter of 500 µm. PP with a diameter between 50 and 150 µm. | Detection of MPs using Nile Red fluorescent dye. | A PMMA-based microfluidic platform was designed. The channels were fabricated with a width of 400 µm and a height of 500 µm. FT-IR was integrated with this platform. | Nile Red-stained MPs were monitored under a fluorescence microscope, and chemical composition analysis was performed using FT-IR spectroscopy. | The limit-of-detection (LOD) was determined as a diameter of 20 µm for stained MPs. Video and continuous monitoring provided the advantage of real-time detection of particles. The number of MPs, size, and their mobility were measured efficiently. | [70] |
| Commercial Product; PMMA and PS (Thermo Fisher Scientific, Duke Scientific, Polysciences Inc. and Microbeads AS) | 80 µm size of PS, and 20 µm size of PMMA | Separation and characterization of PS and PMMA MPs using Raman and FT-IR spectroscopy. | A PDMS-based microfluidic chip was combined with spectroscopic methods. | Monitoring and classification with image processing of MPs were performed with a camera and IDEAS Analysis Software, respectively. FT-IR and Raman spectroscopy were utilized for the chemical analysis of MPs. | The LOD ranged down to MPs with a diameter of 20 m. MPs were separated and collected using the size sorting method. In this region, analyses were performed using spectroscopy techniques to characterize the chemical structures of MPs. | [48] |
| Commercial Standards | PMMA with a size of 40 ± 18 µm, PS with a size of 39.5 ± 1 µm, LDPE with a size of 300 µm (irregular). | Anti-Stokes Raman Scattering and Two-Photon Excited Autofluorescence Analysis were used for detection and separation of MPs. | A quartz glass flow cell with an inner thickness of 500 μm, a width of 8 mm, and a length of 40 mm was integrated with Raman spectroscopy. | Coherent Anti-Stokes Raman Scattering (CARS) was utilized to detect MPs, and their amount was calculated through relevant fluorescence intensity analysis. | Analysis of water-submerged targets is possible. | [71] |
| Commercial Standard | PE with sizes of 212−250 μm, 300−355 μm, 425−500 μm, 500−600 μm, 600−710 μm, and 850−1000 μm. | Impedance measurement for the detection of microplastics. | Gold-plated circuit boards as electrode bases, supported by acrylic and epoxy, were utilized. | Impedance spectroscopy was used to understand the size and material characteristics of MPs by measuring and utilizing the electrical properties of pollutants. | This system provided high-throughput and real-time measurement. | [72] |
| Commercial Standard | Carboxyl-functionalized PS beads with a size of 1 mm. | Electrochemical separation of microplastics observed with optical imaging. | A glass/PDMS microfluidic chip with a length of 15.0 mm, a width of 100.0 mm width, and a microchannel with a thickness of 6.0 mm was fabricated using the photolithography method. | An inverted microscope was implemented for the real-time monitoring of MPs. COMSOL simulation was performed for the detection of MP behaviors during the separation process. | Continuous separation was achieved. | [67] |
Disclaimer/Publisher’s Note: The statements, opinions and data contained in all publications are solely those of the individual author(s) and contributor(s) and not of MDPI and/or the editor(s). MDPI and/or the editor(s) disclaim responsibility for any injury to people or property resulting from any ideas, methods, instructions or products referred to in the content. |
© 2023 by the authors. Licensee MDPI, Basel, Switzerland. This article is an open access article distributed under the terms and conditions of the Creative Commons Attribution (CC BY) license (https://creativecommons.org/licenses/by/4.0/).
Share and Cite
Ece, E.; Hacıosmanoğlu, N.; Inci, F. Microfluidics as a Ray of Hope for Microplastic Pollution. Biosensors 2023, 13, 332. https://doi.org/10.3390/bios13030332
Ece E, Hacıosmanoğlu N, Inci F. Microfluidics as a Ray of Hope for Microplastic Pollution. Biosensors. 2023; 13(3):332. https://doi.org/10.3390/bios13030332
Chicago/Turabian StyleEce, Emre, Nedim Hacıosmanoğlu, and Fatih Inci. 2023. "Microfluidics as a Ray of Hope for Microplastic Pollution" Biosensors 13, no. 3: 332. https://doi.org/10.3390/bios13030332