Fabrication of a Molecularly Imprinted Nano-Interface-Based Electrochemical Biosensor for the Detection of CagA Virulence Factors of H. pylori


Abstract
:1. Introduction
2. Materials and Methods
2.1. Chemical Reagents Used
2.2. Molecular Dynamics Simulations
2.3. Binding Energy Calculation
2.4. Synthesis of Nanomaterials
2.5. Synthesis of CagA-Specific MIP
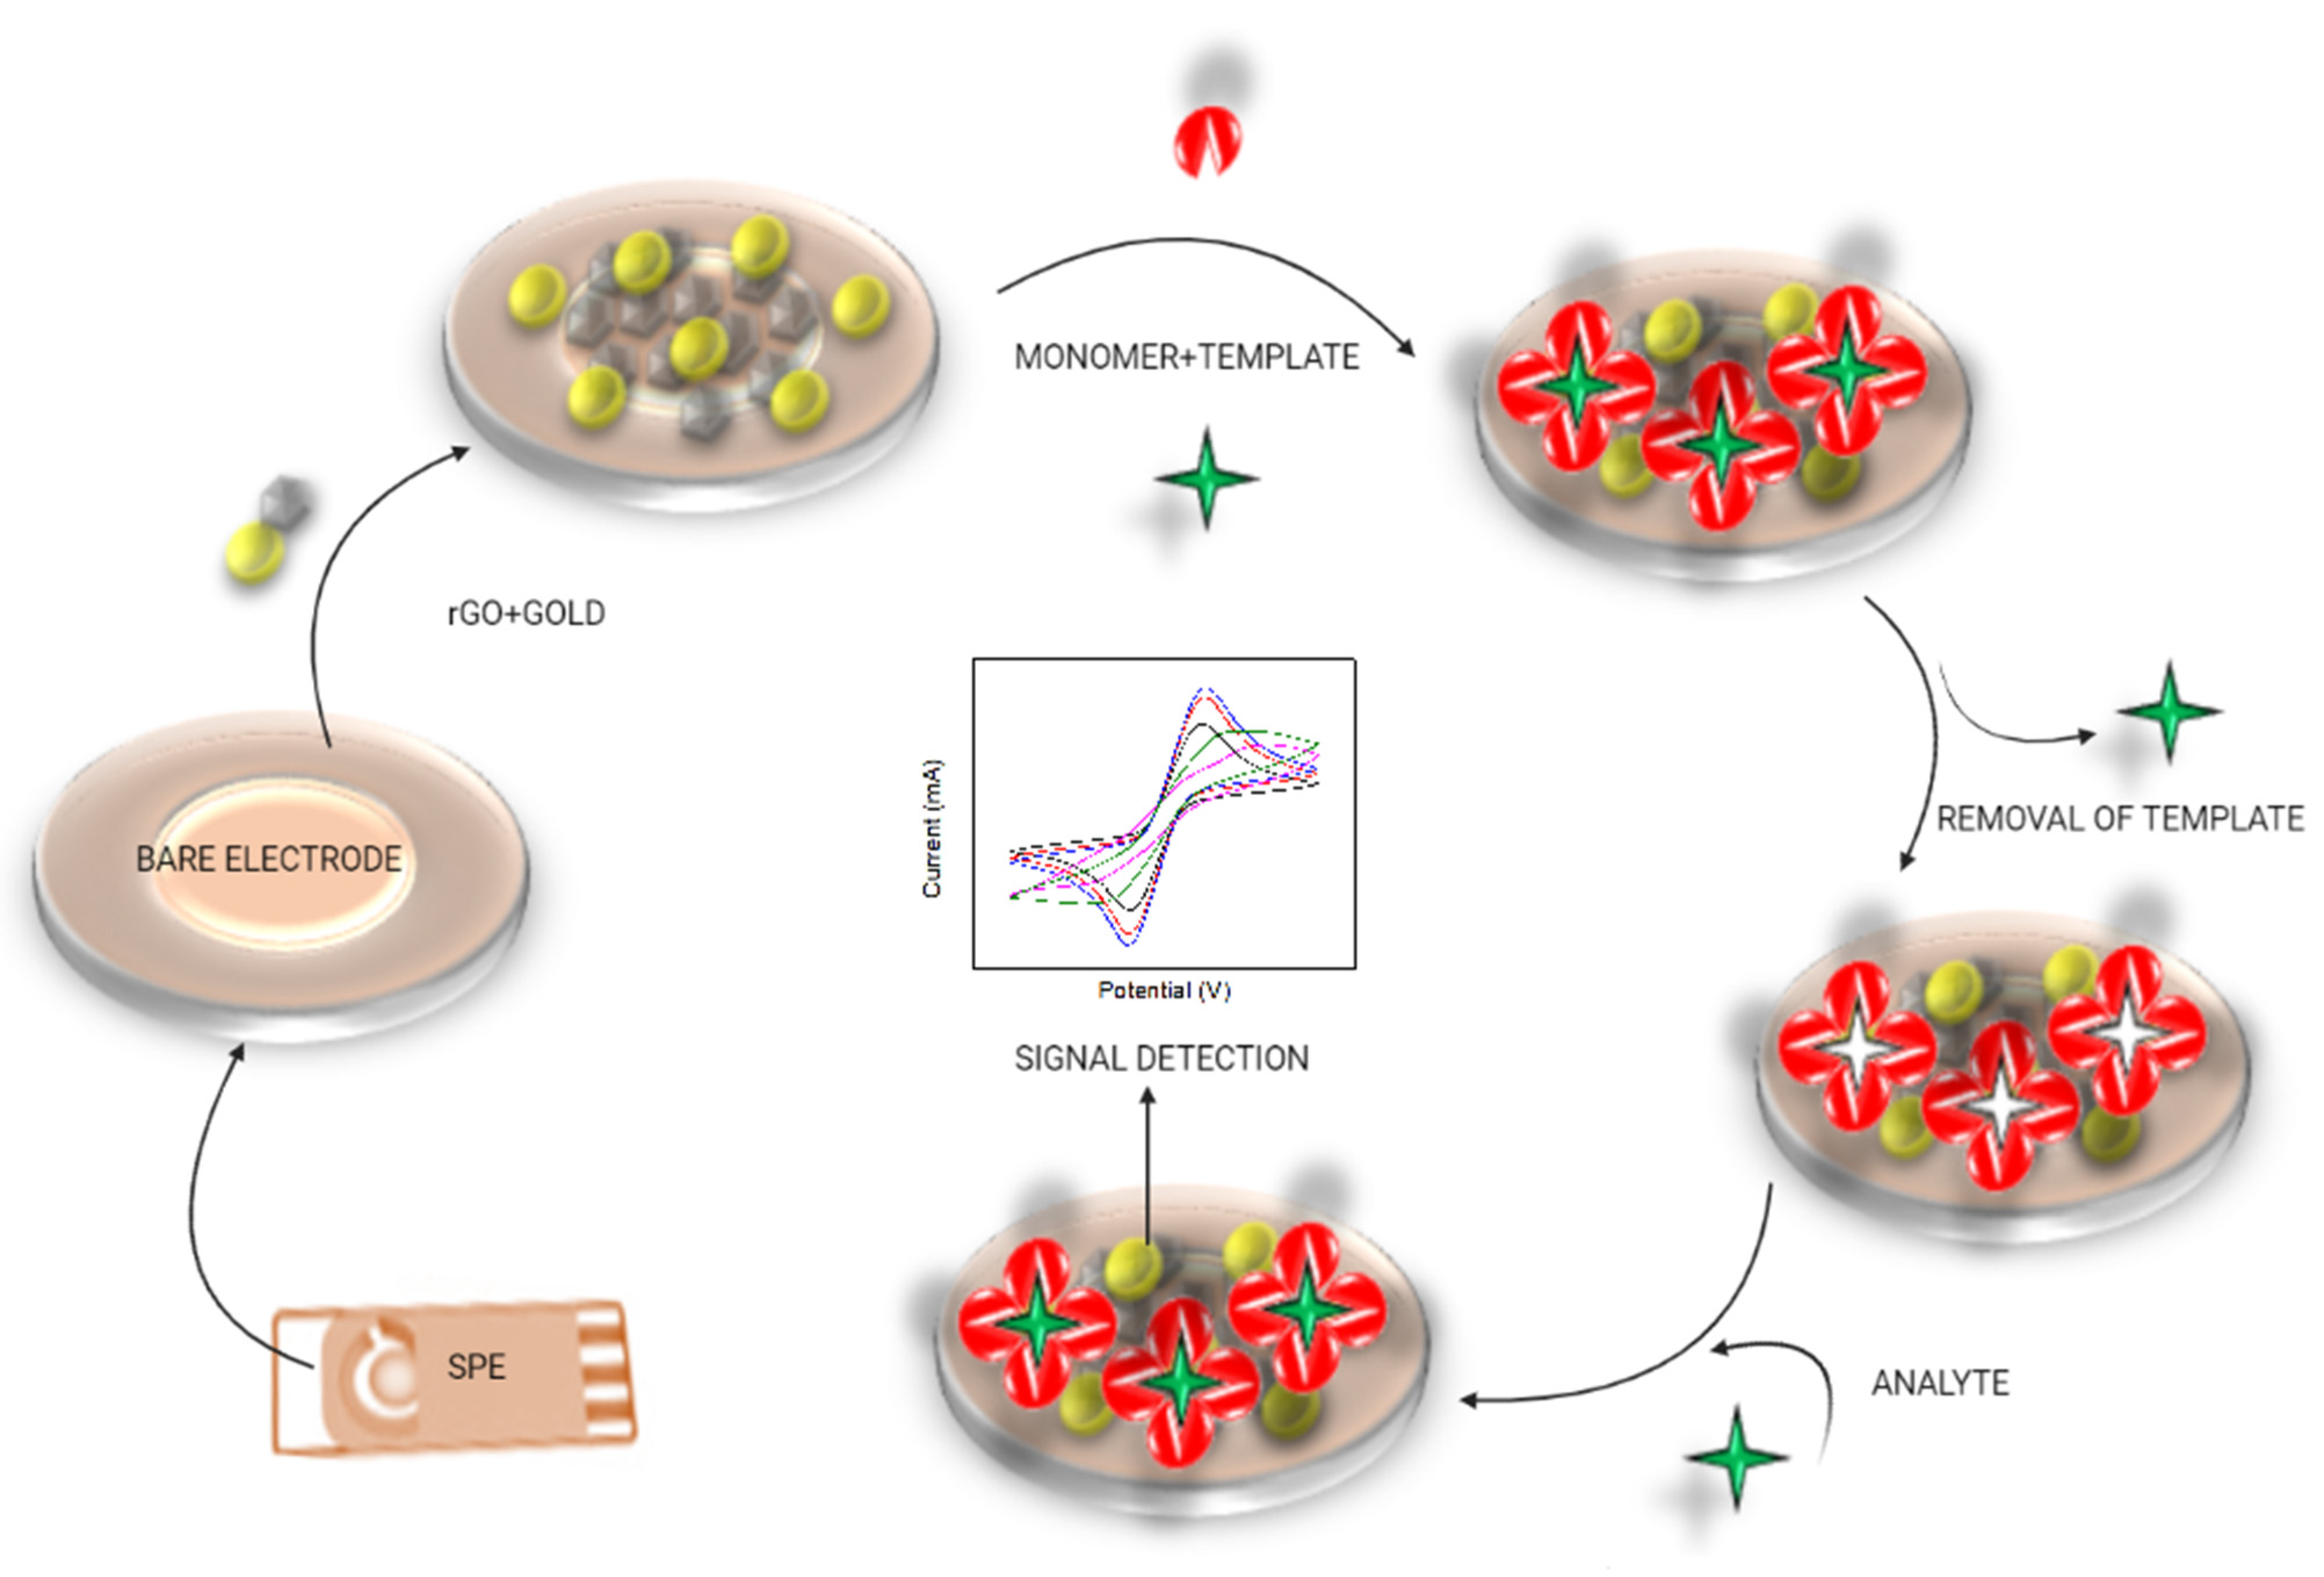
2.6. Fabrication of Biosensing Surface
2.6.1. Electrodeposition of Nanomaterials on an Electrode Surface
2.6.2. Electropolymerization of CagA-MIP
2.7. Electrochemical Response Study
2.8. Study of the Analytical Performance of Fabricated Biosensor
2.9. Real Sample Analysis
3. Results and Discussion
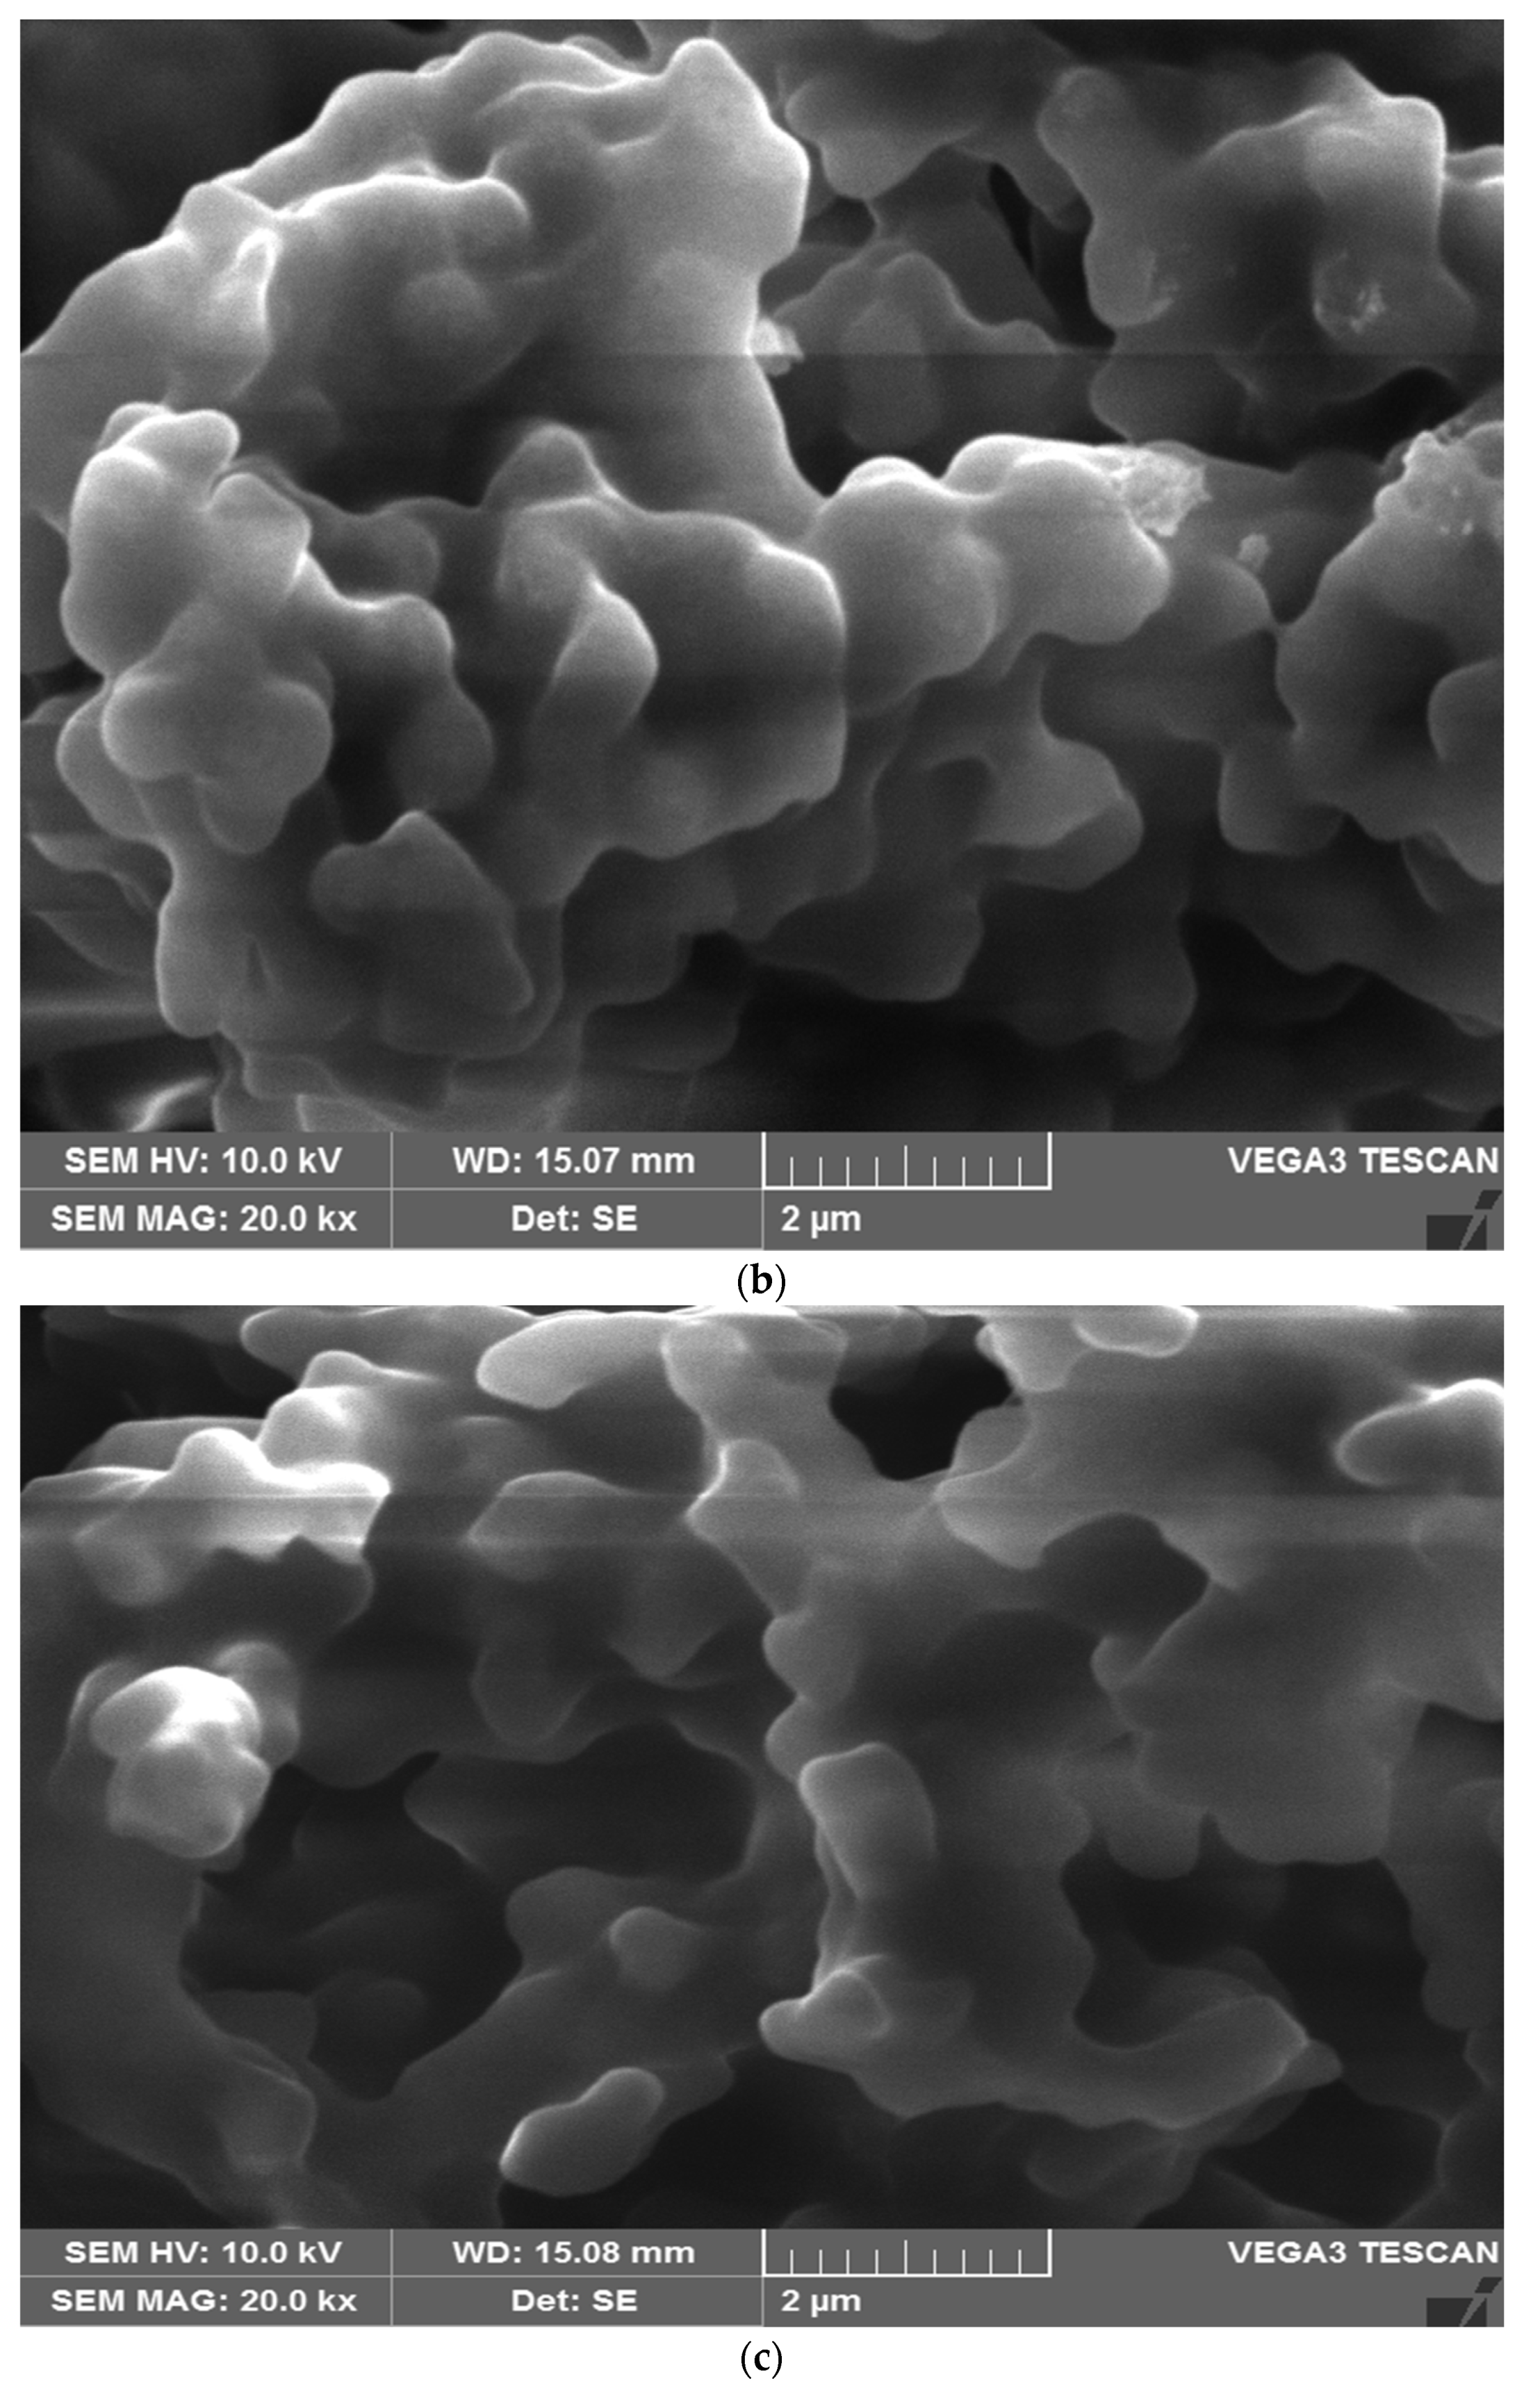
3.1. Morphological Study of Synthesized CagA-MIP by SEM
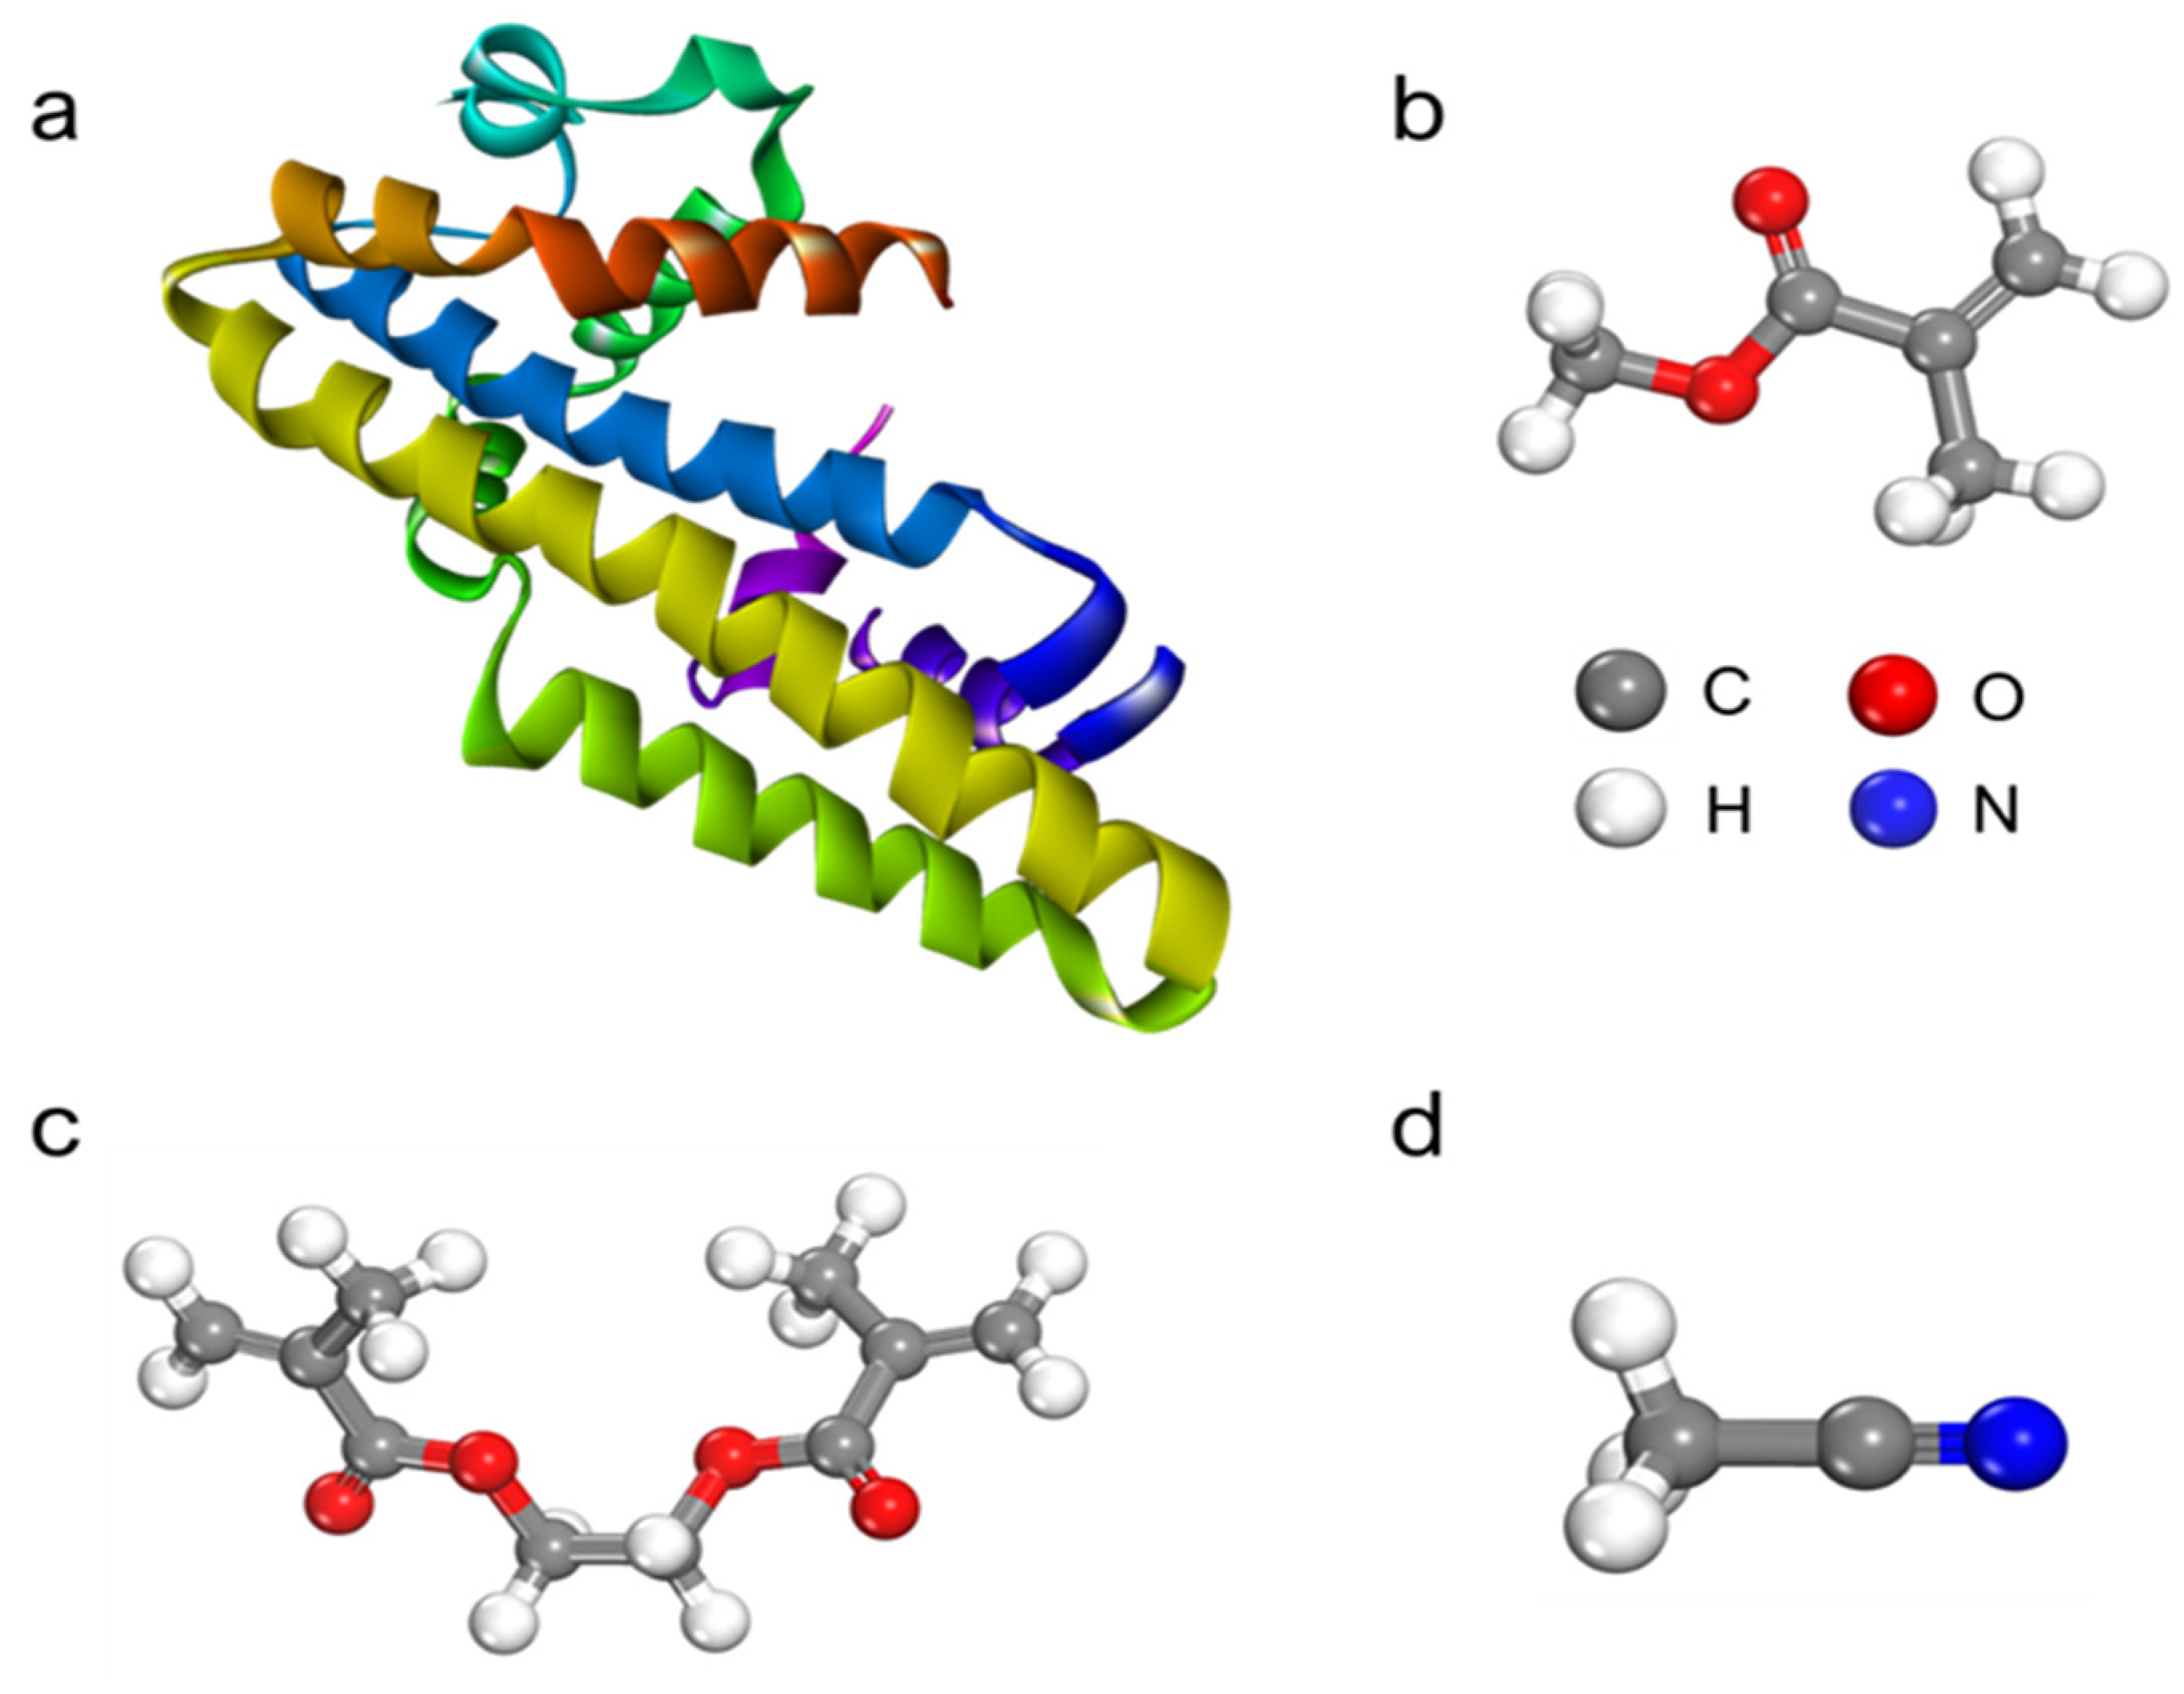
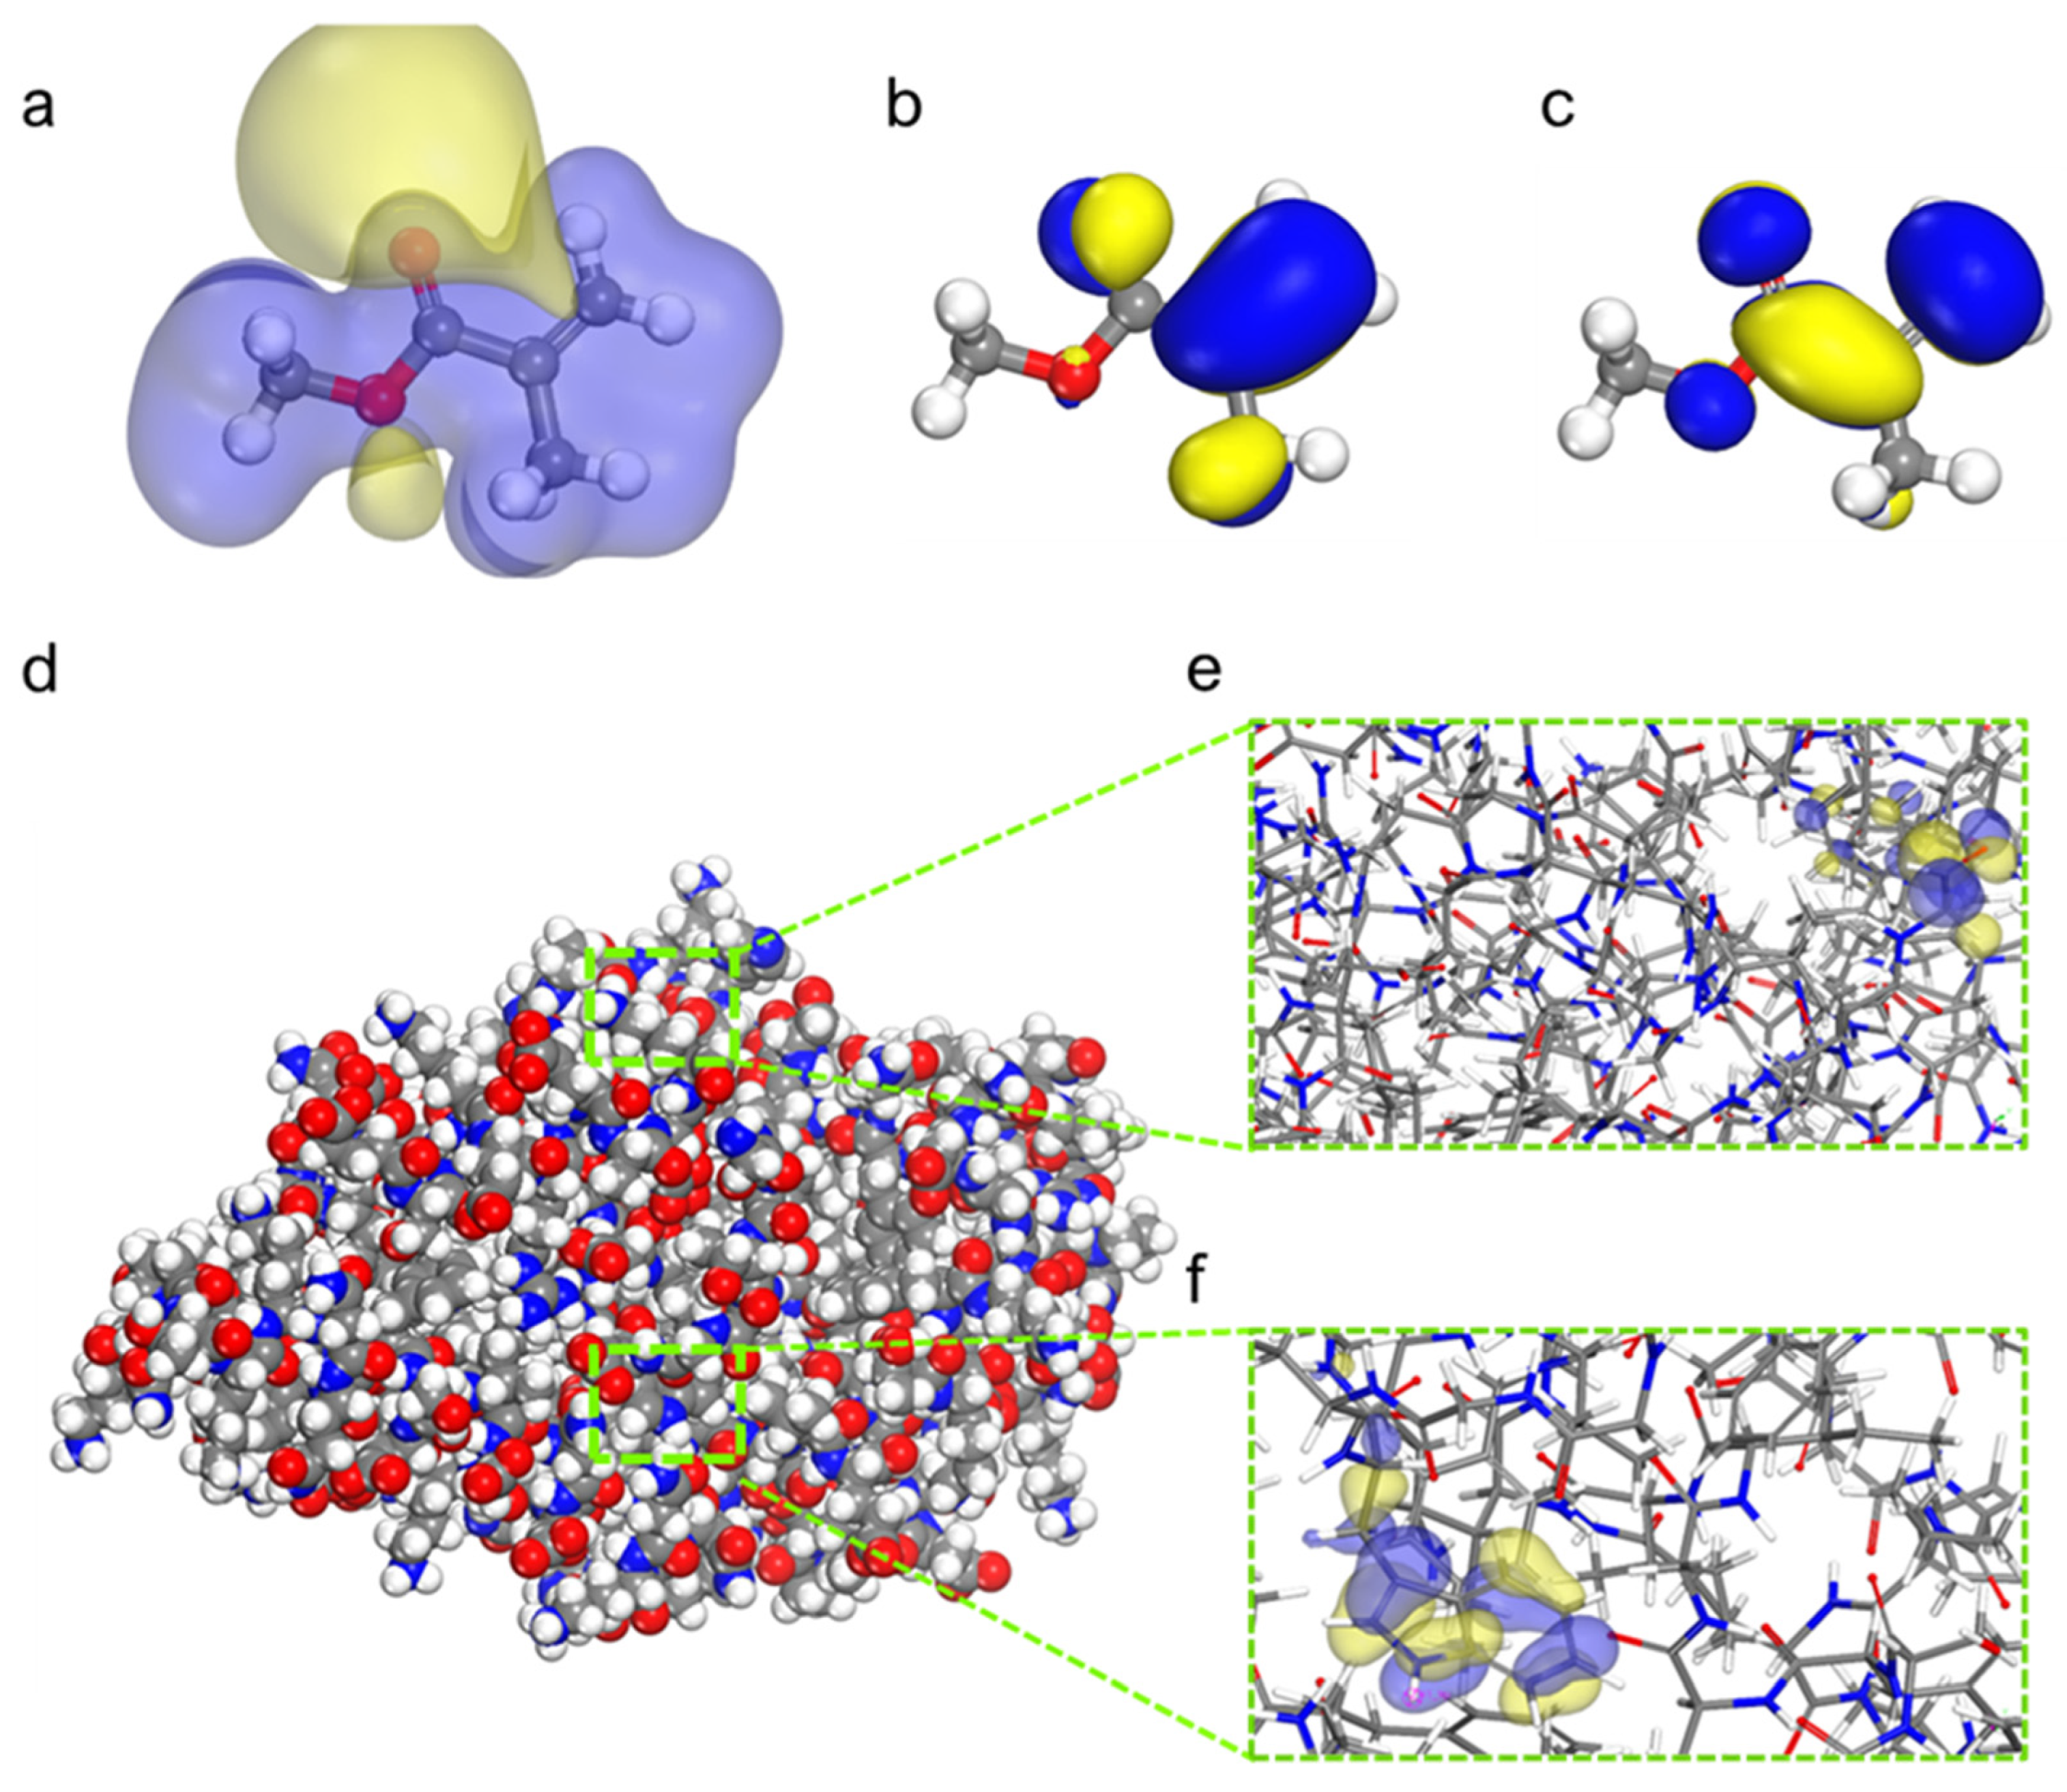
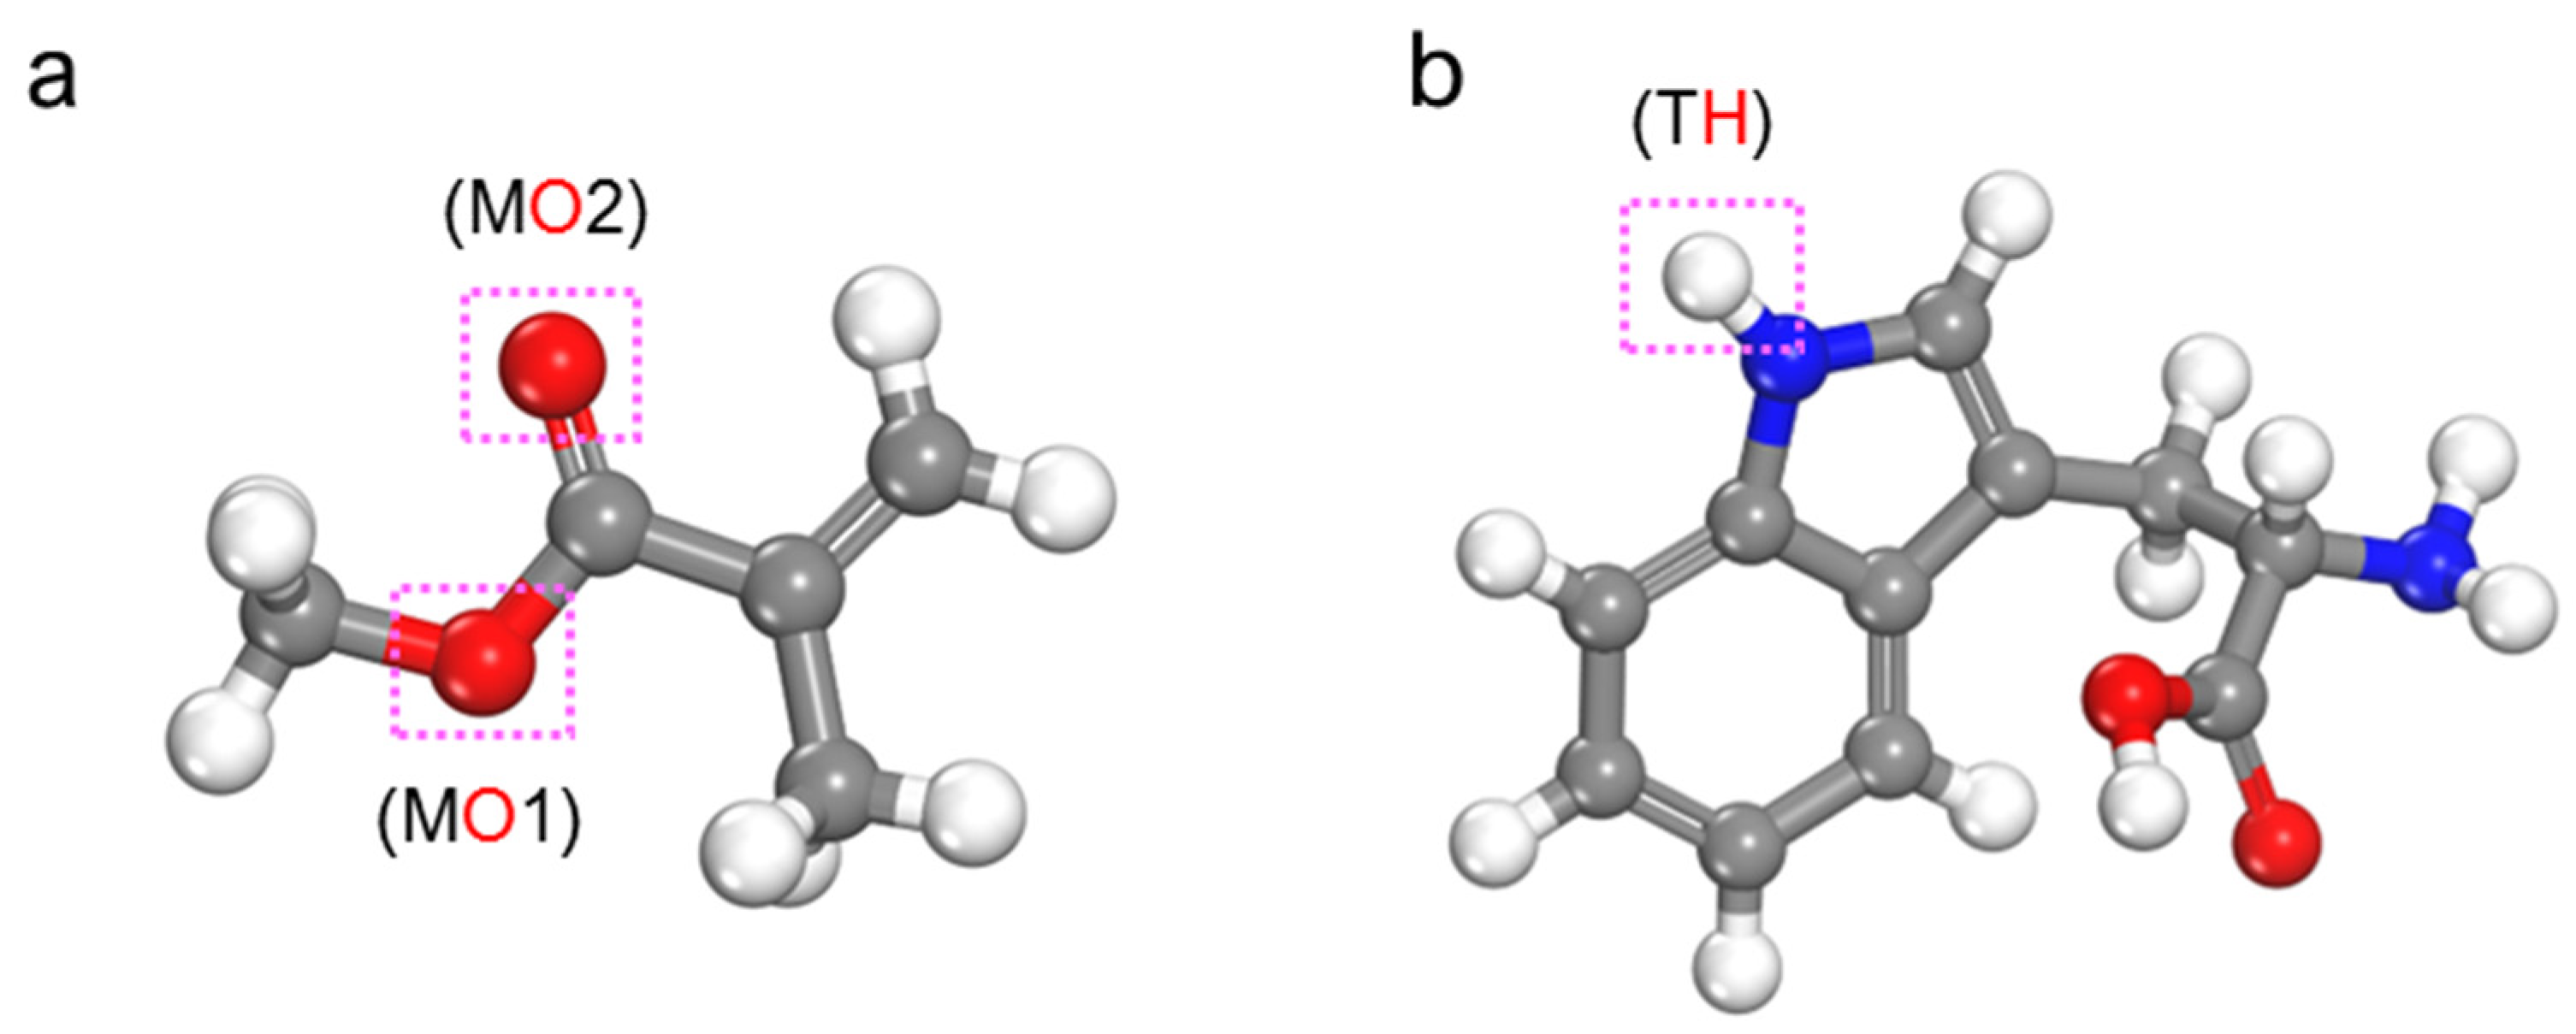
3.2. Geometry Optimizations
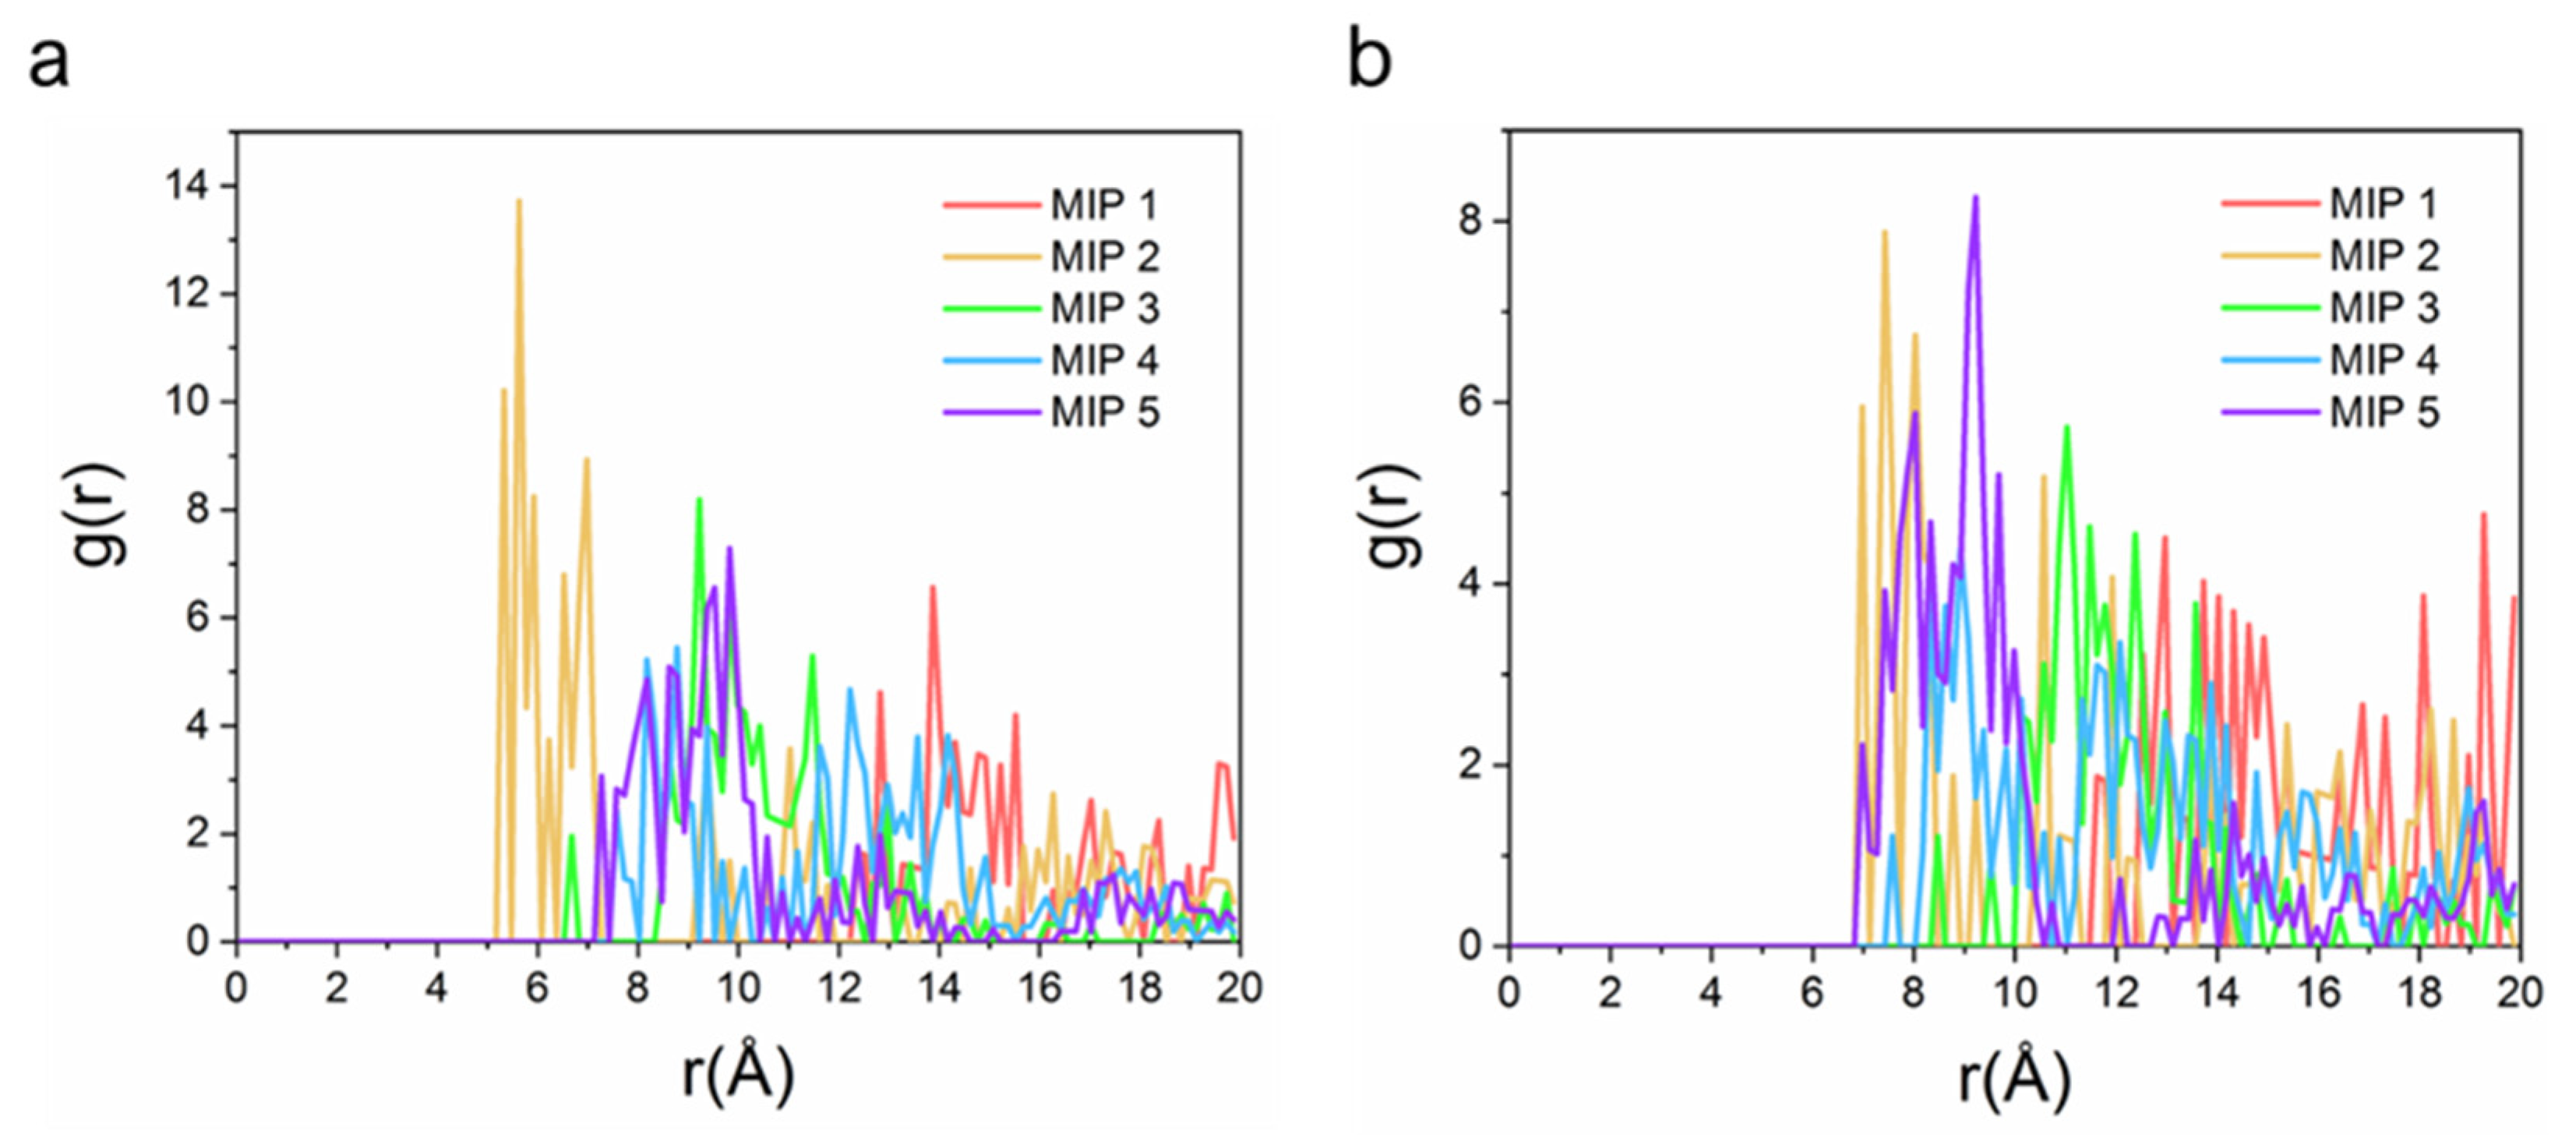
3.3. Molecular Dynamics Simulations and Binding Energy Calculation
3.4. Electrochemical Experiment Results
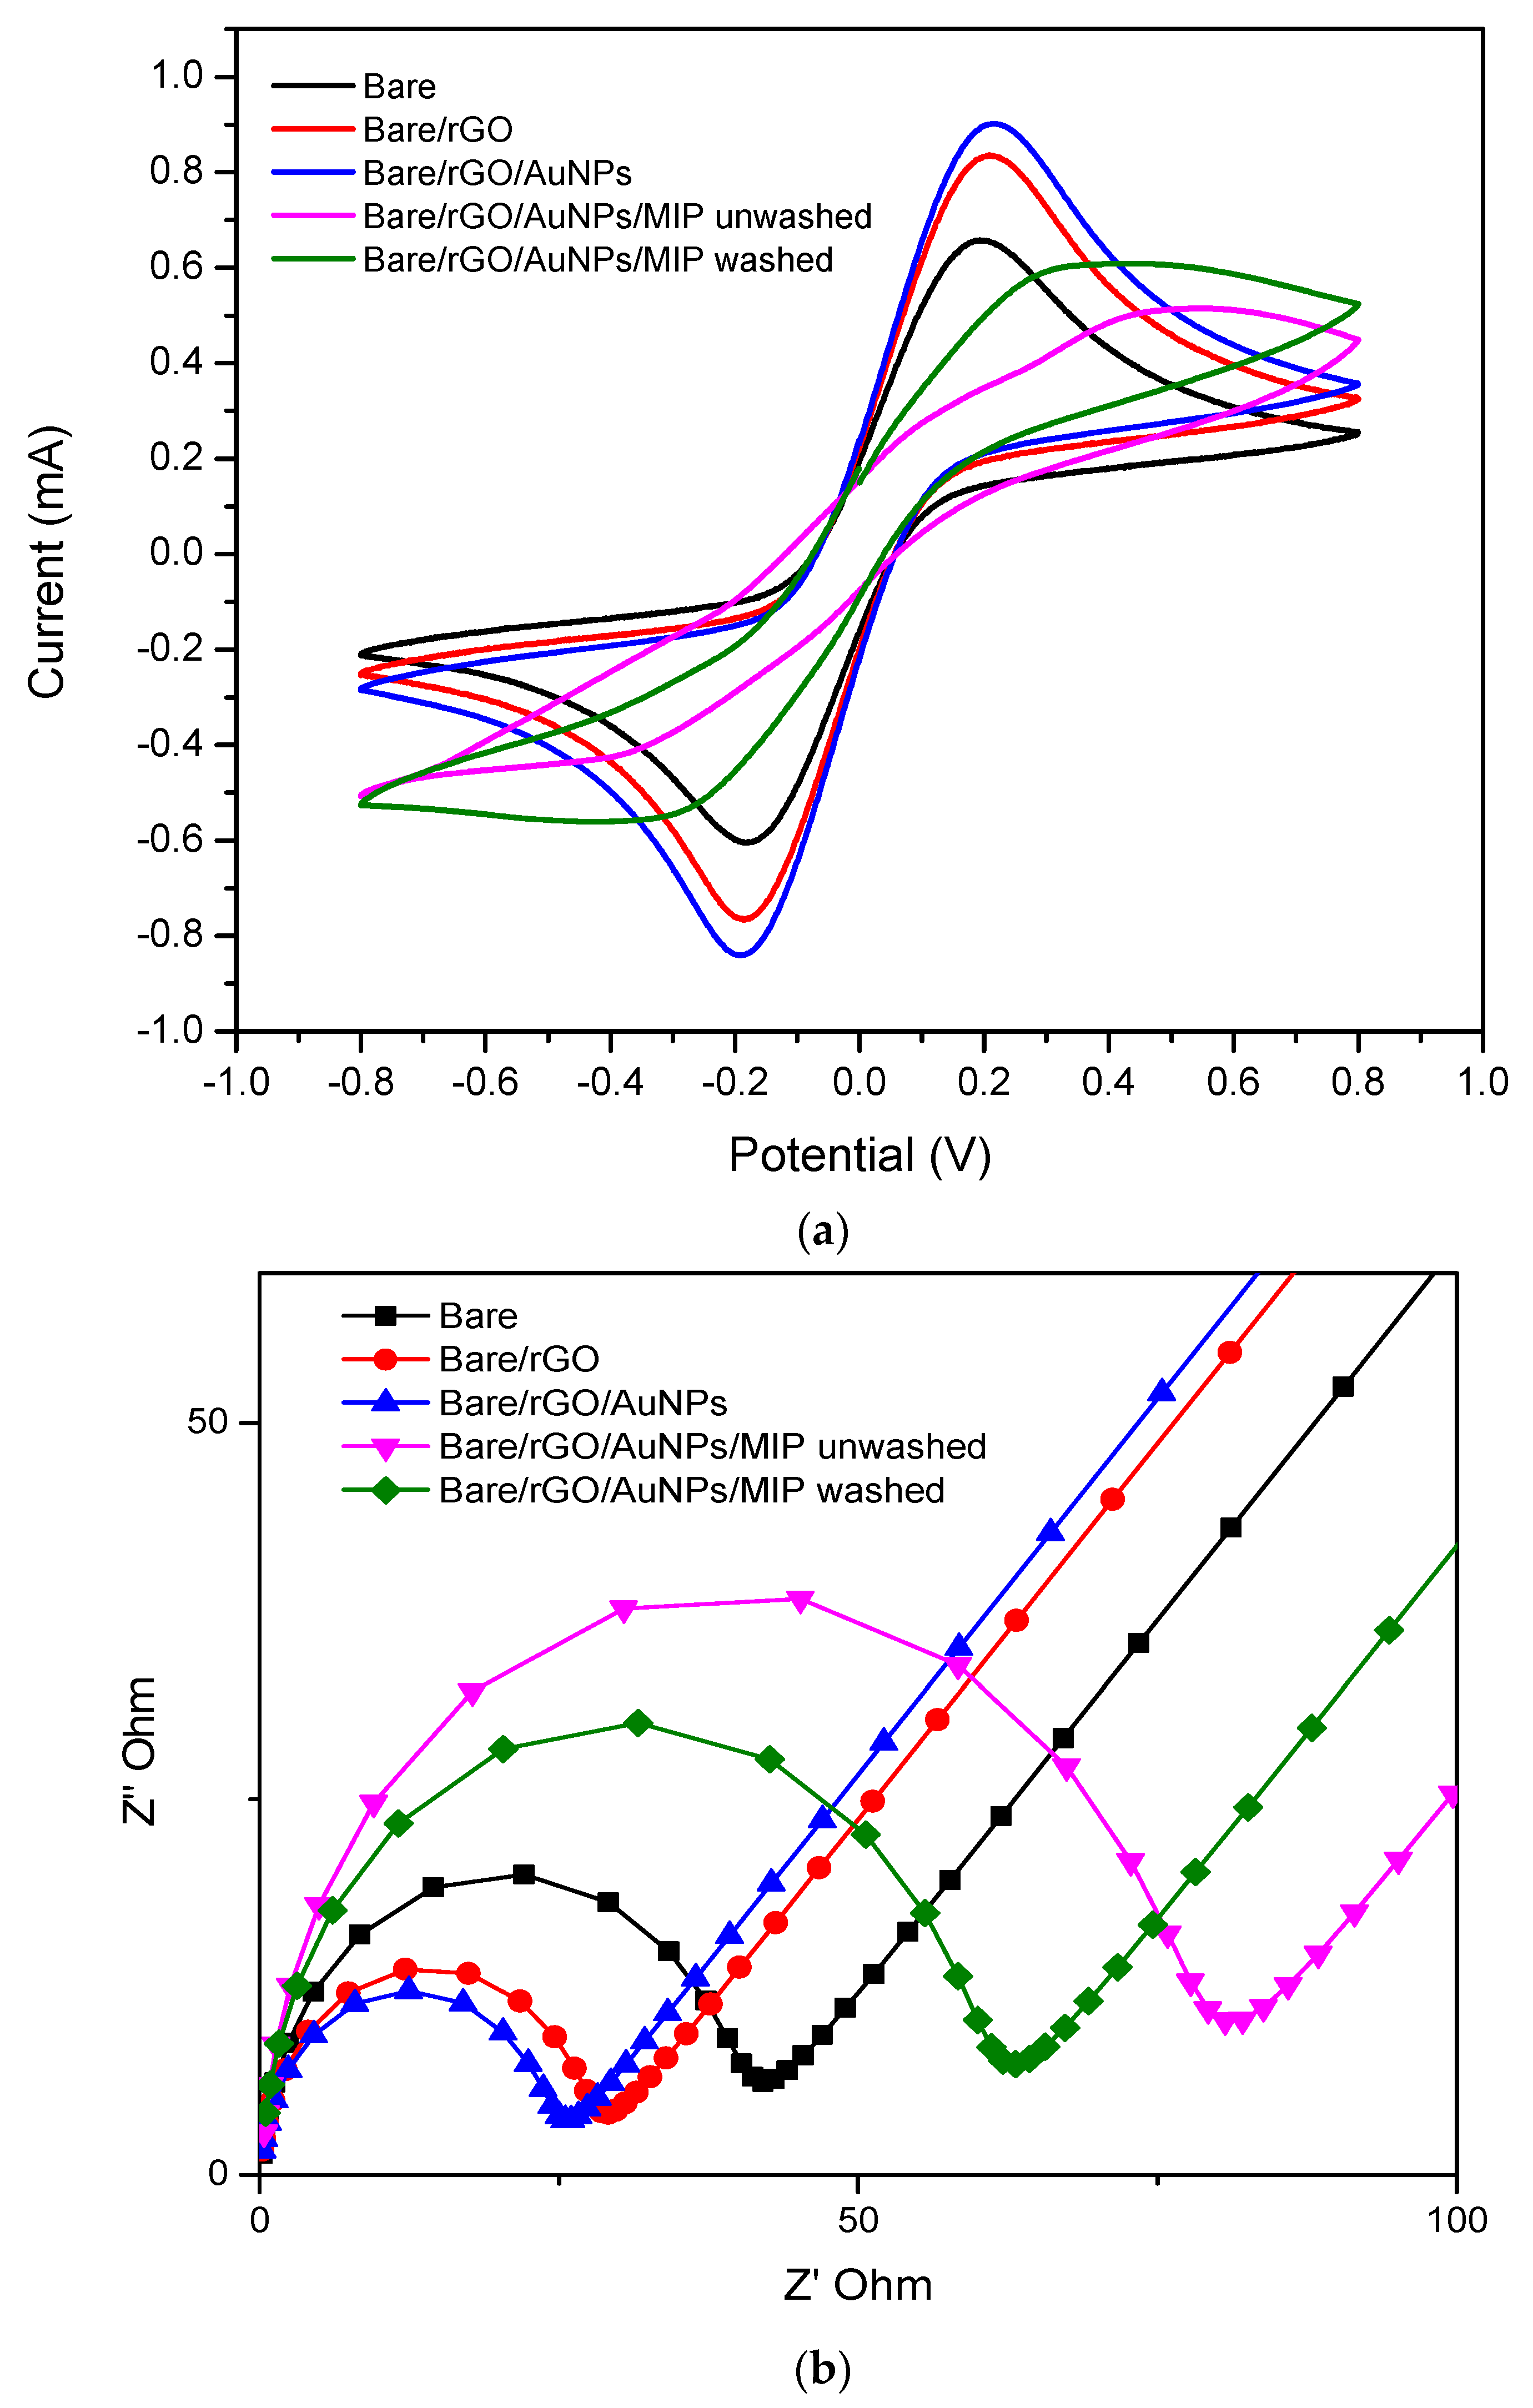
3.4.1. Validation of Fabrication Steps through Electrochemical Study
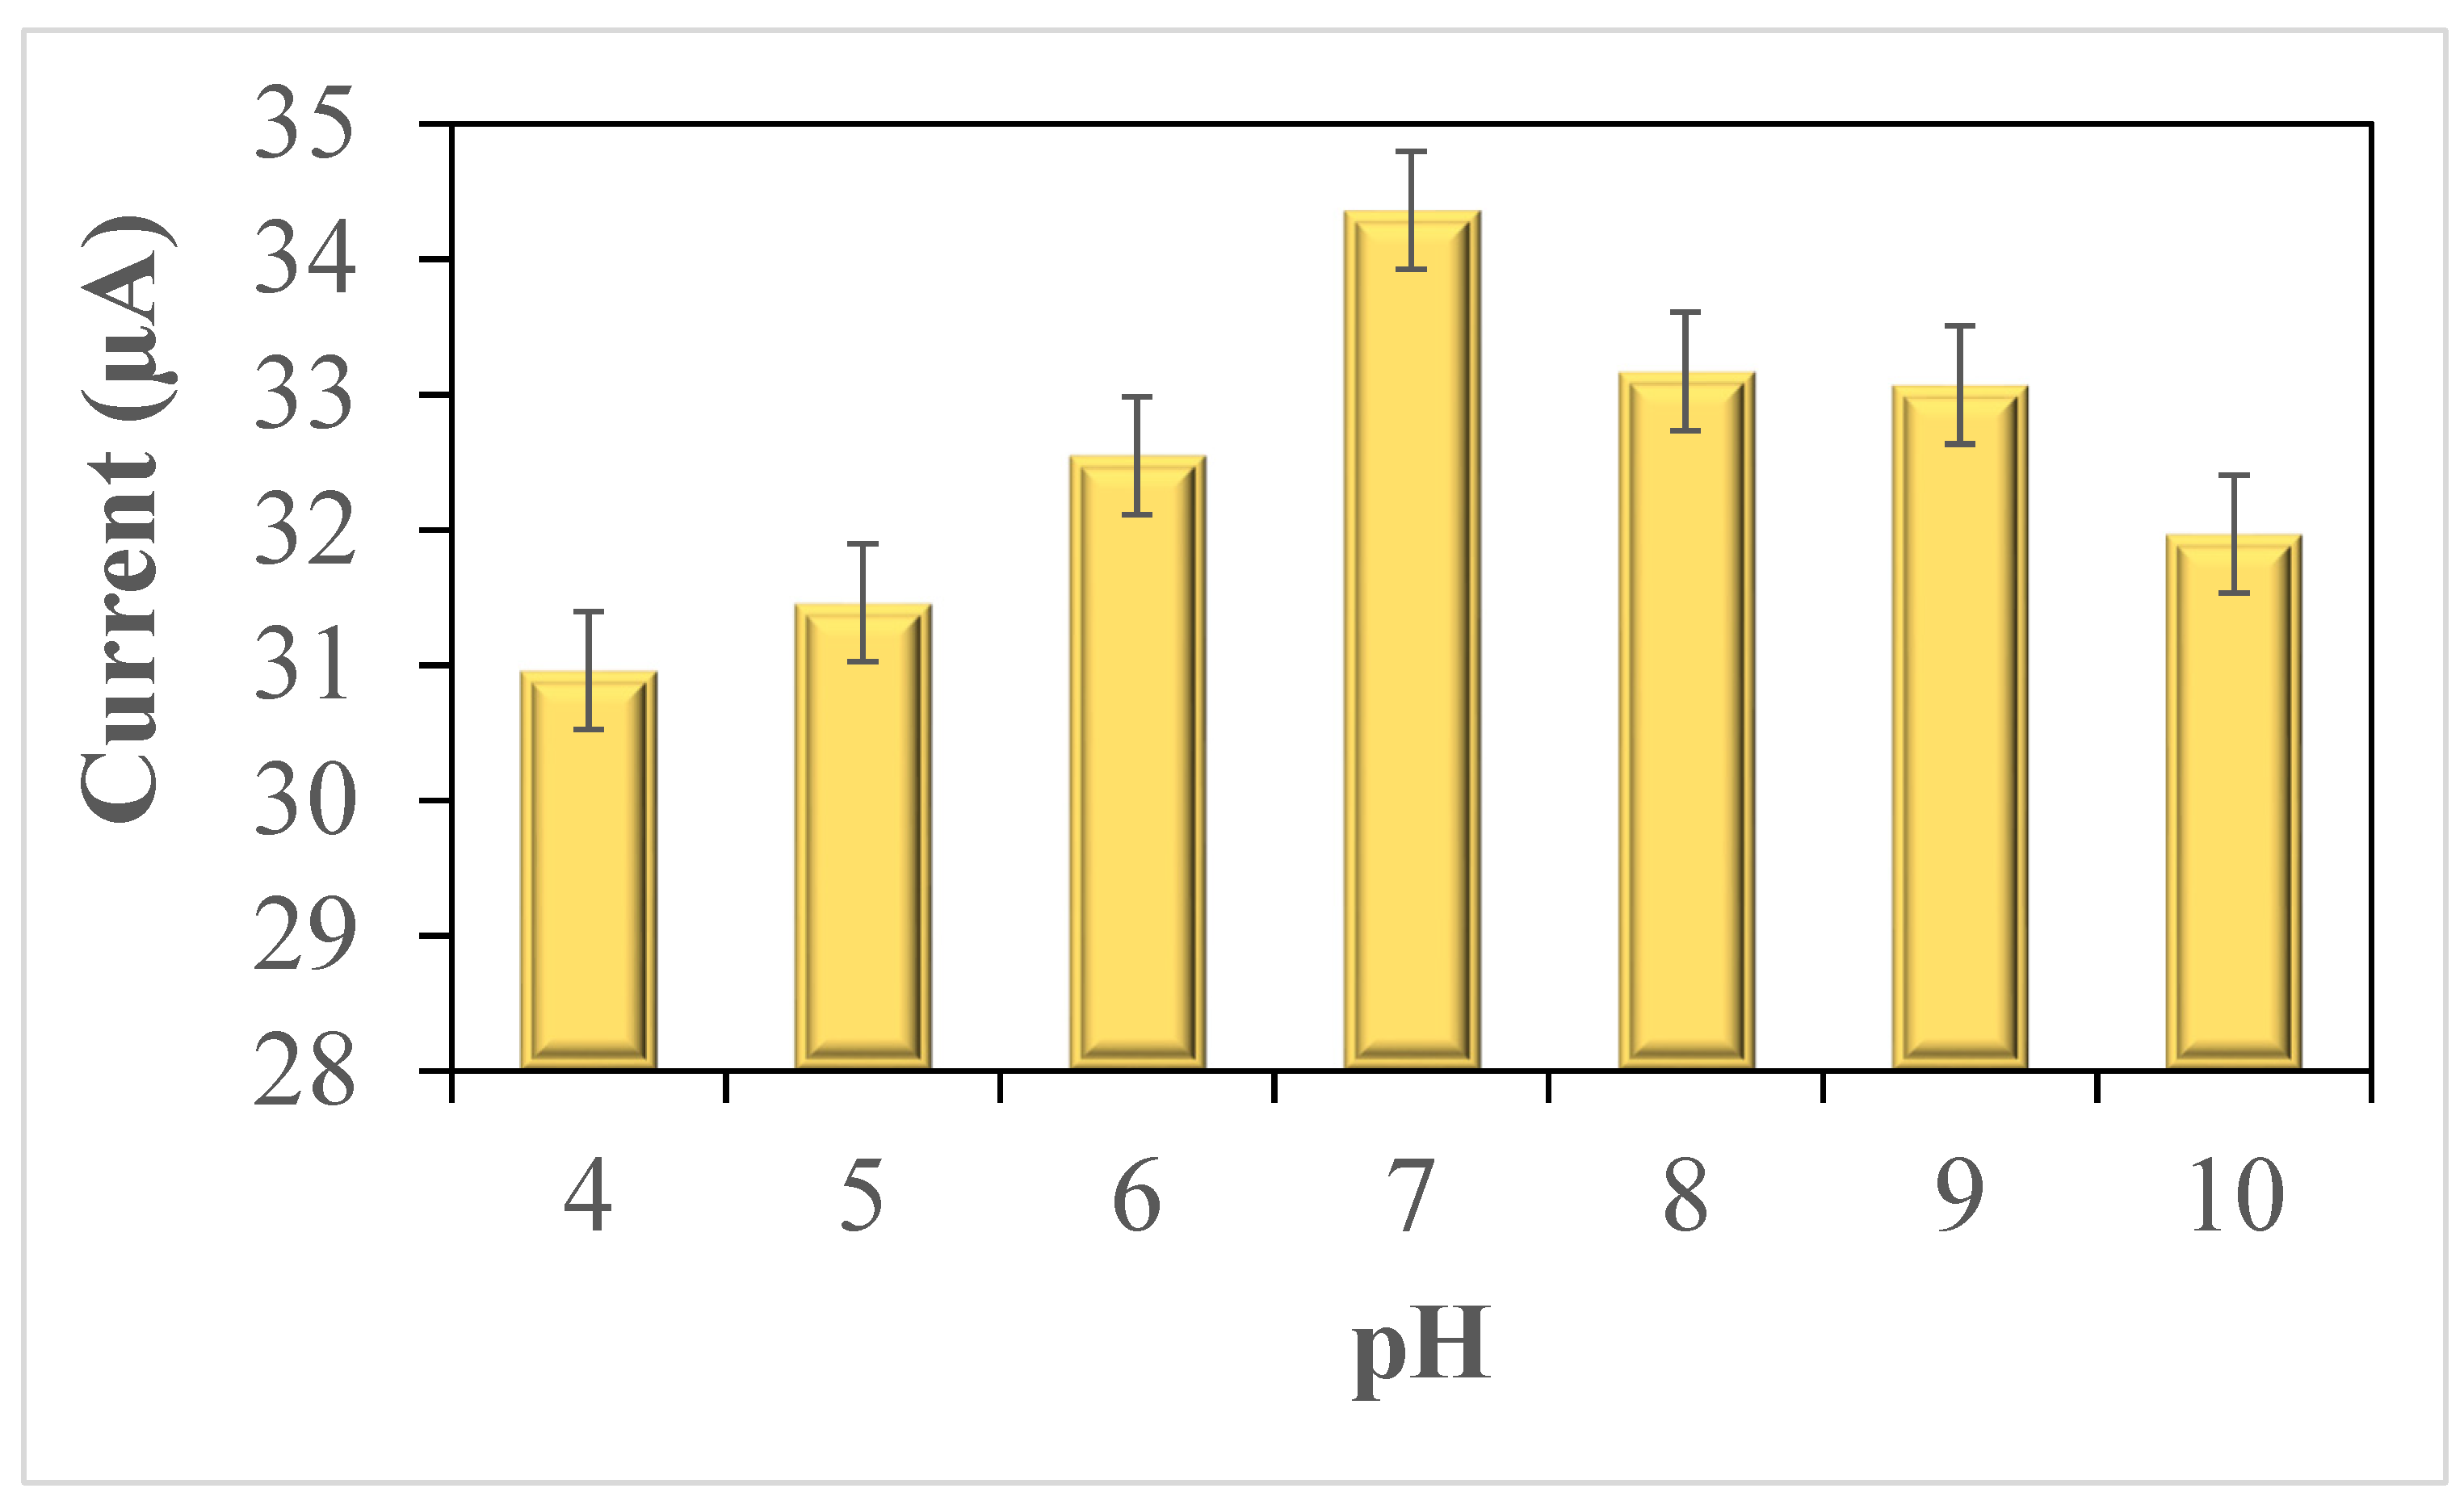
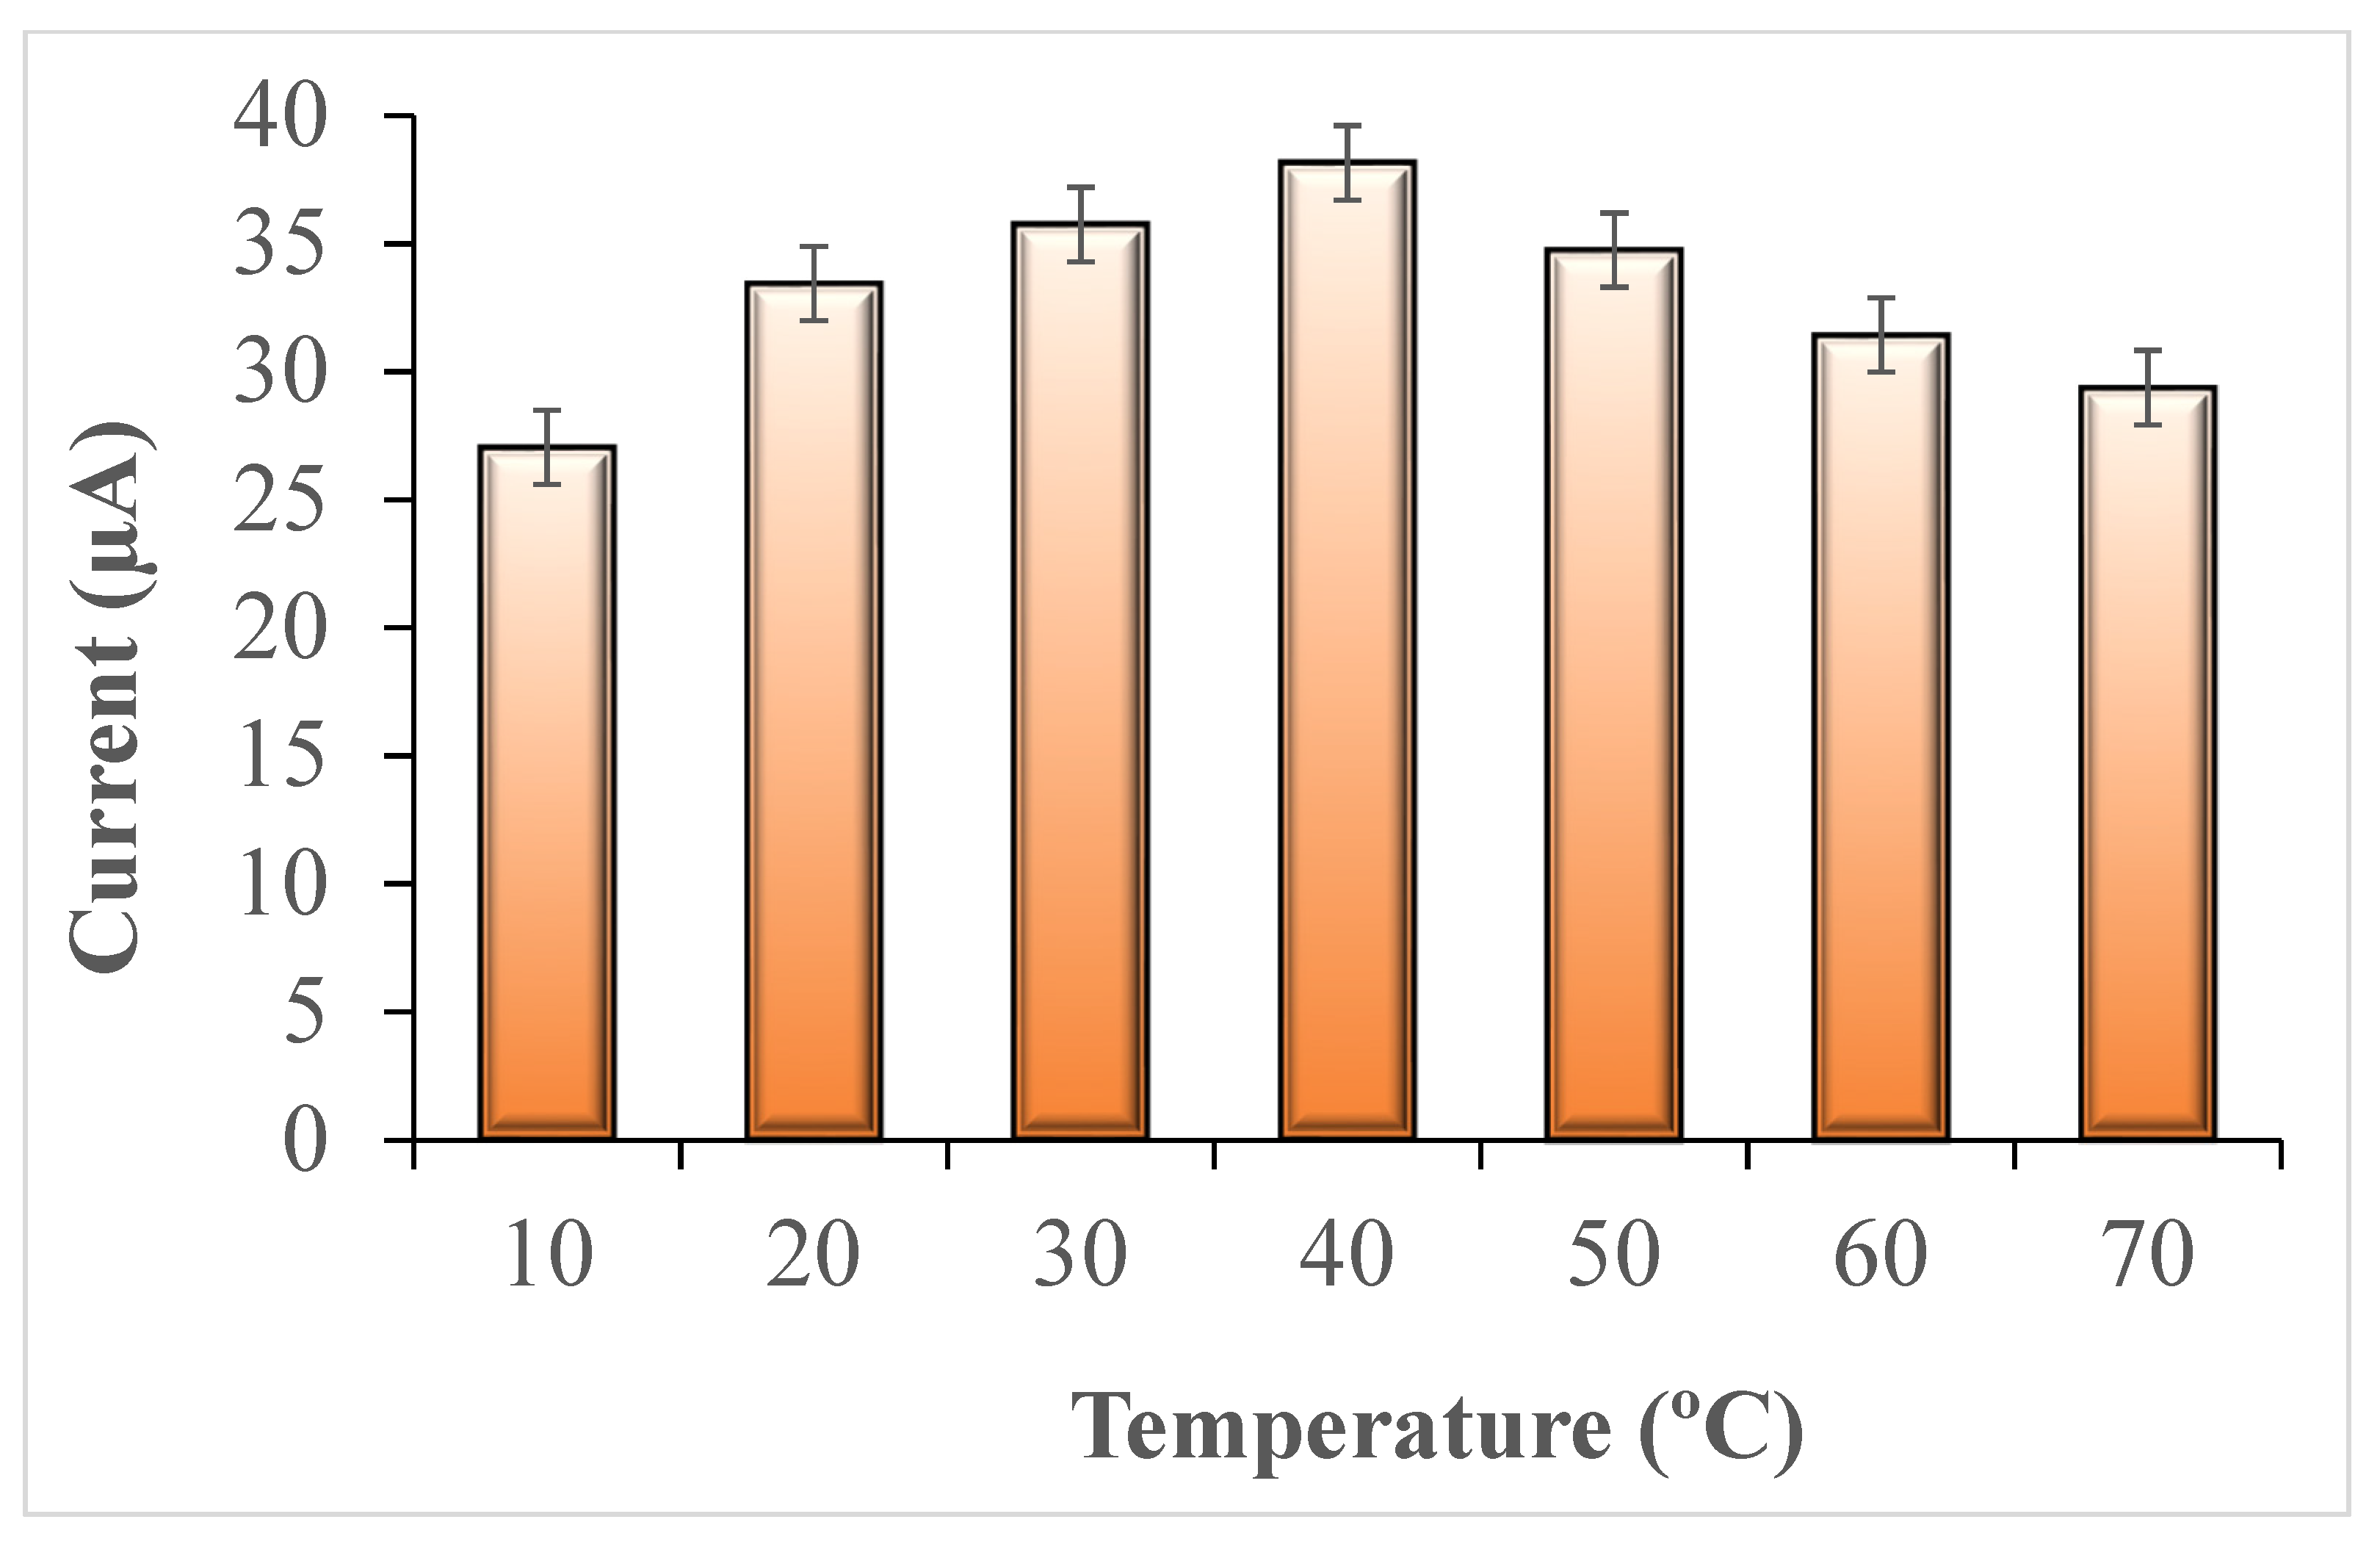
3.4.2. Optimization of Fabricated Electrodes for Various Sensing Parameters
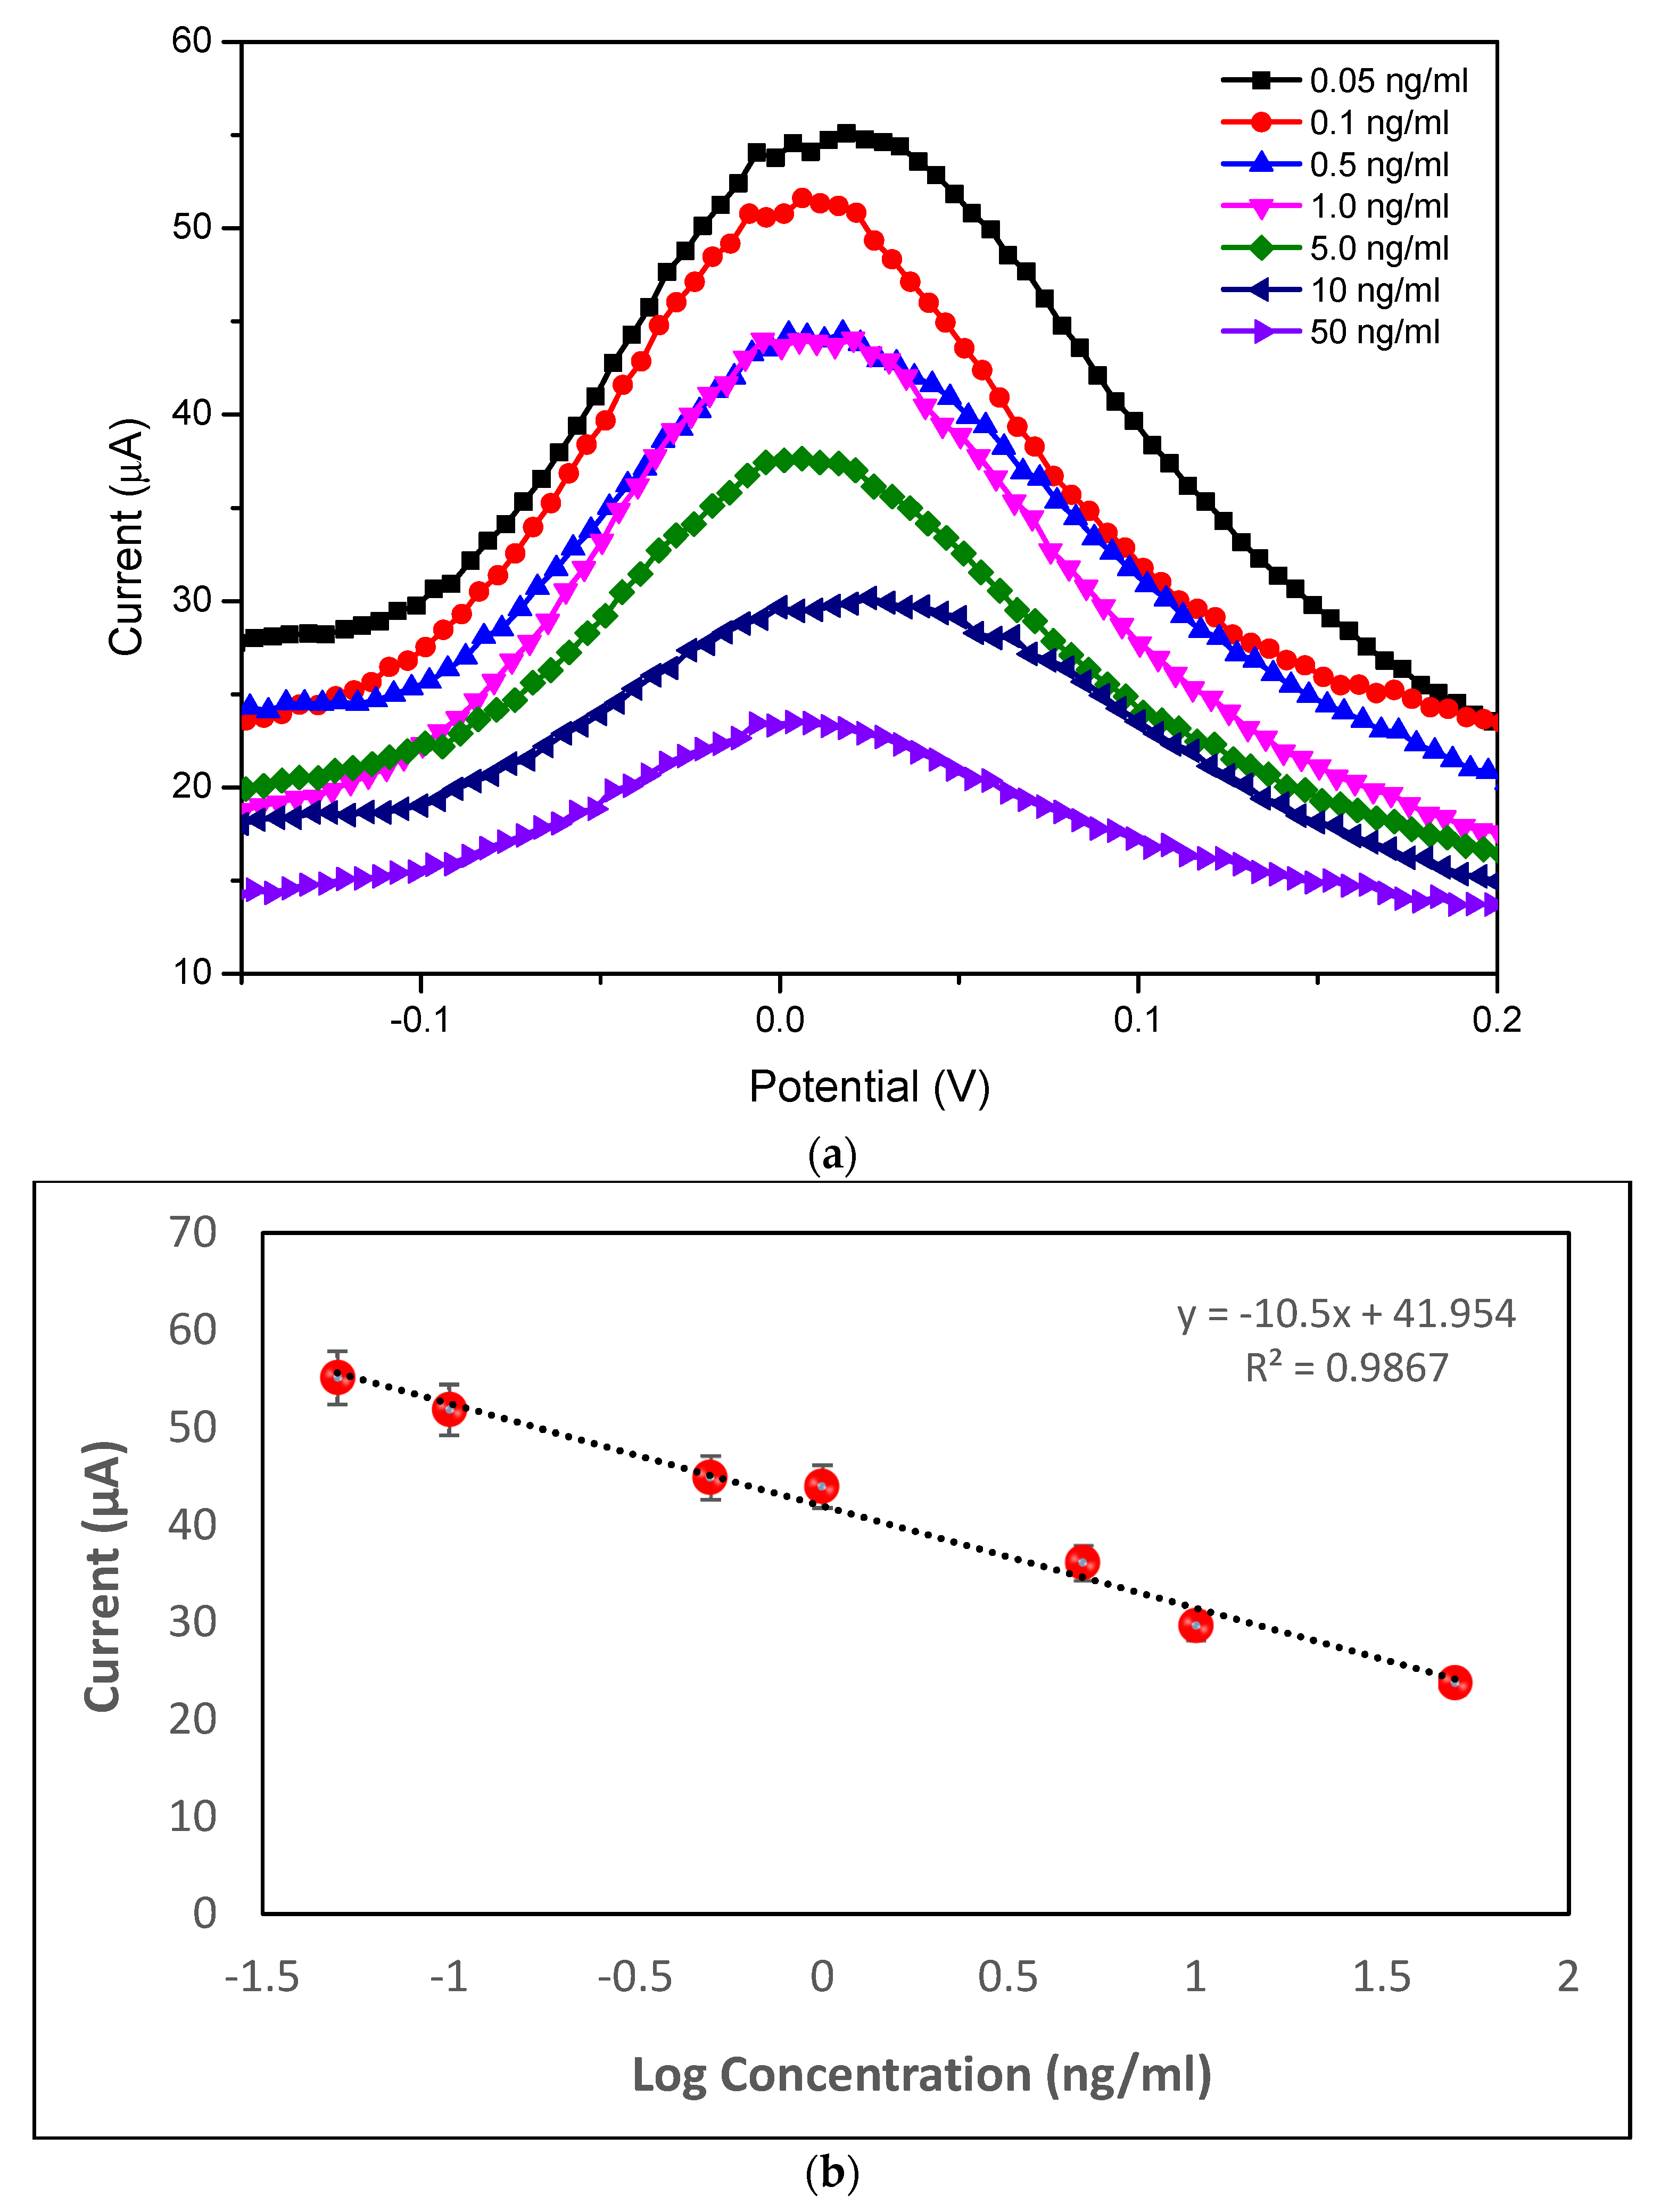
3.4.3. Sensor’s Analytical Performance
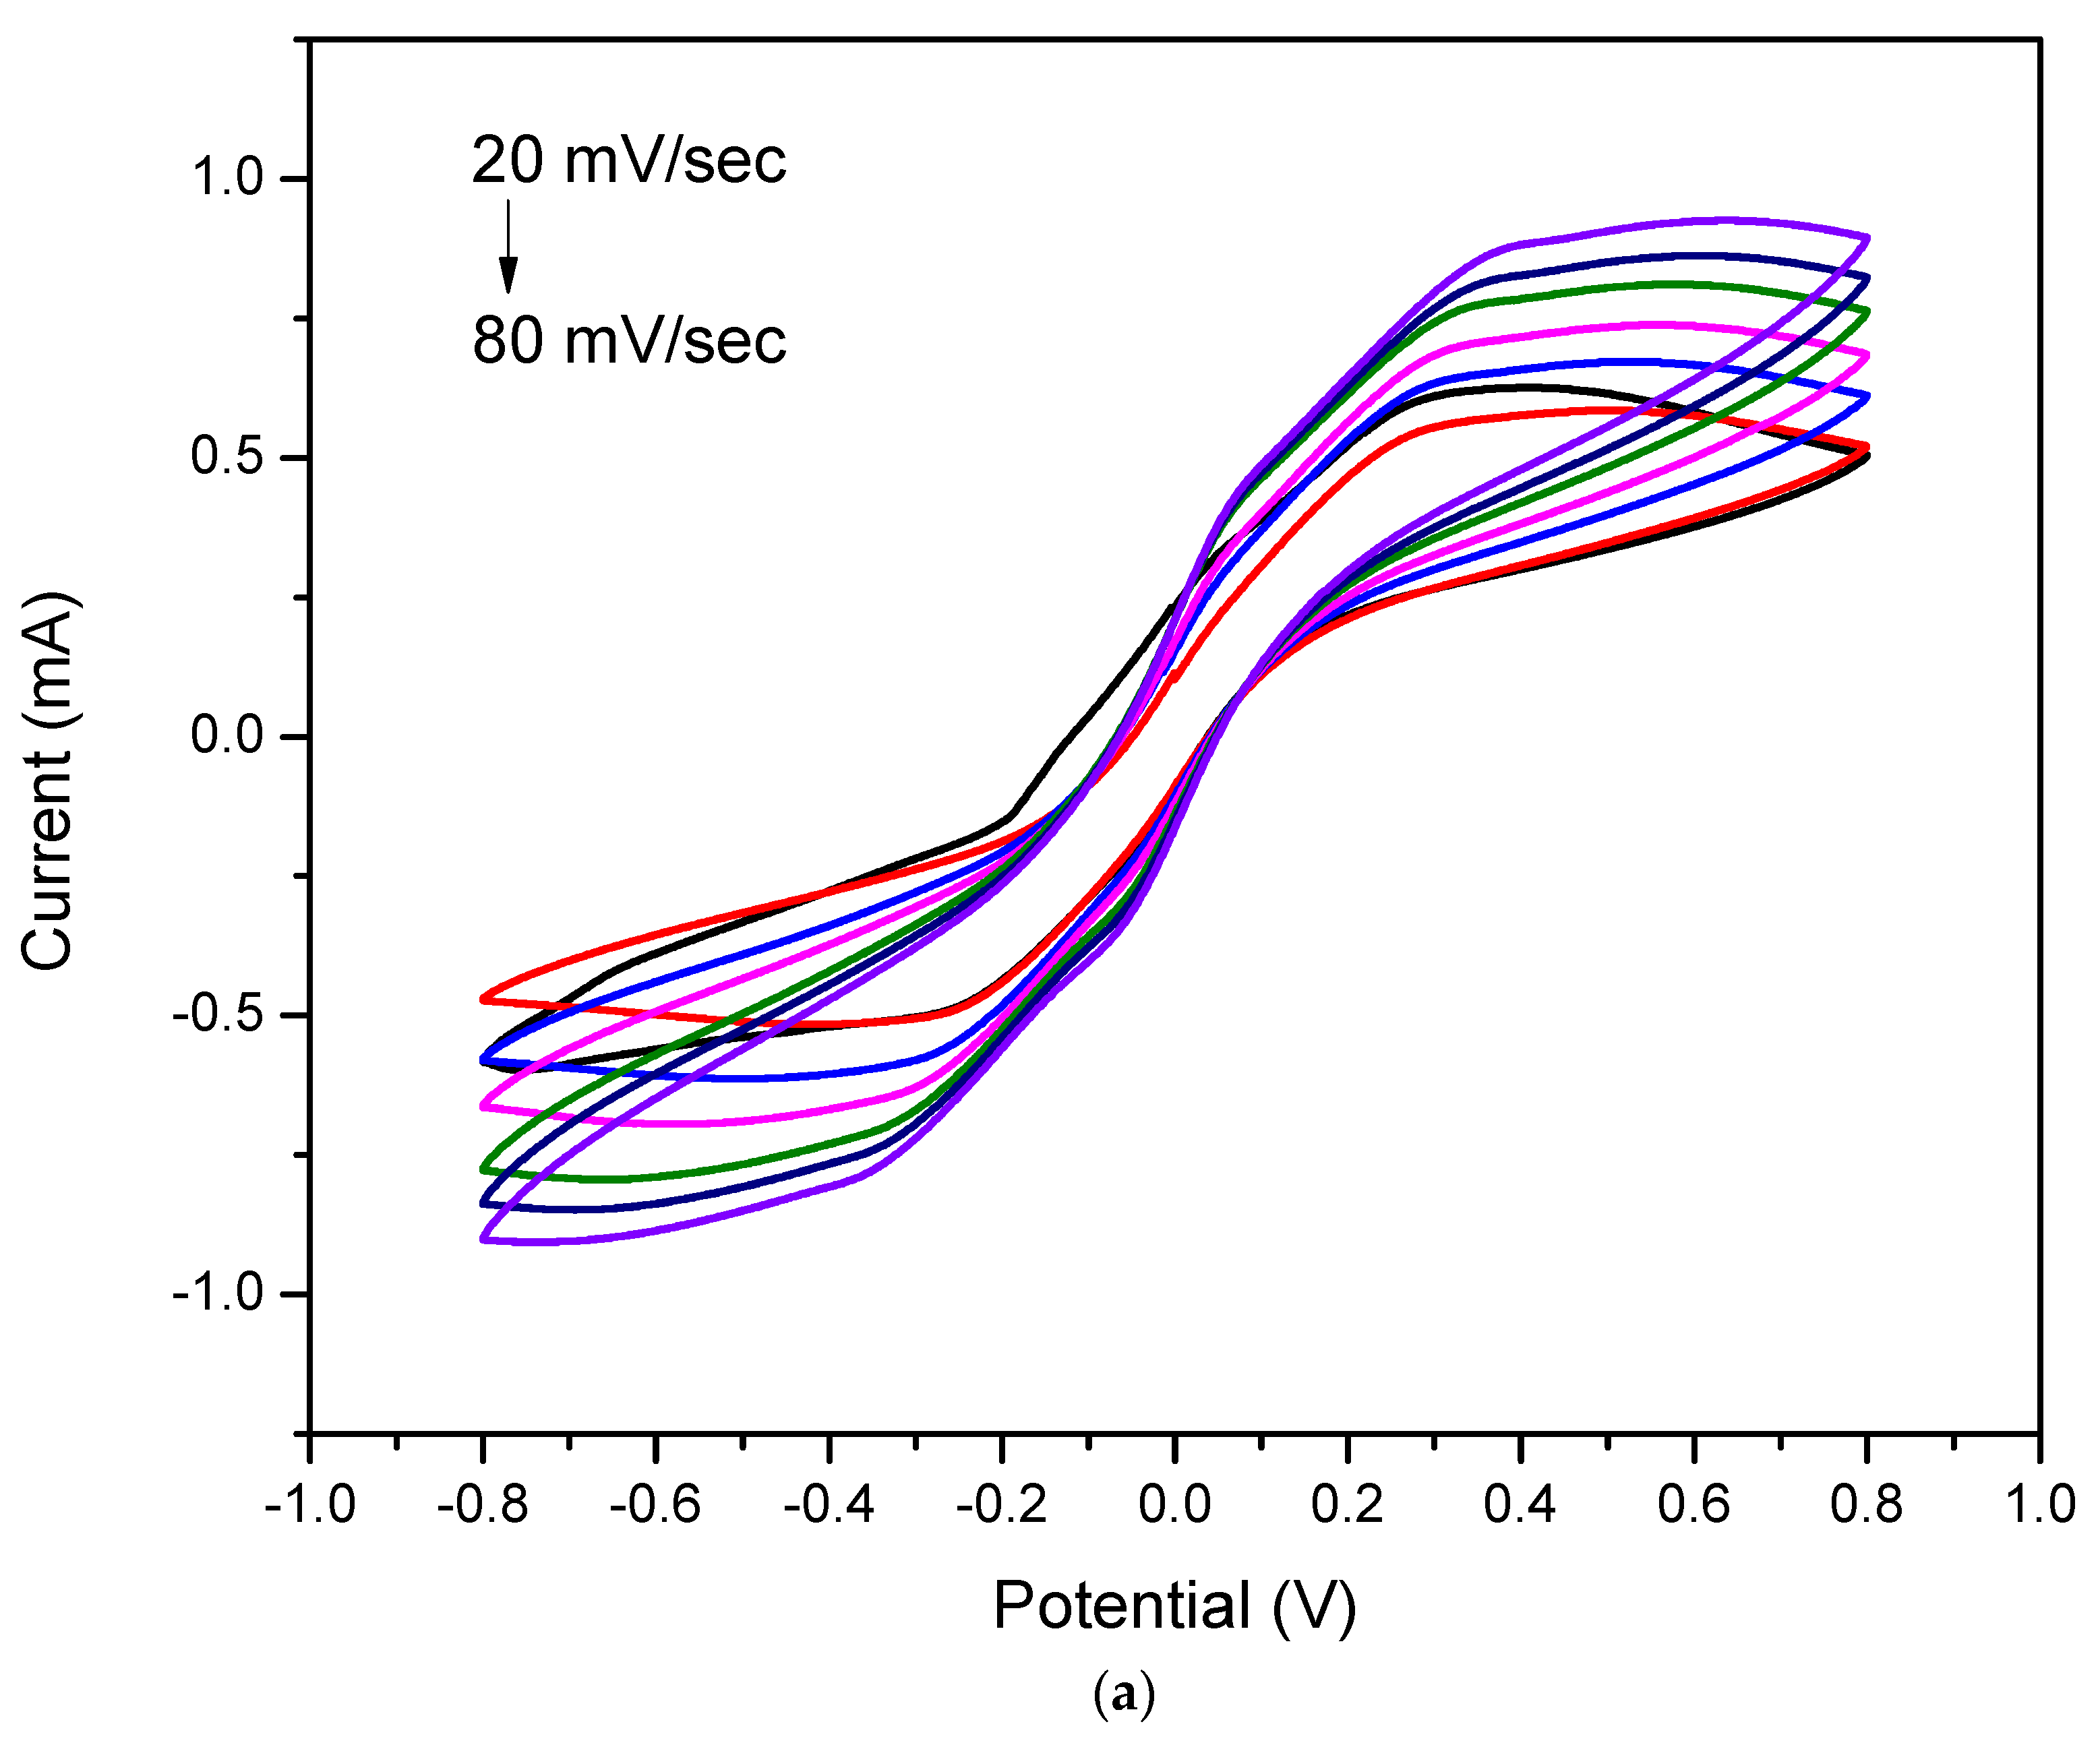
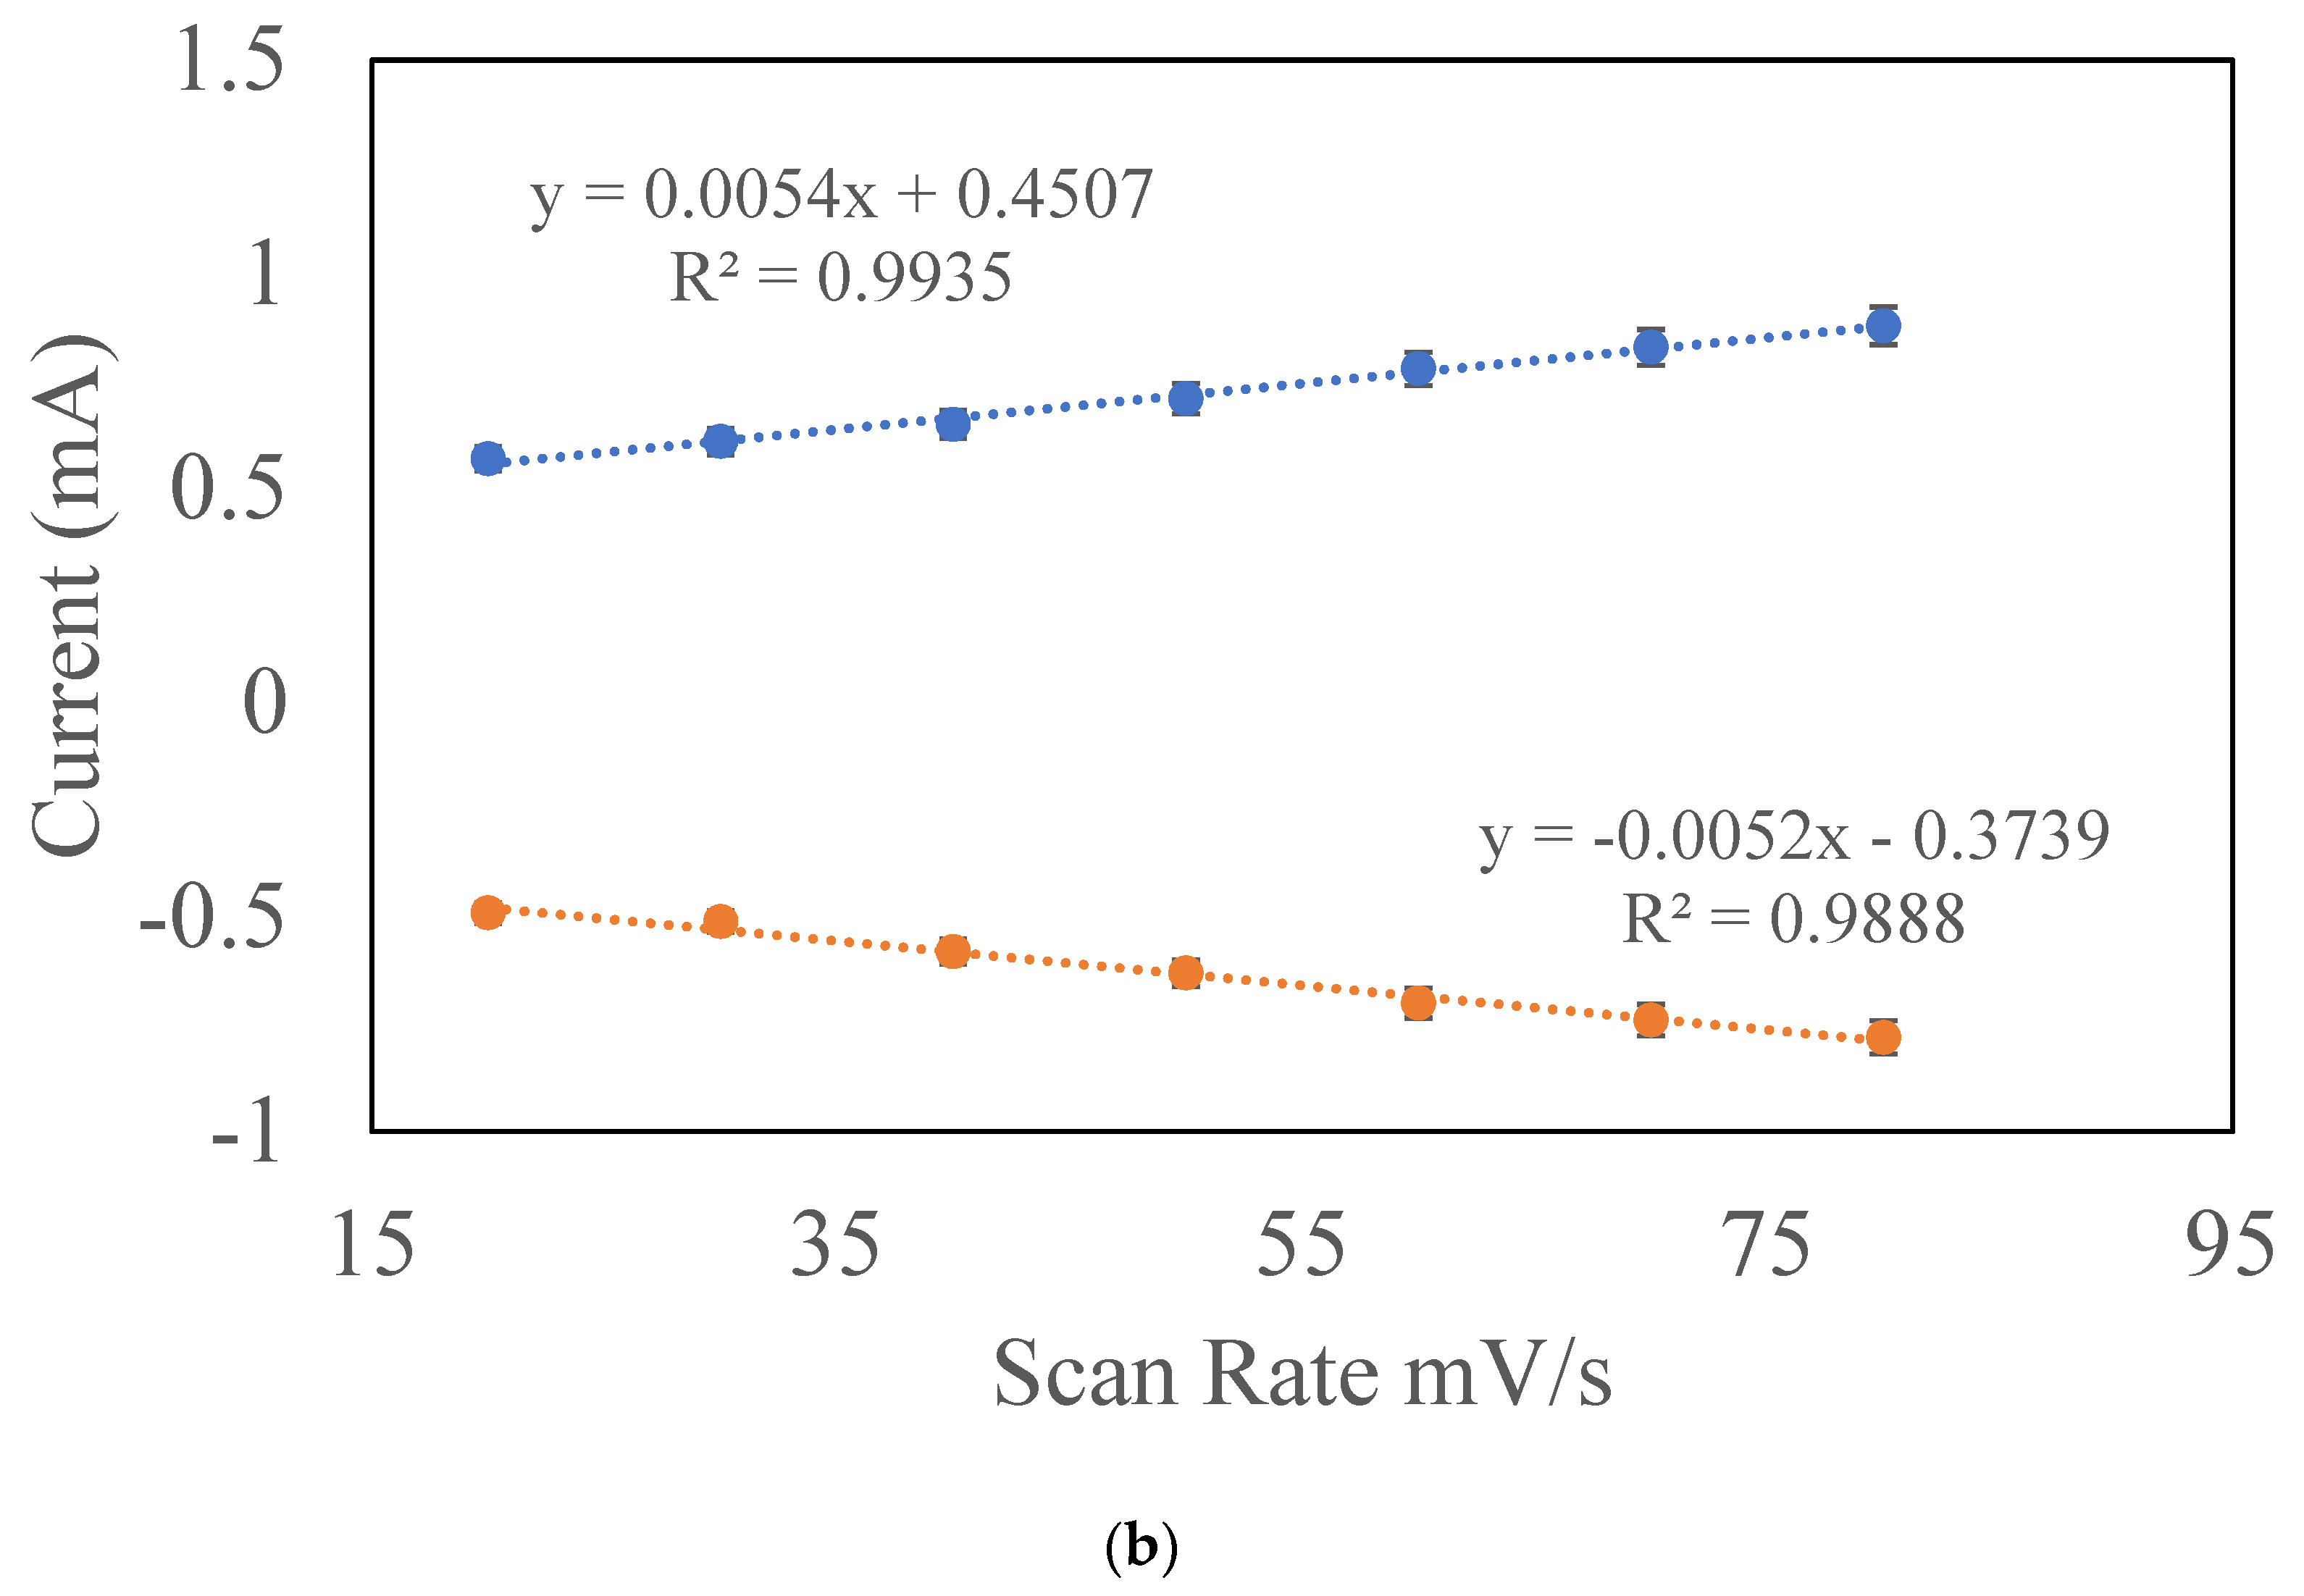
3.4.4. Scan Rates Study to Observe Sensing Response
3.4.5. Analysis of Selectivity and Stability
3.4.6. Real Sample Analysis
4. Conclusions
Author Contributions
Funding
Institutional Review Board Statement
Informed Consent Statement
Acknowledgments
Conflicts of Interest
References
- Claros, J.; Tocino, R.V.; Fonseca, E.; Cigarral, B.; Barrios, B.; Casado, D.; Escalera, E.; Olivares, A.; Figuero, L.; Terán, E.; et al. Gastric cancer. Medicine 2021, 13, 1328–1334. [Google Scholar] [CrossRef]
- Sitarz, R.; Skierucha, M.; Mielko, J.; Offerhaus, J.; Maciejewski, R.; Polkowski, W. Gastric cancer: Epidemiology, prevention, classification, and treatment. Cancer Manag. Res. 2018, 10, 239–248. [Google Scholar] [CrossRef] [PubMed] [Green Version]
- Molina-Castro, S.; Pereira-Marques, J.; Figueiredo, C.; Machado, J.C.; Varon, C. Gastric cancer: Basic aspects. Helicobacter 2017, 22, e12412. [Google Scholar] [CrossRef] [PubMed]
- Kienesberger, S.; Zechner, E.L. Helicobacter pylori. In Reference Module in Biomedical Sciences, 4th ed.; Academic Press: Cambridge, MA, USA, 2017; pp. 518–524. [Google Scholar] [CrossRef]
- Garza-González, E.; Perez-Perez, G.I.; Maldonado-Garza, H.J.; Bosques-Padilla, F.J. A review of Helicobacter pylori diagnosis, treatment, and methods to detect eradication. World J. Gastroenterol. 2014, 20, 1438–1449. [Google Scholar] [CrossRef] [PubMed]
- Kao, C.-Y.; Sheu, B.-S.; Wu, J.-J. Helicobacter pylori infection: An overview of bacterial virulence factors and pathogenesis. Biomed. J. 2016, 39, 14–23. [Google Scholar] [CrossRef] [PubMed] [Green Version]
- Wang, Y.-K.; Kuo, F.-C.; Liu, C.-J.; Wu, M.-C.; Shih, H.-Y.; Wang, S.S.; Wu, J.-Y.; Kuo, C.-H.; Huang, Y.-K.; Wu, D.-C. Diagnosis of Helicobacter pylori infection: Current options and developments. World J. Gastroenterol. 2015, 21, 11221–11235. [Google Scholar] [CrossRef]
- Saxena, K.; Chauhan, N.; Jain, U. Advances in diagnosis of Helicobacter pylori through biosensors: Point of care devices. Anal. Biochem. 2021, 630, 114325. [Google Scholar] [CrossRef]
- Yamaoka, Y.; Ojo, O.; Fujimoto, S.; Odenbreit, S.; Haas, R.; Gutierrez, O.; El-Zimaity, H.M.T.; Reddy, R.; Arnqvist, A.; Graham, D.Y. Helicobacter pylori outer membrane proteins and gastroduodenal disease. Gut 2006, 55, 775–781. [Google Scholar] [CrossRef] [Green Version]
- Zhang, J.; Wang, M.; Shi, Y.; Wang, Q.; Zhao, W. Rapid detection of Helicobacter pylori using cytotoxin-associated gene A based on loop-mediated isothermal amplification assay and magnetic nanoparticles. Mater. Express 2020, 10, 283–289. [Google Scholar] [CrossRef]
- Chang, W.-L.; Yeh, Y.-C.; Sheu, B.-S. The impacts of H. pylori virulence factors on the development of gastroduodenal diseases. J. Biomed. Sci. 2018, 25, 1–9. [Google Scholar] [CrossRef] [Green Version]
- Magalhaes, A.; Reis, C. Helicobacter pylori adhesion to gastric epithelial cells is mediated by glycan receptors. Braz. J. Med Biol. Res. 2010, 43, 611–618. [Google Scholar] [CrossRef] [PubMed] [Green Version]
- Gupta, S.; Tiwari, A.; Jain, U.; Chauhan, N. Synergistic effect of 2D material coated Pt nanoparticles with PEDOT polymer on electrode surface interface for a sensitive label free Helicobacter pylori CagA(Ag-Ab) immunosensing. Mater. Sci. Eng. C Mater. Biol. Appl. 2019, 103, 109733. [Google Scholar] [CrossRef] [PubMed]
- Granstrom, M.; Lehours, P.; Bengtsson, C.; Mégraud, F. Diagnosis of Helicobacter pylori. Helicobacter 2008, 13, 7–12. [Google Scholar] [CrossRef]
- Chauhan, N.; Saxena, K.; Tikadar, M.; Jain, U. Recent advances in the design of biosensors based on novel nanomaterials: An insight. Nanotechnol. Precis. Eng. 2021, 4, 045003. [Google Scholar] [CrossRef]
- Blum, L.J.; Coulet, P.R. What Is Biosensor, M. Dekker. 1991. Available online: https://www.routledge.com/Biosensor-Principles-and-Applications/lum/p/book/9780824785468 (accessed on 2 September 2022).
- Dede, S.; Altay, F. Biosensors from the First Generation to Nano-biosensors. Int. Adv. Res. Eng. J. 2018, 2, 200–207. [Google Scholar]
- Kizek, R.; Krejcova, L.; Michalek, P.; Rodrigo, M.M.; Heger, Z.; Krizkova, S.; Vaculovicova, M.; Hynek, D.; Adam, V. Nanoscale virus biosensors: State of the art. Nanobiosens. Dis. Diagn. 2015, 4, 47–66. [Google Scholar] [CrossRef] [Green Version]
- Zarei, M. Infectious pathogens meet point-of-care diagnostics. Biosens. Bioelectron. 2018, 106, 193–203. [Google Scholar] [CrossRef]
- Gui, R.; Jin, H.; Guo, H.; Wang, Z. Recent advances and future prospects in molecularly imprinted polymers-based electrochemical biosensors. Biosens. Bioelectron. 2018, 100, 56–70. [Google Scholar] [CrossRef]
- Roy, A.C.; Nisha, V.; Dhand, C.; Ali, A.; Malhotra, B. Molecularly imprinted polyaniline-polyvinyl sulphonic acid composite based sensor for para-nitrophenol detection. Anal. Chim. Acta 2013, 777, 63–71. [Google Scholar] [CrossRef]
- Hashwan, S.S.B.; Khir, M.H.B.M.; Al-Douri, Y.; Ahmed, A.Y. Recent Progress in the Development of Biosensors for Chemicals and Pesticides Detection. IEEE Access 2020, 8, 82514–82527. [Google Scholar] [CrossRef]
- Subramani, K.; Elhissi, A.; Subbiah, U.; Ahmed, W. Introduction to nanotechnology. Nanobiomater. Clin. Dent. 2019, 3–18. [Google Scholar] [CrossRef]
- Xia, M.-Y.; Xie, Y.; Yu, C.-H.; Chen, G.-Y.; Li, Y.-H.; Zhang, T.; Peng, Q. Graphene-based nanomaterials: The promising active agents for antibiotics-independent antibacterial applications. J. Control. Release 2019, 307, 16–31. [Google Scholar] [CrossRef] [PubMed]
- Baptista, P.; Fernandes, A.; Figueiredo, S.; Vinhas, R.; Cordeiro, M.; Carlos, F.F.; Mendo, S. Gold nanoparticle-based theranostics: Disease diagnostics and treatment using a single nanomaterial. Nanobiosens. Dis. Diagn. 2015, 4, 11–23. [Google Scholar] [CrossRef] [Green Version]
- Pourmadadi, M.; Shayeh, J.S.; Arjmand, S.; Omidi, M.; Fatemi, F. An electrochemical sandwich immunosensor of vascular endothelial growth factor based on reduced graphene oxide/gold nanoparticle composites. Microchem. J. 2020, 159, 105476. [Google Scholar] [CrossRef]
- Krishnan, S.K.; Singh, E.; Singh, P.; Meyyappan, M.; Singh Nalwa, H. A review on graphene-based nanocomposites for electrochemical and fluorescent biosensors. RSC Adv. 2019, 9, 8778–8881. [Google Scholar] [CrossRef]
- Biovia, D.S. Material Studio Modelling; Dassault Systemes: San Diego, CA, USA, 2018. [Google Scholar]
- Nešić, D.; Buti, L.; Lu, X.; Stebbins, C.E. Structure of the Helicobacter pylori CagA oncoprotein bound to the human tumor suppressor ASPP2. Proc. Natl. Acad. Sci. USA 2014, 111, 1562–1567. [Google Scholar] [CrossRef] [PubMed] [Green Version]
- Delley, B. An all-electron numerical method for solving the local density functional for polyatomic molecules. J. Chem. Phys. 1998, 92, 508–517. [Google Scholar] [CrossRef]
- Delley, B. From molecules to solids with the DMol3 approach. J. Chem. Phys. 2000, 113, 7756–7764. [Google Scholar] [CrossRef]
- Stephens, P.J.; Devlin, F.J.; Chabalowski, C.F.; Frisch, M.J. Ab Initio Calculation of Vibrational Absorption and Circular Dichroism Spectra Using Density Functional Force Fields. J. Phys. Chem. 1994, 98, 11623–11627. [Google Scholar] [CrossRef]
- Tirado-Rives, J.; Jorgensen, W.L. Performance of B3LYP Density Functional Methods for a Large Set of Organic Molecules. J. Chem. Theory Comput. 2008, 4, 297–306. [Google Scholar] [CrossRef]
- Aradi, B.; Hourahine, B.; Frauenheim, T. DFTB+, a Sparse Matrix-Based Implementation of the DFTB Method. J. Phys. Chem. A 2007, 111, 5678–5684. [Google Scholar] [CrossRef] [PubMed]
- Sun, H. COMPASS: An ab Initio Force-Field Optimized for Condensed-Phase ApplicationsOverview with Details on Alkane and Benzene Compounds. J. Phys. Chem. B 1998, 102, 7338–7364. [Google Scholar] [CrossRef]
- Sun, H.; Ren, P.; Fried, J. The COMPASS force field: Parameterization and validation for phosphazenes. Comput. Theor. Polym. Sci. 1998, 8, 229–246. [Google Scholar] [CrossRef]
- Kong, Y.; Wang, N.; Ni, X.; Yu, Q.; Liu, H.; Huang, W.; Xu, W. Molecular dynamics simulations of molecularly imprinted polymer approaches to the preparation of selective materials to remove norfloxacin. J. Appl. Polym. Sci. 2016, 133, 42817. [Google Scholar] [CrossRef]
- Patel, R.R.; Mohanraj, R.; Pittman, C.U., Jr. Properties of polystyrene and polymethyl methacrylate copolymers of polyhedral oligomeric silsesquioxanes: A molecular dynamics study. J. Polym. Sci. Part B Polym. Phys. 2005, 44, 234–248. [Google Scholar] [CrossRef]
- Synthesis of Gold Nanoparticles via Chemical Reduction Method. Available online: https://www.researchgate.net/publication/306360987_Synthesis_of_Gold_Nanoparticles_via_Chemical_Reduction_Method (accessed on 20 October 2022).
- Jo, J.; Lee, S.; Gim, J.; Song, J.; Kim, S.; Mathew, V.; Alfaruqi, M.H.; Kim, S.; Lim, J.; Kim, J. Facile synthesis of reduced graphene oxide by modified Hummer’s method as anode material for Li-, Na- and K-ion secondary batteries. R. Soc. Open Sci. 2019, 6, 181978. [Google Scholar] [CrossRef] [Green Version]
- Alibeyli, R.; Ata, A.; Topaç, E. Reduced Graphene Oxide Synthesis via Improved Hummers’ Method, (n.d.). In Proceedings of the Conference: ISITES., Pune, India, 17 August 2014. [Google Scholar]
- Jain, U.; Gupta, S.; Chauhan, N. Detection of glycated hemoglobin with voltammetric sensing amplified by 3D-structured nanocomposites. Int. J. Biol. Macromol. 2017, 101, 896–903. [Google Scholar] [CrossRef]
- Pareek, S.; Jain, U.; Balayan, S.; Chauhan, N. Ultra-sensitive nano-molecular imprinting polymer-based electrochemical sensor for Follicle-Stimulating Hormone (FSH) detection. Biochem. Eng. J. 2022, 180, 108329. [Google Scholar] [CrossRef]
- Balayan, S.; Chauhan, N.; Chandra, R.; Jain, U. Molecular imprinting based electrochemical biosensor for identification of serum amyloid A (SAA), a neonatal sepsis biomarker. Int. J. Biol. Macromol. 2022, 195, 589–597. [Google Scholar] [CrossRef]
- Saxena, K.; Kumar, A.; Chauhan, N.; Khanuja, M.; Malhotra, B.D.; Jain, U. Electrochemical Immunosensor for Detection of H. pylori Secretory Protein VacA on g-C3N4/ZnO Nanocomposite-Modified Au Electrode. ACS Omega 2022, 7, 32292–32301. [Google Scholar] [CrossRef]
- Gupta, S.; Jain, U.; Murti, B.T.; Putri, A.D.; Tiwari, A.; Chauhan, N. Nanohybrid-based immunosensor prepared for Helicobacter pylori BabA antigen detection through immobilized antibody assembly with @ Pdnano/rGO/PEDOT sensing platform. Sci. Rep. 2020, 10, 1–14. [Google Scholar] [CrossRef] [PubMed]
- Stoian, I.-A.; Iacob, B.-C.; Dudaș, C.-L.; Barbu-Tudoran, L.; Bogdan, D.; Marian, I.O.; Bodoki, E.; Oprean, R. Biomimetic electrochemical sensor for the highly selective detection of azithromycin in biological samples. Biosens. Bioelectron. 2020, 155, 112098. [Google Scholar] [CrossRef] [PubMed]
- Li, Y.; Zhang, L.; Dang, Y.; Chen, Z.; Zhang, R.; Li, Y.; Ye, B.-C. A robust electrochemical sensing of molecularly imprinted polymer prepared by using bifunctional monomer and its application in detection of cypermethrin. Biosens. Bioelectron. 2018, 127, 207–214. [Google Scholar] [CrossRef] [PubMed]
- Electrochemical Based C-Reactive Protein (CRP) Sensing Through Molecularly Imprinted Polymer (MIP) Pore Structure Coupled with Bi-Metallic Tuned Screen-Printed Electrode. Biointerface Res. Appl. Chem. 2021, 12, 7697–7714. [CrossRef]
- Jin, M.; Zhang, G.; Yu, F.; Li, W.; Lu, W.; Huang, H. Sponge-like Ni(OH)2–NiF2 composite film with excellent electrochemical performance. Phys. Chem. Chem. Phys. 2013, 15, 1601–1605. [Google Scholar] [CrossRef]
- Bathinapatla, A.; Kanchi, S.; Singh, P.; Sabela, M.I.; Bisetty, K. An ultrasensitive performance enhanced novel cytochrome c biosensor for the detection of rebaudioside A. Biosens. Bioelectron. 2016, 77, 116–123. [Google Scholar] [CrossRef] [PubMed]
- Ashaduzzaman, M.; Deshpande, S.R.; Murugan, N.A.; Mishra, Y.K.; Turner, A.P.F.; Tiwari, A. On/off-switchable LSPR nano-immunoassay for troponin-T. Sci. Rep. 2017, 7, srep44027. [Google Scholar] [CrossRef] [Green Version]
- Basiuk, E.V.; Martínez-Herrera, M.; Álvarez-Zauco, E.; Henao-Holguín, L.V.; Puente-Lee, I.; Basiuk, V.A. Noncovalent functionalization of graphene with a Ni(II) tetraaza[14]annulene complex. Dalton Trans. 2014, 43, 7413–7428. [Google Scholar] [CrossRef]
- Murti, B.T.; Putri, A.D.; Kanchi, S.; Sabela, M.I.; Bisetty, K.; Inamuddin; Asiri, A.M. Light induced DNA-functionalized TiO2 nanocrystalline interface: Theoretical and experimental insights towards DNA damage detection. J. Photochem. Photobiol. B Biol. 2018, 188, 159–176. [Google Scholar] [CrossRef]
- Hu, J.; He, P.; Li, Y. Chemical modifications of tryptophan residues in peptides and proteins. J. Pept. Sci. 2021, 27, e3286. [Google Scholar] [CrossRef]
- King, T.A.; Kandemir, J.M.; Walsh, S.J.; Spring, D.R. Photocatalytic methods for amino acid modification. Chem. Soc. Rev. 2021, 50, 39–57. [Google Scholar] [CrossRef] [PubMed]
- Sun, H.-W.; Qiao, F.-X. Recognition mechanism of water-compatible molecularly imprinted solid-phase extraction and determination of nine quinolones in urine by high performance liquid chromatography. J. Chromatogr. A 2008, 1212, 1–9. [Google Scholar] [CrossRef] [PubMed]
- Tokonami, S.; Shiigi, H.; Nagaoka, T. Review: Micro- and nanosized molecularly imprinted polymers for high-throughput analytical applications. Anal. Chim. Acta 2009, 641, 7–13. [Google Scholar] [CrossRef] [PubMed]
- Thorneywork, A.L.; Roth, R.; Aarts, D.G.A.L.; Dullens, R.P.A. Communication: Radial distribution functions in a two-dimensional binary colloidal hard sphere system. J. Chem. Phys. 2014, 140, 161106. [Google Scholar] [CrossRef] [Green Version]
- Harris, T.K.; Mildvan, A.S. High-Precision Measurement of Hydrogen Bond Lengths in Proteins by Nu-clear Magnetic Resonance Methods. Proteins 1999, 35, 275–282. [Google Scholar] [CrossRef]
- Sarkhel, S.; Desiraju, G.R. N-H…O, O-H…O, and C-H…O hydrogen bonds in protein-ligand complexes: Strong and weak interactions in molecular recognition. Proteins 2004, 54, 247–259. [Google Scholar] [CrossRef]
- Caro, E.; Marce, R.; Borrull, F.; Cormack, P.; Sherrington, D. Application of molecularly imprinted polymers to solid-phase extraction of compounds from environmental and biological samples. TrAC Trends Anal. Chem. 2006, 25, 143–154. [Google Scholar] [CrossRef]
- Soni, S.; Jain, U.; Burke, D.H.; Chauhan, N. A label free, signal off electrochemical aptasensor for amphetamine detection. Surf. Interfaces 2022, 31, 102023. [Google Scholar] [CrossRef]
- Jain, U.; Soni, S.; Balhara, Y.P.S.; Khanuja, M.; Chauhan, N. Dual-Layered Nanomaterial-Based Molecular Pattering on Polymer Surface Biomimetic Impedimetric Sensing of a Bliss Molecule, Anandamide Neurotransmitter. ACS Omega 2020, 5, 10750–10758. [Google Scholar] [CrossRef]


| Polymer | CagA (mmol) | MMA (mmol) | EGDMA (mmol) | ACN (mmol) | Molar Ratio |
|---|---|---|---|---|---|
| MIP 1 | 1 | 2 | 2 | 80 | 1:2:2 |
| MIP 2 | 1 | 4 | 4 | 80 | 1:4:4 |
| MIP 3 | 1 | 6 | 6 | 80 | 1:6:6 |
| MIP 4 | 1 | 8 | 8 | 80 | 1:8:8 |
| MIP 5 | 1 | 10 | 10 | 80 | 1:10:10 |
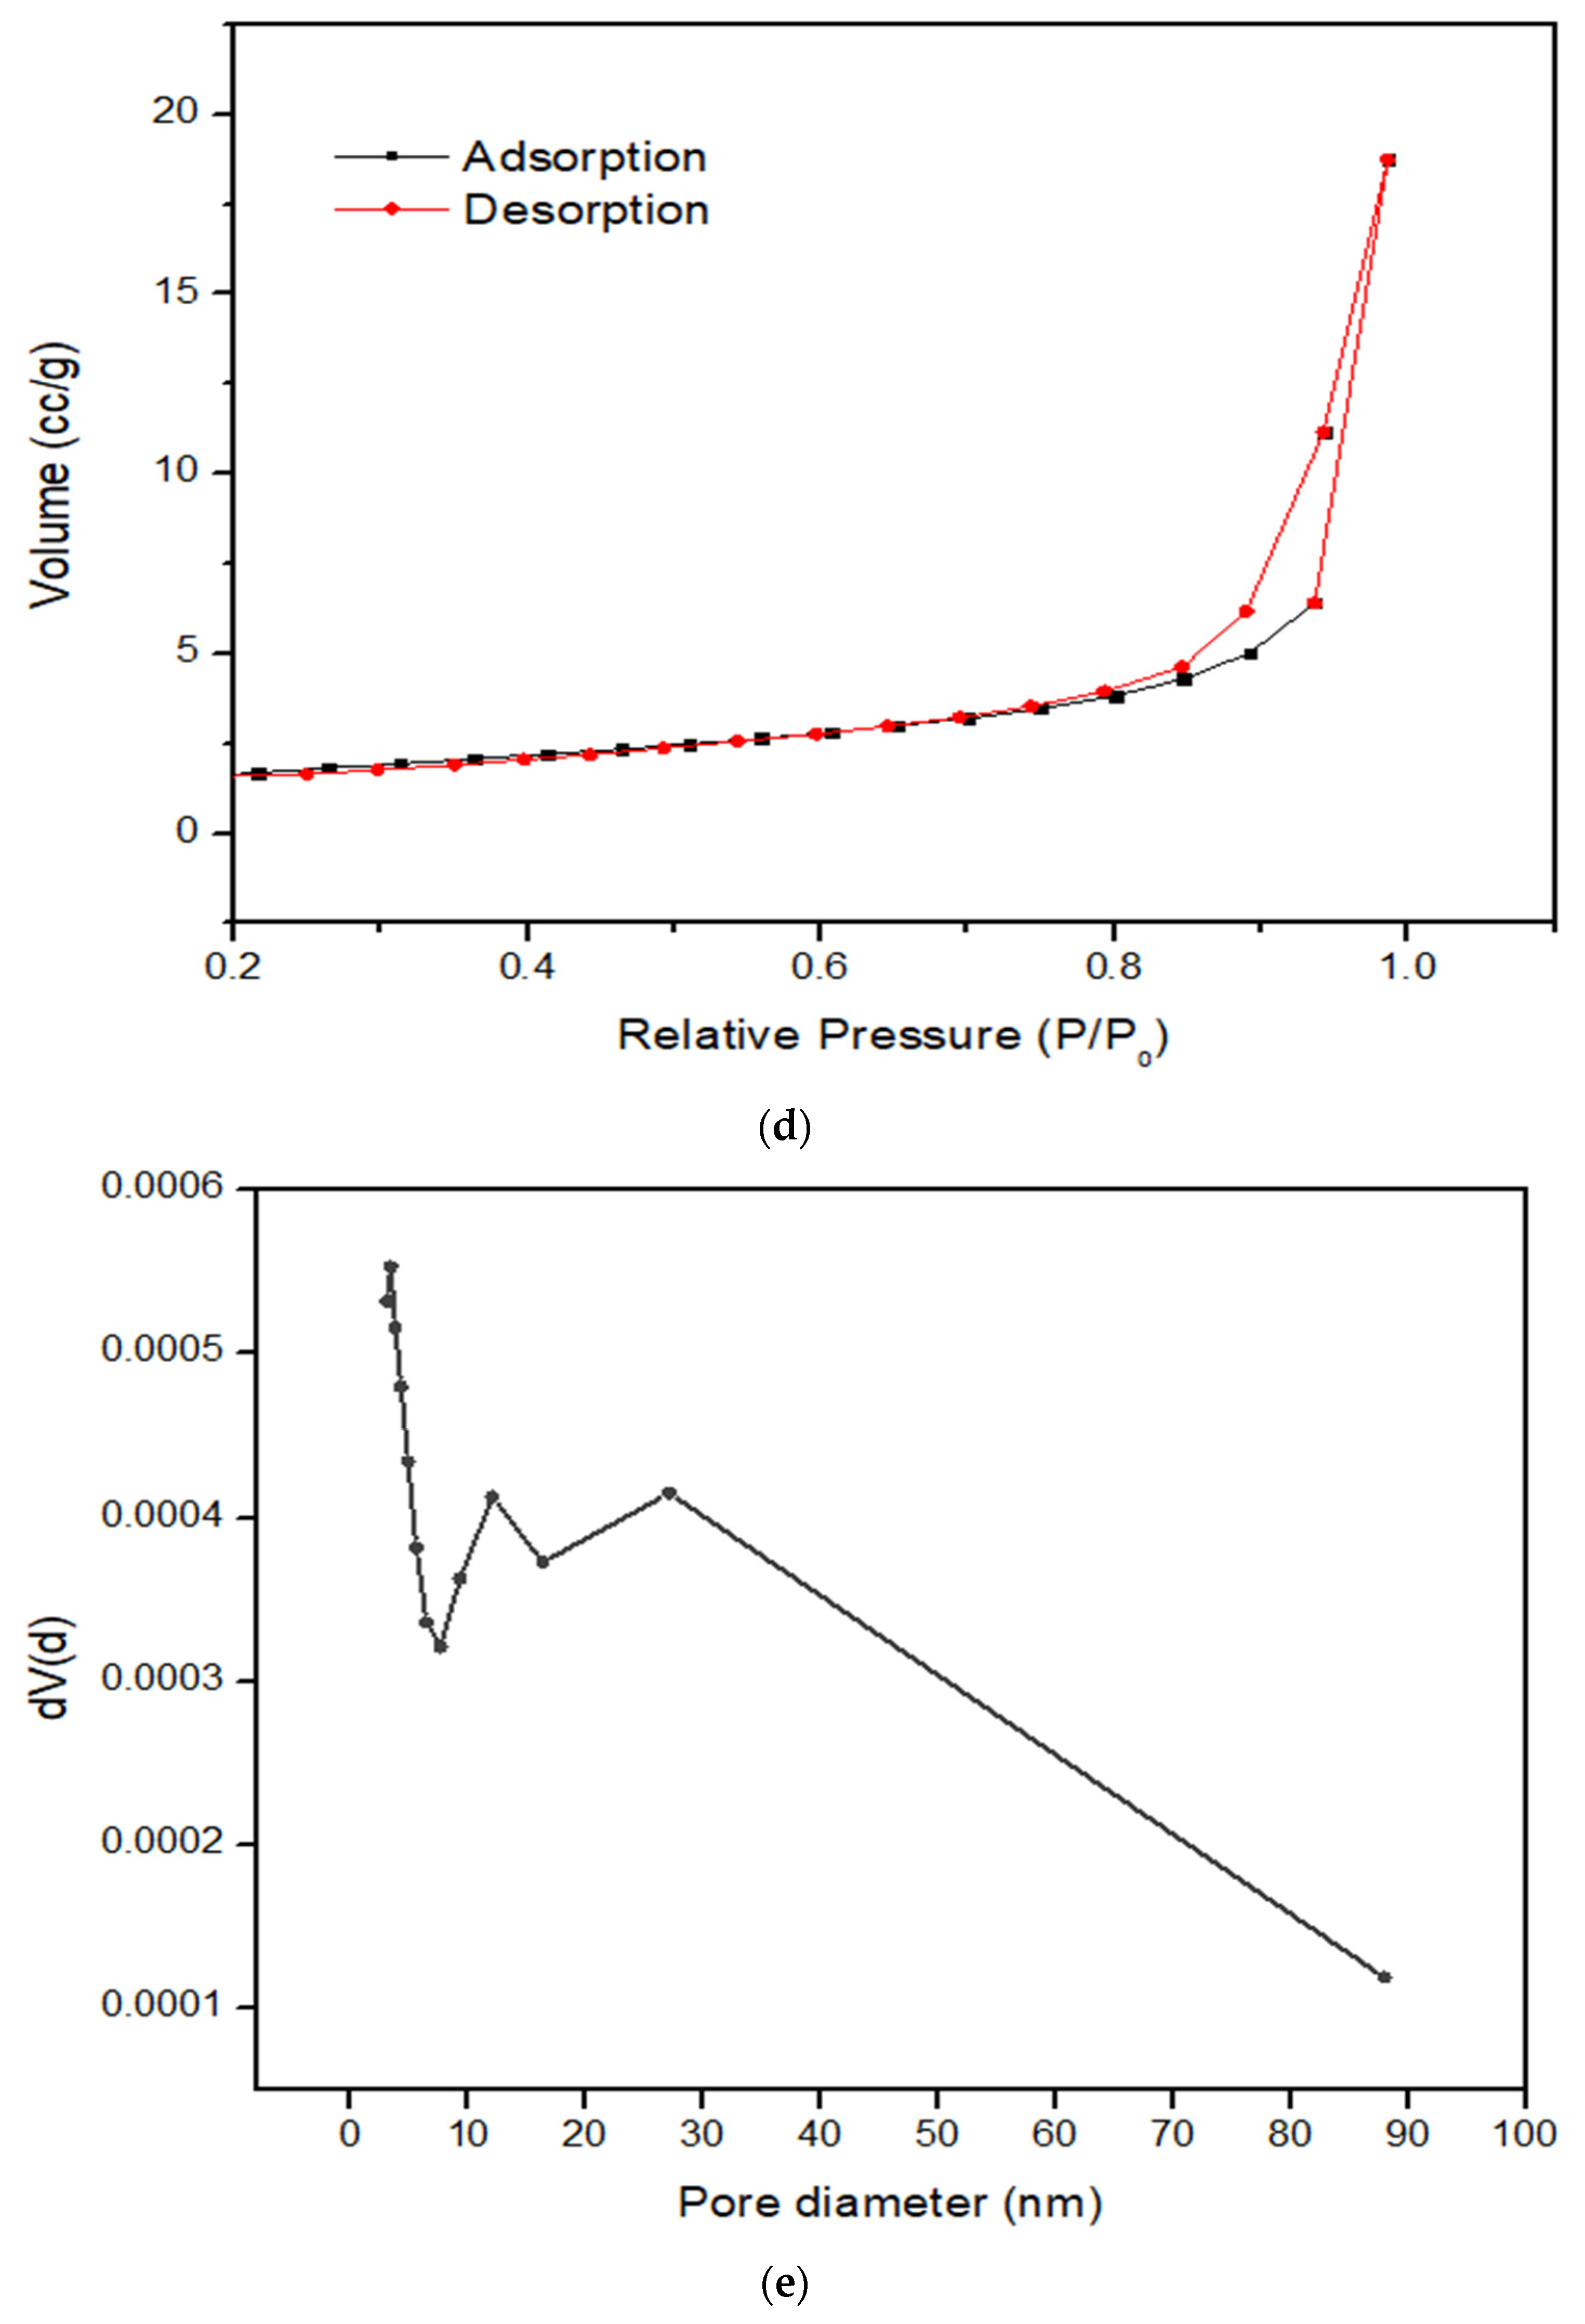
| Surface Area | 5.074 m2/g |
|---|---|
| Pore Volume | 0.029 cc/g |
| Pore Diameter Dv(d) | 3.374 nm |
| Complex/Molecules | Total Energy (kcal/mol) | Binding Energy (kcal/mol) |
|---|---|---|
| Before template removal (CagA-MMA-EGDMA-ACN) | −9049.77 | −886.48 |
| After template removal (MMA-EGDMA-ACN) | −1317.29 | −32.94 |
| CagA | −6878.95 | |
| MMA | −53.32 | |
| EGDMA | −153.70 | |
| ACN | −1077.32 |
Publisher’s Note: MDPI stays neutral with regard to jurisdictional claims in published maps and institutional affiliations. |
© 2022 by the authors. Licensee MDPI, Basel, Switzerland. This article is an open access article distributed under the terms and conditions of the Creative Commons Attribution (CC BY) license (https://creativecommons.org/licenses/by/4.0/).
Share and Cite
Saxena, K.; Murti, B.T.; Yang, P.-K.; Malhotra, B.D.; Chauhan, N.; Jain, U. Fabrication of a Molecularly Imprinted Nano-Interface-Based Electrochemical Biosensor for the Detection of CagA Virulence Factors of H. pylori. Biosensors 2022, 12, 1066. https://doi.org/10.3390/bios12121066
Saxena K, Murti BT, Yang P-K, Malhotra BD, Chauhan N, Jain U. Fabrication of a Molecularly Imprinted Nano-Interface-Based Electrochemical Biosensor for the Detection of CagA Virulence Factors of H. pylori. Biosensors. 2022; 12(12):1066. https://doi.org/10.3390/bios12121066
Chicago/Turabian StyleSaxena, Kirti, Bayu Tri Murti, Po-Kang Yang, Bansi Dhar Malhotra, Nidhi Chauhan, and Utkarsh Jain. 2022. "Fabrication of a Molecularly Imprinted Nano-Interface-Based Electrochemical Biosensor for the Detection of CagA Virulence Factors of H. pylori" Biosensors 12, no. 12: 1066. https://doi.org/10.3390/bios12121066