Synthesis and Characterization of TiO2 Thick Films for Glucose Sensing

Abstract
:1. Introduction
2. Materials and Methods
2.1. Synthesis of a TiO2 Electrode
2.2. Characterization of the Ti/TiO2 Electrode
3. Results and Discussion
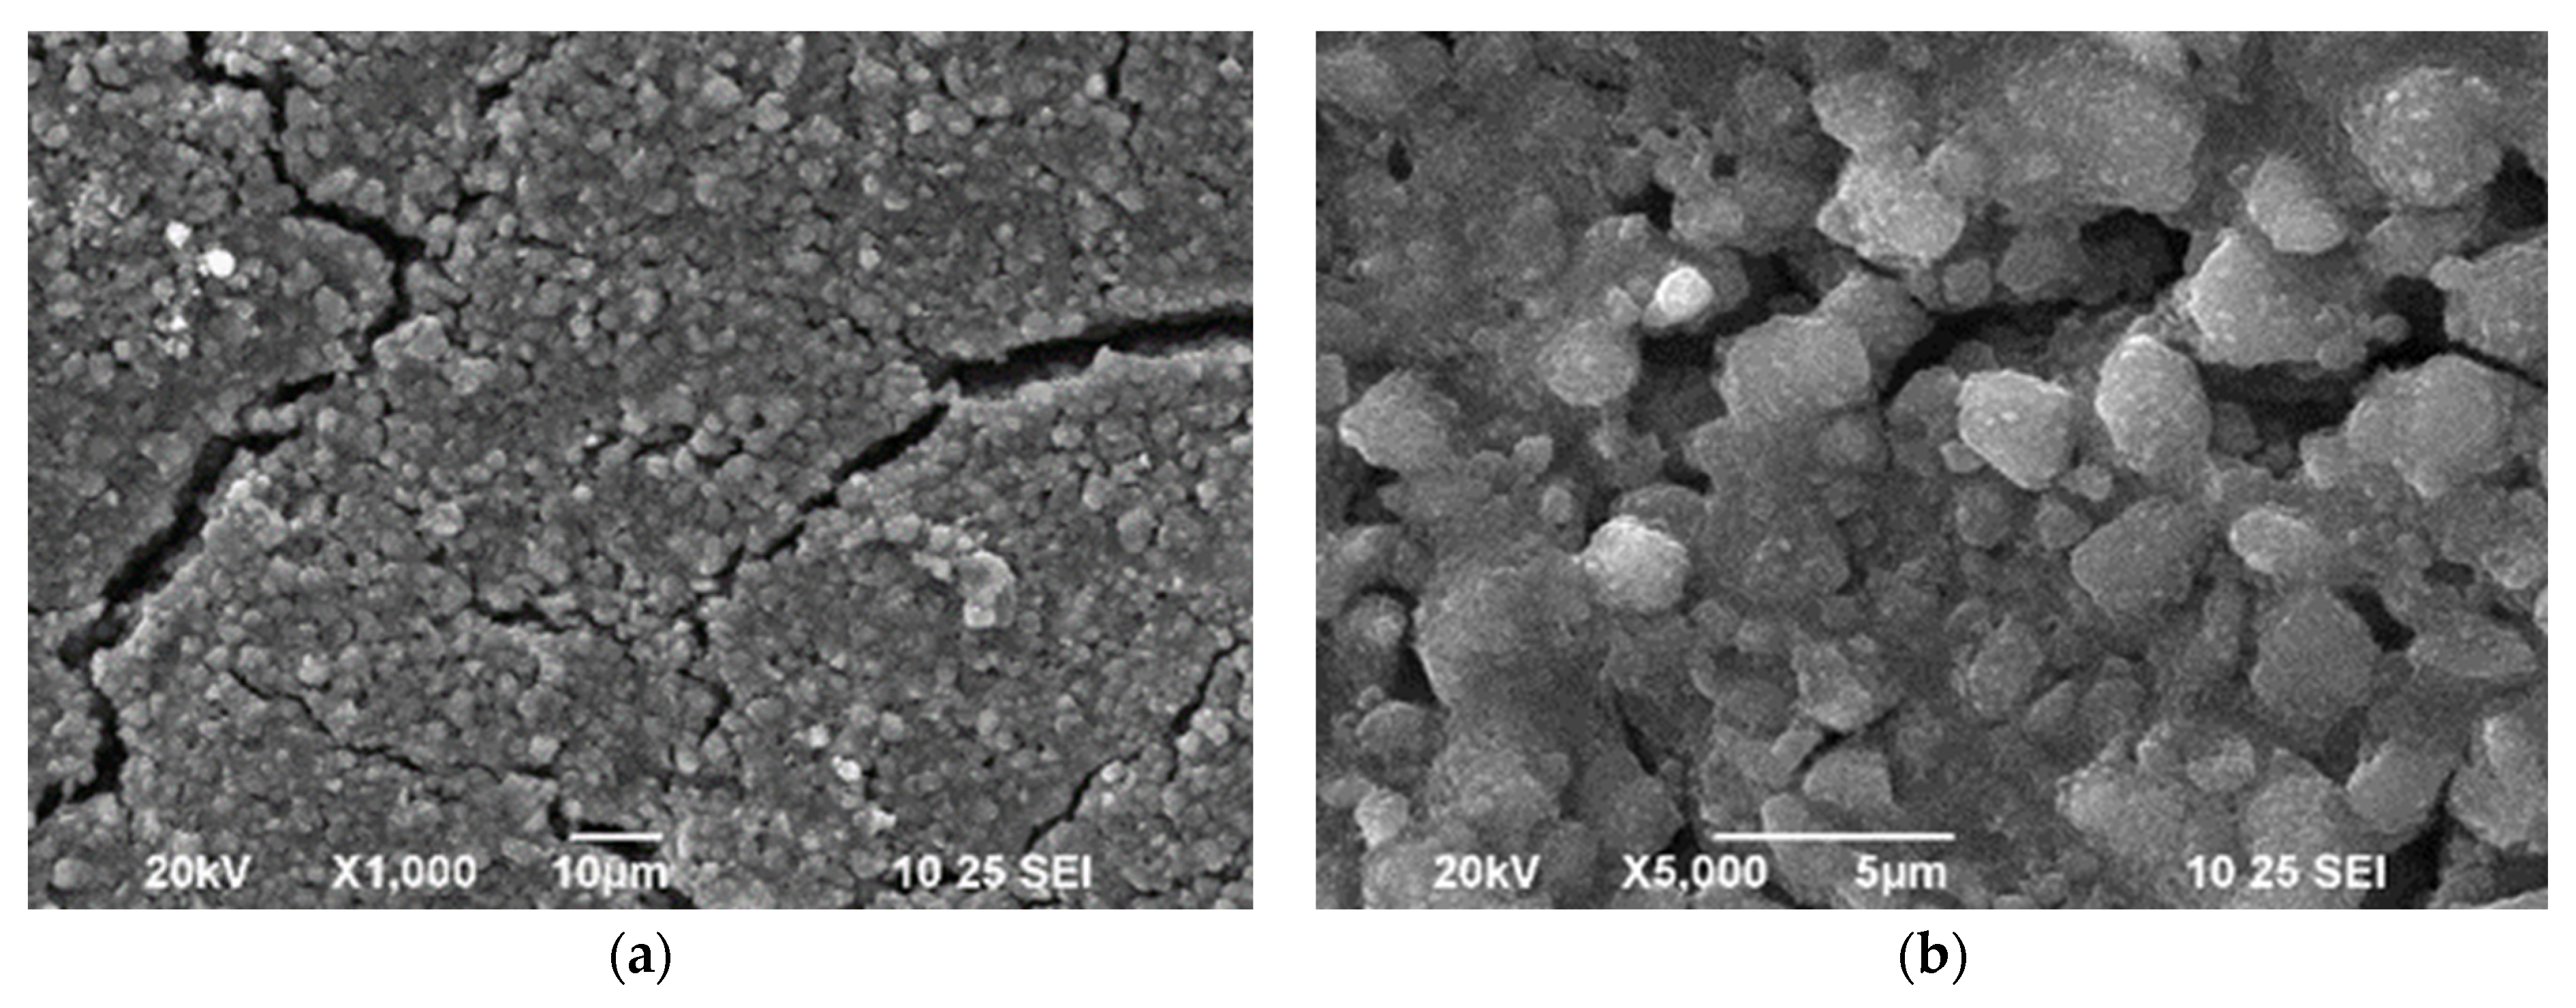
3.1. SEM
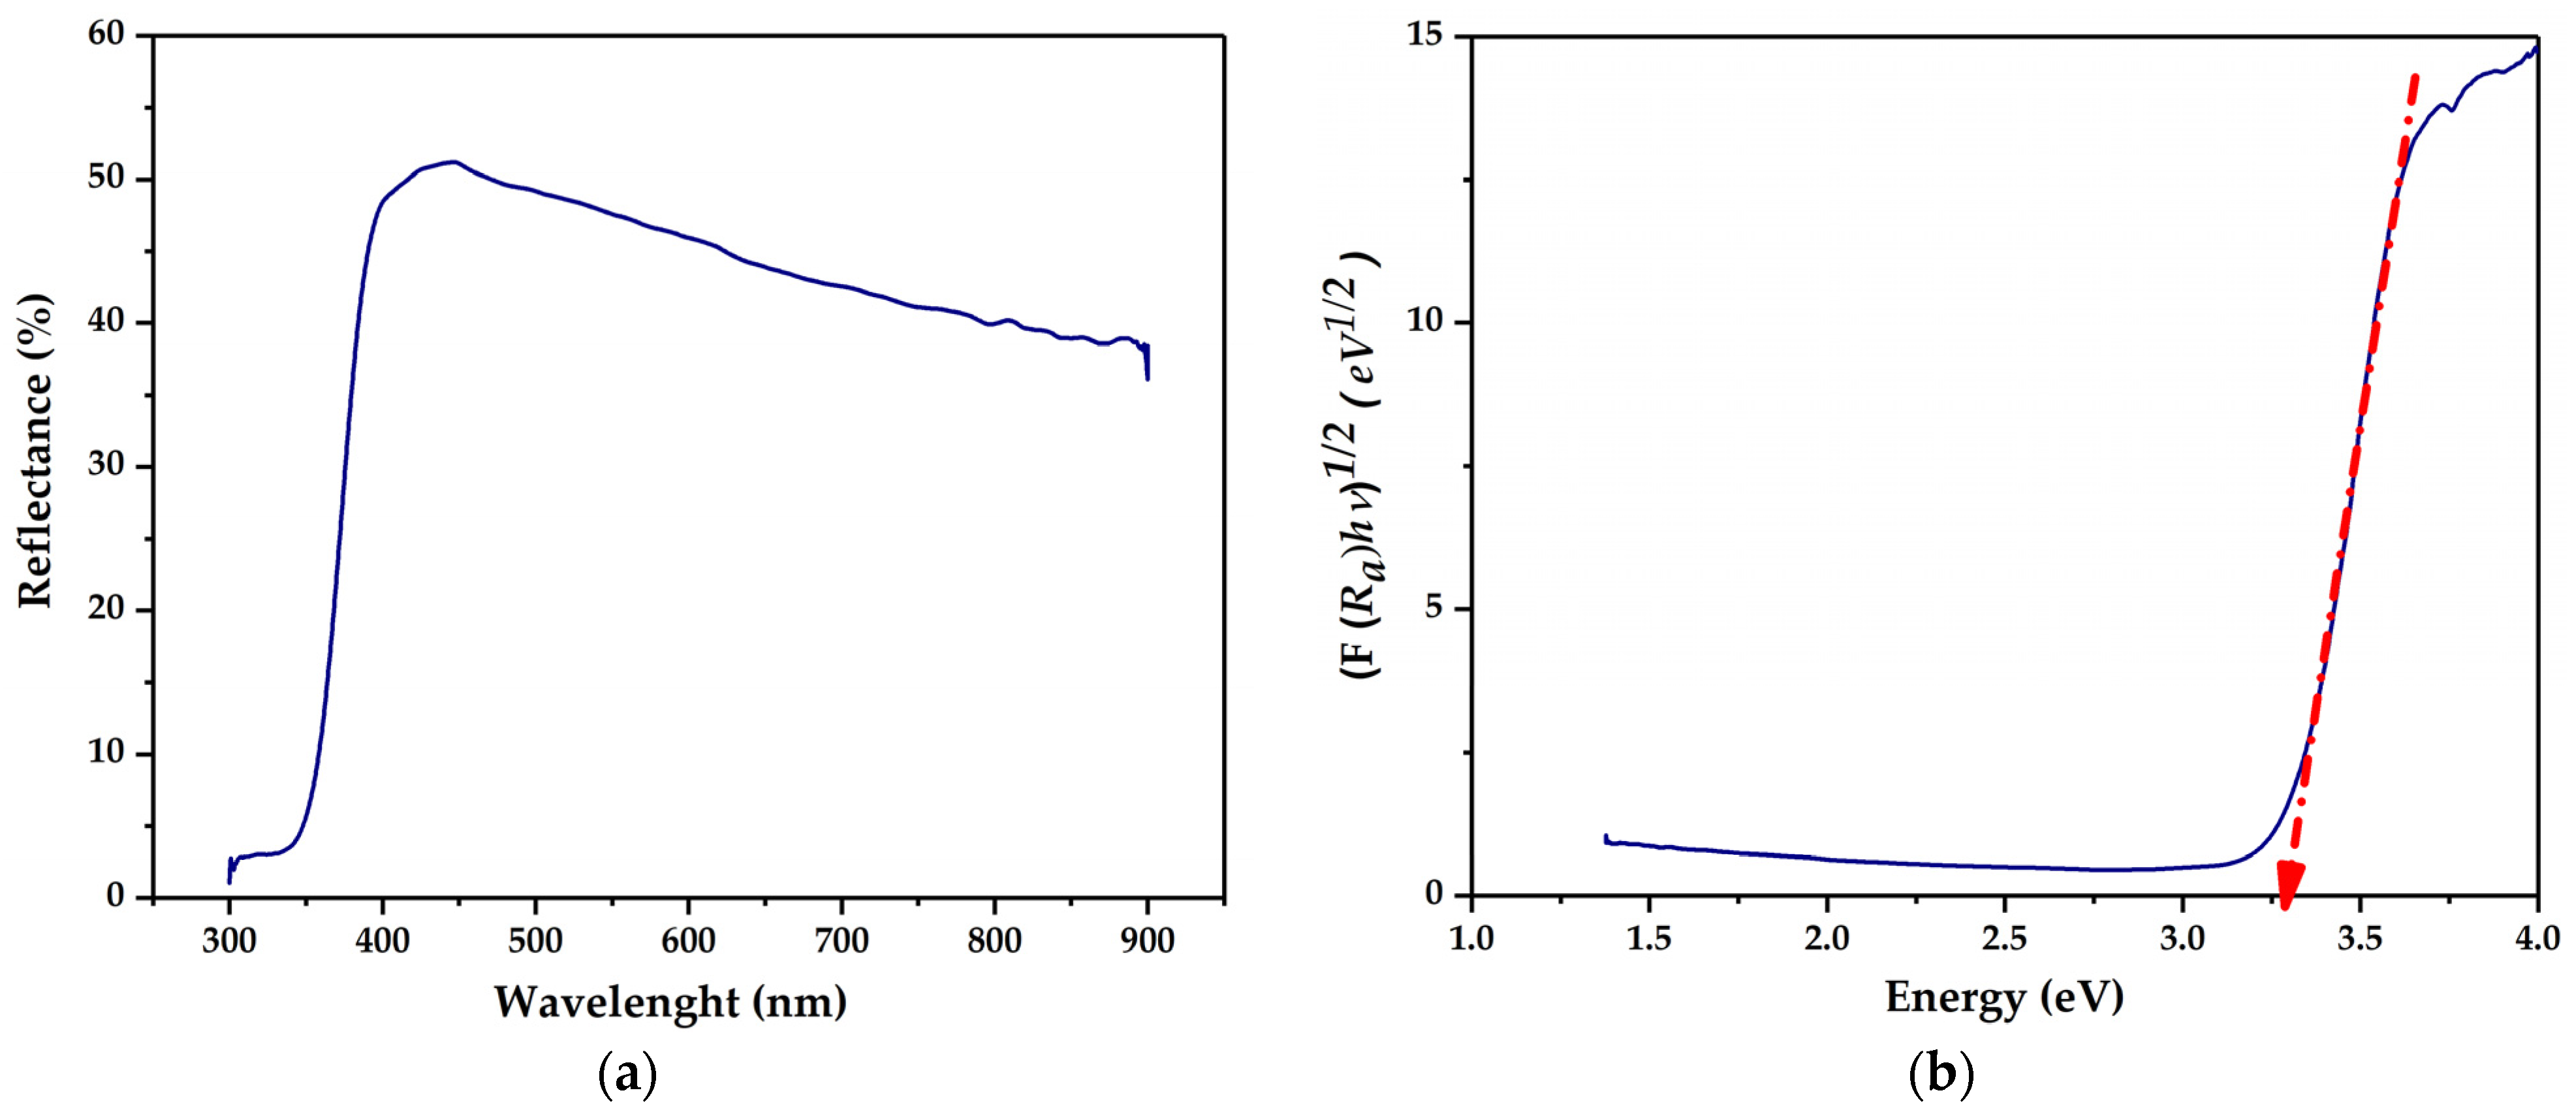
3.2. UV-Vis
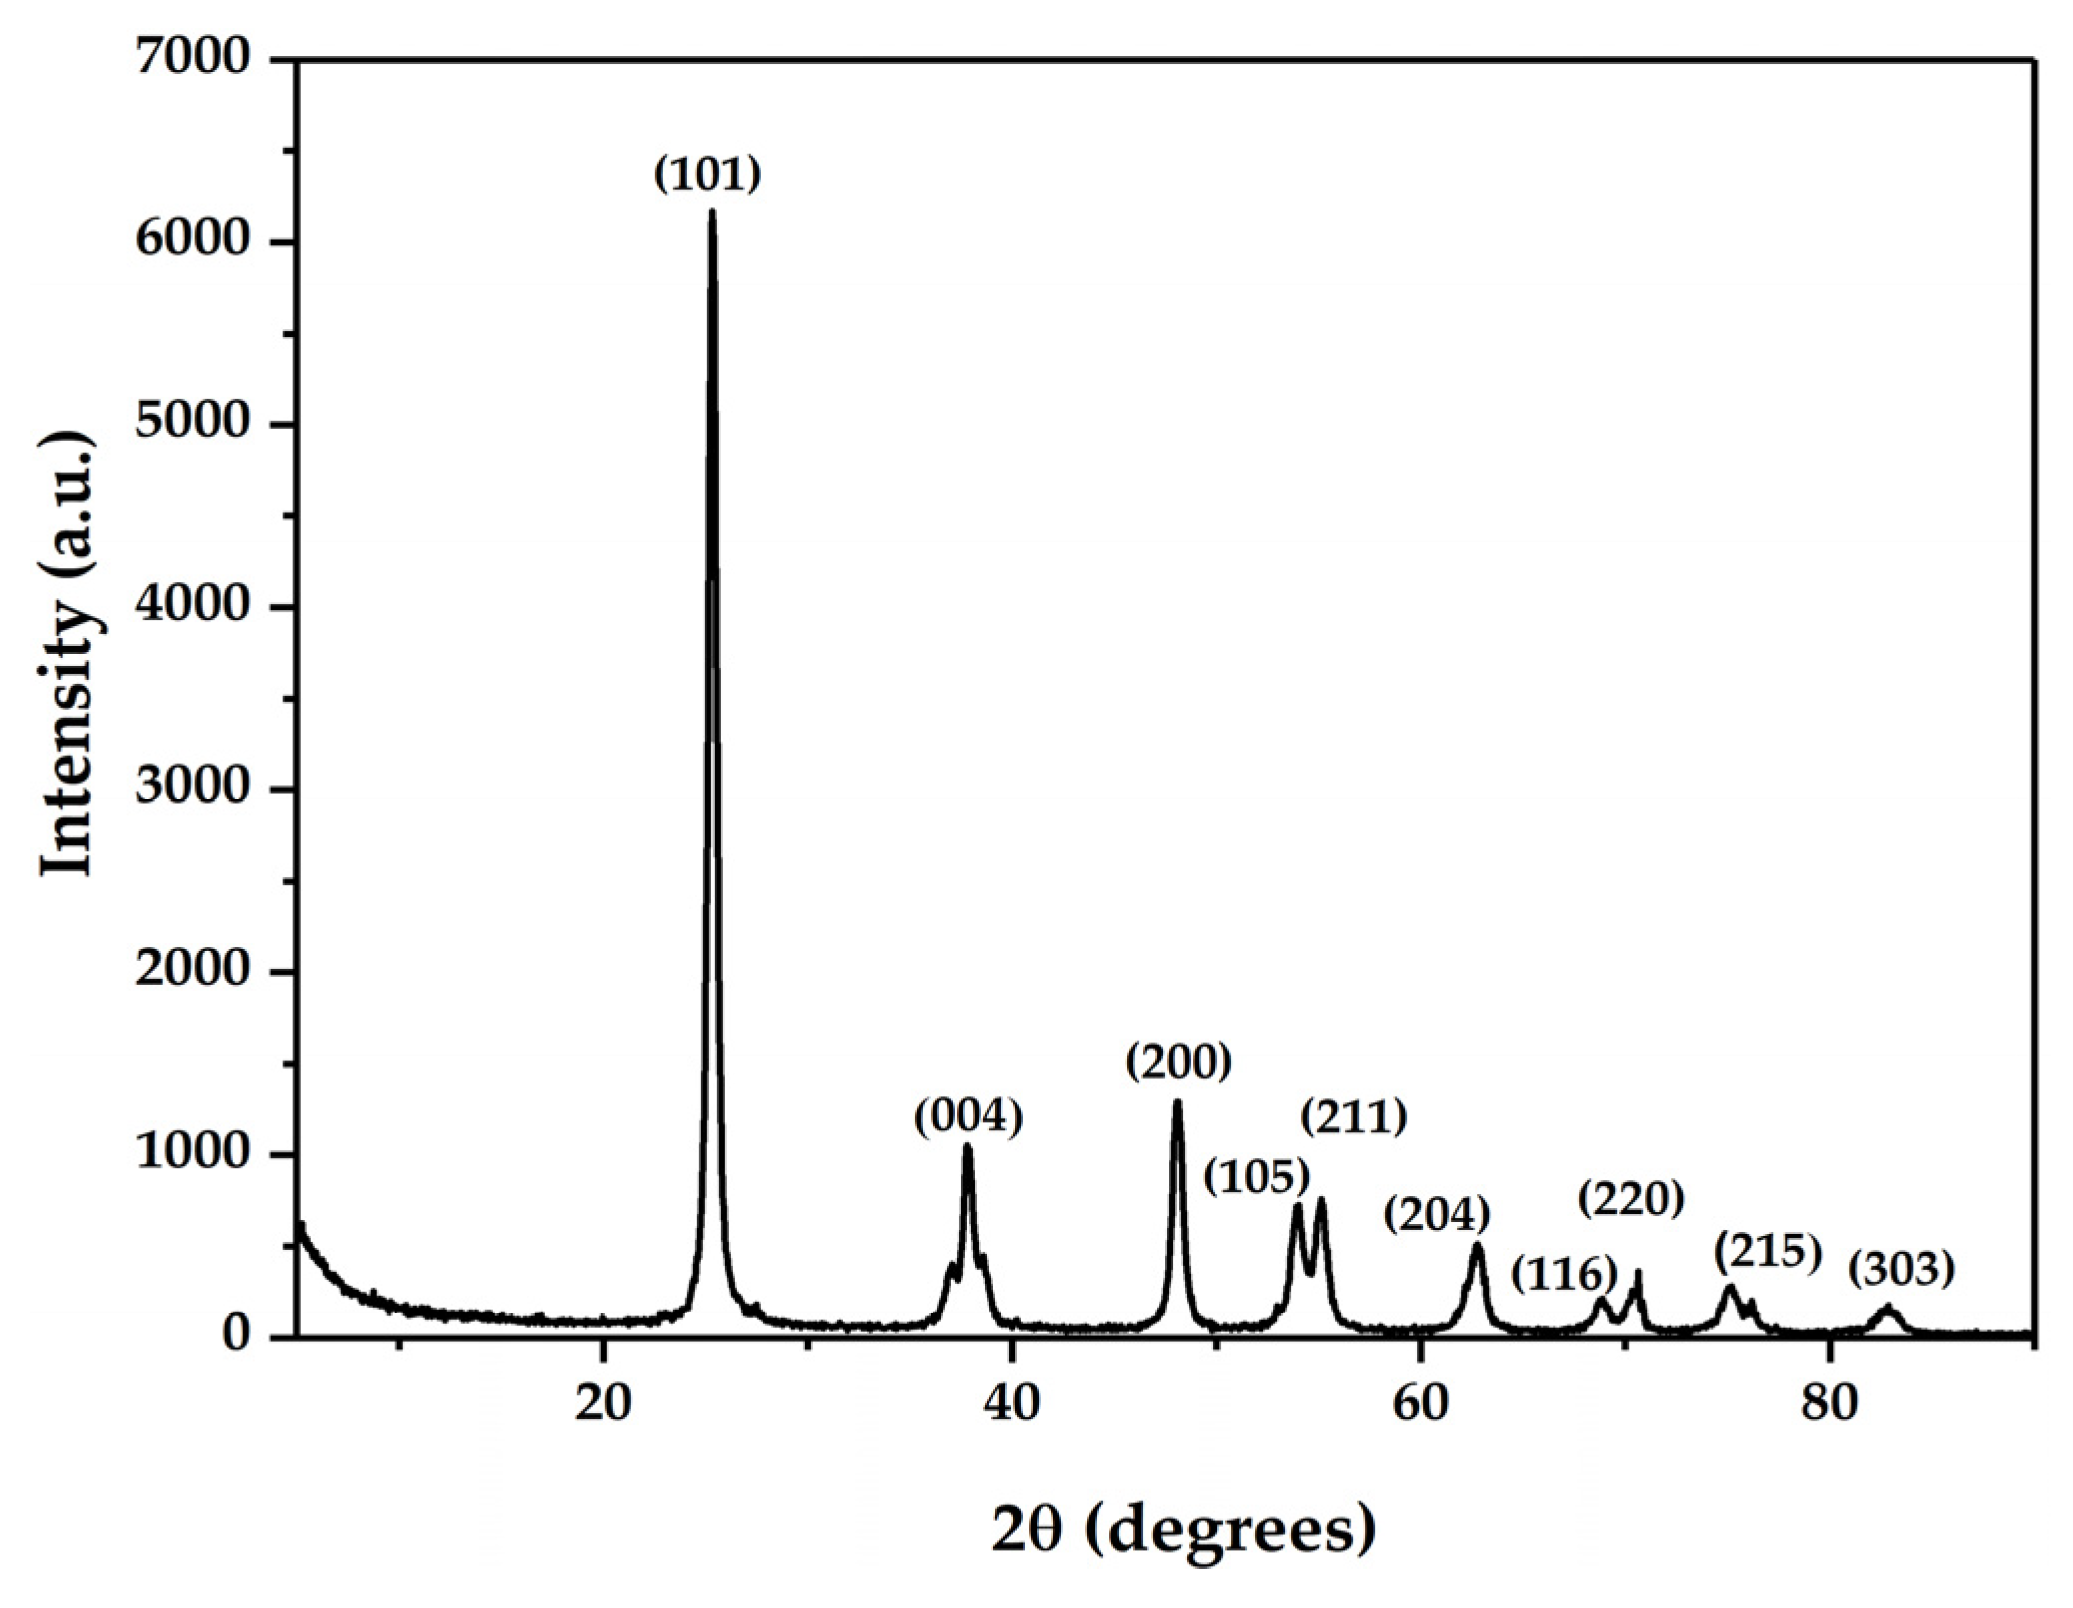
3.3. XRD
3.4. Electrochemical Measurements
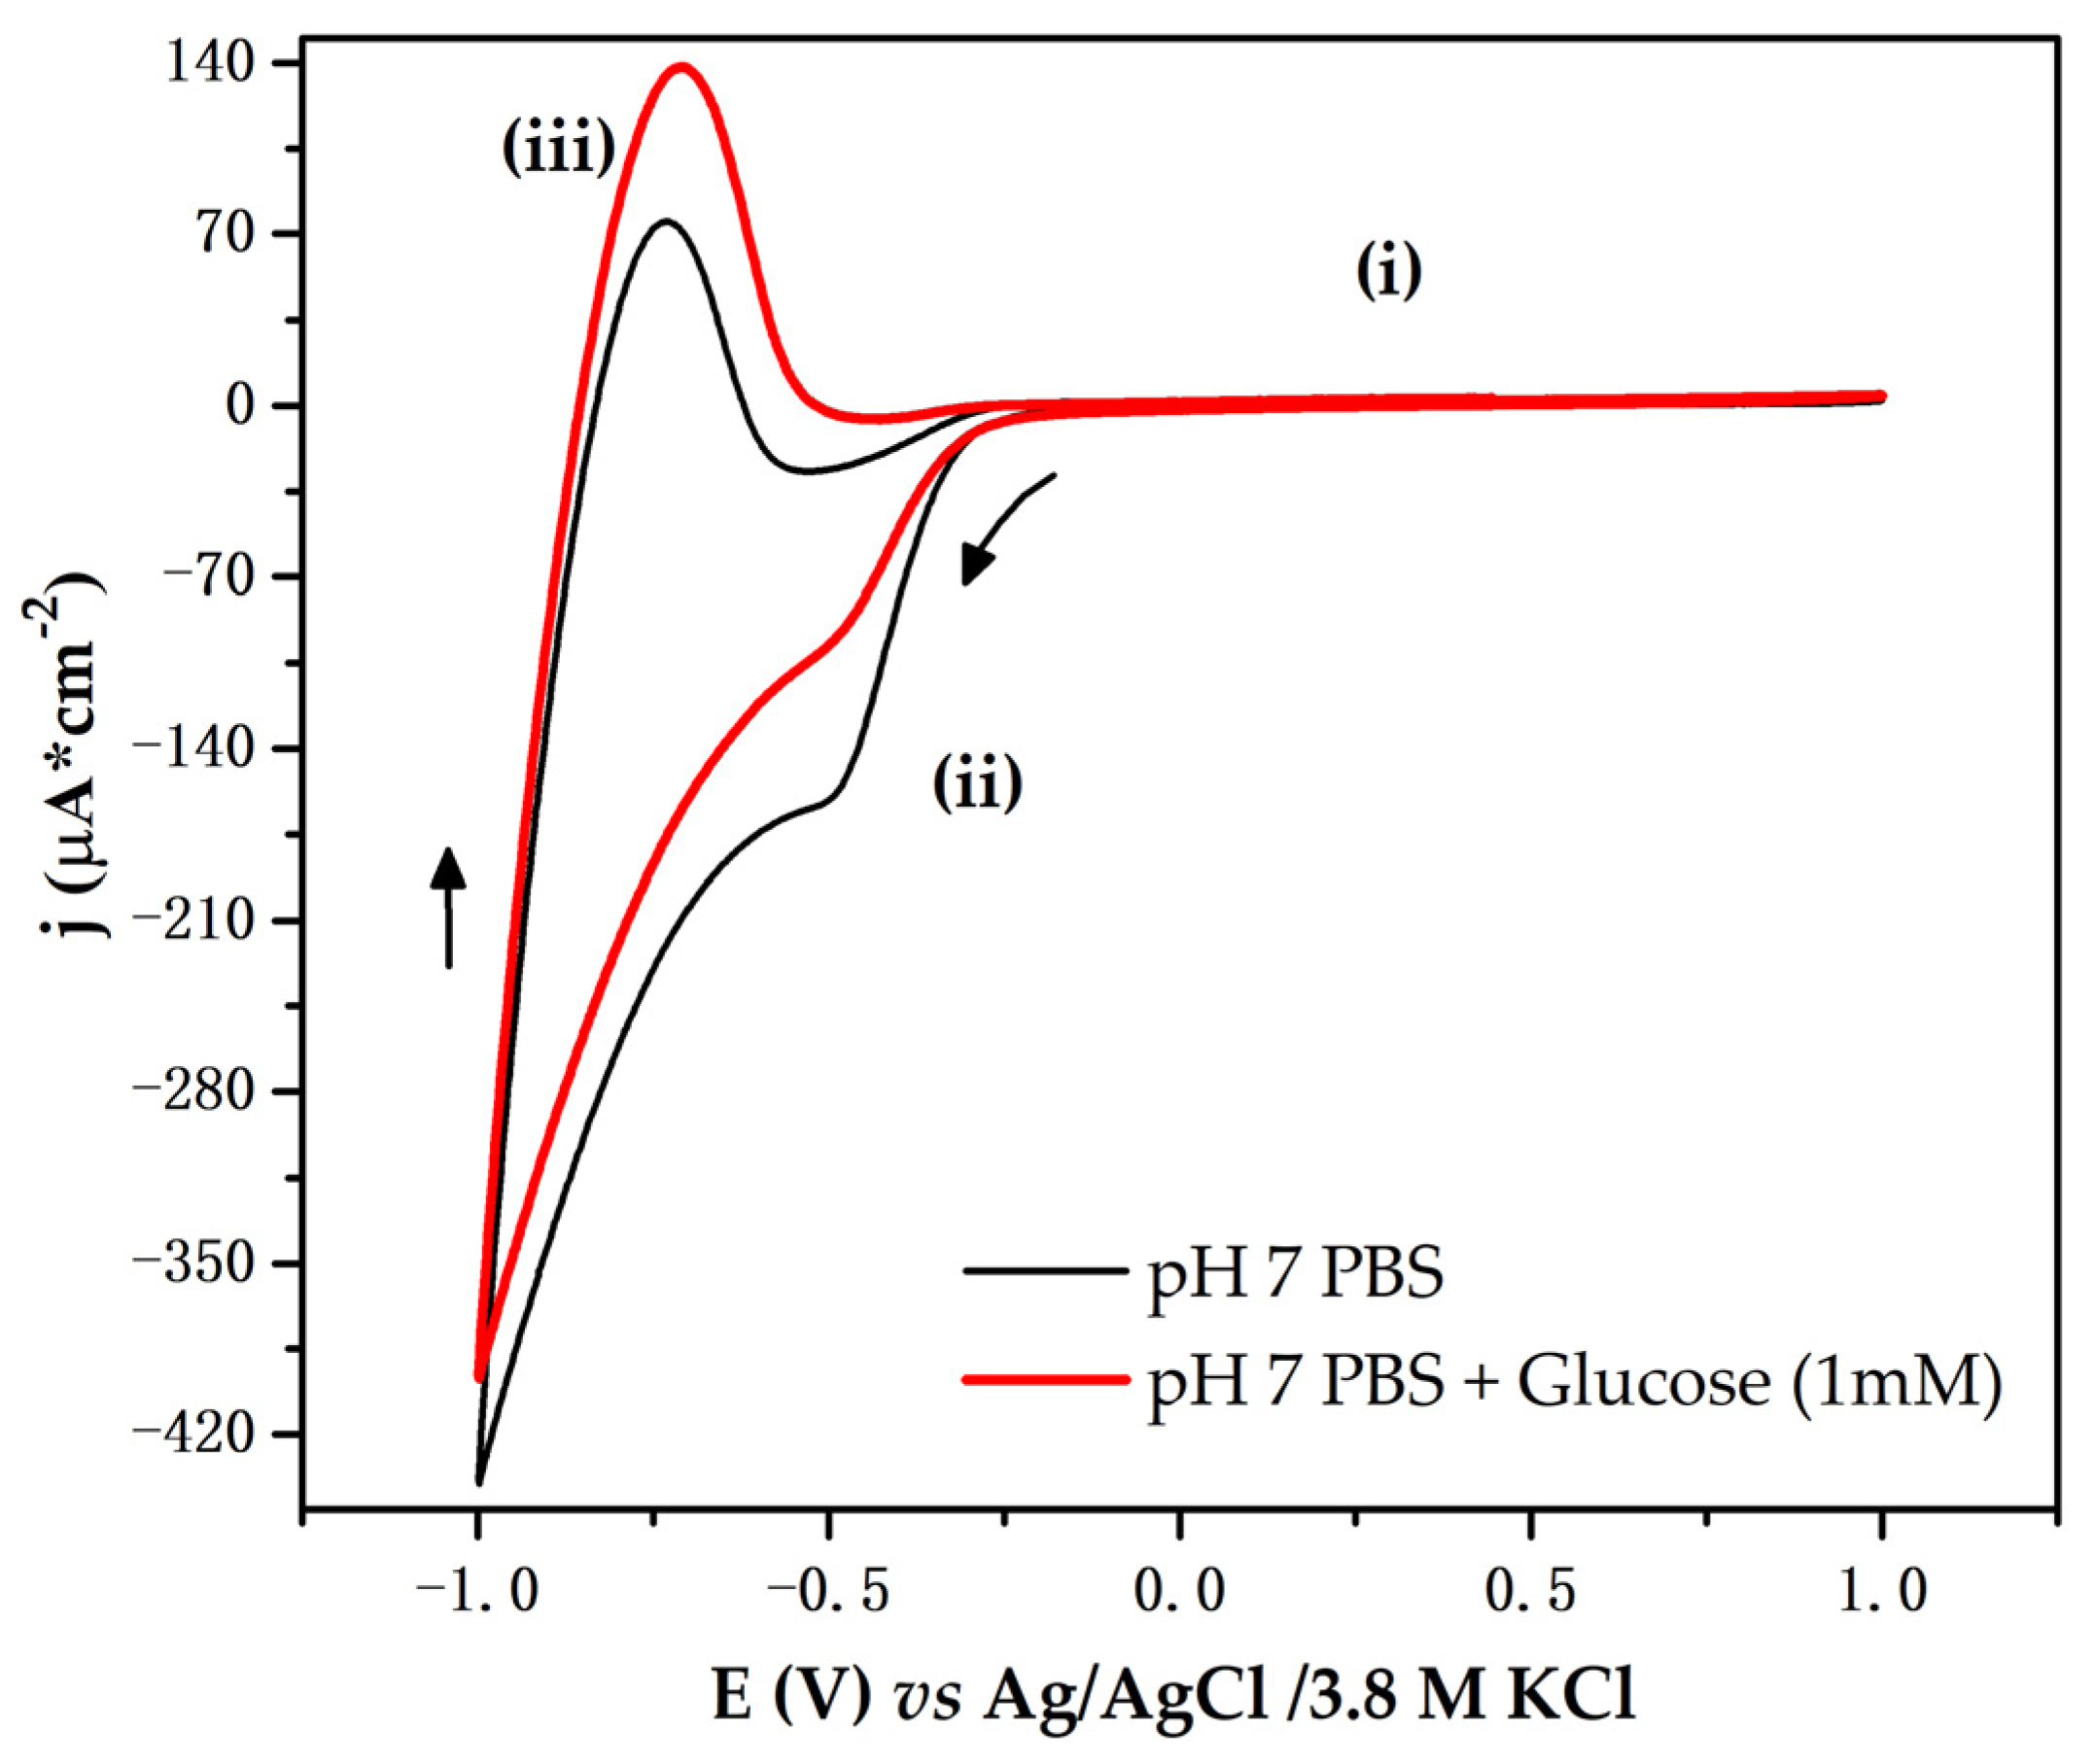
3.4.1. Cyclic Voltammetry (CV)
Scan Rate Effects
Influence of Solution pH
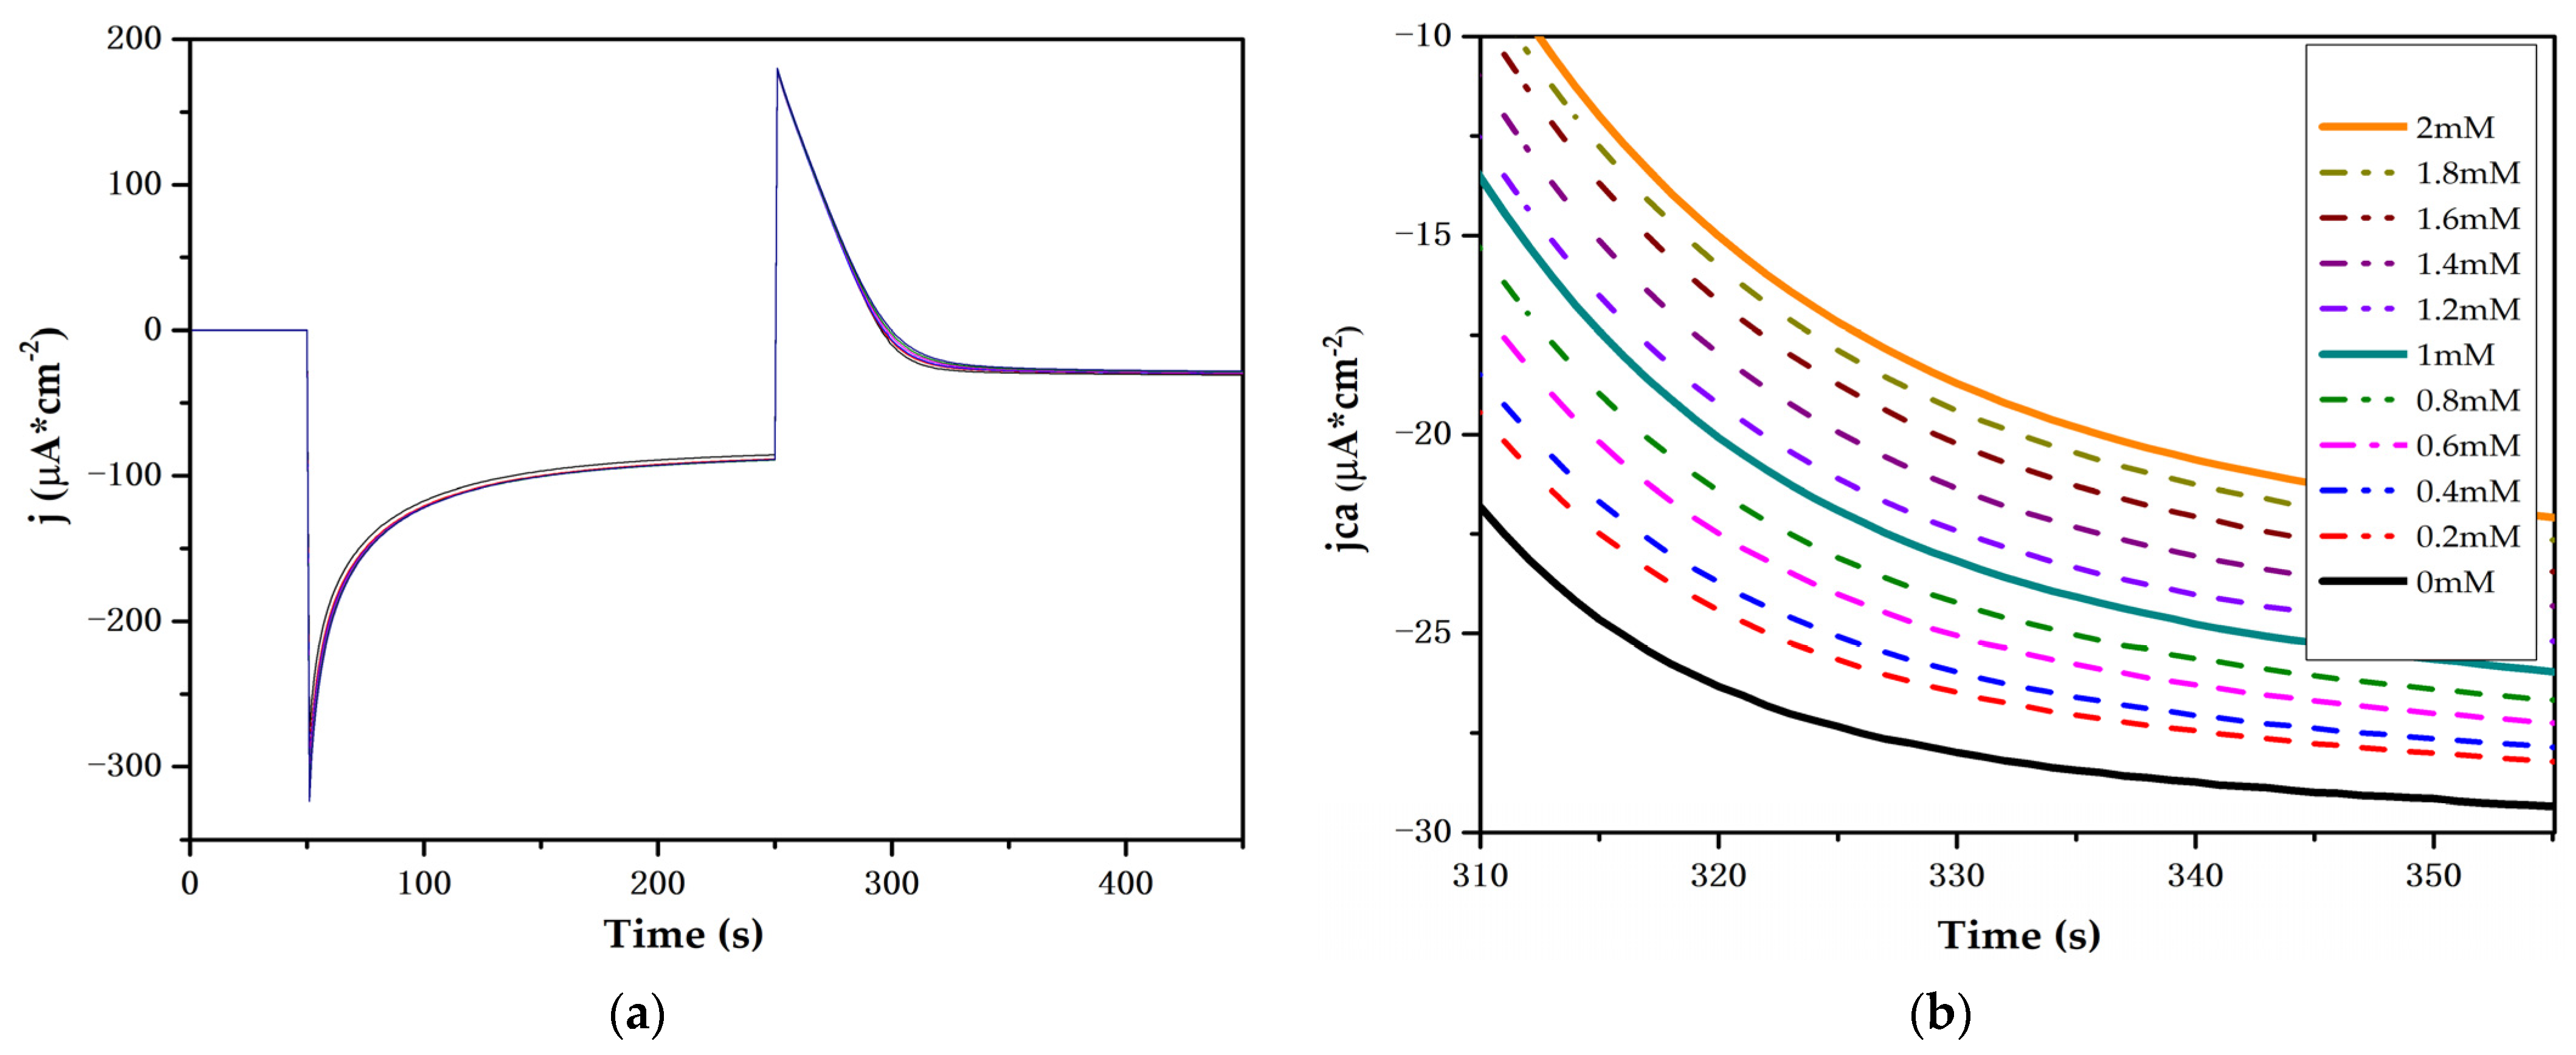
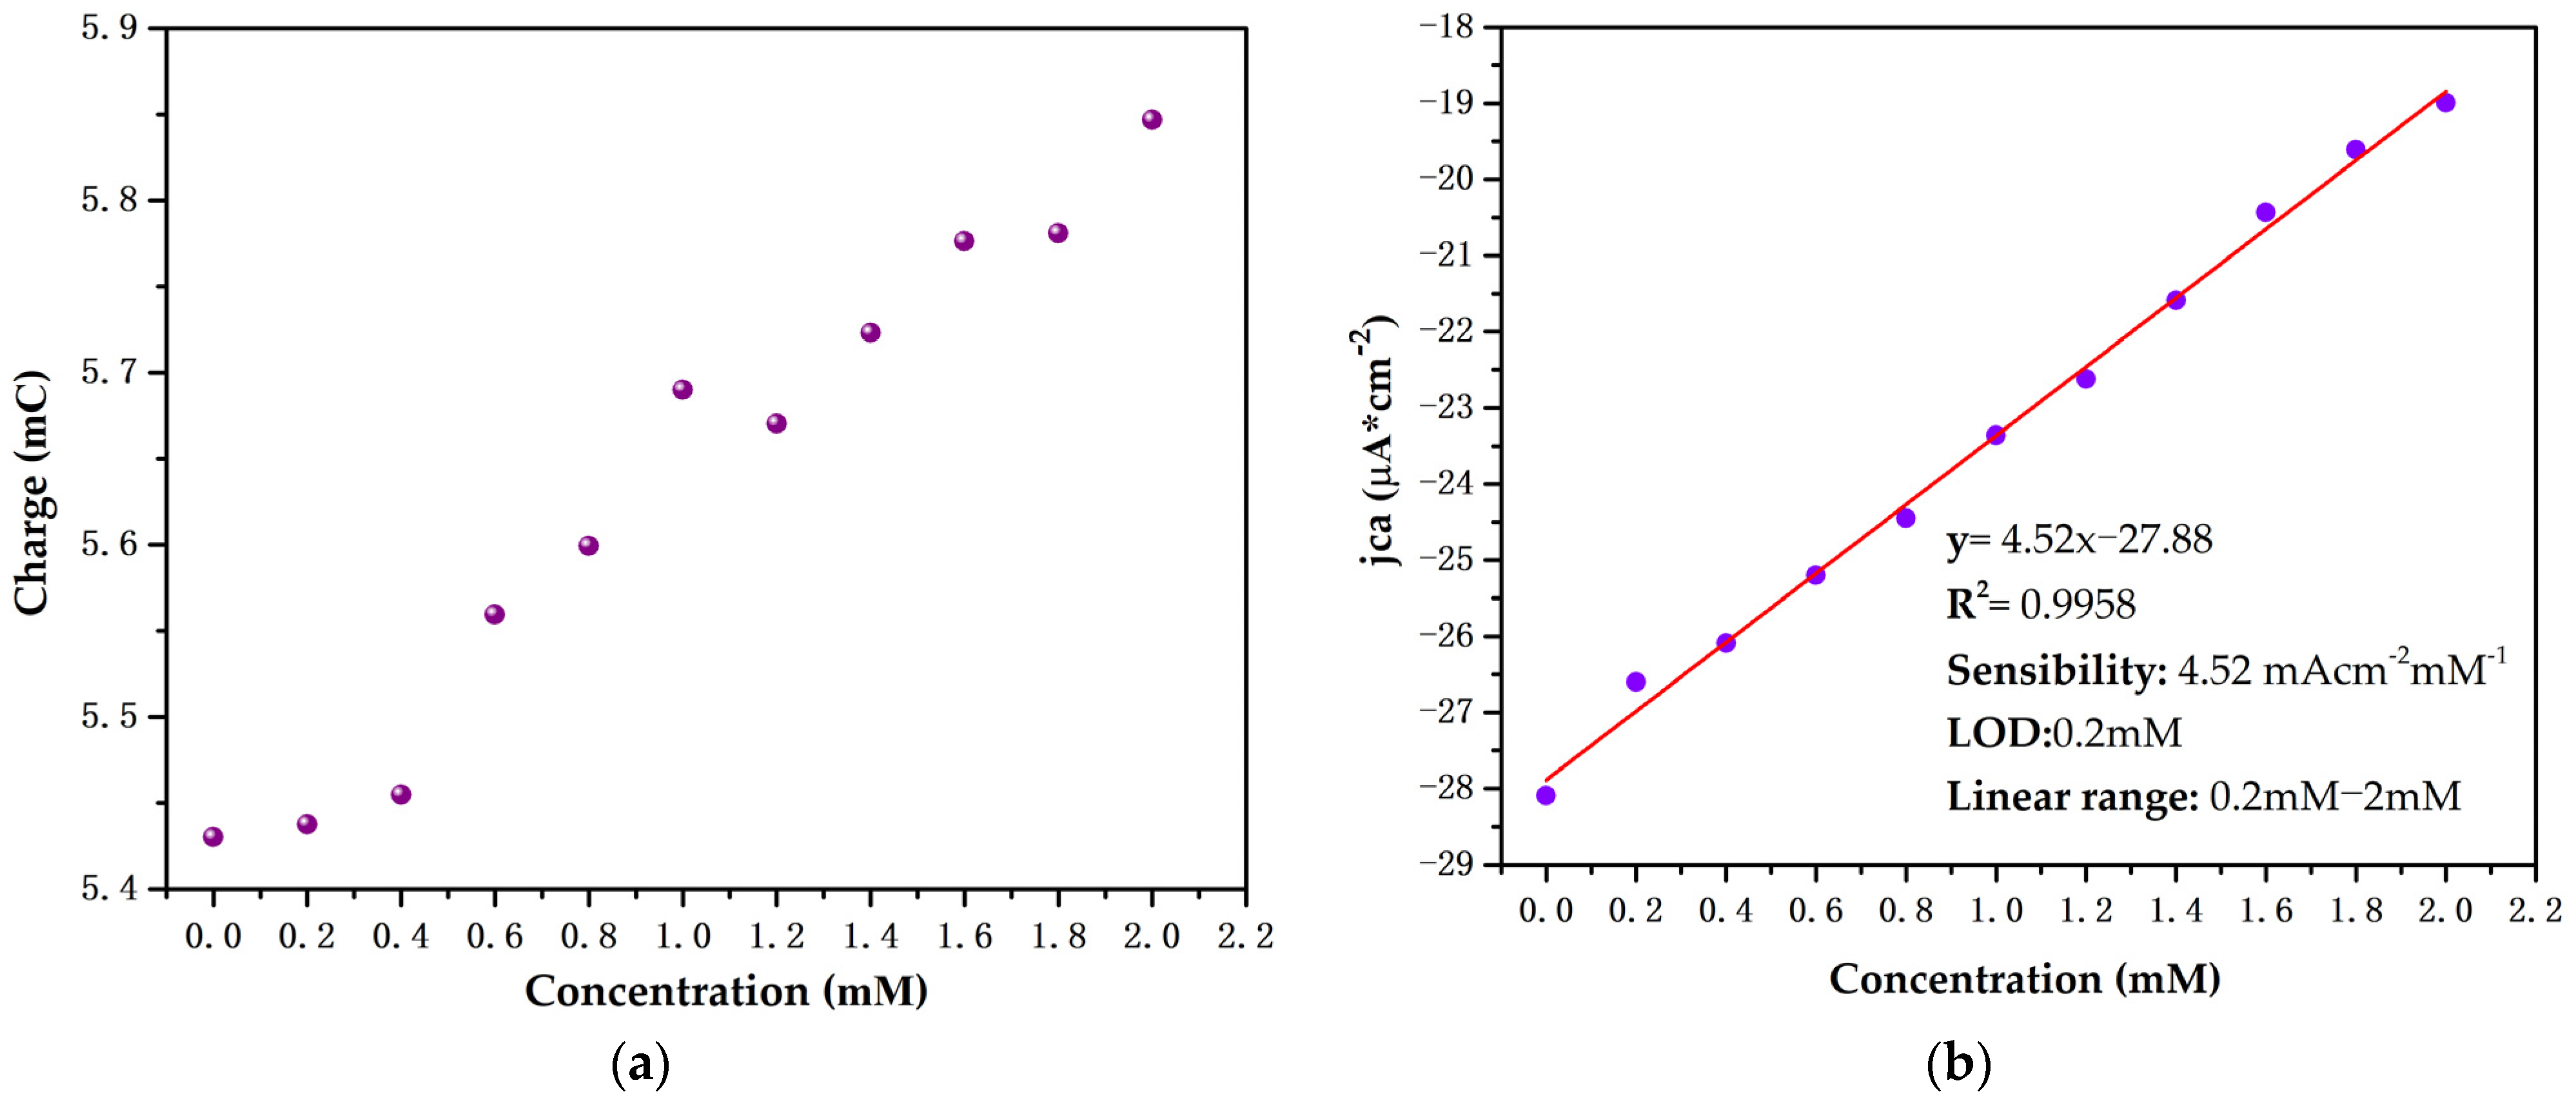
3.4.2. Chronoamperometry
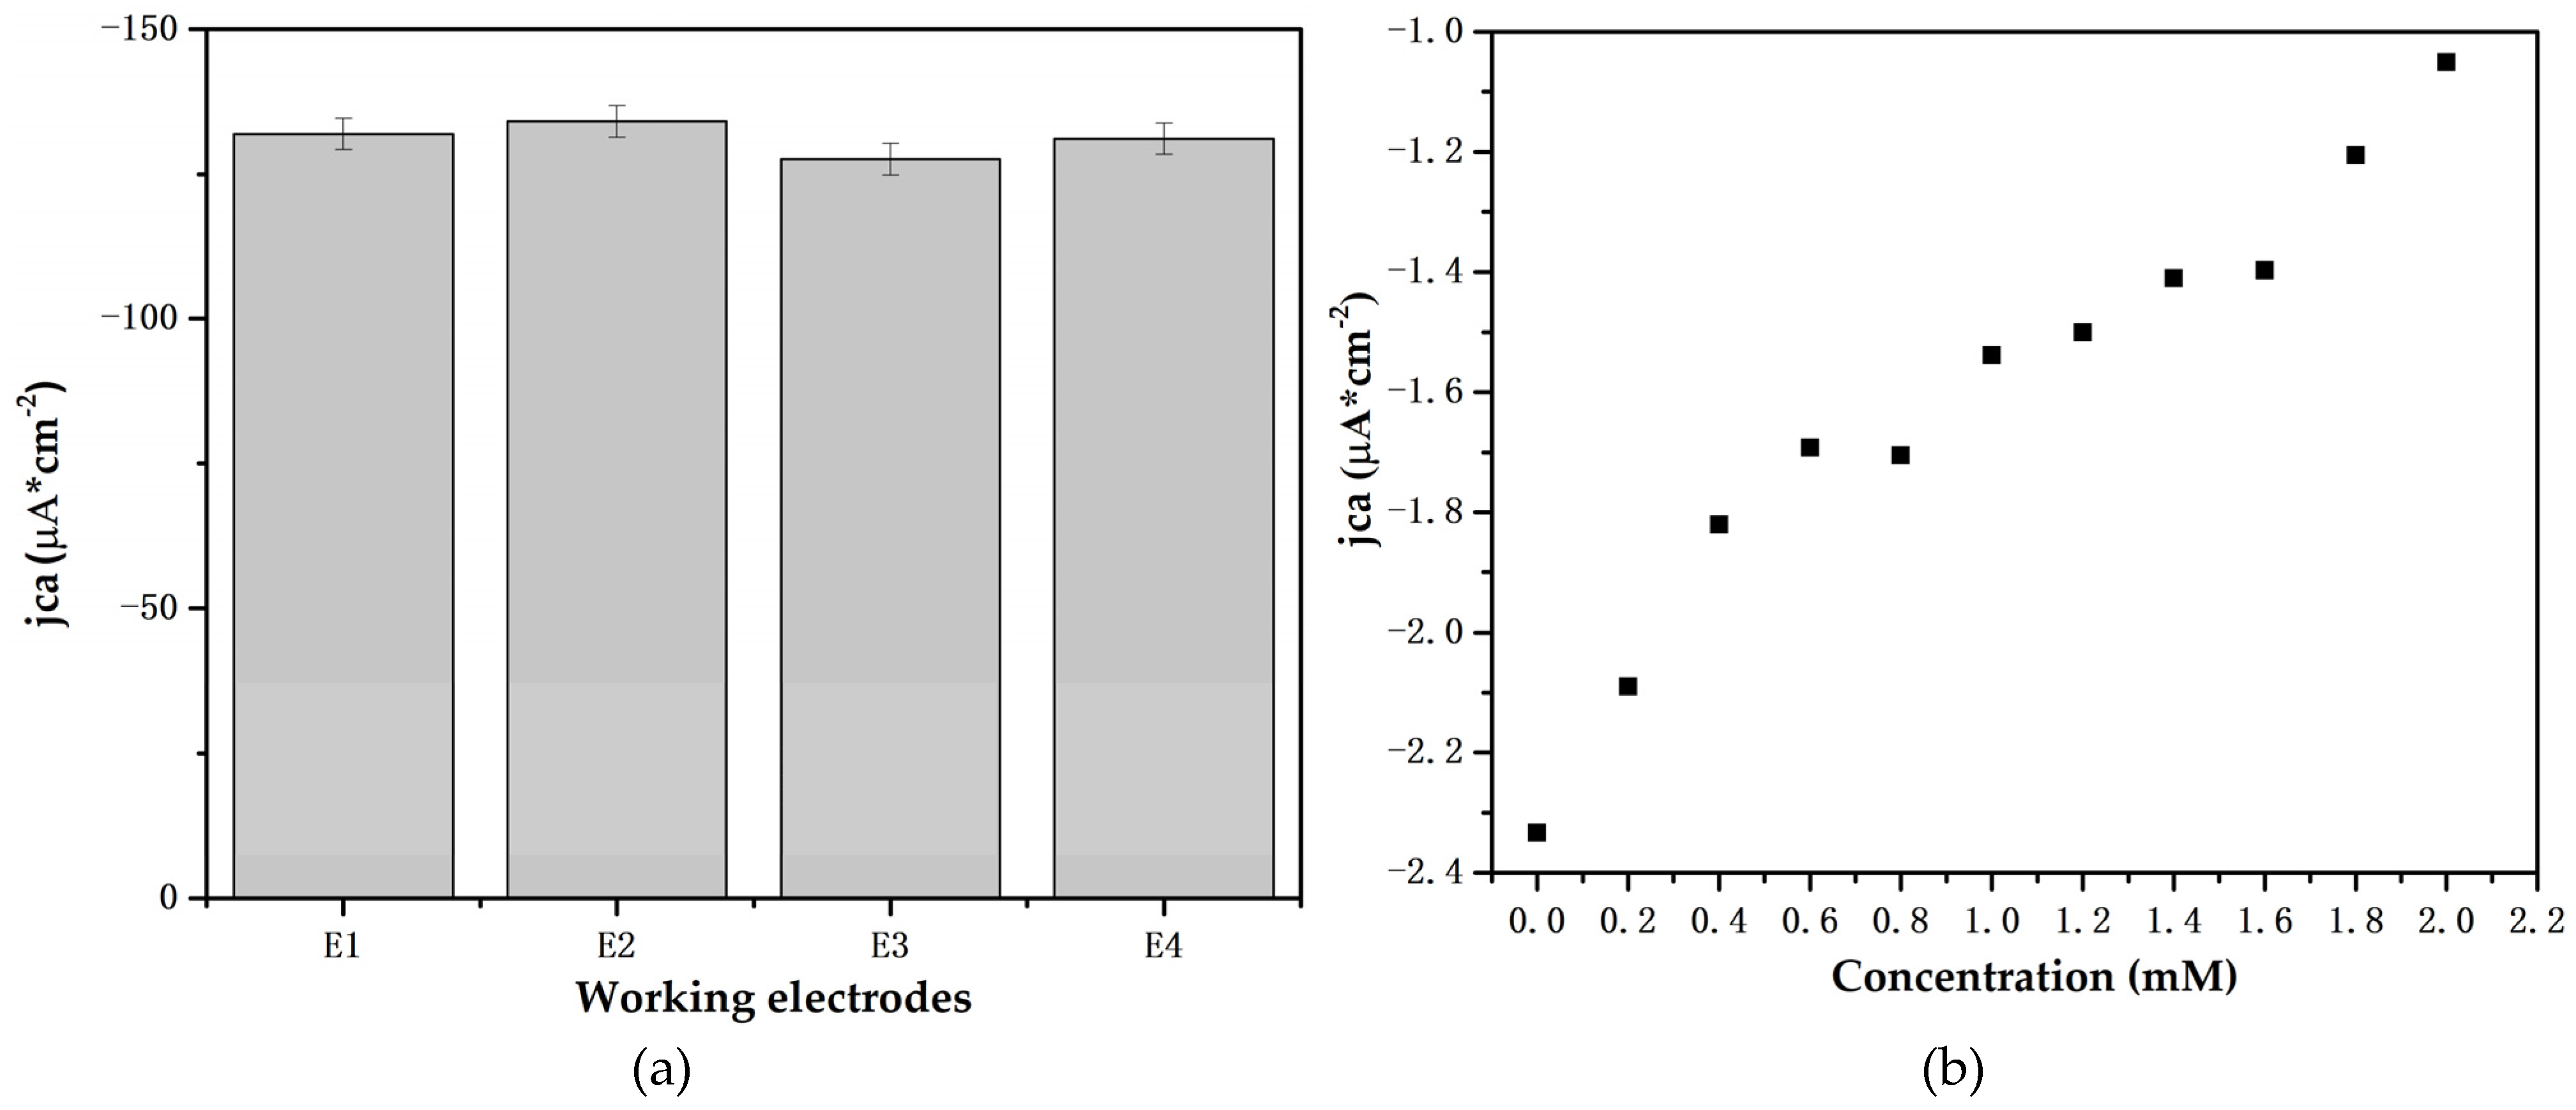
3.4.3. Reproducibility and Artificial Saliva Study
4. Conclusions
Author Contributions
Funding
Institutional Review Board Statement
Informed Consent Statement
Acknowledgments
Conflicts of Interest
References
- Association, A.D. Diagnosis and Classification of Diabetes Mellitus. Diabetes Care 2014, 37 (Suppl. S1), S81–S90. [Google Scholar] [CrossRef] [PubMed] [Green Version]
- Lam, D.W.; LeRoith, D. The worldwide diabetes epidemic. Curr. Opin. Endocrinol. Diabetes Obes. 2012, 19, 93–96. [Google Scholar] [CrossRef] [PubMed]
- Yoo, E.-H.; Lee, S.-Y. Glucose Biosensors: An Overview of Use in Clinical Practice. Sensors 2010, 10, 4558–4576. [Google Scholar] [CrossRef] [Green Version]
- Nathan, D.M. Long-Term Complications of Diabetes Mellitus. N. Engl. J. Med. 1993, 328, 1676–1685. [Google Scholar] [CrossRef]
- Zeller, H.; Novak, P.; Landgraf, R. Blood Glucose Measurement by Infrared Spectroscopy. Int. J. Artif. Organs 1989, 12, 129–135. [Google Scholar] [CrossRef] [PubMed]
- Shao, J.; Lin, M.; Li, Y.; Li, X.; Liu, J.; Liang, J.; Yao, H. In Vivo Blood Glucose Quantification Using Raman Spectroscopy. PLoS ONE 2012, 7, e48127. [Google Scholar] [CrossRef] [Green Version]
- Wahjudi, P.N.; Patterson, M.E.; Lim, S.; Yee, J.K.; Mao, C.S.; Lee, W.-N.P. Measurement of glucose and fructose in clinical samples using gas chromatography/mass spectrometry. Clin. Biochem. 2010, 43, 198–207. [Google Scholar] [CrossRef] [Green Version]
- The Top 10 Causes of Death. Available online: https://www.who.int/news-room/fact-sheets/detail/the-top-10-causes-of-death (accessed on 10 September 2022).
- Bruen, D.; Delaney, C.; Florea, L.; Diamond, D. Glucose Sensing for Diabetes Monitoring: Recent Developments. Sensors 2017, 17, 1866. [Google Scholar] [CrossRef] [Green Version]
- Wang, J. Electrochemical glucose biosensors. Chem. Rev. 2008, 108, 814–825. [Google Scholar] [CrossRef]
- Feldman, B. Electrochemical Glucose Sensors and Their Applications in Diabetes Management. Chem. Rev. 2008, 108, 2482–2505. [Google Scholar] [CrossRef]
- Radhakrishnan, S.; Lakshmy, S.; Santhosh, S.; Kalarikkal, N.; Chakraborty, B.; Rout, C.S. Recent Developments and Future Perspective on Electrochemical Glucose Sensors Based on 2D Materials. Biosensors 2022, 12, 467. [Google Scholar] [CrossRef] [PubMed]
- Wei, M.; Qiao, Y.; Zhao, H.; Liang, J.; Li, T.; Luo, Y.; Lu, S.; Shi, X.; Lu, W.; Sun, X. Electrochemical non-enzymatic glucose sensors: Recent progress and perspectives. Chem. Commun. 2020, 56, 14553–14569. [Google Scholar] [CrossRef] [PubMed]
- Mahapatra, D.R. Electrochemical nonenzymatic sensing of glucose using advanced nanomaterials. Mikrochim. Acta 2017, 185, 49. [Google Scholar] [CrossRef]
- Toghill, K.E.; Compton, R.G. Electrochemical non-enzymatic glucose sensors: A perspective and an evaluation. Int. J. Electrochem. Sci. 2010, 5, 1246–1301. [Google Scholar]
- Burke, L.D. Premonolayer oxidation and its role in electrocatalysis. Electrochimica Acta 1994, 39, 1841–1848. [Google Scholar] [CrossRef]
- Gupta, S.; Sandhu, S.V.; Bansal, H.; Sharma, D. Comparison of Salivary and Serum Glucose Levels in Diabetic Patients. J. Diabetes Sci. Technol. 2014, 9, 91–96. [Google Scholar] [CrossRef]
- Lee, H.; Song, C.; Hong, Y.S.; Kim, M.S.; Cho, H.R.; Kang, T.; Shin, K.; Choi, S.H.; Hyeon, T.; Kim, D.-H. Wearable/disposable sweat-based glucose monitoring device with multistage transdermal drug delivery module. Sci. Adv. 2017, 3, e1601314. [Google Scholar] [CrossRef] [Green Version]
- Chen, X.; Mao, S.S. Titanium dioxide nanomaterials: Synthesis, properties, modifications, and applications. Chem. Rev. 2007, 107, 2891–2959. [Google Scholar] [CrossRef]
- Byranvand, M.M.; Kharat, A.N.; Fatholahi, L.; Beiranvand, Z.M. A Review on Synthesis of Nano-TiO2 via Different Methods. J. Nanostruct. 2013, 3, 1–9. [Google Scholar] [CrossRef]
- Ochoa, Y.; Ortegón, Y.; Vargas, M.; Páez, J.E. Síntesis de tiO2, fase anatasa, por el método pechini. Supl. Rev. Latinoam. Metal. Y Mater. 2009, 1, 931–937. [Google Scholar]
- Kumar, A.; Nanda, D. Chapter 3—Methods and Fabrication Techniques of Superhydrophobic Surfaces, en Superhydrophobic Polymer Coatings. In Superhydrophobic Polymer Coatings; Samal, S.K., Mohanty, S., Nayak, S.K., Eds.; Elsevier: Amsterdam, The Netherlands, 2019; pp. 43–75. [Google Scholar] [CrossRef]
- Dimesso, L. Pechini Processes: An Alternate Approach of the Sol–Gel Method, Preparation, Properties, and Applications, en Handbook of Sol-Gel Science and Technology. In Handbook of Sol-Gel Science and Technology; Klein, L., Aparicio, M., Jitianu, A., Eds.; Springer International Publishing: Cham, Switzerland, 2016; pp. 1–22. [Google Scholar] [CrossRef]
- Hindawi. Study of the Effect of TiO2 Layer on the Adsorption and Photocatalytic Activity of TiO2-MoS2 Heterostructures under Visible-Infrared Light. Available online: https://www.hindawi.com/journals/ijp/2020/8740825/ (accessed on 10 September 2022).
- Abdullahi, S.; Güner, S.; Koseoglu, Y.; Musa, I.; Adamu, B.; Abdulhamid, M.I. Simple Method For The Determination of Band Gap of a Nanopowdered Sample Using Kubelka Munk Theory. J. Niger. Assoc. Math. Phys. 2016, 35, 241–246. [Google Scholar]
- Lyon, L.A.; Hupp, J.T. Energetics of Semiconductor Electrode/Solution Interfaces: EQCM Evidence for Charge-Compensating Cation Adsorption and Intercalation during Accumulation Layer Formation in the Titanium Dioxide/Acetonitrile System. J. Phys. Chem. 1995, 99, 15718–15720. [Google Scholar] [CrossRef]
- Jankulovska, M.; Berger, T.; Wong, S.S.; Gómez, R.; Lana-Villarreal, T. Trap States in TiO2 Films Made of Nanowires, Nanotubes or Nanoparticles: An Electrochemical Study. ChemPhysChem 2012, 13, 3008–3017. [Google Scholar] [CrossRef] [PubMed]
- Boschloo, G.; Fitzmaurice, D. Electron Accumulation in Nanostructured TiO2 (Anatase) Electrodes. J. Phys. Chem. B 1999, 103, 7860–7868. [Google Scholar] [CrossRef]
- Thomas, A.G.; Syres, K.L. Adsorption of organic molecules on rutile TiO2 and anatase TiO2 single crystal surfaces. Chem. Soc. Rev. 2012, 41, 4207–4217. [Google Scholar] [CrossRef]
- Khodari, M.; Mersal, G.A.M.; Rabie, E.M.; Assaf, H.F. Electrochemical Sensor based on Carbon Paste Electrode Modified by TiO2 nano-particles for the Voltammetric Determination of Resorcinol. Int. J. Electrochem. Sci. 2018, 13, 3460–3474. [Google Scholar] [CrossRef]
- Minella, M.; Maurino, V.; Minero, C.; Pelizzetti, E. Thin film nanocrystalline TiO2 electrodes: Dependence of flat band potential on pH and anion adsorption. J. Nanosci. Nanotechnol. 2015, 15, 3348–3358. [Google Scholar] [CrossRef]
- Lin, C.; Pratt, B.; Honikel, M.; Jenish, A.; Ramesh, B.; Alkhan, A.; La Belle, J.T. Toward the Development of a Glucose Dehydrogenase-Based Saliva Glucose Sensor without the Need for Sample Preparation. J. Diabetes Sci. Technol. 2017, 12, 83–89. [Google Scholar] [CrossRef]


Publisher’s Note: MDPI stays neutral with regard to jurisdictional claims in published maps and institutional affiliations. |
© 2022 by the authors. Licensee MDPI, Basel, Switzerland. This article is an open access article distributed under the terms and conditions of the Creative Commons Attribution (CC BY) license (https://creativecommons.org/licenses/by/4.0/).
Share and Cite
Silva-Galindo, G.; Zapata-Torres, M. Synthesis and Characterization of TiO2 Thick Films for Glucose Sensing. Biosensors 2022, 12, 973. https://doi.org/10.3390/bios12110973
Silva-Galindo G, Zapata-Torres M. Synthesis and Characterization of TiO2 Thick Films for Glucose Sensing. Biosensors. 2022; 12(11):973. https://doi.org/10.3390/bios12110973
Chicago/Turabian StyleSilva-Galindo, G., and M. Zapata-Torres. 2022. "Synthesis and Characterization of TiO2 Thick Films for Glucose Sensing" Biosensors 12, no. 11: 973. https://doi.org/10.3390/bios12110973