
Combining IVUS + OCT Data, Biomechanical Models and Machine Learning Method for Accurate Coronary Plaque Morphology Quantification and Cap Thickness and Stress/Strain Index Predictions

 ,
,
Abstract
:1. Introduction
2. Materials and Methods
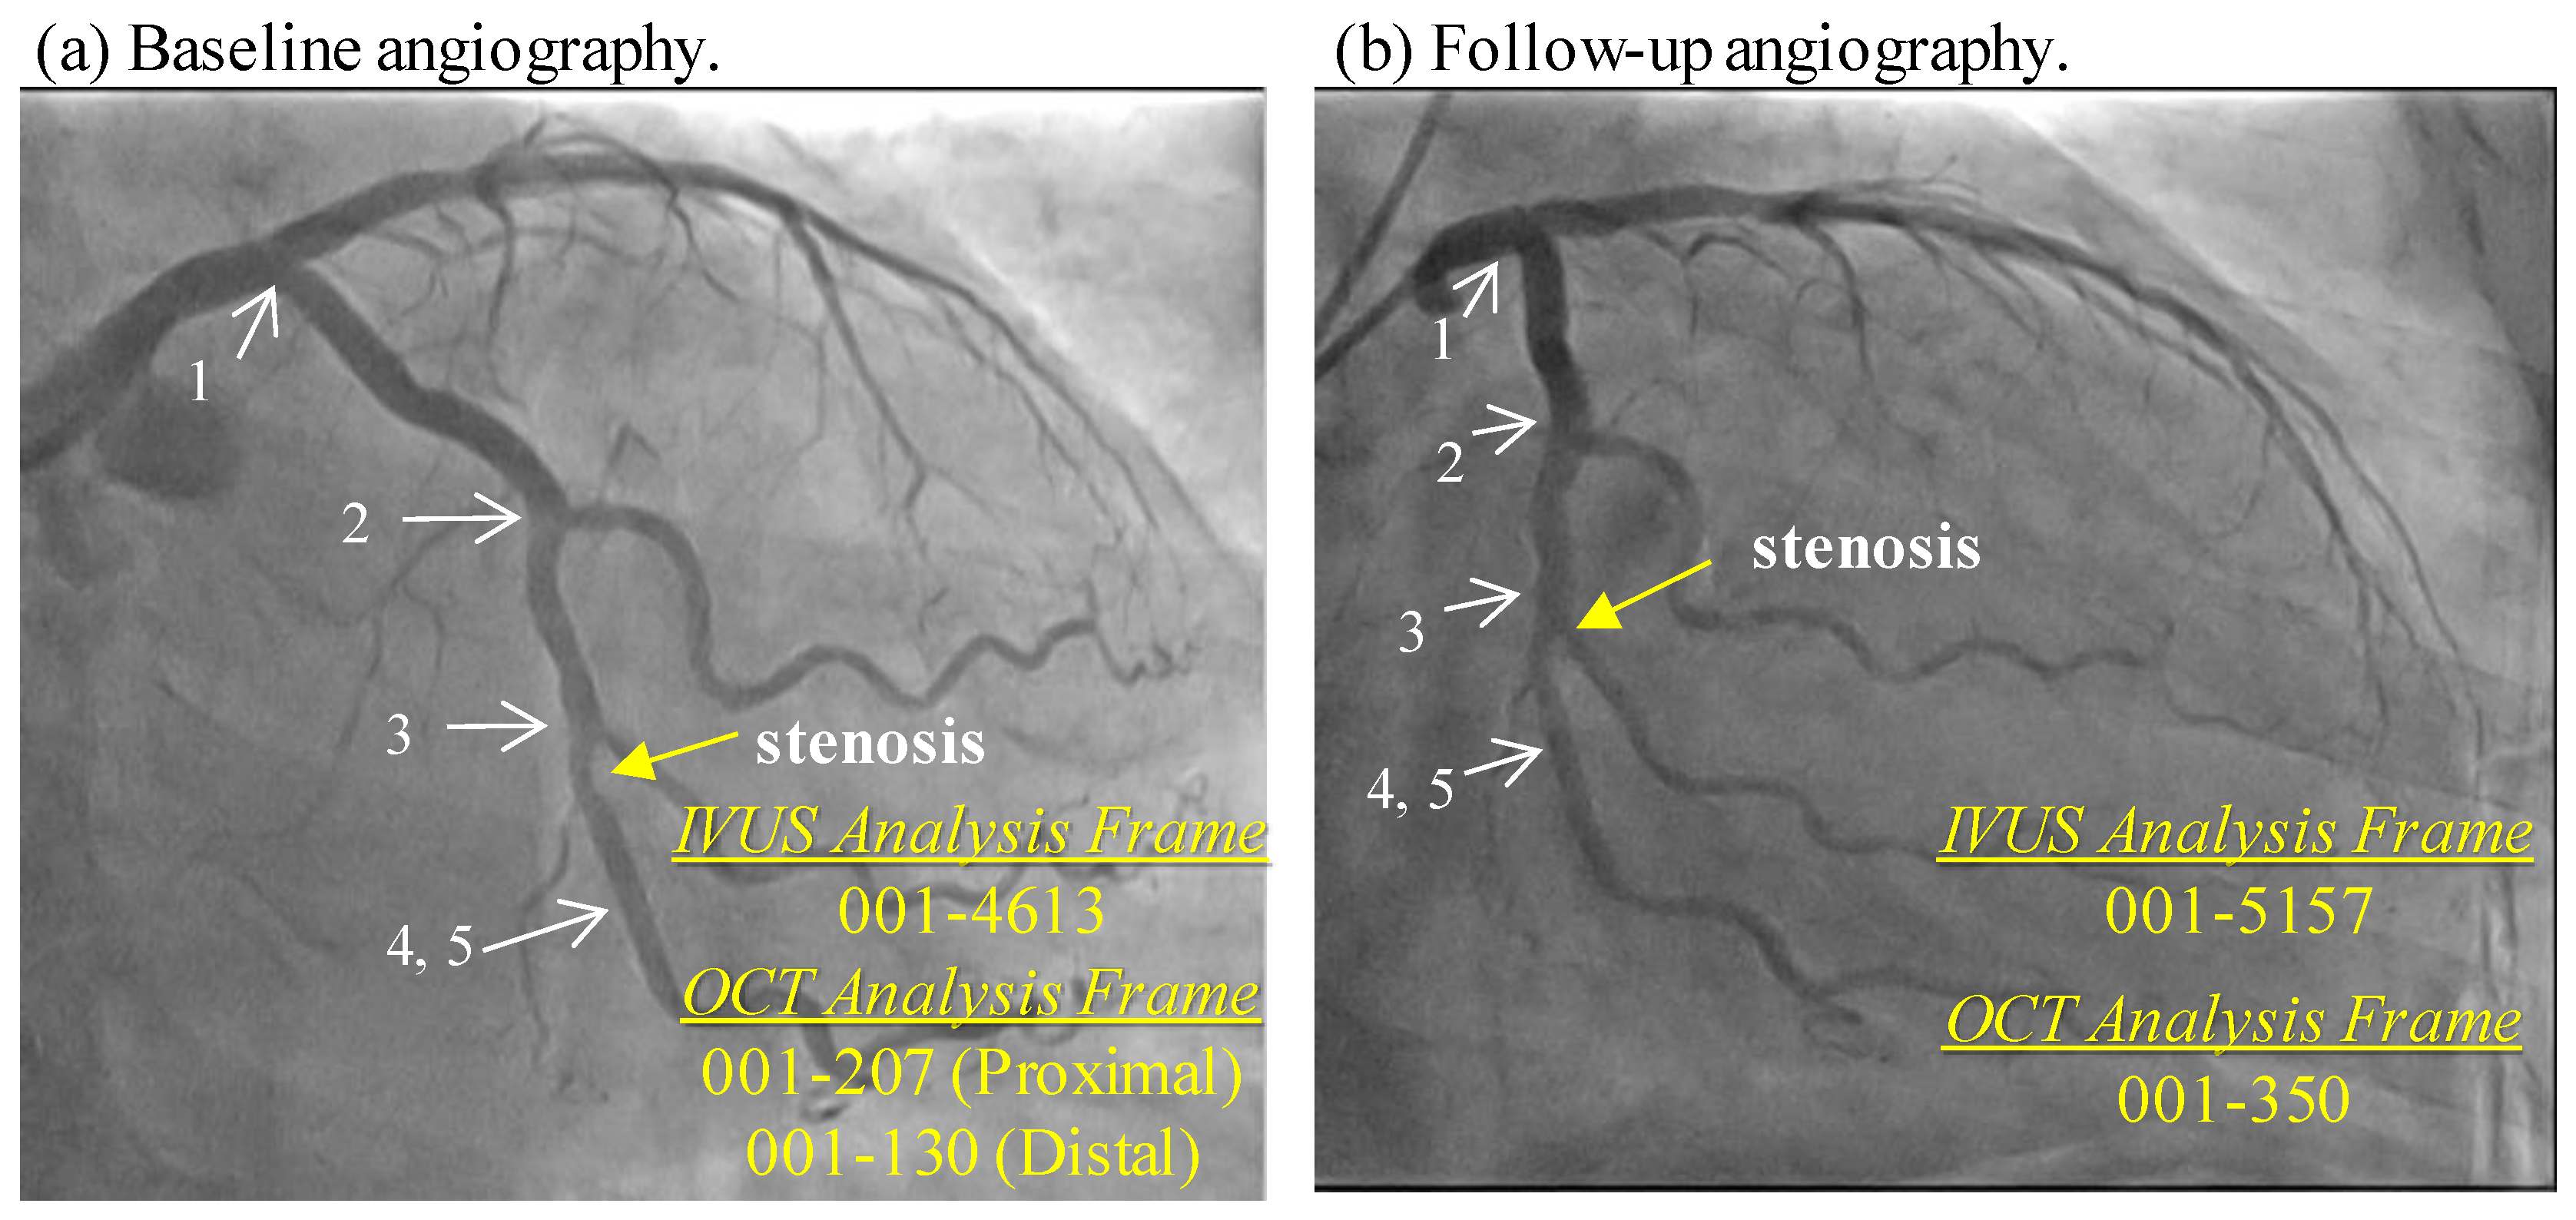
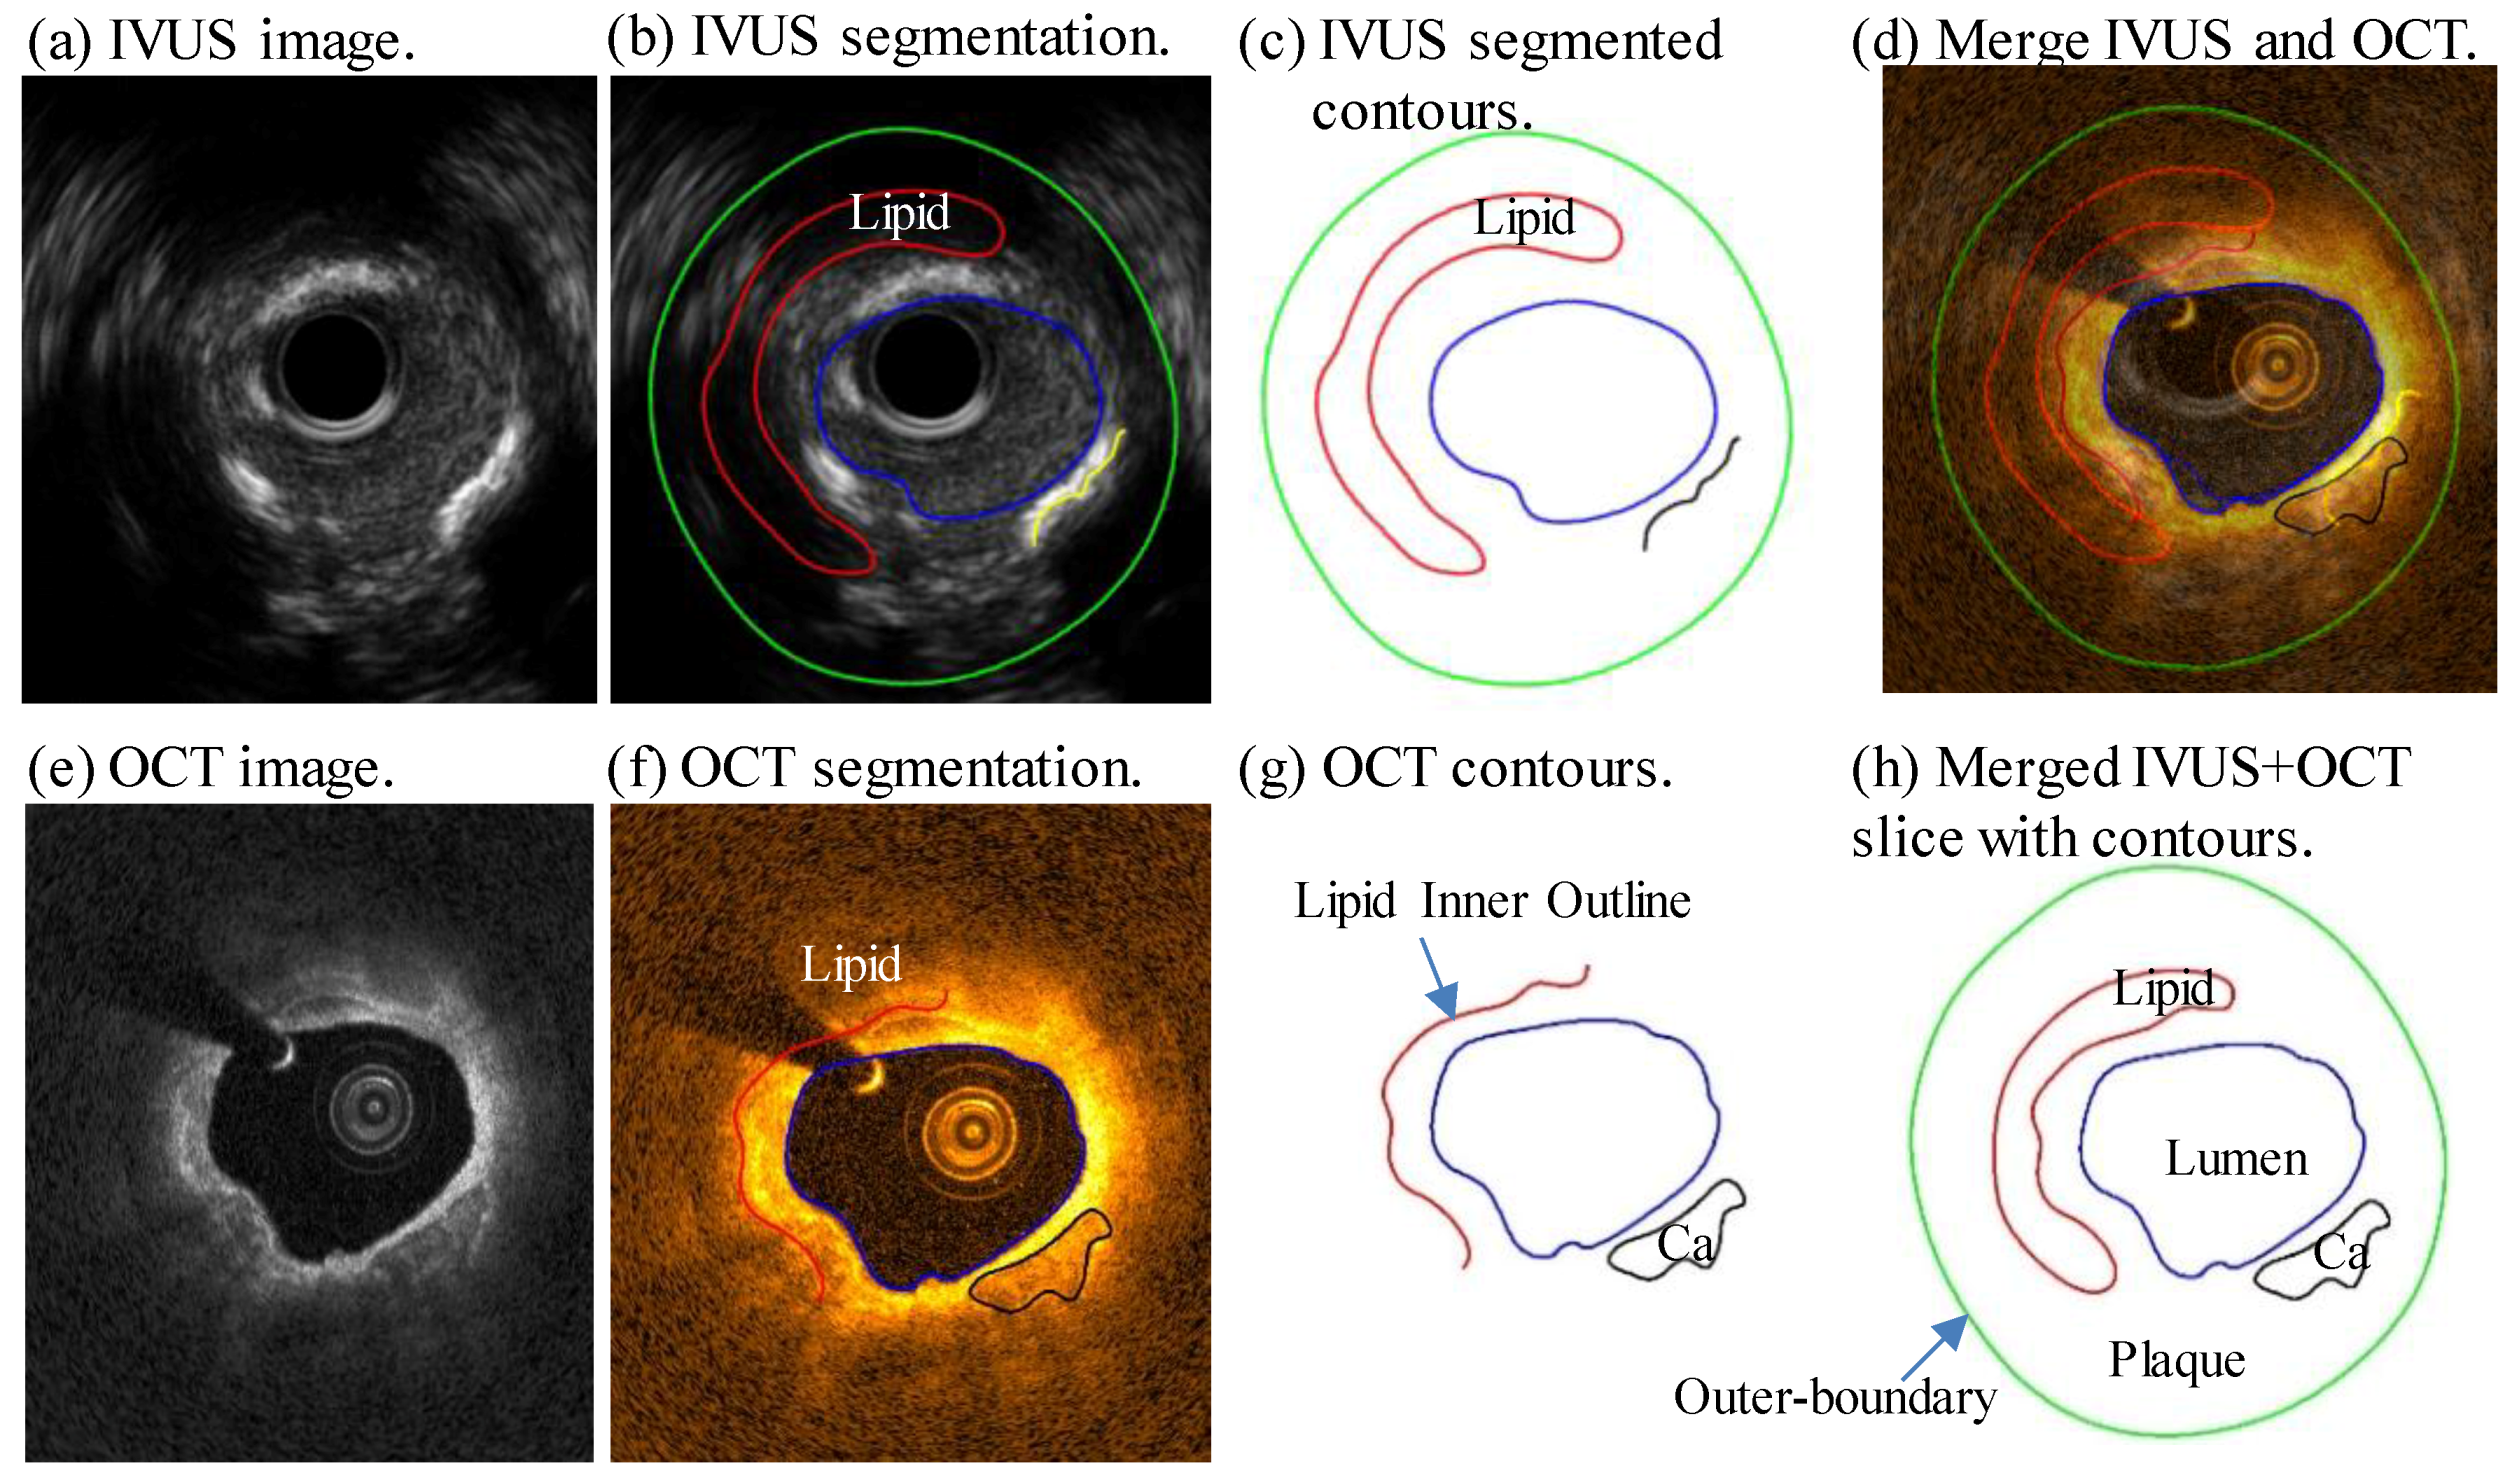
2.1. Data Acquisition, Segmentation, Slice Co-Registration and Merging
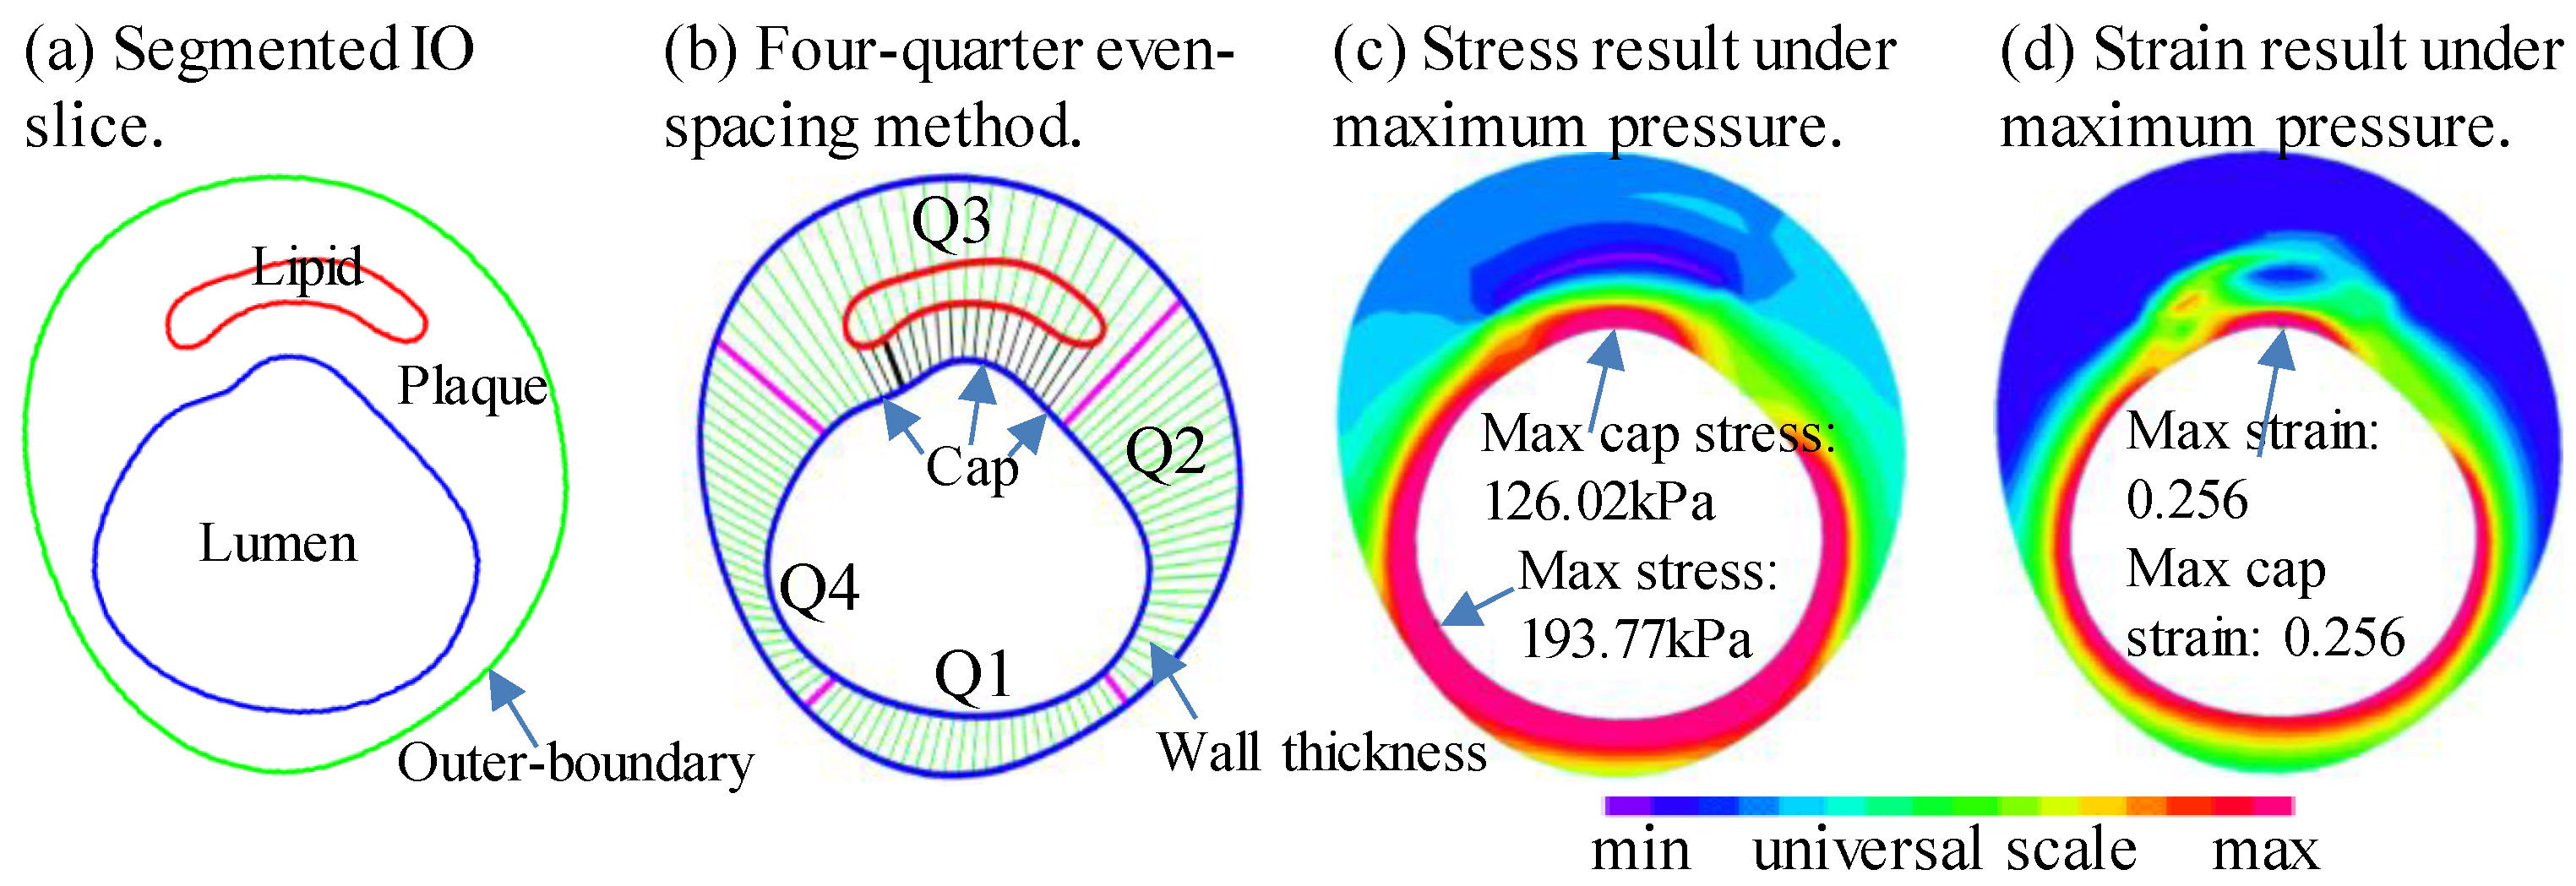
2.2. Thin-Slice Models, Morphological and Biomechanical Predictors, Data Extraction for Analysis
2.3. Plaque Vulnerability Indices
2.3.1. Cap Thickness Plaque Vulnerability Index (C-PVI)
2.3.2. Stress Plaque Vulnerability Index (S-PVI)
2.3.3. Strain Plaque Vulnerability Index (Sn-PVI)
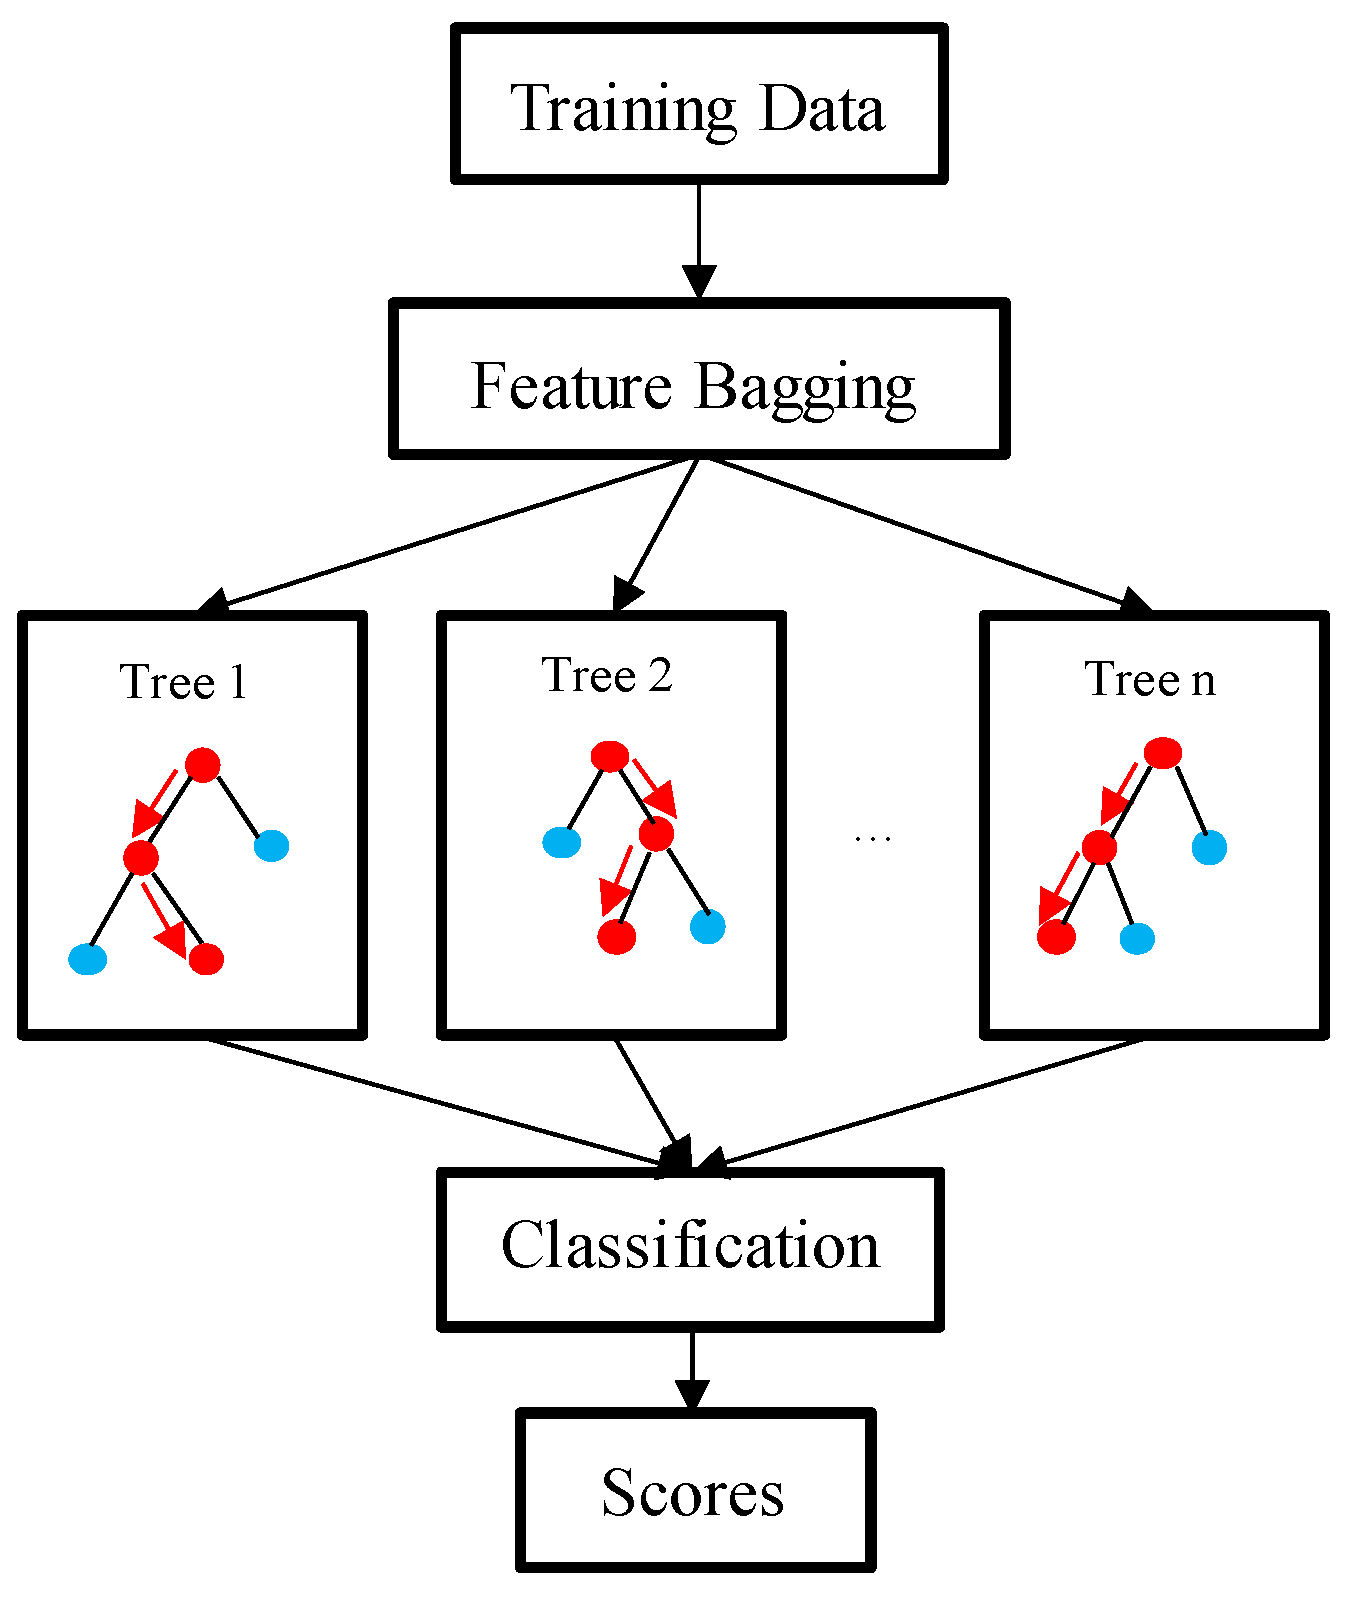
2.3.4. Prediction Methods and Plaque Vulnerability Predictions
3. Results
3.1. Prediction Results for the 5 PVIs Using Combination Predictors
3.2. Prediction Results for the 5 PVIs Using Single Predictors
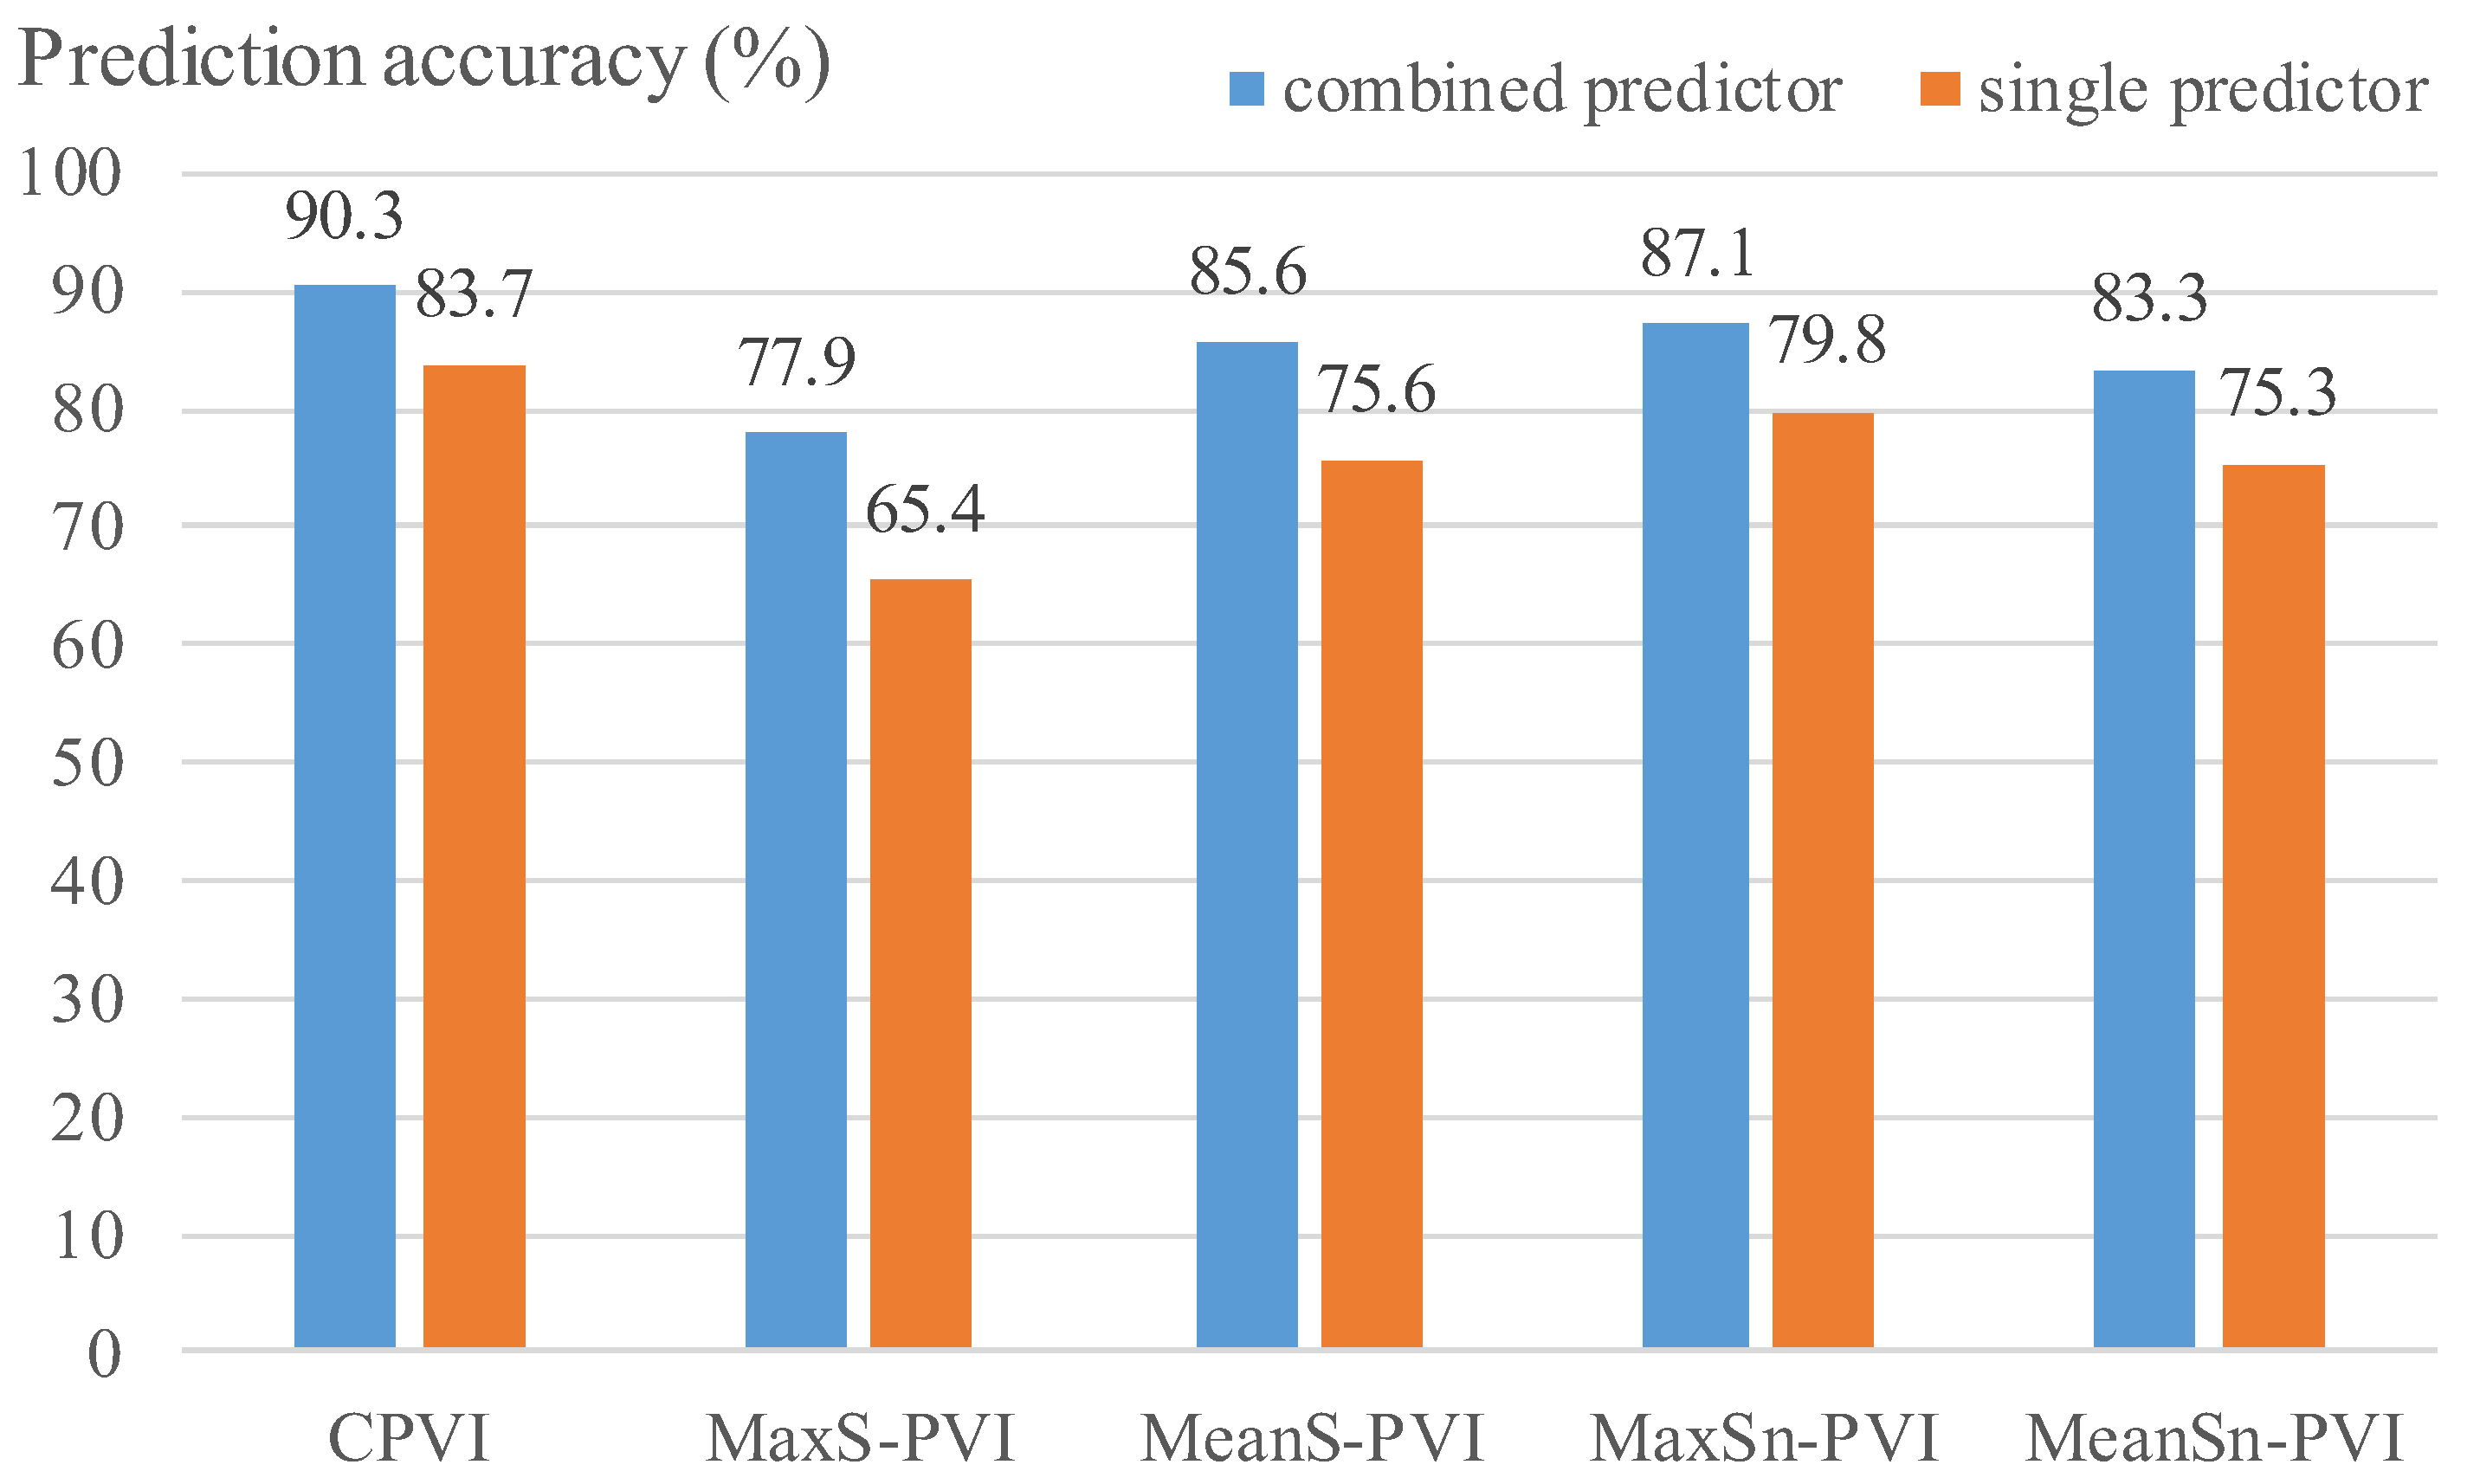
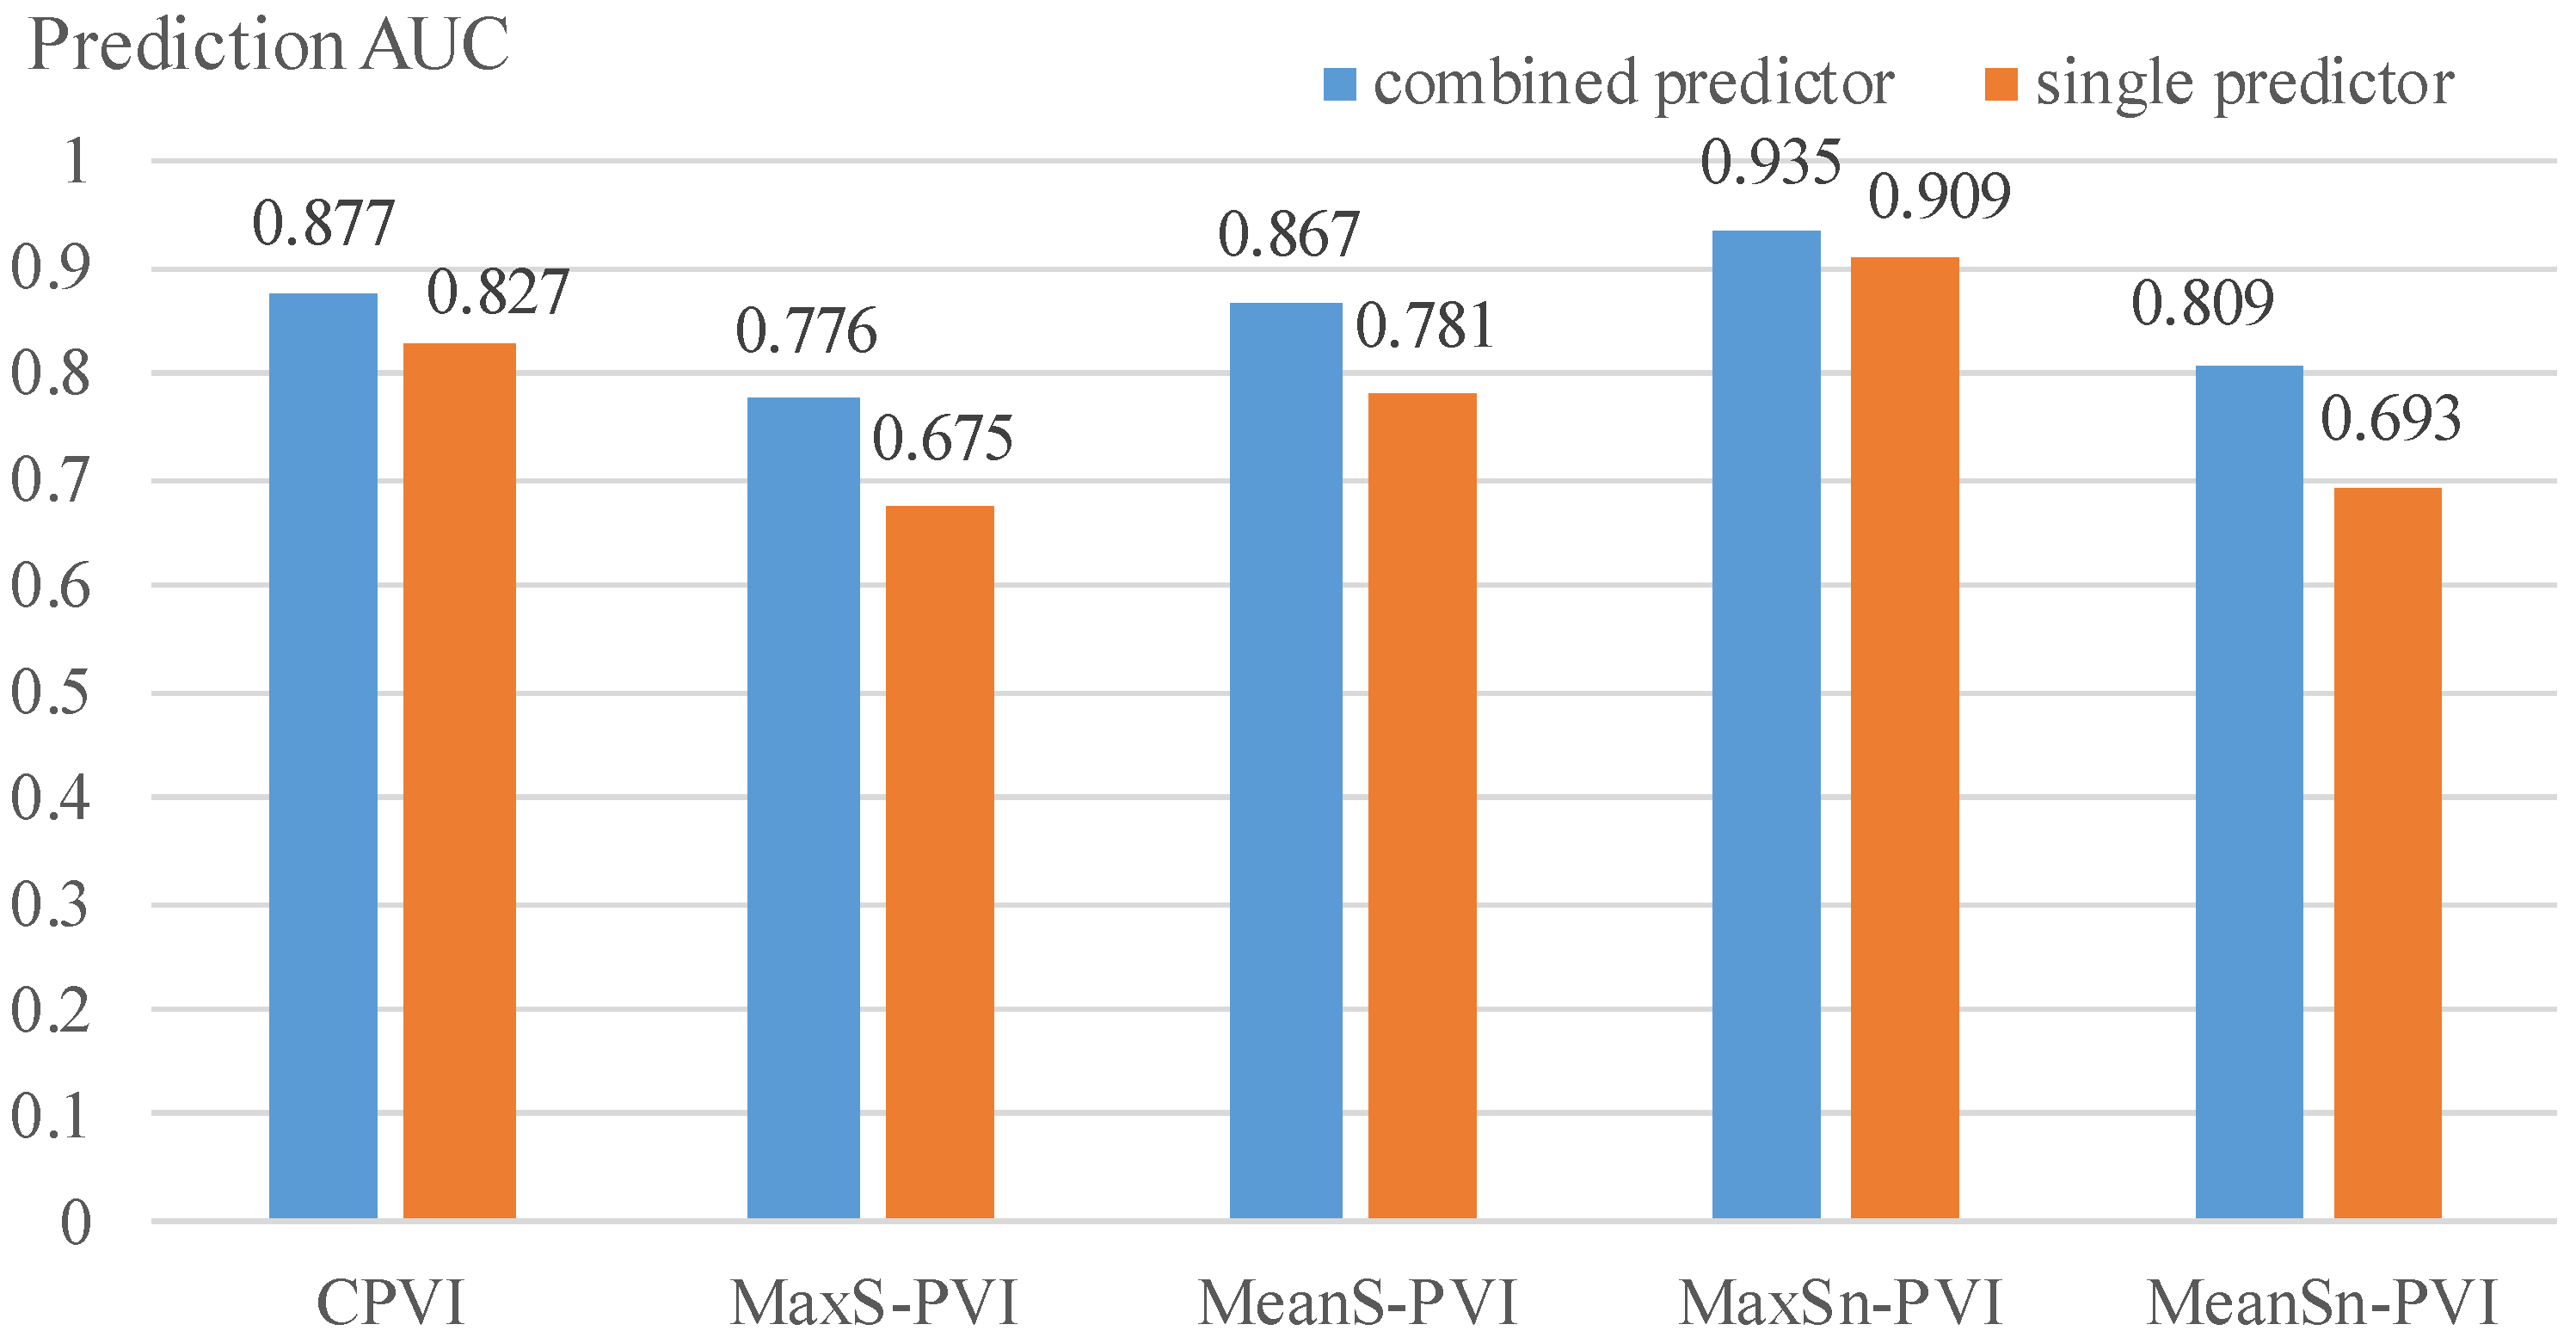
3.3. Combination Predictors Had Better Prediction Accuracies Than Those from Single Predictors
4. Discussion
4.1. Introducing Quantitative Plaque Vulnerability Indices for Vulnerability Predictions
4.2. Predicting PVI Changes Based on Accurate and Reliable OCT-Based Data
4.3. Combining Mechanical and Morphological Predictors May Lead to Better Predictions
4.4. Labor Cost and Potential Implementations
4.5. Limitations
5. Conclusions
Author Contributions
Funding
Institutional Review Board Statement
Informed Consent Statement
Data Availability Statement
Conflicts of Interest
References
- Gupta, R.; Wood, D. Primary prevention of ischaemic heart disease: Populations, individuals, and health professionals. Lancet 2019, 394, 685–696. [Google Scholar] [CrossRef] [PubMed]
- Stary, H.C.; Chandler, A.B.; Dinsmore, R.E.; Fuster, V.; Glagov, S.; Insull, W., Jr.; Rosenfeld, M.E.; Schwartz, C.J.; Wagner, W.D.; Wissler, R.W. A Definition of Advanced Types of Atherosclerotic Lesions and a Histological Classification of Atherosclerosis. Circulation 1995, 92, 1355–1374. [Google Scholar] [CrossRef]
- Virmani, R.; Kolodgie, F.D.; Burke, A.P.; Farb, A.; Schwartz, S.M. Schwartz. Lessons From Sudden Coronary Death A Comprehensive Morphological Classification Scheme for Atherosclerotic Lesions. Arterioscler. Thromb. Vasc. Biol. 2000, 20, 1262–1275. [Google Scholar] [CrossRef] [PubMed] [Green Version]
- Tang, D.; Yang, C.; Zheng, J.; Woodard, P.K.; Saffitz, J.E.; Petruccelli, J.D.; Sicard, G.A.; Yuan, C. Local Maximal Stress Hypothesis and Computational Plaque Vulnerability Index for Atherosclerotic Plaque Assessment. Ann. Biomed. Eng. 2005, 33, 1789–1801. [Google Scholar] [CrossRef]
- Goncalves, I.; Sun, J.; Tengryd, C.; Nitulescu, M.; Persson, A.F.; Nilsson, J.; Edsfeldt, A. Plaque Vulnerability Index Predicts Cardiovascular Events: A Histological Study of an Endarterectomy Cohort. J. Am. Heart Assoc. 2021, 10, e021038. [Google Scholar] [CrossRef] [PubMed]
- Wang, L.; Zheng, J.; Maehara, A.; Yang, C.; Billiar, K.L.; Wu, Z.; Bach, R.; Muccigrosso, D.; Mintz, G.S.; Tang, D. Morphological and Stress Vulnerability Indices for Human Coronary Plaques and Their Correlations with Cap Thickness and Lipid Percent: An IVUS-Based Fluid-Structure Interaction Multi-patient Study. PLoS Comput. Biol. 2015, 11, e1004652. [Google Scholar] [CrossRef] [PubMed] [Green Version]
- Yang, C.; Canton, G.; Yuan, C.; Ferguson, M.; Hatsukami, T.S.; Tang, D. Advanced human carotid plaque progression correlates positively with flow shear stress using follow-up scan data: An in vivo MRI multi-patient 3D FSI study. J. Biomech. 2010, 43, 2530–2538. [Google Scholar] [CrossRef] [Green Version]
- Kume, T.; Akasaka, T.; Kawamoto, T.; Okura, H.; Watanabe, N.; Toyota, E.; Neishi, Y.; Sukmawan, R.; Sadahira, Y.; Yoshida, K. Measurement of the thickness of the fibrous cap by optical coherence tomography. Am. Heart J. 2006, 152, 755.e1–755.e4. [Google Scholar] [CrossRef]
- Kini, A.S.; Vengrenyuk, Y.; Yoshimura, T.; Matsumura, M.; Pena, J.; Baber, U.; Moreno, P.; Mehran, R.; Maehara, A.; Sharma, S.; et al. Fibrous Cap Thickness by Optical Coherence Tomography In Vivo. J. Am. Coll. Cardiol. 2017, 69, 644–657. [Google Scholar] [CrossRef]
- Liu, X.; He, W.; Hong, X.; Li, D.; Chen, Z.; Wang, Y.; Chen, Z.; Luan, Y.; Zhang, W. New insights into fibrous cap thickness of vulnerable plaques assessed by optical coherence tomography. BMC Cardiovasc. Disord. 2022, 22, 484. [Google Scholar] [CrossRef]
- Reith, S.; Battermann, S.; Hoffmann, R.; Marx, N.; Burgmaier, M. Optical coherence tomography derived differences of plaque characteristics in coronary culprit lesions between type 2 diabetic patients with and without acute coronary syndrome. Catheter. Cardiovasc. Interv. 2014, 84, 700–707. [Google Scholar] [CrossRef]
- Sawada, T.; Shite, J.; Garcia-Garcia, H.M.; Shinke, T.; Watanabe, S.; Otake, H.; Matsumoto, D.; Tanino, Y.; Ogasawara, D.; Kawamori, H.; et al. Feasibility of combined use of intravascular ultrasound radiofrequency data analysis and optical coherence tomography for detecting thin-cap fibroatheroma. Eur. Heart J. 2008, 29, 1136–1146. [Google Scholar] [CrossRef] [Green Version]
- Guo, X.; Giddens, D.P.; Molony, D.; Yang, C.; Samady, H.; Zheng, J.; Matsumura, M.; Mintz, G.S.; Maehara, A.; Wang, L.; et al. A Multi-Modality Image-Based FSI Modeling Approach for Prediction of Coronary Plaque Progression Using IVUS and OCT Data with Follow-Up. J. Biomech. Eng. 2019, 141, 0910031–0910039. [Google Scholar] [CrossRef]
- Bourantas, C.V.; Räber, L.; Sakellarios, A.; Ueki, Y.; Zanchin, T.; Koskinas, K.C.; Yamaji, K.; Taniwaki, M.; Heg, D.; Radu, M.D.; et al. Utility of Multimodality Intravascular Imaging and the Local Hemodynamic Forces to Predict Atherosclerotic Disease Progression. JACC Cardiovasc. Imaging 2020, 13, 1021–1032. [Google Scholar] [CrossRef] [PubMed]
- Gijsen, F.; Katagiri, Y.; Barlis, P.; Bourantas, C.; Collet, C.; Coskun, U.; Daemen, J.; Dijkstra, J.; Edelman, E.; Evans, P.; et al. Expert recommendations on the assessment of wall shear stress in human coronary arteries: Existing methodologies, technical considerations, and clinical applications. Eur. Heart J. 2019, 40, 3421–3433. [Google Scholar] [CrossRef] [Green Version]
- Costopoulos, C.; Timmins, L.H.; Huang, Y.; Hung, O.Y.; Molony, D.S.; Brown, A.J.; Davis, E.L.; Teng, Z.; Gillard, J.H.; Samady, H.; et al. Impact of combined plaque structural stress and wall shear stress on coronary plaque progression, regression, and changes in composition. Eur. Heart J. 2019, 40, 1411–1422. [Google Scholar] [CrossRef] [PubMed] [Green Version]
- Costopoulos, C.; Maehara, A.; Huang, Y.; Brown, A.J.; Gillard, J.H.; Teng, Z.; Stone, G.W.; Bennett, M.R. Plaque Structural Stress. 2019. Heterogeneity of Plaque Structural Stress Is Increased in Plaques Leading to MACE. JACC Cardiovasc. Imaging 2020, 13, 1206–1218. [Google Scholar] [CrossRef] [PubMed]
- Milzi, A.; Lemma, E.D.; Dettori, R.; Burgmaier, K.; Marx, N.; Reith, S.; Burgmaier, M. Coronary plaque composition influences biomechanical stress and predicts plaque rupture in a morpho-mechanic OCT analysis. eLife 2021, 10, e64020. [Google Scholar] [CrossRef] [PubMed]
- Schaar, J.A.; de Korte, C.; Mastik, F.; Strijder, C.; Pasterkamp, G.; Boersma, E.; Serruys, P.W.; van der Steen, A.F. Characterizing vulnerable plaque features with intravascular elastography. Circulation 2003, 108, 2636–2641. [Google Scholar] [CrossRef] [Green Version]
- Zhang, L.; Liu, Y.; Zhang, P.F.; Zhao, Y.X.; Ji, X.P.; Lu, X.T.; Chen, W.Q.; Liu, C.X.; Zhang, C.; Zhang, Y. Peak radial and circumferential strain measured by velocity vector imaging is a novel index for detecting vulnerable plaques in a rabbit model of atherosclerosis. Atherosclerosis 2010, 211, 146–152. [Google Scholar] [CrossRef]
- Majdouline, Y.; Ohayon, J.; Keshavarz-Motamed, Z.; Cardinal, M.-H.R.; Garcia, D.; Allard, L.; Lerouge, S.; Arsenault, F.; Soulez, G.; Cloutier, G. Endovascular shear strain elastography for the detection and characterization of the severity of atherosclerotic plaques: In vitro validation and in vivo evaluation. Ultrasound Med. Biol. 2014, 40, 890–903. [Google Scholar] [CrossRef] [PubMed]
- Khan, A.A.; Sikdar, S.; Hatsukami, T.; Cebral, J.; Jones, M.; Huston, J.; Howard, G.; Lal, B.K. Noninvasive characterization of carotid plaque strain. J. Vasc. Surg. 2017, 65, 1653–1663. [Google Scholar] [CrossRef] [PubMed] [Green Version]
- Samady, H.; Eshtehardi, P.; McDaniel, M.C.; Suo, J.; Dhawan, S.S.; Maynard, C.; Timmins, L.H.; Quyyumi, A.A.; Giddens, D.P. Coronary artery wall shear stress is associated with progression and transformation of atherosclerotic plaque and arterial remodeling in patients with coronary artery disease. Circulation 2011, 124, 779–788. [Google Scholar] [CrossRef] [Green Version]
- Stone, G.W.; Maehara, A.; Lansky, A.J.; de Bruyne, B.; Cristea, E.; Mintz, G.S.; Mehran, R.; McPherson, J.; Farhat, N.; Marso, S.P.; et al. A prospective natural-history study of coronary atherosclerosis. N. Engl. J. Med. 2011, 364, 226–235. [Google Scholar] [CrossRef]
- Sakellarios, A.I.; Pezoulas, V.C.; Bourantas, C.; Naka, K.K.; Michalis, L.K.; Serruys, P.W.; Stone, G.; Garcia-Garcia, H.M.; Fotiadis, D.I. Prediction of atherosclerotic disease progression combining computational modelling with machine learning. Annu. Int. Conf. IEEE Eng. Med. Biol. Soc. 2020, 2020, 2760–2763. [Google Scholar] [CrossRef]
- D’Ascenzo, F.; De Filippo, O.; Gallone, G.; Mittone, G.; Deriu, M.A.; Iannaccone, M.; Ariza-Solé, A.; Liebetrau, C.; Manzano-Fernández, S.; Quadri, G.; et al. Machine learning-based prediction of adverse events following an acute coronary syndrome (PRAISE): A modelling study of pooled datasets. Lancet 2021, 397, 199–207. [Google Scholar] [CrossRef]
- Lin, S.; Li, Z.; Fu, B.; Chen, S.; Li, X.; Wang, Y.; Wang, X.; Lv, B.; Xu, B.; Song, X.; et al. Feasibility of using deep learning to detect coronary artery disease based on facial photo. Eur. Heart J. 2020, 41, 4400–4411. [Google Scholar] [CrossRef] [PubMed]
- Lv, R.; Maehara, A.; Matsumura, M.; Wang, L.; Zhang, C.; Huang, M.; Guo, X.; Samady, H.; Giddens, D.P.; Zheng, J.; et al. Using Optical Coherence Tomography and Intravascular Ultrasound Imaging to Quantify Coronary Plaque Cap Stress/Strain and Progression: A Follow-Up Study Using 3D Thin-Layer Models. Front. Bioeng. Biotechnol. 2021, 9, 713525. [Google Scholar] [CrossRef]
- Lansky, A.J.; Dangas, G.; Mehran, R.; Desai, K.J.; Stone, G.W.; Leon, M.B.; Mintz, G.S.; Waksman, R.; Wu, H.; Fahy, M. Quantitative angiographic methods for appropriate end-point analysis, edge-effect evaluation, and prediction of recurrent restenosis after coronary brachytherapy with gamma irradiation. J. Am. Coll. Cardiol. 2002, 39, 274–280. [Google Scholar] [CrossRef] [Green Version]
- Tang, D.; Kamm, R.D.; Yang, C.; Zheng, J.; Canton, G.; Bach, R.; Huang, X.; Hatsukami, T.S.; Zhu, J.; Ma, G.; et al. Image-based modeling for better understanding and assessment of atherosclerotic plaque progression and vulnerability: Data, modeling, validation, uncertainty and predictions. J. Biomech. 2014, 47, 834–846. [Google Scholar] [CrossRef]
- Wang, Q.; Tang, D.; Wang, L.; Canton, G.; Wu, Z.; Hatsukami, T.S.; Billiar, K.L.; Yuan, C. Combining morphological and biomechanical factors for optimal carotid plaque progression prediction: An MRI-based follow-up study using 3D thin-layer models. Int. J. Cardiol. 2019, 293, 266–271. [Google Scholar] [CrossRef]
- Huang, X.; Yang, C.; Zheng, J.; Bach, R.; Muccigrosso, D.; Woodard, P.K.; Tang, D. 3D MRI-based multicomponent thin layer structure only plaque models for atherosclerotic plaques. J. Biomech. 2016, 49, 2726–2733. [Google Scholar] [CrossRef] [PubMed] [Green Version]
- Wang, L.; Tang, D.; Maehara, A.; Molony, D.; Zheng, J.; Samady, H.; Wu, Z.; Lu, W.; Zhu, J.; Ma, G.; et al. Multi-factor decision-making strategy for better coronary plaque burden increase prediction: A patient-specific 3D FSI study using IVUS follow-up data. Biomech. Model. Mechanobiol. 2019, 18, 1269–1280. [Google Scholar] [CrossRef] [PubMed]
- Wang, L.; Tang, D.; Maehara, A.; Wu, Z.; Yang, C.; Muccigrosso, D.; Matsumura, M.; Zheng, J.; Bach, R.; Billiar, K.L.; et al. Using intravascular ultrasound image-based fluid-structure interaction models and machine learning methods to predict human coronary plaque vulnerability change. Comput. Methods Biomech. Biomed. Eng. 2020, 23, 1267–1276. [Google Scholar] [CrossRef] [PubMed]
- Mortensen, M.B.; Dzaye, O.; Steffensen, F.H.; Bøtker, H.E.; Jensen, J.M.; Sand, N.P.R.; Kragholm, K.H.; Sørensen, H.T.; Leipsic, J.; Mæng, M.; et al. Impact of Plaque Burden Versus Stenosis on Ischemic Events in Patients With Coronary Atherosclerosis. J. Am. Coll. Cardiol. 2020, 76, 2803–2813. [Google Scholar] [CrossRef] [PubMed]
- Rodriguez-Granillo, G.A.; García-García, H.M.; Mc Fadden, E.P.; Valgimigli, M.; Aoki, J.; de Feyter, P.; Serruys, P.W. In Vivo Intravascular Ultrasound-Derived Thin-Cap Fibroatheroma Detection Using Ultrasound Radiofrequency Data Analysis. J. Am. Coll. Cardiol. 2005, 46, 2038–2042. [Google Scholar] [CrossRef] [PubMed] [Green Version]
- Wang, L.; Tang, D.; Maehara, A.; Wu, Z.; Yang, C.; Muccigrosso, D.; Zheng, J.; Bach, R.; Billiar, K.L.; Mintz, G.S. Fluid-Structure Interaction Models Based on Patient-Specific IVUS at Baseline and Follow-Up for Prediction of Coronary Plaque Progression by Morphological and Biomechanical Factors: A Preliminary Study. J. Biomech. 2018, 68, 43–50. [Google Scholar] [CrossRef]
- Prati, F.; Romagnoli, E.; Gatto, L.; La Manna, A.; Burzotta, F.; Ozaki, Y.; Marco, V.; Boi, A.; Fineschi, M.; Fabbiocchi, F.; et al. Relationship between coronary plaque morphology of the left anteriordescending artery and 12 months clinical outcome: The CLIMA study. Eur. Heart J. 2020, 41, 383–391. [Google Scholar] [CrossRef] [Green Version]
- Burgmaier, M.; Hellmich, M.; Marx, N.; Reith, S. A score to quantify coronary plaque vulnerability in high-risk patients with type 2 diabetes: An optical coherence tomography study. Cardiovasc. Diabetol. 2014, 13, 117. [Google Scholar] [CrossRef] [Green Version]
- Giudici, A.; Li, Y.; Yasmin; Cleary, S.; Connolly, K.; McEniery, C.; Wilkinson, I.B.; Khir, A.W. Time-course of the human thoracic aorta ageing process assessed using uniaxial mechanical testing and constitutive modelling. J. Mech. Behav. Biomed. Mater. 2022, 134, 105339. [Google Scholar] [CrossRef]
- Jadidi, M.; Habibnezhad, M.; Anttila, E.; Maleckis, K.; Desyatova, A.; MacTaggart, J.; Kamenskiy, A. Mechanical and structural changes in human thoracic aortas with age. Acta Biomater. 2020, 103, 172–188. [Google Scholar] [CrossRef] [PubMed]
- Holzapfel, G.A.; Sommer, G.; Gasser, C.T.; Regitnig, P. Determination of layer-specific mechanical properties of human coronary arteries with nonatherosclerotic intimal thickening and related constitutive modeling. Am. J. Physiol. 2005, 289, H2048–H2058. [Google Scholar] [CrossRef] [PubMed] [Green Version]
- Guo, X.; Zhu, J.; Maehara, A.; Monoly, D.; Samady, H.; Wang, L.; Billiar, K.L.; Zheng, J.; Yang, C.; Mintz, G.S.; et al. Quantify patient-specific coronary material property and its impact on stress/strain calculations using in vivo IVUS data and 3D FSI models: A pilot study. Biomech. Model. Mechanobiol. 2017, 16, 333–344. [Google Scholar] [CrossRef] [PubMed]


| Patient ID | Age | Sex | BP (mmHg) | Diagnosis History | FU Days |
|---|---|---|---|---|---|
| P1 | 80 | F | 71–138 | HT DM | 304 |
| P2 | 70 | M | 84–155 | HT | 273 |
| P3 | 65 | F | 63–149 | DM | 220 |
| P4 | 66 | M | 89–150 | DM | 290 |
| P5 | 81 | M | 69–112 | HT | 182 |
| P6 | 73 | M | 55–150 | HT HL | 248 |
| P7 | 74 | F | 62–151 | HT DM HL | 244 |
| P8 | 62 | F | 79–117 | HL | 195 |
| P9 | 61 | M | 78–128 | HT DM HL | 283 |
| P10 | 72 | M | 80–143 | HT DM HL | 272 |
| PVI Index Values | 1 | 2 | 3 | 4 |
|---|---|---|---|---|
| C-PVI Min-CapT Range (mm) | (0.36, 2) | (0.26, 0.36] | (0.20, 0.26] | (0.0, 0.20] |
| Slice Distributions | 79 | 21 | 7 | 7 |
| MaxS-PVI Max Stress Range (kPa) | (20, 80] | (80, 101] | (101, 110] | (110, ∞) |
| Slice Distributions | 73 | 22 | 8 | 11 |
| MeanS-PVI Mean Stress Range (kPa) | (20, 70] | (70, 88] | (88, 93] | (93, ∞) |
| Slice Distributions | 82 | 23 | 8 | 1 |
| MaxSn-PVI Max Strain Range | (0.05,0.17] | (0.17,0.18] | (0.18,0.2] | (0.2, ∞) |
| Slice Distributions | 80 | 15 | 13 | 6 |
| MeanSn-PVI Mean Strain Range | (0.05,0.18] | (0.18,0.2] | (0.2,0.21] | (0.21, ∞) |
| Slice Distributions | 95 | 13 | 3 | 3 |
| PVI Index | Best Predictor | Acc | Sen | Spe | Sen + Spe | AUC |
|---|---|---|---|---|---|---|
| C-PVI | PA + PB + MinCapT + MeanCapT + MeanCapSn | 0.903 | 0.567 | 0.958 | 1.525 | 0.877 |
| MaxS-PVI | MinCapT + MeanCapT + MaxCapS | 0.779 | 0.617 | 0.844 | 1.461 | 0.776 |
| MeanS-PVI | PA + MeanCapS | 0.856 | 0.730 | 0.888 | 1.617 | 0.867 |
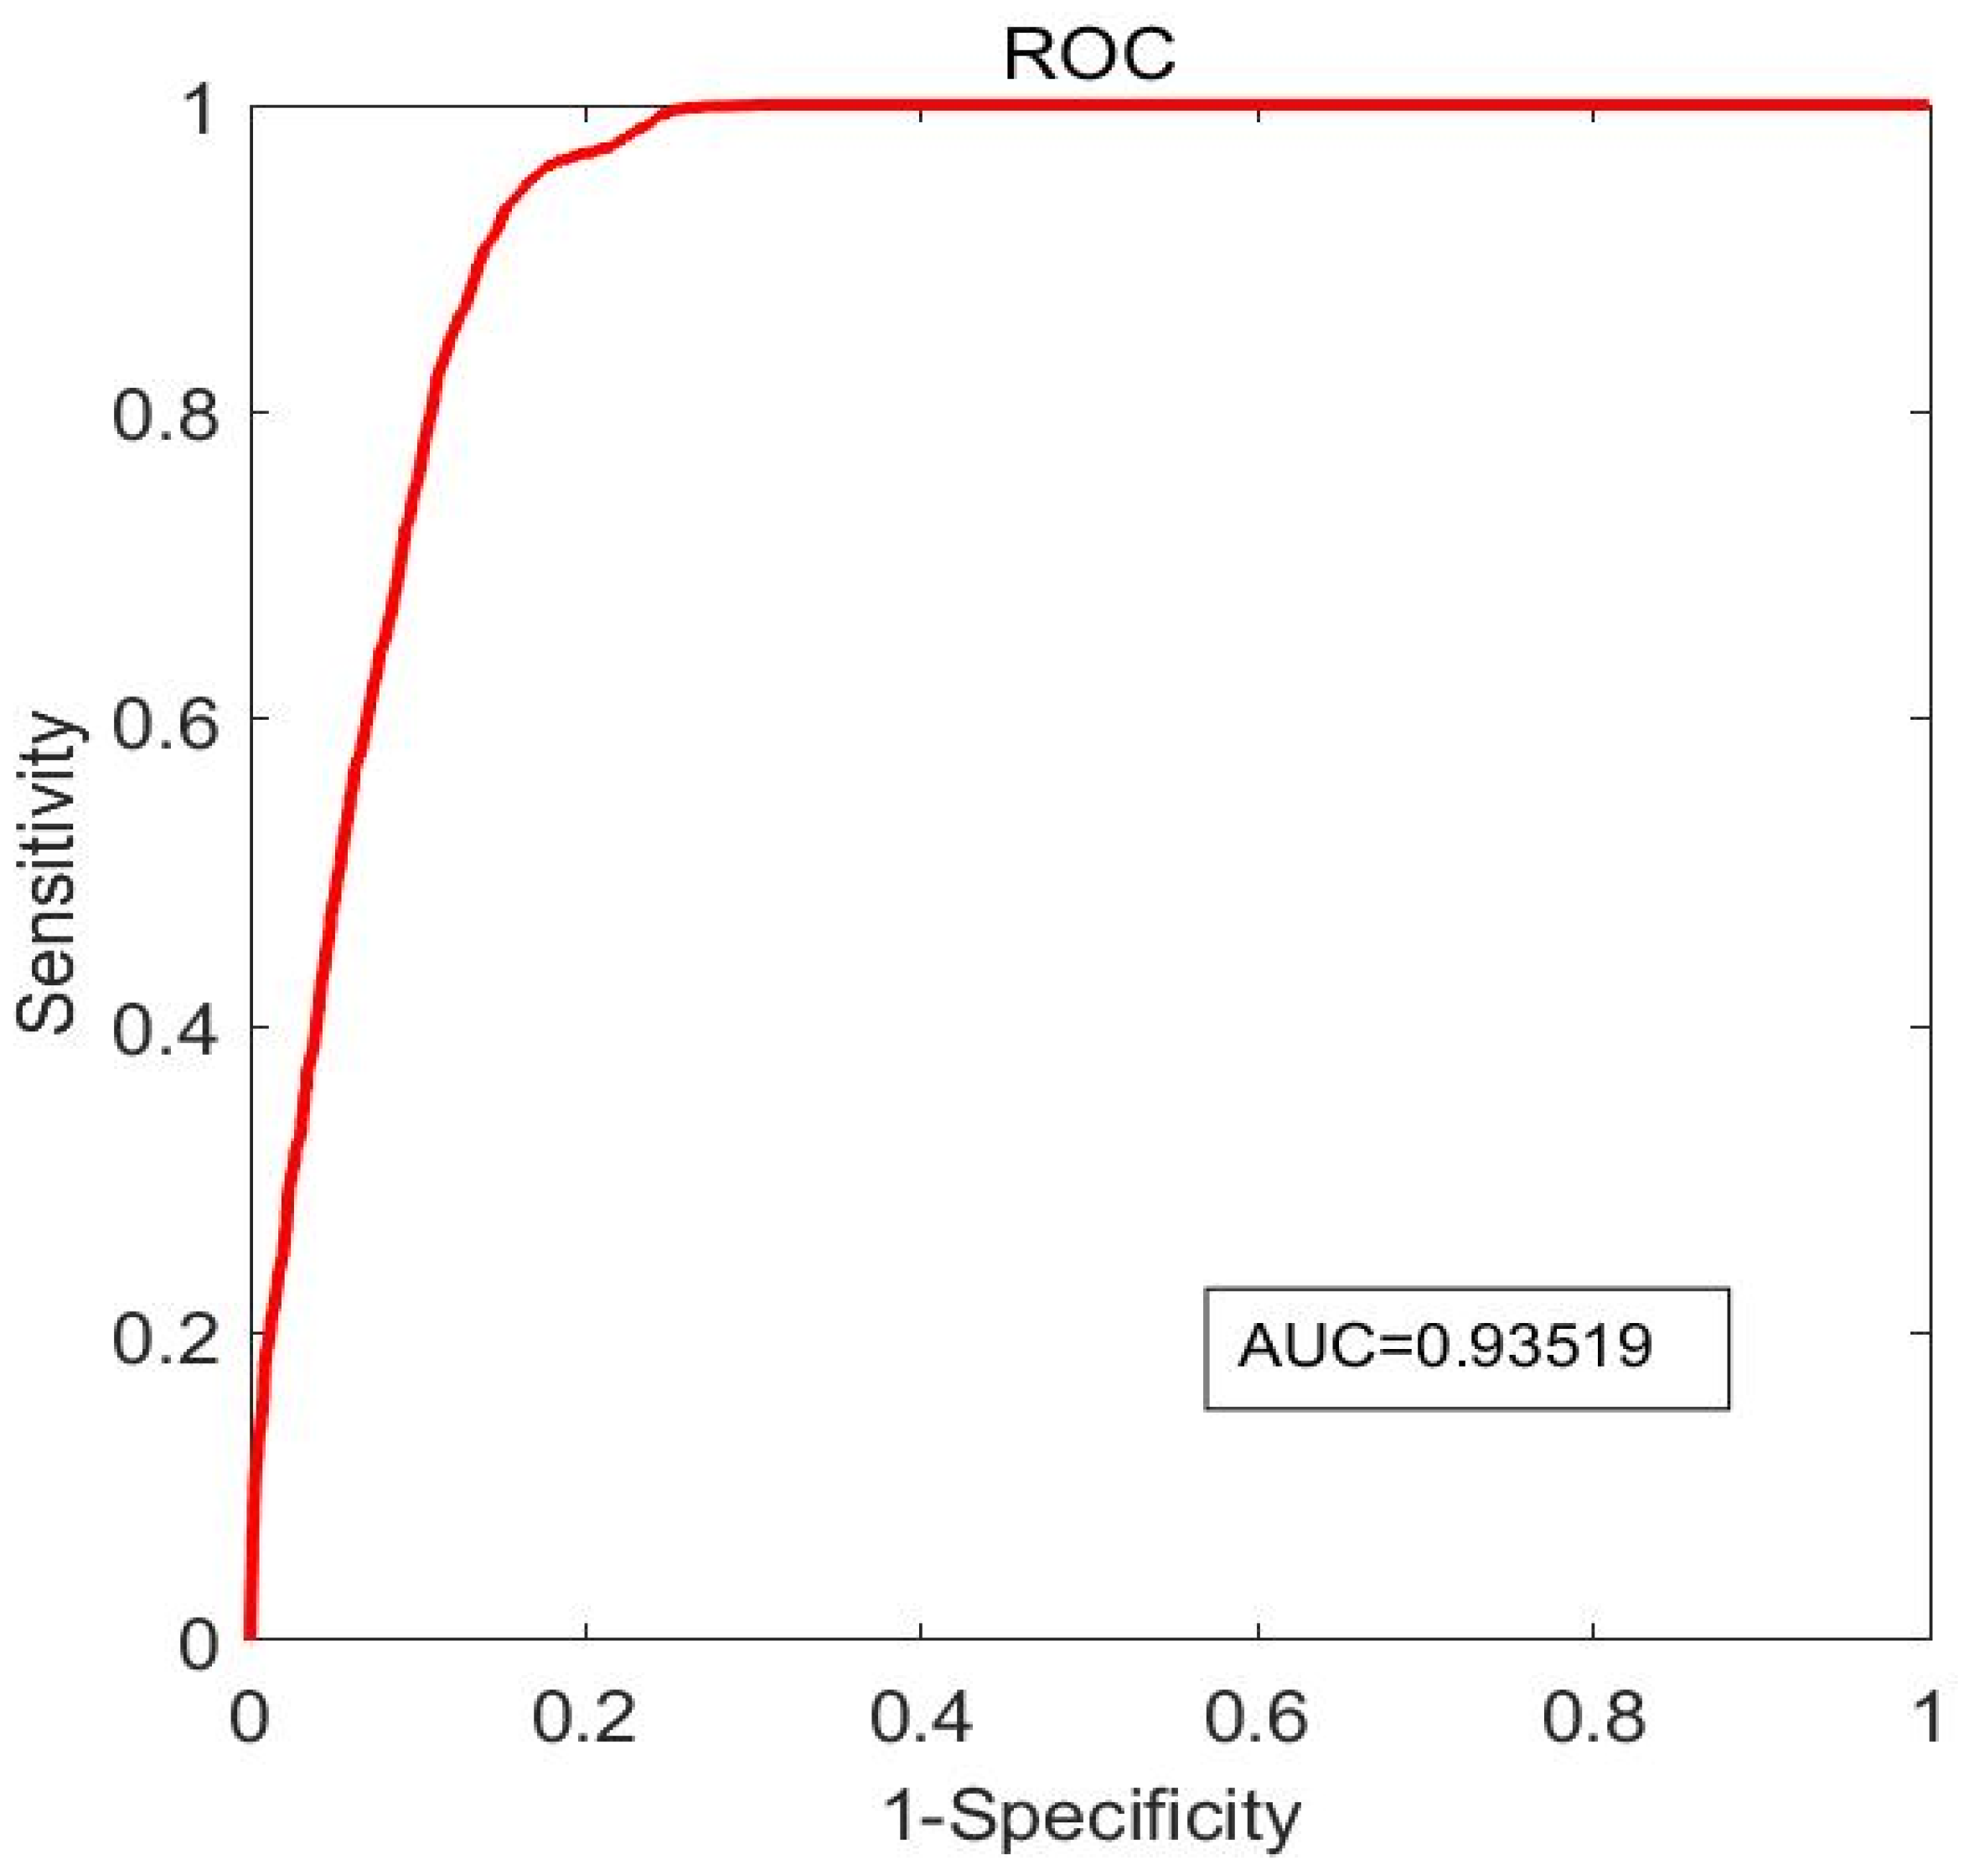
| MaxSn-PVI | LA + PA + MaxCapSn | 0.871 | 0.876 | 0.869 | 1.745 | 0.935 |
| MeanSn-PVI | PA + PB + MaxCapSn + MeanCapSn | 0.833 | 0.568 | 0.876 | 1.444 | 0.809 |
| C-PVI | MaxS-PVI | ||
| Predictor | (Acc, Sen, Spe, AUC) | Predictor | (Acc, Sen, Spe, AUC) |
| LA | (0.702, 0.136, 0.794, 0.416) | LA | (0.566, 0.288, 0.679, 0.483) |
| PA | (0.738, 0.068, 0.847, 0.434) | PA | (0.568, 0.309, 0.674, 0.465) |
| PB | (0.837, 0.702, 0.859, 0.827) | PB | (0.634, 0.445, 0.711, 0.632) |
| MinCapT | (0.756, 0.199, 0.847, 0.674) | MinCapT | (0.506, 0.351, 0.569, 0.463) |
| MeanCapT | (0.696, 0.220, 0.774, 0.571) | MeanCapT | (0.654, 0.388, 0.762, 0.675) |
| MaxCapS | (0.715, 0.235, 0.793, 0.524) | MaxCapS | (0.600, 0.323, 0.713, 0.610) |
| MeanCapS | (0.789, 0.279, 0.872, 0.687) | MeanCapS | (0.451, 0.184, 0.559, 0.356) |
| MaxCapSn | (0.778, 0.293, 0.858, 0.672) | MaxCapSn | (0.559, 0.349, 0.644, 0.486) |
| MeanCapSn | (0.785, 0.177, 0.885, 0.603) | MeanCapSn | (0.587, 0.386, 0.669, 0.540) |
| MeanS-PVI | MaxSn-PVI | ||
| Predictor | (Acc, Sen, Spe, AUC) | Predictor | (Acc, Sen, Spe, AUC) |
| LA | (0.735, 0.316, 0.841, 0.664) | LA | (0.576, 0.551, 0.587, 0.627) |
| PA | (0.756, 0.513, 0.818, 0.781) | PA | (0.704, 0.535, 0.776, 0.699) |
| PB | (0.676, 0.355, 0.757, 0.640) | PB | (0.615, 0.302, 0.749, 0.523) |
| MinCapT | (0.704, 0.171, 0.839, 0.509) | MinCapT | (0.498, 0.353, 0.560, 0.474) |
| MeanCapT | (0.564, 0.238, 0.646, 0.436) | MeanCapT | (0.521, 0.331, 0.602, 0.504) |
| MaxCapS | (0.646, 0.179, 0.764, 0.492) | MaxCapS | (0.641, 0.506, 0.698, 0.641) |
| MeanCapS | (0.580, 0.294, 0.653, 0.513) | MeanCapS | (0.606, 0.422, 0.684, 0.543) |
| MaxCapSn | (0.717, 0.277, 0.828, 0.660) | MaxCapSn | (0.798, 0.593, 0.885, 0.909) |
| MeanCapSn | (0.716, 0.403, 0.795, 0.628) | MeanCapSn | (0.623, 0.306, 0.757, 0.585) |
| MeanSn-PVI | |||
| Predictor | (Acc, Sen, Spe, AUC) | Predictor | (Acc, Sen, Spe, AUC) |
| LA | (0.743, 0.047, 0.857, 0.508) | PA | (0.734, 0.200, 0.821, 0.451) |
| PB | (0.748, 0.361, 0.811, 0.579) | MinCapT | (0.710, 0.201, 0.793, 0.560) |
| MeanCapT | (0.714, 0.306, 0.781, 0.587) | MaxCapS | (0.701, 0.041, 0.808, 0.326) |
| MeanCapS | (0.715, 0.168, 0.805, 0.477) | MaxCapSn | (0.753, 0.266, 0.833, 0.693) |
| MeanCapSn | (0.659, 0.518, 0.682, 0.650) | ||
Disclaimer/Publisher’s Note: The statements, opinions and data contained in all publications are solely those of the individual author(s) and contributor(s) and not of MDPI and/or the editor(s). MDPI and/or the editor(s) disclaim responsibility for any injury to people or property resulting from any ideas, methods, instructions or products referred to in the content. |
© 2023 by the authors. Licensee MDPI, Basel, Switzerland. This article is an open access article distributed under the terms and conditions of the Creative Commons Attribution (CC BY) license (https://creativecommons.org/licenses/by/4.0/).
Share and Cite
Lv, R.; Wang, L.; Maehara, A.; Matsumura, M.; Guo, X.; Samady, H.; Giddens, D.P.; Zheng, J.; Mintz, G.S.; Tang, D. Combining IVUS + OCT Data, Biomechanical Models and Machine Learning Method for Accurate Coronary Plaque Morphology Quantification and Cap Thickness and Stress/Strain Index Predictions. J. Funct. Biomater. 2023, 14, 41. https://doi.org/10.3390/jfb14010041
Lv R, Wang L, Maehara A, Matsumura M, Guo X, Samady H, Giddens DP, Zheng J, Mintz GS, Tang D. Combining IVUS + OCT Data, Biomechanical Models and Machine Learning Method for Accurate Coronary Plaque Morphology Quantification and Cap Thickness and Stress/Strain Index Predictions. Journal of Functional Biomaterials. 2023; 14(1):41. https://doi.org/10.3390/jfb14010041
Chicago/Turabian StyleLv, Rui, Liang Wang, Akiko Maehara, Mitsuaki Matsumura, Xiaoya Guo, Habib Samady, Don P. Giddens, Jie Zheng, Gary S. Mintz, and Dalin Tang. 2023. "Combining IVUS + OCT Data, Biomechanical Models and Machine Learning Method for Accurate Coronary Plaque Morphology Quantification and Cap Thickness and Stress/Strain Index Predictions" Journal of Functional Biomaterials 14, no. 1: 41. https://doi.org/10.3390/jfb14010041