
Experimental Study of the Propagation Process of Dissection Using an Aortic Silicone Phantom

 , and
, and 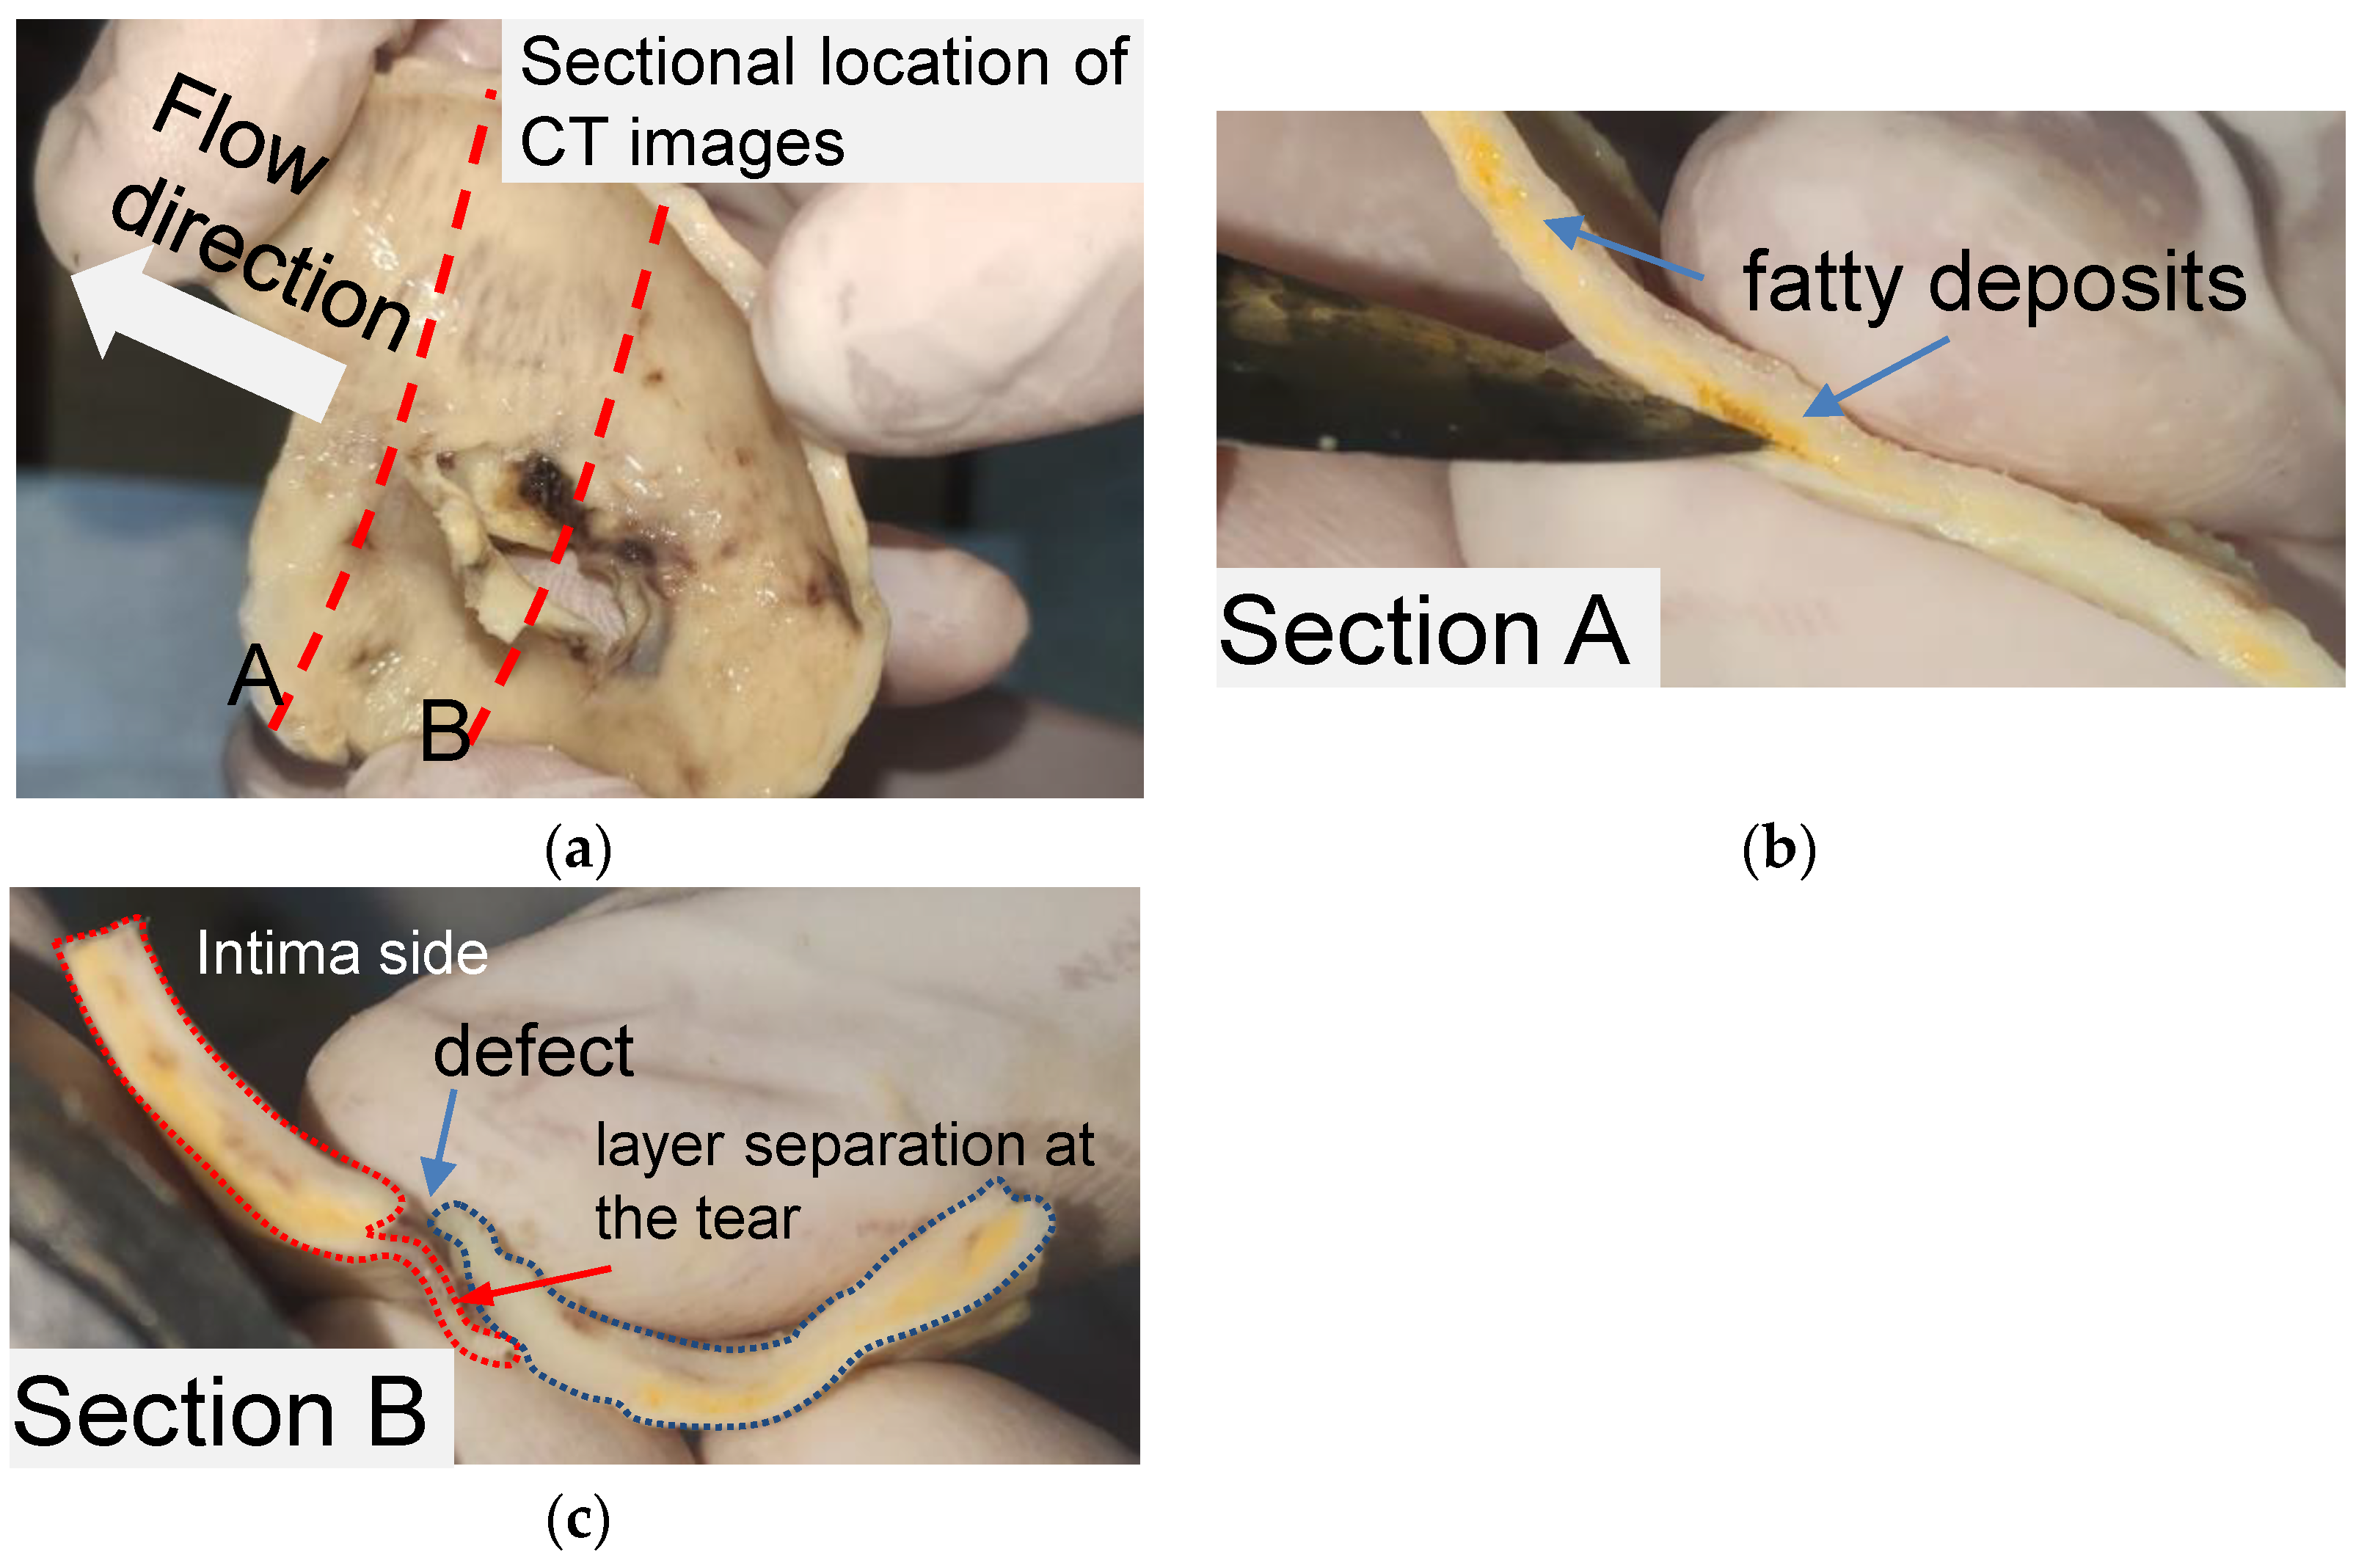
Abstract
:1. Introduction
2. Materials and Methods
2.1. Key Features of the Tear of AD in Human Aortic Tissue
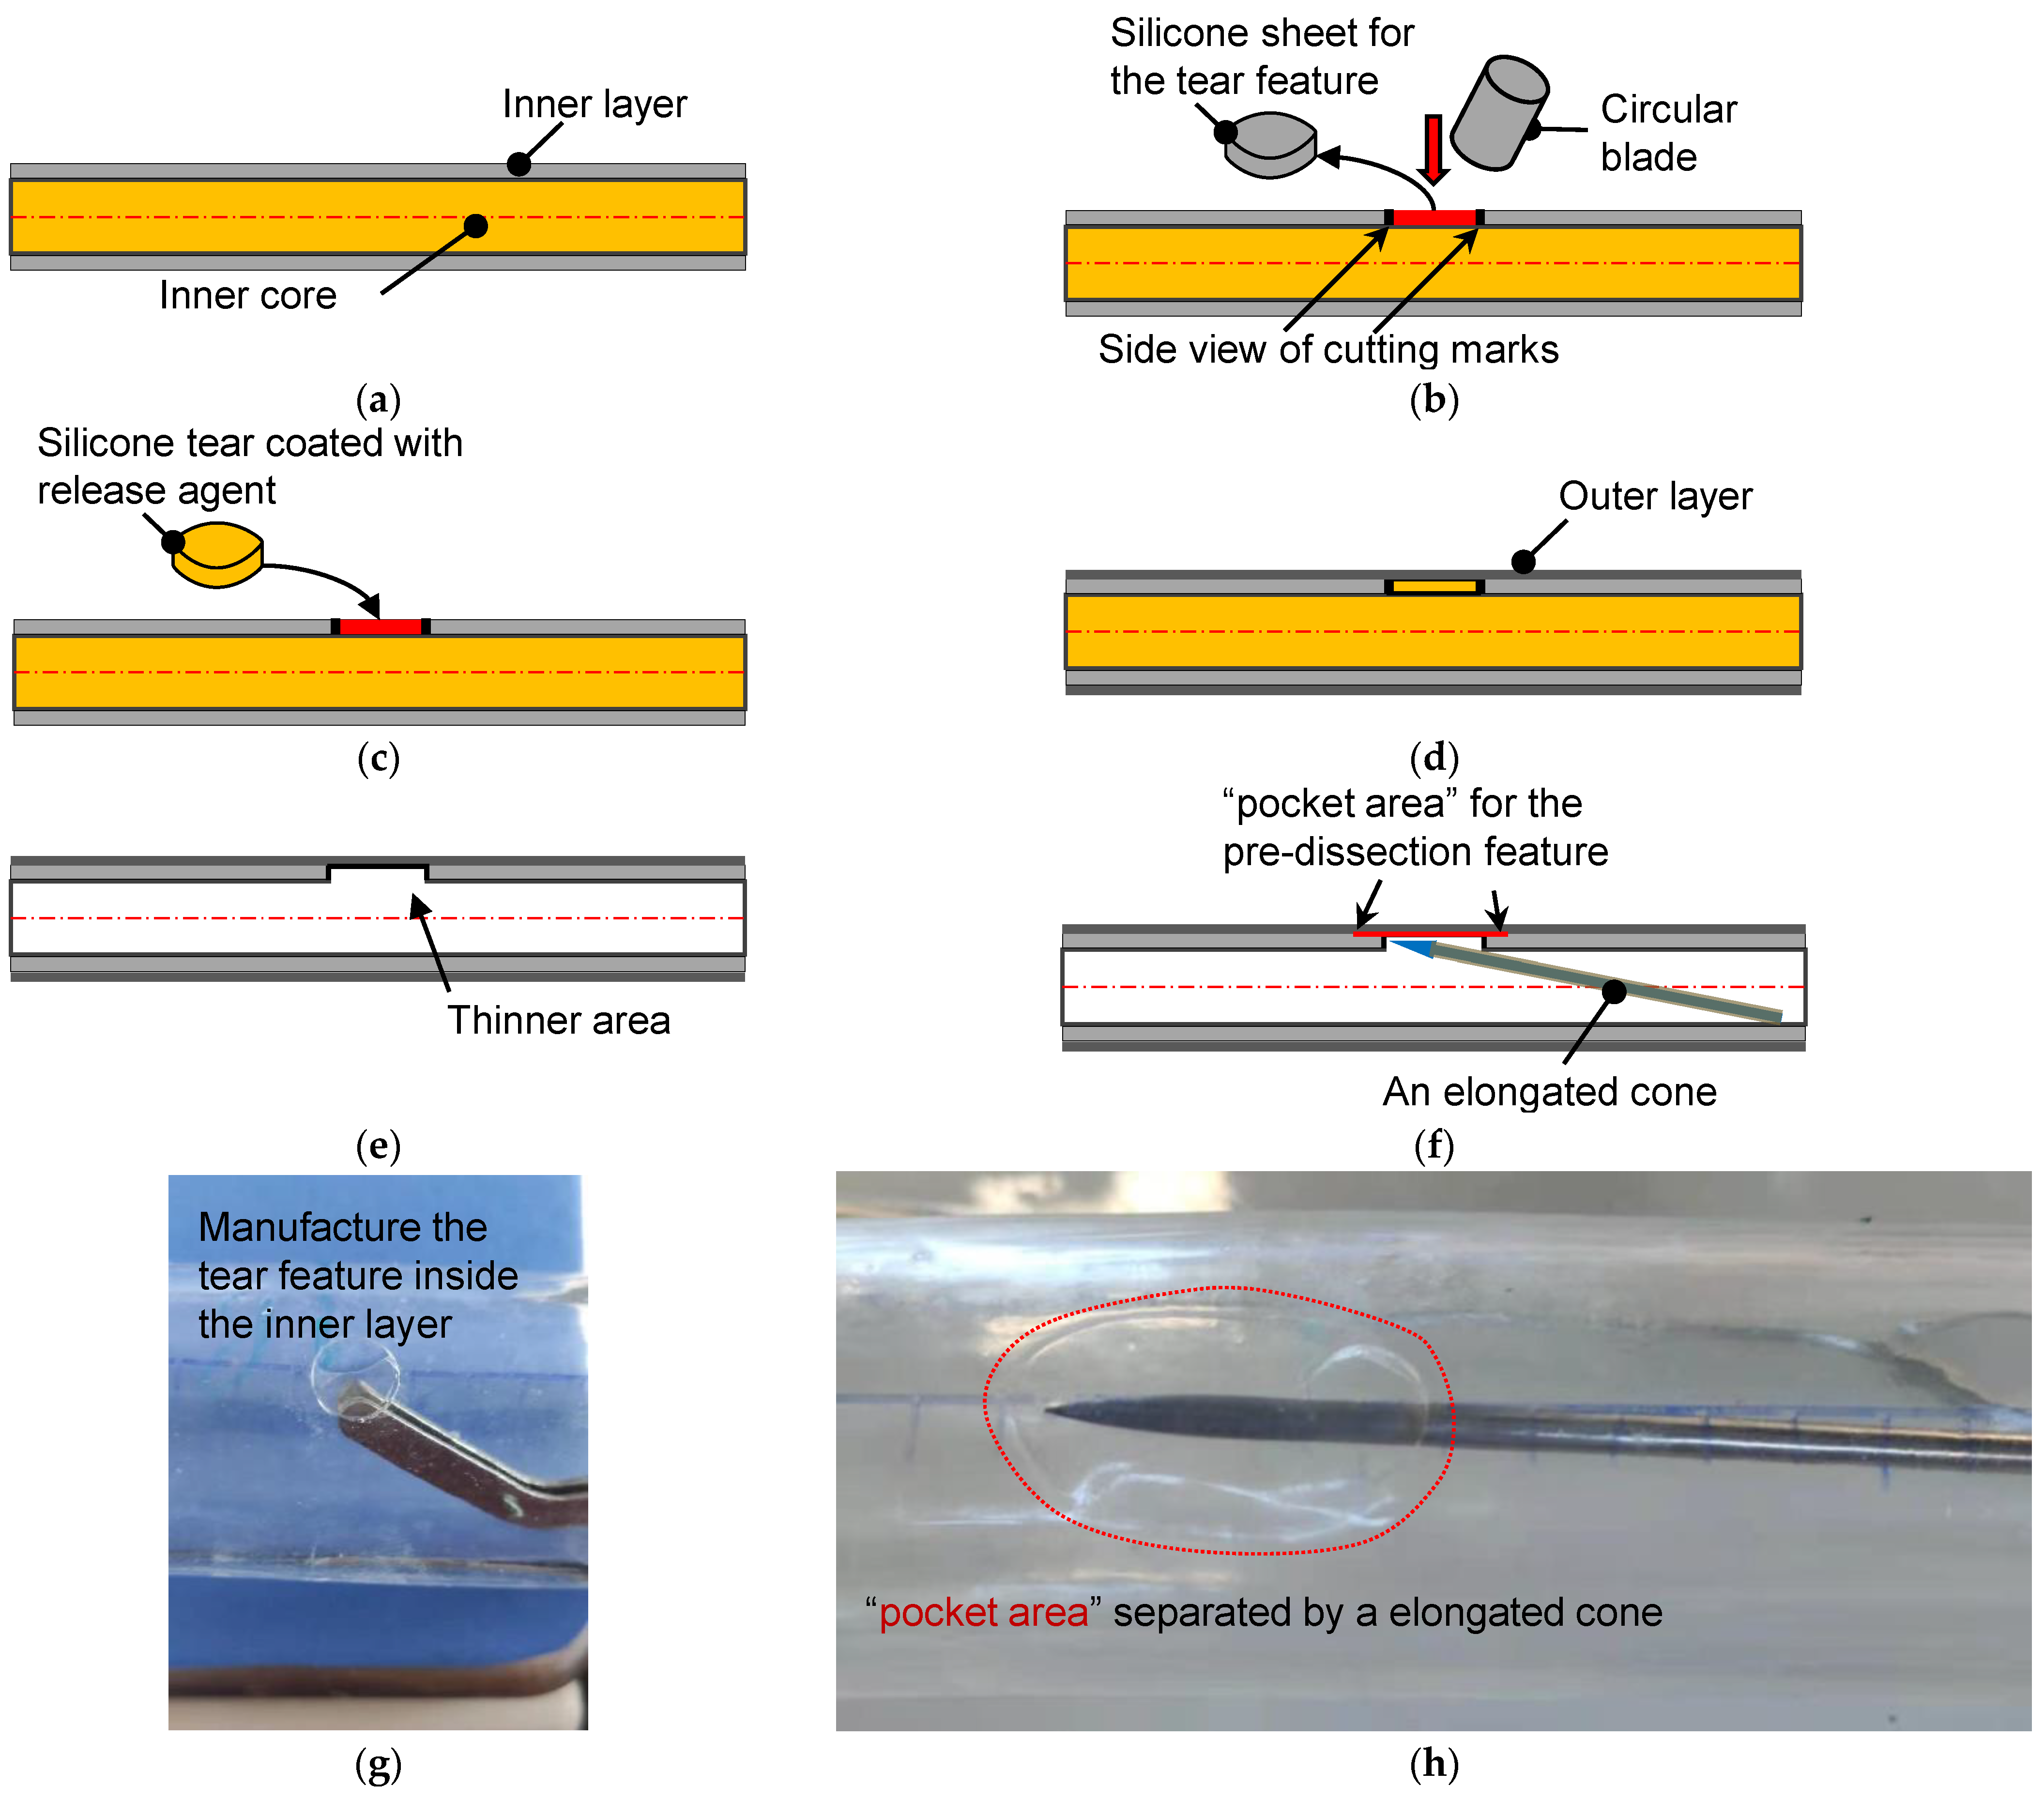
2.2. Fabrication Method of Tear-Embedded Silicone Phantom
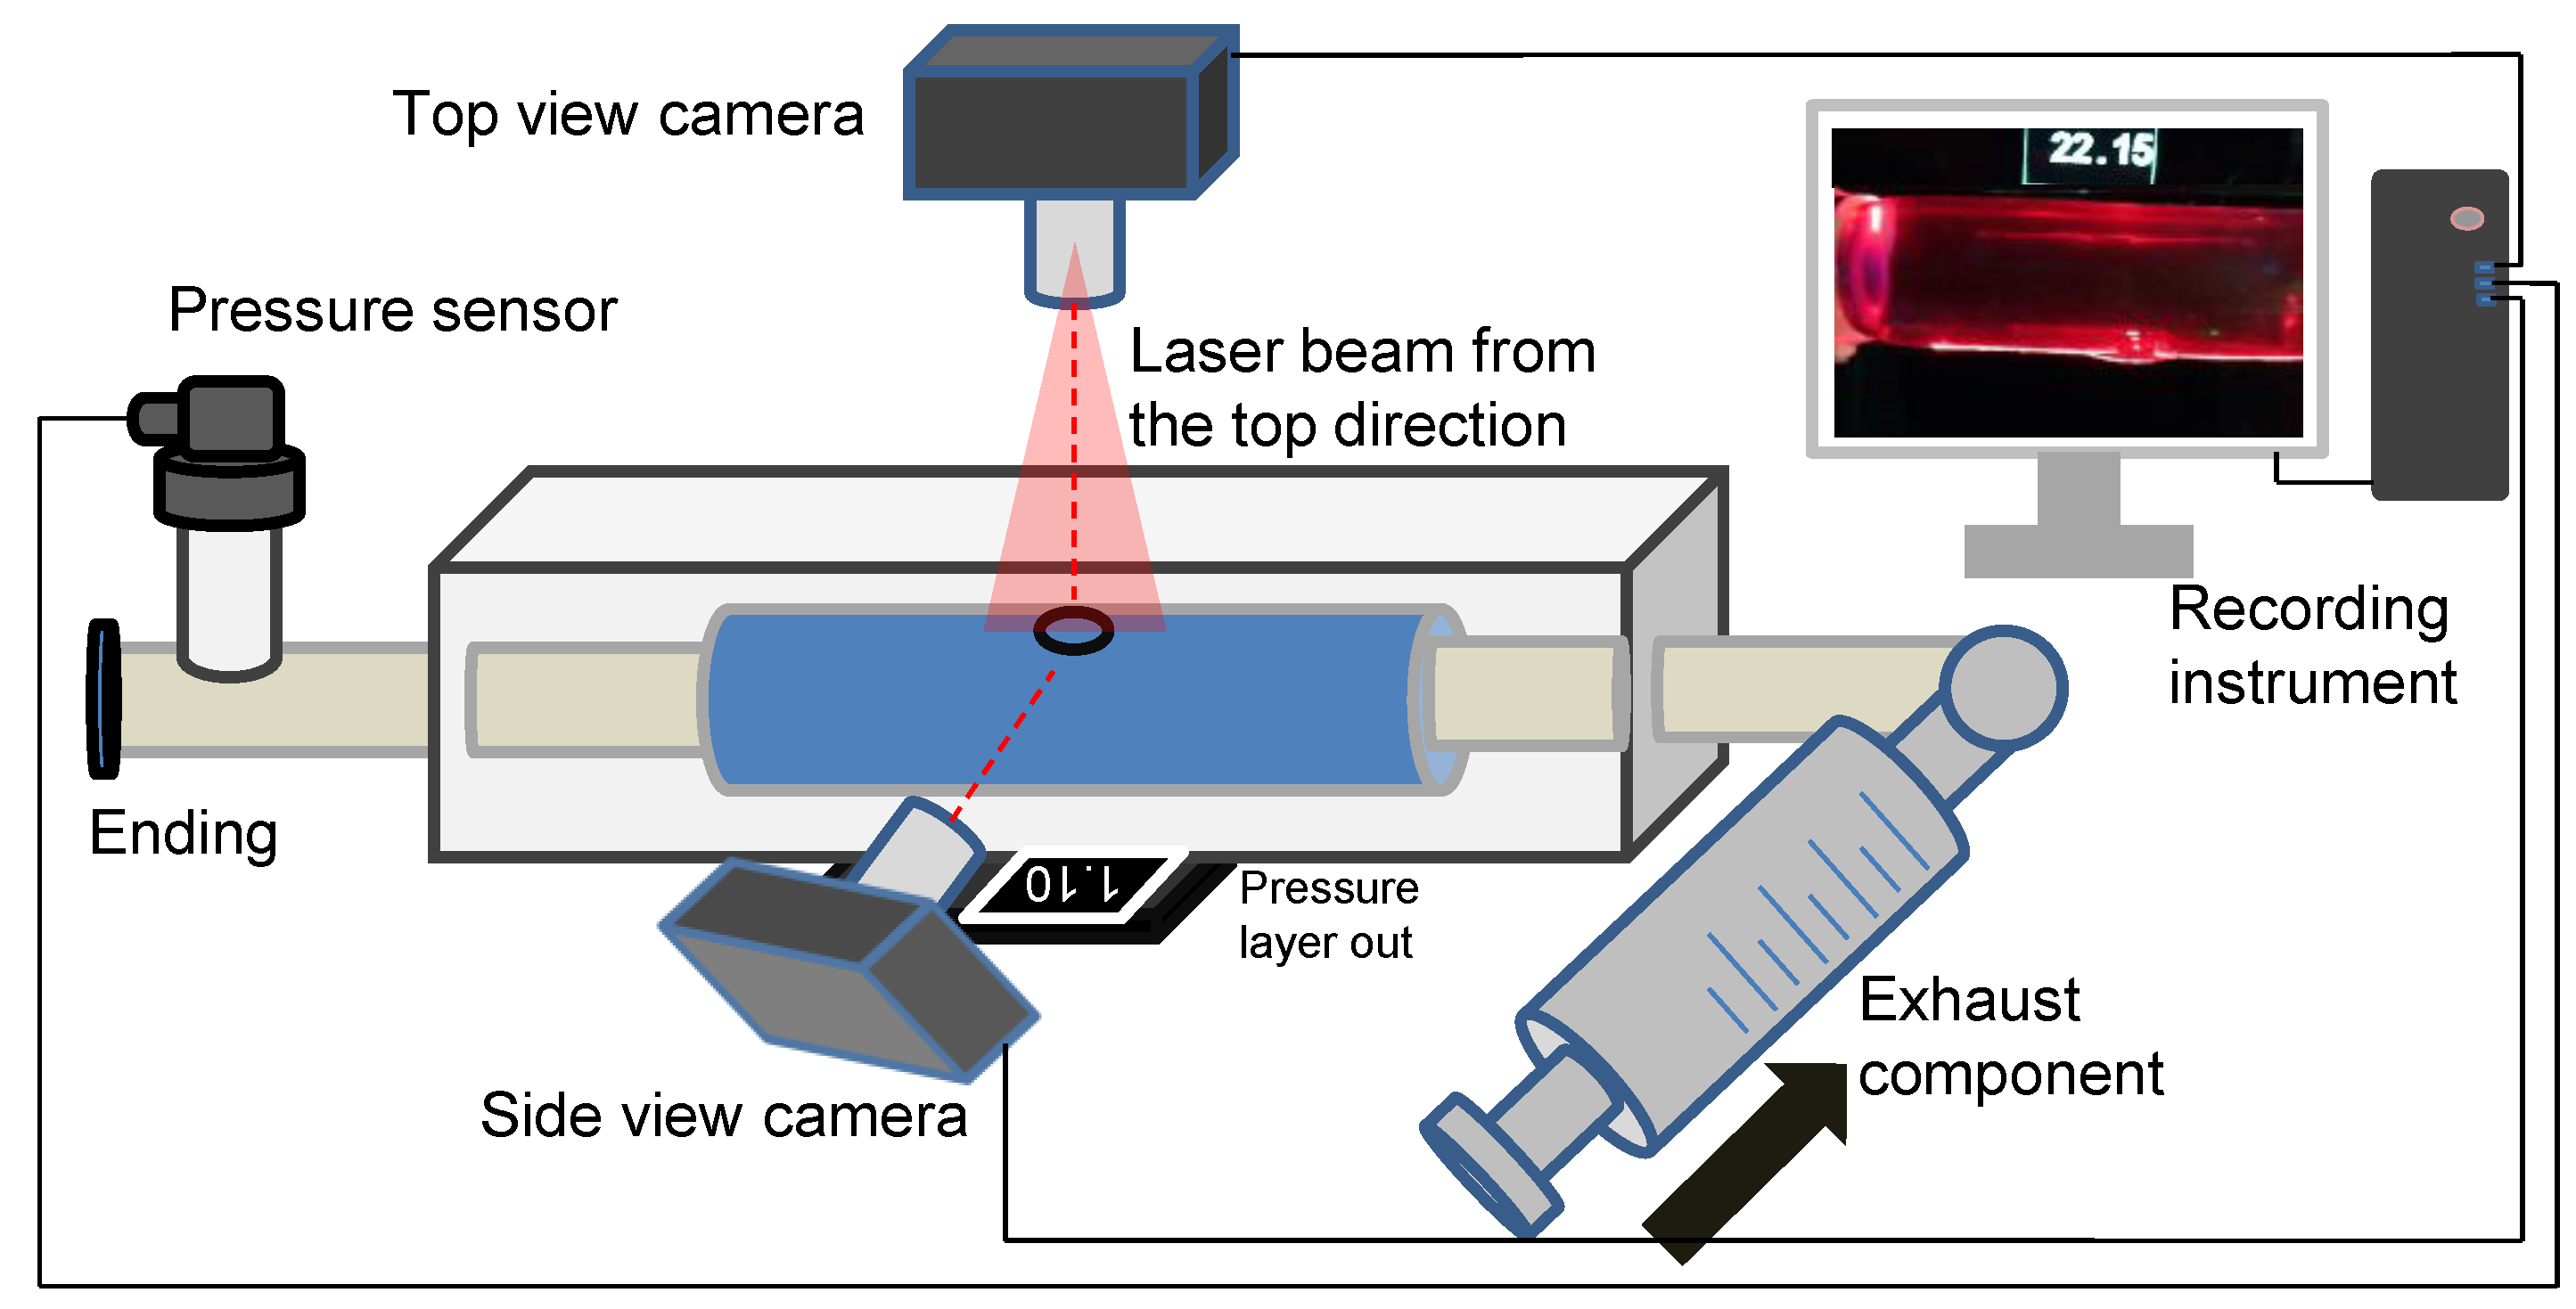
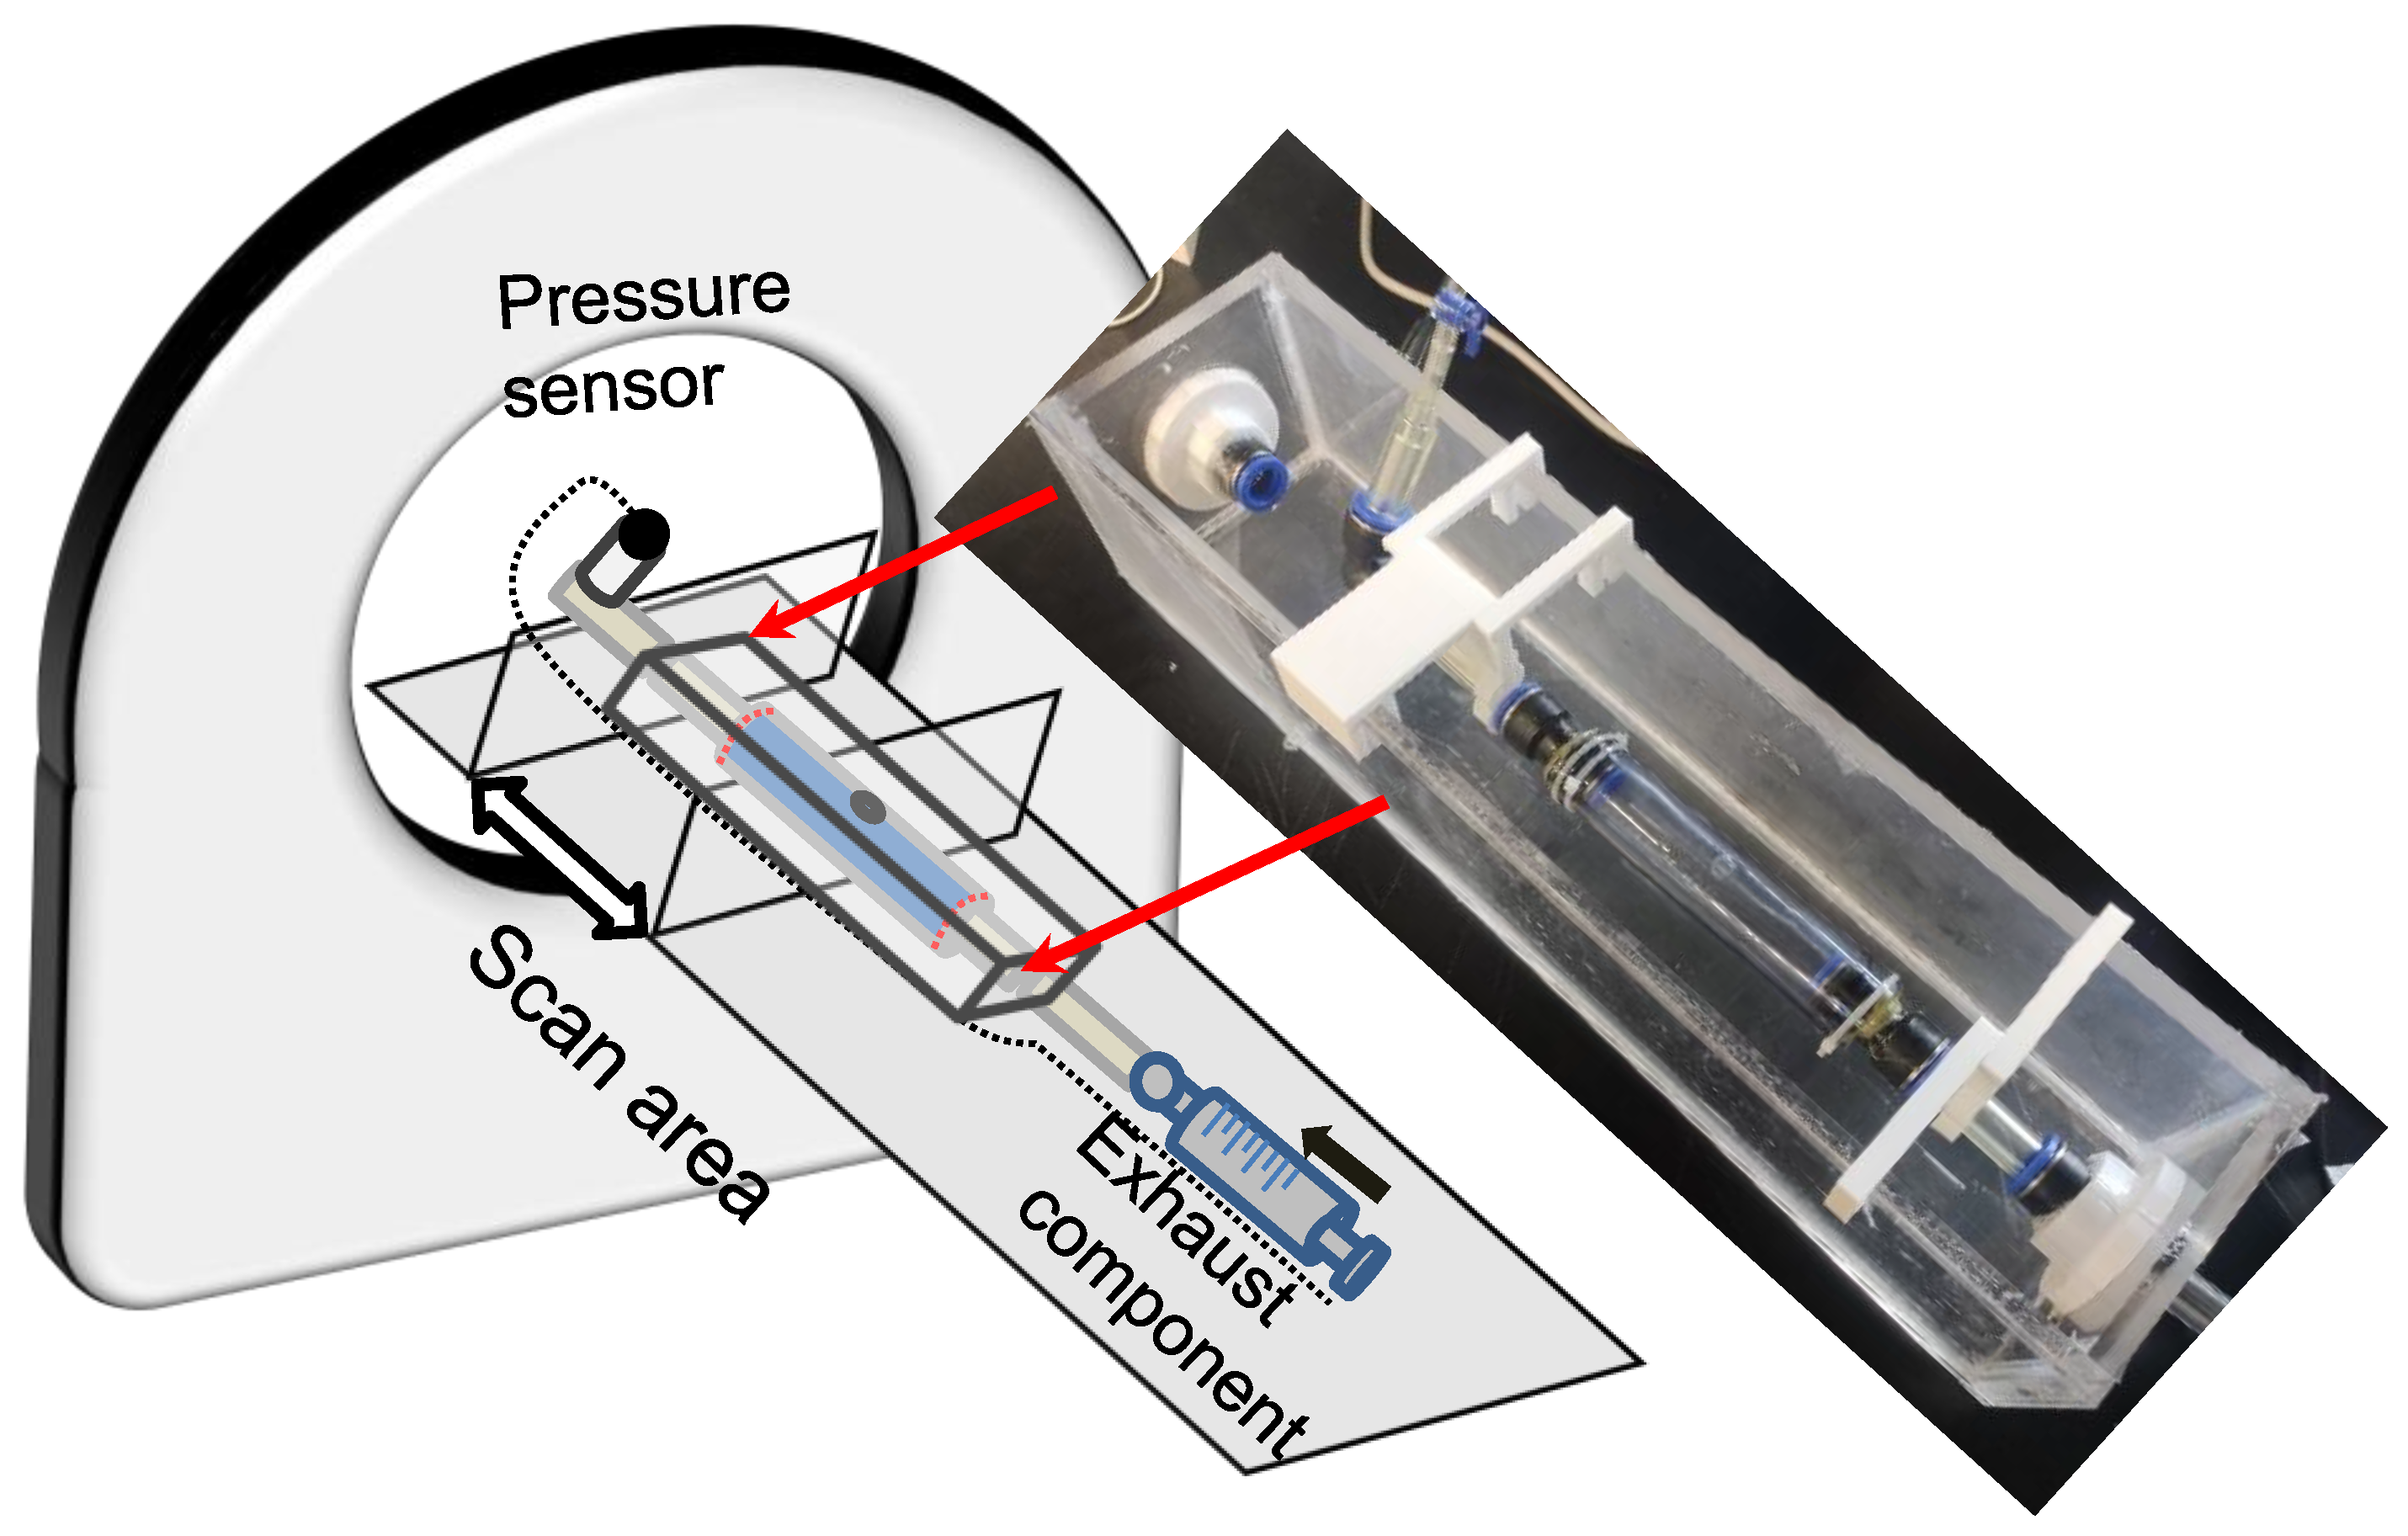
2.3. Experimental Setup of the Laser-Enhanced Observation
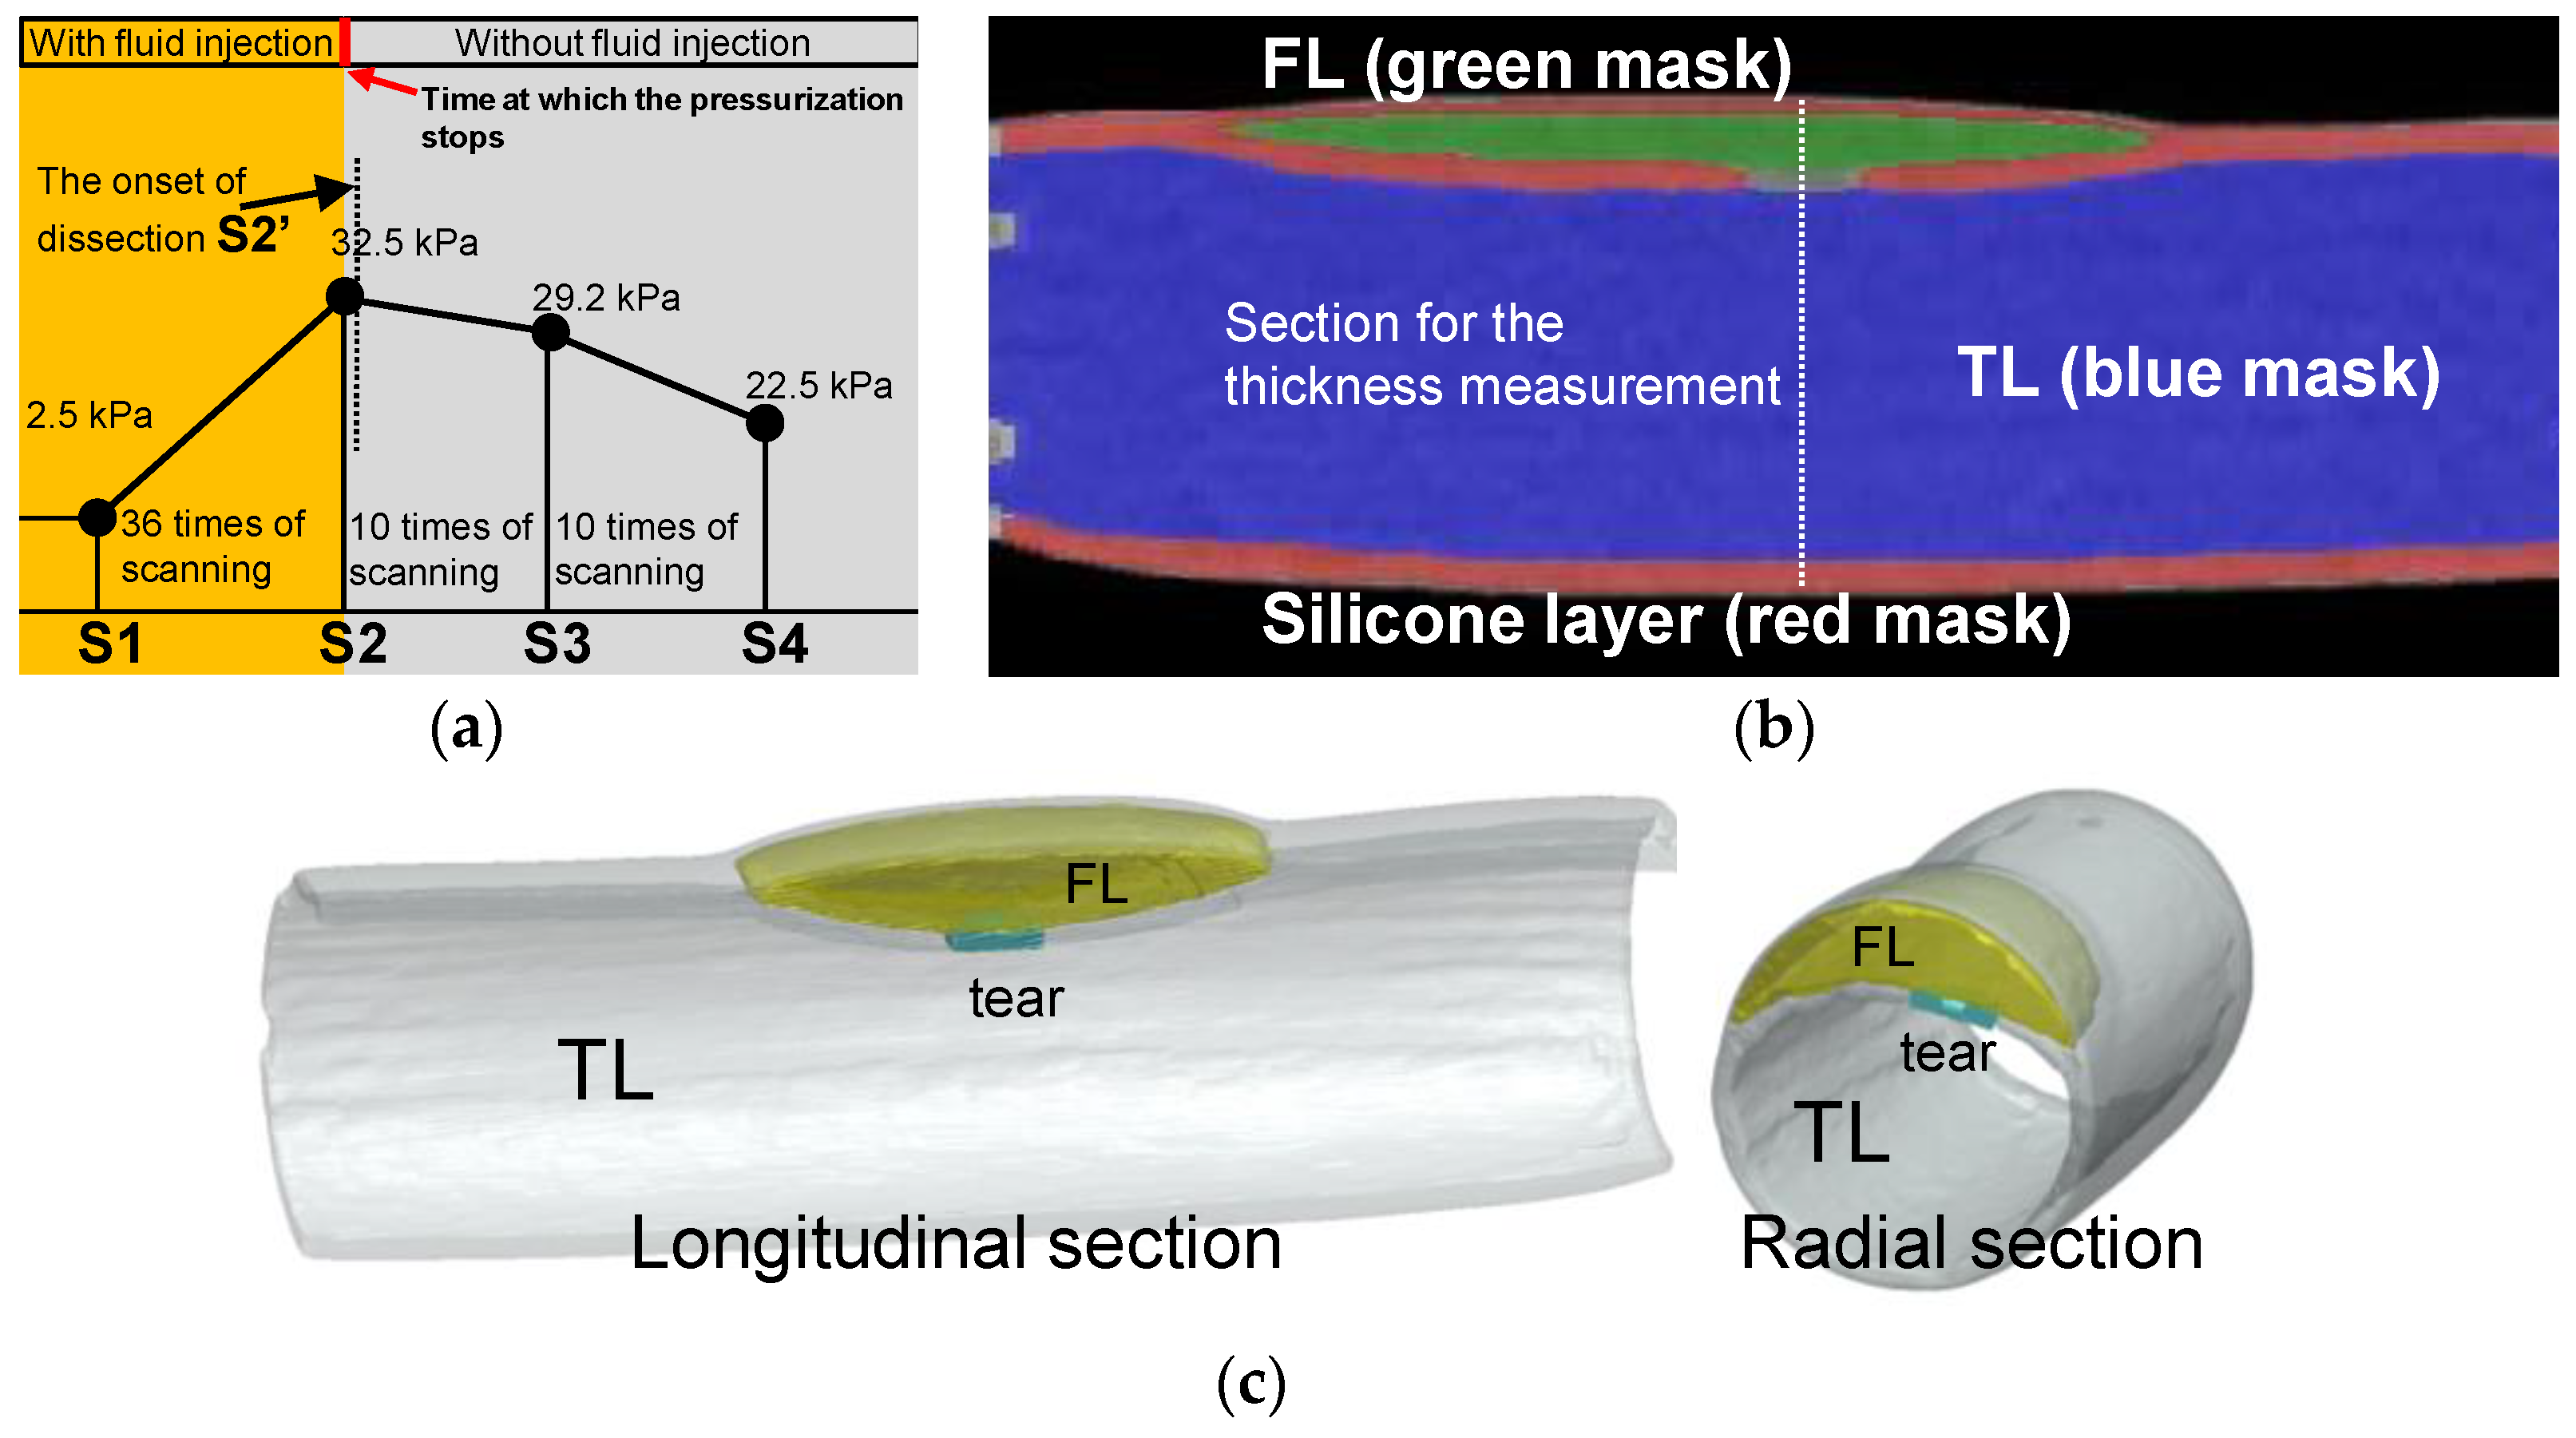
2.4. Experimental Setup of the CT Imaging
3. Results
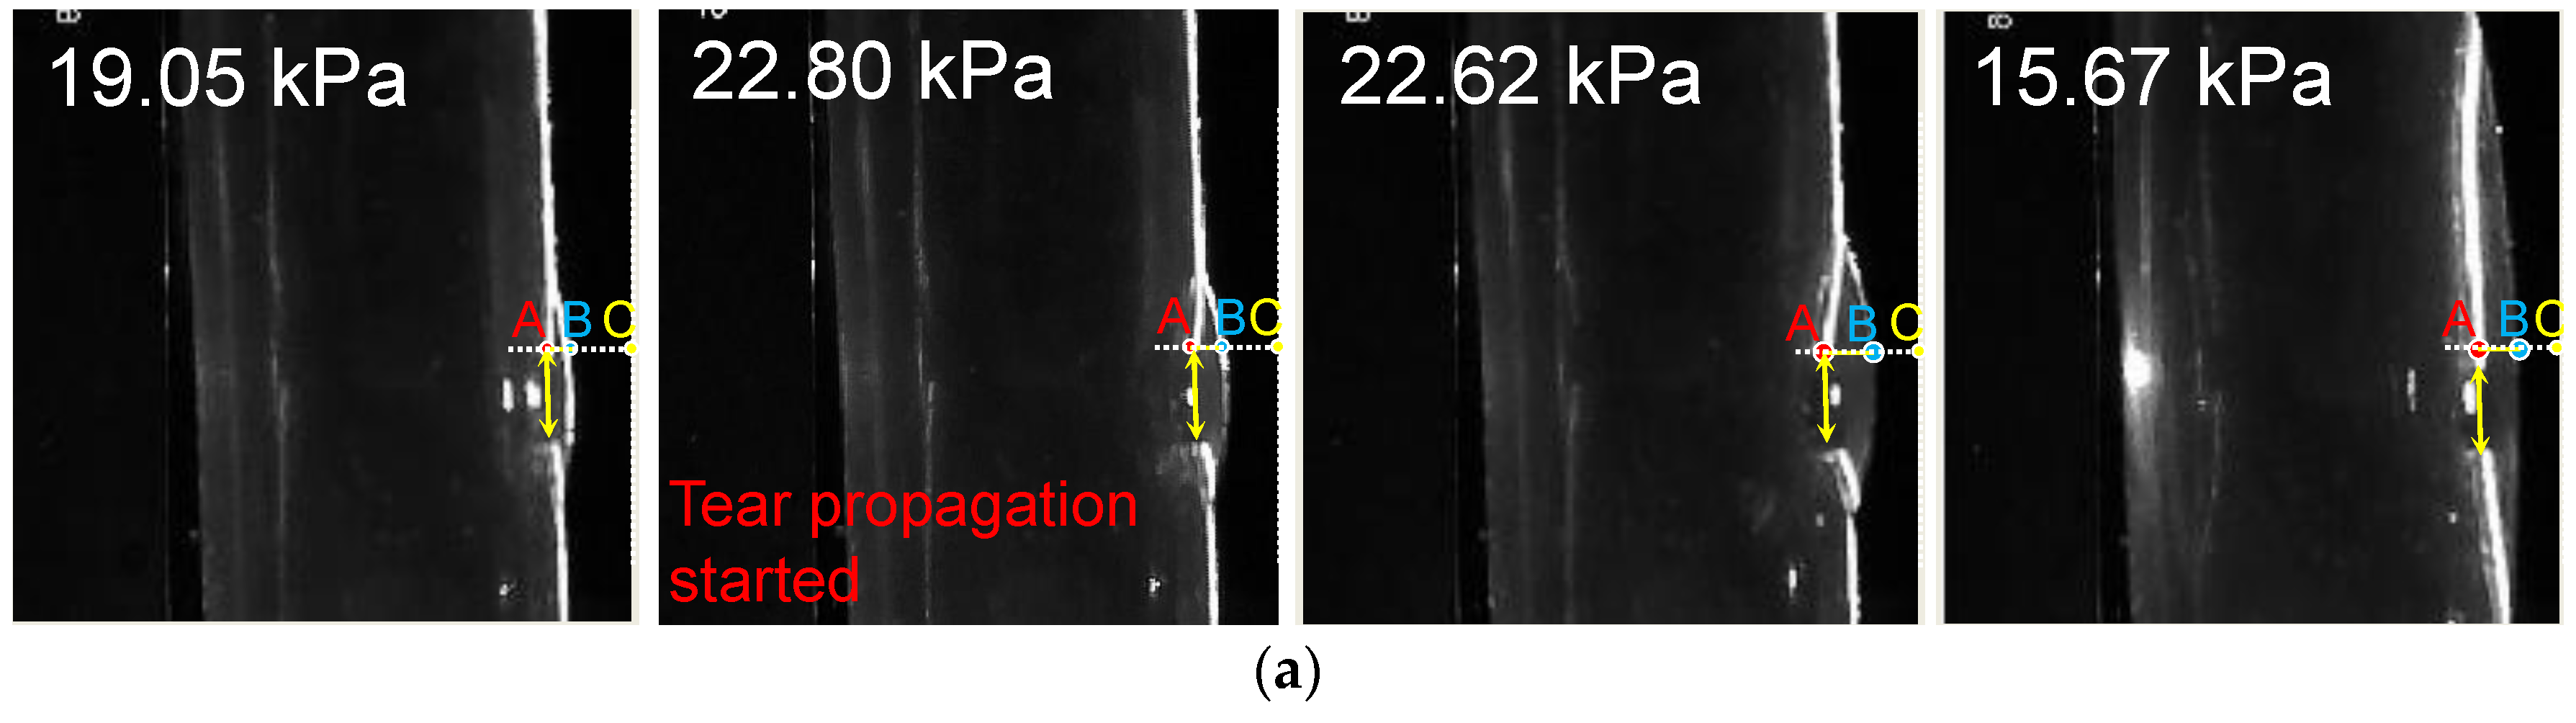
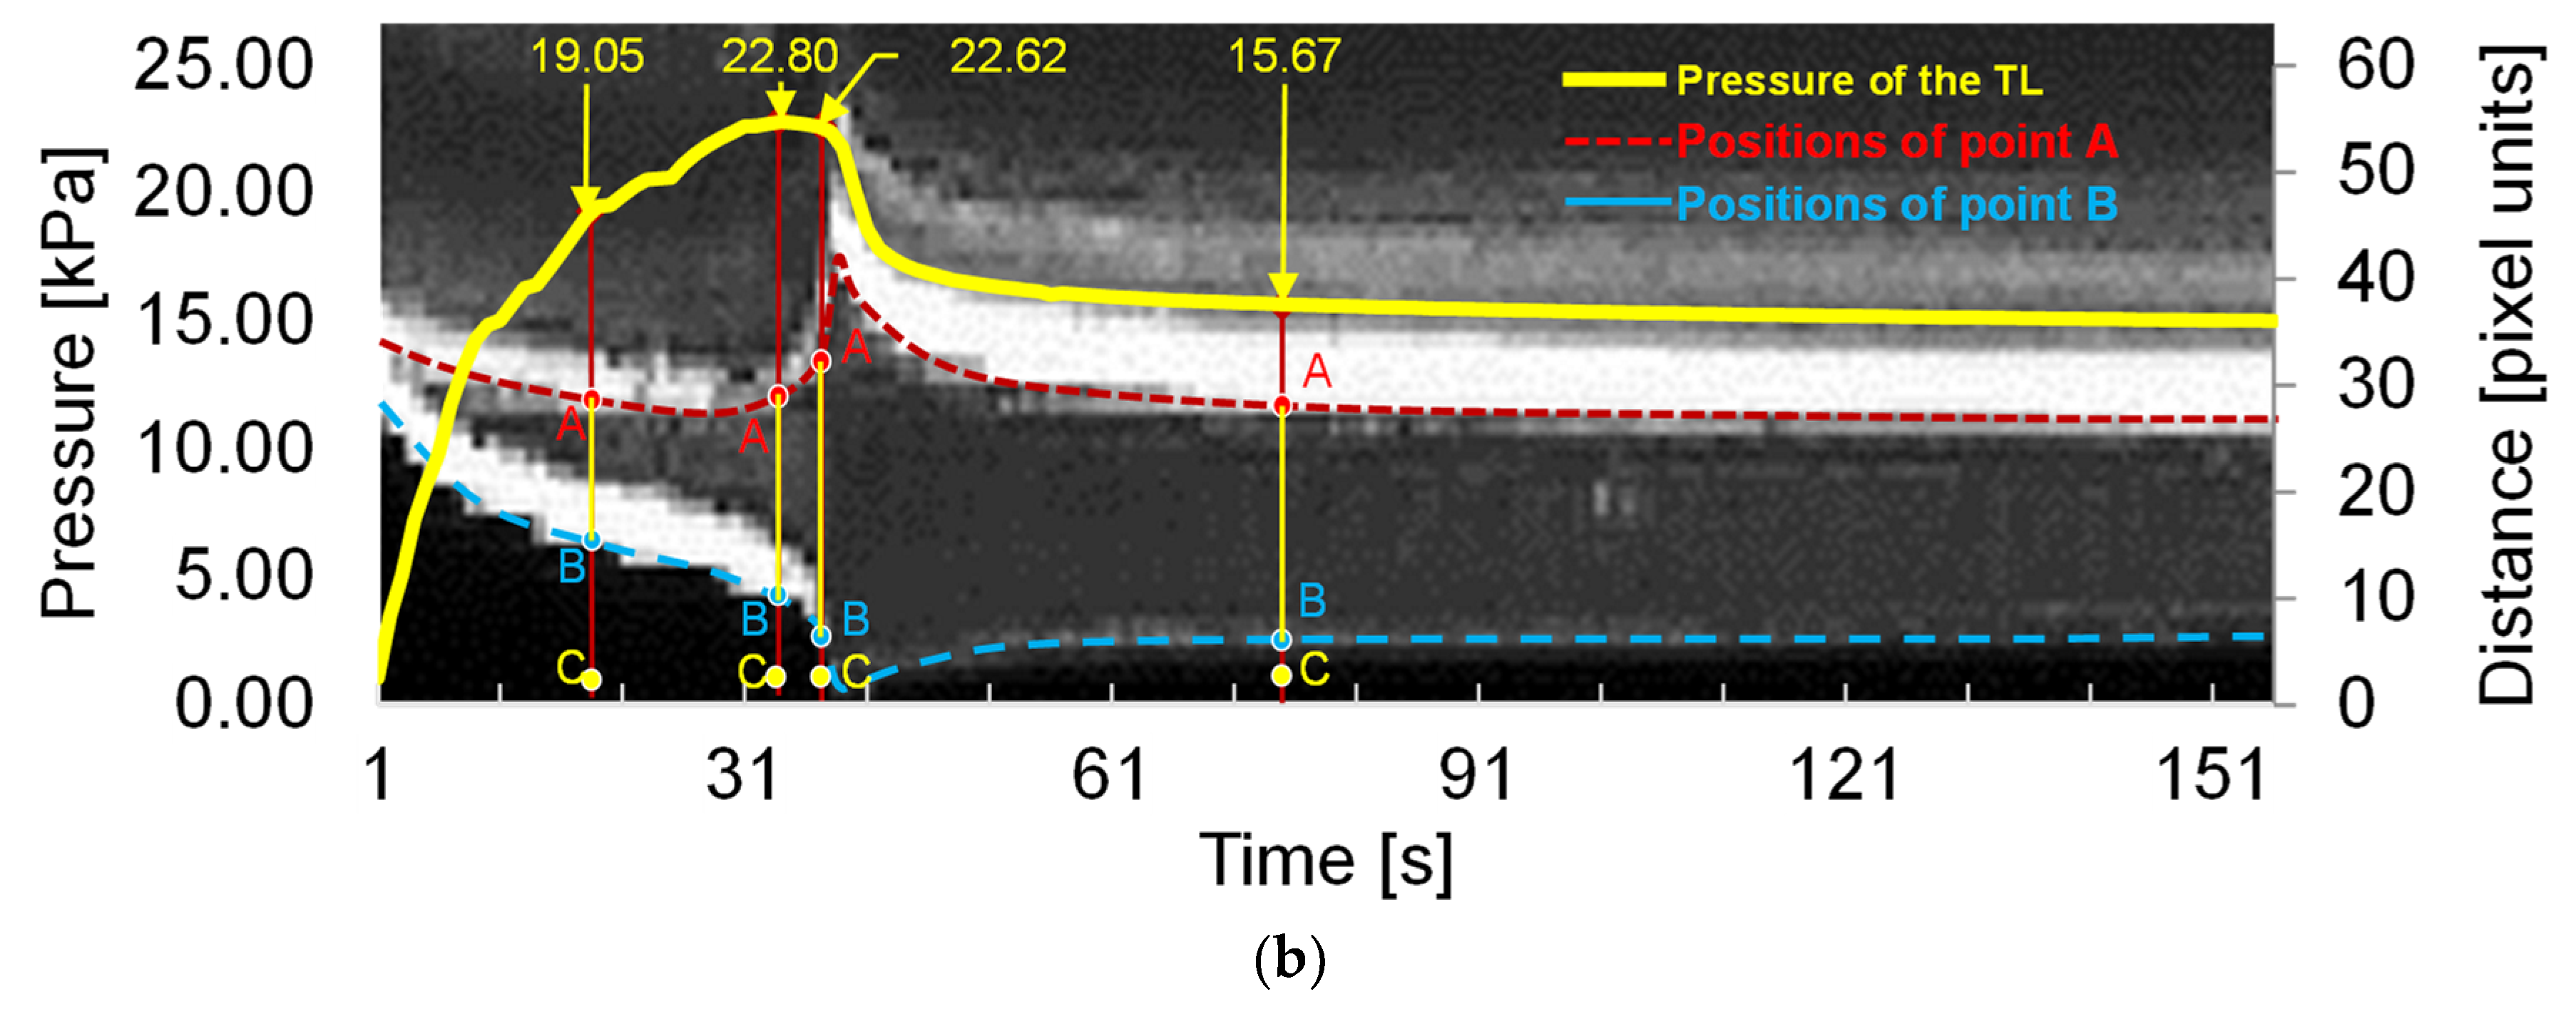
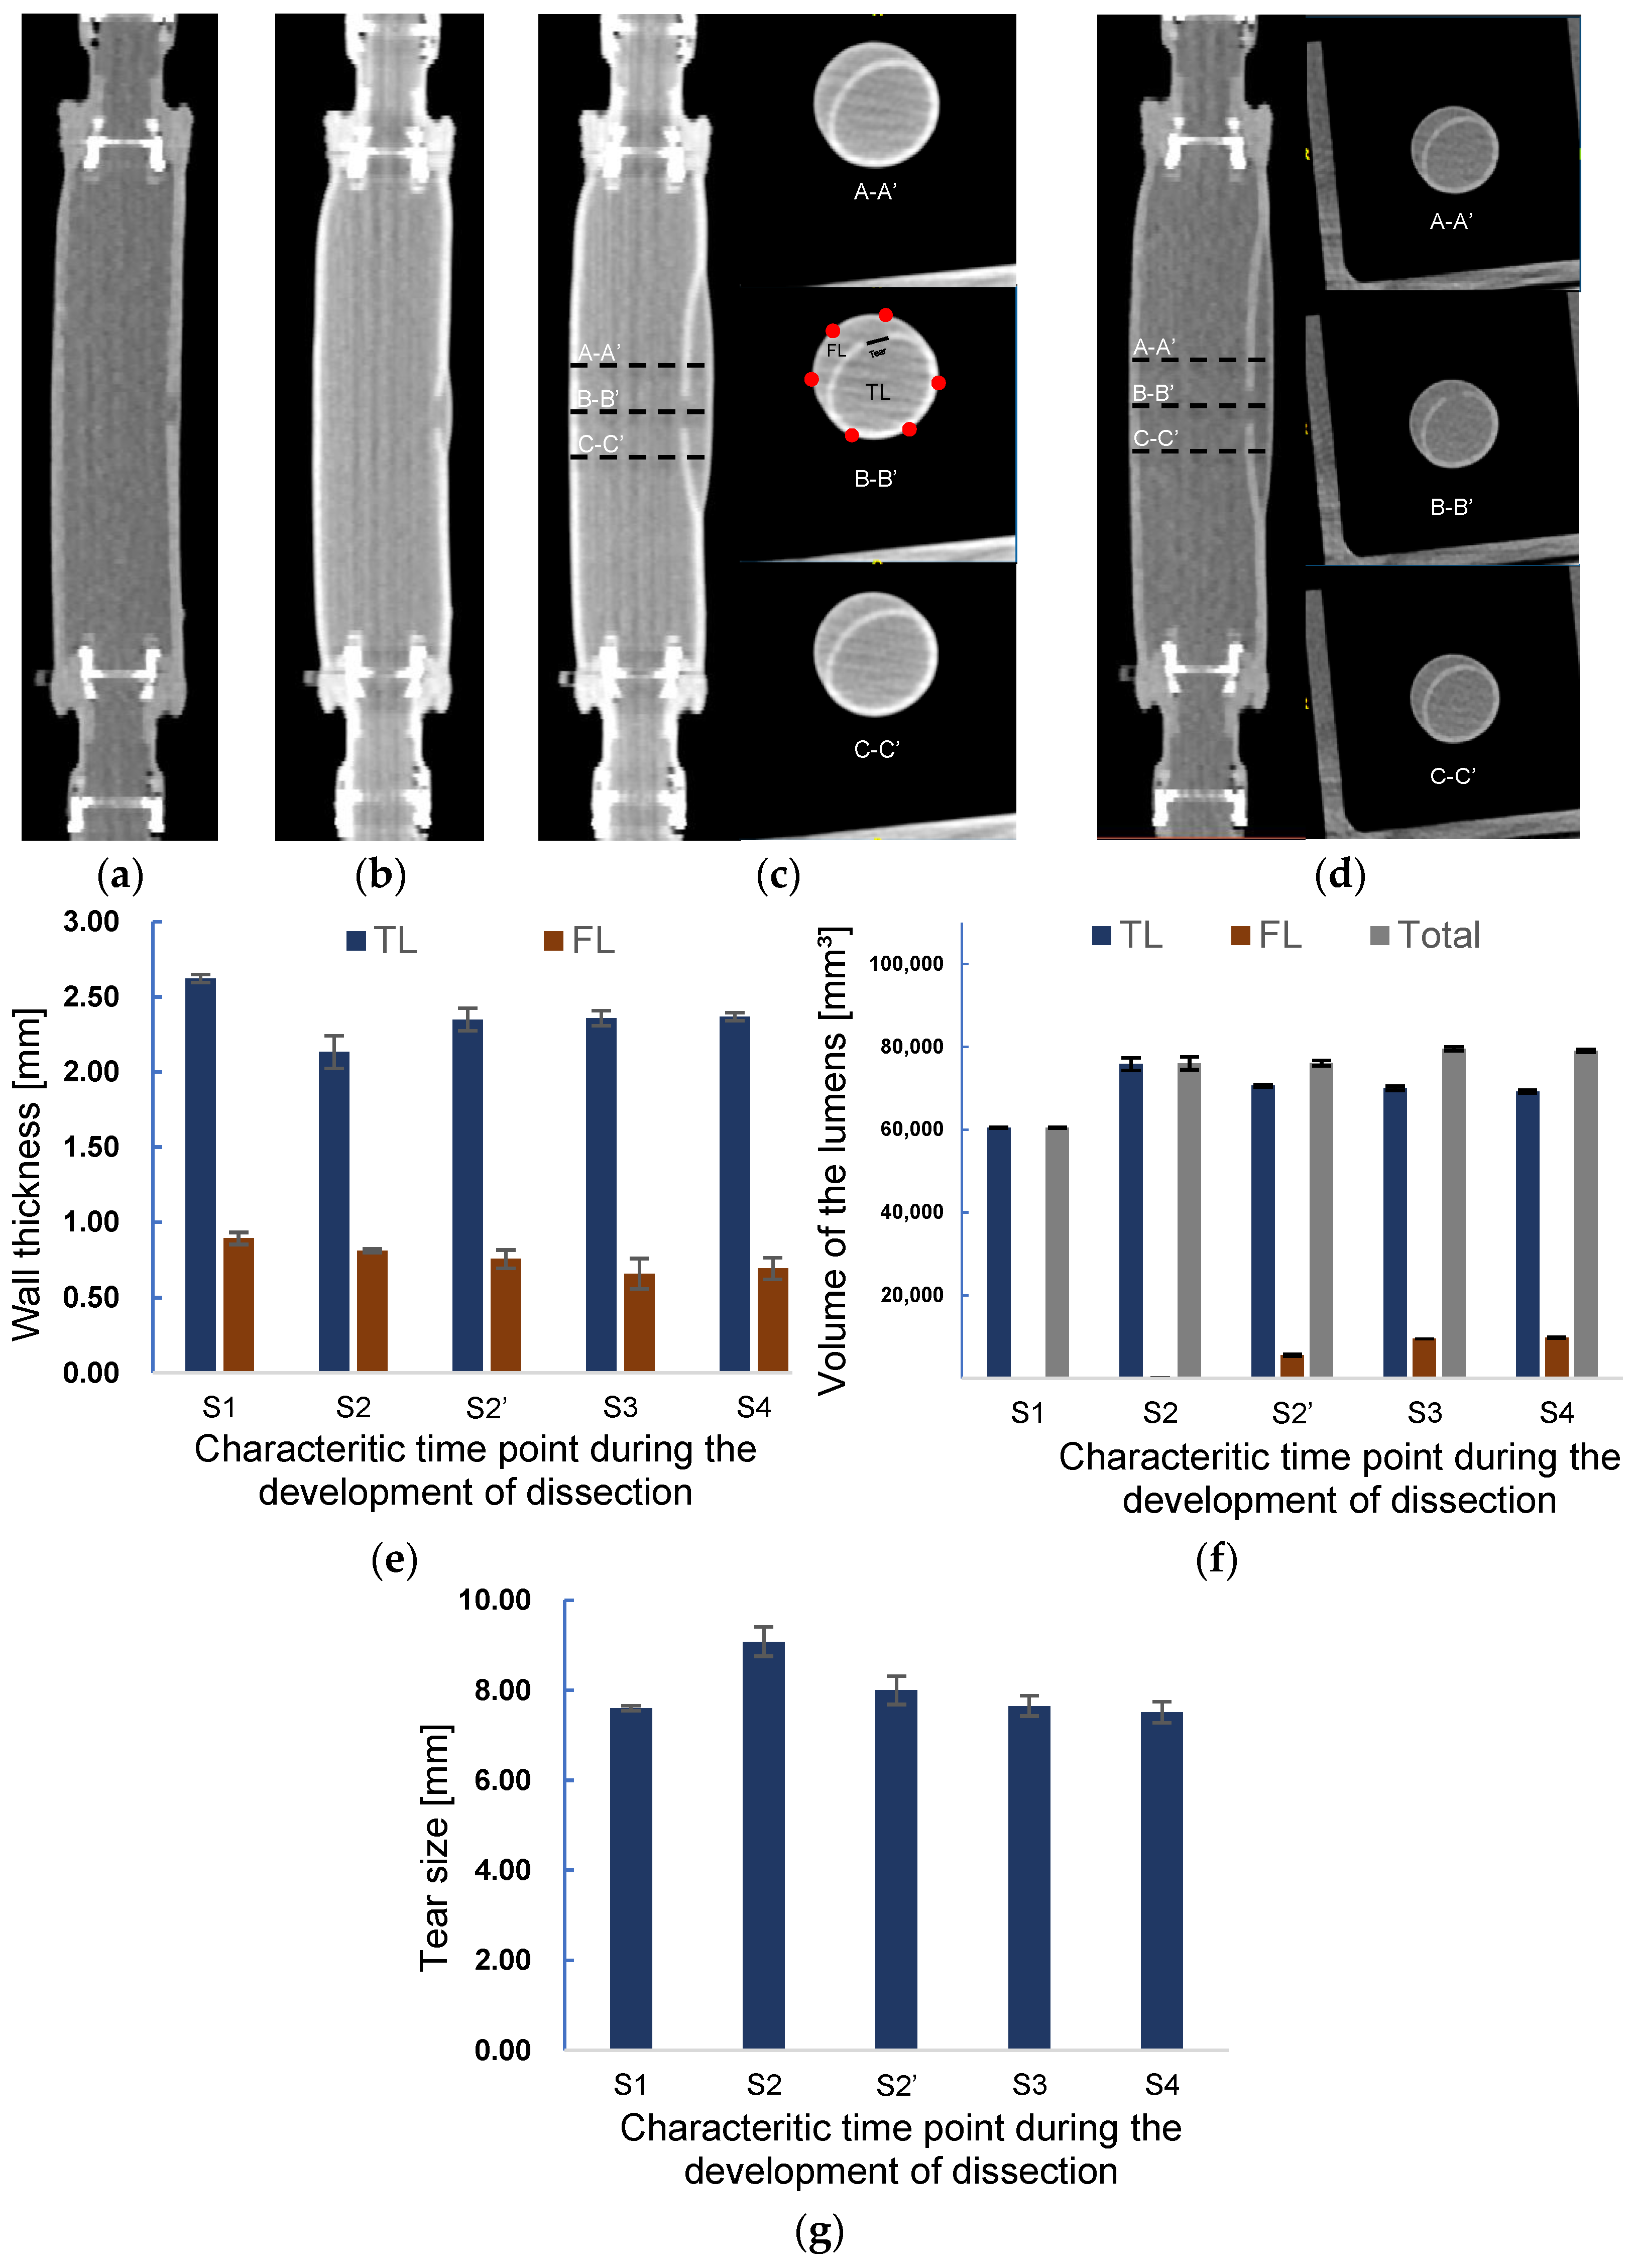
3.1. Deformation of the FL and TL during the Development of Dissection
3.2. Volume and Wall Thickness Variations during the Progress of Dissection
4. Discussion
4.1. Experimental Biomechanical Study for Aortic Dissection
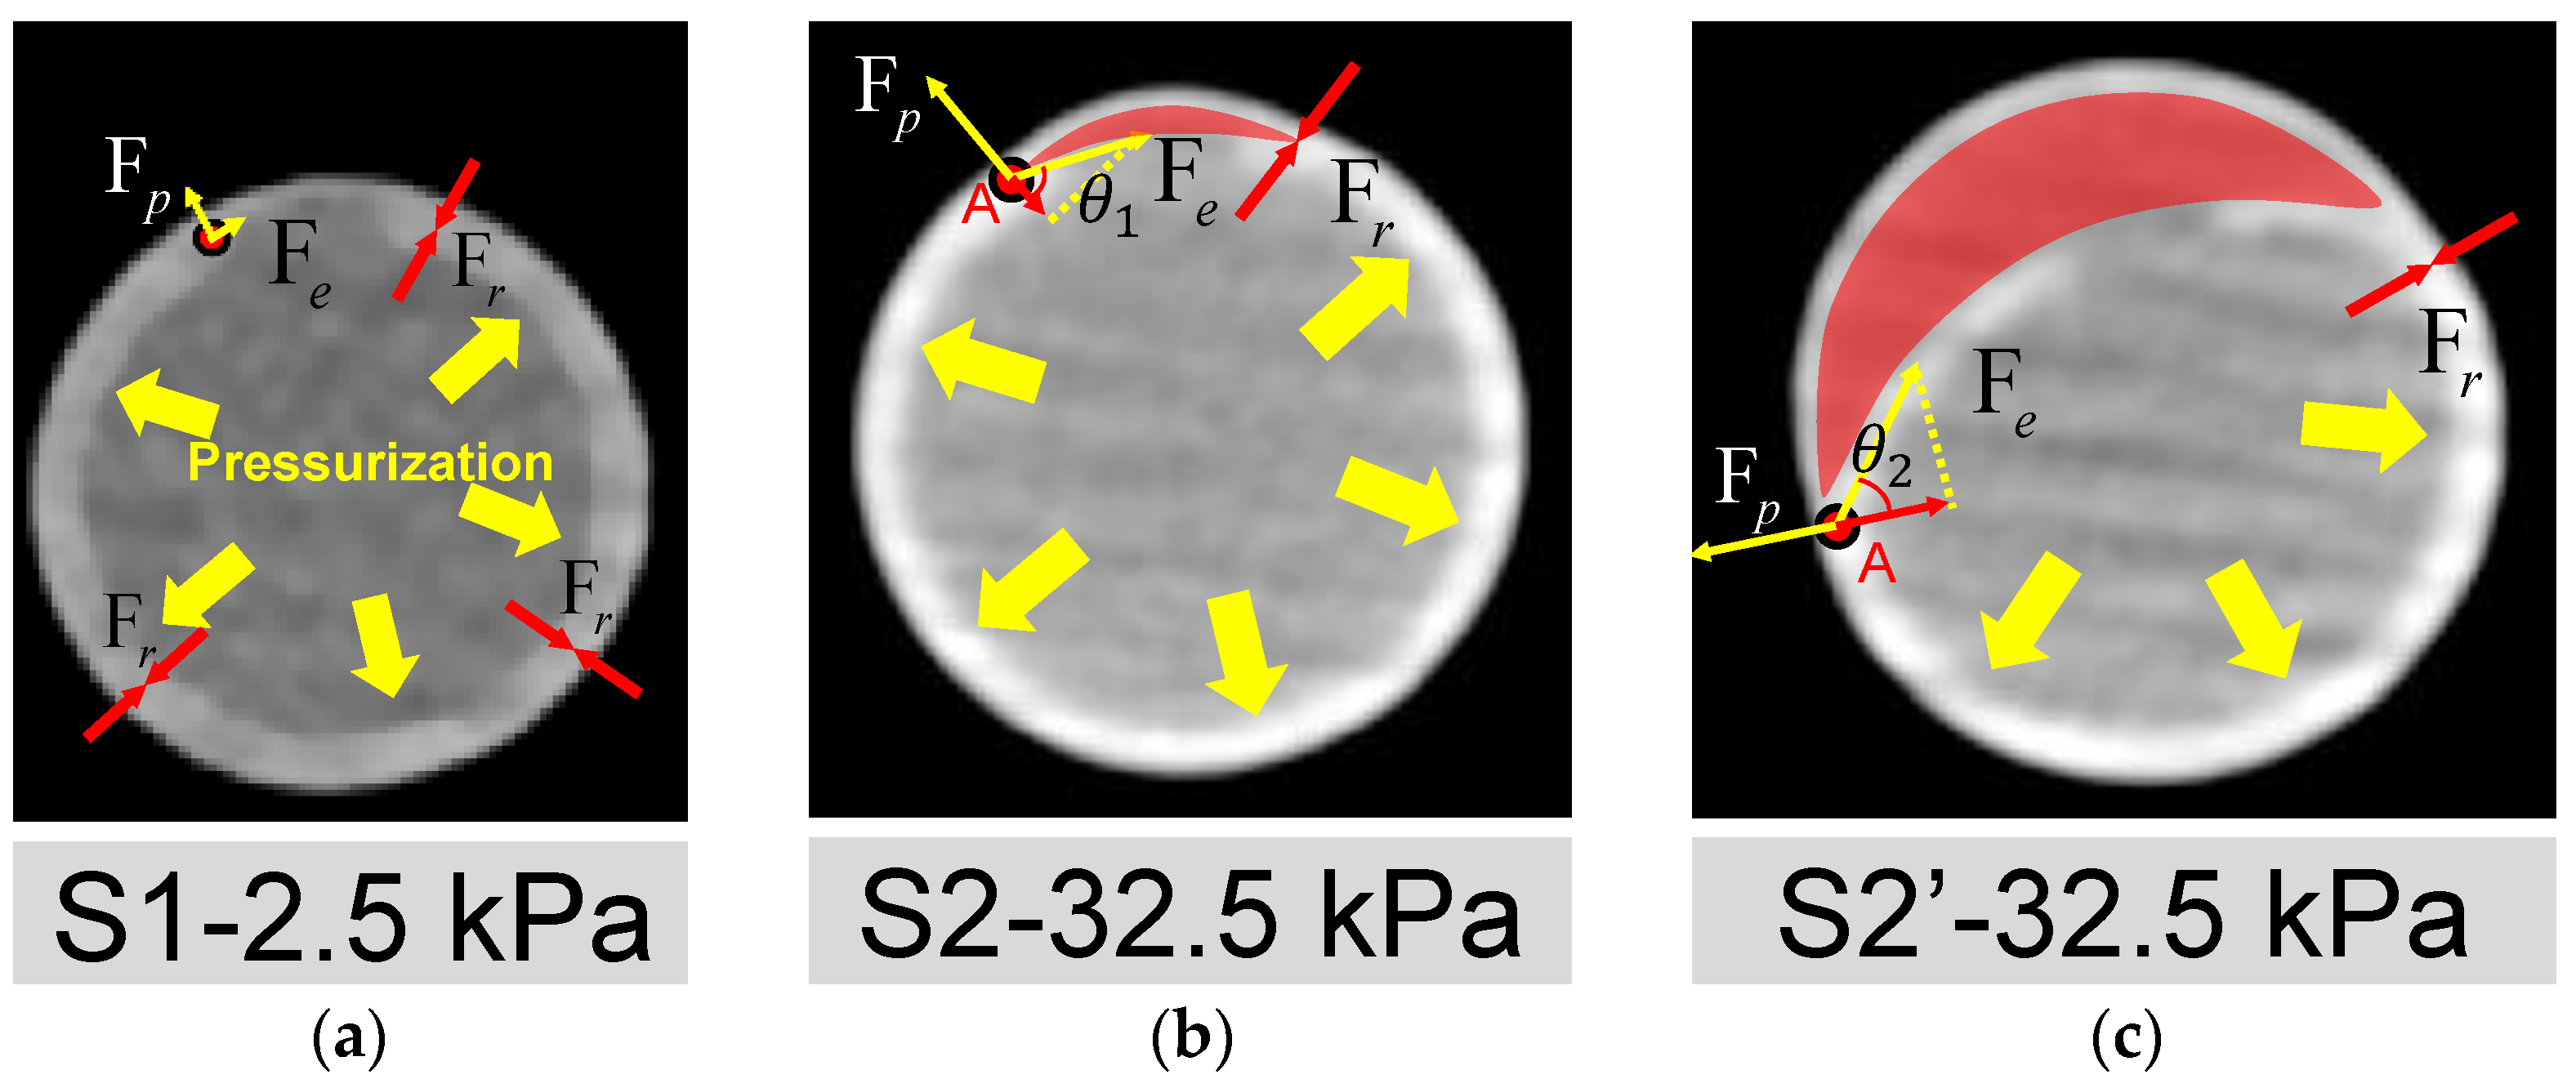
4.2. Analysis of the Forces during the Development of Dissection
4.3. Limitations
5. Conclusions
6. Patents
Author Contributions
Funding
Institutional Review Board Statement
Informed Consent Statement
Data Availability Statement
Conflicts of Interest
References
- Clouse, W.D.; Hallett, J.W., Jr.; Schaff, H.V.; Spittell, P.C.; Rowland, C.M.; Ilstrup, D.M.; Melton, L.J., 3rd. Acute aortic dissection: Population-based incidence compared with degenerative aortic aneurysm rupture. Mayo Clin. Proc. 2004, 79, 176–180. [Google Scholar] [CrossRef] [PubMed]
- Howard, D.P.; Banerjee, A.; Fairhead, J.F.; Perkins, J.; Silver, L.E.; Rothwell, P.M.; Oxford Vascular, S. Population-based study of incidence and outcome of acute aortic dissection and premorbid risk factor control: 10-year results from the Oxford Vascular Study. Circulation 2013, 127, 2031–2037. [Google Scholar] [CrossRef] [PubMed] [Green Version]
- Olsson, C.; Thelin, S.; Stahle, E.; Ekbom, A.; Granath, F. Thoracic aortic aneurysm and dissection: Increasing prevalence and improved outcomes reported in a nationwide population-based study of more than 14,000 cases from 1987 to 2002. Circulation 2006, 114, 2611–2618. [Google Scholar] [CrossRef] [PubMed] [Green Version]
- Harris, K.M.; Braverman, A.C.; Eagle, K.A.; Woznicki, E.M.; Pyeritz, R.E.; Myrmel, T.; Peterson, M.D.; Voehringer, M.; Fattori, R.; Januzzi, J.L.; et al. Acute Aortic Intramural Hematoma An Analysis From the International Registry of Acute Aortic Dissection. Circulation 2012, 126, S91–S96. [Google Scholar] [CrossRef] [PubMed] [Green Version]
- Ganaha, F.; Miller, D.C.; Sugimoto, K.; Do, Y.S.; Minamiguchi, H.; Saito, H.; Mitchell, R.S.; Dake, M.D. Prognosis of aortic intramural hematoma with and without penetrating atherosclerotic ulcer: A clinical and radiological analysis. Circulation 2002, 106, 342–348. [Google Scholar] [CrossRef]
- Evangelista, A.; Mukherjee, D.; Mehta, R.H.; O’Gara, P.T.; Fattori, R.; Cooper, J.V.; Smith, D.E.; Oh, J.K.; Hutchison, S.; Sechtem, U.; et al. Acute intramural hematoma of the aorta: A mystery in evolution. Circulation 2005, 111, 1063–1070. [Google Scholar] [CrossRef] [Green Version]
- Sugawara, J.; Hayashi, K.; Yokoi, T.; Tanaka, H. Age-associated elongation of the ascending aorta in adults. JACC Cardiovasc. Imaging 2008, 1, 739–748. [Google Scholar] [CrossRef] [Green Version]
- Chi, Q.Z.; Chen, H.M.; Mu, L.Z.; He, Y.; Luan, Y. Haemodynamic Analysis of the Relationship between the Morphological Alterations of the Ascending Aorta and the Type A Aortic-Dissection Disease. Fluid Dyn. Mater. Proc. 2021, 17, 721–743. [Google Scholar] [CrossRef]
- Chiu, J.J.; Chien, S. Effects of disturbed flow on vascular endothelium: Pathophysiological basis and clinical perspectives. Physiol. Rev. 2011, 91, 327–387. [Google Scholar] [CrossRef] [Green Version]
- Gimbrone, M.A., Jr.; Garcia-Cardena, G. Endothelial Cell Dysfunction and the Pathobiology of Atherosclerosis. Circ. Res. 2016, 118, 620–636. [Google Scholar] [CrossRef]
- Malek, A.M.; Alper, S.L.; Izumo, S. Hemodynamic shear stress and its role in atherosclerosis. JAMA 1999, 282, 2035–2042. [Google Scholar] [CrossRef]
- Tronc, F.; Mallat, Z.; Lehoux, S.; Wassef, M.; Esposito, B.; Tedgui, A. Role of matrix metalloproteinases in blood flow-induced arterial enlargement: Interaction with NO. Arterioscler. Thromb. Vasc. Biol. 2000, 20, E120–E126. [Google Scholar] [CrossRef]
- Dolan, J.M.; Sim, F.J.; Meng, H.; Kolega, J. Endothelial cells express a unique transcriptional profile under very high wall shear stress known to induce expansive arterial remodeling. Am. J. Physiol. Cell Physiol. 2012, 302, C1109–C1118. [Google Scholar] [CrossRef] [Green Version]
- Guzzardi, D.G.; Barker, A.J.; van Ooij, P.; Malaisrie, S.C.; Puthumana, J.J.; Belke, D.D.; Mewhort, H.E.; Svystonyuk, D.A.; Kang, S.; Verma, S.; et al. Valve-Related Hemodynamics Mediate Human Bicuspid Aortopathy: Insights From Wall Shear Stress Mapping. J. Am. Coll Cardiol. 2015, 66, 892–900. [Google Scholar] [CrossRef] [Green Version]
- Metaxa, E.; Tremmel, M.; Natarajan, S.K.; Xiang, J.; Paluch, R.A.; Mandelbaum, M.; Siddiqui, A.H.; Kolega, J.; Mocco, J.; Meng, H. Characterization of Critical Hemodynamics Contributing to Aneurysmal Remodeling at the Basilar Terminus in a Rabbit Model. Stroke 2010, 41, 1774–1782. [Google Scholar] [CrossRef] [Green Version]
- Hayashi, K.; Makino, A.; Kakoi, D. Remodeling of arterial wall: Response to changes in both blood flow and blood pressure. J. Mech. Behav. Biomed. Mater. 2018, 77, 475–484. [Google Scholar] [CrossRef]
- Sehgel, N.L.; Sun, Z.; Hong, Z.; Hunter, W.C.; Hill, M.A.; Vatner, D.E.; Vatner, S.F.; Meininger, G.A. Augmented vascular smooth muscle cell stiffness and adhesion when hypertension is superimposed on aging. Hypertension 2015, 65, 370–377. [Google Scholar] [CrossRef] [Green Version]
- Angouras, D.; Sokolis, D.P.; Dosios, T.; Kostomitsopoulos, N.; Boudoulas, H.; Skalkeas, G.; Karayannacos, P.E. Effect of impaired vasa vasorum flow on the structure and mechanics of the thoracic aorta: Implications for the pathogenesis of aortic dissection. Eur. J. Cardiothorac. Surg. 2000, 17, 468–473. [Google Scholar] [CrossRef] [Green Version]
- Osada, H.; Kyogoku, M.; Ishidou, M.; Morishima, M.; Nakajima, H. Aortic dissection in the outer third of the media: What is the role of the vasa vasorum in the triggering process? Eur. J. Cardiothorac. Surg. 2013, 43, e82–e88. [Google Scholar] [CrossRef] [Green Version]
- Carson, M.W.; Roach, M.R. The strength of the aortic media and its role in the propagation of aortic dissection. J. Biomech. 1990, 23, 579–588. [Google Scholar] [CrossRef]
- Tiessen, I.M.; Roach, M.R. Factors in the initiation and propagation of aortic dissections in human autopsy aortas. J. Biomech. Eng. 1993, 115, 123–125. [Google Scholar] [CrossRef] [PubMed]
- Tam, A.S.M.; Sapp, M.C.; Roach, M.R. The effect of tear depth on the propagation of aortic dissections in isolated porcine thoracic aorta. J. Biomech. 1998, 31, 673–676. [Google Scholar] [CrossRef] [PubMed]
- Tang, J.; Wang, Y.; Hang, W.; Fu, W.; Jing, Z. Controllable and uncontrollable Stanford type B aortic dissection in canine models. Eur. Surg. Res. 2010, 44, 179–184. [Google Scholar] [CrossRef] [PubMed]
- Wang, L.X.; Wang, Y.Q.; Guo, D.Q.; Jiang, J.H.; Zhang, J.; Cui, J.S.; Fu, W.G. An experimental model of Stanford type B aortic dissection with intravenous epinephrine injection. Kaohsiung J. Med. Sci. 2013, 29, 194–199. [Google Scholar] [CrossRef] [Green Version]
- Guo, B.; Dong, Z.; Pirola, S.; Liu, Y.; Menichini, C.; Xu, X.Y.; Guo, D.; Fu, W. Dissection level within aortic wall layers is associated with propagation of type B aortic dissection: A swine model study. Eur. J. Vasc. Endovasc. Surg. 2019, 58, 415–425. [Google Scholar] [CrossRef]
- Rudenick, P.A.; Bijnens, B.H.; Garcia-Dorado, D.; Evangelista, A. An in vitro phantom study on the influence of tear size and configuration on the hemodynamics of the lumina in chronic type B aortic dissections. J. Vasc. Surg. 2013, 57, 464–474.e465. [Google Scholar] [CrossRef] [Green Version]
- Soudah, E.; Rudenick, P.; Bordone, M.; Bijnens, B.; Garcia-Dorado, D.; Evangelista, A.; Onate, E. Validation of numerical flow simulations against in vitro phantom measurements in different type B aortic dissection scenarios. Comput. Methods Biomech. Biomed. Eng. 2015, 18, 805–815. [Google Scholar] [CrossRef] [Green Version]
- Birjiniuk, J.; Timmins, L.H.; Young, M.; Leshnower, B.G.; Oshinski, J.N.; Ku, D.N.; Veeraswamy, R.K. Pulsatile Flow Leads to Intimal Flap Motion and Flow Reversal in an In Vitro Model of Type B Aortic Dissection. Cardiovasc. Eng. Technol. 2017, 8, 378–389. [Google Scholar] [CrossRef]
- Birjiniuk, J.; Veeraswamy, R.K.; Oshinski, J.N.; Ku, D.N. Intermediate fenestrations reduce flow reversal in a silicone model of Stanford Type B aortic dissection. J. Biomech. 2019, 93, 101–110. [Google Scholar] [CrossRef]
- Brunet, J.; Pierrat, B.; Adrien, J.; Maire, E.; Curt, N.; Badel, P. A Novel Method for In Vitro 3D Imaging of Dissecting Pressurized Arterial Segments Using X-Ray Microtomography. Exp. Mech. 2021, 61, 147–157. [Google Scholar] [CrossRef]
- Mikich, B. Dissection of the aorta: A new approach. Heart 2003, 89, 6–8. [Google Scholar] [CrossRef]
- Qiao, A.K.; Li, X.Y.; Zhang, H.J. Mechanism of the initiation, propagation and treatment of aortic dissection. J. Beijing Univ. Technol. 2007, 33, 959–963. [Google Scholar]
- Shiraishi, Y.; Yambe, T.; Narracott, A.J.; Yamada, A.; Morita, R.; Qian, Y.; Hanzawa, K. Modeling Approach for An Aortic Dissection with Endovascular Stenting. Annu. Int. Conf. IEEE Eng. Med. Biol. Soc. 2020, 2020, 5008–5011. [Google Scholar] [CrossRef]
- Marconi, S.; Lanzarone, E.; De Beaufort, H.; Conti, M.; Trimarchi, S.; Auricchio, F. A novel insight into the role of entry tears in type B aortic dissection: Pressure measurements in an in vitro model. Int. J. Artif. Organs 2017, 40, 563–574. [Google Scholar] [CrossRef]
- Chi, Q.Z.; Mu, L.Z.; He, Y.; Luan, Y.; Jing, Y.C. A brush–spin–coating method for fabricating in vitro patient-specific vascular models by coupling 3D-printing. Cardiovasc. Eng. Technol. 2021, 12, 200–214. [Google Scholar] [CrossRef]
- Roccabianca, S.; Figueroa, C.A.; Tellides, G.; Humphrey, J.D. Quantification of regional differences in aortic stiffness in the aging human. J. Mech. Behav. Biomed. Mater 2014, 29, 618–634. [Google Scholar] [CrossRef] [Green Version]
- De Beaufort, H.W.L.; Ferrara, A.; Conti, M.; Moll, F.L.; van Herwaarden, J.A.; Figueroa, C.A.; Bismuth, J.; Auricchio, F.; Trimarchi, S. Comparative Analysis of Porcine and Human Thoracic Aortic Stiffness. Eur. J. Vasc. Endovasc. Surg. 2018, 55, 560–566. [Google Scholar] [CrossRef] [Green Version]
- Sherifova, S.; Holzapfel, G.A. Biomechanics of aortic wall failure with a focus on dissection and aneurysm: A review. Acta Biomater. 2019, 99, 1–17. [Google Scholar] [CrossRef]
- Dimitrios, C.I.; Rejar, P.D.; Eleftherios, P.K.; Despina, P.; George, D.S.; Konstantinos, T.; Christodoulos, S.; Dimitrios, P.S. Regional and directional variations in the mechanical properties of ascending thoracic aortic aneurysms. Med. Eng. Phys. 2009, 31, 1–9. [Google Scholar] [CrossRef]
- Iliopoulos, D.C.; Kritharis, E.P.; Giagini, A.T.; Papadodima, S.A.; Sokolis, D.P. Ascending thoracic aortic aneurysms are associated with compositional remodeling and vessel stiffening but not weakening in age-matched subjects. J. Thorac. Cardiovasc. Surg. 2009, 137, 101–109. [Google Scholar] [CrossRef] [Green Version]
- Manopoulos, C.; Karathanasis, I.; Kouerinis, I.; Angouras, D.C.; Lazaris, A.; Tsangaris, S.; Sokolis, D.P. Identification of regional/layer differences in failure properties and thickness as important biomechanical factors responsible for the initiation of aortic dissections. J. Biomech. 2018, 80, 102–110. [Google Scholar] [CrossRef] [PubMed]
- Sugita, S.; Matsumoto, T.; Ohashi, T.; Kumagai, K.; Akimoto, H.; Tabayashi, K.; Sato, M. Evaluation of Rupture Properties of Thoracic Aortic Aneurysms in a Pressure-Imposed Test for Rupture Risk Estimation. Cardiovasc. Eng. Technol. 2011, 3, 41–51. [Google Scholar] [CrossRef]
- Kim, J.H.; Avril, S.; Duprey, A.; Favre, J.P. Experimental characterization of rupture in human aortic aneurysms using a full-field measurement technique. Biomech. Model Mechanobiol. 2012, 11, 841–853. [Google Scholar] [CrossRef] [PubMed]
- Pearson, R.; Philips, N.; Hancock, R.; Hashim, S.; Field, M.; Richens, D.; McNally, D. Regional wall mechanics and blunt traumatic aortic rupture at the isthmus. Eur. J. Cardiothorac. Surg. 2008, 34, 616–622. [Google Scholar] [CrossRef] [Green Version]
- Karmonik, C.; Duran, C.; Shah, D.J.; Anaya-Ayala, J.E.; Davies, M.G.; Lumsden, A.B.; Bismuth, J. Preliminary findings in quantification of changes in septal motion during follow-up of type B aortic dissections. J. Vasc. Surg. 2012, 55, 1419–1426.e1411. [Google Scholar] [CrossRef] [Green Version]
- Rolf-Pissarczyk, M.; Li, K.W.; Fleischmann, D.; Holzapfel, G.A. A discrete approach for modeling degraded elastic fibers in aortic dissection. Comput. Method Appl. M 2021, 373, 113511. [Google Scholar] [CrossRef]
- Li, Y.; Zhang, N.; Xu, S.; Fan, Z.; Zhu, J.; Huang, L.; Chen, D.; Sun, Z.; Sun, L. Acute type A aortic intramural hematoma and type A aortic dissection: Correlation between the intimal tear features and pathogenesis. Quant. Imaging Med. Surgery 2020, 10, 1504–1514. [Google Scholar] [CrossRef]
- Kitai, T.; Kaji, S.; Yamamuro, A.; Tani, T.; Kinoshita, M.; Ehara, N.; Kobori, A.; Kim, K.; Kita, T.; Furukawa, Y. Detection of intimal defect by 64-row multidetector computed tomography in patients with acute aortic intramural hematoma. Circulation 2011, 124, 174–178. [Google Scholar] [CrossRef] [Green Version]
- Chi, Q.; He, Y.; Luan, Y.; Qin, K.; Mu, L. Numerical analysis of wall shear stress in ascending aorta before tearing in type A aortic dissection. Comp. Biol. Med. 2017, 89, 236–247. [Google Scholar] [CrossRef]


Publisher’s Note: MDPI stays neutral with regard to jurisdictional claims in published maps and institutional affiliations. |
© 2022 by the authors. Licensee MDPI, Basel, Switzerland. This article is an open access article distributed under the terms and conditions of the Creative Commons Attribution (CC BY) license (https://creativecommons.org/licenses/by/4.0/).
Share and Cite
Chi, Q.-Z.; Ge, Y.-Y.; Cao, Z.; Long, L.-L.; Mu, L.-Z.; He, Y.; Luan, Y. Experimental Study of the Propagation Process of Dissection Using an Aortic Silicone Phantom. J. Funct. Biomater. 2022, 13, 290. https://doi.org/10.3390/jfb13040290
Chi Q-Z, Ge Y-Y, Cao Z, Long L-L, Mu L-Z, He Y, Luan Y. Experimental Study of the Propagation Process of Dissection Using an Aortic Silicone Phantom. Journal of Functional Biomaterials. 2022; 13(4):290. https://doi.org/10.3390/jfb13040290
Chicago/Turabian StyleChi, Qing-Zhuo, Yang-Yang Ge, Zhen Cao, Li-Li Long, Li-Zhong Mu, Ying He, and Yong Luan. 2022. "Experimental Study of the Propagation Process of Dissection Using an Aortic Silicone Phantom" Journal of Functional Biomaterials 13, no. 4: 290. https://doi.org/10.3390/jfb13040290