

Smart Machine Health Prediction Based on Machine Learning in Industry Environment
by
 , and
, and
Sagar Yeruva
1,
Jeshmitha Gunuganti
2,
Sravani Kalva
2,
Surender Reddy Salkuti
3,* and
Seong-Cheol Kim
3 1
Department of CSE (AIML and IoT), VNR Vignana Jyothi Institute of Engineering and Technology, Hyderabad 500090, India
2
Department of CSE, VNR Vignana Jyothi Institute of Engineering and Technology, Hyderabad 500090, India
3
Department of Railroad and Electrical Engineering, Woosong University, Daejeon 34606, Republic of Korea
*
Author to whom correspondence should be addressed.
Information 2023, 14(3), 181; https://doi.org/10.3390/info14030181
Submission received: 10 February 2023
/
Revised: 6 March 2023
/
Accepted: 9 March 2023
/
Published: 14 March 2023
(This article belongs to the Special Issue Health Data Information Retrieval)
Abstract
:In an industrial setting, consistent production and machine maintenance might help any company become successful. Machine health checking is a method of observing the status of a machine to predict mechanical mileage and predict the machine’s disappointment. The most often utilized traditional approaches are reactive and preventive maintenance. These approaches are unreliable and wasteful in terms of time and resource utilization. The use of system health management in conjunction with a predictive maintenance strategy allows for the scheduling of maintenance times in such a way that device malfunction is avoided, and thus the repercussions are avoided. IoT can help monitor equipment health and provide the best outcomes, especially in an industrial setting. Internet of Things (IoT) and machine learning models are quite successful in providing ongoing knowledge and comprehensive study on infrastructure performance. Our suggested technique uses a mobile application that seeks to anticipate the machine’s health status using a classification method utilizing IoT and machine learning technologies, which might benefit the industry environment by alerting the appropriate maintenance team before inflicting significant harm to the system and disrupting normal operations. A comparison of decision tree, XGBoost, SVM, and KNN performance has been carried out. According to our findings, XGBoost achieves higher classification accuracy compared to the other algorithms. As a result, this model is selected for creating a user-based application that allows the user to easily check the state of the machine’s health.
1. Introduction
To avoid equipment failure, it is important to forecast system failure ahead of time. The importance of a well-functioning maintenance system cannot be overstated because it is critical to lean manufacturing [1]. Many businesses and organizations nowadays rely on sophisticated and advanced technology. Using naïve approaches might result in massive economic, human, and productivity losses. If the organization’s methods for dealing with equipment failure are inadequate, the cost of failure might be excessive [2]. As a result, a company must pick a superior approach to help them overcome these dangers. Traditional equipment maintenance approaches such as reactive and preventative maintenance are still in use. Repairing equipment after it has failed is referred to as reactive maintenance [3]. Periodic inspections are performed while the equipment is still operational as part of preventive maintenance [4]. However, this is not the best strategy because the equipment is maintained even when it isn’t needed. However, these methods need human interaction and equipment monitoring from afar.
Thus, predictive maintenance [5] involving real-time streaming of data and predictions using enhanced algorithms requiring minimal human efforts is the finest choice for any organization to opt. We aim to develop smart machine health prediction using machine learning techniques thereby minimizing conventional ineffective practices.
The exploration of the Internet of Things (IoT) and machine learning models /methods brings more convenient methods for easier computation that could reduce the chances of failures in the industry environment [6]. In this study, using machine learning and signal processing, an acoustic-based predictive model is developed that makes use of sound delivered by the machine to understand the condition of the machine and predicts future failures which help industries in handling the risk of failure before it becomes a serious concern. The acoustic signal is converted into mathematical numbers that the computer or a machine learning model can comprehend and analyze to draw inferences about the machine’s health state using signal processing techniques. Thus, the generated model is capable of analyzing sound signals and anticipating concealed oncoming machine faults thanks to this amazing mix of signal processing and machine learning. Then, using principal component study and a comparative analysis of algorithms/methods such as decision tree, extreme gradient boosting (XGBoost), support vector machine (SVM), and K-nearest neighbor (KNN), the optimal model is picked (PCA). This model is being used to create an android application that captures the machine’s noises and anticipates abnormalities using classification method.
1.1. Challenges of Conventional Machine Monitoring
The traditional process of machine monitoring includes operational costs (staff training for data analysis), installation process, and regular maintenance activity chart. This monitoring activity may include human faults and leads to wrong prediction.
1.2. Advantages of Prognostics and Systems Health Management (PHM)
The proposed model of prediction gives many advantage aspects including better efficiency and durability of machines with reduced maintenance cost. This process reduces handling risks as this is completely an automated process and prediction. This supports an advanced protection and gives good perception of the entire organization systems and helps in strengthening the customer relationships.
The rest of this paper is organized as follows: Section 2 presents the related work. Section 3 presents the proposed solution and usage of various machine learning algorithms. This section also includes the system architecture, experimental setup, and the availability of dataset for carrying the experimentation process. Section 4 includes result and discussion and finally Section 5 presents the concluding remarks.
2. Related Work
This section presents the related work on the problem and various attempts by research community toward the attainment of the solution to the problem throughout the globe. This could help to find the best solution to the existing problem. This section also includes design methodology, algorithms usage, and experimental setup.
Daeil Kwon et al. [6], examines the advantages and disadvantages of PHM for industrial usage, with an emphasis on the Internet of Things (IoT). The primary goal of this article is to accelerate the development of PHM based on IoT since IoT offers a flexible and accessible framework. Human resources continue to be a key barrier in building, verifying, and maintaining the models necessary for prognostics, as shown by numerous examples of businesses successfully implementing IoT-based PHM. The fundamental assumption is that IoT-based PHM will have a significant influence on deployment quality review, analysis, and early detection, as well as the development of new business opportunities. It additionally examines the inaccessibility of real-time datasets as they will empower the advancement of new calculations. Moreover, the greatest concern is regarding the security of information as the IoT stages center around open design where open access stages empower improvement of utilization by third parties. The key premise is that IoT-based PHM will have a significant influence on quality deployment review, analysis, and early detection, as well as the exploitation of new opportunities [7], the authors assess four machine learning algorithms and put them to the test in order to characterize seven common steel plate defects. Multi-layer perceptron neural network (MLPNN), C5.0 decision tree, Bayesian system (BN), and ensemble model are the four machine learning models chosen. When compared to other models, the C5.0 choice tree delivered exceptional results, with 95.56 percent accuracy for the training data and 95.66 percent accuracy for the testing data. Van Tung Tran and other authors [8] mention the use of univariate time series techniques and regression models in this work to offer a methodology for estimating prospective system conditions. The recommended method is carried out by predicting future situations. The peak acceleration and the envelope acceleration are investigated in the low methane compressor condition. This method produced a forecast error of 1.43 percent in peak acceleration and a prediction error of 6% in envelope acceleration. The findings support the hypothesis that the proposed approach technique with one-step-ahead prediction has potential for machine health management. Predictive maintenance (PdM) in Industry 4.0 using machine learning approach [9] presents a machine learning engineering for predictive maintenance. By constructing the information framework inquiry, implementing the machine learning technique, and comparing it with the re-enactment instrument examination, the framework is tested on a real-world industry model. Another PdM technique based on PdM, the AI approach on a cutting machine, is described in this study. The proposed PdM philosophy allows for dynamical choice guidelines to be received for executive upkeep, which is achieved using Azure Machine Learning Studio and a random forest approach. Jimenez-Cortadi et al. [10] presents technique for carrying out information-driven predictive maintenance (PdM) in a dynamic system, which is described in this article. They demonstrated that preventive maintenance (PM) done in a real-time machining process could be converted to a PdM method. A dynamic application was built to provide a visual study of the machining apparatus’s remaining useful life (RUL). This study demonstrates that the technique proposed in one process may be replicated for a significant amount of the procedure for sequential component production. In this paper, we present a method that may be used in this operation, as well as the vast majority of sequential creation procedures.
Machine health monitoring using knowledge-based systems [11] is a study to offer a framework for assessing machine well-being. Machine health monitoring is surveyed using an application based on knowledge-based systems’ artificial intelligence (AI) approach. The framework’s outputs are tested for passable characteristics using vibration standards and found to be worthy. The present framework is designed for disconnected situations in which the client physically transports machine vibration data to the information framework. Yan et al. [12] covers the development of a machine health management system that uses the machine’s vibration and temperature as metrics for monitoring the machine’s health condition. putting your health to the test the entire approach for improving the computer health monitoring system is described in this article. The assumption is that the most intense permitted vibration measurements are in the ranges of 0–20 Hz@210 rpm, 0–15 Hz@175 rpm, and 0–10 Hz@135 rpm. We can decrease equipment failures and improve machine performance and efficiency by using effective machine health monitoring. The recommended strategy for successful management is a fast increasing method. A Self Aware Health Monitoring Architecture for Distributed Industrial Systems [13] proposes Self-Aware Wellbeing Monitoring and Bio-Propelled Coordination for Disseminated Automation Frameworks (SAMBA) (CPPS). The Framework’s ability to react intelligently to quickly changing conditions and possible CPPS states is enhanced by SAMBA. This article suggests using mechanically conveyed CPPS engineering to build the framework’s ability to adapt to changing events and conditions. The design’s main emphasis elements are wellness assessment and social deviance correction. Lee et al. [14] presents the management of machine health for bright industrial facilities, which is also the subject of this study. The research also looked at several types of machine sensors, as well as the different types of computations and PHM devices used for machine wellness administrations. As a result, the current research aims to provide a broad overview and point of view of machine wellbeing administrations in smart processing plants and Industry 4.0. Machine Condition Monitoring System using a smart phone [15] is a framework for machine condition monitoring created using sophisticated smartphone functionalities in this article. This article offers a machine condition checking architecture that despite some equipment limitations tends to protect information. The accuracy of error identification is provided in this study, which validates the suggested system’s capabilities in future condition checking administrations.
Chen et al. [16] offer a new technique for machine health status prediction based on Neuro-Fuzzy Systems (NFS) and Bayesian algorithms in their article. After training using system data, NFS is used as a predictive model to anticipate the reaction of the system failure state over time. Chen and colleagues tested the established procedure using two separate experimental cases: a damaged carrier plate and a faulty bearing. The experiment’s efficiency is compared to three popular predictors: recurrent neural networks (RNN), NFS, and recursive neural networks (RNN) (RNFS). Monitoring machine health status and diagnosis of fault using SVM algorithm [17] are crucial for machine status monitoring and problem identification; this study primarily uses a support vector machine. The findings of the current research in machine condition monitoring are reviewed and presented in this publication. Artificial neural networks (ANN), fuzzy expert systems, random forests, and condition-based reasoning have all been employed. Despite the fact that SVM implementation is uncommon, it provides great performance and accuracy. Machine health monitoring with deep learning and its applications [18] is proposed by Zhao et al. to assess and summarize the recent fieldwork on machine condition monitoring using deep learning algorithms. Zhao et al. examine the implementation of deep learning from the perspectives of restricted Boltzmann machines, auto-encoders, and convolutional neural networks (CNN). Eventually, several important advances in computer state analysis approaches focusing on deep learning are discussed. Binding et al., discusses the predictive maintenance of a superior printing machine. Various metrics such as cross-entropy, AUC, ROC, PRC, decision thresholds, calibration curves were used to determine the best model. Random forest and XGBoost outperformed logistic regression in terms of decision thresholds [19,20,21]. In terms of ROC, all techniques outperformed random classifiers significantly. Motor failure time prediction is carried out using ANN [22,23], artificial neural networks, and this paper presents an approach for predicting the status of the equipment. The model was trained to make predictions on the devices that imitated a motor using vibration readings obtained from an accelerometer. The algorithms used were ANN, regression tree, random forest, and support vector machine, with ANN providing the best results. Moreover, model generalization and k-fold cross-validation were performed.
Biswal et al. [24] discusses the methodology to monitor the condition of a wind turbine using ANN. To simulate the functioning of a real wind turbine, a bend-top test rig was created. Time-domain vibration signatures were investigated for essential aspects and vibration signatures were obtained depending on the state (healthy, malfunctioning, etc.,). The predictive model correctly classified the machine’s status 92.6 percent of the time. Predictive maintenance system for refrigeration using case temperature data, demonstrates an ML-based approach [25,26,27,28] for detecting faults in refrigeration systems. Seasonality-based decomposition, pattern discovery employing dynamic time warping, and clustering were used to extract features. The collected features are utilized to train a binary classifier built using random forest. This approach was validated using real-world data from 2265 refrigerators. The precision of 89 percent was achieved with a 7-day lead time. When tested on unseen cases, it had a recall of 46%. Fernandes et al. outlines the work titled “A Machine-Learning Approach for Predictive Maintenance for forecasting appliances failures”, which outlines a mechanism for predicting boiler malfunctions as well as future failures up to a week in advance. LSTM was primarily utilized as a prediction model with various topologies. Results indicate that LSTM with three hidden layers of 50 neurons and LSTM with one hidden layer of 25 neurons gives the best performance. Along with this, a random stratified classifier, random tree, and neural networks were evaluated. It was observed that weighted neural networks performed poorly when compared to NN models. In [29,30,31], Gopi Krishna and Selvaraj use ML techniques to classify the type of fault in the bearings. Data were acquired using torque, displacement, accelerometer, and velocity sensors after which vibrational signal analysis [32,33] was carried out to extract the features. Machine learning models involving KNN, SVM, K-Means, CRA (collaborative recommendation approach) were used. Among all, CRA has given the best results with 93% accuracy in identifying a fault [34,35]. Arias et al. [36] gives an overview of how to forecast failures in power transformers using ML techniques including SVM, decision tree, random forest, and LSTM. Dataset of insulating oil test was used. Among all the techniques evaluated, SVM had given the best result, with a recall rate of 77%. As the data were gathered at such a low frequency, the LSTM could not provide a better outcome.
From the existing and related work discussed above, the problem of identification of machine health status especially in the industrial environment was attempted by various experts using several approaches such as: (a) Observing the machine status using sensors deployed in various places of the industry and further using the data for analysis to know the health status [37]; and (b) observations from the sensors are stored in the centralized system and further analyzed with machine learning/deep learning models to assess the health condition. The problem identified above is fixing, and the deployment of sensors to capture the observations of the machinery is another systemic model and burden in terms of financial aspects in the industry [38]. This model cannot apply to all kinds of machinery as the machines are different and exhibit different properties/functionalities.
This paper attempts a simple and comprehensive solution to observe the health status machinery through a simple mobile application that is well-equipped with a machine learning model that could easily predict the health status of the machine instantly. The mobile application can also be tuned to a specific industrial machine as they differ in their functionalities and mode of operational properties. This work also helps in minimizing the operational cost of maintenance of the industrial appliances as they require a huge investment when the industry is set up.
3. Proposed Solution
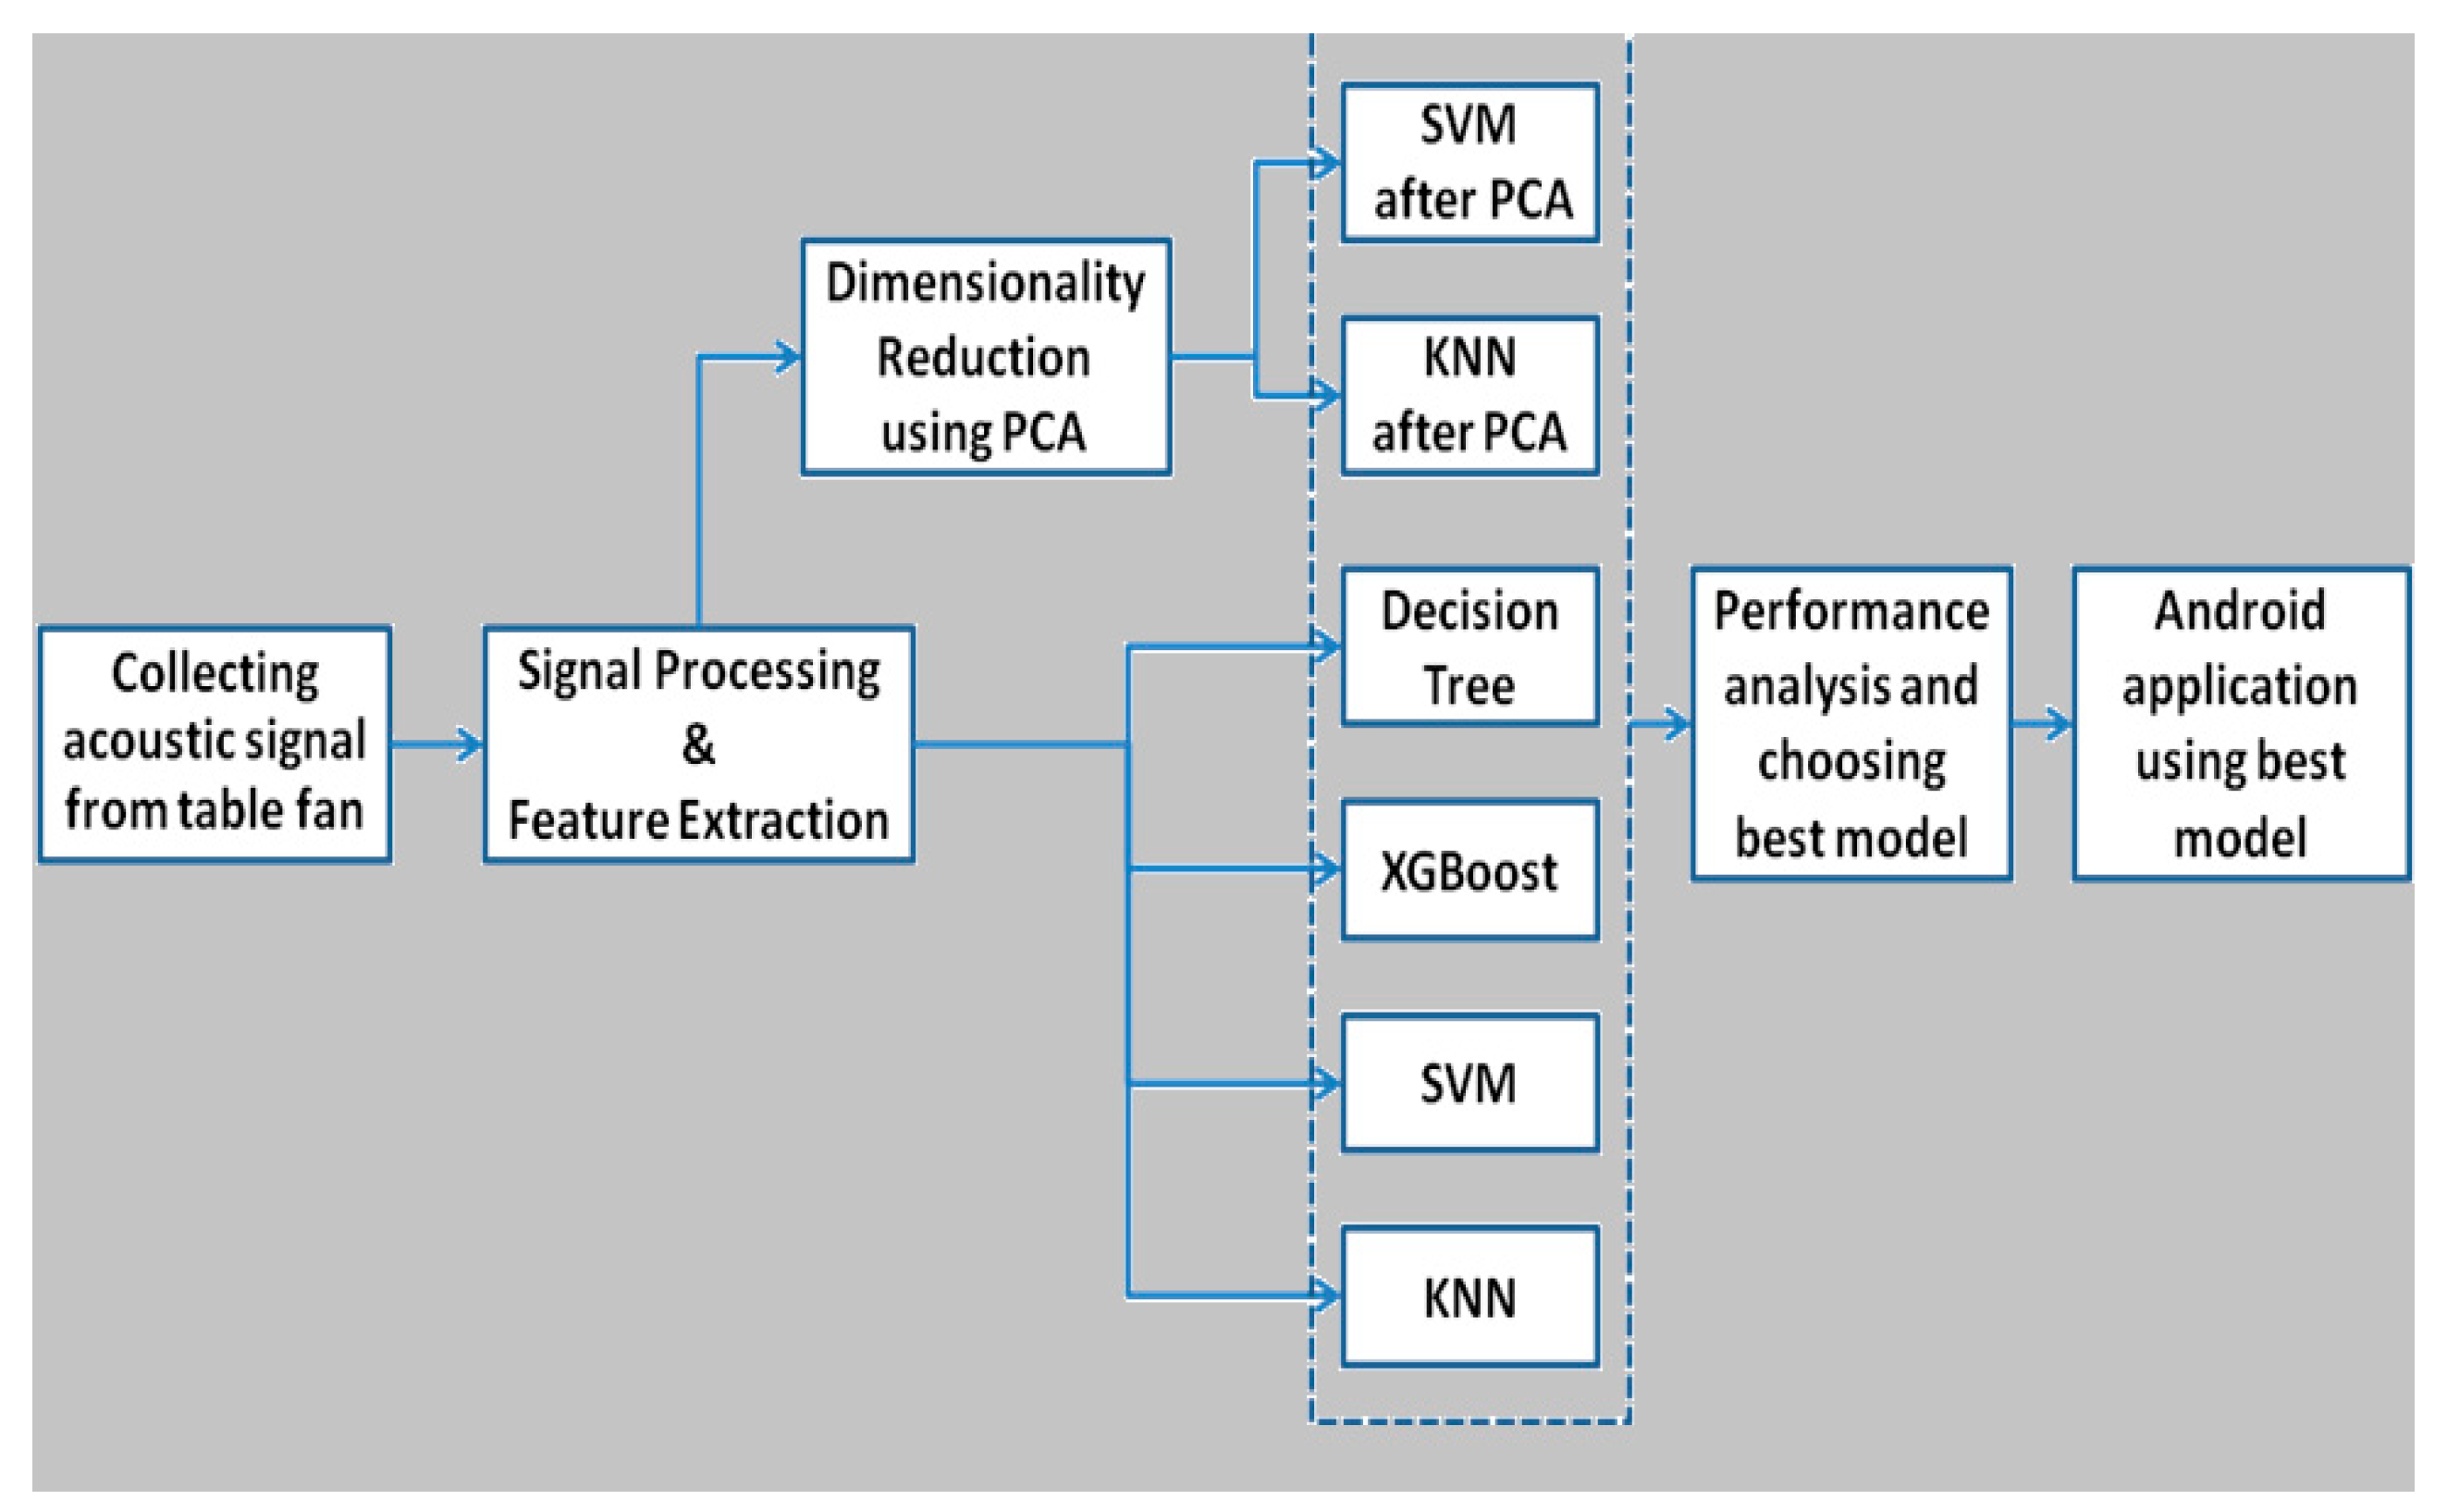
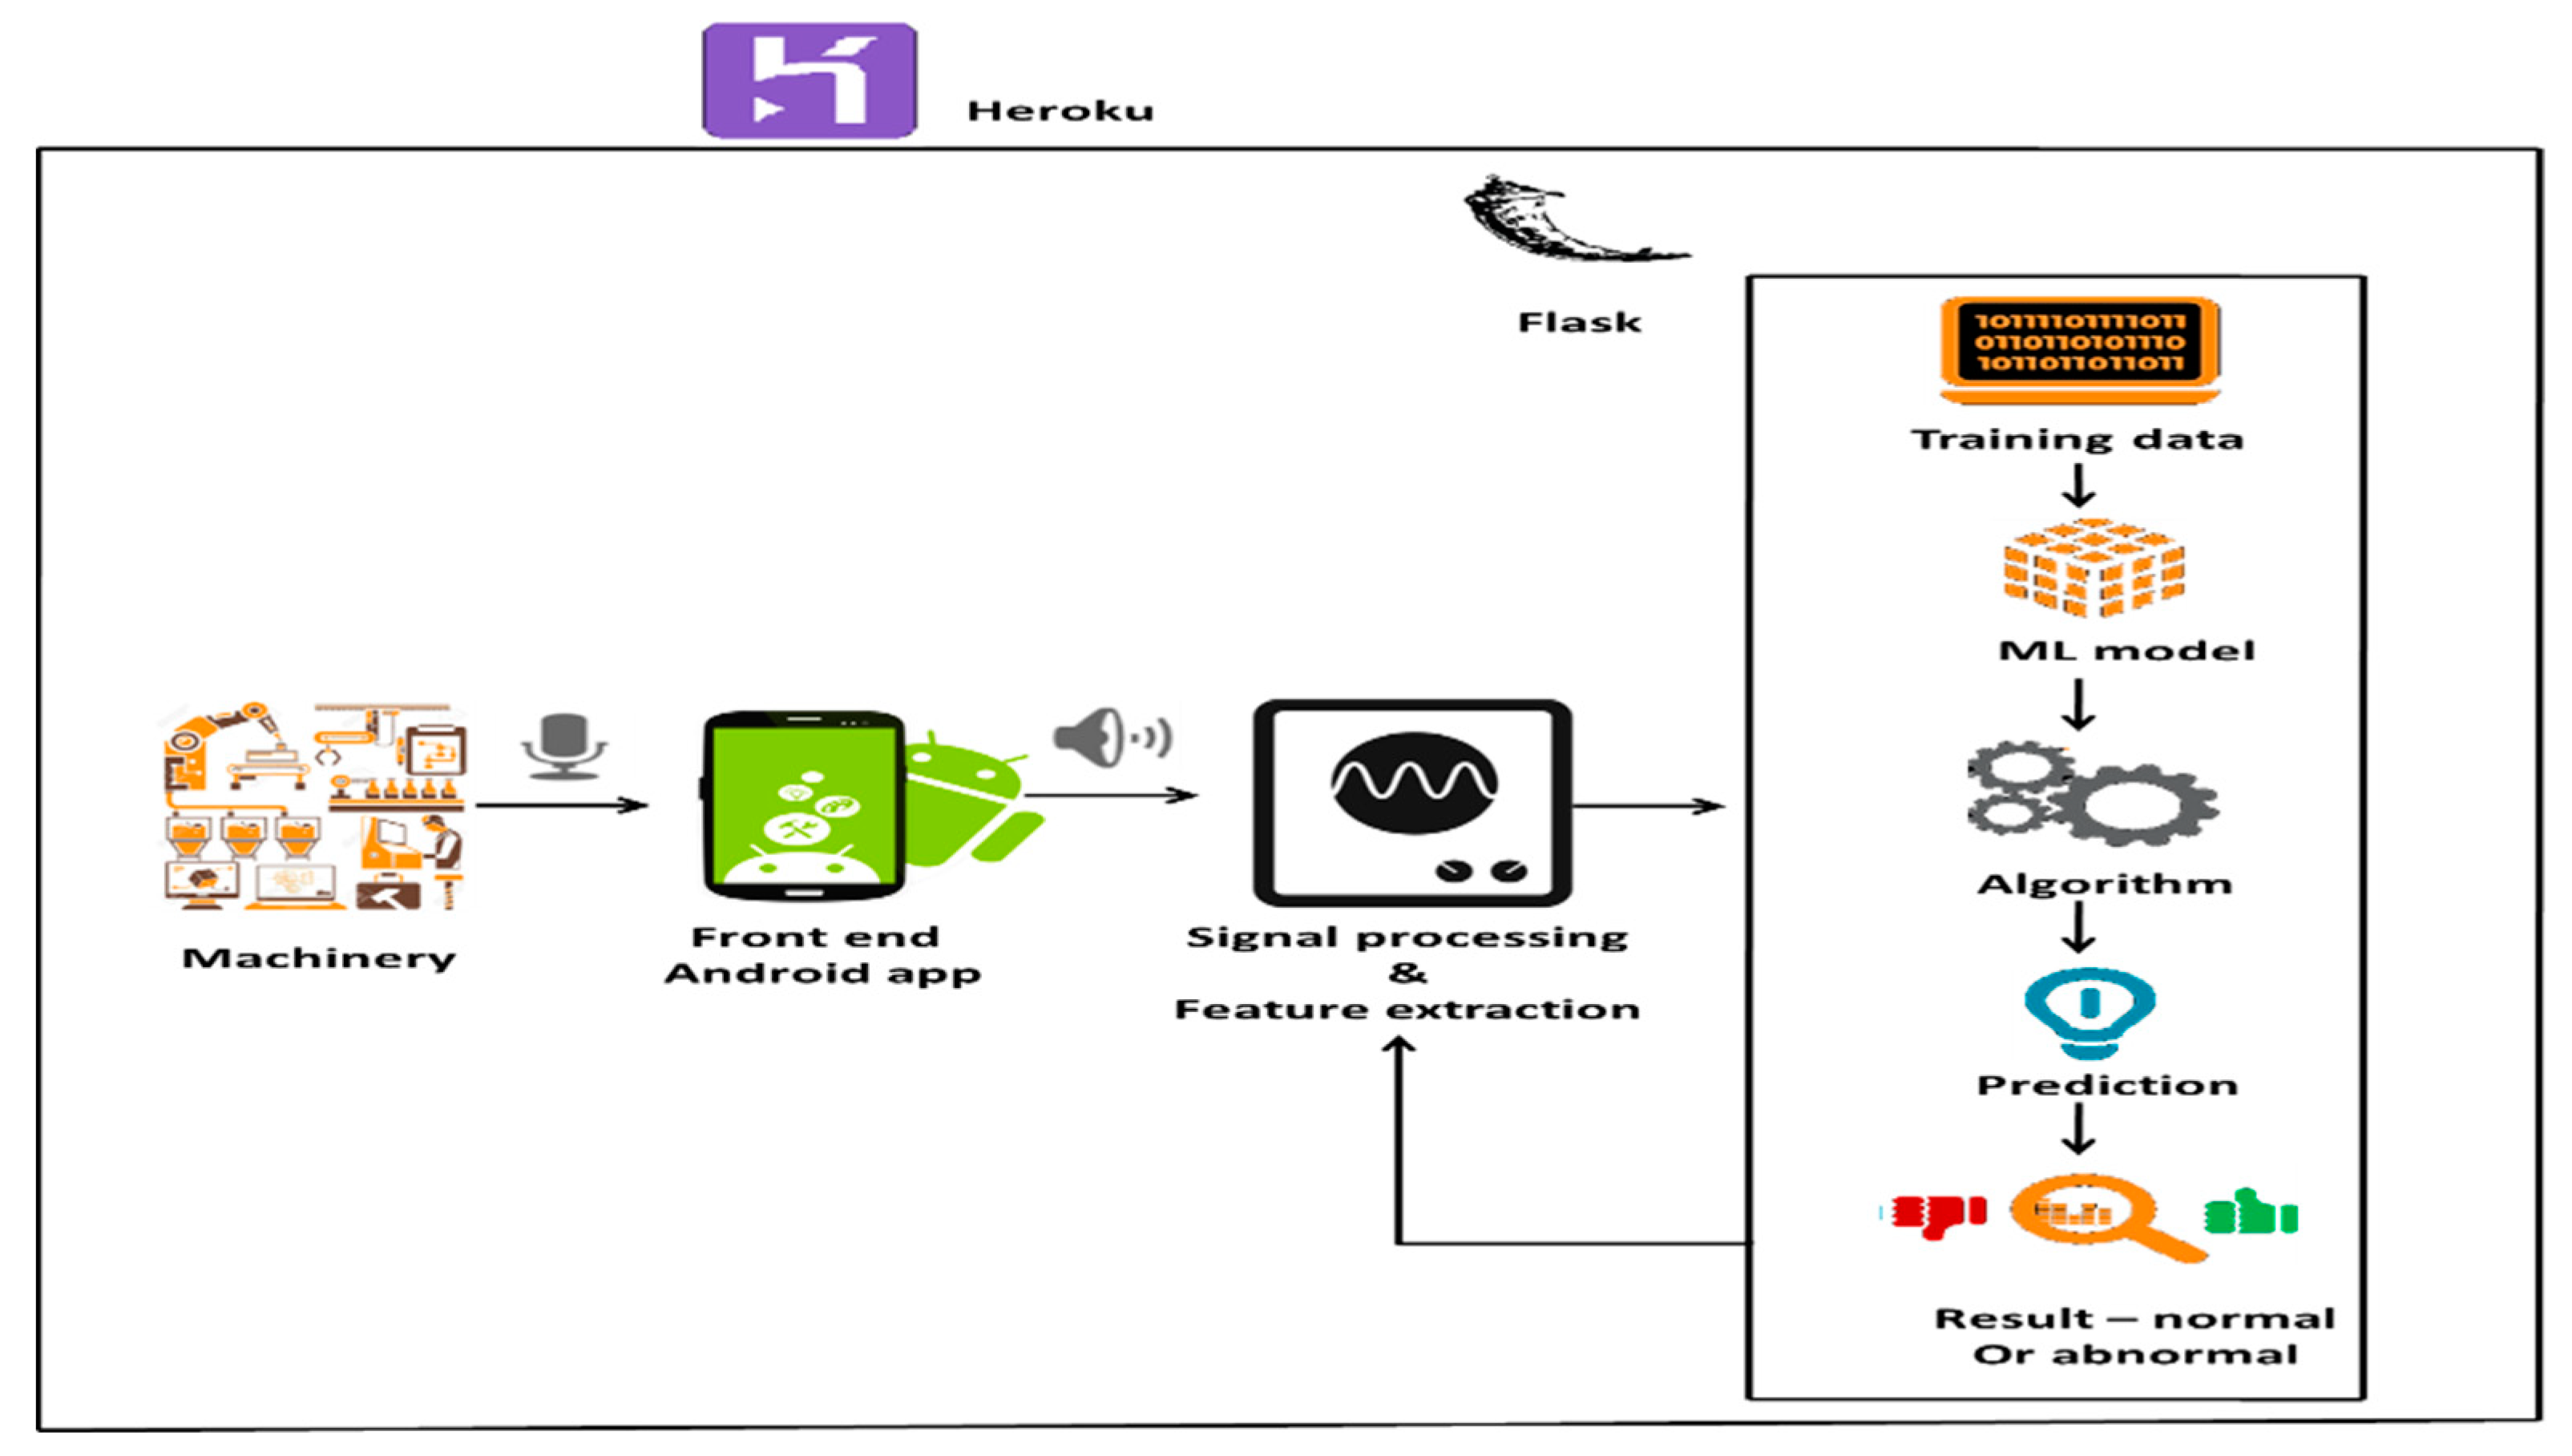
So, in order to obtain reliable results, we plan to create a predictive model of machine health predictions using machine learning approaches based on the machine’s real data. It analyzes the data, anticipates deviations, and alerts the user to any abnormalities in the machine’s operation. The proposed method uses classification (binary classification) and predicts whether the given observation of a machine is normal or abnormal. Our suggested prediction method is depicted in Figure 1, and it entails using popular machine algorithms such as: KNN, SVM, decision tree, and XGBoost [39,40]. The performance characteristics of various algorithms are then examined, and the best algorithm is picked for the predictive machine learning model’s [41,42,43] final development. The technique also reports the irregularity through a user interface in which the front end is built with Android Studio and the backend is built with Flask, a Python framework, and the server is hosted on Heroku. The following Figure 1 is elaborated in various stages as follows.
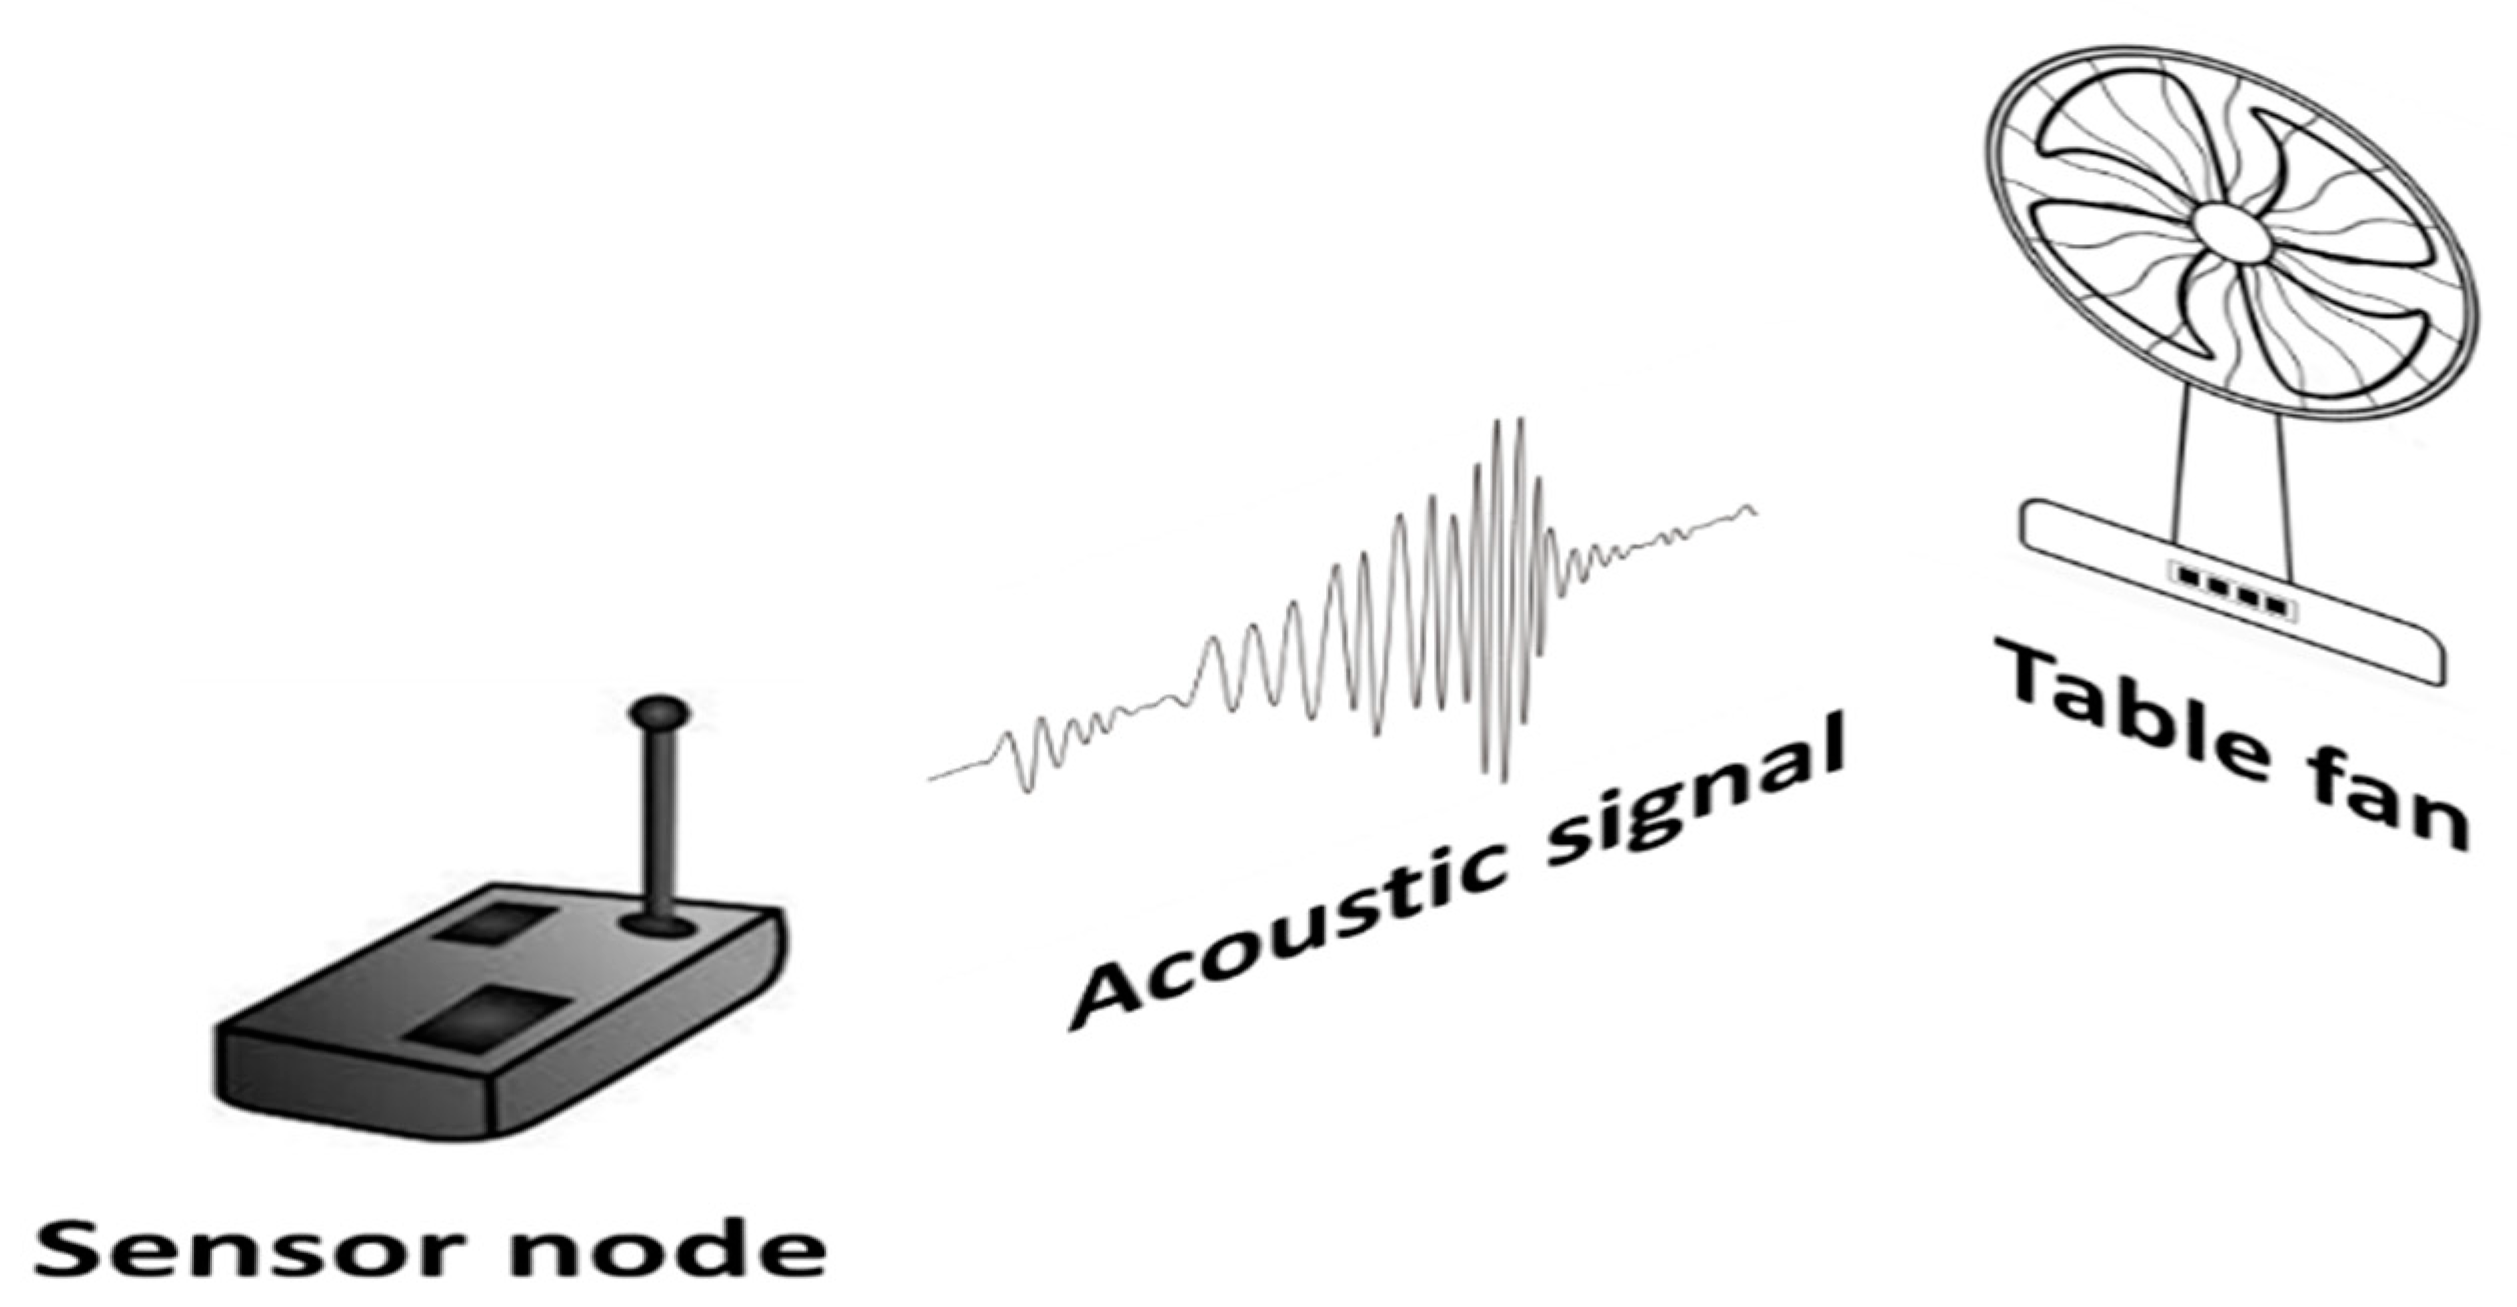
Collecting acoustic signal from table fan: To mimic the industry environment and to gather signals from the machines, we have considered a table fan to collect the sound signals from the fan in various timing intervals for both states of the fan working conditions such as “normal” and “abnormal” states.
Signal Processing & Feature Extraction: The entire model development used as part of this manuscript has been carried out in a python programming environment. To derive features of the signals received from the table fan, especially for processing the machine learning algorithms, we want to derive the following features to be extracted from the acoustic signals of the fan using the signal processing method [44,45,46,47,48]. They are 1. chroma shift, 2. RMSE (root mean square energy), 3. spectral centroid, 4. spectral bandwidth, 5. spectral roll-off, 6. zero crossing rate, and 7. MFCC (coefficient of mel frequency cepstrum). These features of the signal help in the prediction of the health status of the machine. We use the “lebrosa library” in the python environment to derive the above said features from the audio signals of the fan through the mobile application.
Dimensionality Reduction using PCA: In machine learning models, the greater efficiency of the model is achieved by supplying important data features rather than sending the entire dataset features to the model. Especially SVM and KNN work very well on the important features rather than the entire dataset. Because of this property we have selected a phase called “dimensionality reduction using PCA”.
Algorithms Usage: To identify the best machine learning model, we have selected algorithms such as SVM, KNN, decision tree, and XGBoost which are very popular machine learning algorithms.
Performance analysis and Choosing the model: All the above-mentioned algorithms are analyzed on the dataset and the best model that could predict the health condition quickly with good accuracy is selected while deploying the model in the mobile application.
Android Application using best model: This work is also intended to build a mobile application usable by any staff member of the industry to record the audio signal from the machinery as part of their routine maintenance activity and the application could predict the health status quickly.
3.1. Usage of Algorithms
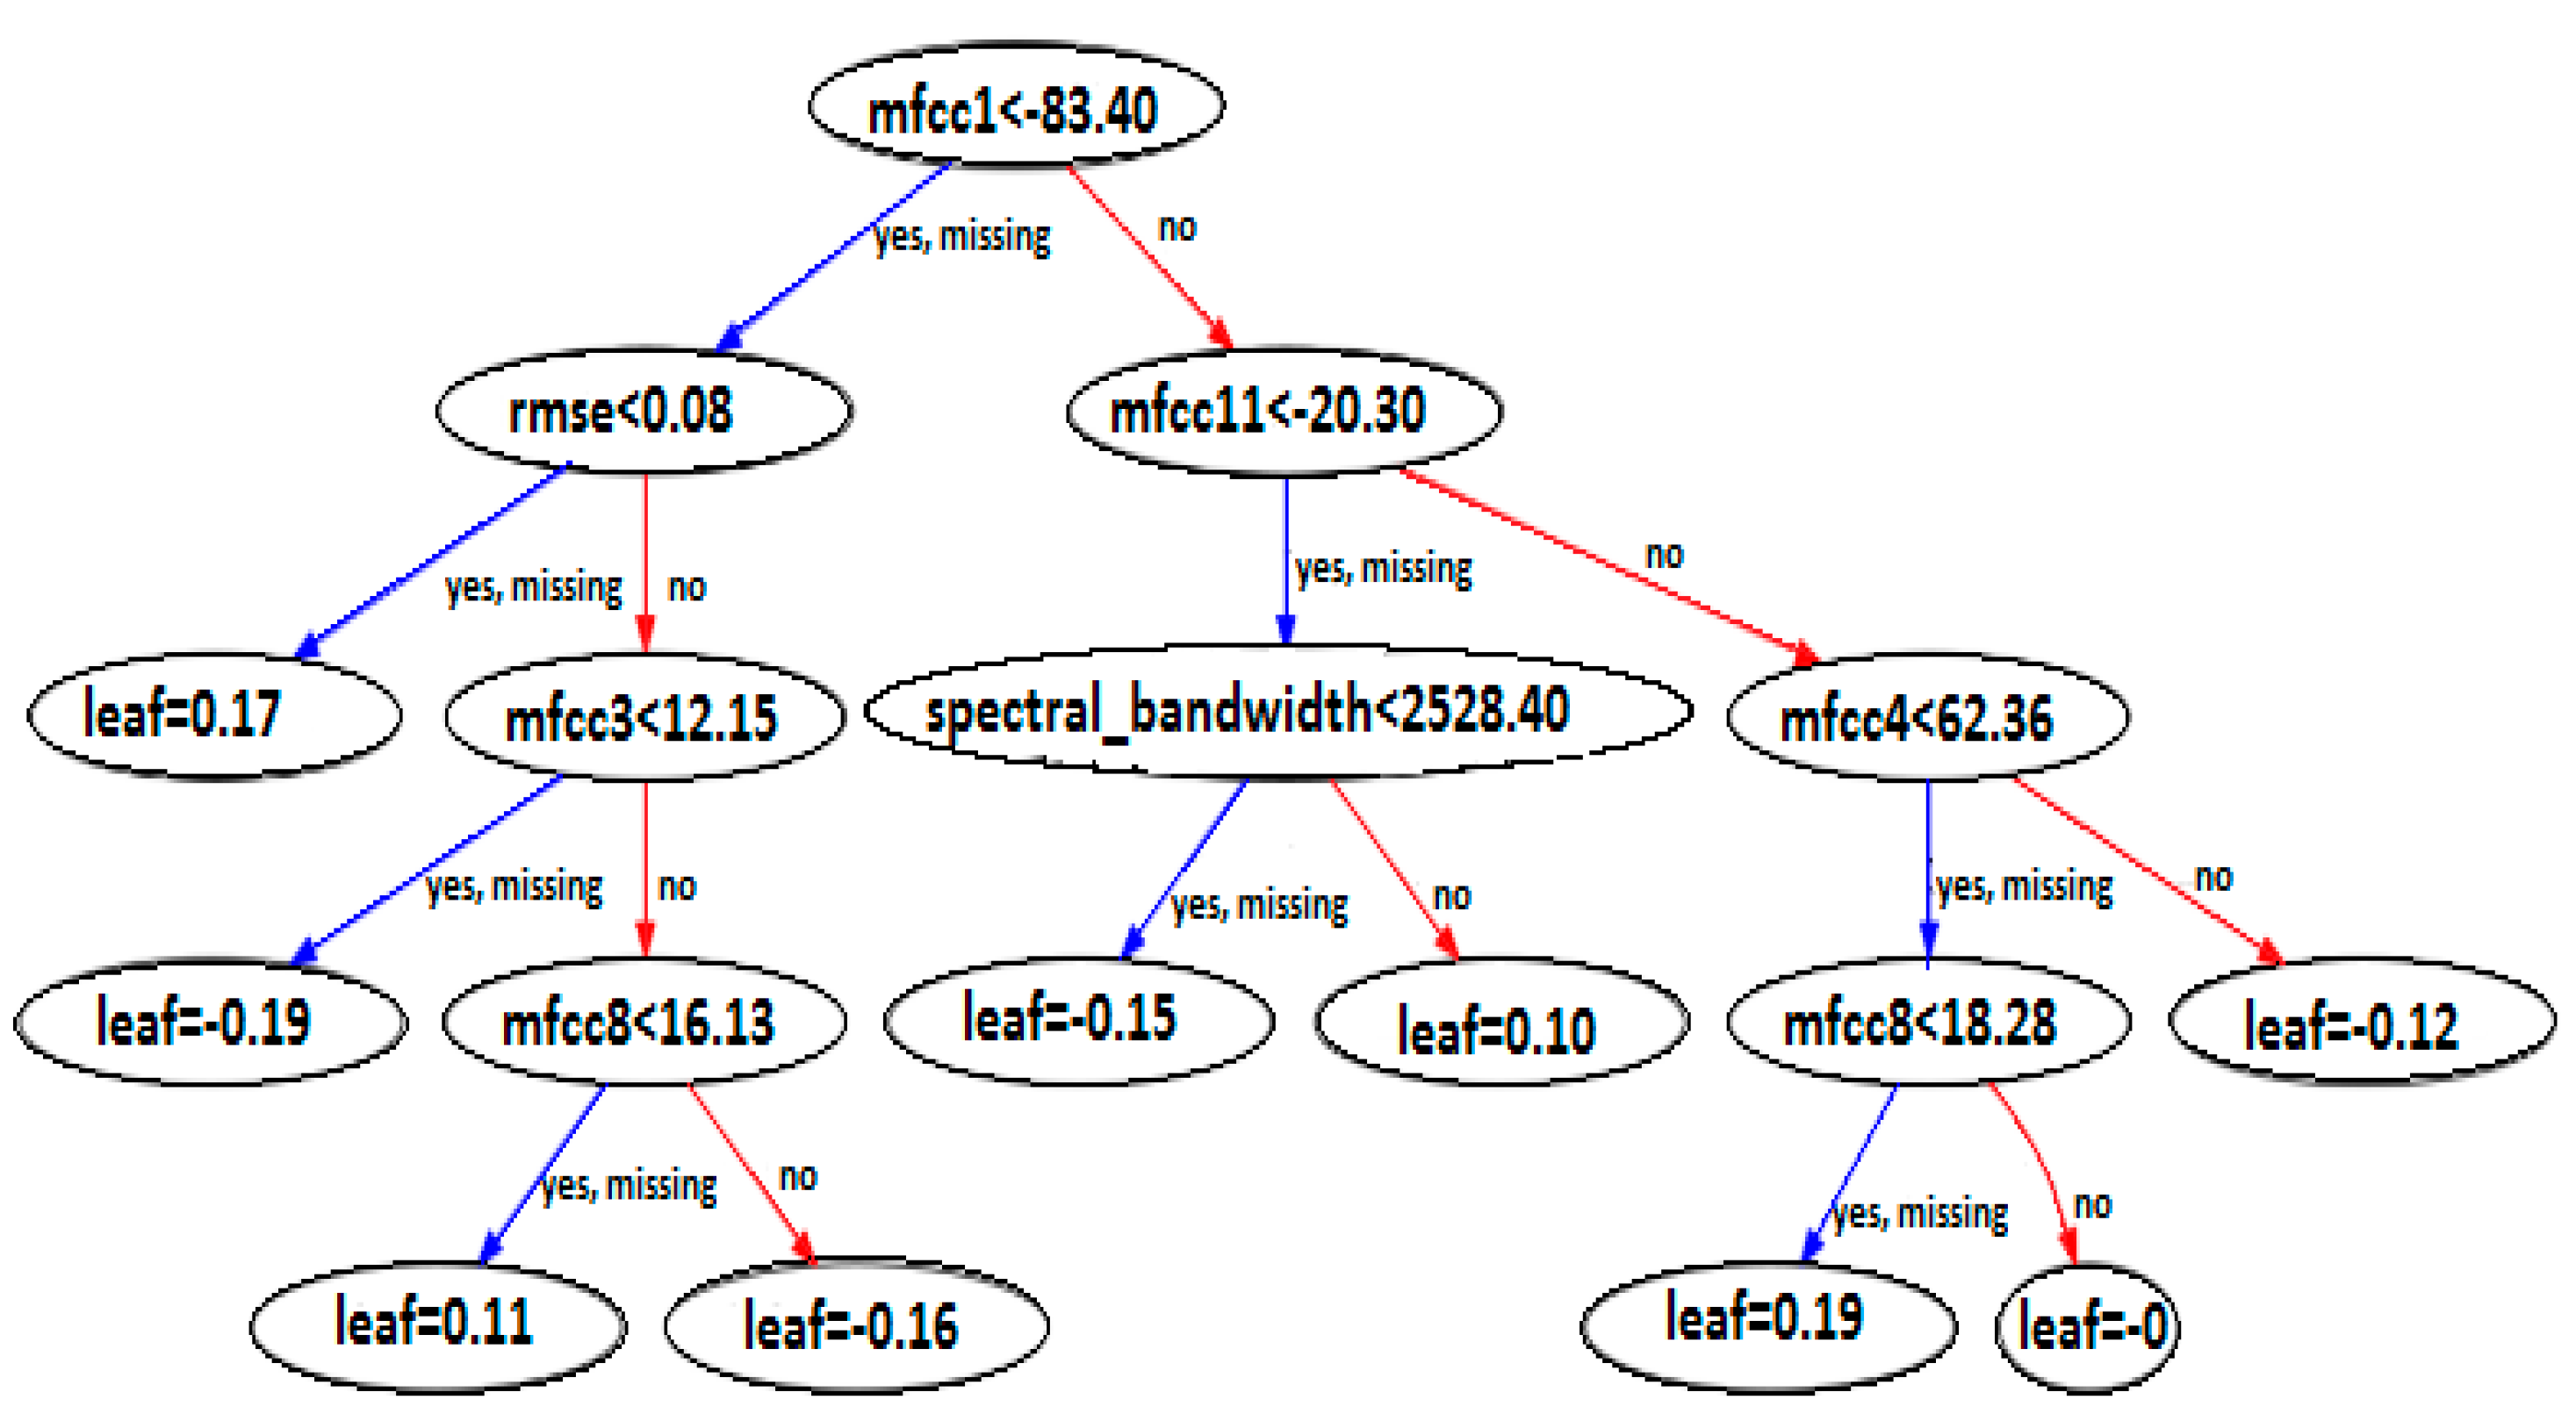
3.1.1. XGBoost Algorithm
Extreme gradient boosting (also called XGBoost) is a decision-tree-based machine learning method that may be used to a variety of machine learning applications. A gradient boosting framework is used to implement it [19]. It is designed as an ensemble learning approach, which means that the XGBoost’s result is a composite of multiple models’ outputs. Its parallel processing, tree trimming, and regularized boosting capabilities make it a formidable tool [20,21]. XGBoost is a popular decision-tree-based ensemble method. It uses a gradient descent algorithm to minimize errors in a model. It has various characteristics including, used to solve a wide range of applications, portability, support of major programming languages, and integration with the cloud environment.
Figure 2 presents the visual form of the tree built using XGBoost model built by using hyper-parameters such as learning rate, max depth, etc.
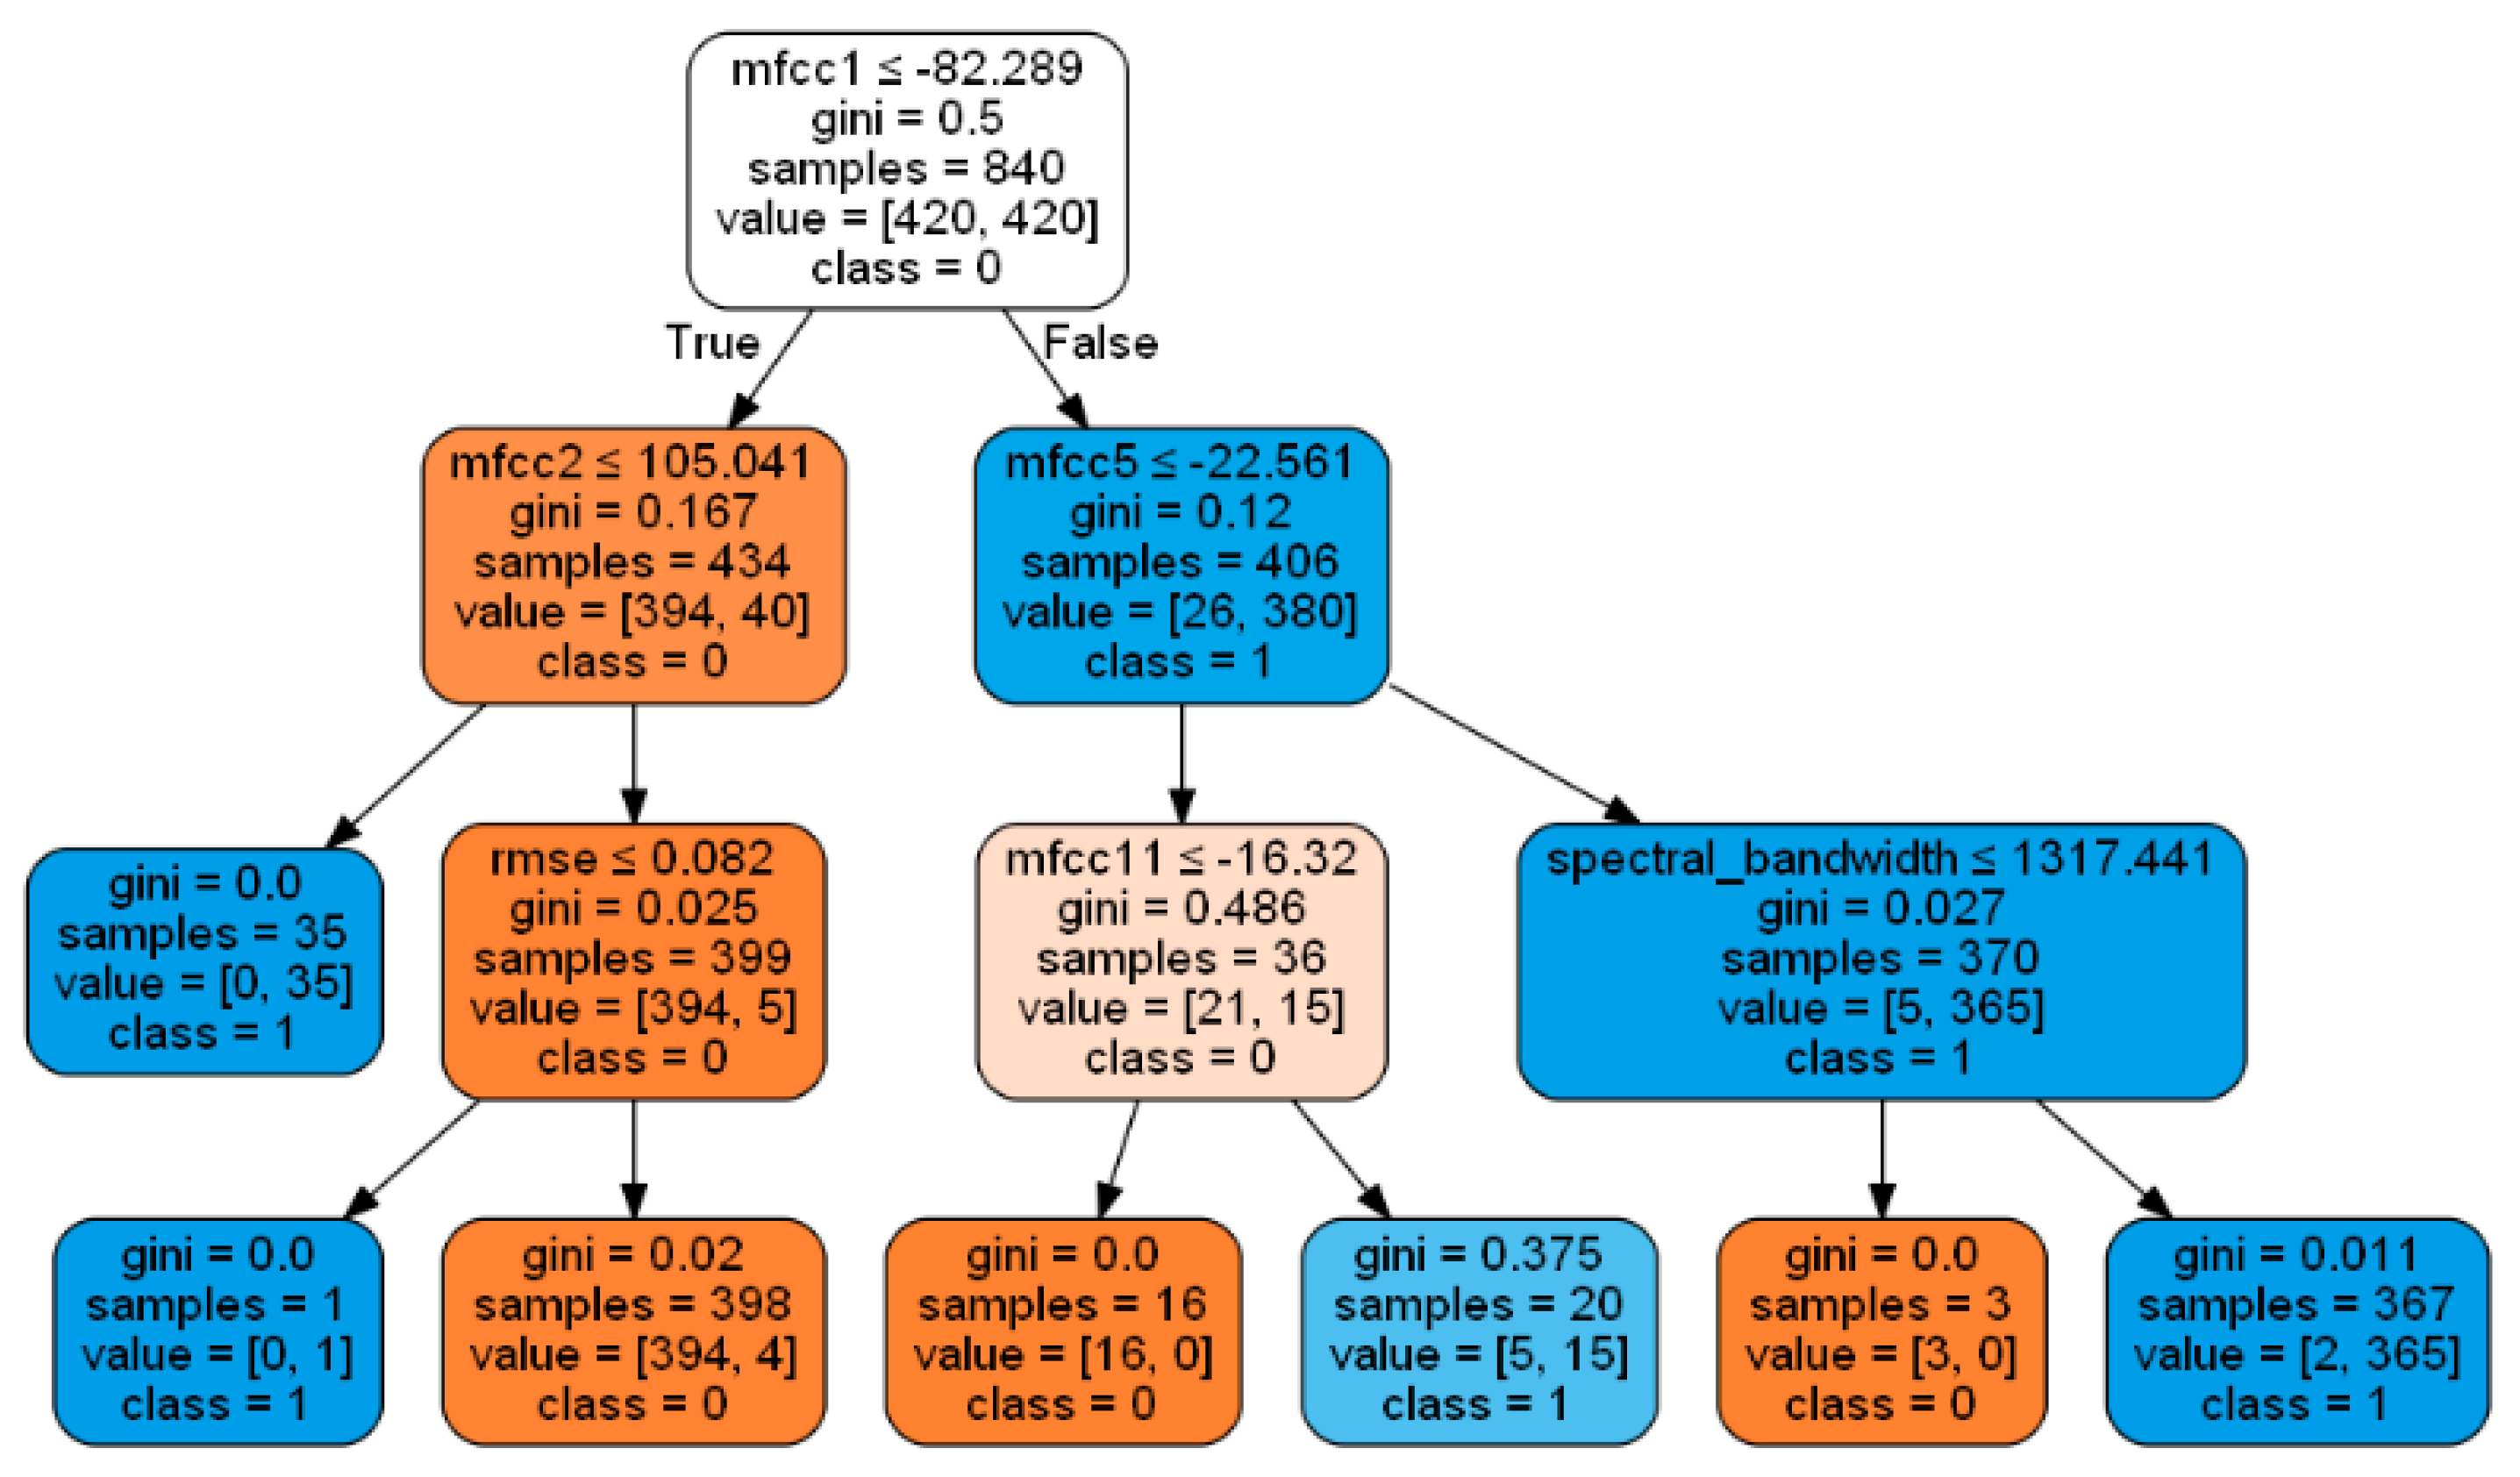
3.1.2. Decision Tree
The decision tree method essentially learns various decision rules found from the training data by constructing a tree containing decision nodes [22,32]. Internally, this decision tree performs attribute selection at each level of decision using different methods and techniques such as information gain, Gini index, Gini impurity, entropy, and so on. Then, for the given input data, this decision tree may be used to categorize or predict continuous value. The decision tree works with both discrete and continuous data variables using supervised learning approach. Based on the data properties, the decision tree is constructed with a root node (significant predictor node) and sub-nodes.
Figure 3 is the representation of the decision tree formed, and the various decision rules based on which the constructed decision tree model performs categorization (normal or abnormal).
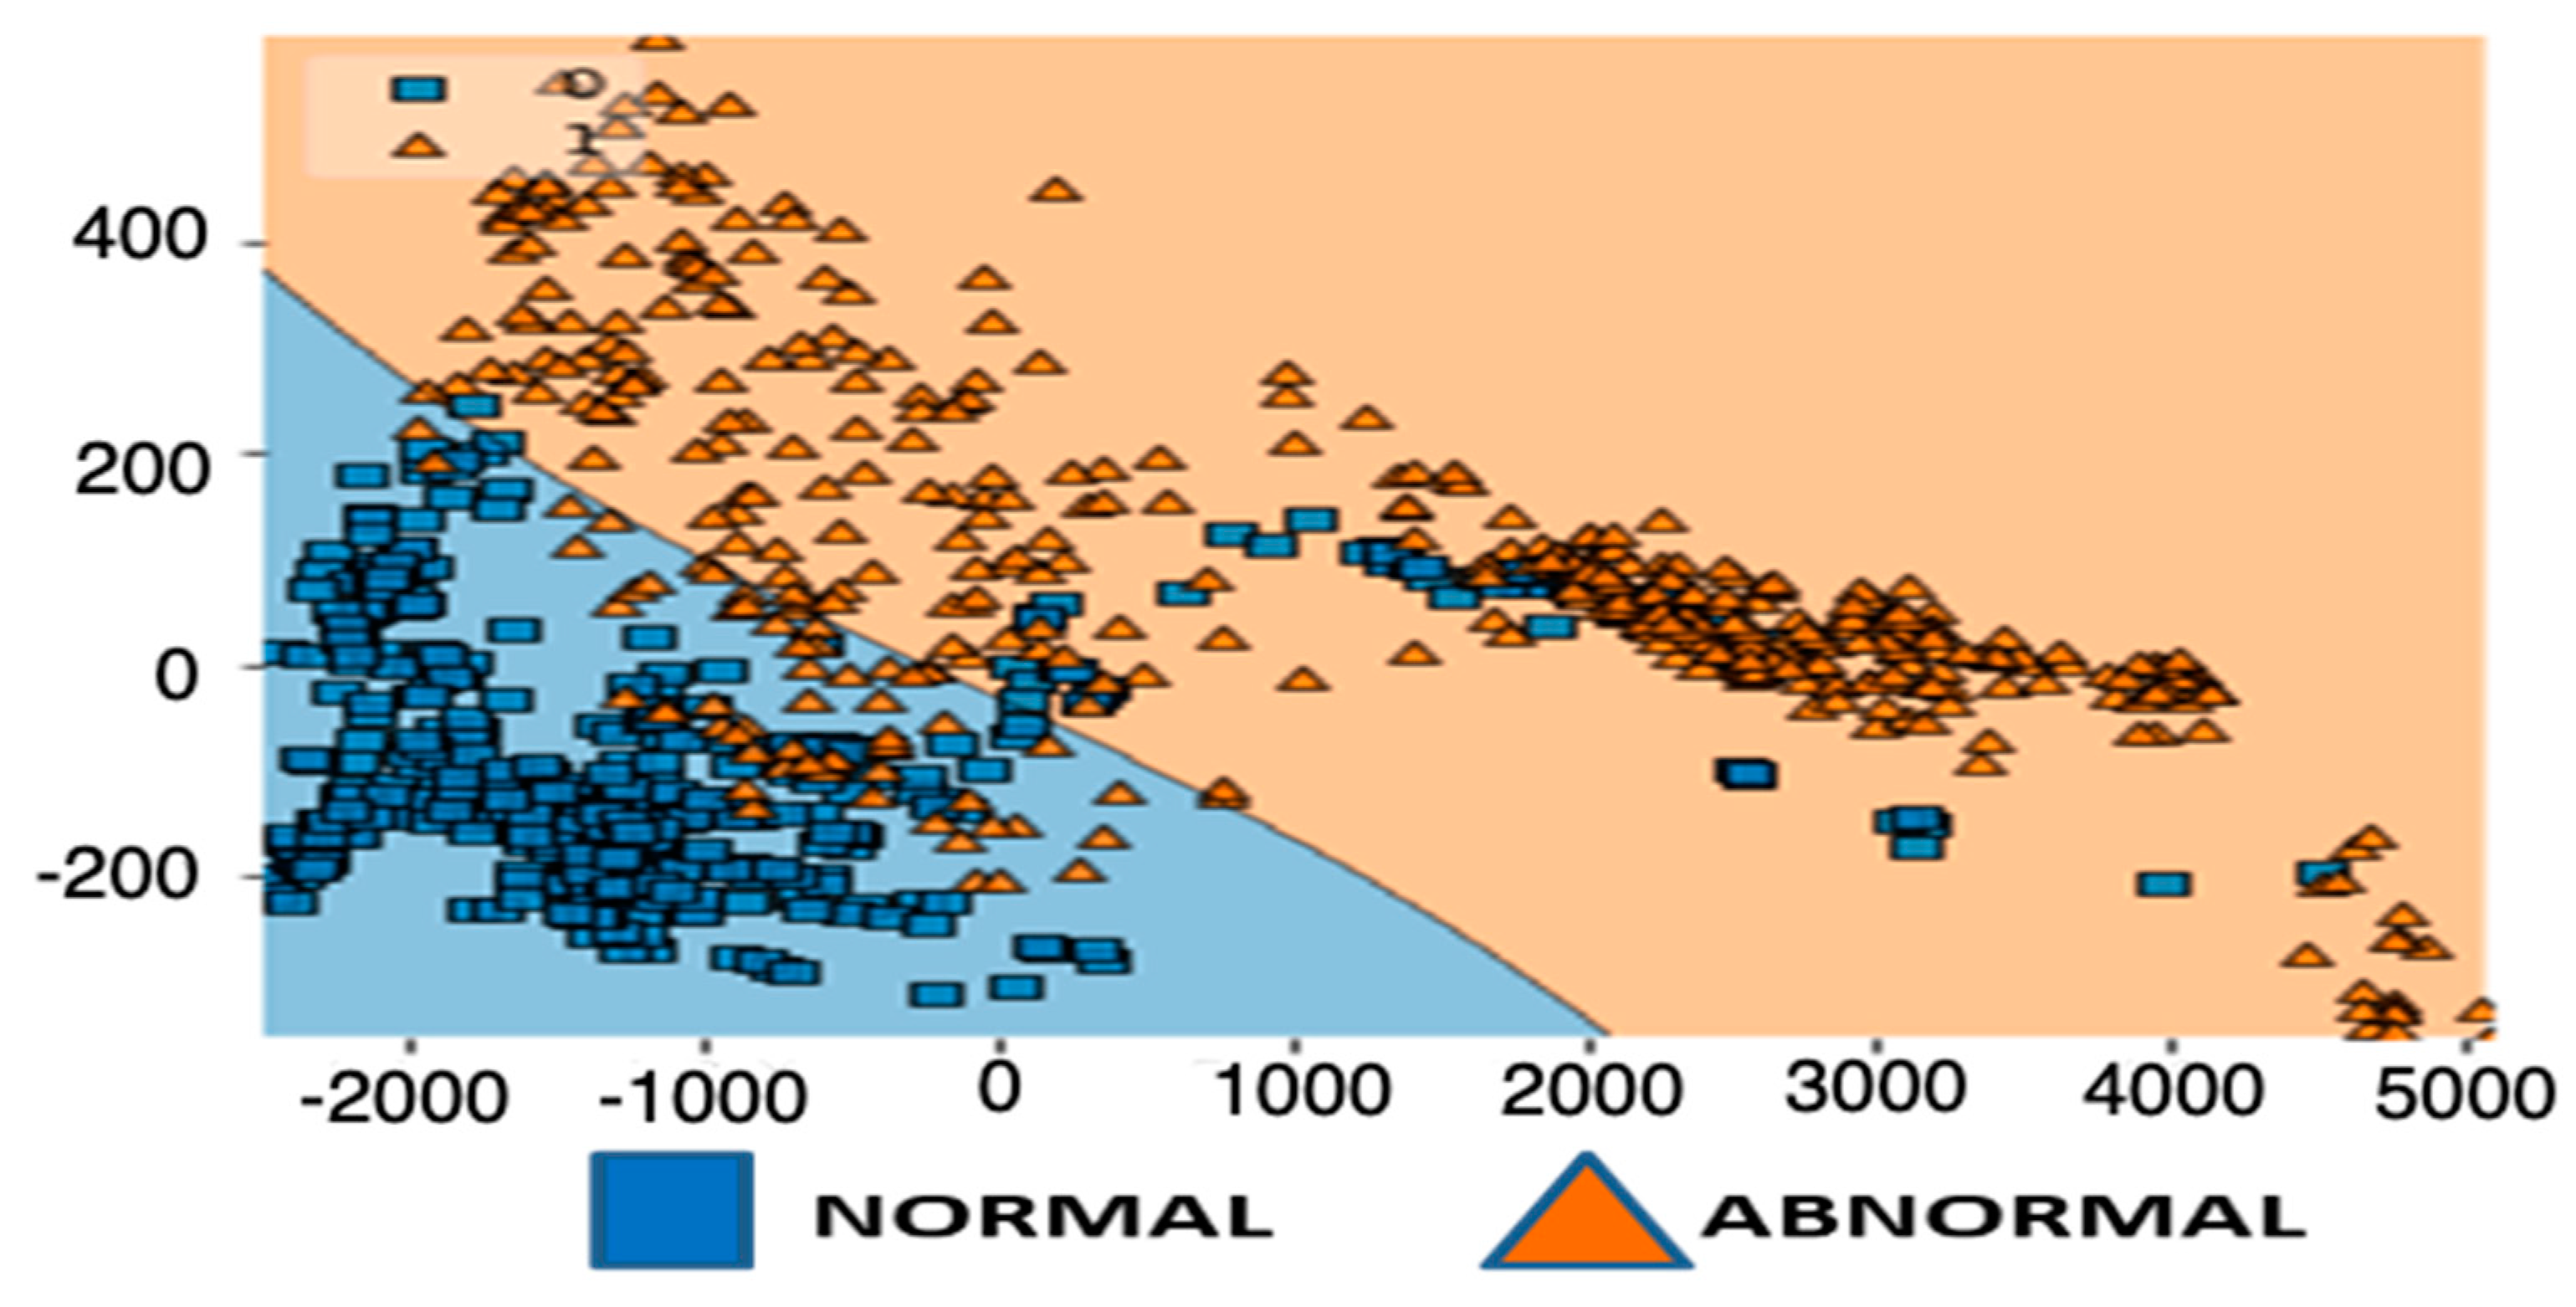
3.1.3. SVM Algorithm
SVM (support vector machine) is a supervised machine learning method used for classification and regression issues. Internally, SVM creates a hyperplane that separates two or more classes most effectively [33]. This algorithm uses less computation power with significant accuracy. This is used to find a hyperplane that distinctly classifies the data points. SVM algorithm uses a technique called “kernel trick” that takes low dimensional input space and transforms it into a higher dimensional space. This kind of feature is useful when we want to work with extremely complex data. This is carried out iteratively to gain more precision and minimize error. This algorithm is used with two functionalities: 1. SVM with kernel trick and 2. PCA with SVM. This is done and experimented with the above as the problem domain is complex and expects good accuracy of prediction. A support vector machine (SVM) is a powerful and versatile algorithm which is capable of doing linear or non-linear classification and regression. It has another popular functionality of outlier detection as shown in Figure 4. This functionality helps in the experimentation process especially in dealing with data significant to the experimentation. To deal with higher dimensional data and to optimize the classification process of the algorithm, this algorithm adds another functionality of “kernel trick” that is intended to process the dataset using a set of pairwise similarity comparison among the data observations. This added feature greatly helps the SVM algorithm in reducing the computational power during the training and validation stage of the algorithm. As the observed data for the diagnosis of health condition of machinery in industry environment include signal processed data that contain imperfections in the form of impression and uncertainty (noise), we have used PCA (principle component analysis) integrated with SVM process. The combined process works effectively in the detection of patterns in the system. The integration of PCA with SVM classification process helps in (1) identifying the data properties which are important and contributes majorly to the detection of faults in the machine properties (observed patterns) and (2) it helps in reducing the data properties especially when the data is multi-dimensional in orientation.
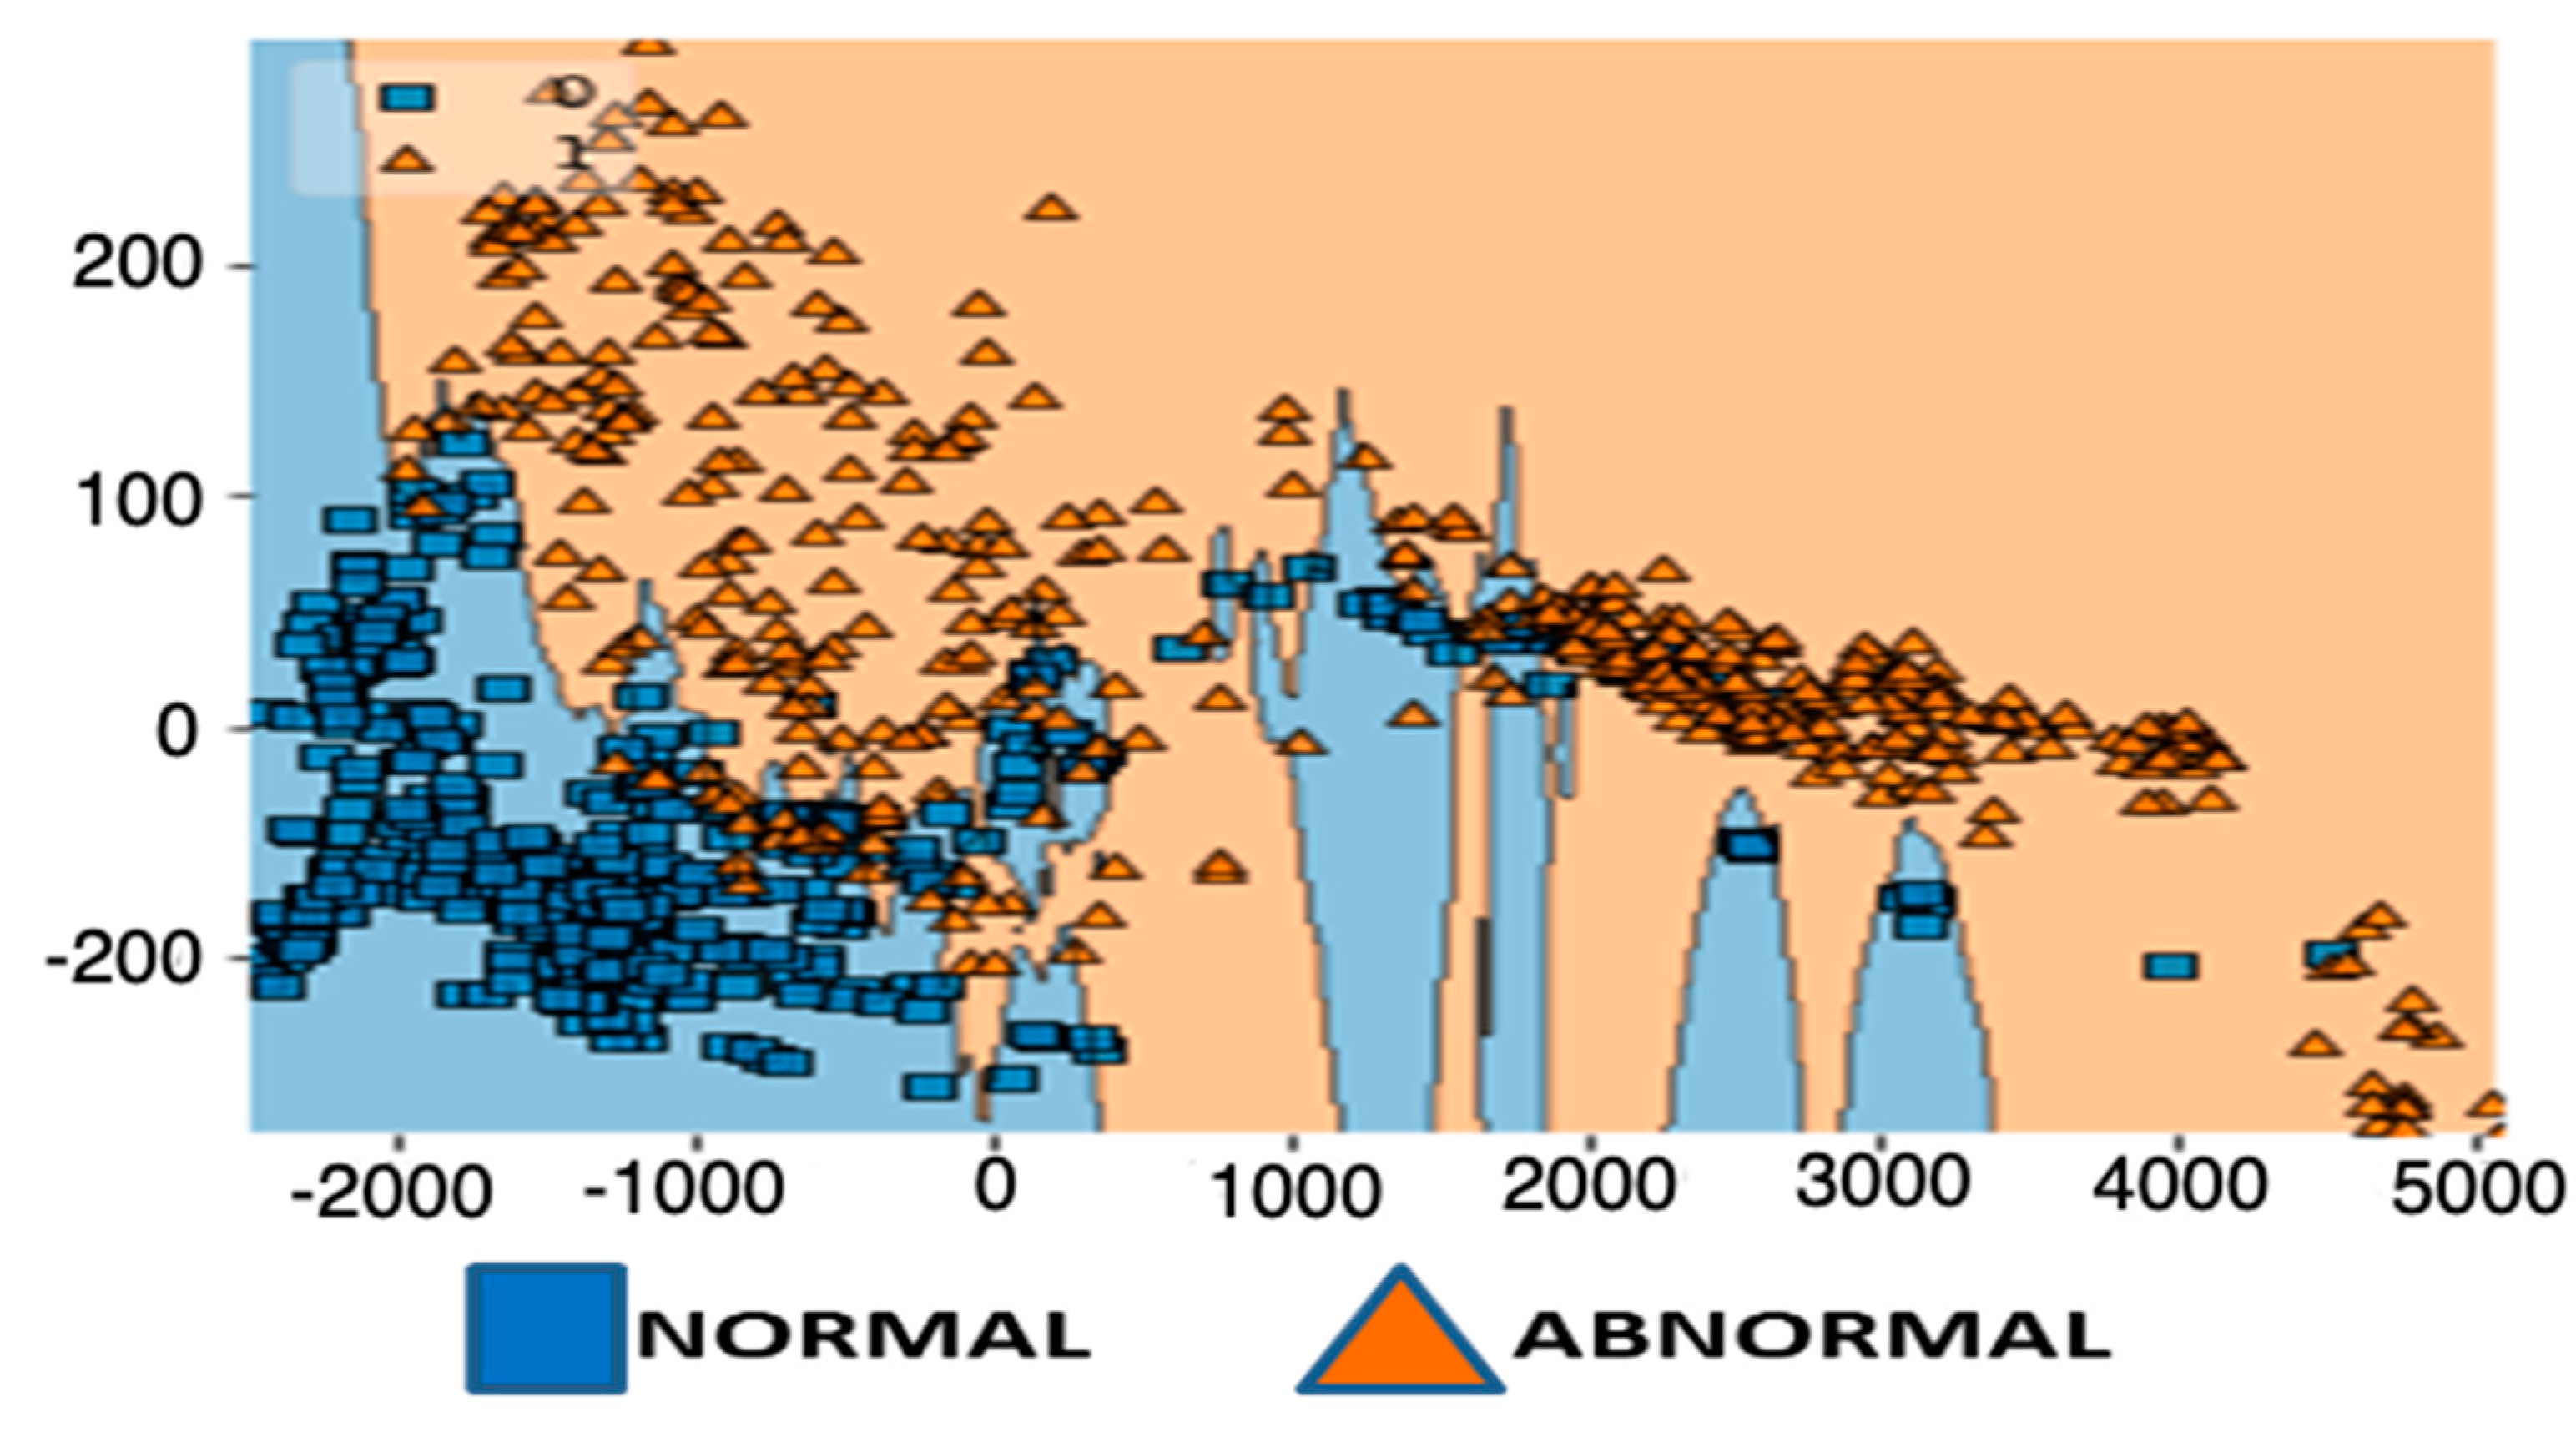
Figure 4 shows the visualization after reducing multi-dimensional data to two-dimensional characteristics; the visual form of SVM model created with PCA. It depicts a linear decision border that separates two groups for an effective classification.
3.1.4. KNN Model
The KNN model is a supervised technique that is used to work with classification and regression issues. It is most commonly utilized in the categorization of fresh data samples based on measure of similarity acquired during the training phase of the model. It is assumed that neighboring data points have comparable characteristics and so belong to the same class [27]. This algorithm is chosen for classification process and assigns/predicts the class based on a majority vote. KNN basic model is also experimented with inclusion of PCA features to leverage majority class information. This process greatly helps in improving the prediction accuracy of the model. The combined version of PCA with KNN has shown good accuracy of prediction as the data size grows.
Figure 5 presents the visual representation of KNN model created after the dimensionality reduction using PCA. It also presents how the decision boundary is represented in order to determine if the machine state is normal or pathological.
3.2. System Architecture
The suggested system model’s entire systemic architecture can be seen in Figure 6, which depicts the system’s step-by-step activity, including the use of machinery by handheld devices such as mobile phones that can analyze signals and feature extraction from machinery [29,32,33]. This information is sent to the FLASK environment, which is used to create the prediction model.
3.3. Development of User Interface
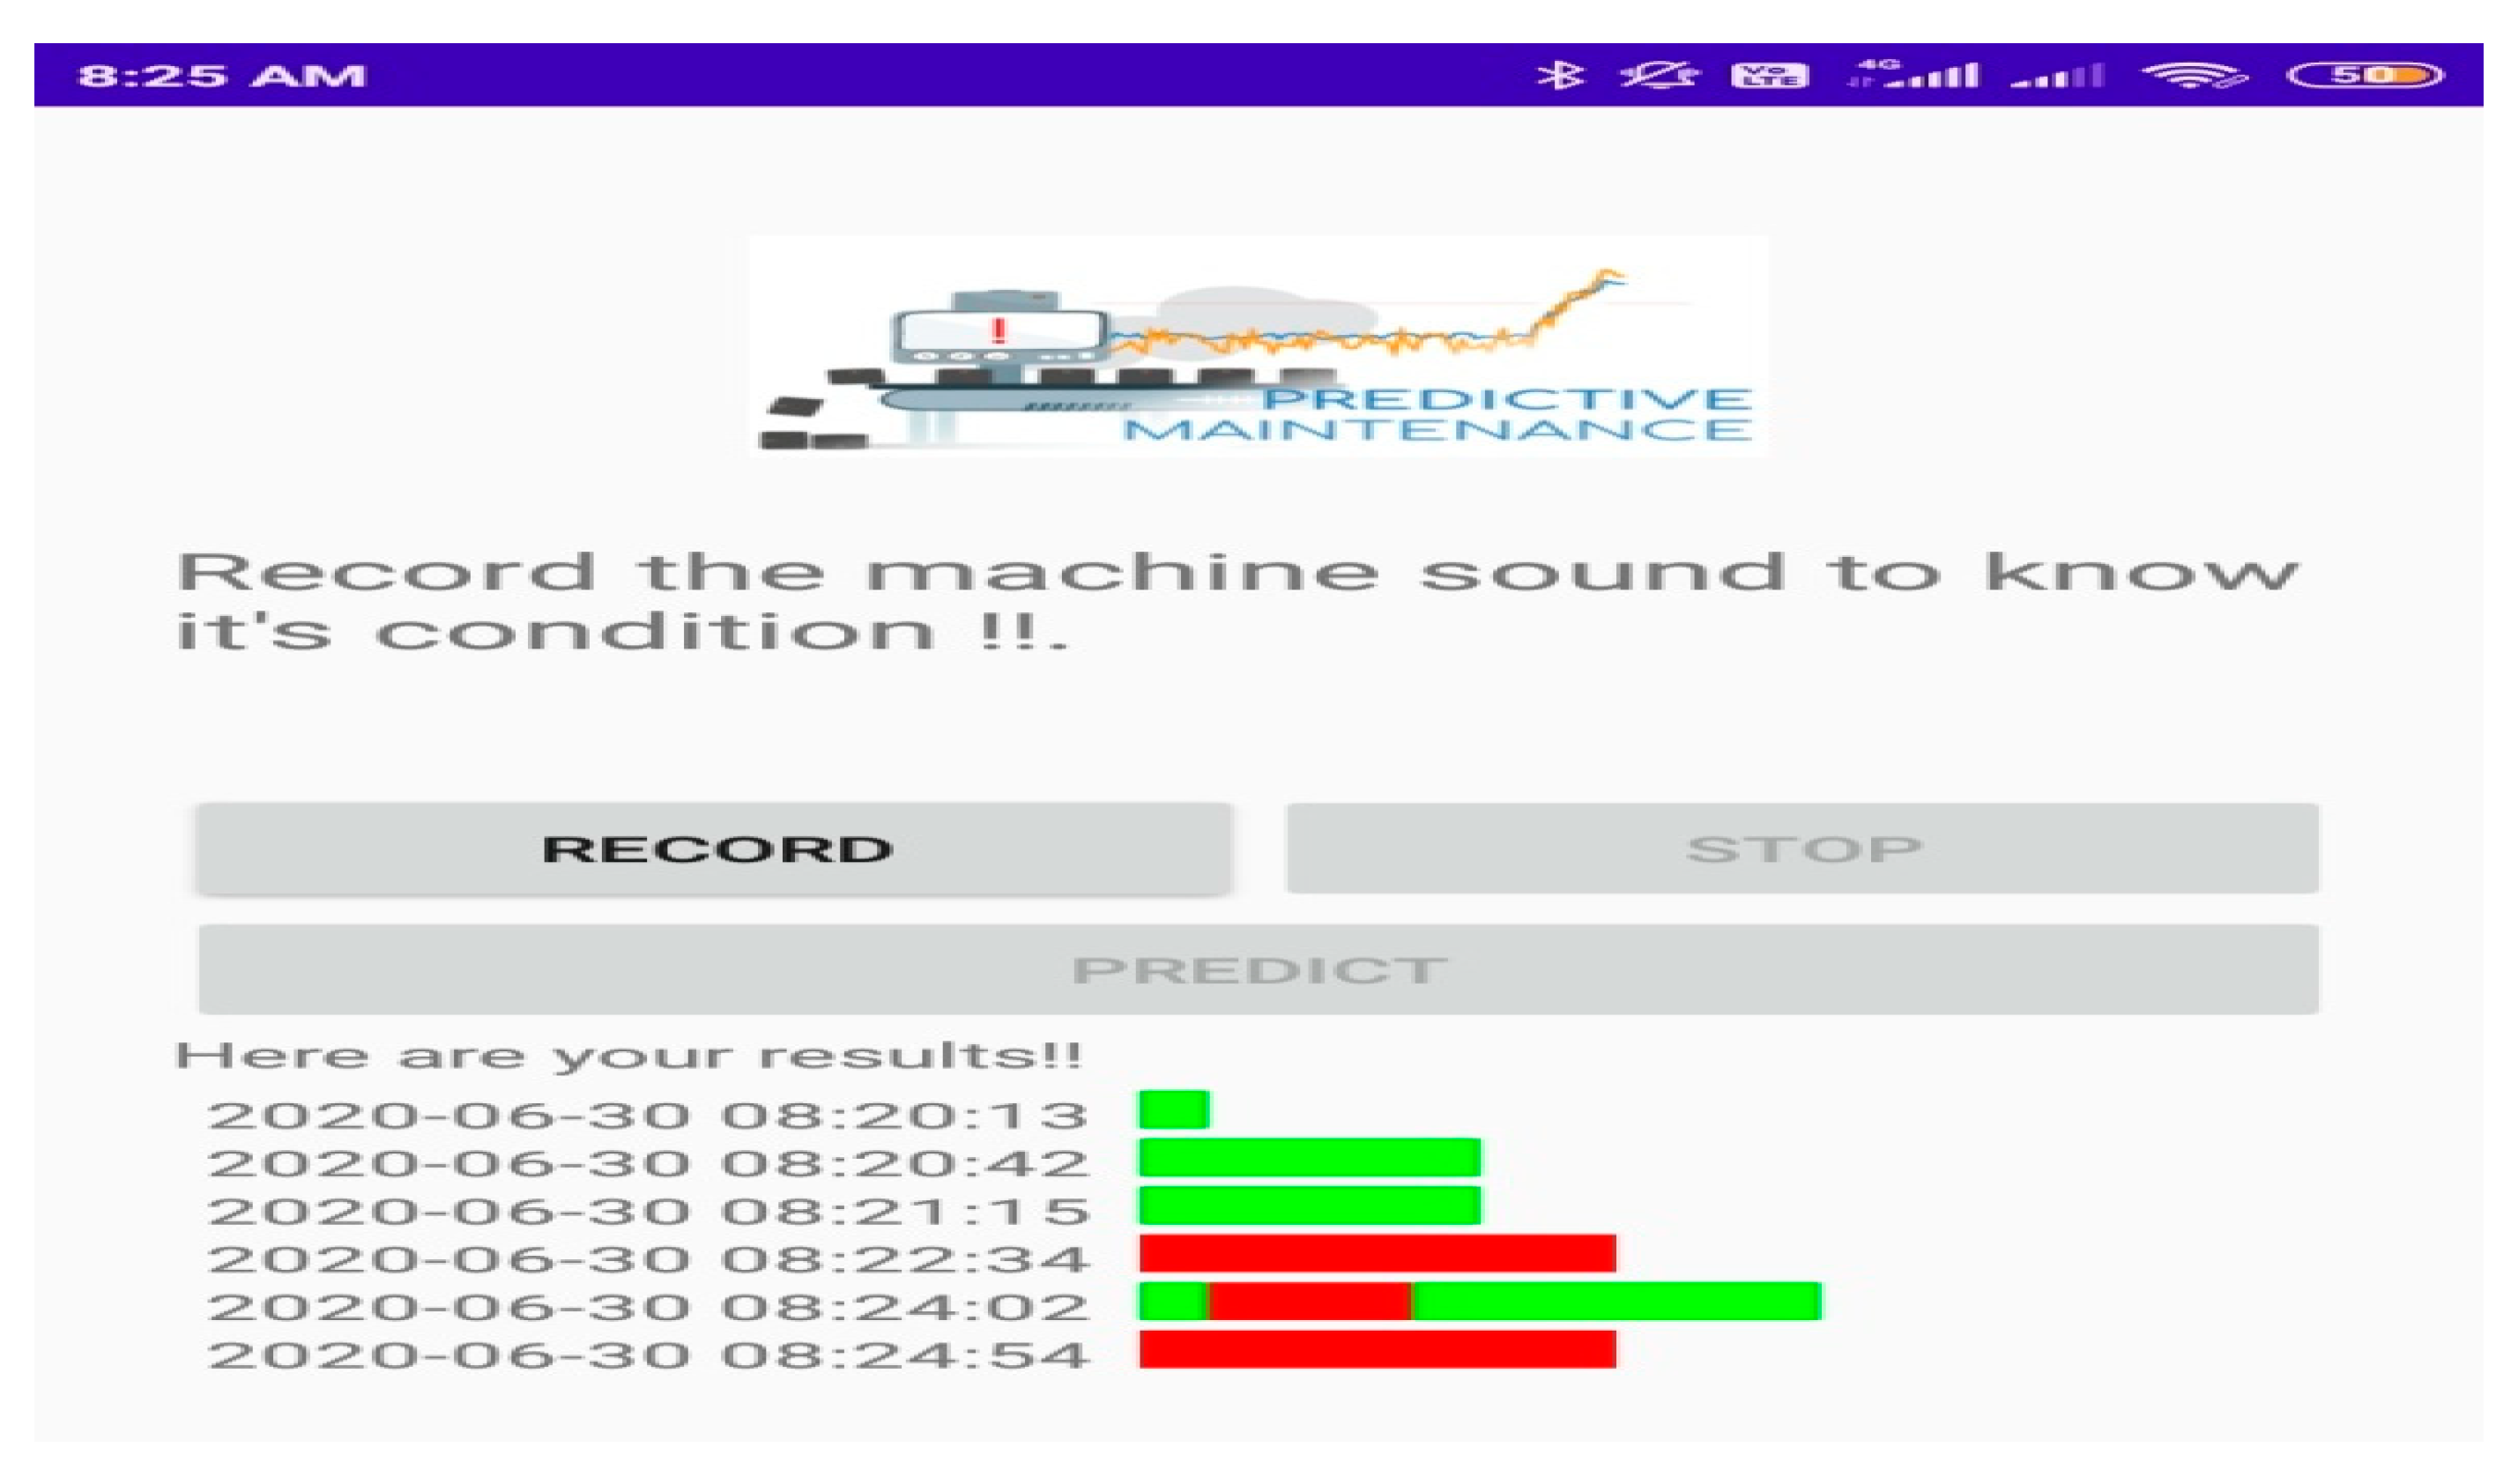
The user interface is created with Android Studio (for front-end) and with Flask (for back-end), and the application provides the user to record the functioning of a machine (through sound) and visualize its health status, such as whether it is normal or abnormal, as well as the time stamp, allowing the user to gain insight into the machine’s condition [40,44,45,46,47,48].
Features of User Interface
- Record Button—Starts the recording.
- Stop Button—Stops the recording and the file is saved in local machine.
- Predict Button—Sends the stored file to the Flask API (application programming interface), which carries out the prediction and returns the results to the android app (front end).
- Visualization—Process time is displayed alongside the received answer from the flask API, with red indicating abnormal and green indicating normal.
3.4. Experimental Setup
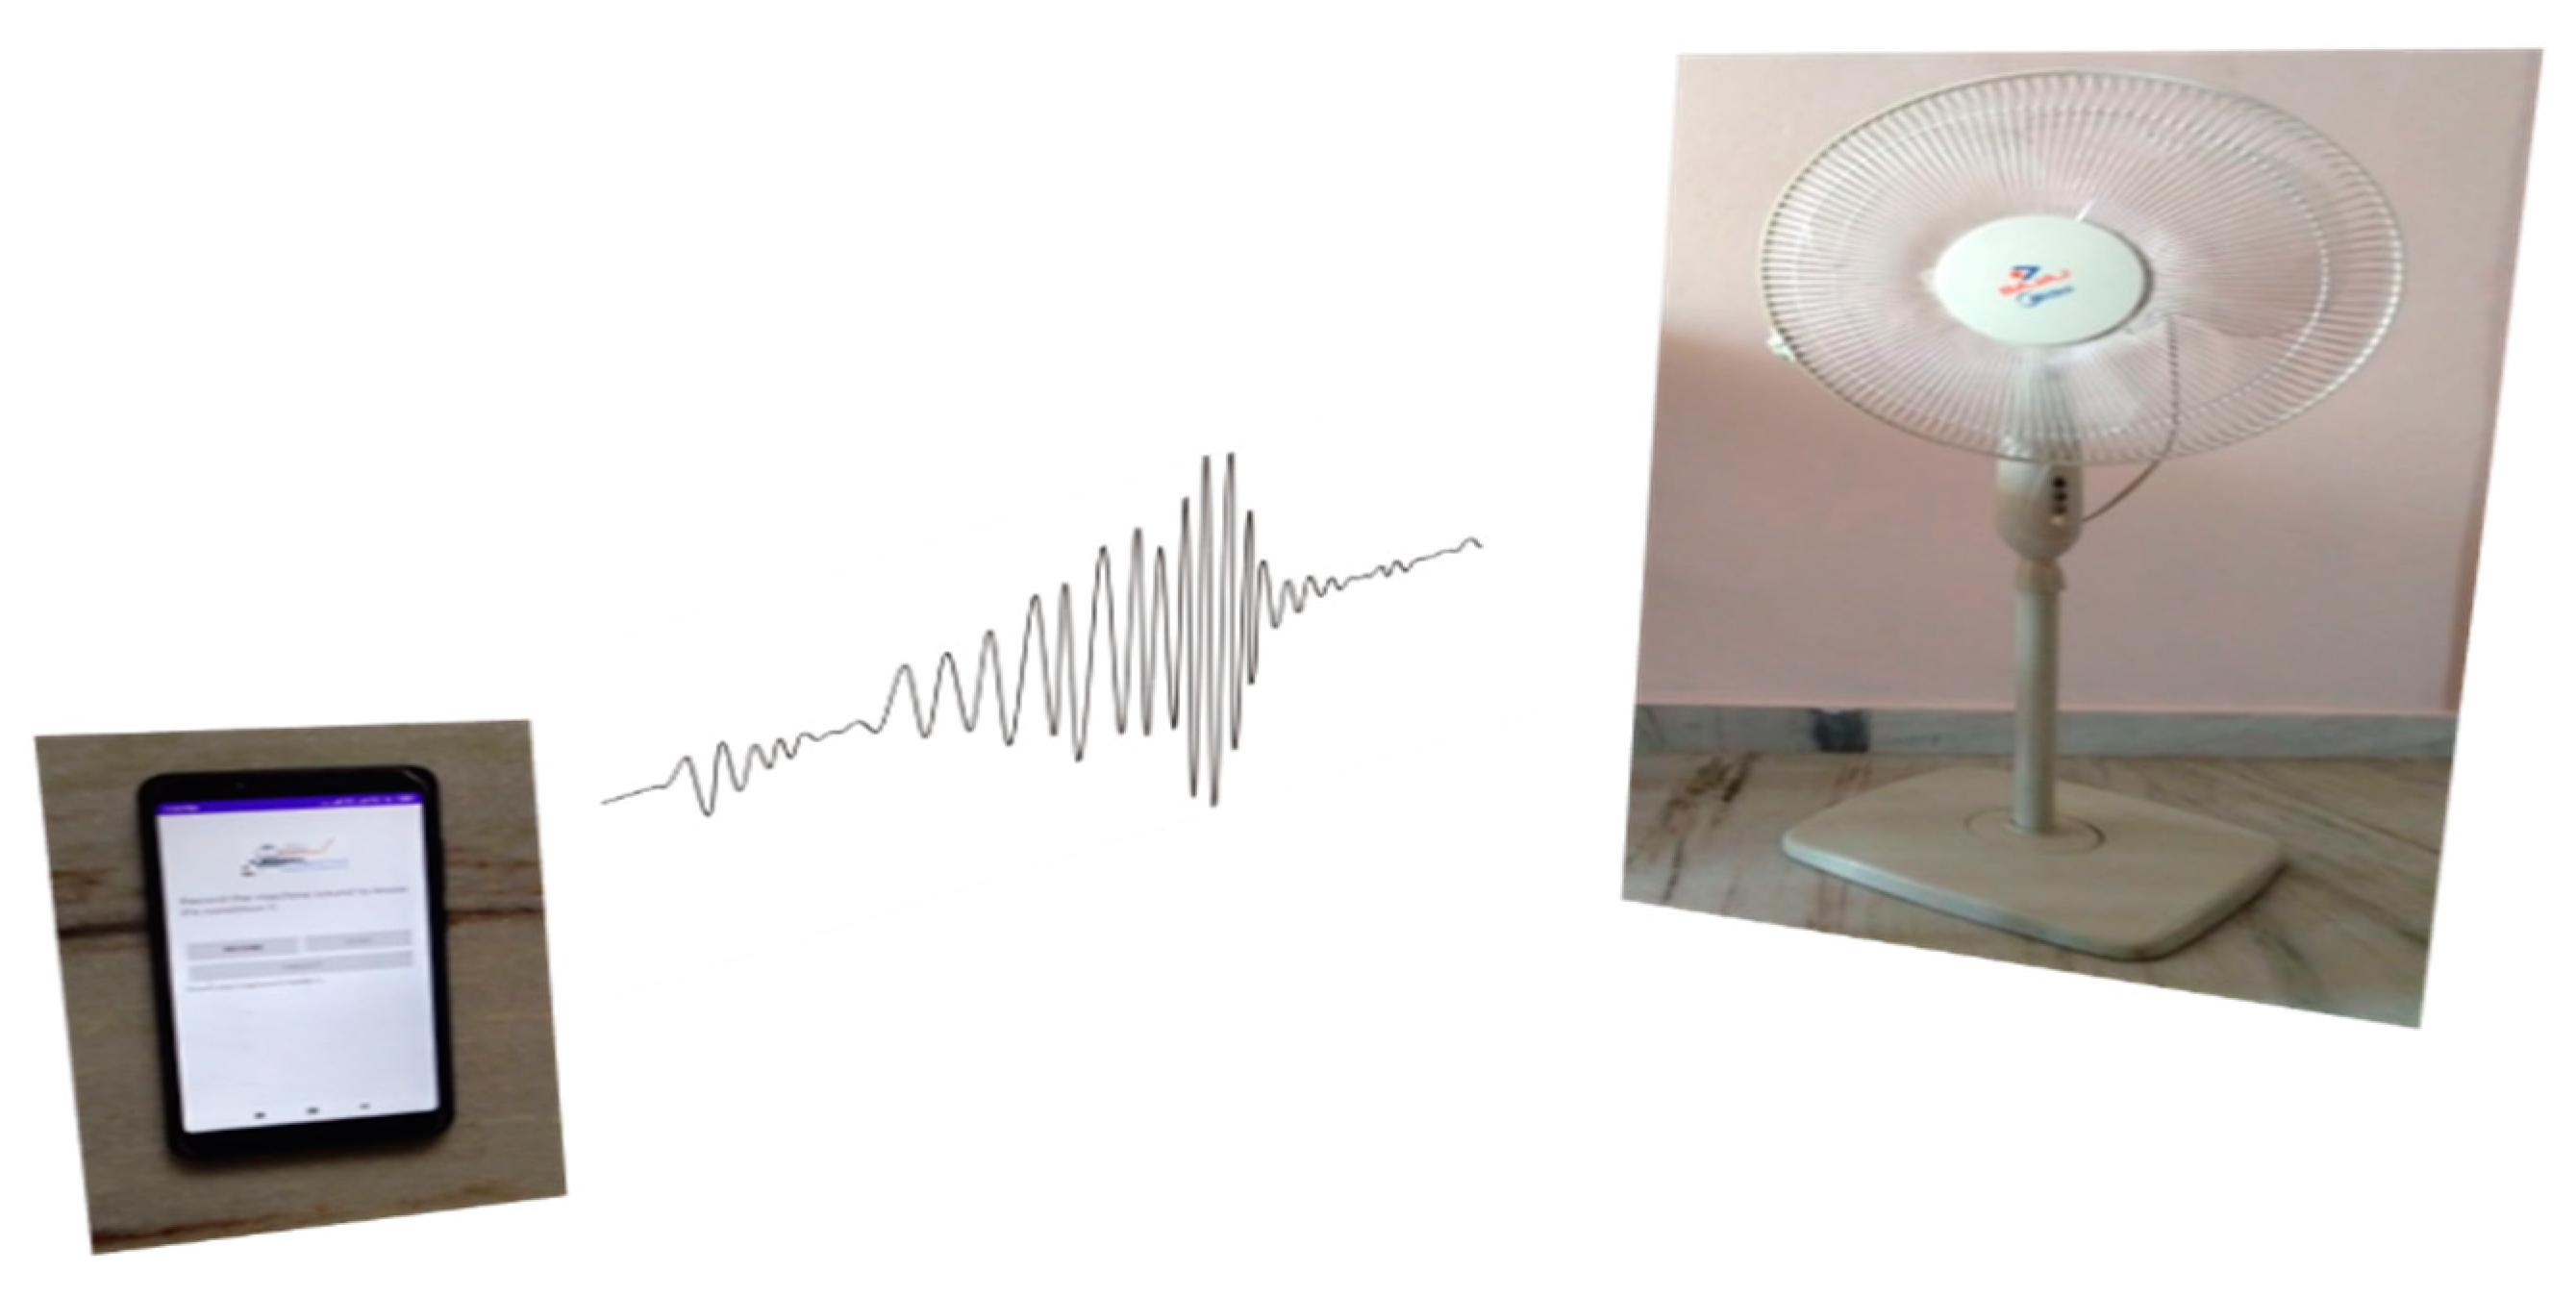
The suggested approach tries to anticipate the occurrence of anomalies in a machine. This necessitates the collection of data from the machine. As a result, acoustic signals from the machine are employed in our technique to assess the machine’s condition. Various industrial sounds are gathered and utilized as background noise while trying to mimic the industrial setting. This work also considers the research implications of the development of an entropy measure to identify the defective components of an axial piston pump [46] and a rolling bearing fault diagnosis based on variational mode decomposition(VMD) and degree of cyclo stationarity(DCS) demodulation [47]. This encourages the development of robust model that also functions well in a noisy environment. As part of the experimentation, we use a home table fan to mimic an industrial machine, and the noises generated by the table fan were captured both normally and abnormally, as shown in Figure 7 and Figure 8. Once the mobile application reads the signals from the machine, the identified features are extracted and stored in the dataset using the “librosa library” of the python programming environment. As mentioned in the previous section, each feature has its way of representing information captured from the acoustic signal. Chroma Shift, a floating point representation, presents the quality of the sound and helps to categorize it into various scales such as higher, medium, and lower. RMSE, a floating point representation, contains the total magnitude of the signal. Spectral Centroid, A floating point representation, contains the location of the center of mass in the spectrum. This is useful in the characterization of the audio file signal. Spectral Bandwidth, is a floating point representation, to know the difference between the upper and lower frequency spectrum. Spectral roll-off, a floating point representation, helps in deriving the power spectrum and is further useful to remove the noise in the signals. Zero Crossing Rate, a floating point representation, a measure at which the signal is going through the zeroth line(positive to negative or vice versa), and MFCC, a floating point representation, useful in the representation of sound in a mel scale of frequency. This information is needed to train, develop, and test a machine learning model that can forecast the health of a machine.
3.5. Dataset Description
The characteristics of the acoustic signals that are retrieved using signal processing conducted using a python package named “librosa” are the properties contained in the dataset as indicated in Table 1. Each sample is also given identification called “faculty category” or “non-fault category”. The audio samples acquired by the equipment contain 450 normal samples and 450 aberrant samples. There were 50% of fault-category dataset elements and another 50% of non-fault-category dataset elements. As there were two identification labels for the entire dataset, this is considered as a two-class classification problem. These samples have of a total of 900 audio signals with the ratio of 70:20:10 supplied during the training, testing, and validation process of the model. These samples along with the identification label were supplied to the models during the phase of training, and were further tested without supply of identification label. These samples have the characteristics listed in Table 1 that are utilized to train and develop the suggested model that predicts the health of the machine.
4. Results and Discussion
The experimental setup mentioned in the above section is examined with various machine learning algorithms and has the following characteristics with various accuracy metrics during the training process. The parameters supplied to various models during the training are the basic and standard utilization such as sample size for training and testing. Other parameters include:
- Decision Tree: Classifier parameters such as criterion, max_depth, split, etc.;
- XGBoost: General parameters, booster parameters, and learning parameters;
- SVM: Regularization parameters; and
- KNN: value-n, weights(uniform) and type of algorithm.
The following Table 2 presents the performance metrics of various algorithms.
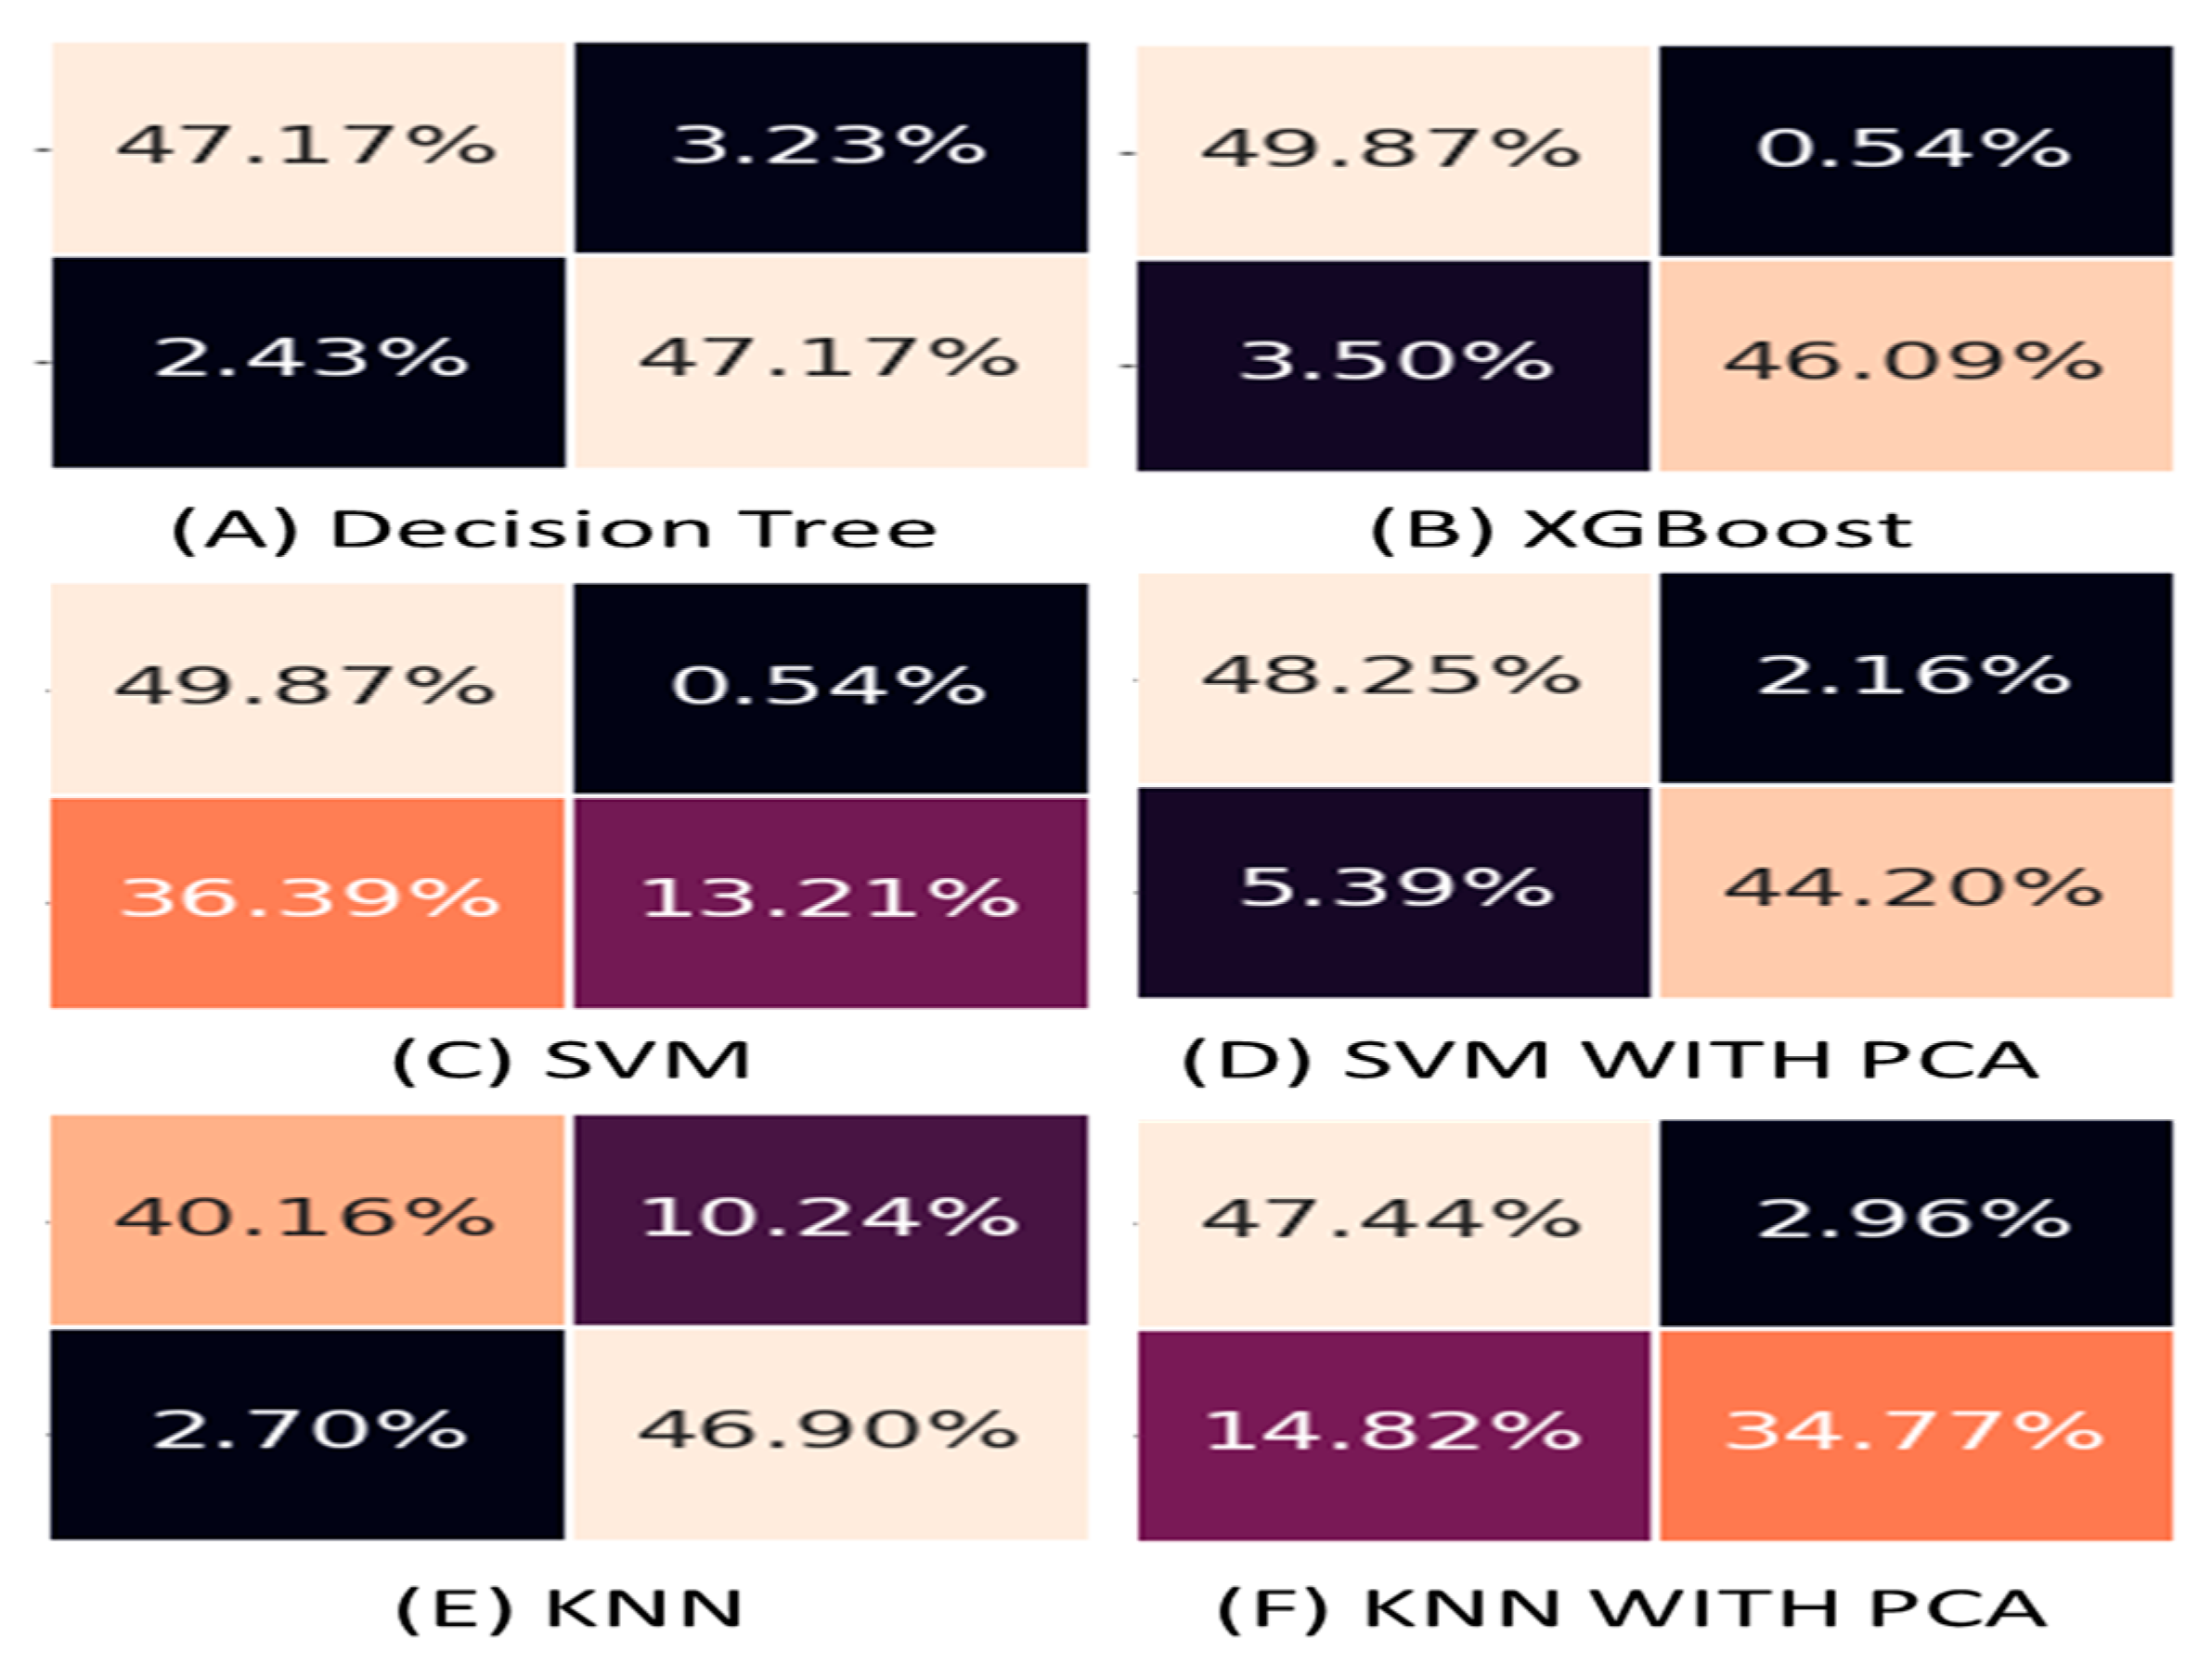
We have identified the highest performing model with six models such as decision tree, SVM model, SVM with PCA, XGBoost, KNN, and KNN with PCA for the prediction of machines health. In this comparison, performance measurements such as accuracy, precision, recall, F1 score, confusion matrix, and area under the ROC curve were used. Based on the findings in Table 2, the XGBoost model, with an accuracy of 95.95 percent, outperforms the Decision Tree, SVM with PCA, KNN, KNN with PCA, and SVM models, which have accuracies of 94.33 percent, 92.45 percent, 87.06 percent, 82.21 percent, and 72.77 percent, respectively. The performance of the models during the training stage is assessed using the confusion matrix. The measures of various algorithms cannot give any interpretations of the dataset which were classified correctly and incorrectly. Incorrect classification may happen due to the dataset properties and wrong class label. The confusion matrix is a metric that gives a total picture of the working model of the algorithm. It also helps us to know the imbalanced property of the data. It is a matrix of 2 × 2 size (for binary classification) that includes the number of data points/datasets that were classified correctly and incorrectly for a given class label. Similarly, it is assessed for the other class label too. These matrix values help in deriving the other performance metrics such as recall, precision, and accuracy. The confusion matrix can be easily accessed as part of the programming of each algorithm. In Figure 9, for the XGBoost algorithm, we observe that out of 50% of the dataset which needs to be of fault identification, XGBoost could predict correctly with 49.87% and 0.54% of misclassification toward fault identification. Similarly, we observe that out of 50% of the dataset which needs to be of non-fault identification, XGBoost could predict correctly with 44.20% and 5.39% of misclassification. As demonstrated in Figure 9, XGBoost has the highest precision among all, this shows that 98% of the failures it predicted are correct. Though, the decision tree gives out a better recall value than XGBoost. The F1-score which represents both precision and recall together is high for XGBoost.
True positive and true negative values are higher in a good-performing model, whereas false-positive and false-negative values are lower [34]. The XGBoost model has the greatest true-negative rate and the lowest false-positive rate, as shown in Figure 9. When compared to the XGBoost model, decision tree has the lowest false-negative rate and the greatest true-positive, but it also has a higher false-positive rate and a lower true-negative rate. As a result, the decision tree performs worse than XGBoost. As a result of analyzing the confusion matrices of six prediction models, it is clear that XGBoost outperforms the others.
The ROC curve (receiver operating characteristic) of the employed algorithms, decision tree, XGBoost, SVM with PCA, KNN, SVM, KNN with PCA, is shown in Figure 10. The trade-off between sensitivity and specificity is depicted by the ROC curve. The model with higher performance usually has a roc curve that is closer to the plot’s upper left corner [35]. Furthermore, the area under the ROC curve is among the finest measures for evaluating the model’s performance. The model’s ability to discriminate between positive and negative classes is represented by the area under the ROC curve. The greater the AUC, the better the model’s performance. When we analyze the ROC curves of the four algorithms discussed, the ROC curve of XGBoost model, with the vertex start at the top left of the plot and an AUC (area under the curve) of 0.99, outperforms decision tree, SVM model, SVM with PCA, KNN, and KNN with PCA, which have AUCs of 0.94, 0.92, 0.95, 0.89, and 0.94, respectively.
Furthermore, the experimentation of this work and its results are compared with the results of “Fault Prediction Recommender Model for IoT Enabled Sensors Based Workplace” as it is closer to the design methodology. It is observed that the prediction of faults in smart offices with the random forest algorithm occurs with an accuracy of 94.27%. The model presented in this manuscript, especially XGBoost has shown a greater impacted accuracy of 99%. Another comparison of the study observed in similar work is in [48]; the sensors present in the devices are programmed to capture the health condition of the machines to cloud environment and thereby prediction of the health status is observed. The model presented in this manuscript uses a mobile application that can help any person in the industry to read the acoustic signals from the targeted machine, hence making the prediction of health conditions possible. In turn, the model presented in [48] is costlier and takes the cloud environment for model storage and prediction of the same; whereas the model presented in this manuscript uses a simple mobile application that is easy to use and does not require any other computational resources. Finally, this application can be adapted to any kind of industrial environment for the easier health status of the machinery with a greater impact and is easy to use with a simple mobile application.
Built of User Interface Using Android Environment and Flask
Finally, after the program is installed on hand-held devices such as mobile phones [42,43], the user may use it to record the set of actions mentioned above, and the prediction model completes the work by displaying the findings as shown in Figure 11. User interfaces allow the user to see the results of the prediction.
5. Conclusions
This paper presents a comprehensive study on machine learning algorithms employed to predict prior failures in any equipment. Though few techniques such as reactive and preventive maintenance exist, they have certain drawbacks. Early detection of a machine’s health can improve the machine’s dependability, efficiency, and availability. Machine learning algorithms aid in the more accurate prediction of a machine’s health. Acoustic signals from the machine were collected, and signal processing was performed to extract several audio characteristics that were utilized to create the model such as spectral centroid, spectral bandwidth, spectral rolloff, zerocrossing rate, RMSE, MFCC, and so on. Working with and analyzing the performance of several machine learning algorithms provided us the freedom to select the most appropriate machine learning algorithm for our needs. Metrics such as accuracy, precision, recall, confusion matrix, and AUC-ROC were used in deciding on the best model. Visual representation of models in the form of trees and decision boundaries were also obtained to understand the ML models better. Among the algorithms we worked with i.e., decision tree, XGBoost, support vector machine, KNN, the XGBoost model had the highest accuracy, followed by the decision tree model. Furthermore, the designed user interface aids in better understanding the anomaly and enables users to monitor and comprehend the health status of the industrial machine with greater convenience and precision. As a result, when employed in real-time, this technique can promote the system’s throughput and resilience. Moreover, it can help achieve a better insight into the current condition of the system and thereby lower the maintenance cost significantly. This work can be taken further by testing the experimentation process with deep learning models that could be integrated easily into many real-world applications.
Author Contributions
Conceptualization, S.Y., J.G., S.R.S., and S.-C.K.; methodology, J.G., and S.K.; software, S.Y., J.G., S.R.S., and S.-C.K.; validation, S.Y., S.R.S., and S.-C.K.; formal analysis, S.Y., J.G., and S.-C.K.; investigation, S.R.S., J.G., and S.-C.K.; resources, S.Y., S.K., S.R.S., S.-C.K.; data curation, S.Y., S.K., and S.R.S.; writing—original draft preparation, S.Y., J.G., S.R.S., and S.-C.K.; writing—review and editing, S.Y., J.G., and S.R.S.; visualization, S.R.S., S.K., and S.-C.K.; supervision, S.Y., S.R.S., and S.-C.K.; project administration, J.G., S.-C.K., and S.R.S.; funding acquisition, S.R.S. and S.-C.K. All authors have read and agreed to the published version of the manuscript.
Funding
This research work was funded by WOOSONG UNIVERSITY’s (Daejeon, Republic of Korea) Academic Research Funding—2023.
Institutional Review Board Statement
Not applicable.
Informed Consent Statement
Not applicable.
Data Availability Statement
Not applicable.
Conflicts of Interest
The authors declare no conflict of interest.
References
- Kothamasu, R.; Huang, S.H.; Verduin, W.H. System health monitoring and prognostics—A review of current paradigms and practices. Int. J. Adv. Manuf. Technol. 2006, 28, 1012–1024. [Google Scholar] [CrossRef]
- 5 Causes of Equipment Faulure. Available online: https://www.fiixsoftware.com/blog/5-causes-of-equipment-failure-and-what-you-can-do-to-prevent-it/ (accessed on 9 November 2022).
- What Is Reactive Maintenance? Types, Benefits, Cost, and Examples. Available online: https://coastapp.com/blog/reactive-maintenance/ (accessed on 9 November 2022).
- Preventive Maintenance: The Ultimate Guide [2023]. Available online: https://blog.infraspeak.com/preventive-maintenance/ (accessed on 9 November 2022).
- Predicictive Maintenance Explained. Available online: https://www.reliableplant.com/Read/12495/preventive-predictive-maintenance (accessed on 9 November 2022).
- Kwon, D.; Hodkiewicz, M.R.; Fan, J.; Shibutani, T.; Pecht, M.G. IoT-Based Prognostics and Systems Health Management for Industrial Applications. IEEE Access 2016, 4, 3659–3670. [Google Scholar] [CrossRef]
- Kazemi, M.A.A.; Hajian, S.; Kiani, N. Quality Control and Classification of Steel Plates Faults Using Data Mining. Appl. Math. Inf. Sci. Lett. 2018, 6, 59–67. [Google Scholar] [CrossRef] [PubMed]
- Tran, V.T.; Yang, B.-S.; Oh, M.-S.; Tan, A.C.C. Machine condition prognosis based on regression trees and one-step-ahead prediction. Mech. Syst. Signal Process. 2008, 22, 1179–1193. [Google Scholar] [CrossRef] [Green Version]
- Paolanti, M.; Romeo, L.; Felicetti, A.; Mancini, A.; Frontoni, E.; Loncarski, J. Machine Learning approach for Predictive Maintenance in Industry 4.0. In Proceedings of the 14th IEEE/ASME International Conference on Mechatronic and Embedded Systems and Applications, MESA, Oulu, Finland, 2–4 July 2018. [Google Scholar]
- Jimenez-Cortadi, A.; Irigoien, I.; Boto, F.; Sierra, B.; Rodriguez, G. Predictive Maintenance on the Machining Process and Machine Tool. Appl. Sci. 2019, 10, 224. [Google Scholar] [CrossRef] [Green Version]
- Mahantesh, N.; Aditya, P.; Kumar, U. Integrated machine health monitoring: A knowledge based approach. Int. J. Syst. Assur. Eng. Manag. 2013, 5, 371–382. [Google Scholar] [CrossRef]
- Yan, R.; Gao, R.X. Approximate Entropy as a diagnostic tool for machine health monitoring. Mech. Syst. Signal Process. 2007, 21, 824–839. [Google Scholar] [CrossRef]
- Siafara, L.C.; Kholerdi, H.A.; Bratukhin, A.; TaheriNejad, N.; Wendt, A.; Jantsch, A.; Treytl, A.; Sauter, T. SAMBA: A self-aware health monitoring architecture for distributed industrial systems. In Proceedings of the IECON 2017-43rd Annual Conference of the IEEE Industrial Electronics Society, Beijing, China, 29 October–1 November 2017. [Google Scholar]
- Lee, G.-Y.; Kim, M.; Quan, Y.-J.; Kim, M.-S.; Kim, T.J.Y.; Yoon, H.-S.; Min, S.; Kim, D.-H.; Mun, J.-W.; Oh, J.W.; et al. Machine health management in smart factory: A review. J. Mech. Sci. Technol. 2018, 32, 987–1009. [Google Scholar] [CrossRef]
- Gondal, I.; Yaqub, M.F.; Hua, X. Smart Phone Based Machine Condition Monitoring System. Lect. Notes Comput. Sci. 2012, 7667, 488–497. [Google Scholar] [CrossRef]
- Chen, C.; Zhang, B.; Vachtsevanos, G. Prediction of Machine Health Condition Using Neuro-Fuzzy and Bayesian Algorithms. IEEE Trans. Instrum. Meas. 2011, 61, 297–306. [Google Scholar] [CrossRef]
- Widodo, A.; Yang, B.-S. Support vector machine in machine condition monitoring and fault diagnosis. Mech. Syst. Signal Process. 2007, 21, 2560–2574. [Google Scholar] [CrossRef]
- Zhao, R.; Yan, R.; Chen, Z.; Mao, K.; Wang, P.; Gao, R.X. Deep learning and its applications to machine health monitoring. Mech. Syst. Signal Process. 2019, 115, 213–237. [Google Scholar] [CrossRef]
- XGBoost Documentation. Available online: https://xgboost.readthedocs.io/en/latest/ (accessed on 9 November 2022).
- XGBoost Algorithm. Available online: https://towardsdatascience.com/https-medium-com-vishalmorde-xgboost-algorithm-long-she-may-rein-edd9f99be63d (accessed on 9 November 2022).
- XGBoost: Enhancement over Gradient Boosting Machines. Available online: https://medium.com/@ODSC/xgboost-enhancement-over-gradient-boosting-machines-73abafa49b14 (accessed on 9 November 2022).
- Understanding the Gini Index and Information Gain in Decision Trees. Available online: https://medium.com/analytics-steps/understanding-the-gini-index-and-information-gain-in-decision-trees-ab4720518ba8 (accessed on 9 November 2022).
- Sampaio, G.S.; Filho, A.R.D.A.V.; da Silva, L.S.; da Silva, L.A. Prediction of Motor Failure Time Using an Artificial Neural Network. Sensors 2019, 19, 4342. [Google Scholar] [CrossRef] [PubMed] [Green Version]
- Biswal, S.; Sabareesh, G. Design and development of a wind turbine test rig for condition monitoring studies. In Proceedings of the 2015 International Conference on Industrial Instrumentation and Control (ICIC), Pune, India, 28–30 May 2015. [Google Scholar] [CrossRef]
- Tangirala, S. Evaluating the Impact of GINI Index and Information Gain on Classification using Decision Tree Classifier Algorithm. Int. J. Adv. Comput. Sci. Appl. 2020, 11, 612–619. [Google Scholar] [CrossRef] [Green Version]
- Zhang, Y. Support Vector Machine Classification Algorithm and Its Application. In Information Computing and Applications; Springer: Berlin/Heidelberg, Germany, 2012; pp. 179–186. [Google Scholar] [CrossRef]
- Wang, L. Research and Implementation of Machine Learning Classifier Based on KNN. IOP Conf. Series Mater. Sci. Eng. 2019, 677, 052038. [Google Scholar] [CrossRef]
- Kulkarni, K.; Devi, U.; Sirighee, A.; Hazra, J.; Rao, P. Predictive Maintenance for Supermarket Refrigeration Systems Using Only Case Temperature Data. In Proceedings of the 2018 Annual American Control Conference (ACC), Milwaukee, WI, USA, 27–29 June 2018. [Google Scholar]
- Meyda. Available online: https://meyda.js.org/audio-features (accessed on 9 November 2022).
- Fernandes, S.; Antunes, M.; Santiago, A.R.; Barraca, J.P.; Gomes, D.; Aguiar, R.L. Forecasting Appliances Failures: A Machine-Learning Approach to Predictive Maintenance. Information 2020, 11, 208. [Google Scholar] [CrossRef] [Green Version]
- Durbhaka, G.; Selvaraj, P. Predictive Maintenance for Wind Turbine Diagnostics using Vibration Signal Analysis based on Collaborative Recommendation Approach. In Proceedings of the 2016 International Conference on Advances in Computing, Communications and Informatics (ICACCI), Jaipur, India, 21–24 September 2016. [Google Scholar] [CrossRef]
- Zero-Crossing Rate. Available online: https://wiki.aalto.fi/display/ITSP/Zero-crossing+rate (accessed on 9 November 2022).
- Speech Recognition-Feature Extraction MFCC & PLP. Available online: https://medium.com/@jonathan_hui/speech-recognition-feature-extraction-mfcc-plp-5455f5a69dd9 (accessed on 9 November 2022).
- Understanding Confusion Matrix. Available online: https://towardsdatascience.com/decoding-the-confusion-matrix-bb4801decbb (accessed on 9 November 2022).
- Hajian-Tilaki, K. Receiver Operator Characteristic Analysis of Biomarkers Evaluation in Diagnostic Research. J. Clin. Diagn. Res. 2018, 12, LE01–LE08. [Google Scholar] [CrossRef]
- Arias, P.A. Planning Models for Distribution Grid. U. Porto J. Eng. 2018, 4, 42–55. [Google Scholar] [CrossRef] [Green Version]
- Binding, A.; Dykeman, N.; Pang, S. Machine Learning Predictive Maintenance on Data in the Wild. In Proceedings of the 2019 IEEE 5th World Forum on Internet of Things (WF-IoT), Limerick, Ireland, 15–18 April 2019. [Google Scholar] [CrossRef]
- Anshari, M.; Syafrudin, M.; Fitriyani, N.L. Fourth Industrial Revolution between Knowledge Management and Digital Humanities. Information 2022, 13, 292. [Google Scholar] [CrossRef]
- Saiz, F.A.; Alfaro, G.; Barandiaran, I. An Inspection and Classification System for Automotive Component Remanufacturing Industry Based on Ensemble Learning. Information 2021, 12, 489. [Google Scholar] [CrossRef]
- Vaccaro, L.; Sansonetti, G.; Micarelli, A. An Empirical Review of Automated Machine Learning. Computers 2021, 10, 11. [Google Scholar] [CrossRef]
- Mukhtar, H.; Rubaiee, S.; Krichen, M.; Alroobaea, R. An IoT Framework for Screening of COVID-19 using Real-Time Data from Wearable Sensors. Int. J. Environ. Res. Public Health 2021, 18, 4022. [Google Scholar] [CrossRef] [PubMed]
- Krichen, M.; Mechti, S.; Alroobaea, R.; Said, E.; Singh, P.; Khalaf, O.I.; Masud, M. A formal testing model for operating room control system using internet of things. Comput. Mater. Contin. 2021, 66, 2997–3011. [Google Scholar] [CrossRef]
- Yeruva, S.; Ding, J.; Gaddam, A.; Brahmananda Reddy, A. CoviCare: An Integrated System for COVID-19, Emerging Computational Approaches in Telehealth and Telemedicine: A Look at The Post-COVID-19 Landscape. In Advances in Data Science-Driven Technologies; Bentham Science Publishers: Sharjah, United Arab Emirates, 2022; Volume 1, pp. 88–115. [Google Scholar] [CrossRef]
- Lin, T.-K. PCA/SVM-Based Method for Pattern Detection in a Multisensor System. Math. Probl. Eng. 2018, 2018, 6486345. [Google Scholar] [CrossRef] [Green Version]
- Gasmi, K.; Ben Ltaifa, I.; Lejeune, G.; Alshammari, H.; Ben Ammar, L.; Mahmood, M.A. Optimal Deep Neural Network-Based Model for Answering Visual Medical Question. Cybern. Syst. 2021, 53, 403–424. [Google Scholar] [CrossRef]
- Zhou, Y.; Kumar, A.; Parkash, C.; Vashishtha, G.; Tang, H.; Glowacz, A.; Dong, A.; Xiang, J. Development of entropy measure for selecting highly sensitive WPT band to identify defective components of an axial piston pump. Appl. Acoust. 2023, 203, 109225. [Google Scholar] [CrossRef]
- Zhen, D.; Li, D.; Feng, G.; Zhang, H.; Gu, F. Rolling bearing fault diagnosis based on VMD reconstruction and DCS demodulation. Int. J. Hydromechatron. 2022, 5, 205–225. [Google Scholar] [CrossRef]
- Uppal, M.; Gupta, D.; Mahmoud, A.; Elmagzoub, M.A.; Sulaiman, A.; Al Reshan, M.S.; Shaikh, A.; Juneja, S. Fault Prediction Recommender Model for IoT Enabled Sensors Based Workplace. Sustainability 2023, 15, 1060. [Google Scholar] [CrossRef]
Figure 1.
Block diagram of system overview.

Figure 2.
XGBoost model.

Figure 3.
Decision-tree model.

Figure 4.
SVM model visualization.

Figure 5.
KNN model visualization.

Figure 6.
Solution architecture.

Figure 7.
Desired experimental setup.

Figure 8.
Real-time experimental setup.

Figure 9.
Confusion matrices.

Figure 10.
Comparison of ROC curves.

Figure 11.
User interface.


Table 1.
Dataset description.
| SNO | Attribute | Attribute Type | Description |
|---|---|---|---|
| 1. | Chroma stft | Float | Chromogram based feature |
| 2. | RMSE | Float | Root-Mean-Square (RMS) energy for each frame of the audio signal |
| 3. | Spectral Centroid | Float | Indicates the frequency where the energy of the spectrum is centered. |
| 4. | Spectral bandwidth | Float | Indicates the bandwidth of the spectrum for each frame of the audio signal |
| 5. | Spectral roll-off | Float | Indicates the volume of the right skewedness of the power spectrum |
| 6. | Zero crossing rate | Float | Indicates the number of times the amplitude of the audio signal pas through zero |
| 7. | MFCC | Float | Coefficients that build up the mel frequency cepstrum |
Table 2.
Results.
| Algorithm | Performance Metrics | ||||
|---|---|---|---|---|---|
| Accuracy | Precision | Recall | F1 Score | Area under ROC Curve | |
| Decision Tree | 94.33 | 93.58 | 95.10 | 94.33 | 0.94 |
| XGBoost | 95.95 | 98.84 | 92.93 | 95.79 | 0.99 |
| SVM | 63.07 | 96.07 | 26.63 | 41.70 | 0.92 |
| SVM WITH PCA | 92.45 | 95.34 | 89.13 | 92.13 | 0.95 |
| KNN | 87.06 | 82.07 | 94.56 | 87.87 | 0.89 |
| KNN WITH PCA | 82.21 | 92.14 | 70.10 | 79.62 | 0.94 |
Disclaimer/Publisher’s Note: The statements, opinions and data contained in all publications are solely those of the individual author(s) and contributor(s) and not of MDPI and/or the editor(s). MDPI and/or the editor(s) disclaim responsibility for any injury to people or property resulting from any ideas, methods, instructions or products referred to in the content. |
© 2023 by the authors. Licensee MDPI, Basel, Switzerland. This article is an open access article distributed under the terms and conditions of the Creative Commons Attribution (CC BY) license (https://creativecommons.org/licenses/by/4.0/).
Share and Cite
MDPI and ACS Style
Yeruva, S.; Gunuganti, J.; Kalva, S.; Salkuti, S.R.; Kim, S.-C. Smart Machine Health Prediction Based on Machine Learning in Industry Environment. Information 2023, 14, 181. https://doi.org/10.3390/info14030181
AMA Style
Yeruva S, Gunuganti J, Kalva S, Salkuti SR, Kim S-C. Smart Machine Health Prediction Based on Machine Learning in Industry Environment. Information. 2023; 14(3):181. https://doi.org/10.3390/info14030181
Chicago/Turabian StyleYeruva, Sagar, Jeshmitha Gunuganti, Sravani Kalva, Surender Reddy Salkuti, and Seong-Cheol Kim. 2023. "Smart Machine Health Prediction Based on Machine Learning in Industry Environment" Information 14, no. 3: 181. https://doi.org/10.3390/info14030181
Note that from the first issue of 2016, this journal uses article numbers instead of page numbers. See further details here.