

Challenges Encountered and Lessons Learned when Using a Novel Anonymised Linked Dataset of Health and Social Care Records for Public Health Intelligence: The Sussex Integrated Dataset
 , and
, and 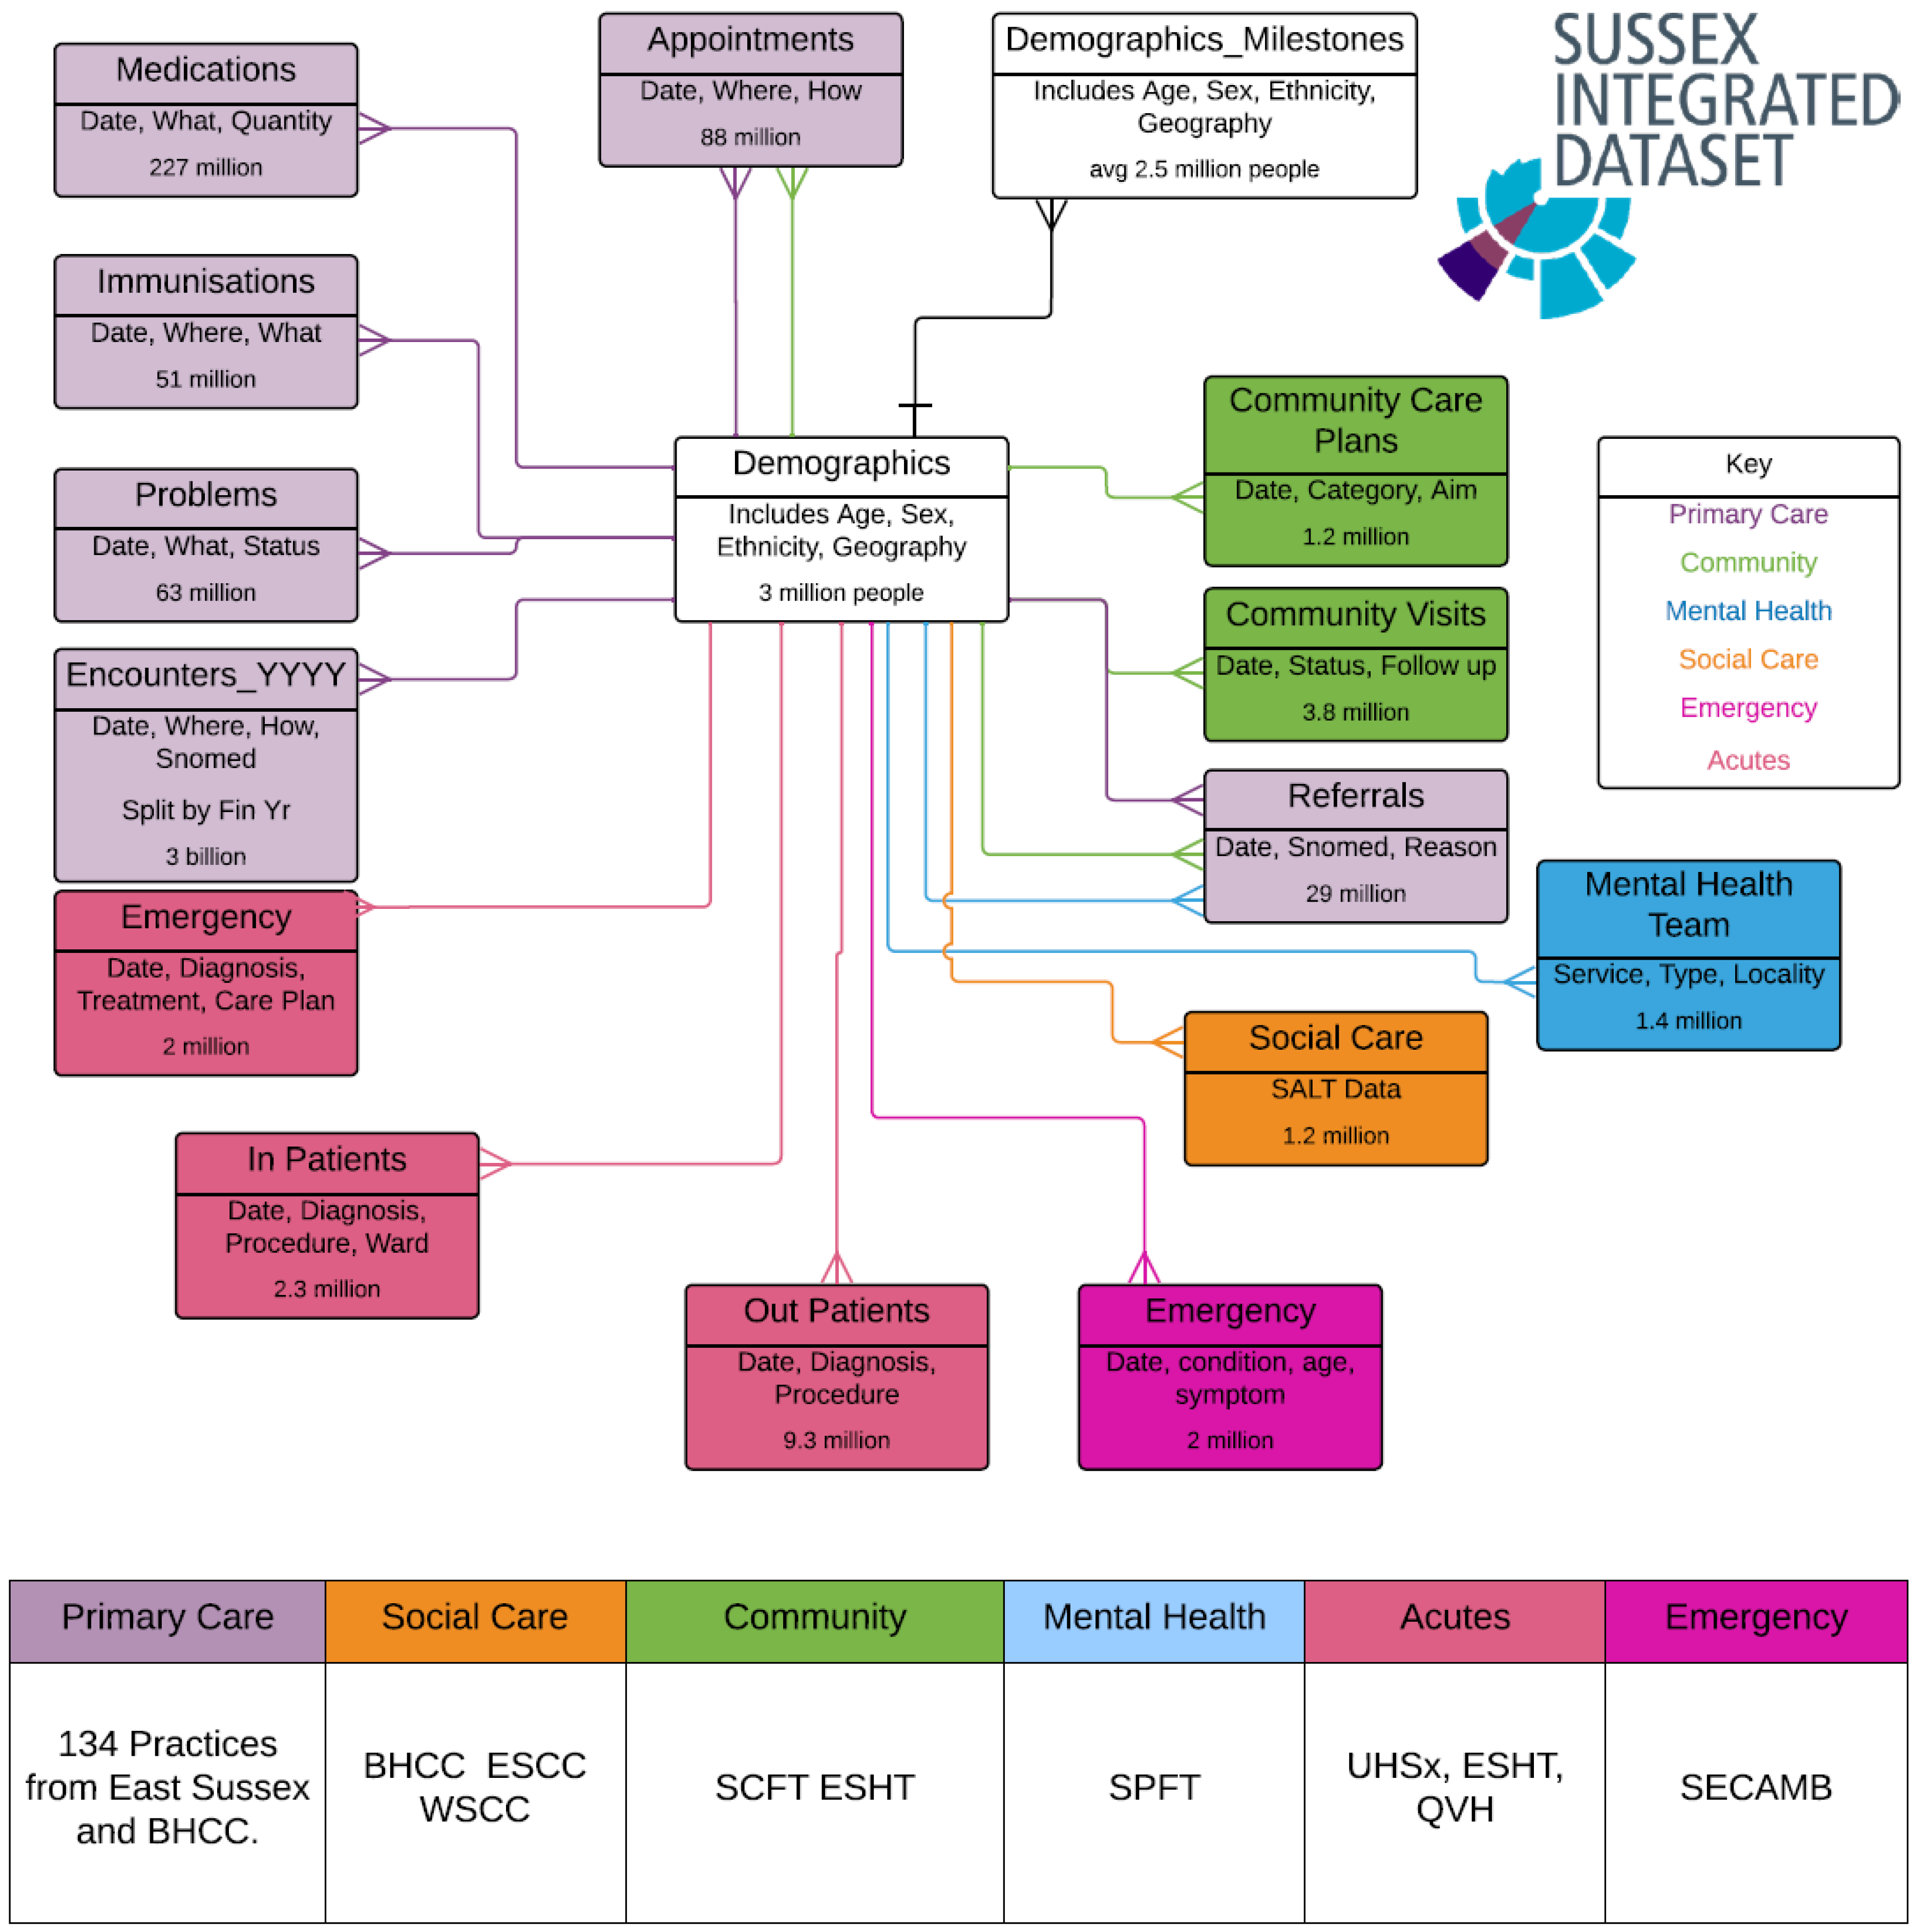
Abstract
:1. Introduction
2. Materials and Methods
2.1. The Data Source: Sussex Integrated Dataset
2.2. How Data Was Accessed
- (1)
- Identify efficient methods for evaluating the number of data sources for each individual;
- (2)
- Evaluate data quality and completeness of diagnostic codes for long term conditions and whether the number of people with a condition in SID was equivalent to numbers reported through traditional routes;
- (3)
- Develop early methods for describing multiple service use by an individual;
- (4)
- Explore the application of longitudinal modelling to identify individuals developing 2 or more long-term conditions at different ages, their socio-demographic risk factors and their service use;
- (5)
- Develop advanced presentation methods to communicate intelligence from these models to decision-makers in an easy-to-understand way.
2.3. Data Quality Assessment Methods, including Comparison of other Datasets to SID Outputs
- Disease prevalence from the UK Quality and Outcomes Framework (QOF) [14];
- National Diabetes Audit public reports on prevalence [15];
- National Cancer Registration and Analysis Service (NCRAS) incidence figures [16]
- Cardiovascular Disease Prevention Audit (CVDPREVENT), produced by the Office for Health Improvement and Disparities and the NHS Benchmarking Network [17];
- Number of maternity admissions in secondary care from local analysis of Hospital Episode Statistics and comparisons of overall numbers of emergency and elective admissions [18];
- Numbers of patients registered to primary care (GP) organisations [19];
- Office for National Statistics Death Data [20].
2.4. Methods for Identifying Multiple Long-Term Conditions—Development and Validation of Code Lists
2.5. Visualisation of Multidimensional Longitudinal Data
2.6. Ethics Statement
3. Results
3.1. Data Quality Activities to Identify an Analysable Cohort
3.1.1. Conflicting Demographic Values
3.1.2. Conflicting Date Stamps and Sparse Historical Events
3.1.3. Death
3.1.4. Visitors to Sussex
3.1.5. Duplication
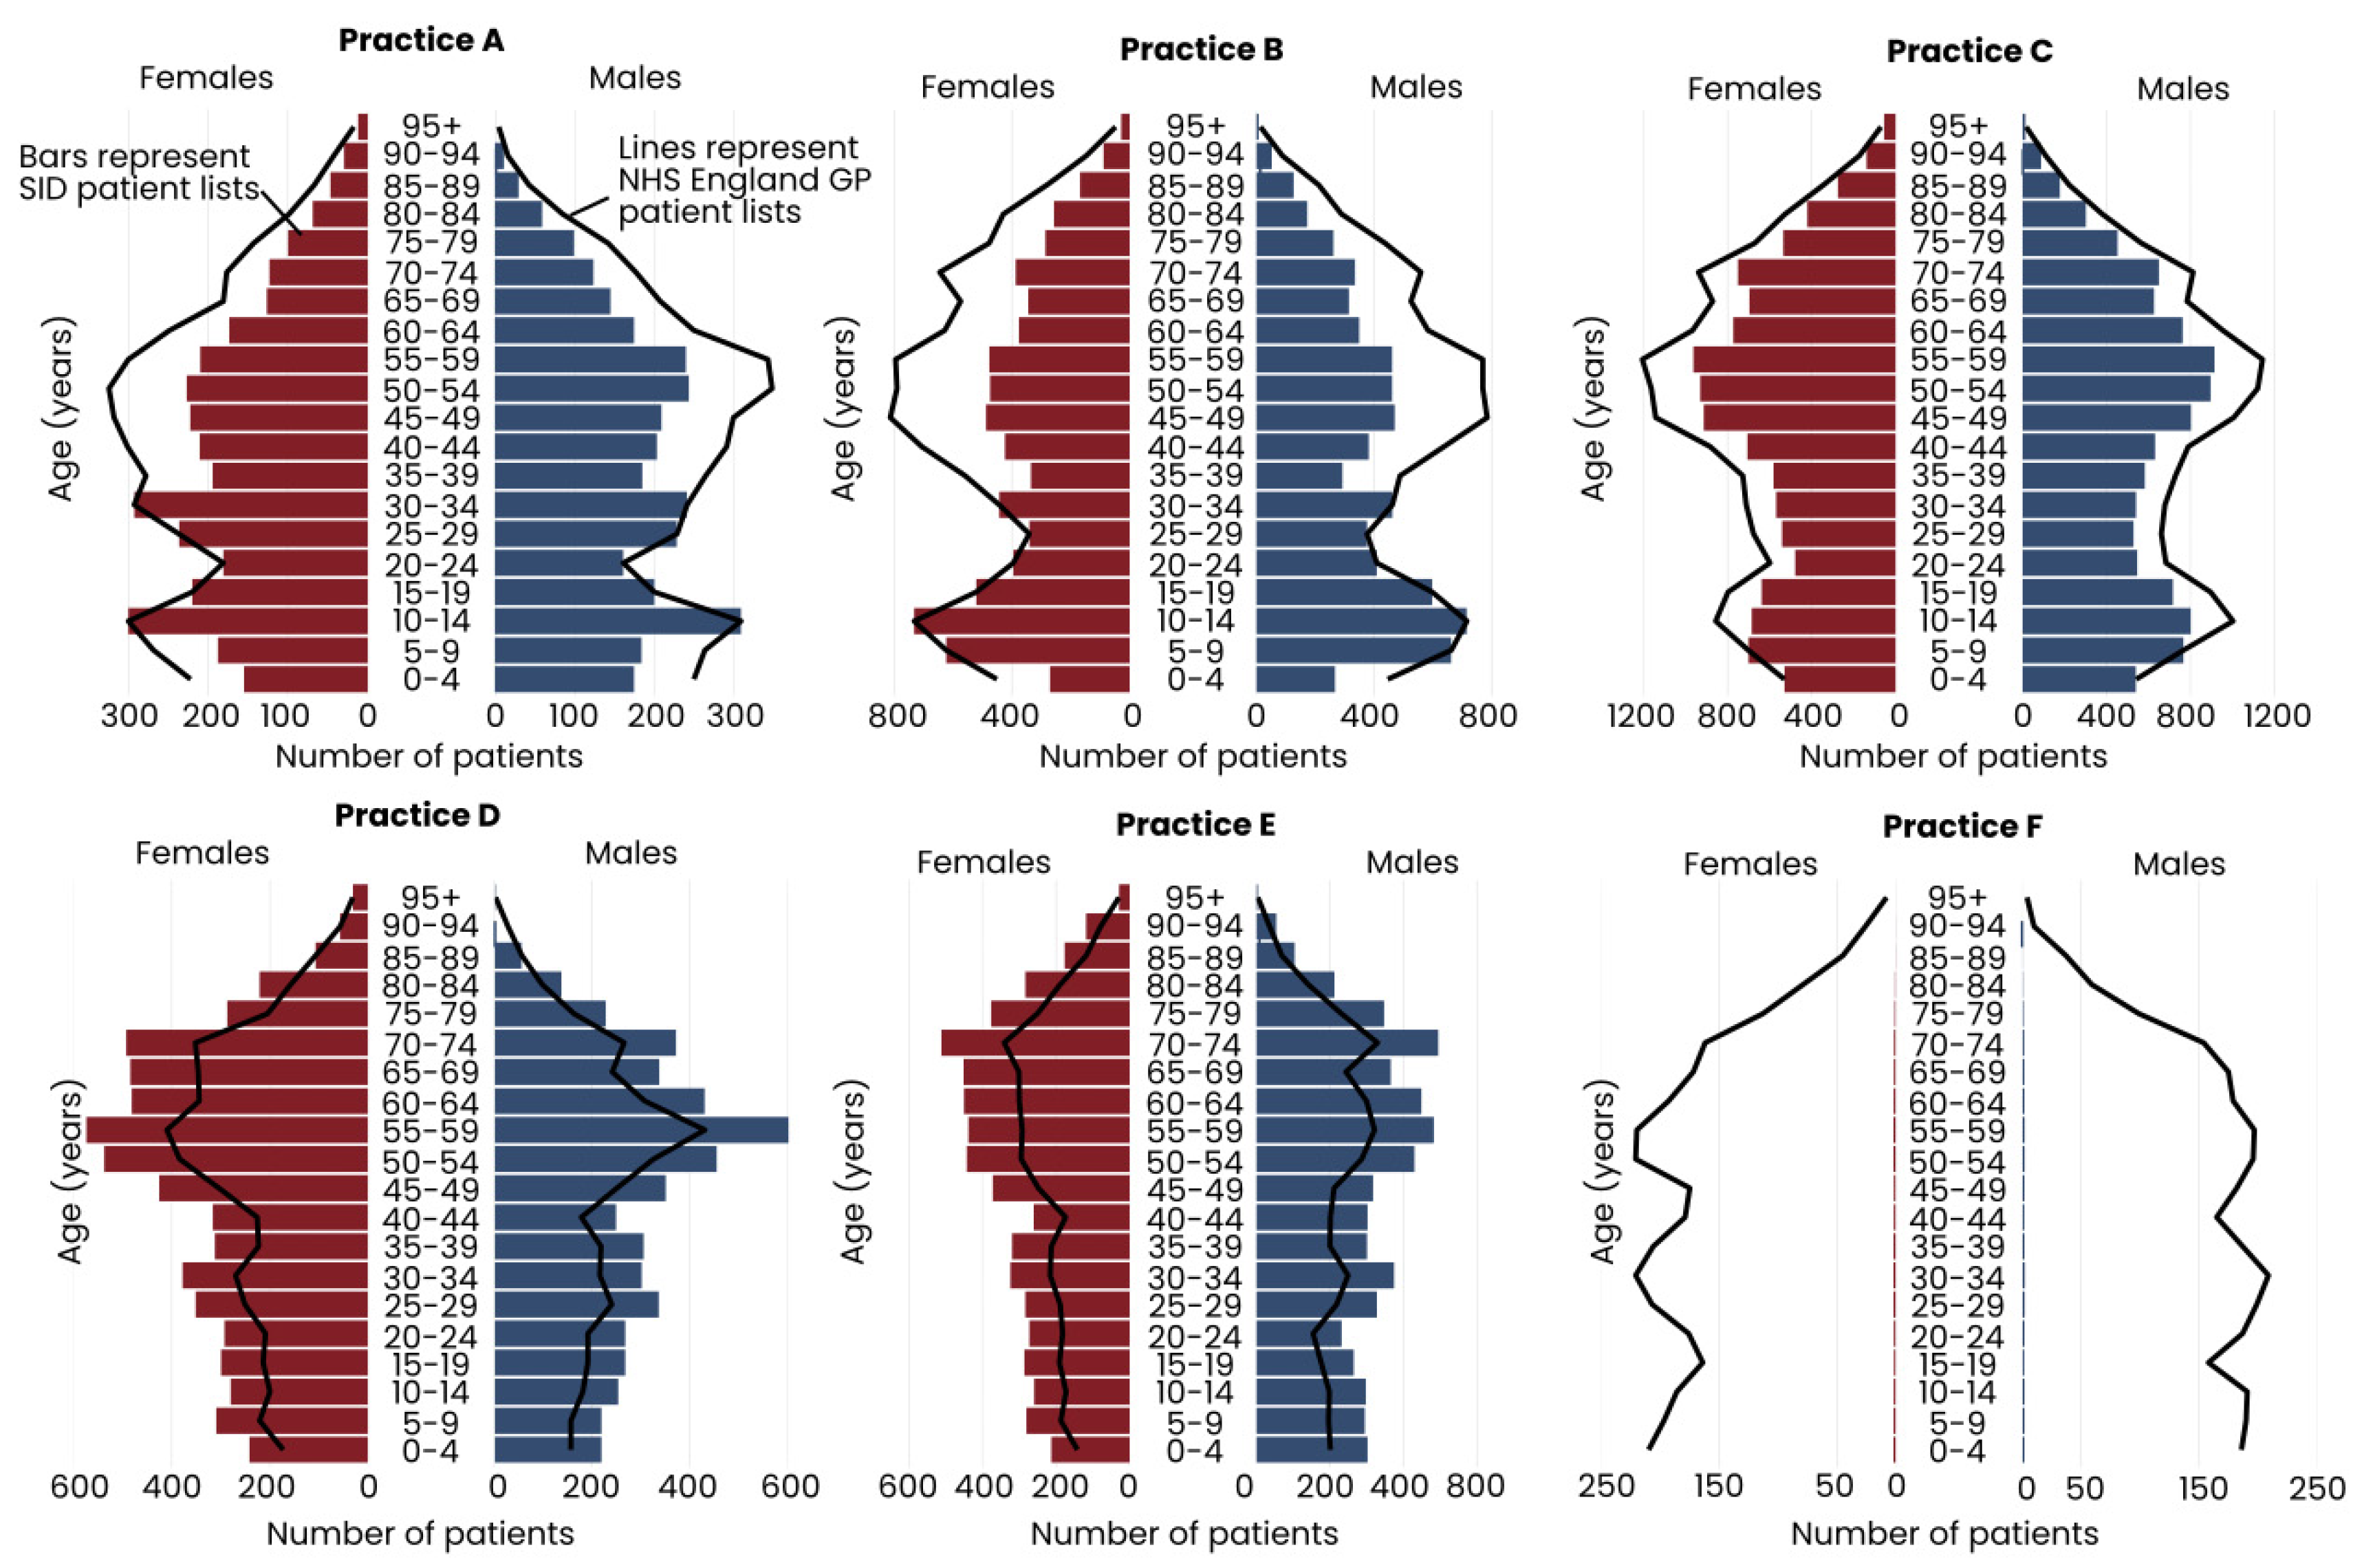
3.1.6. GP Practice List Sizes
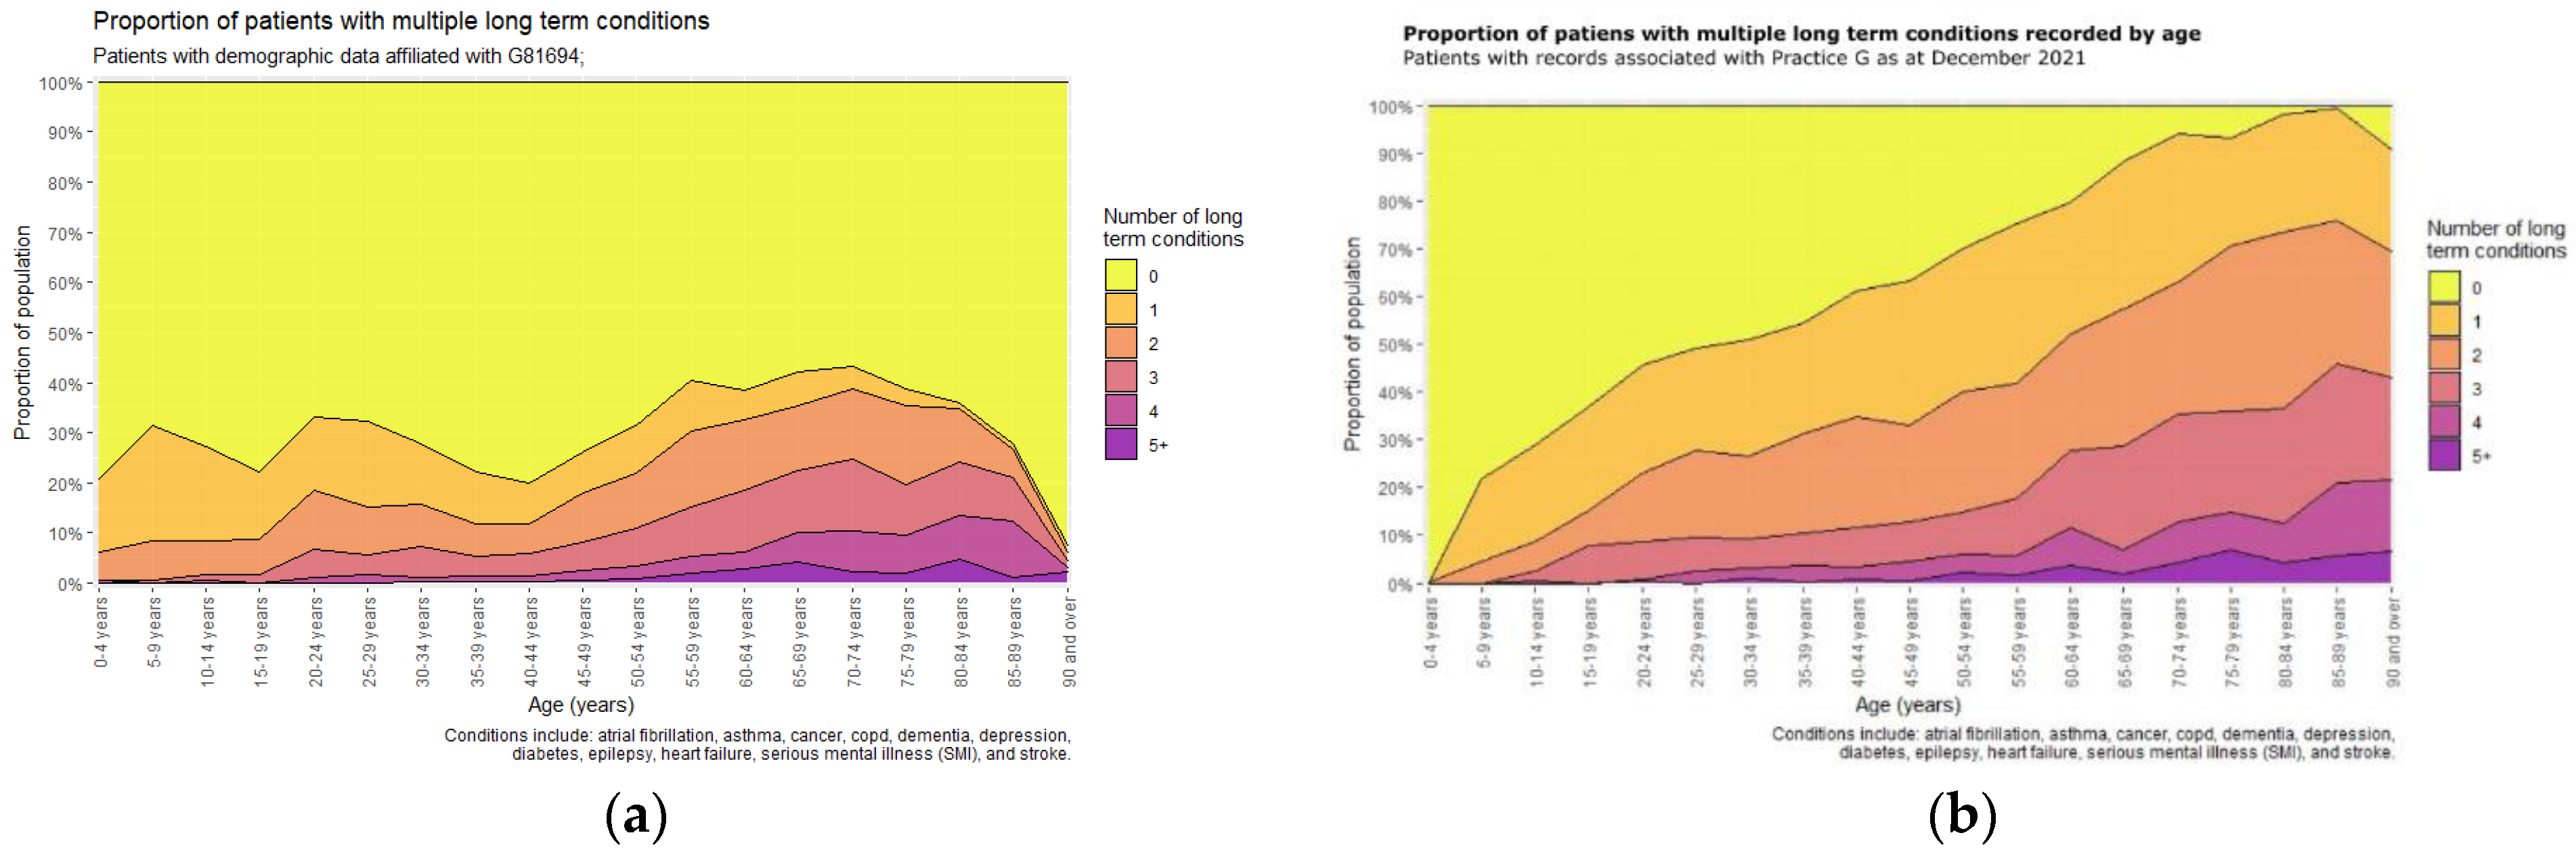
3.2. Identifying Multiple Long-Term Conditions
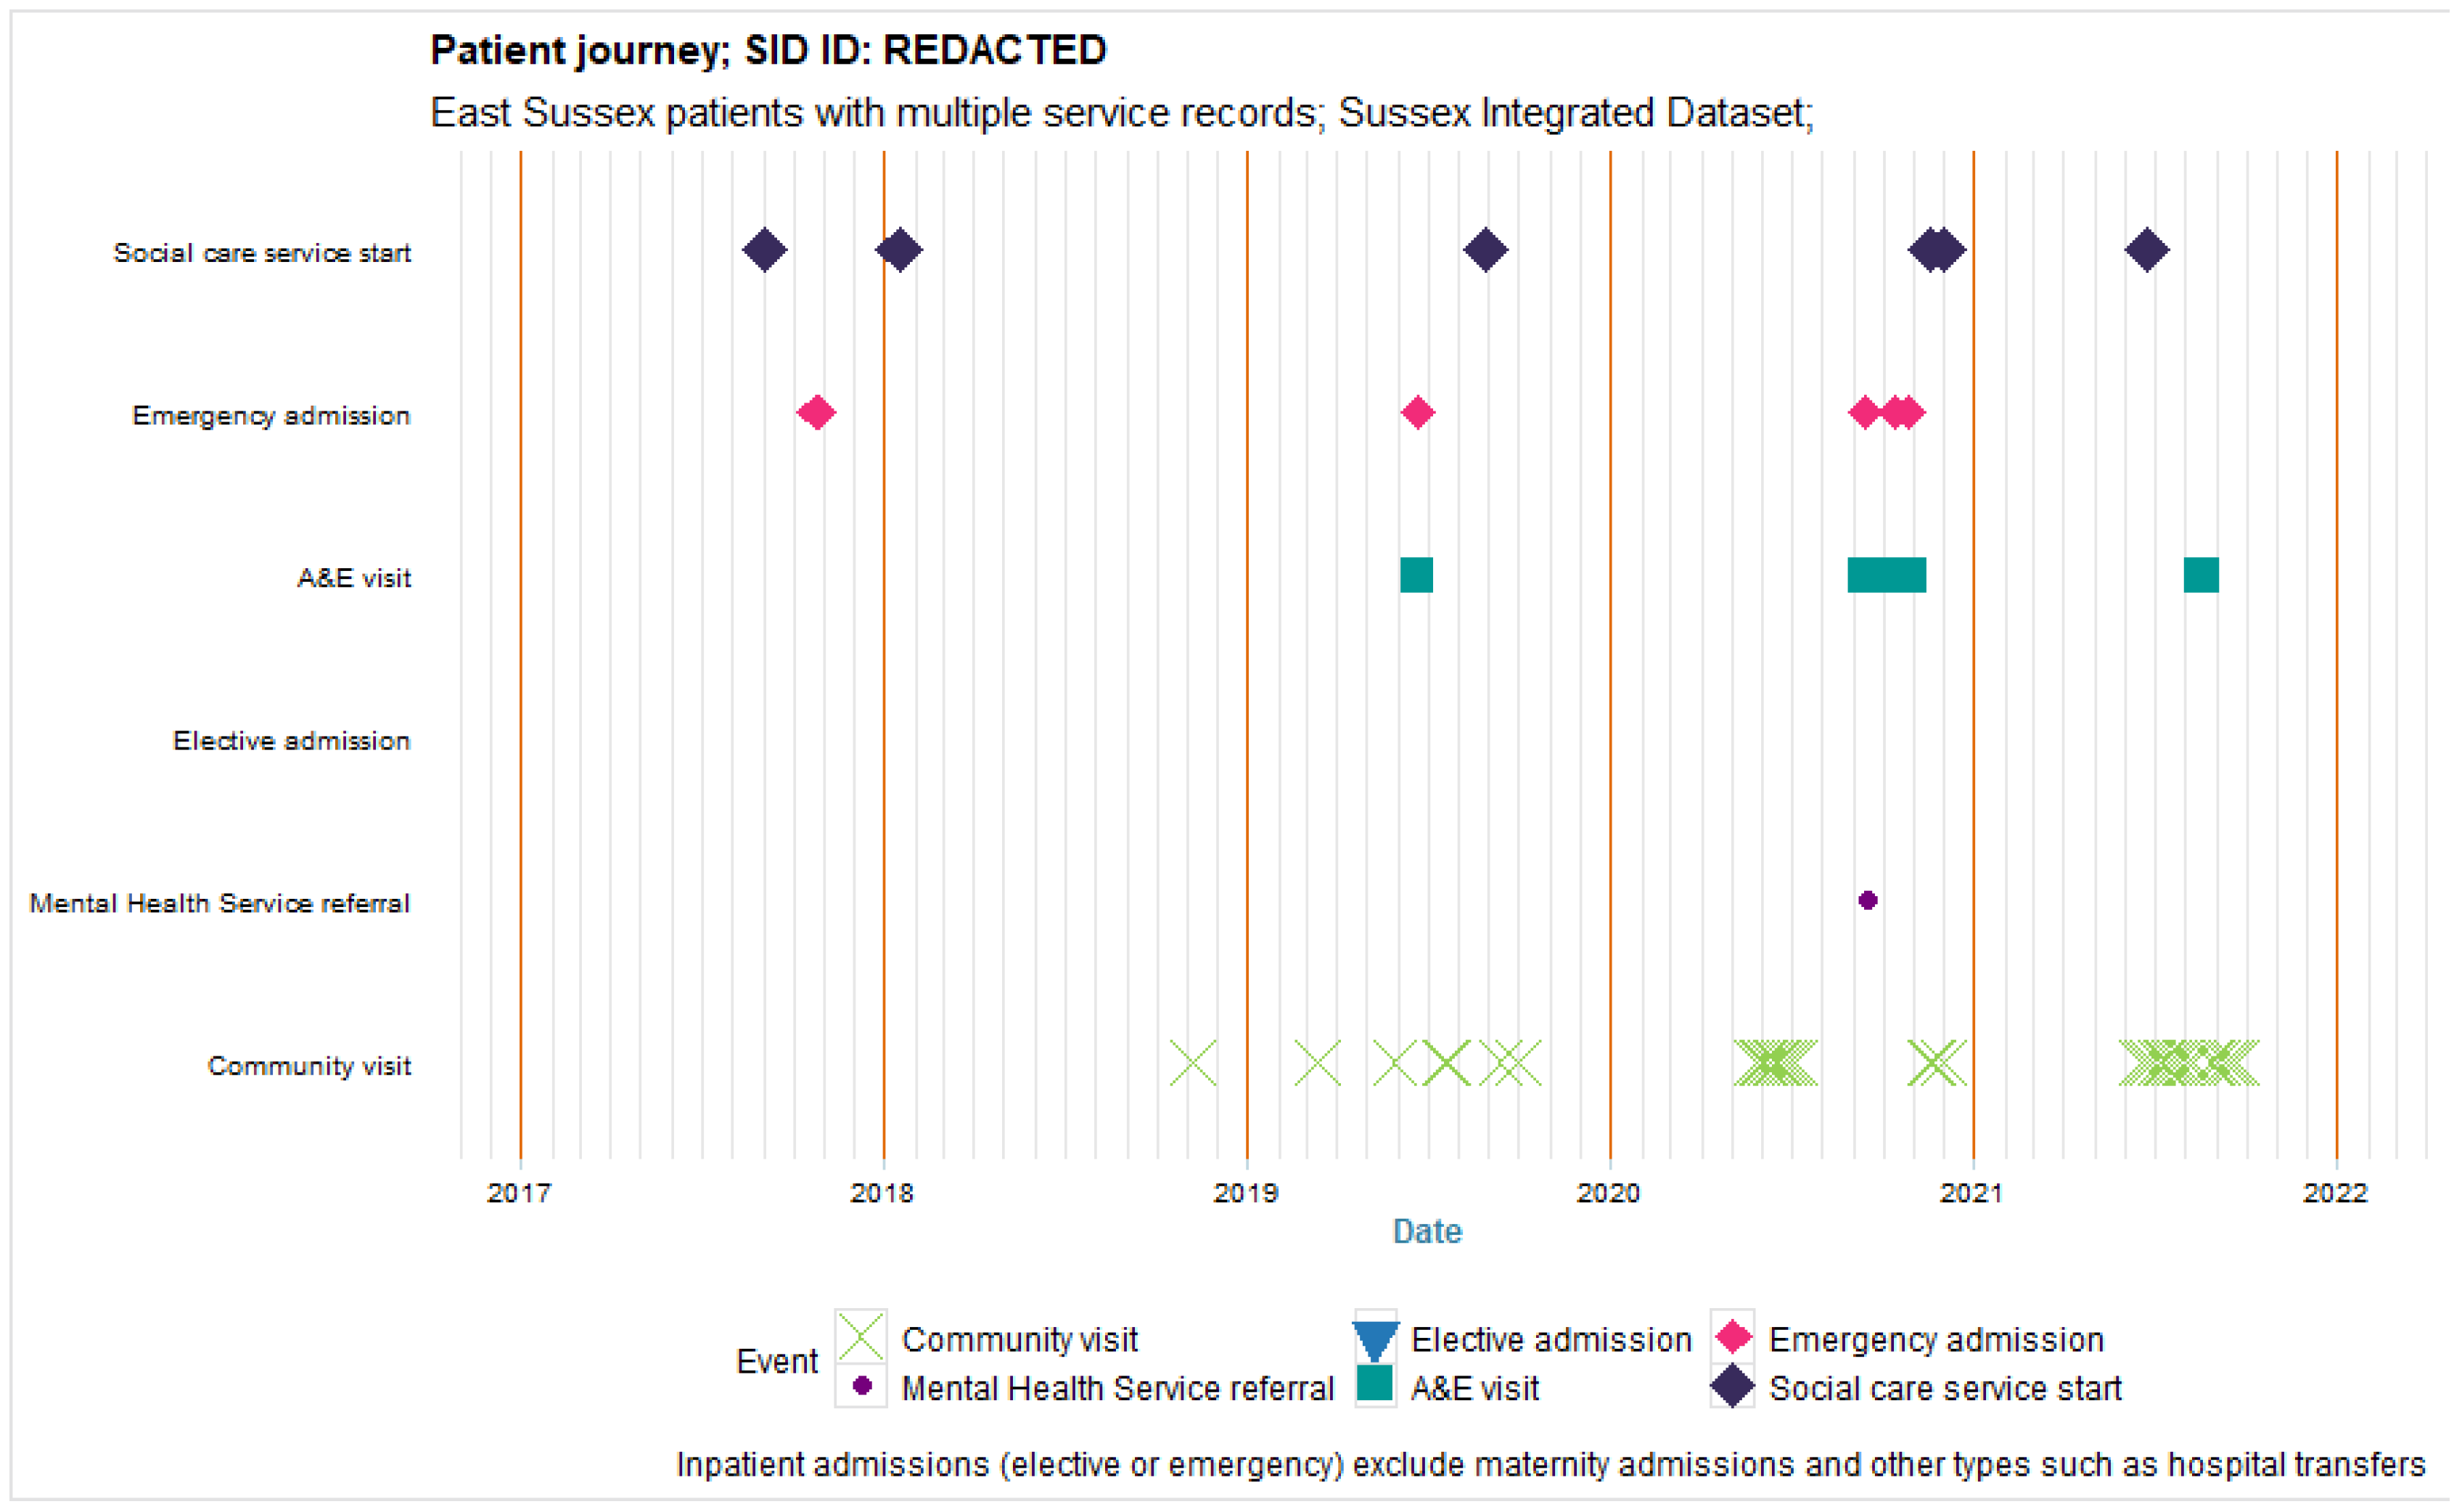
3.3. Visualisation of Multiple Service Use over Time
4. Discussion and Reflections
4.1. Strengths and Limitations
4.2. Key Learning for Public Health and Future Plans
4.3. Conclusions
Author Contributions
Funding
Data Availability Statement
Acknowledgments
Conflicts of Interest
References
- The King’s Fund. Sustainability and Transformation Plans (STPs) Explained: The King’s Fund. 2017. Available online: https://www.kingsfund.org.uk/topics/integrated-care/sustainability-transformation-plans-explained (accessed on 15 December 2022).
- NHS Providers. NO TRUST IS AN ISLAND: A Briefing For Governors on Working Collaboratively in Health and Care Systems: NHS Providers. 2018. Available online: https://nhsproviders.org/stp-governor-briefing (accessed on 15 December 2022).
- NHS Digital. ICS Implementation NHS Digital. 2022. Available online: https://digital.nhs.uk/services/ics-implementation (accessed on 15 December 2022).
- NHS England. Integrated Care Boards. 2022. Available online: https://digital.nhs.uk/services/organisation-data-service/integrated-care-boards (accessed on 15 December 2022).
- Sussex Health and Care. Our Care Connected: Sussex Health and Care. 2022. Available online: https://www.sussex.ics.nhs.uk/our-vision/priorities-and-programmes/digital/our-care-connected/ (accessed on 15 December 2022).
- UK Parliament. Local Authorities’ Public Health Responsibilities (England) London: House of Commons Library. 2014. Available online: https://researchbriefings.files.parliament.uk/documents/SN06844/SN06844.pdf (accessed on 15 December 2022).
- Department of Health. Local Public Health Intelligence: Department of Health. 2012. Available online: https://assets.publishing.service.gov.uk/government/uploads/system/uploads/attachment_data/file/212959/Public-health-intelligence-all-factsheets.pdf (accessed on 15 December 2022).
- Centers for Disease Control and Prevention National Center for Health Statistics. International Classification of Diseases, Tenth Revision (ICD-10). 2021. Available online: https://www.cdc.gov/nchs/icd/icd-10-cm.htm (accessed on 15 December 2022).
- SNOMED International. Use SNOMED CT. 2022. Available online: https://www.snomed.org/snomed-ct/Use-SNOMED-CT] (accessed on 15 December 2022).
- Booth, N. What are the Read Codes? Health Libr. Rev. 1994, 11, 177–182. [Google Scholar] [PubMed]
- Chisholm, J. The Read clinical classification. Br. Med. J. 1990, 300, 1092. [Google Scholar] [CrossRef] [PubMed]
- Stuart-Buttle, C.D.; Read, J.D.; Sanderson, H.F.; Sutton, Y.M. A language of health in action: Read Codes, classifications and groupings. In Proceedings of the A Conference of the American Medical Informatics Association AMIA Fall Symposium, New Orleans, LA, USA, 11–15 November 1996; pp. 75–79. [Google Scholar]
- NHS Digital. DAPB0084: OPCS Classification of Interventions and Procedures. Available online: https://digital.nhs.uk/data-and-information/information-standards/information-standards-and-data-collections-including-extractions/publications-and-notifications/standards-and-collections/dapb0084-opcs-classification-of-interventions-and-procedures (accessed on 15 December 2022).
- NHS Digital. Quality and Outcomes Framework, 2020-21: NHS Digital 2021. Available online: https://digital.nhs.uk/data-and-information/publications/statistical/quality-and-outcomes-framework-achievement-prevalence-and-exceptions-data/2020-21 (accessed on 15 December 2022).
- NHS Digital. National Diabetes Audit, 2019-20, Type 1 Diabetes: NHS Digital 2021. Available online: https://digital.nhs.uk/data-and-information/publications/statistical/national-diabetes-audit/national-diabetes-audit-2019-20-type-1-diabetes (accessed on 15 December 2022).
- National Cancer Registration and Analysis Service. Welcome to CancerData: CancerData. 2022. Available online: https://www.cancerdata.nhs.uk/ (accessed on 15 December 2022).
- Office for Health Improvement and Disparities, NHS Benchmarking Network. Quality Improvement Tool. 2021. Available online: https://www.cvdprevent.nhs.uk/quality-improvement?period=4 (accessed on 15 December 2022).
- NHS Digital. Hospital Episode Statistics (HES). 2019. Available online: https://digital.nhs.uk/data-and-information/data-tools-and-services/data-services/hospital-episode-statistics (accessed on 15 December 2022).
- NHS Digital. Patients Registered at a GP Practice NHS Digital. 2022. Available online: https://digital.nhs.uk/data-and-information/publications/statistical/patients-registered-at-a-gp-practice (accessed on 15 December 2022).
- Office for National Statistics. Deaths: Deaths Broken down by Age, Sex, Area and Cause of Death. 2022. Available online: https://www.ons.gov.uk/peoplepopulationandcommunity/birthsdeathsandmarriages/deaths (accessed on 15 December 2022).
- Health Data Research in UK. The HDR UK Phenotype Library London UK: Health Data Research UK. 2022. Available online: https://phenotypes.healthdatagateway.org/ (accessed on 15 December 2022).
- OpenCodelists. OpenCodelists: Bennett Institute for Applied Data Science, University of Oxford. 2022. Available online: https://www.opencodelists.org/ (accessed on 15 December 2022).
- Brighton and Hove City Council. Joint Strategic Needs Assessment Brighton, UK: Brighton and Hove City Council. 2022. Available online: https://www.brighton-hove.gov.uk/joint-strategic-needs-assessment (accessed on 15 December 2022).
- Office for National Statistics. Living Longer: How our Population is Changing and Why it Matters. 2021. Available online: https://www.ons.gov.uk/peoplepopulationandcommunity/birthsdeathsandmarriages/ageing/articles/livinglongerhowourpopulationischangingandwhyitmatters/2018-08-13#what-are-the-implications-of-living-longer-for-society-and-the-individual (accessed on 15 December 2022).
- Imperial College Health Partners. How to Use Theographs to Better Understand Individual Stories and Improve Patient Care. 2019. Available online: https://imperialcollegehealthpartners.com/gps-and-commissioners-are-increasingly-interested-in-using-theographs/ (accessed on 15 December 2022).
- NHS Health Research Authority. Guidance for Using Patient Data. 2022. Available online: https://www.hra.nhs.uk/covid-19-research/guidance-using-patient-data/ (accessed on 15 December 2022).
- Ford, E.; Rees-Roberts, M.; Stanley, K.; Goddard, K.; Giles, S.; Armes, J.; Ikhile, D.; Madzvamuse, A.; Spencer-Hughes, V.; George, A.; et al. Understanding how to build a social licence for using novel linked datasets for planning and research in Kent, Surrey and Sussex: Results of deliberative focus groups. Int. J. Popul. Data Sci. 2023, 5, 13. [Google Scholar] [CrossRef]
- Blue Sail. Sussex Visitor Economy Baseline Report. 2021. Available online: https://www.experiencewestsussex.com/wp-content/uploads/2022/03/Sussex-Visitor-Economy-Baseline-Review.pdf (accessed on 15 December 2022).
- Henson, K.E.; Elliss-Brookes, L.; Coupland, V.H.; Payne, E.; Vernon, S.; Rous, B.; Rashbass, J. Data resource profile: National cancer registration dataset in England. Int. J. Epidemiol. 2020, 49, 16-16h. [Google Scholar] [CrossRef] [PubMed]
- Herbert, A.; Wijlaars, L.; Zylbersztejn, A.; Cromwell, D.; Hardelid, P. Data Resource Profile: Hospital Episode Statistics Admitted Patient Care (HES APC). Int. J. Epidemiol. 2017, 46, 1093-1093i. [Google Scholar] [CrossRef] [PubMed]
- Herrett, E.; Gallagher, A.M.; Bhaskaran, K.; Forbes, H.; Mathur, R.; van Staa, T.; Smeeth, L. Data resource profile: Clinical practice research datalink (CPRD). Int. J. Epidemiol. 2015, 44, 827–836. [Google Scholar] [CrossRef] [PubMed]
- Wolf, A.; Dedman, D.; Campbell, J.; Booth, H.; Lunn, D.; Chapman, J.; Myles, P. Data resource profile: Clinical Practice Research Datalink (CPRD) Aurum. Int. J. Epidemiol. 2019, 48, 1740-1740g. [Google Scholar] [CrossRef] [PubMed]
- Lewer, D.; Bourne, T.; George, A.; Abi-Aad, G.; Taylor, C.; George, J. Data Resource: The Kent Integrated Dataset (KID). Int. J. Popul. Data Sci. 2018, 3, 427. [Google Scholar] [CrossRef] [PubMed]
- Botsis, T.; Hartvigsen, G.; Chen, F.; Weng, C. Secondary use of EHR: Data quality issues and informatics opportunities. Summit Transl. Bioinform. 2010, 2010, 1. [Google Scholar] [PubMed]
- Orfanidis, L.; Bamidis, P.D.; Eaglestone, B. Data quality issues in electronic health records: An adaptation framework for the Greek health system. Health Inform. J. 2004, 10, 23–36. [Google Scholar] [CrossRef]
- Weiskopf, N.G.; Weng, C. Methods and dimensions of electronic health record data quality assessment: Enabling reuse for clinical research. J. Am. Med. Inform Assoc. 2013, 20, 144–151. [Google Scholar] [CrossRef] [PubMed]
- De Lusignan, S.; Hague, N.; van Vlymen, J.; Kumarapeli, P. Routinely-collected general practice data are complex, but with systematic processing can be used for quality improvement and research. Inform. Prim. Care 2006, 14, 59–66. [Google Scholar] [CrossRef] [PubMed]
- De Lusignan, S.; Jones, S.; Liaw, S.; Michalakidis, G. Defining datasets and creating data dictionaries for quality improvement and research in chronic disease using routinely collected data: An ontology-driven approach. Inform. Prim. Care 2012, 19, 127–134. [Google Scholar] [CrossRef] [PubMed]
- Nicholson, A.; Ford, E.; Davies, K.; Smith, H.; Rait, G.; Tate, R.; Petersen, I.; Cassell, J. Optimising Use of Electronic Health Records to Describe the Presentation of Rheumatoid Arthritis in Primary Care: A Strategy for Developing Code Lists. PLoS ONE 2013, 8, e54878. [Google Scholar] [CrossRef] [PubMed]
- Perimal-Lewis, L.; Teubner, D.; Hakendorf, P.; Horwood, C. Application of process mining to assess the data quality of routinely collected time-based performance data sourced from electronic health records by validating process conformance. Health Inform. J. 2016, 22, 1017–1029. [Google Scholar] [CrossRef] [PubMed]
- Kohane, I.S.; Aronow, B.J.; Avillach, P.; Beaulieu-Jones, B.K.; Bellazzi, R.; Bradford, R.L.; Brat, G.A.; Cannataro, M.; Cimino, J.J.; García-Barrio, N.; et al. What Every Reader Should Know About Studies Using Electronic Health Record Data but May Be Afraid to Ask. J. Med. Internet Res. 2021, 23, e22219. [Google Scholar] [CrossRef] [PubMed]


Disclaimer/Publisher’s Note: The statements, opinions and data contained in all publications are solely those of the individual author(s) and contributor(s) and not of MDPI and/or the editor(s). MDPI and/or the editor(s) disclaim responsibility for any injury to people or property resulting from any ideas, methods, instructions or products referred to in the content. |
© 2023 by the authors. Licensee MDPI, Basel, Switzerland. This article is an open access article distributed under the terms and conditions of the Creative Commons Attribution (CC BY) license (https://creativecommons.org/licenses/by/4.0/).
Share and Cite
Ford, E.; Tyler, R.; Johnston, N.; Spencer-Hughes, V.; Evans, G.; Elsom, J.; Madzvamuse, A.; Clay, J.; Gilchrist, K.; Rees-Roberts, M. Challenges Encountered and Lessons Learned when Using a Novel Anonymised Linked Dataset of Health and Social Care Records for Public Health Intelligence: The Sussex Integrated Dataset. Information 2023, 14, 106. https://doi.org/10.3390/info14020106
Ford E, Tyler R, Johnston N, Spencer-Hughes V, Evans G, Elsom J, Madzvamuse A, Clay J, Gilchrist K, Rees-Roberts M. Challenges Encountered and Lessons Learned when Using a Novel Anonymised Linked Dataset of Health and Social Care Records for Public Health Intelligence: The Sussex Integrated Dataset. Information. 2023; 14(2):106. https://doi.org/10.3390/info14020106
Chicago/Turabian StyleFord, Elizabeth, Richard Tyler, Natalie Johnston, Vicki Spencer-Hughes, Graham Evans, Jon Elsom, Anotida Madzvamuse, Jacqueline Clay, Kate Gilchrist, and Melanie Rees-Roberts. 2023. "Challenges Encountered and Lessons Learned when Using a Novel Anonymised Linked Dataset of Health and Social Care Records for Public Health Intelligence: The Sussex Integrated Dataset" Information 14, no. 2: 106. https://doi.org/10.3390/info14020106