Article

Predicting COVID-19 Hospital Stays with Kolmogorov–Gabor Polynomials: Charting the Future of Care

by
Hamidreza Marateb
1,
Mina Norouzirad
2,
Kouhyar Tavakolian
3,
Faezeh Aminorroaya
4,
Mohammadreza Mohebbian
5,
Miguel Ángel Mañanas
1,6,
Sergio Romero Lafuente
1,6,
Ramin Sami
7 and
Marjan Mansourian
1,4,*
1
Biomedical Engineering Research Centre (CREB), Automatic Control Department (ESAII), Universitat Politècnica de Catalunya-Barcelona Tech (UPC), 08028 Barcelona, Spain
2
Center for Mathematics and Applications (NOVA Math), NOVA School of Science and Technology (NOVA SST), 2825-149 Caparica, Portugal
3
School of Electrical Engineering and Computer Science, University of North Dakota, Grand Forks, ND 58202, USA
4
Epidemiology and Biostatistics Department, School of Health, Isfahan University of Medical Sciences, Isfahan 81746-73461, Iran
5
Department of Electrical and Computer Engineering, University of Saskatchewan, Saskatoon, SK S7N 5A9, Canada
6
CIBER de Bioingeniería, Biomateriales y Nanomedicina (CIBER-BBN), 28029 Madrid, Spain
7
Department of Internal Medicine, School of Medicine, Isfahan University of Medical Science, Isfahan 81746-73461, Iran
*
Author to whom correspondence should be addressed.
Information 2023, 14(11), 590; https://doi.org/10.3390/info14110590
Submission received: 28 August 2023 / Revised: 9 October 2023 / Accepted: 23 October 2023 / Published: 31 October 2023
(This article belongs to the Special Issue Artificial Intelligence and Big Data Applications)

Abstract

:
Optimal allocation of ward beds is crucial given the respiratory nature of COVID-19, which necessitates urgent hospitalization for certain patients. Several governments have leveraged technology to mitigate the pandemic’s adverse impacts. Based on clinical and demographic variables assessed upon admission, this study predicts the length of stay (LOS) for COVID-19 patients in hospitals. The Kolmogorov–Gabor polynomial (a.k.a., Volterra functional series) was trained using regularized least squares and validated on a dataset of 1600 COVID-19 patients admitted to Khorshid Hospital in the central province of Iran, and the five-fold internal cross-validated results were presented. The Volterra method provides flexibility, interactions among variables, and robustness. The most important features of the LOS prediction system were inflammatory markers, bicarbonate (HCO3), and fever—the adj. R2 and Concordance Correlation Coefficients were 0.81 [95% CI: 0.79–0.84] and 0.94 [0.93–0.95], respectively. The estimation bias was not statistically significant (p-value = 0.777; paired-sample t-test). The system was further analyzed to predict “normal” LOS ≤ 7 days versus “prolonged” LOS > 7 days groups. It showed excellent balanced diagnostic accuracy and agreement rate. However, temporal and spatial validation must be considered to generalize the model. This contribution is hoped to pave the way for hospitals and healthcare providers to manage their resources better.

1. Introduction

The fast spread of the SARS-CoV-2 coronavirus has placed immense strain on healthcare systems across the globe. As infected individuals surged, the demand for hospital admissions grew accordingly [1]. Past outbreaks have demonstrated that limited bed capacity and hospital resources significantly contribute to higher infectious disease mortality rates [2]. Hence, guidelines for prioritizing patients and determining who should be admitted for essential care are instrumental in addressing resource limitations. Neglecting this could jeopardize the lives of COVID-19 patients [3].
Nine to eleven percent of COVID-19 hospitalizations required enhanced life-support interventions [4]. However, the ICU faced challenges accommodating these needs due to limited beds and shortages in monitoring equipment, life-sustaining machinery, and skilled staff crucial for top-tier care [5]. In a study encompassing 183 nations in 2021, Sen-Crowe et al. [2] reported that high-income areas registered the highest average ICU beds at 12.79 and 402.32 hospital beds for every 100,000 individuals. On the other hand, regions with upper-middle income showed dominance in average acute-care beds, numbering 424.75 per 100,000 inhabitants. This is not the case for low- and middle-income countries, where the number of ICU beds is often insufficient, and the equipment is often old and poorly serviced. This number was five beds per one million people in Africa [6].
Challenges in managing hospital capacity throughout this pandemic spanned various phases, including testing, treatment, and preparation for future patients. As a result, there is a pressing need to accurately predict and prioritize patients based on the likelihood of their condition escalating in severity. It is part of the pandemic preparedness action plan.
In predicting hospital length of stay (LOS), the overarching challenges introduced by COVID-19 cannot be overlooked. The pandemic has significantly strained hospital capacities, potentially altering standard care pathways and discharge protocols. Furthermore, heightened fatigue [7], burnout [8], and stress among healthcare professionals [9], a byproduct of the ongoing crisis, may also have indirect implications for the duration of patient stays. These combined factors elucidate the multifaceted dynamics influencing hospital operations during these unprecedented times.
Numerous studies have explored predicting hospital resource needs for COVID-19 patients. Many of these investigations have leveraged machine learning (ML). ML has established itself as an invaluable tool in the medical realm, adept at sifting through and synthesizing vast amounts of data to discern intricate patterns. Most health-related challenges nowadays rely heavily on ML to disentangle the complexities inherent in large-scale data, facilitating informed healthcare decisions.
During outbreaks like COVID-19, forecasting the imminent demand for medical resources such as beds and nasal oxygen support becomes crucial. In this context, ML methodologies have proven invaluable [10,11]. For instance, researchers from London designed an ML algorithm that outperformed clinical experts in predicting COVID-19 patient mortality [12]. Another ML study successfully predicted which COVID-19 patients would transition into a severe respiratory phase with a 70–80% accuracy rate [13].
Furthermore, an AI-based tool named “ambient warning and response evaluation” has been employed to refine ICU clinical settings. This tool significantly enhanced timely and accurate decision-making, leading to a 37% reduction in LOS [14].
LOS estimation remains crucial for efficient healthcare management, offering insights into patient health trajectories, resource allocation, and the quality-of-care delivery. The state-of-the-art research listed encompasses a myriad of methodologies and priorities, thereby revealing both the advancements and the persisting gaps in LOS prediction.
Nemati et al. (2020) [15] utilized a global dataset and focused on a limited set of five variables, primarily age and sex, to estimate LOS. Their approach, which involved stagewise gradient boosting, did not venture into comprehensive features but mainly centered around symptoms onset date and symptoms. Given the minimalistic input feature set, this focus might limit its applicability in varied clinical settings.
Working in a tertiary care hospital in China, Hong et al. (2020) [16] used logistic regression with a set of 37 variables, including lymphocyte and neutrophil count, heart rate, and procalcitonin levels, D-dimer, and partial thrombin time. Their dataset was also relatively small, including 75 patients considering the number of predictors, and reached an AUC of 0.85 to classify prolonged (>14 days) versus normal (≤14 days) hospital LOS. Their work lacks internal and external validation, indicating potential overfitting risks.
Ebinger et al. (2021) [17] embarked on an extensive exploration of 966 patients with 353 variables of electronic health records (EHRs) to classify patients based on extended stays (i.e., LOS > 8 vs. LOS ≤ 8 days) in the Cedars-Sinai Medical Center. Forty-two machine learning models were used as ensemble models of 12 base classifiers (including Elastic-net and random forest). Such models were trained using the first 1, 2, and 3 days of hospital admission. Advanced Average (AVG) Blender for the day 3 model outperformed the others. Age, Interleukin 6, blood urea nitrogen level, and oxygen flow rate were among the selected features. The best model had an area under the ROC curve (AUC) of 0.82 and a precision of 67%.
Usher et al. (2021) [18] analyzed data from 36 hospitals across Minnesota, Wisconsin, and the Dakotas. Using 20 variables, which included diverse features such as age, critical illness, mechanical ventilator (MV) application, and oxygen requirement, their approach adopted the random forest method, considering it as the best model. The classification output was the LOS ≤ 5 days (reference), LOS between 5 and 10 days, LOS between 10 and 15 days, and LOS > 15 days. With five-fold cross-validation, they achieved an AUC of 0.89, highlighting the potential of integrating diverse input features for LOS category prediction.
Mahboub et al. (2021) [19] at Rashid Hospital in Dubai took a distinct route by incorporating treatments as input features and variables such as urea, platelets, and D-dimer. Utilizing decision trees on a dataset of 2017 patients, they achieved a coefficient of determination (R2) of 0.5, suggesting the relevance of treatment variables in predicting LOS.
Liuzzi et al. (2022) [20] from the Fondazione Don Carlo Gnocchi Living COVID-19 Registry in Italy incorporated a comprehensive set of 829 variables, with a focus on 55 primary variables spanning across admission clinical scales, symptoms, and therapies. Their method, employing sequential convolutional neural networks, was validated with repeated five-fold cross-validation, resulting in a median absolute deviation of 2.7 days.
Orooji et al. (2022) [21] in Iran, with data from 1225 patients, utilized 53 variables and emphasized 20 key features such as age, creatinine, and lymphocyte/neutrophil count. They applied statistical feature selection combined with multi-layer perceptron and 12 training algorithms, reaching a root-mean-square error (RMSE) of 1.6213 days.
In 2022, Alabbad et al. [22] from King Fahad University Hospital in Saudi Arabia classified ICU LOS into nine categories using 43 variables. The synthetic minority oversampling technique (SMOTE) was used to balance the class distribution. Their best model employed random forest, and they also explored gradient boosting and extreme gradient boosting. With three-fold cross-validation, their model boasted a positive predictive value (PPV) of 94%, indicating high precision in prediction.
Alam et al. (2023) [23] from Prince Sultan Hospital in Riyadh incorporated 89 variables, including laboratory data, X-ray results, clinical data, and treatments, to classify LOS into seven categories. Their model utilized the Tab Transformer and achieved impressive results, with an F1 score of 93% for discharged patients. The SMOTE-N oversampling technique was also noted to balance the class distribution.
Zhang et al. (2023) [24] analyzed 83 variables, including immunotherapy and heparin, to predict LOS for 384 patients at Zhengzhou University Hospital. Using the least absolute shrinkage and selection operator (LASSO) and linear regression, they explained 30% of LOS variability (R2 = 0.30). Missing data were managed with imputations, and results were verified via bootstrap validation.
Overall, while significant strides have been made in predicting LOS through diverse methodologies, ranging from classical regression models to neural networks, gaps in validation and comprehensive feature inclusion, conditioning on future events (e.g., therapies) resulting in selection bias, incorporating time-dependent predictors (e.g., treatments) as time-fixed, leading to immortal-time bias [25], and balancing the dataset, resulting in biased performance indices [26] remained a consistent challenge. Moreover, sample size insufficiency based on the number of input features [27] was the other problem of some methods proposed in the literature. Further research was required to enhance model generalizability across varied clinical settings.
Our research aimed to employ multivariable analysis and the Kolmogorov–Gabor polynomial to craft a predictive model. This model aimed to precisely forecast the LOS of COVID-19 patients in a nationally representative sample of the pediatric population in the Middle East and North Africa (MENA) based on their demographic and clinical data upon hospital admission.
Our primary model was designed to predict the continuous LOS. We evaluated and presented performance metrics for this continuous prediction. Additionally, we derived a binary representation of LOS from the predicted and actual data, categorizing it as either prolonged (LOS > 7 days) or normal (LOS ≤ 7 days). This binary classification’s performance was also examined. We adopted this approach to accommodate the existing literature’s categorical and continuous LOS representations. Our primary focus remained the continuous prediction model, which can seamlessly be converted to a binary prediction through straightforward post-processing.

2. Materials and Methods

2.1. Data Source

In this retrospective study, we examined the clinical records of N = 1600 confirmed COVID-19 cases with complete information from Isfahan, situated in the center of Iran, from 6 March to 7 May 2020. These patients were admitted to Khorshid Hospital, which caters to the vast metropolitan area of Isfahan, home to over 15 million residents. Given that this hospital functioned as the primary referral center for critical COVID-19 cases during this period, our study exclusively focused on the patients admitted to the hospital. Patients with a positive RT-PCR test confirming SARS-CoV-2 infection or confirmed chest computed tomography (CT) results were enrolled in this study.
All participants’ LOS was calculated from their initial hospital ward or ICU admission until discharge. It is noteworthy to mention that this LOS represents the first recorded admission. Comprehensive information regarding the study design and the methods used to register variables can be found in our Khorshid COVID Cohort (KCC) study [28]. The data gathered included demographic details such as age and sex, pertinent dates including COVID-19 diagnosis and hospital or ICU admission, and the patient’s most recent known clinical status.

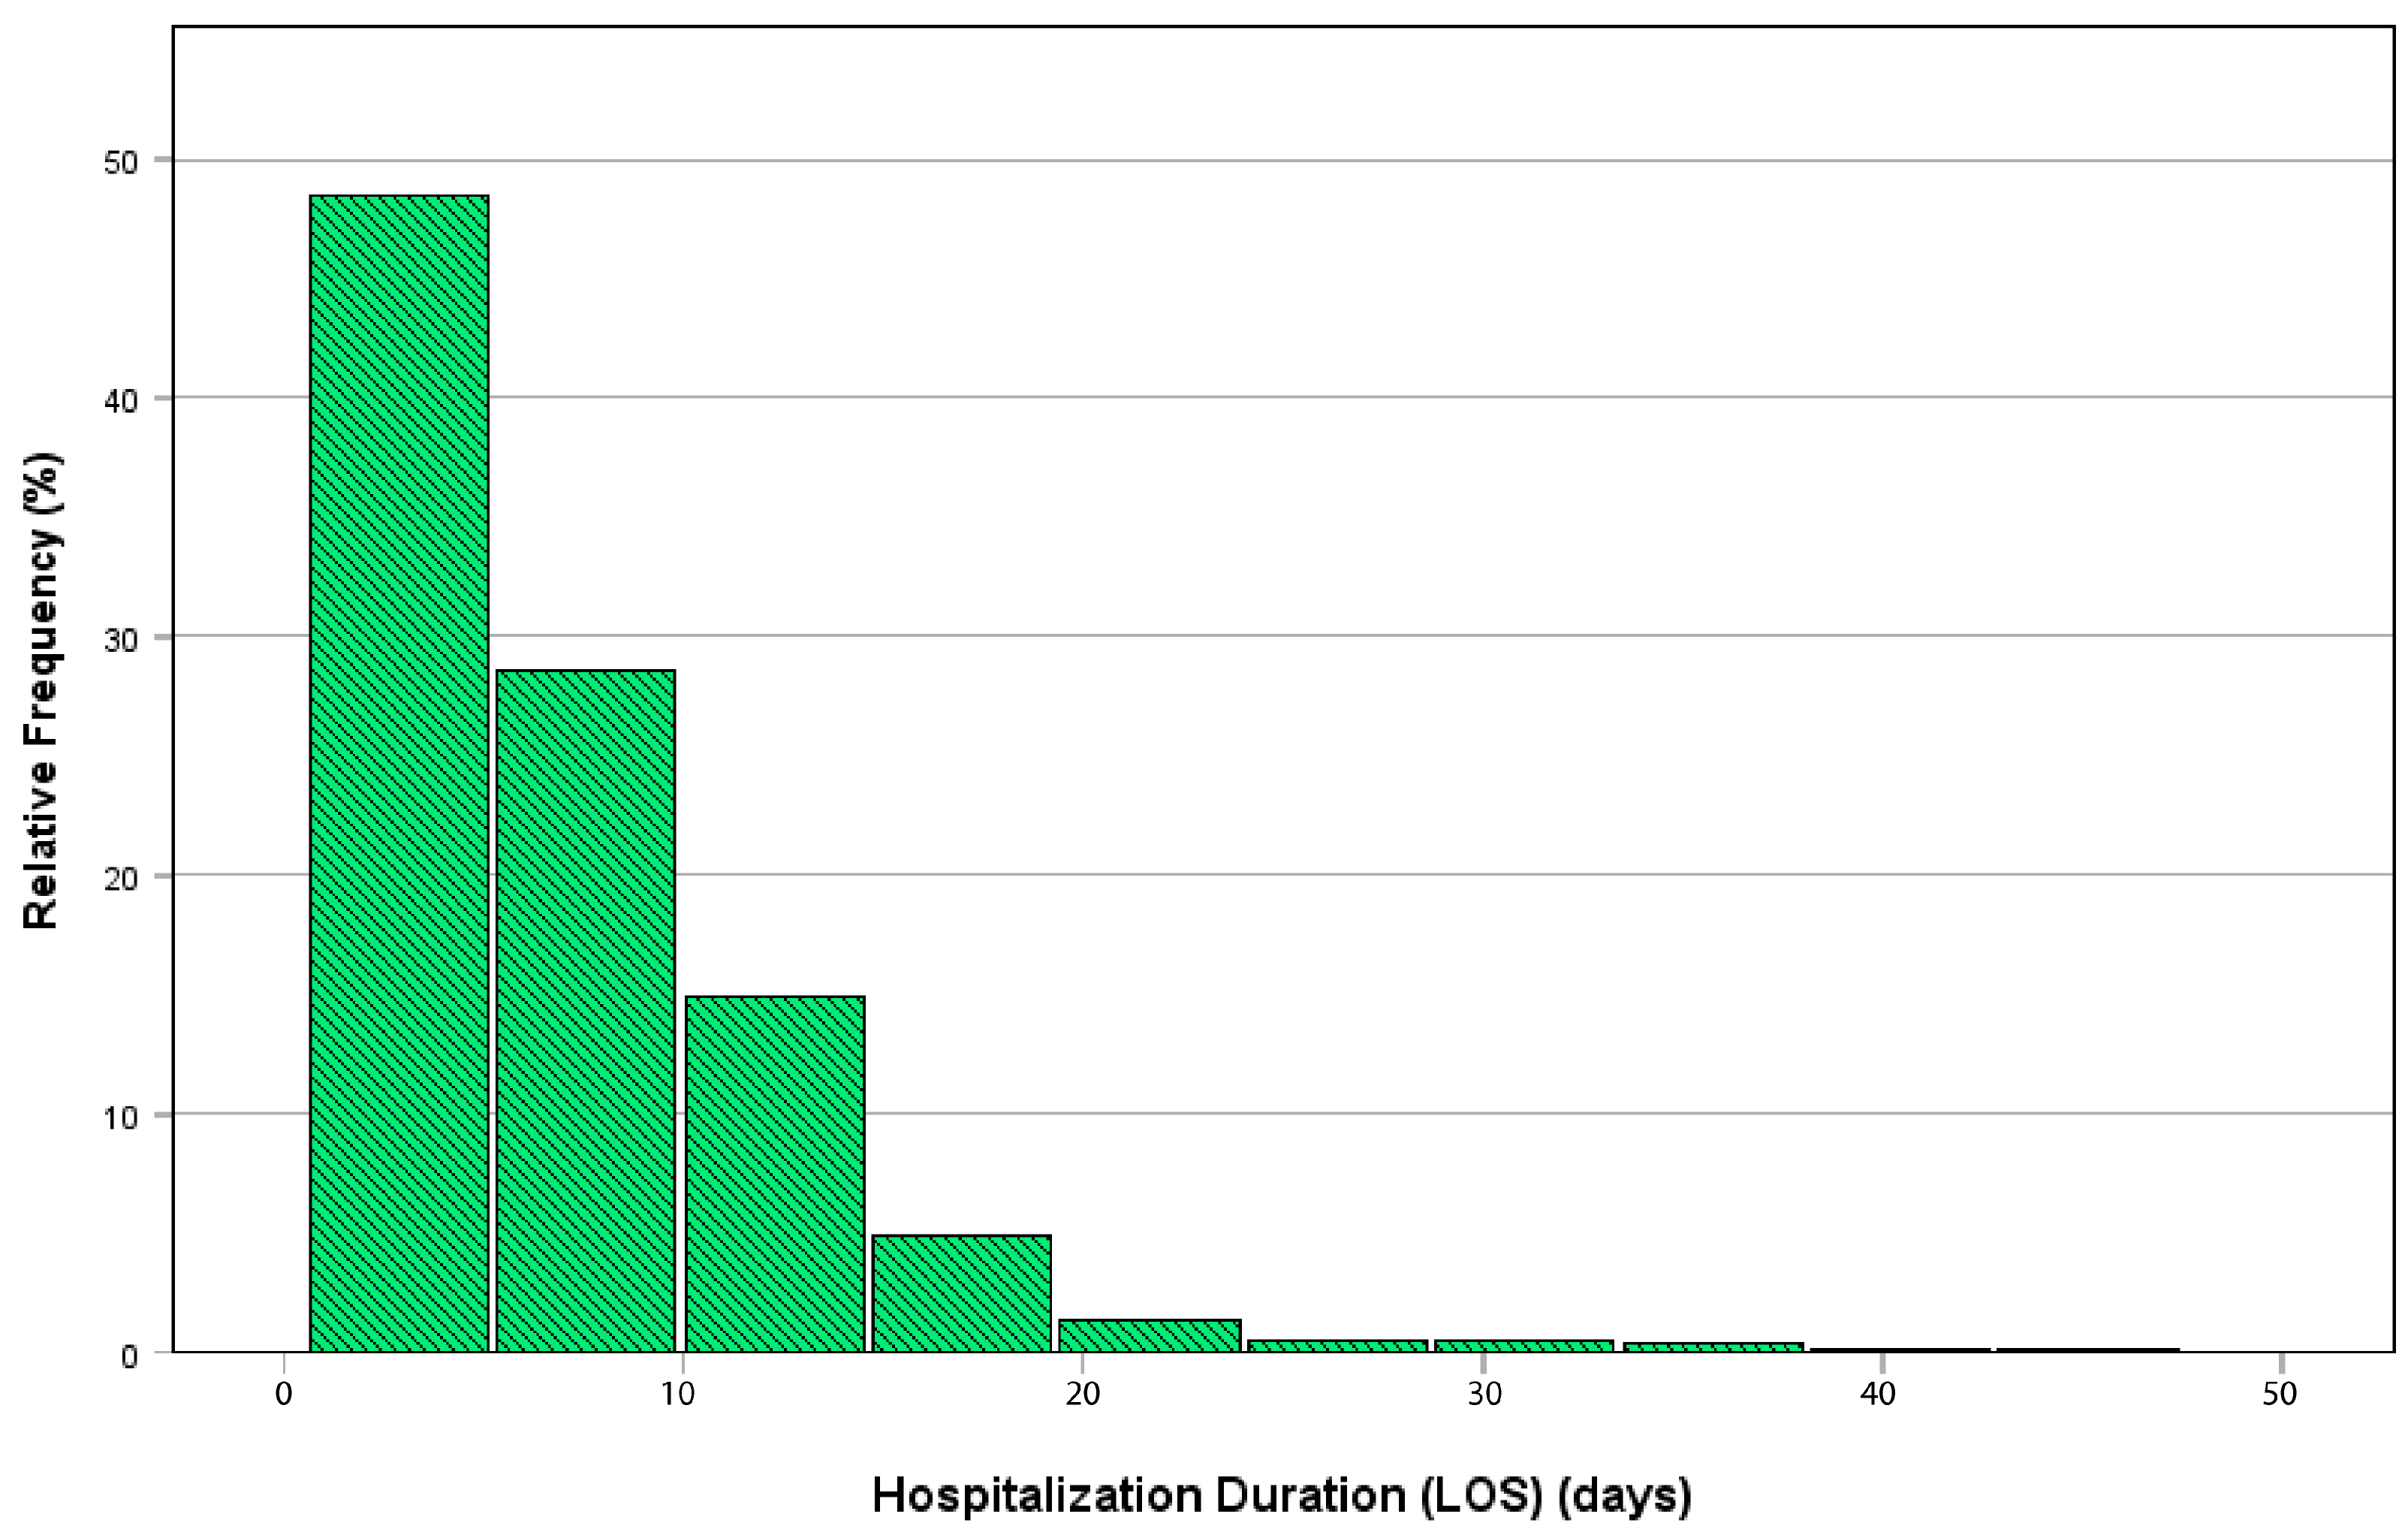
2.2. Data Description and Pre-Processing

This study extracted and used patients’ records, including non-clinical, clinical, and symptom data. Non-clinical data included sex, age, occupation, education, body mass index, family size, number of family members infected, house area, travel history, duration of symptoms before admission, and history of influenza vaccination. Clinical patient data included principal diagnosis, admission unit, medical history, and comorbidities. Laboratory data included the results of all blood tests performed at patient admission. The latest available laboratory tests included were CBC results, sodium (Na+), potassium (K+), urea, creatinine, alkaline phosphatase (ALP), aspartate transaminase (AST), alanine aminotransferase (ALT), bilirubin, international normalized ratio (INR), lactate dehydrogenase (LDH), C-reactive protein (CRP), ferritin, hemoglobin A1c (HbA1c), D-dimer, erythrocyte sedimentation rate (ESR), and vitamin D. To assess patient health status and identify the required level of care, parameters such as blood pressure, heart rate, and respiratory rate were recorded. Comorbidity categories were evaluated by the Charlson comorbidity index (CCI), which is one of the most commonly used methods to evaluate comorbid factors and predict mortality [29]. It was calculated based on age category, history of myocardial infarction (MI), congestive heart failure (CHF), peripheral vascular disease, history of a cerebrovascular accident or transient ischemic attacks, dementia, chronic obstructive pulmonary disease (COPD), connective tissue disease, peptic ulcer disease, liver disease, diabetes mellitus, hemiplegia, moderate to severe chronic kidney disease (CKD), presence of solid tumor, leukemia, lymphoma, and AIDS, ranging from 0 to 37. These medical conditions were classified by the International Classification of Diseases, Tenth Revision, Clinical Modification (ICD-10-CM) codes that are available in Appendix I Table SI-1 in [30]. The CCI was categorized into five groups: CCI score 0, CCI score 1–2, CCI score 3–4, CCI score 5–6, and CCI score ≥7 [31].
In addition to fever (body degree “up to 39.4 °C”), other symptoms, including fatigue, cough, sore throat, headache, nasal congestion, shortness of breath, severe chest pain, severe muscle pain, vomiting, dry cough, nausea, diarrhea, abdominal pain, muscle and joint pain, general weakness, smell-taste disorder, and dyspnea were identified by the medical interview [32]. Primary composite endpoints (PCEP) were defined as death, the use of mechanical ventilation, or admission to intensive care [33].

2.3. Statistical Data Analysis

Descriptive statistics, including means, frequencies, and proportions, are summarized for the collected data. The disease severity level stratifies summaries. Chi-squared and Fisher exact tests were used whenever appropriate to examine differences among categorical predictors. The endpoint of this study was LOS, which was calculated according to the number of days of hospitalization. The paired-sample t-test was used to identify if the LOS bias was statistically significant [34]. The Bland–Altman plot, (also known as the Tukey mean-difference plot) [35] was provided to analyze the LOS error. Patients were divided into two groups for descriptive analysis, according to the quartile LOS value: ≤7 days as normal and > 7 days as prolonged LOS [36]. Such a cutoff was used in terms of healthcare utilization. We considered p < 0.05 as statistically significant. Predictive modeling was performed offline using MATLAB version 9.6 R2019a (Natick, MA, USA: The MathWorks Inc.), while statistical analysis was performed using IBM SPSS Statistics for Windows, Version 29.0 (Armonk, NY, USA: IBM Corp).

2.4. Predictive Modeling

Volterra functional series, also known as Kolmogorov–Gabor polynomials [37], were used in our study for prediction. The level of interaction was limited to two to reduce the computational complexity and overfitting. The proposed model is provided in Equation (1).
y = a 0 + i = 1 m a i x i + i = 1 m j = 1 m a ij x i x j
where y is the output of the model (LOS), xi is the ith input feature (i = 1, …, m), m is the number of features, and the model parameters are a0 (the offset) and aij (two-way interaction coefficients; i, j = 1, …, m). Prior to estimation, the output variable was detrended by subtracting its average. After the model was constructed, this offset was subsequently added back. Since some input features were categorical, one-hot and ordinal encoding were used for nominal and ordinal features, respectively [38], allowing capturing the system’s response for each of multiple generated binary features. Prior to estimating the coefficients, highly correlated (i.e., with an absolute correlation coefficient higher than or equal to 0.8) features and two-way interactions were identified, and some of those were selected to avoid collinearity and multicollinearity [39]. Note that multicollinearity was further reduced by dropping one of the one-hot encoded columns, also known as “dropping one level”. Since Equation (1) contains all two combinations of the input coded features, we used regularized least squares (RLS) [40], with the Euclidean norm penalization, also known as the ridge regression, to estimate the coefficients in the under-determined system:
A R L S = X T × X + λ I 1 × X T × Y
where ARLS are the estimated coefficients in Equation (1), Y is the target LOS vector, X is the data matrix for the selected input features of the training set, and T is the transpose operator. The regularization parameter (λ) was estimated during the cross-validation on the training set [40]. The ridge regression can help reduce the model’s variance and improve its generalization to unseen data and more stable estimates, mitigate the risk of overfitting, manage model complexity, and provide some feature stability [41].

2.5. Model Validation

Five-fold cross-validation was used in our study, and the cross-validated results were provided. The goodness-of-fit of the LOS estimation algorithm was assessed using root-mean-squared-error (RMSE), mean and median absolute error, as well as the coefficient of determination (R2) [42], adjusted R2 (adj. R2), and the concordance correlation coefficient ( ρ c ) [43]. For the LoSi and yi pairs (i = 1, …, N), such indices were calculated as follows:
R 2 = 1 i = 1 N L o S i y i 2 i = 1 N L o S i L o S μ 2
where,
a d j .     R 2 = 1 N 1 N p 1 × 1 R 2
where p is the number of selected input features of the model.
ρ c = 2 × C o V L o S , y σ L o S 2 + σ y 2 + y ¯ L o S μ 2
where CoV is the covariance, σ L o S 2 = 1 N × i = 1 N L o S i L o S u 2 is the variance of the LOS, LOSu is the mean of LOS, σ y 2 is the variance of the predicted LOS, and y ¯ is the mean of the predicted LOS.
We further analyzed the binary outcome of the prediction system for the normal (LOS ≤ 7 days) and prolonged LOS (LOS > 7 days) [44]. The performance indices were calculated based on the cross-validated confusion matrix:
  • TP (True Positives) = The number of accurately identified prolonged LOS
  • TN (True Negatives) = The number of accurately identified normal LOS
  • FP (True Positives) = The number of inaccurately identified prolonged LOS
  • FN (True Positives) = The number of inaccurately identified normal LOS
The following performance indices were then calculated:
S e = T P T P + F N
S p = T N T N + F P
P P V = T P T P + F P
D O R = T P × T N F P × F N
A U C = S e + S p 2
F 1 = 2 × T P 2 × T P + F N + F P
M C C = T P × T N F P × F N T P + F P × T P + F N × T N + F P × T N + F N
K C = 2 × T P × T N F P × F N T P + F P × T P + F N × T N + F P × T N + F N
where Se is the sensitivity, Sp is the specificity, PPV is the positive predictive value, DOR is the diagnostic odds ratio, AUC is the balance diagnostic accuracy (area under the ROC curve), F1 is the F1 score, MCC is the Matthews’s correlation coefficient [45,46], and K(C) is the Cohen’s Kappa agreement rate.
Also, the unbiased PPV was calculated based on the sensitivity and specificity of the developed dichotomous LOS model using different prevalence (P) measures of the prolonged LOS in the hospital. PPV is the probability that a patient has prolonged LOS when the dichotomous LOS model results are positive. The related formula was presented in Equation (14). It was estimated using the Bayes’ theorem [26]:
u n b i a s e d     P P V = S e × P S e × P + 1 S p × 1 P
Following the Transparent reporting of a multivariable prediction model for individual prognosis or diagnosis (TRIPOD) guideline [47], a CI of 95% of the performance indices was reported.

2.6. Ethical Considerations

The study protocol was reviewed and approved by the Isfahan University of Medical Sciences Research Ethical Committee (IUMSREC), with the following approvals: Modeling of incidence and outcomes of COVID-19: IR.MUI.RESEARCH.REC.1399.479 and Longitudinal epidemiologic investigation of patients’ characteristics with coronavirus infection referring to Isfahan Khorshid Hospital: IR.MUI.MED.REC.1399.029, conforming to the Declaration of Helsinki. Patient informed consent was obtained before admission to the current study. All data were kept confidential and had no personal identifiers. No minors participated in our study.

3. Results

Descriptive statistics were used to summarize the baseline characteristics of the study population. In our setting, 1600 COVID-19 patients were included in the study. Patients were categorized according to their LOS (≤7 days (n = 1165) as “normal”, >7 days (n = 435) as “prolonged”) in univariate comparison analysis. The median length of stay during the study period was 7.2 (IQR 4−9) days. Table 1 and Table 2 summarize the descriptive statistics and the characteristics and symptoms of the patients considered in the study according to the length of stay categories.
For an example, an 86-year-old male COVID-19 patient with fever, cough, myalgia, sore throat, dizziness, diarrhea, stomachache and weight loss symptoms, but without chest pain, headache, loss of smell, vomiting, nausea, and short breath with CCI of 4, maximum body temperature of 36°, heart rate of 84 (beats per minute), respiratory rate of 16 (breaths per minute), systolic blood pressure of 105 (mmHg), diastolic blood pressure of 66 (mmHg), %O2 saturation minimum of 90, neutrophils of 715 (×109/L), lymphocytes of 264 (×109/L), hemoglobin of 12.10 (g/dL), platelet of 126.00 (×109/L), ferritin of 255.50 (ng/mL), CRP of 14.00 (mg/L), ESR of 26.00 (mm/h), LDH of 487.00 (U/L), D-dimer of 98.30 (mg/L), AST of 39.00 (IU/L), HCO3 of 31.00 (mEq/L), ALT of 16.00 (IU/L), creatinine of 0.73 (mg/dL), phosphorus of 2.56 (mg/dL), magnesium of 1.90 (mg/dL), sodium of 135.00 (mEq/L), potassium of 4.00 (mEq/L), BUN of 24.80 (mg/dL), and total bilirubin of 0.96 (mg/dL) had an LOS of 5 days in Khorshid Hospital.
Figure 1 shows the frequency distribution of LOS, which was right-skewed. The median age of patients was 59 (IQR 47–79) years (range 5–91), and 58% were male. Comorbidities were present in more than half of the patients, with hypertension being the most common comorbidity, followed by diabetes. The Charlson comorbidity index is presented in Table 1 for patients admitted for ≤7 and >7 days in hospital. The comorbidities score was significantly higher in patients with longer LOS (p-value < 0.05, Table 1). The cutoffs used for high-risk exposures were provided by the following: age [48], body temperature [49], heart rate [50,51], blood pressure [52], oxygen saturation [53], neutrophils, lymphocytes, hemoglobin, platelets, D-dimer [54], ferritin [55], CRP [56], ESR [57], LDH [58], AST [59], ALT [60], and creatinine [61].
Figure 2 shows the rate of different PCEP events among patients for both short and prolonged LOS. ICU admission is the most prevalent (55%) status among patients with prolonged LOS. There was a significant association between LOS and the PCEP binary variable (p-value < 0.001).
Fever (p-value < 0.001), cough (p-value < 0.001), myalgia (p-value < 0.001), weight loss (p-value 0.018), and shortness of breath (p-value 0.032) were significantly different in the LOS groups (Table 2). The cross-validated results of the proposed algorithm for the estimation of LOS as well as its “normal” and “prolonged” categories is provided in Table 3. The most important features of the LOS prediction system were inflammatory markers, HCO3, and fever.
The Bland–Altman plot of residual analysis is provided in Figure 3. Although the bias was not statistically significant (p-value = 0.777; paired-sample t-test), the residual error was higher in higher target LOS than lower LOS values. The residual error was further analyzed in “normal” and “prolonged” LOS groups. The estimation error values of 3.9% and 3.2% subjects surpassed the lower or higher 1.96 limits in the “normal” and “prolonged” LOS groups, respectively.
The ROC curve was then provided for the predicted LOS versus the binary ground truth (Figure 4). The best cutoff was calculated using the Youden index (J = Se + Sp − 1), estimated as >6.95, almost identical to our a-priori threshold.
We further predicted the importance of significant factors in the Kolmogorov–Gabor polynomials. The main predictors were only analyzed based on their normalized coefficients in the model. The seven most important factors are provided in Figure 5.
The unbiased PPV plot is provided in Figure 6 based on the prevalence of the prolonged LOS and Equation (14). The required parameters of Bayes’ theorem were assessed from Table 3.

4. Discussion

4.1. Implications

Medical researchers have recently been striving to enhance the quality and efficiency of healthcare systems and services. A significant aspect of this endeavor pertains to the LOS in the context of future outbreaks. Given the emergence of various variants of the virus responsible for COVID-19, accurately assessing or predicting LOS is becoming increasingly vital. An extended LOS not only impacts hospital capacity [62] but also escalates costs associated with outbreak management [63]. Hence, nations must plan for even the worst-case scenarios. This research delved into the risk factors of hospital admissions that influence the LOS among COVID-19 patients in Isfahan, Iran. We utilized a novel nonlinear artificial intelligence method for continuous data, focusing on comprehensive predictors. Our findings indicate that patients with prolonged hospital stays typically exhibited higher inflammatory markers, increased HCO3, and more prevalent fever. These insights can guide clinicians in pinpointing specific risk factors linked to extended LOS. Moreover, our results serve as a benchmark for various models that could be applied in similar analyses, allowing healthcare professionals to narrow down critical variables for predicting LOS from the multitude recorded in hospital systems.
In our research, the median LOS was 7.2 days, with an interquartile range (IQR) of 4–9 days. It aligns closely with findings from a Chinese study [64], wherein the median hospital LOS fluctuated between 4 to 53 days over 45 domestic studies and 4 to 21 days across eight international studies. In contrast, a comprehensive report, drawing from data across 25 countries, recorded a median LOS of just 4 days and an IQR of 1–9 days [65]—substantially shorter than our recorded observations. Notably, our results surpassed the median LOS of 6 days documented in Saudi Arabia [66]. However, it fell short of the 16.4 days indicated in Indiana [67], aligning with the 8.5 days reported in the Mediterranean. These regional variances in LOS can be ascribed to many factors, including the infrastructure of healthcare facilities, the severity of treated cases, diverse admission and discharge protocols, and varying treatment approaches. Additionally, sociodemographic variables, especially age, are pivotal in influencing the observed international disparities in hospital stays.

4.2. Risk Factors

The consistency in hospital bed occupancy duration across various demographic groups in our research contrasts starkly with findings from a significant US study by Nguyen et al. [68]. Their research indicated that males typically had a more extended LOS than females. Due to the limited sample size in our cohort, we could not investigate the influence of gender on the likelihood of ICU admission. Furthermore, while our findings showed a consistent LOS regardless of demographic distinctions, European studies suggest a pronounced variability in hospital stays based on both gender and age [69]. In our data, the correlation between age and LOS was relatively weak (r = 0.134; p-value < 0.001).
In our research, the predominant symptoms upon admission, such as cough, fever, and shortness of breath, align with many earlier studies [70,71]. A systematic review and meta-analysis spanning 54 studies identified the most frequent symptoms in COVID-19 patients as follows: fever at 81.2% (95% CI: 77.9–84.4), cough at 58.5% (95% CI: 54.2–62.8), fatigue at 38.5% (95% CI: 30.6–45.3), dyspnea at 26.1% (95% CI: 20.4–31.8), and sputum production at 25.8% (95% CI: 21.1–30.4) [72]. Our findings concur with these percentages concerning fever and cough. However, the prevalence of shortness of breath in our study diverged.
Disturbances in total white blood cells, particularly lymphocytes, are often seen as the immune system’s response to inflammation. There is growing evidence that lymphopenia, characterized by a reduced lymphocyte count, significantly influences the trajectory of COVID-19, right from its onset to the eventual development of viral sepsis. This decrease in lymphocytes has been identified as a symptom of acute COVID-19, potentially resulting from direct damage inflicted by the virus [73]. Our findings regarding lymphopenia echo those of previous studies. Earlier research has outlined prognostic models that gauge the severity of SARS-CoV-2 infection by monitoring the lymphocyte-to-leukocyte ratio [74,75].
Recent studies have illustrated that lymphocyte counts below 5% were predominantly observed in patients exhibiting severe symptoms upon follow-up. There also appears to be a trend wherein lymphopenia is more pronounced and persistent among the gravely affected patients [76,77]. These studies also highlighted that patients with extended hospital stays typically had increased circulating lymphocytes, whereas their neutrophil counts were marginally diminished. This surge in lymphocytes might be attributed to rejuvenated production, given their rise both as a percentage of total blood cells and in absolute terms. Notably, the lymphocyte count was elevated across all patient severity subgroups [78], suggesting its potential role in extended LOS or heightened mortality risk [79].
Our study underscores the substantial influence of D-dimer on the length of hospital stay, aligning with the conclusions of other meta-analyses. These analyses indicate that D-dimer correlates with factors such as comorbidities, demographics, specific laboratory tests, radiological findings, the duration of hospitalization, complications, and ultimate outcomes. Such findings propose that D-dimer is a distinct biomarker, interfacing with other inflammatory cytokine markers indicative of organ or tissue damage. Furthermore, the interaction of acute-phase proteins with D-dimer implies that infection-driven inflammation (comprising cytokines and chemokines) instigates a state of hyper-fibrinolysis, a notion reinforced by D-dimer’s disconnect from the comprehensive coagulation panel [80,81].
Our study showed that patients with prolonged LOS among COVID-19 cases exhibited a significantly higher ESR. Many studies have assessed acute-phase responses to COVID-19 since the pandemic’s onset, and these frequently included ESR data [82,83]. A meta-analysis [84] further highlighted that elevated ESR levels were particularly pronounced in severe and fatal cases of COVID-19. Another comprehensive meta-analysis by Zhang et al. [85], which analyzed 28 studies encompassing 4663 cases, discovered that 61.2% of cases with increased ESR had a longer length of stay and were at a heightened risk for severe disease. Notably, variations in sedimentation rates between the groups were not explored.
There is a noticeable gap in the literature regarding using HCO3 values as predictors for LOS. It might be attributed to the understanding that abnormal HCO3 levels already indicate extended hospitalization [86]. It is plausible that these levels act more as process variables than predictors, a sentiment echoed by our findings. The serum HCO3 level indicates the acid–base balance within the human body and is commonly assessed in routine biochemical tests, particularly as renal diseases advance [87]. Certain clinical studies have posited a potential role for serum HCO3 levels in forecasting mortality from ailments beyond progressive renal disease. For instance, diminished HCO3 levels have been linked to mortality from malignancies, while elevated HCO3 levels have been associated with cardiovascular disease complications and related mortalities [88].
Low HCO3 serum levels upon ICU admission significantly predict both short-term and long-term mortality. Additionally, a reduced serum HCO3 serves as an indicator of acidosis. Past research confirms that acidosis can diminish systemic vascular resistance, exacerbating conditions like circulatory shock, impaired myocardial contraction, and tissue malperfusion. This cascade of complications can ultimately precipitate end-organ failure, including acute kidney injury, which might primarily contribute to the grim prognosis observed in critically ill patients.

4.3. The Properties of Kolmogorov–Gabor Polynomials

Among the diverse techniques employed for continuous prediction, we utilized Kolmogorov–Gabor polynomials. These are more popularly recognized as the Volterra series. They serve as instrumental methodologies in identifying and modeling nonlinear systems. They can adeptly capture a broad spectrum of nonlinear behaviors by executing a series expansion based on system input. Within the context of a hospital setting, when compared with other prediction algorithms, the Volterra series boasts several advantages [89]:
Flexibility: The Volterra series can depict many nonlinear systems, endorsing its versatility across diverse modeling landscapes.
Interpretability: A standout feature of the Volterra series is its capacity to demystify the system’s structure. It delineates the input–output relationship across linear, quadratic, and cubic terms. It facilitates a deeper comprehension of the system’s nonlinearity and subsequent impact.
Theoretical Foundations: The mathematical underpinnings of Kolmogorov–Gabor polynomials are well-established and rigorously studied, ensuring a robust theoretical base for their application.
However, it is essential to note that while these advantages are compelling, particular challenges and potential drawbacks also emerge [37]:
Computational Complexity: The expansion order’s escalation leads to an exponential growth in computational demands. It can hinder the feasibility of deploying high-order models, particularly when grappling with multitudinous inputs.
Overfitting: As with many adaptive models, there is an inherent overfitting risk when complexity overshadows the data’s intricacy. Such scenarios necessitate a meticulous model selection process to safeguard against over-optimization and ensure genuine applicability to new datasets.
In our research, we have employed regularization techniques. Additionally, by capping the interaction level at two, we have strategically mitigated computational demands and curtailed the risk of overfitting.

4.4. Performance Indices

Guarding against testing hypotheses suggested by the data (Type III errors) was guaranteed by cross-validation. The LOS prediction method showed strong agreement with the measured LOS ( ρ c = 0.94), and strong goodness-of-fit (R2 = 0.8), and did not show a significant bias (p-value = 0.777; paired-sample t-test). However, the Bland–Altman error regression showed higher errors for lower LOS values.
The binary classification algorithm, on the other hand, showed a statistical power of 92%, a Type I error of 0.09, and a precision of 79%. It also had an excellent balanced diagnosis accuracy (AUC = 0.91), a high correlation between predicted and observed class labels (MCC = 0.79), and an excellent class labeling agreement rate (K(C) = 0.79). However, it is not entirely clinically reliable, as Type I errors must be less than 0.05, and the precision must be higher than or equal to 95% [34].

4.5. Comparison with the State-of-the-Art

We searched “Embase” for journal papers with the key words “(‘length of stay’/exp OR ‘length of stay’) AND (‘hospital’/exp OR ‘hospital’) AND (‘prediction’/exp OR ‘prediction’) AND (‘machine learning’/exp OR ‘machine learning’) AND (‘COVID’/exp OR ‘COVID’OR ‘coronavirus’/exp OR ‘coronavirus’)” without publication date condition. Among 64 screened, 45 records were excluded after analyzing their abstracts since they did not predict LOS. Nineteen records were thus assessed for eligibility. Journal papers with at least one prediction performance index and a sound ML methodology were included in Table 4 (10 methods as the state-of-the-art, besides the proposed algorithm “this study”).
Among the studies in Table 4, only Hong et al., 2020 [16] and our study followed the TRIPOD guideline [47] to report the 95% CI of the performance indices. In addition to transparency in reporting, it quantifies precision, uncertainty, reproducibility, and generalization. Only Alam et al. [23], Mahboub et al. [19], Liuzzi et al. [20], Usher et al. [18] and our study did not use missing imputations. The others used missing imputations. However, no analysis was performed to identify the reasons for missing data, i.e., missing completely at random (MCAR), missing at random (MAR), and missing not at random (MNAR), which is critical in missing data analysis [90]. In our study, we not only did not include ICU admission, mechanical ventilation, or treatments as the inputs, but we also only used baseline information at hospital admission, which was not the case for Ebinger et al. [17], Usher et al. [18], Liuzzi et al. [20], Mahboub et al. [19], and Alam et al. [23].
Similarly to Alabbad et al. [22], Usher et al. [18], and Liuzzi et al. [20], we used cross-validation. Zhang et al. [24] used bootstrapped validation, though the 0.632+ bootstrap method is preferred in the literature [91]. Hold-out validation used by Ebinger et al. [17], Orooji et al. [21], Mahboub et al. [19], and Alam et al. [23] might introduce Type III error, and the repeated hold-out validation method is preferred. Also, Hong et al. [16] and Nemati et al. [15] did not use validation. Among the studies included in Table 4, only Nemati et al. [15], Usher et al. [18], and Liuzzi et al. [20] were multi-center. Orooji et al. [21] excluded subjects who died within 3 days of hospital admission, resulting in sampling bias. Our study is ranked in the top third based on the sample size. Moreover, Alabbad et al. [22] and Alam et al. [23] balanced the unbalanced training and test datasets, resulting in biased evaluation metrics, potential misleading improvement, and overfitting to the minority class. However, they had a better goodness-of-fit R2 = 0.80 compared to other studies. Our study is the only one that reported the Bland–Altman plot critical to analyzing the residual error [35].
Like most studies in Table 4 [15,16,17,18,19,20], our study only focused on the first COVID-19 wave. However, Orooji et al. [21] considered the first, second, and third waves. Alam et al. [23] analyzed the first and second waves, and Zhang et al. [24] considered the Omicron variant. Thus, a direct comparison of the results of the proposed method and the other three methods [21,23,24] is not entirely rigorous.

4.6. Dichotomous LOS Definition

When the median LOS in our dataset was 7 days, then using a 7-day cutoff to dichotomize hospital LOS was statistically motivated: (1) Using the median as a cutoff point ensures that approximately half of the patients are categorized as “short stay” and the other half as “long stay”; (2) the median represents the robust central tendency of the data; patients with “prolonged” LOS are staying longer than the majority of patients, suggesting they might have different clinical characteristics, needs, or outcomes; (3) the median is robust to outliers and is not affected by very short or very long LOS values; and (4) the binary outcome can be directly tied to the dataset’s inherent structure, making the results more interpretable in the context of the data. However, it might make direct comparisons between the binary LOS model and other datasets or studies more challenging unless they also use a median LOS of 7 days.

4.7. Limitations and Future Research

Our study has several limitations. Firstly, given its single-center design with 1600 COVID-19 patients at a major academic hospital following specific institutional treatment protocols, the findings might not directly apply to other hospitals throughout Asian countries. More samples are required to improve the statistical power of the proposed method. Secondly, while we tried to control for disease severity in our analysis, we could not account for more subjective factors, including the nuances of treatment that might influence endpoint decisions. To comprehensively evaluate the potential impact of treatment on LOS, a prospective randomized trial is imperative. Thirdly, the Bland–Altman analysis of residual error highlighted a non-uniform error across measured LOS. Integrating the Bland–Altman parameters into the cost function will be a focal point of our future endeavors. While our initial findings demonstrate promising results, expanding the validation scope will provide a more holistic understanding of the model’s capabilities. Addressing these gaps in temporal and spatial validation will be instrumental in fostering confidence in our approach and ensuring its relevance across broader contexts, which is the focus of our future activity. Moreover, using multimodal image-processing prediction methods could, in principle, improve the reliability of the proposed algorithm [92,93], which is a focus of our future studies.
While the current model has been calibrated based on the original SARS-CoV-2 strain, the underlying framework holds potential for adaptation to newer strains. We can ensure its sustained relevance and accuracy in predicting LOS by continually updating and retraining the model with data from emerging variants. Integrating this dynamic model within the hospital health information system will facilitate real-time adaptability, making it a versatile tool for clinicians across different pandemic phases.

5. Conclusions

In this research, the utilization of machine learning models, notably the Volterra functional series, demonstrated a promising approach to predicting the length of stay (LOS) of COVID-19 patients. Validated on a significant dataset from Khorshid Hospital in Iran, the model showed strong performance metrics, including an R2 of 0.8 and a concordance correlation coefficient of 0.94, indicating a good fit and a high agreement with the measured LOS. As noted in multiple studies, key features that played a vital role in LOS prediction were inflammatory markers, bicarbonate, and fever, aligning with the commonly observed symptoms in COVID-19 patients. The binary classification algorithm further provided insights into differentiating between “normal” and “prolonged” LOS groups. While the results present a substantial basis, there is room for improvement in the clinical reliability of the binary classification algorithm, especially concerning its Type I error and precision rate.
However, some limitations and considerations remain in the study. The Bland–Altman error regression indicated a higher error rate for patients with a lower LOS, suggesting potential areas for refinement in the model for this patient subgroup. Moreover, while our findings regarding the most prevalent symptoms upon admission were consistent with several other studies, there were notable discrepancies in the observed prevalence of shortness of breath. As healthcare providers and hospitals globally grapple with the challenges posed by the COVID-19 pandemic, findings from this research could pave the way for better resource management. Nonetheless, further temporal and spatial validation is imperative before generalized application. Future research endeavors could delve deeper into optimizing the model’s clinical reliability and expanding the model’s scope to other pertinent clinical outcomes. Further studies and medical regulations are essential to establish a dependable clinical prediction model suitable for smart hospitals.

Author Contributions

Conceptualization, H.M., M.Á.M., S.R.L. and M.M. (Marjan Mansourian); methodology, H.M., F.A., M.M. (Mohammadreza Mohebbian), K.T. and M.M. (Marjan Mansourian); software, M.N., F.A. and H.M.; validation, F.A., R.S., K.T. and M.M. (Marjan Mansourian); formal analysis, H.M., F.A., S.R.L. and M.M. (Marjan Mansourian); investigation, H.M., M.N., F.A. and M.M. (Marjan Mansourian); resources, R.S. and M.M. (Marjan Mansourian); data curation, F.A., M.N. and M.M. (Marjan Mansourian); writing—original draft preparation, H.M., M.N., F.A., K.T. and M.M. (Marjan Mansourian); writing—review and editing, M.M. (Mohammadreza Mohebbian), M.Á.M., S.R.L. and R.S.; visualization, H.M., F.A. and M.M. (Marjan Mansourian); supervision, M.Á.M., R.S. and M.M. (Marjan Mansourian); project administration, R.S. and M.M. (Marjan Mansourian); funding acquisition, H.M., M.N., M.Á.M., R.S. and M.M. (Marjan Mansourian). All authors have read and agreed to the published version of the manuscript.

Funding

This research was funded by the Beatriu de Pinós post-doctoral programme from the Office of the Secretary of Universities and Research from the Ministry of Business and Knowledge of the Government of Catalonia programme: 2020 BP 00261 (H.M.); National Funds through the FCT—Fundação para a Ciência e a Tecnologia, I.P., under the scope of the projects UIDB/00297/2020 and UIDP/00297/2020 (Center for Mathematics and Applications) (M.N.); the Ministry of Science and Innovation [Ministerio de Ciencia e Innovación (MICINN)], Spain, under contract PID2020-117751RB-I00 (M.A.M., S.R.L.). CIBER-BBN is an initiative of the Instituto de Salud Carlos III, Spain. The funders had no role in study design, data collection and analysis, decision to publish, or preparation of the manuscript.

Data Availability Statement

The data presented in this study are available on request from the corresponding author. The data are not publicly available due to Hospital privacy restrictions.

Acknowledgments

We sincerely thank the nurses and interns of Khorshid Hospital for their invaluable contribution to patient recruitment and follow-up data collection. Foremost, our appreciation goes to the patients who generously gave their consent to partake in this study.

Conflicts of Interest

The authors declare no conflict of interest. The funders had no role in the design of the study; in the collection, analyses, or interpretation of data; in the writing of the manuscript; or in the decision to publish the results.

References

  1. Zhuang, Z.; Cao, P.; Zhao, S.; Han, L.; He, D.; Yang, L. The shortage of hospital beds for COVID-19 and non-COVID-19 patients during the lockdown of Wuhan, China. Ann. Transl. Med. 2021, 9, 200. [Google Scholar] [CrossRef] [PubMed]
  2. Sen-Crowe, B.; Sutherland, M.; McKenney, M.; Elkbuli, A. A Closer Look into Global Hospital Beds Capacity and Resource Shortages During the COVID-19 Pandemic. J. Surg. Res. 2021, 260, 56–63. [Google Scholar] [CrossRef] [PubMed]
  3. Jaziri, R.; Alnahdi, S. Choosing which COVID-19 patient to save? The ethical triage and rationing dilemma. Ethics Med. Public Health 2020, 15, 100570. [Google Scholar] [CrossRef] [PubMed]
  4. Remuzzi, A.; Remuzzi, G. COVID-19 and Italy: What next? Lancet 2020, 395, 1225–1228. [Google Scholar] [CrossRef]
  5. Deschepper, M.; Eeckloo, K.; Malfait, S.; Benoit, D.; Callens, S.; Vansteelandt, S. Prediction of hospital bed capacity during the COVID-19 pandemic. BMC Health Serv. Res. 2021, 21, 468. [Google Scholar] [CrossRef]
  6. Pasquale, S.; Gregorio, G.L.; Caterina, A.; Francesco, C.; Beatrice, P.M.; Vincenzo, P.; Caterina, P.M. COVID-19 in Low- and Middle-Income Countries (LMICs): A Narrative Review from Prevention to Vaccination Strategy. Vaccines 2021, 9, 1477. [Google Scholar] [CrossRef]
  7. Sasangohar, F.; Jones, S.L.; Masud, F.N.; Vahidy, F.S.; Kash, B.A. Provider Burnout and Fatigue During the COVID-19 Pandemic: Lessons Learned from a High-Volume Intensive Care Unit. Anesth. Analg. 2020, 131, 106–111. [Google Scholar] [CrossRef]
  8. Sikaras, C.; Ilias, I.; Tselebis, A.; Pachi, A.; Zyga, S.; Tsironi, M.; Gil, A.P.R.; Panagiotou, A. Nursing staff fatigue and burnout during the COVID-19 pandemic in Greece. AIMS Public Health 2022, 9, 94–105. [Google Scholar] [CrossRef]
  9. Sagherian, K.; Steege, L.M.; Cobb, S.J.; Cho, H. Insomnia, fatigue and psychosocial well-being during COVID-19 pandemic: A cross-sectional survey of hospital nursing staff in the United States. J. Clin. Nurs. 2023, 32, 5382–5395. [Google Scholar] [CrossRef]
  10. Alsunaidi, S.J.; Almuhaideb, A.M.; Ibrahim, N.M.; Shaikh, F.S.; Alqudaihi, K.S.; Alhaidari, F.A.; Khan, I.U.; Aslam, N.; Alshahrani, M.S. Applications of Big Data Analytics to Control COVID-19 Pandemic. Sensors 2021, 21, 2282. [Google Scholar] [CrossRef]
  11. Marateb, H.R.; Mohebbian, M.R.; Shirzadi, M.; Mirshamsi, A.; Zamani, S.; Abrisham chi, A.; Bafande, F.; Mañanas, M.Á. Reliability of machine learning methods for diagnosis and prognosis during the COVID-19 pandemic: A comprehensive critical review. In High Performance Computing for Intelligent Medical Systems; IOP Publishing: Bristol, UK, 2021; pp. 5-1–5-25. [Google Scholar] [CrossRef]
  12. Steele, A.J.; Denaxas, S.C.; Shah, A.D.; Hemingway, H.; Luscombe, N.M. Machine learning models in electronic health records can outperform conventional survival models for predicting patient mortality in coronary artery disease. PLoS ONE 2018, 13, e0202344. [Google Scholar] [CrossRef] [PubMed]
  13. Alimadadi, A.; Aryal, S.; Manandhar, I.; Munroe, P.B.; Joe, B.; Cheng, X. Artificial intelligence and machine learning to fight COVID-19. Physiol. Genom. 2020, 52, 200–202. [Google Scholar] [CrossRef] [PubMed]
  14. Pickering, B.W.; Dong, Y.; Ahmed, A.; Giri, J.; Kilickaya, O.; Gupta, A.; Gajic, O.; Herasevich, V. The implementation of clinician designed, human-centered electronic medical record viewer in the intensive care unit: A pilot step-wedge cluster randomized trial. Int. J. Med. Inf. Inform. 2015, 84, 299–307. [Google Scholar] [CrossRef]
  15. Nemati, M.; Ansary, J.; Nemati, N. Machine-Learning Approaches in COVID-19 Survival Analysis and Discharge-Time Likelihood Prediction Using Clinical Data. Patterns 2020, 1, 100074. [Google Scholar] [CrossRef] [PubMed]
  16. Hong, Y.; Wu, X.; Qu, J.; Gao, Y.; Chen, H.; Zhang, Z. Clinical characteristics of Coronavirus Disease 2019 and development of a prediction model for prolonged hospital length of stay. Ann. Transl. Med. 2020, 8, 443. [Google Scholar] [CrossRef]
  17. Ebinger, J.; Wells, M.; Ouyang, D.; Davis, T.; Kaufman, N.; Cheng, S.; Chugh, S. A Machine Learning Algorithm Predicts Duration of hospitalization in COVID-19 patients. Intell. Based Med. 2021, 5, 100035. [Google Scholar] [CrossRef]
  18. Usher, M.G.; Tourani, R.; Simon, G.; Tignanelli, C.; Jarabek, B.; Strauss, C.E.; Waring, S.C.; Klyn, N.A.M.; Kealey, B.T.; Tambyraja, R.; et al. Overcoming gaps: Regional collaborative to optimize capacity management and predict length of stay of patients admitted with COVID-19. JAMIA Open 2021, 4, ooab055. [Google Scholar] [CrossRef]
  19. Mahboub, B.; Bataineh, M.T.A.; Alshraideh, H.; Hamoudi, R.; Salameh, L.; Shamayleh, A. Prediction of COVID-19 Hospital Length of Stay and Risk of Death Using Artificial Intelligence-Based Modeling. Front. Med. 2021, 8, 592336. [Google Scholar] [CrossRef]
  20. Liuzzi, P.; Campagnini, S.; Fanciullacci, C.; Arienti, C.; Patrini, M.; Carrozza, M.C.; Mannini, A. Predicting SARS-CoV-2 infection duration at hospital admission:a deep learning solution. Med. Biol. Eng. Comput. 2022, 60, 459–470. [Google Scholar] [CrossRef]
  21. Orooji, A.; Shanbehzadeh, M.; Mirbagheri, E.; Kazemi-Arpanahi, H. Comparing artificial neural network training algorithms to predict length of stay in hospitalized patients with COVID-19. BMC Infect. Dis. 2022, 22, 923. [Google Scholar] [CrossRef]
  22. Alabbad, D.A.; Almuhaideb, A.M.; Alsunaidi, S.J.; Alqudaihi, K.S.; Alamoudi, F.A.; Alhobaishi, M.K.; Alaqeel, N.A.; Alshahrani, M.S. Machine learning model for predicting the length of stay in the intensive care unit for COVID-19 patients in the eastern province of Saudi Arabia. Inf. Inform. Med. Unlocked 2022, 30, 100937. [Google Scholar] [CrossRef]
  23. Alam, F.; Ananbeh, O.; Malik, K.M.; Odayani, A.A.; Hussain, I.B.; Kaabia, N.; Aidaroos, A.A.; Saudagar, A.K.J. Towards Predicting Length of Stay and Identification of Cohort Risk Factors Using Self-Attention-Based Transformers and Association Mining: COVID-19 as a Phenotype. Diagnostics 2023, 13, 1760. [Google Scholar] [CrossRef] [PubMed]
  24. Zhang, J.; Li, L.; Hu, X.; Cui, G.; Sun, R.; Zhang, D.; Li, J.; Li, Y.; Shen, S.; He, P.; et al. Development of a model by LASSO to predict hospital length of stay (LOS) in patients with the SARS-CoV-2 omicron variant. Virulence 2023, 14, 2196177. [Google Scholar] [CrossRef] [PubMed]
  25. Wolkewitz, M.; Allignol, A.; Harbarth, S.; de Angelis, G.; Schumacher, M.; Beyersmann, J. Time-dependent study entries and exposures in cohort studies can easily be sources of different and avoidable types of bias. J. Clin. Epidemiol. 2012, 65, 1171–1180. [Google Scholar] [CrossRef] [PubMed]
  26. Pepe, M.S. The Statistical Evaluation of Medical Tests for Classification and Prediction; Oxford University Press: Oxford, UK; New York, NY, USA, 2003; 302p. [Google Scholar]
  27. Steyerberg, E.W. Clinical Prediction Models: A Practical Approach to Development, Validation, and Updating; Springer: New York, NY, USA, 2019; p. 558. [Google Scholar]
  28. Sami, R.; Soltaninejad, F.; Amra, B.; Naderi, Z.; Haghjooy Javanmard, S.; Iraj, B.; Haji Ahmadi, S.; Shayganfar, A.; Dehghan, M.; Khademi, N.; et al. A one-year hospital-based prospective COVID-19 open-cohort in the Eastern Mediterranean region: The Khorshid COVID Cohort (KCC) study. PLoS ONE 2020, 15, e0241537. [Google Scholar] [CrossRef]
  29. Charlson, M.E.; Pompei, P.; Ales, K.L.; MacKenzie, C.R. A new method of classifying prognostic comorbidity in longitudinal studies: Development and validation. J. Chronic Dis. 1987, 40, 373–383. [Google Scholar] [CrossRef]
  30. Glasheen, W.P.; Cordier, T.; Gumpina, R.; Haugh, G.; Davis, J.; Renda, A. Charlson Comorbidity Index: ICD-9 Update and ICD-10 Translation. Am. Health Drug Benefits 2019, 12, 188–197. [Google Scholar]
  31. Comoglu, S.; Kant, A. Does the Charlson comorbidity index help predict the risk of death in COVID-19 patients? North. Clin. Istanb. 2022, 9, 117–121. [Google Scholar] [CrossRef]
  32. Walker, H.; Hall, W.; Hurst, J. Clinical Methods: The History, Physical, and Laboratory Examinations, 3rd ed.; Butterworths: Boston, MA, USA, 1990. [Google Scholar]
  33. Guan, W.J.; Ni, Z.Y.; Hu, Y.; Liang, W.H.; Ou, C.Q.; He, J.X.; Liu, L.; Shan, H.; Lei, C.L.; Hui, D.S.C.; et al. Clinical Characteristics of Coronavirus Disease 2019 in China. N. Engl. J. Med. 2020, 382, 1708–1720. [Google Scholar] [CrossRef]
  34. Mansourian, M.; Marateb, H.R.; Mansourian, M.; Mohebbian, M.R.; Binder, H.; Mañanas, M.Á. Rigorous performance assessment of computer-aided medical diagnosis and prognosis systems: A biostatistical perspective on data mining. Model. Anal. Act. Biopotential Signals Healthc. 2020, 2, 17-11–17-24. [Google Scholar] [CrossRef]
  35. Giavarina, D. Understanding Bland Altman analysis. Biochem. Med. 2015, 25, 141–151. [Google Scholar] [CrossRef] [PubMed]
  36. Ofori-Asenso, R.; Liew, D.; Mårtensson, J.; Jones, D. The Frequency of, and Factors Associated with Prolonged Hospitalization: A Multicentre Study in Victoria, Australia. J. Clin. Med. 2020, 9, 3055. [Google Scholar] [CrossRef]
  37. Madala, H.R.; Ivakhnenko, A.G.e. Inductive Learning Algorithms for Complex Systems Modeling; CRC Press: Boca Raton, FL, USA, 1994; p. 368. [Google Scholar]
  38. Hancock, J.T.; Khoshgoftaar, T.M. Survey on categorical data for neural networks. J. Big Data 2020, 7, 28. [Google Scholar] [CrossRef]
  39. Yoo, W.; Mayberry, R.; Bae, S.; Singh, K.; Peter He, Q.; Lillard, J.W., Jr. A Study of Effects of MultiCollinearity in the Multivariable Analysis. Int. J. Appl. Sci. Technol. 2014, 4, 9–19. [Google Scholar] [PubMed]
  40. Beck, A. Introduction to Nonlinear Optimization: Theory, Algorithms, and Applications with MATLAB; Society for Industrial and Applied Mathematics, Mathematical Optimization Society: Philadelphia, PA, USA, 2014; p. 282. [Google Scholar]
  41. Jain, R.K. Ridge regression and its application to medical data. Comput. Biomed. Res. 1985, 18, 363–368. [Google Scholar] [CrossRef] [PubMed]
  42. Chicco, D.; Warrens, M.J.; Jurman, G. The coefficient of determination R-squared is more informative than SMAPE, MAE, MAPE, MSE and RMSE in regression analysis evaluation. PeerJ Comput. Sci. 2021, 7, e623. [Google Scholar] [CrossRef]
  43. Lawrence, I.K.L. A Concordance Correlation Coefficient to Evaluate Reproducibility. Biometrics 1989, 45, 255–268. [Google Scholar] [CrossRef]
  44. Rees, E.M.; Nightingale, E.S.; Jafari, Y.; Waterlow, N.R.; Clifford, S.; Pearson, C.A.B.; Group, C.W.; Jombart, T.; Procter, S.R.; Knight, G.M. COVID-19 length of hospital stay: A systematic review and data synthesis. BMC Med. 2020, 18, 270. [Google Scholar] [CrossRef]
  45. Chicco, D.; Tötsch, N.; Jurman, G. The Matthews correlation coefficient (MCC) is more reliable than balanced accuracy, bookmaker informedness, and markedness in two-class confusion matrix evaluation. BioData Min. 2021, 14, 13. [Google Scholar] [CrossRef]
  46. Chicco, D.; Jurman, G. The advantages of the Matthews correlation coefficient (MCC) over F1 score and accuracy in binary classification evaluation. BMC Genom. 2020, 21, 6. [Google Scholar] [CrossRef]
  47. Collins, G.S.; Reitsma, J.B.; Altman, D.G.; Moons, K.G.M. Transparent reporting of a multivariable prediction model for individual prognosis or diagnosis (TRIPOD): The TRIPOD Statement. BMC Med. 2015, 13, 1. [Google Scholar] [CrossRef] [PubMed]
  48. Yanez, N.D.; Weiss, N.S.; Romand, J.-A.; Treggiari, M.M. COVID-19 mortality risk for older men and women. BMC Public Health 2020, 20, 1742. [Google Scholar] [CrossRef]
  49. Uchiyama, S.; Sakata, T.; Tharakan, S.; Ishikawa, K. Body temperature as a predictor of mortality in COVID-19. Sci. Rep. 2023, 13, 13354. [Google Scholar] [CrossRef] [PubMed]
  50. Jin, H.; Yang, S.; Yang, F.; Zhang, L.; Weng, H.; Liu, S.; Fan, F.; Li, H.; Zheng, X.; Yang, H.; et al. Elevated resting heart rates are a risk factor for mortality among patients with coronavirus disease 2019 in Wuhan, China. J. Transl. Int. Med. 2021, 9, 285–293. [Google Scholar] [CrossRef] [PubMed]
  51. Devgun, J.M.; Zhang, R.; Brent, J.; Wax, P.; Burkhart, K.; Meyn, A.; Campleman, S.; Abston, S.; Aldy, K.; Group, T.I.C.F.S. Identification of Bradycardia Following Remdesivir Administration Through the US Food and Drug Administration American College of Medical Toxicology COVID-19 Toxic Pharmacovigilance Project. JAMA Netw. Open 2023, 6, e2255815. [Google Scholar] [CrossRef]
  52. Hopkins Tanne, J. US guidelines say blood pressure of 120/80 mm Hg is not “normal”. BMJ 2003, 326, 1104. [Google Scholar] [CrossRef]
  53. Mejía, F.; Medina, C.; Cornejo, E.; Morello, E.; Vásquez, S.; Alave, J.; Schwalb, A.; Málaga, G. Oxygen saturation as a predictor of mortality in hospitalized adult patients with COVID-19 in a public hospital in Lima, Peru. PLoS ONE 2020, 15, e0244171. [Google Scholar] [CrossRef]
  54. Liu, X.; Zhang, R.; He, G. Hematological findings in coronavirus disease 2019: Indications of progression of disease. Ann. Hematol. 2020, 99, 1421–1428. [Google Scholar] [CrossRef]
  55. Cheng, L.; Li, H.; Li, L.; Liu, C.; Yan, S.; Chen, H.; Li, Y. Ferritin in the coronavirus disease 2019 (COVID-19): A systematic review and meta-analysis. J. Clin. Lab. Anal. 2020, 34, e23618. [Google Scholar] [CrossRef]
  56. Stringer, D.; Braude, P.; Myint, P.K.; Evans, L.; Collins, J.T.; Verduri, A.; Quinn, T.J.; Vilches-Moraga, A.; Stechman, M.J.; Pearce, L.; et al. The role of C-reactive protein as a prognostic marker in COVID-19. Int. J. Epidemiol. 2021, 50, 420–429. [Google Scholar] [CrossRef]
  57. Maradit-Kremers, H.; Nicola, P.J.; Crowson, C.S.; Ballman, K.V.; Jacobsen, S.J.; Roger, V.L.; Gabriel, S.E. Raised erythrocyte sedimentation rate signals heart failure in patients with rheumatoid arthritis. Ann. Rheum. Dis. 2007, 66, 76–80. [Google Scholar] [CrossRef] [PubMed]
  58. Nakakubo, S.; Unoki, Y.; Kitajima, K.; Terada, M.; Gatanaga, H.; Ohmagari, N.; Yokota, I.; Konno, S. Serum Lactate Dehydrogenase Level One Week after Admission Is the Strongest Predictor of Prognosis of COVID-19: A Large Observational Study Using the COVID-19 Registry Japan. Viruses 2023, 15, 671. [Google Scholar] [CrossRef] [PubMed]
  59. Krishnasamy, N.; Rajendran, K.; Barua, P.; Ramachandran, A.; Panneerselvam, P.; Rajaram, M. Elevated Liver Enzymes along with Comorbidity Is a High Risk Factor for COVID-19 Mortality: A South Indian Study on 1512 Patients. J. Clin. Transl. Hepatol. 2022, 10, 120–127. [Google Scholar] [CrossRef] [PubMed]
  60. Yin, L.K.; Tong, K.S. Elevated Alt and Ast in an Asymptomatic Person: What the primary care doctor should do? Malays. Fam. Physician 2009, 4, 98–99. [Google Scholar]
  61. Hosten, A.O. BUN and Creatinine. In Clinical Methods: The History, Physical, and Laboratory Examinations; Walker, H.K., Hall, W.D., Hurst, J.W., Eds.; Butterworth Publishers: Boston, MA, USA, 1990. [Google Scholar]
  62. Fine, M.J.; Pratt, H.M.; Obrosky, D.S.; Lave, J.R.; McIntosh, L.J.; Singer, D.E.; Coley, C.M.; Kapoor, W.N. Relation between length of hospital stay and costs of care for patients with community-acquired pneumonia. Am. J. Med. 2000, 109, 378–385. [Google Scholar] [CrossRef]
  63. White, B.A.; Biddinger, P.D.; Chang, Y.; Grabowski, B.; Carignan, S.; Brown, D.F. Boarding inpatients in the emergency department increases discharged patient length of stay. J. Emerg. Med. 2013, 44, 230–235. [Google Scholar] [CrossRef]
  64. Chang, R.; Elhusseiny, K.M.; Yeh, Y.-C.; Sun, W.-Z. COVID-19 ICU and mechanical ventilation patient characteristics and outcomes—A systematic review and meta-analysis. PLoS ONE 2021, 16, e0246318. [Google Scholar] [CrossRef]
  65. Group, I.C.C.; Baillie, J.K.; Joaquin, B.; Abigail, B.; Lucille, B.; Fernando Augusto, B.; Tessa, B.; Aidan, B.; Gail, C.; Barbara Wanjiru, C.; et al. ISARIC COVID-19 Clinical Data Report issued: 27 March 2022. medRxiv 2022. [Google Scholar] [CrossRef]
  66. Alwafi, H.; Naser, A.Y.; Qanash, S.; Brinji, A.S.; Ghazawi, M.A.; Alotaibi, B.; Alghamdi, A.; Alrhmani, A.; Fatehaldin, R.; Alelyani, A.; et al. Predictors of Length of Hospital Stay, Mortality, and Outcomes Among Hospitalised COVID-19 Patients in Saudi Arabia: A Cross-Sectional Study. J. Multidiscip. Healthc. 2021, 14, 839–852. [Google Scholar] [CrossRef]
  67. Garbacz, S. Average COVID-19 Hospital Stay Greater than Three Weeks. Available online: https://www.kpcnews.com/covid-19/article_8ab408ad-8fb0-5f74-8d57-11e586bd8a4f.html (accessed on 26 August 2023).
  68. Nguyen, N.T.; Chinn, J.; De Ferrante, M.; Kirby, K.A.; Hohmann, S.F.; Amin, A. Male gender is a predictor of higher mortality in hospitalized adults with COVID-19. PLoS ONE 2021, 16, e0254066. [Google Scholar] [CrossRef]
  69. Commission, E. Hospital Discharges and Length of Stay Statistics. Available online: https://ec.europa.eu/eurostat/statistics-explained/index.php?title=Hospital_discharges_and_length_of_stay_statistics&oldid=561104#Average_length_of_hospital_stay_for_in-patients (accessed on 26 August 2023).
  70. Garibaldi, B.T.; Fiksel, J.; Muschelli, J.; Robinson, M.L.; Rouhizadeh, M.; Perin, J.; Schumock, G.; Nagy, P.; Gray, J.H.; Malapati, H.; et al. Patient Trajectories Among Persons Hospitalized for COVID-19: A Cohort Study. Ann. Intern. Med. 2021, 174, 33–41. [Google Scholar] [CrossRef]
  71. Karagiannidis, C.; Mostert, C.; Hentschker, C.; Voshaar, T.; Malzahn, J.; Schillinger, G.; Klauber, J.; Janssens, U.; Marx, G.; Weber-Carstens, S.; et al. Case characteristics, resource use, and outcomes of 10 021 patients with COVID-19 admitted to 920 German hospitals: An observational study. Lancet Respir. Med. 2020, 8, 853–862. [Google Scholar] [CrossRef]
  72. Alimohamadi, Y.; Sepandi, M.; Taghdir, M.; Hosamirudsari, H. Determine the most common clinical symptoms in COVID-19 patients: A systematic review and meta-analysis. J. Prev. Med. Hyg. 2020, 61, E304–E312. [Google Scholar] [CrossRef]
  73. Huang, C.; Wang, Y.; Li, X.; Ren, L.; Zhao, J.; Hu, Y.; Zhang, L.; Fan, G.; Xu, J.; Gu, X.; et al. Clinical features of patients infected with 2019 novel coronavirus in Wuhan, China. Lancet 2020, 395, 497–506. [Google Scholar] [CrossRef]
  74. Tan, L.; Wang, Q.; Zhang, D.; Ding, J.; Huang, Q.; Tang, Y.-Q.; Wang, Q.; Miao, H. Lymphopenia predicts disease severity of COVID-19: A descriptive and predictive study. Signal Transduct. Target. Ther. 2020, 5, 33. [Google Scholar] [CrossRef]
  75. Henry, B.; Cheruiyot, I.; Vikse, J.; Mutua, V.; Kipkorir, V.; Benoit, J.; Plebani, M.; Bragazzi, N.; Lippi, G. Lymphopenia and neutrophilia at admission predicts severity and mortality in patients with COVID-19: A meta-analysis. Acta Biomed. 2020, 91, e2020008. [Google Scholar] [CrossRef]
  76. Chen, R.; Sang, L.; Jiang, M.; Yang, Z.; Jia, N.; Fu, W.; Xie, J.; Guan, W.; Liang, W.; Ni, Z.; et al. Longitudinal hematologic and immunologic variations associated with the progression of COVID-19 patients in China. J. Allergy Clin. Immunol. 2020, 146, 89–100. [Google Scholar] [CrossRef]
  77. Liang, J.; Nong, S.; Jiang, L.; Chi, X.; Bi, D.; Cao, J.; Mo, L.; Luo, X.; Huang, H. Correlations of disease severity and age with hematology parameter variations in patients with COVID-19 pre- and post-treatment. J. Clin. Lab. Anal. 2021, 35, e23609. [Google Scholar] [CrossRef]
  78. Gelzo, M.; Cacciapuoti, S.; Pinchera, B.; De Rosa, A.; Cernera, G.; Scialò, F.; Mormile, M.; Fabbrocini, G.; Parrella, R.; Gentile, I.; et al. Prognostic Role of Neutrophil to Lymphocyte Ratio in COVID-19 Patients: Still Valid in Patients That Had Started Therapy? Front. Public Health 2021, 9, 664108. [Google Scholar] [CrossRef]
  79. Rubio-Rivas, M.; Mora-Luján, J.M.; Formiga, F.; Corrales González, M.; García Andreu, M.D.M.; Moreno-Torres, V.; García García, G.M.; Alcalá Pedrajas, J.N.; Boixeda, R.; Pérez-Lluna, L.; et al. Clusters of inflammation in COVID-19: Descriptive analysis and prognosis on more than 15,000 patients from the Spanish SEMI-COVID-19 Registry. Intern. Emerg. Med. 2022, 17, 1115–1127. [Google Scholar] [CrossRef]
  80. Coccheri, S. COVID-19: The crucial role of blood coagulation and fibrinolysis. Intern. Emerg. Med. 2020, 15, 1369–1373. [Google Scholar] [CrossRef]
  81. Martín-Rojas, R.M.; Pérez-Rus, G.; Delgado-Pinos, V.E.; Domingo-González, A.; Regalado-Artamendi, I.; Alba-Urdiales, N.; Demelo-Rodríguez, P.; Monsalvo, S.; Rodríguez-Macías, G.; Ballesteros, M.; et al. COVID-19 coagulopathy: An in-depth analysis of the coagulation system. Eur. J. Haematol. 2020, 105, 741–750. [Google Scholar] [CrossRef]
  82. Rodriguez-Morales, A.J.; Cardona-Ospina, J.A.; Gutiérrez-Ocampo, E.; Villamizar-Peña, R.; Holguin-Rivera, Y.; Escalera-Antezana, J.P.; Alvarado-Arnez, L.E.; Bonilla-Aldana, D.K.; Franco-Paredes, C.; Henao-Martinez, A.F.; et al. Clinical, laboratory and imaging features of COVID-19: A systematic review and meta-analysis. Travel Med. Infect. Dis. 2020, 34, 101623. [Google Scholar] [CrossRef]
  83. Lu, R.; Qin, J.; Wu, Y.; Wang, J.; Huang, S.; Tian, L.; Zhang, T.; Wu, X.; Huang, S.; Jin, X.; et al. Epidemiological and clinical characteristics of COVID-19 patients in Nantong, China. J. Infect. Dev. Ctries. 2020, 14, 440–446. [Google Scholar] [CrossRef]
  84. Henry, B.M.; de Oliveira, M.H.S.; Benoit, S.; Plebani, M.; Lippi, G. Hematologic, biochemical and immune biomarker abnormalities associated with severe illness and mortality in coronavirus disease 2019 (COVID-19): A meta-analysis. Clin. Chem. Lab. Med. 2020, 58, 1021–1028. [Google Scholar] [CrossRef]
  85. Zhang, Z.L.; Hou, Y.L.; Li, D.T.; Li, F.Z. Laboratory findings of COVID-19: A systematic review and meta-analysis. Scand. J. Clin. Lab. Investig. 2020, 80, 441–447. [Google Scholar] [CrossRef]
  86. Tan, L.; Xu, Q.; Li, C.; Chen, X.; Bai, H. Association Between the Admission Serum Bicarbonate and Short-Term and Long-Term Mortality in Acute Aortic Dissection Patients Admitted to the Intensive Care Unit. Int. J. Gen. Med. 2021, 14, 4183–4195. [Google Scholar] [CrossRef]
  87. Erbel, R. Hypotensive Systolic Blood Pressure Predicts Severe Complications and In-Hospital Mortality in Acute Aortic Dissection. J. Am. Coll. Cardiol. 2018, 71, 1441–1443. [Google Scholar] [CrossRef]
  88. Al-Kindi, S.G.; Sarode, A.; Zullo, M.; Rajagopalan, S.; Rahman, M.; Hostetter, T.; Dobre, M. Serum Bicarbonate Concentration and Cause-Specific Mortality: The National Health and Nutrition Examination Survey 1999-2010. Mayo Clin. Proc. 2020, 95, 113–123. [Google Scholar] [CrossRef]
  89. GMDH-Methodology and Implementation in MATLAB; Imperial College Press: London, UK, 2014; p. 284.
  90. Sterne, J.A.C.; White, I.R.; Carlin, J.B.; Spratt, M.; Royston, P.; Kenward, M.G.; Wood, A.M.; Carpenter, J.R. Multiple imputation for missing data in epidemiological and clinical research: Potential and pitfalls. BMJ 2009, 338, b2393. [Google Scholar] [CrossRef]
  91. Efron, B.; Tibshirani, R. Improvements on Cross-Validation: The 632+ Bootstrap Method. J. Am. Stat. Assoc. 1997, 92, 548–560. [Google Scholar] [CrossRef]
  92. Soda, P.; D’Amico, N.C.; Tessadori, J.; Valbusa, G.; Guarrasi, V.; Bortolotto, C.; Akbar, M.U.; Sicilia, R.; Cordelli, E.; Fazzini, D.; et al. AIforCOVID: Predicting the clinical outcomes in patients with COVID-19 applying AI to chest-X-rays. An Italian multicentre study. Med. Image Anal. 2021, 74, 102216. [Google Scholar] [CrossRef]
  93. Rani, G.; Misra, A.; Dhaka, V.S.; Buddhi, D.; Sharma, R.K.; Zumpano, E.; Vocaturo, E. A multi-modal bone suppression, lung segmentation, and classification approach for accurate COVID-19 detection using chest radiographs. Intell. Syst. Appl. 2022, 16, 200148. [Google Scholar] [CrossRef]
Figure 1. The length of stay (LOS) distribution.
Information 14 00590 g001
Figure 2. The distribution of different patient status PCEPs based on length of stay categories.
Information 14 00590 g002
Figure 3. The Bland–Altman plot of the LOS prediction for cross-validated results. “Target” is the measured LOS, while “Predicted” is the estimated LOS. The regression line of the plot is provided in pink.
Information 14 00590 g003
Figure 4. The receiver operating characteristic curve (ROC) (solid blue) for the predicted LOS versus the binary ground truth. The 95% confidence interval (CI) plots are shown in dotted blue. The reference line was also provided in pink.
Information 14 00590 g004
Figure 5. Seven most important main components in the Kolmogorov–Gabor polynomials model.
Information 14 00590 g005
Figure 6. The unbiased PPV of the proposed binary LOS system based on the prevalence of prolonged LOS in the hospital.
Information 14 00590 g006
Table 1. Characteristics of hospitalized patients with COVID-19 in the Khorshid Cohort Study.
ParametersTotal
(n = 1600)
Length of Stay (LOS)p-Value b
≤7 Days
“Normal” (n = 1165)
>7 Days
“Prolonged”
(n = 435)
LOS, days a6.01 (4.85)3.76 (1.94)12.11 (5.09)<0.001
Age (>65 years)562 (56.10%)507 (43.50%)55 (12.60%)<0.001
Gender (% Female)670 (48.80%)464 (39.80%)206 (47.30%)0.001
Charlson Comorbidity
Index (CCI) a
2.67 (2.13)2.49 (2.11)3.13 (2.13)<0.001
Temperature maximum (≥38 degrees Celsius)412 (25.75%)322 (23.64%)90 (20.68%)0.745
Heart rate, beats per minute (<60 or >100)478 (53.98%)388 (33.3%)90 (20.68%)0.028
Respiratory rate, breaths per minute a22.41 (5.67)22.02 (5.27)23.49 (6.56)0.006
Systolic blood pressure (≥120 mmHg)574 (35.80%)247 (21.01%)277 (63.70%)<0.001
Diastolic blood pressure (≥90 mmHg)218 (13.60%)113 (9.60%)105 (24.10%)0.046
% O2 saturation minimum (<90)754 (47.10%)606 (52.01%)148 (34.02%)0.001
Neutrophils (<4 × 10⁹/L)956 (59.75%)620 (53.22%)336 (77.20%)0.028
Lymphocytes (<1 × 10⁹/L)900 (96.40%)621 (53.30%)279 (64.10%)0.028
Hemoglobin (<12 g/dL)356 (22.30%)293 (20.50%)63 (14.40%)0.085
Platelets (<150 × 109/L)678 (59.75%)480 (41.20%)198 (45.51%)0.142
Ferritin (>500 ng/mL)94 (5.80%)72 (6.01%)22 (5.05%)0.298
CRP (>30 mg/L)685 (42.80%)542 (46.52%)143 (32.87%)0.017
ESR (>60 mm/h)420 (26.30%)245 (21.03%)175 (40.20%)0.027
LDH (>222 U/L)672 (42.00%)416 (35.70%)256 (58.80%)0.046
D-dimer (>0.5 mg/L)381 (23.80%)95 (8.20%)286 (65.70%)0.036
AST (>35 IU/L)1156 (72.30%)749 (64.30%)407 (93.50%)0.330
HCO3 (mEq/L)23.65 (3.67) 17.25 (3.76)20.45 (2.78)0.0123
ALT (>45 IU/L)401 (25.10%)305 (26.18%)96 (22.06%)0.204
Creatinine (>1 mg/dL)822 (51.40%)591 (45.40%)231 (53.10%)<0.001
Phosphorus (mg/dL) a3.06 (0.85)2.97 (0.85)3.24 (0.81)<0.001
Magnesium (mg/dL) a1.96 (0.51)1.95 (0.27)1.99 (0.74)0.335
Sodium (mEq/L) a136.30 (4.13)136.42 (3.94)136.09 (4.46)0.054
Potassium (mEq/L) a4.02 (0.56)3.99 (0.54)4.08 (0.60)0.055
BUN (mg/dL) a19.79 (13.47)18.67 (12.37)21.92 (15.13)<0.001
Total bilirubin (mg/dL) a1.03 (2.17)1.06 (2.61)0.98 (0.61)0.361
a The percentage of the high-risk group (i.e., exposure) was provided in parentheses in total, “normal” or “prolonged” LOS subgroups when the high-risk cutoff was mentioned for parameters, and the standard deviation (SD) was provided (with “a” superscript) otherwise for the variables with an interval measurement scale. Such cutoffs were taken from the literature, and their citations were provided in the manuscript. For the predictor gender, the percentage of female subjects was provided in parentheses as the reference group. Statistical tests were selected based on the data’s nature and the variables’ distribution. b An independent-sample t-test was used for interval variables if the data were normally distributed; otherwise, the Mann–Whitney U test was employed. The Chi-square test was utilized for binary variables to compare proportions between the two independent groups. Note that the expected frequencies in any of the cells of the contingency table were more than five. ESR: erythrocyte sedimentation rate, LDH: lactate dehydrogenase, AST: aspartate transferase, HCO3: bicarbonate, ALT: alanine transaminase, BUN: blood urea nitrogen.
Table 2. Symptoms distribution between patients with normal and prolonged LOS.
SymptomsTotalLength of Stayp-Value a
≤7 Days
“Normal”
(n = 1165)
>7 Days
“Prolonged”
(n = 435)
Fever1118 (69.9%)721 (61.9%)397 (91.3%)< 0.001
Cough1125 (70.3%)990 (85.0%)135 (31.0%)< 0.001
Myalgia838 (52.4%)562 (48.2%)276 (63.4%)< 0.001
Throat pain255 (15.9%)168 (14.4%)87 (20.0%)0.058
Weight Loss259 (16.2%)164 (14.1%)95 (21.8%)0.018
Chest pain394 (24.6%)279 (23.9%)115 (26.4%)0.365
Dizziness97 (6.1%)64 (5.5%)33 (7.6%)0.540
Headache515 (32.2%)372 (31.9%)143 (32.9%)0.112
Loss of smell and taste186 (11.6%)134 (11.5%)52 (12.0%)0.260
Diarrhea377 (23.6%)247 (21.2%)130 (29.9%)0.113
Vomiting352 (22.0%)233 (20.0%)119 (27.4%)0.478
Nausea543 (33.9%)373 (32.0%)170 (39.1%)0.518
Shortness of breath995 (62.2%)646 (55.5%)349 (80.2%)0.032
Stomachache243 (15.2%)166 (14.2%)77 (17.7%)0.393
a The Chi-square test was utilized for binary variables to compare proportions between the two independent groups. Note that the expected frequencies in any of the cells of the contingency table were more than five.
Table 3. The cross-validated results of the proposed prediction algorithm in percent.
IndicesRMSEMAE1MAE2R2adj. R2 ρ c SeSpPPVDORAUCF1MCCK(C)
Value1.581.220.9889819492917911291807979
95% CI-Lower1.511.160.928879938989757189767775
95% CI-Upper1.641.281.0591849595938317994858183
MAE1: mean absolute deviation; MAE2: median absolute deviation.
Table 4. The state-of-the-art to predict hospital LOS in COVID-19 patients.
ReferenceCenter/RegionSample SizeInputsImportant FeaturesOutputsModelsValidationIndices (the Best Method)Important Characteristics
Ebinger et al., 2021 [17]Cedars-Sinai Medical Center (Los Angeles), USA966353 variablesAge, respiratory rate, oxygen flow rate LOS > 8 days vs. LOS ≤ 8 days42 models20% Hold-outSe = 93%
Sp = 63%
F1 = 78%
PPV = 67%
AUC = 0.82
Missing imputation;
cumulative day three information was used.
Hong et al., 2020 [16]A tertiary care hospital in Zhejiang province, China7537 variablesLymphocyte count, heart rate, cough, Epidermis, procalcitonin;LOS > 14 days vs. LOS ≤ 14 daysStepwise multivariable regressionNo internal or external validationAUC = 0.85 [CI 95: 0.75–0.94]Missing imputation;
Orooji et al., 2022 [21] Ayatollah Taleghani Hospital, Abadan, Iran122553 variables20 variables:
Age, creatinine, WBC, lymphocyte/neutrophil count, BUN, ASP, ALT, LDH, activated PTT, coughing, hypertension, CVD, diabetes, dyspnea, oxygen therapy, pneumonia, GI complications, ESR, and CRP.
LOSStatistical feature selection (correlation coefficient)+ MLP+ 12 training algorithms10% Hold-outRMSE = 1.6213 (days)Patients who died within three days of admission were excluded (n = 128); selection bias.
Missing data imputation.
Zhang et al., 2023 [24]Zhengzhou University Hospital (Henan), China38483 variablesImmunotherapy, heparin, familial cluster, rhinorrhea (runny nose), and APTTLOSLASSO+ linear regressionBootstrap validation
(N = 2000)
R2 = 0.30Missing data imputation (10 imputations);
Alabbad et al., 2022 [22]King Fahad University hospital, Saudi Arabia89543 variablesAge, C-reactive protein (CRP), nasal oxygen support days9-class ICU LOSRandom forest (RF) (the best classifier), gradient boosting (GB), extreme gradient boosting (XGBoost), and ensemble models3-fold cross-validationPPV = 94%
Se = 94%
F1 = 94%
Missing data imputation;
SMOTE was used to balance nine classes to have 144 records each, biased performance indices.
The original samples ranged from 12 to 144 for the classes; no admission date was provided.
Nemati et al., 2020 [15]Global dataset1182Five variablesAge, sexLOSStagewise GB (the best method), IPCRidge, CoxPH, Coxnet, Componentwise GB, Fast SVM, Fast Kernel SVMNo internal or external validationC-index = 0.71No comprehensive features except symptoms onset date, symptoms, and chronic disease binary variable
Usher et al., 2021 [18]36 hospitals (Minnesota, Wisconsin, and the Dakotas)266520 variablesVarious variables, including age, critical illness, oxygen requirement, weight loss, and nursing home admissionLOS at >5, >10 and >15 daysGLM, RF (the best model)5-fold cross-validationAUC = 0.89ICU admission, mechanical ventilation, and mortality risk are among the input features; selection and immortal-time bias.
Liuzzi et al., 2022 [20]28 centers (Fondazione Don Carlo Gnocchi (FDG) Living COVID-19 Registry), Italy22282955 variables: anagraphical data, admission clinical scales, admission signs and symptoms, admission supports, COVID-19 therapy, therapy prior to COVID-19, hematochemics LOSSequential convolutional neural networkRepeated (N = 10) 5-fold cross-validationMAE2 = 2.7 days
(IQR = 3.0 days)
17 COVID-19 therapies were included in the input data; selection and immortal-time bias.
Mahboub et al., 2021 [19]Rashid Hospital (Dubai), UAE201722 variablesUrea, PLT, D-dimer, K+, anti-inflammatory medicine, antiviral medicine, mechanical ventilation, hemoglobin, azithromycin medicine, vitamin C medicine, painkiller medicineLOSDecision Tree25% Hold-outR2 = 0.5In addition to mechanical ventilation, treatments were used as input features; selection and immortal-time bias.
Alam et al., 2023 [23]Prince Sultan Hospital (Riyadh), Saudi Arabia 30889 variablesLaboratory, X-ray, clinical data, and treatments, including LDH and D-dimer levels, lymphocyte count, and comorbidities such as hypertension and diabetesSeven-class LOSTab Transformer30% stratified hold-outPr = 83%, Se = 93%, F1 = 93%
(discharged)
Pr = 75%, Se = 98%, F1 = 84%
(dead)
SMOTE-N oversampling technique was used to balance the classes and biased performance indices.
Treatments, including anticoagulants, antibiotics, antivirals, an immunomodulators, were used as the inputs; selection and immortal-time bias.
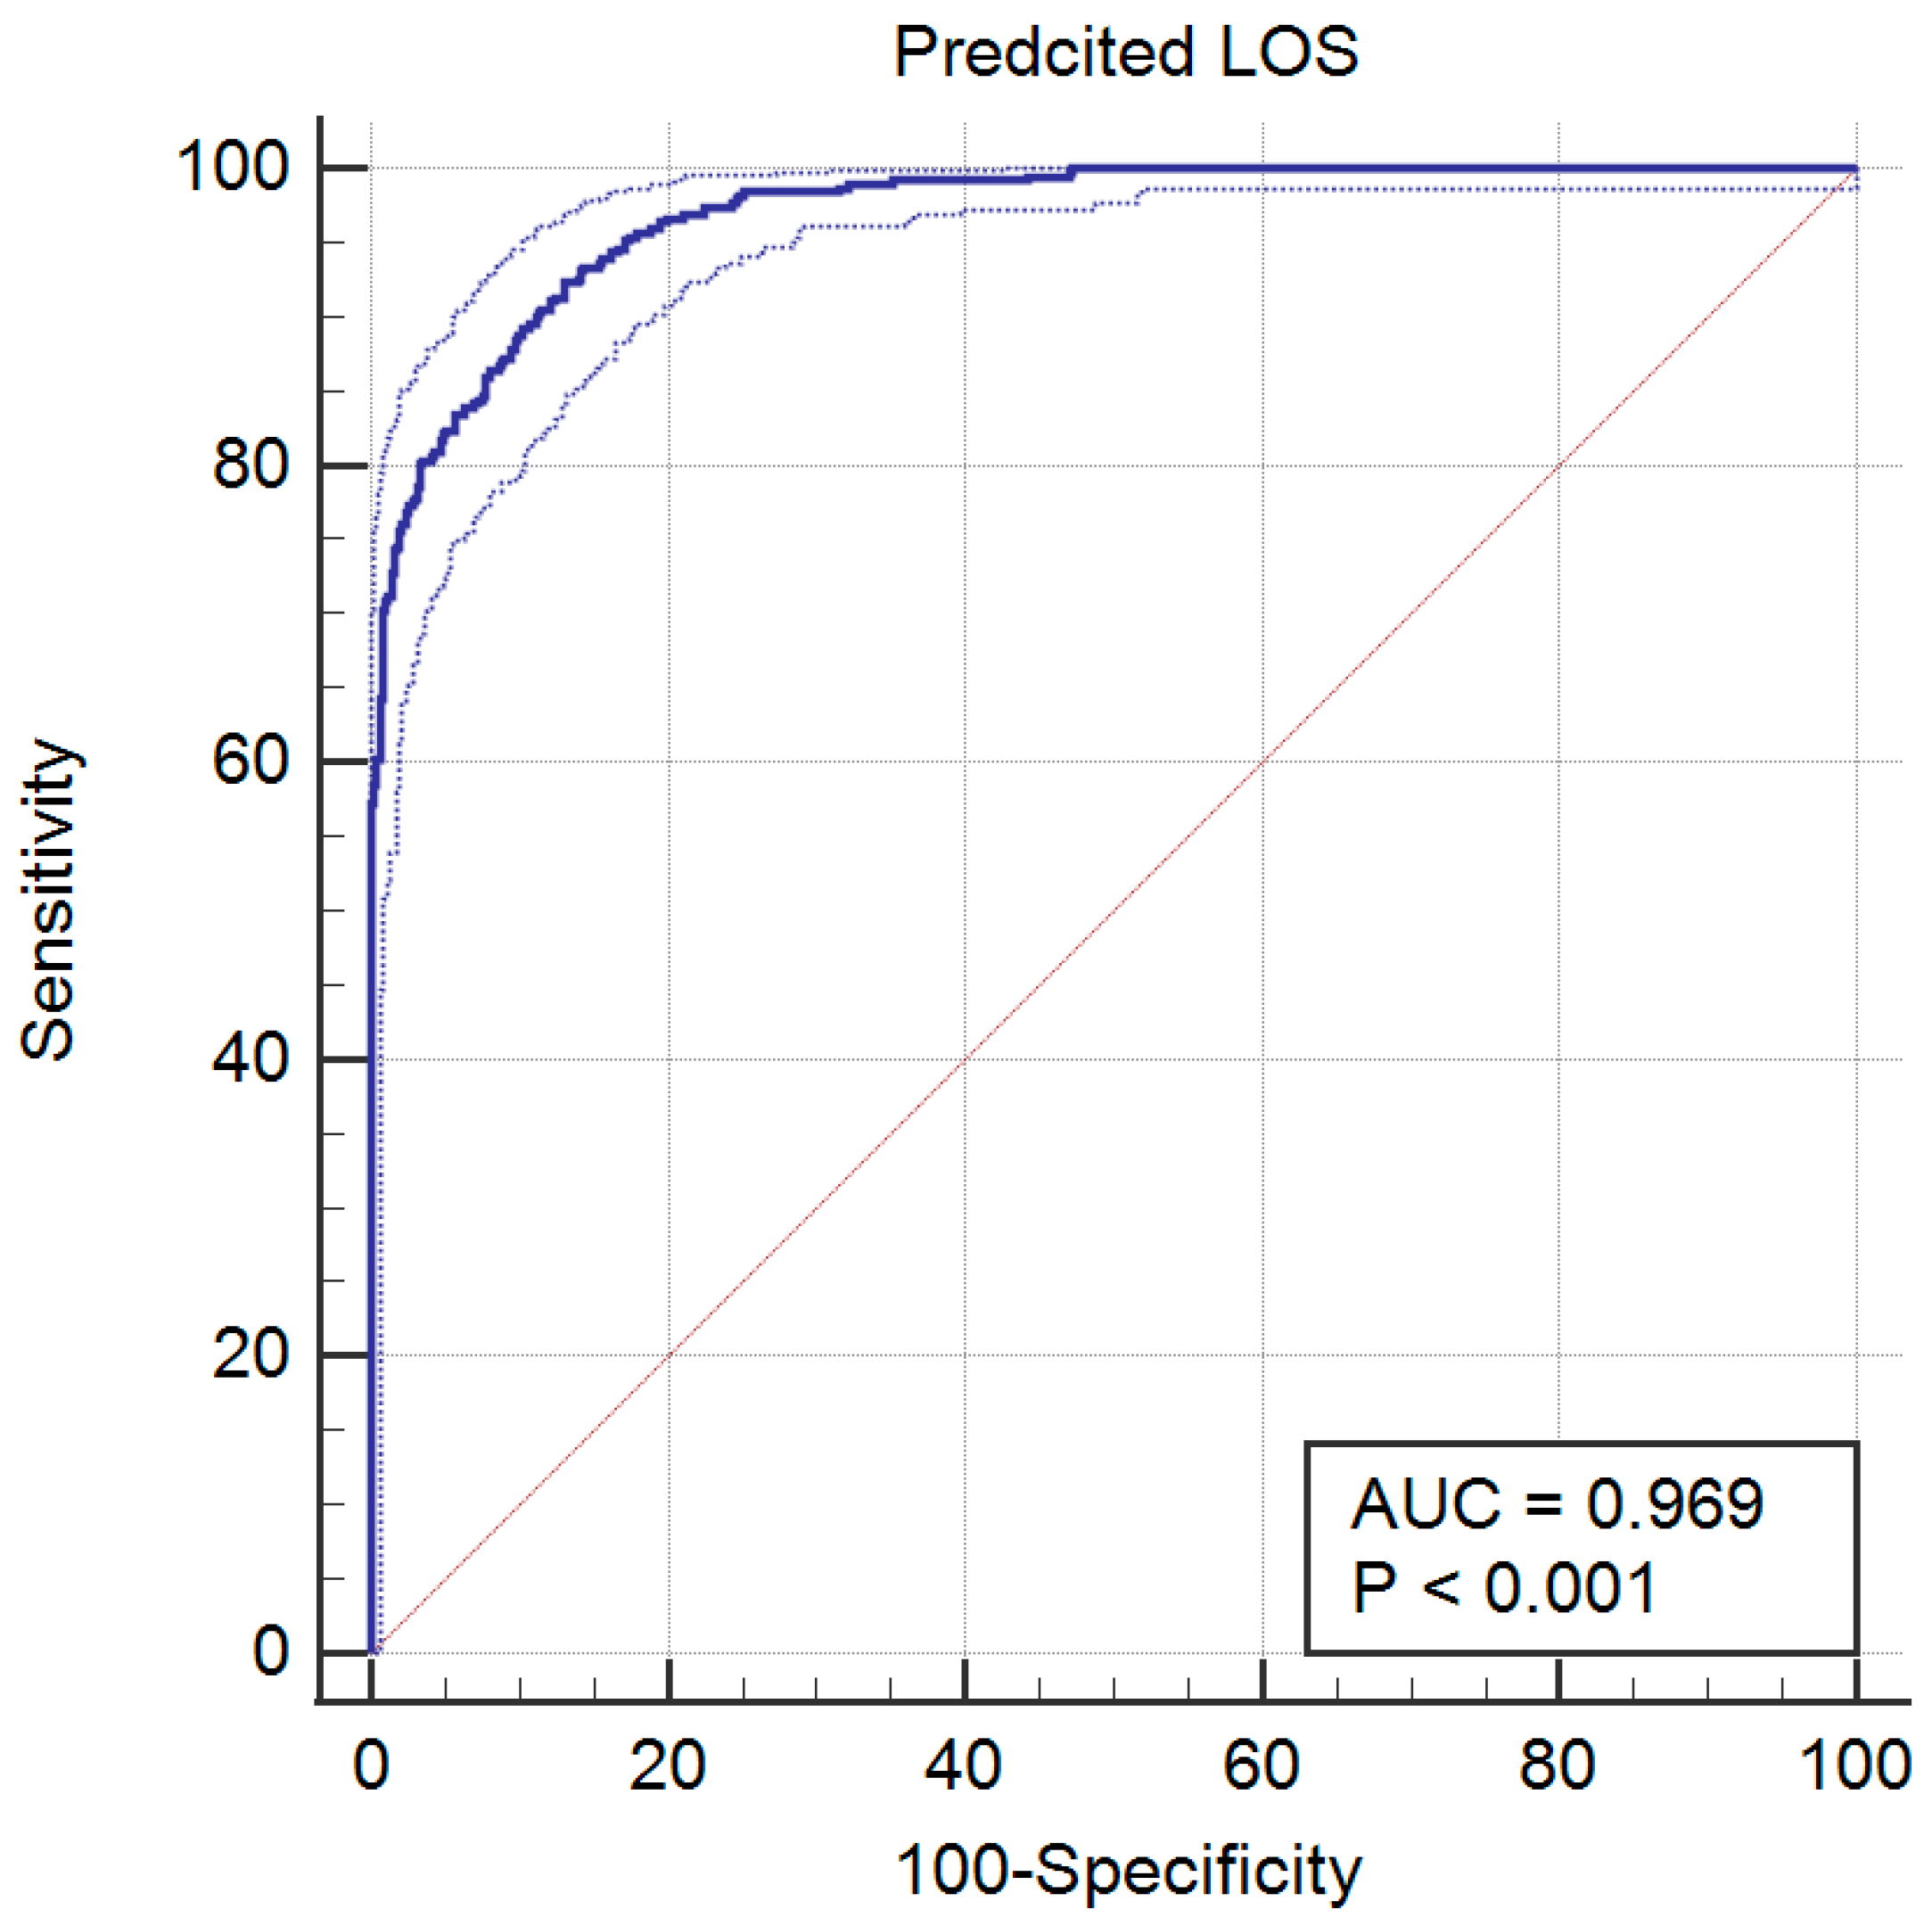
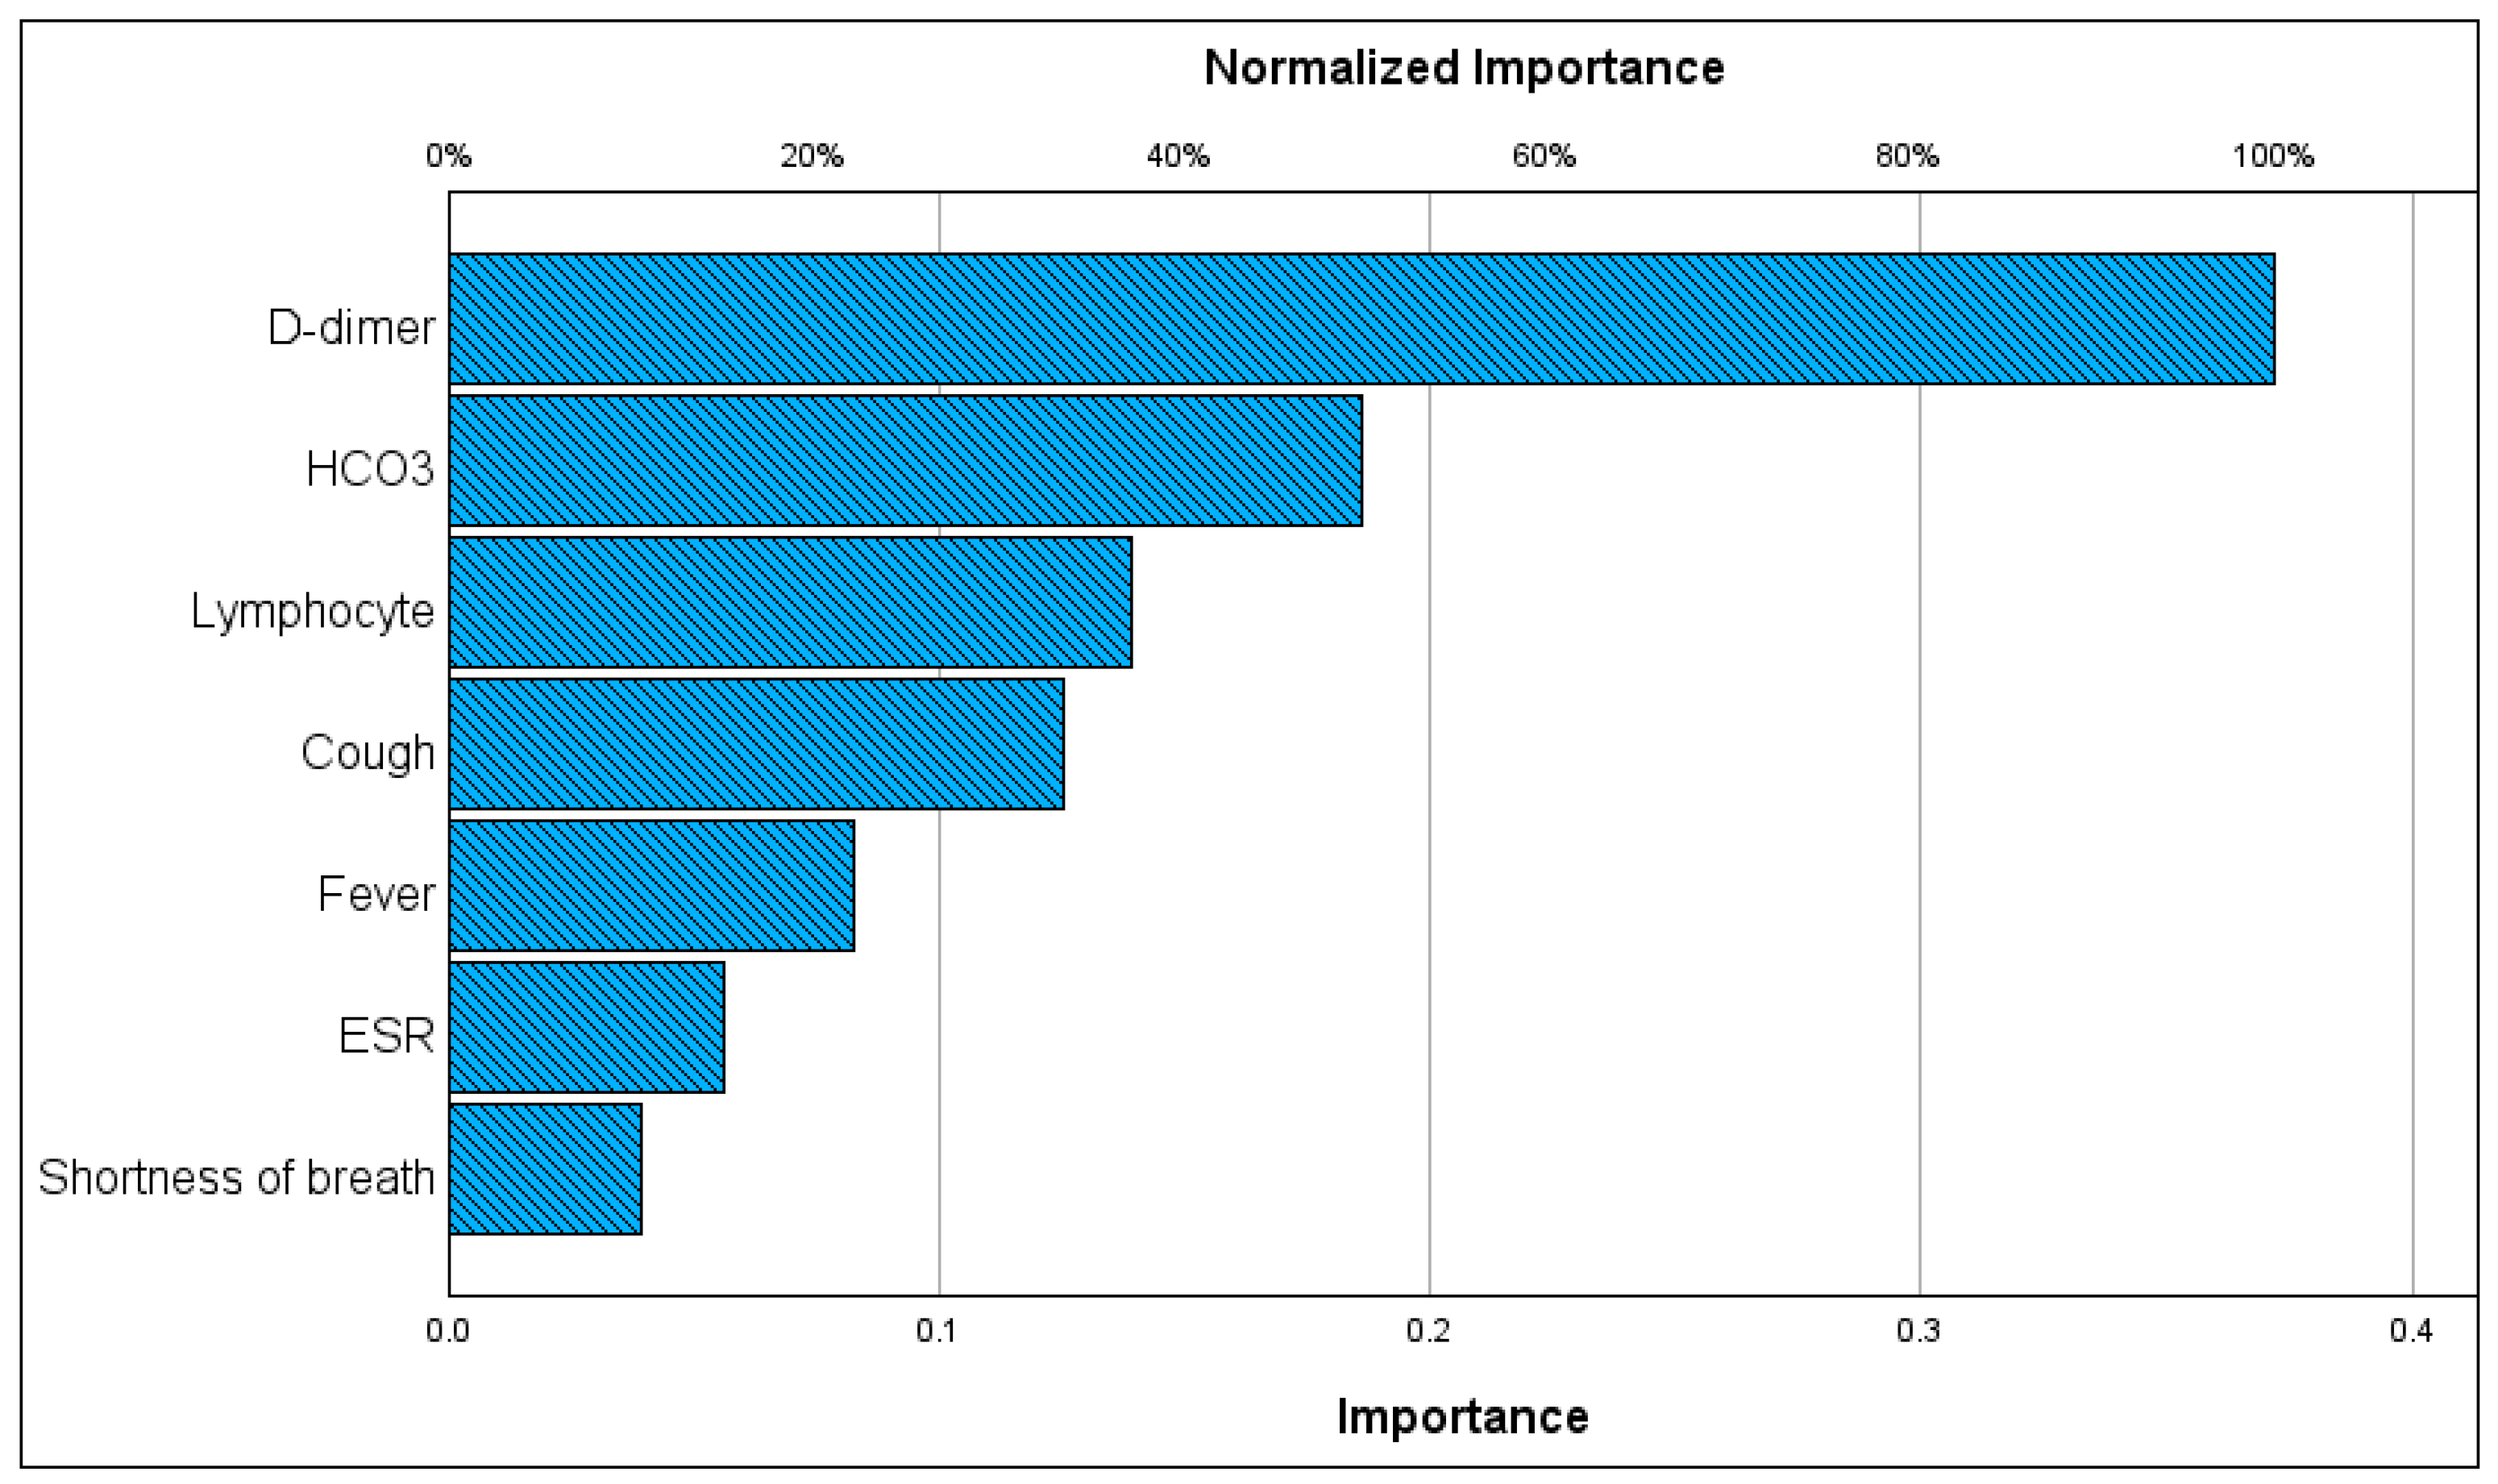
This studyKhorshid Hospital (Isfahan), Iran 160042Inflammatory markers (ESR, D-dimer, lymphocyte counts), HCO3, and feverLOS and also LOS≤ 7 days vs. LOS > 7 daysThe Kolmogorov–Gabor polynomial plus regularized least squaresThree-fold cross-validationLOS:
R2 = 0.89 [0.88–0.91], ρ c = 0.94 [0.93–0.95], RMSE = 1.58 [1.64–1.51] days
MAE1 = 1.22 [1.28–1.16] days,
MAE2 = 0.98
[0.92–1.05] days
LOS categories:
Se = 92% [89–95], Sp = 91% [89–93], PPV = 79% [75–83], AUC = 0.87 [84–89], F1 = 80% [76–85]
No class balancing was used.
ICU admission, mechanical ventilation, and treatments were not used as the input features.
MAE1: mean absolute deviation; MAE2: median absolute deviation.
Disclaimer/Publisher’s Note: The statements, opinions and data contained in all publications are solely those of the individual author(s) and contributor(s) and not of MDPI and/or the editor(s). MDPI and/or the editor(s) disclaim responsibility for any injury to people or property resulting from any ideas, methods, instructions or products referred to in the content.

