Article

Algorithm-Based Data Generation (ADG) Engine for Dual-Mode User Behavioral Data Analytics

by
Iman I. M. Abu Sulayman
1,2,
Peter Voege
1 and
Abdelkader Ouda
1,*
1
Department of Electrical and Computer Engineering, Faculty of Engineering, Western University, London, ON N6A 5B9, Canada
2
Electrical Engineering Department, Engineering College, Main Campus, Taif University, P.O. Box 11099, Taif 21944, Saudi Arabia
*
Author to whom correspondence should be addressed.
Information 2024, 15(3), 146; https://doi.org/10.3390/info15030146
Submission received: 24 January 2024 / Revised: 26 February 2024 / Accepted: 28 February 2024 / Published: 6 March 2024
(This article belongs to the Special Issue Artificial Intelligence and Big Data Applications)

Abstract

:
The increasing significance of data analytics in modern information analysis is underpinned by vast amounts of user data. However, it is only feasible to amass sufficient data for various tasks in specific data-gathering contexts that either have limited security information or are associated with older applications. There are numerous scenarios where a domain is too new, too specialized, too secure, or data are too sparsely available to adequately support data analytics endeavors. In such cases, synthetic data generation becomes necessary to facilitate further analysis. To address this challenge, we have developed an Algorithm-based Data Generation (ADG) Engine that enables data generation without the need for initial data, relying instead on user behavior patterns, including both normal and abnormal behavior. The ADG Engine uses a structured database system to keep track of users across different types of activity. It then uses all of this information to make the generated data as real as possible. Our efforts are particularly focused on data analytics, achieved by generating abnormalities within the data and allowing users to customize the generation of normal and abnormal data ratios. In situations where obtaining additional data through conventional means would be impractical or impossible, especially in the case of specific characteristics like anomaly percentages, algorithmically generated datasets provide a viable alternative. In this paper, we introduce the ADG Engine, which can create coherent datasets for multiple users engaged in different activities and across various platforms, entirely from scratch. The ADG Engine incorporates normal and abnormal ratios within each data platform through the application of core algorithms for time-based and numeric-based anomaly generation. The resulting abnormal percentage is compared against the expected values and ranges from 0.13 to 0.17 abnormal data instances in each column. Along with the normal/abnormal ratio, the results strongly suggest that the ADG Engine has successfully completed its primary task.

1. Introduction

When endeavoring to develop a data analytics system, one of the foremost and daunting hurdles is acquiring a suitable dataset for the task at hand. It is not only imperative that the dataset encompasses relevant data pertaining to your objective, but it must also be abundant in quantity. Additionally, in numerous cases, these data must be appropriately labeled. This is especially crucial for data analytics systems like anomaly detection, where the dataset needs to distinctly differentiate between normal and anomalous data.
In cases where obtaining real-world data of adequate size to fulfill the requirements of the desired anomaly-detection task proves challenging and there are no feasible means to gather additional data, the only option left is to artificially generate the required data by accurately emulating the target conditions [1].
Due to the immense scale of these datasets with specific characteristics, including a predefined rate of anomalies, it is not feasible to create them using any other methods besides algorithmic generation. If successfully accomplished, the potential for executing a significantly larger number of anomaly detection tasks should considerably expand as well.
Consequently, the goal of this paper is to construct a diverse set of algorithms (ADG Engine) that have the ability to generate high-quality labelled data that can be readily accessed and utilized by projects focused on anomaly detection.
The objective of the ADG Engine is to achieve this goal by examining five prevalent data platforms employed in data analytics endeavors. For each data platform, ADG Engine will develop an algorithm with the ability to analyze the data and ascertain attributes such as the proportion of abnormal behavior. This will enable us to generate additional data that aligns with the existing dataset. The ADG Engine does not propose or describe anomaly detection techniques, but the data generated by the Engine is used to build anomaly detection techniques. Moreover, the ADG Engine generates a rational database with eight different features compared to the other related work: Unlimited Data Size, Feature Number Flexibility, Anomaly Features, Rational Datasets, Real Data Aspects, User Behavior, No Initial Data Required, and Number of Applications Variety. The ADG Engine does not cover all platforms, but we focus on the most common platforms, and other platforms can be derived from our platform. For example, any financial data can be driven from our credit card data platform, such as debit card data, retail transaction data, and online transaction data.
The significance of the ADG Engine stems from its robust design, which incorporates a synthetic data generation engine based on dual-mode user behavioral data that includes both normal and abnormal instances. Notably, the engine does not necessitate an initial dataset or data distribution. Instead, researchers can provide a normal/abnormal distribution that aids in simulating real-world data aspects. Furthermore, researchers have the flexibility to select relevant features that reflect the interrelationships observed in their research problem. This engine enables the creation of rational datasets for various data applications, and researchers can choose from five different applications. The availability of these features and options sets this engine apart from existing studies, offering researchers the ability to detect anomalies more effectively in future research endeavors [1]. Given the high likelihood of users utilizing multiple platforms, the ADG Engine considers this factor by generating data from the same user across multiple datasets from different platforms. This approach enables the ADG Engine to better capture real-world data collection scenarios, where individuals rely on various platforms to meet their everyday needs. To accommodate diverse use cases, we aim to make key parameters of the ADG Engine adjustable. For instance, the proportion of generated events that are considered anomalous can be tailored to specific requirements. Additionally, user attributes like marital status and employment status can impact specific dataset features, allowing us to control the generated data by adjusting these attributes. The combination of connecting multiple datasets through individual users and the ability to control the ratio of normal and abnormal behavior provides the ADG Engine with remarkable flexibility and broad applicability. Successful implementation of the engine’s algorithms will enable the creation of effective anomaly detection systems, even when obtaining a large amount of training data is challenging. Furthermore, the principles embedded within the ADG Engine’s algorithms have general applicability to platforms beyond those covered in this study, making them adaptable for generating data for various platforms. The ADG Engine has the following contribution list:
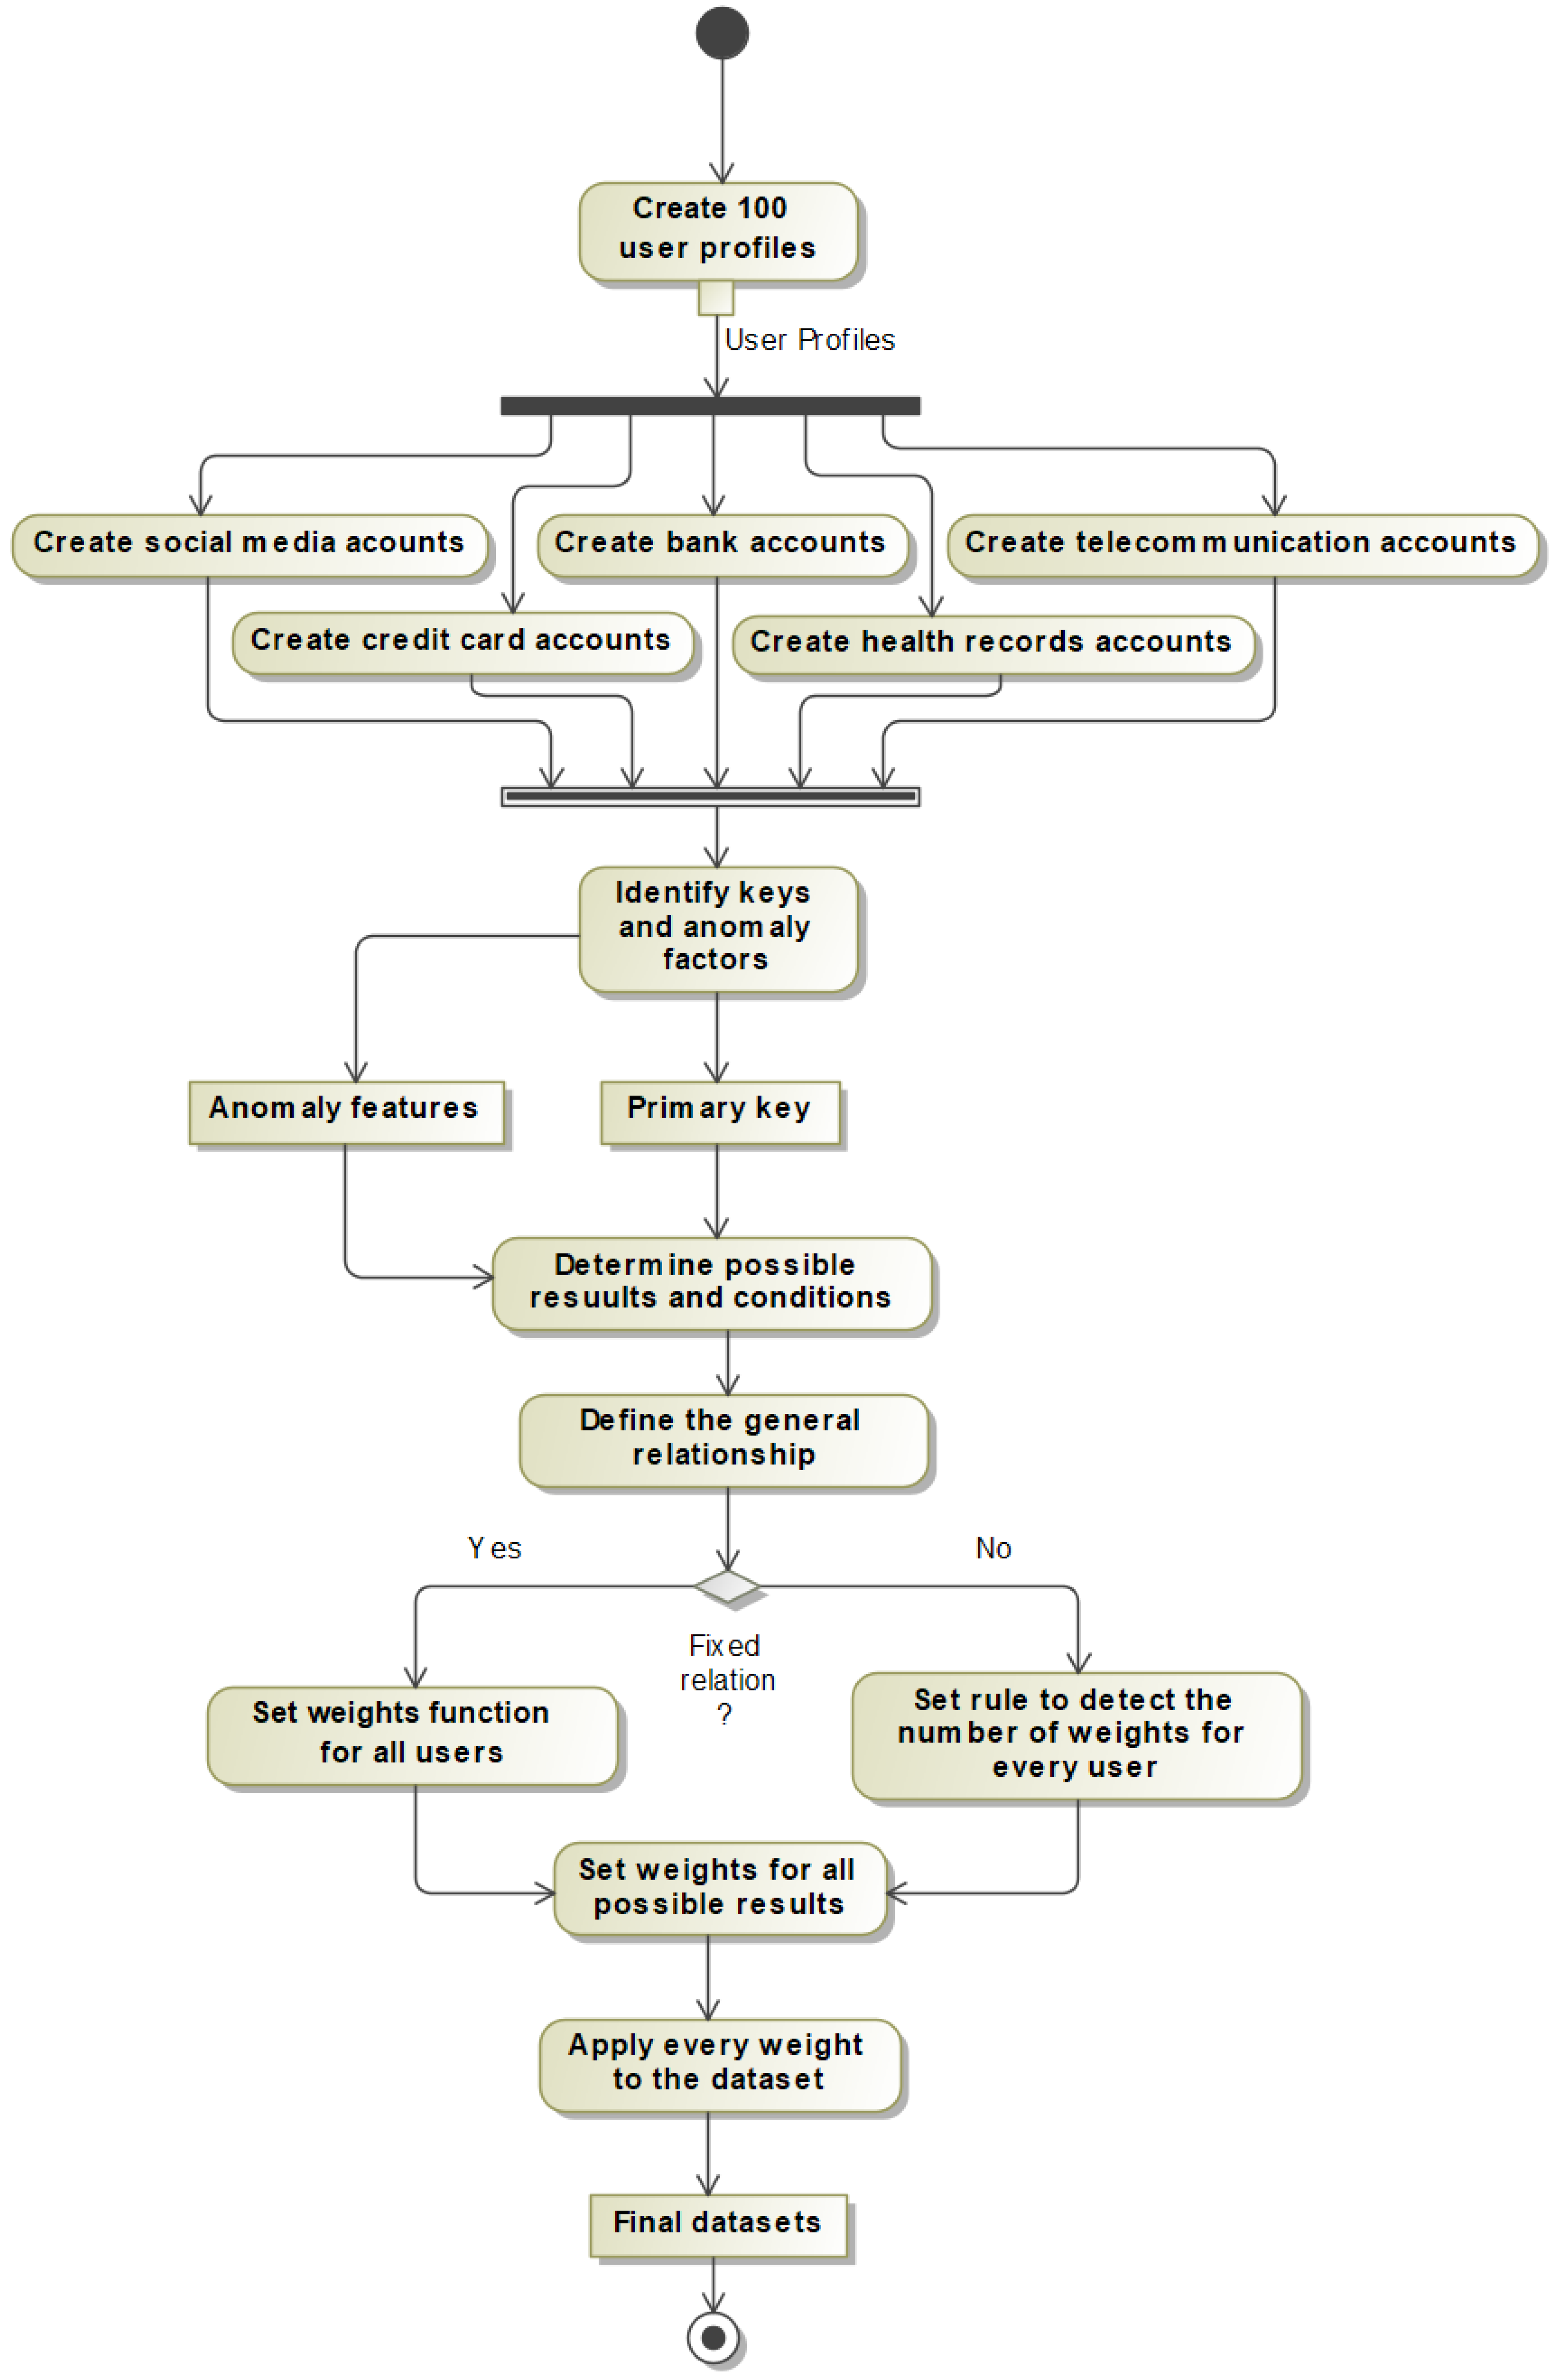
  • The ADG Engine generated a user dataset holding user general information. Initially it has 100 records that can be increased if needed.
  • The ADG Engine generated the above dataset for five common data platforms: credit cards, bank accounts, telecommunications, health records, and social media.
  • Each data platform has attributes that are related to user information or to user behaviors. The ADG Engine classified both types of attributes and used different analyses.
  • The ADG Engine imported user information from the user dataset and iterated over all users in each data platform.
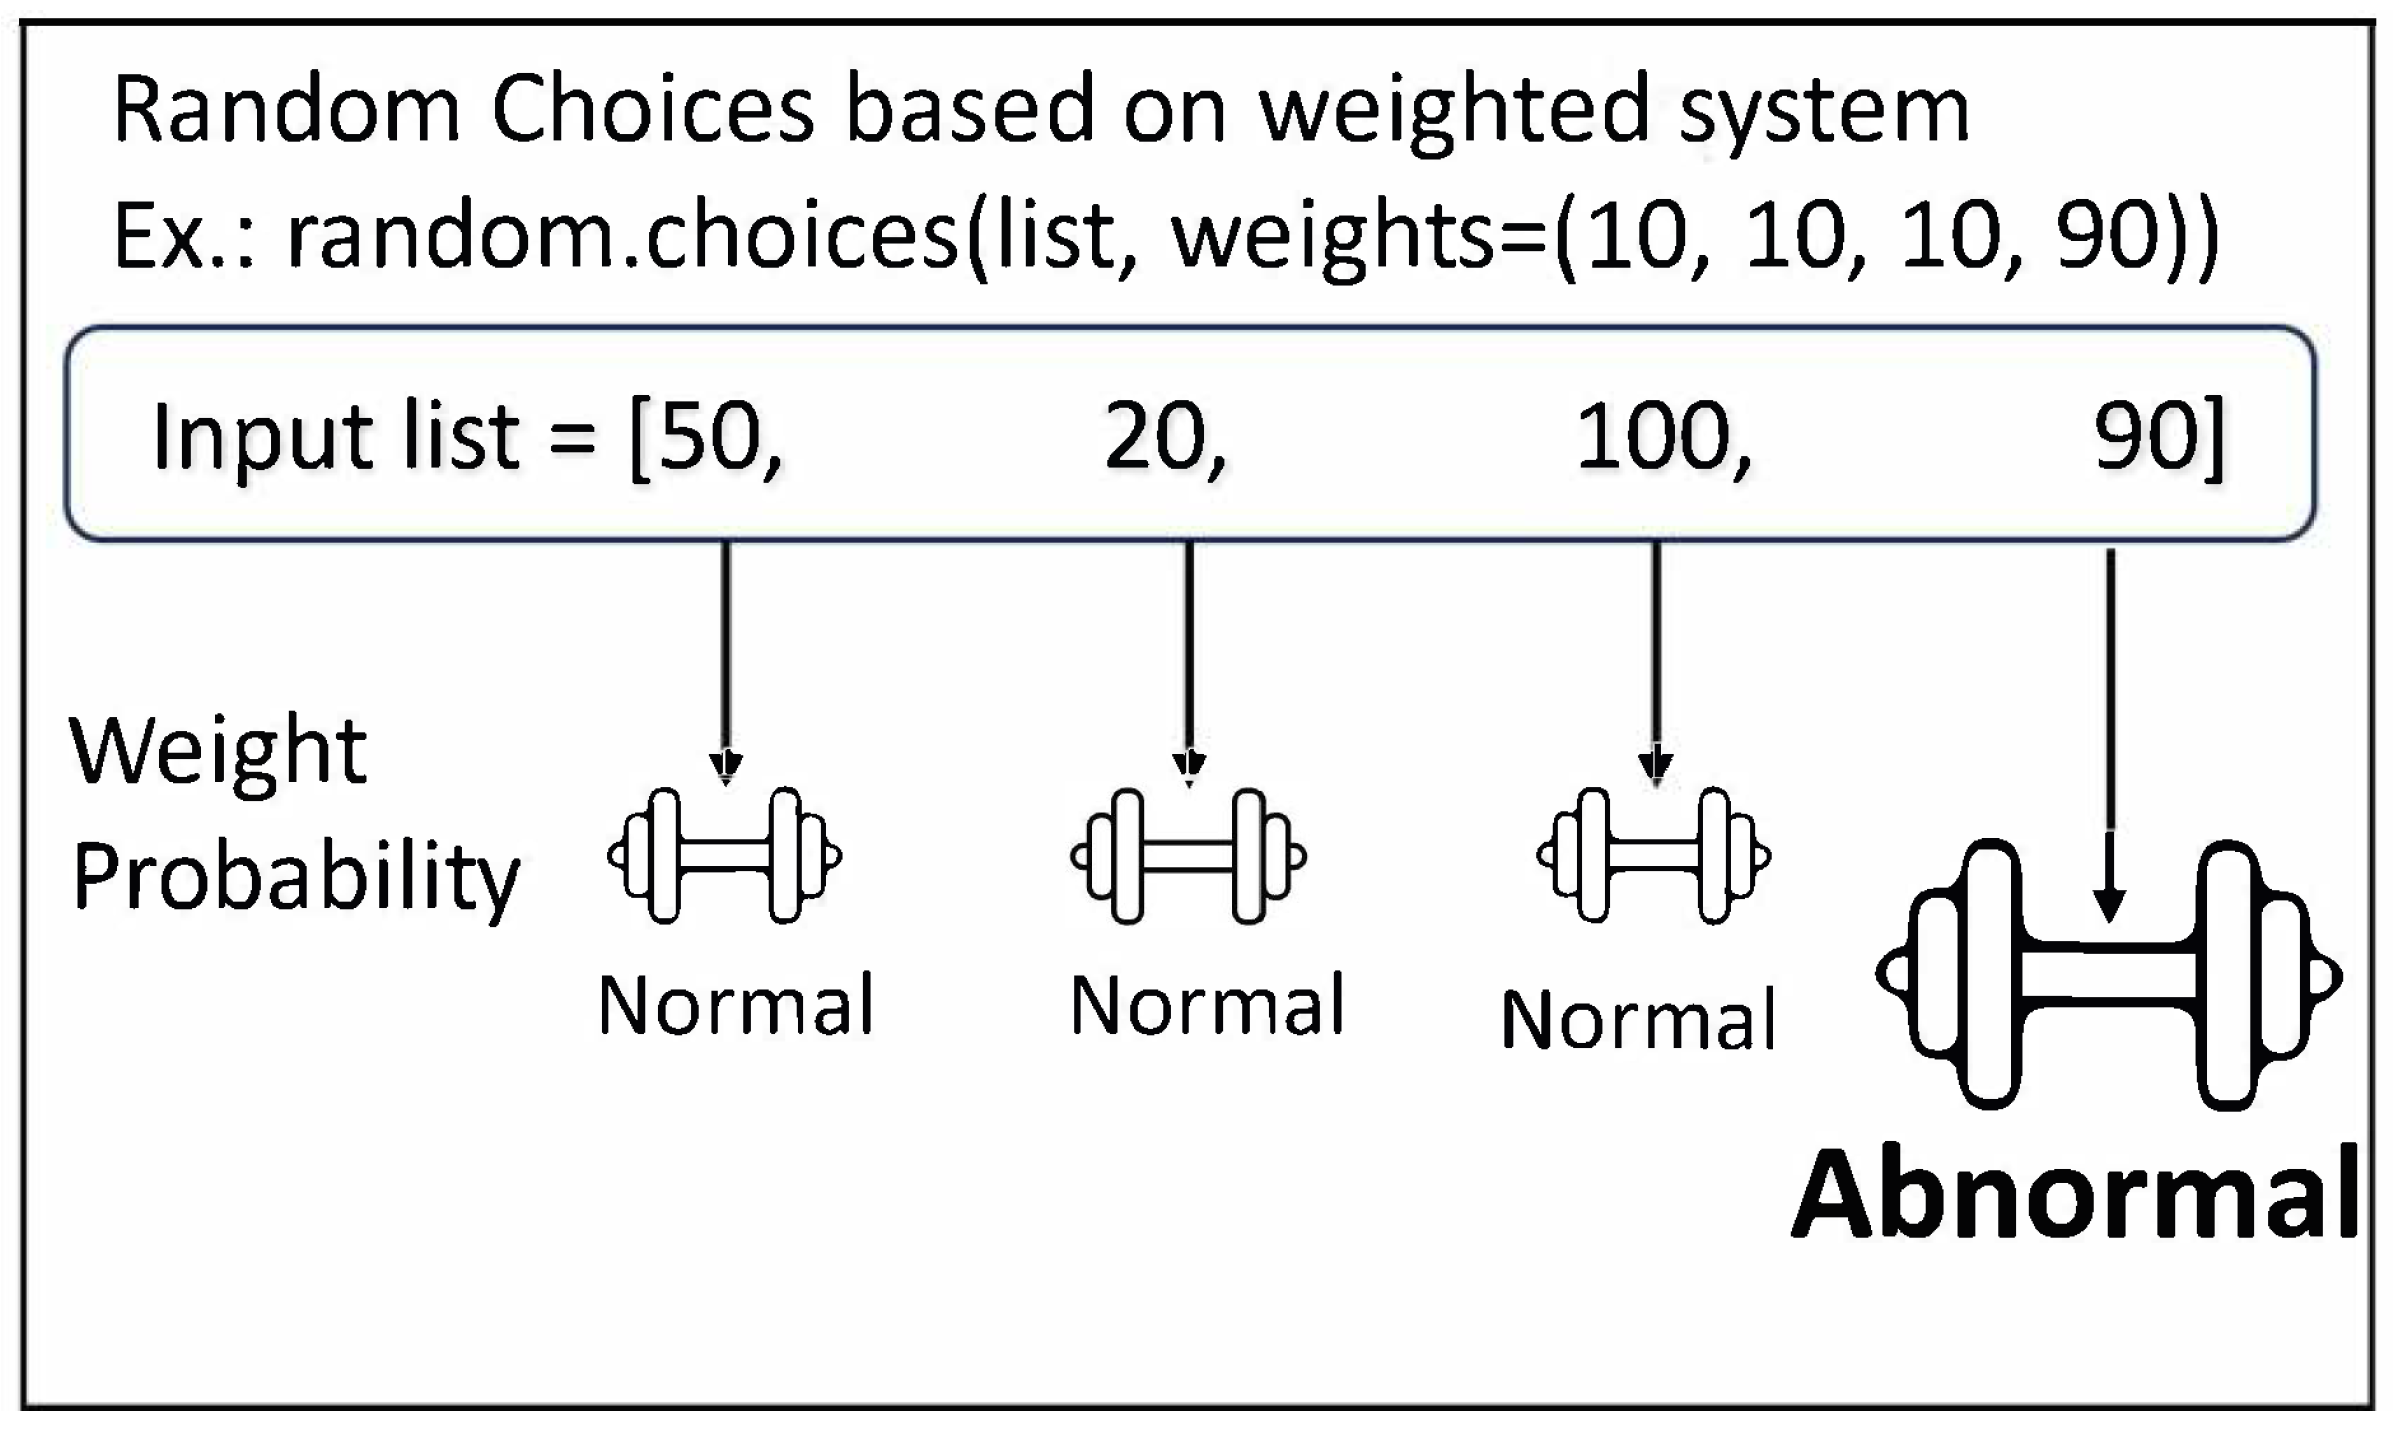
  • The ADG Engine set up a generation ratio system that can provide the normal/ abnormal ratio for user behavior attributes using weight systems that assign weights to each attribute option.
  • Based on the user general information dataset, the ADG Engine generated five data platforms with different sizes. The dataset size for each platform is chosen at random from 500,000 to 1 million, and it can be made bigger if needed.
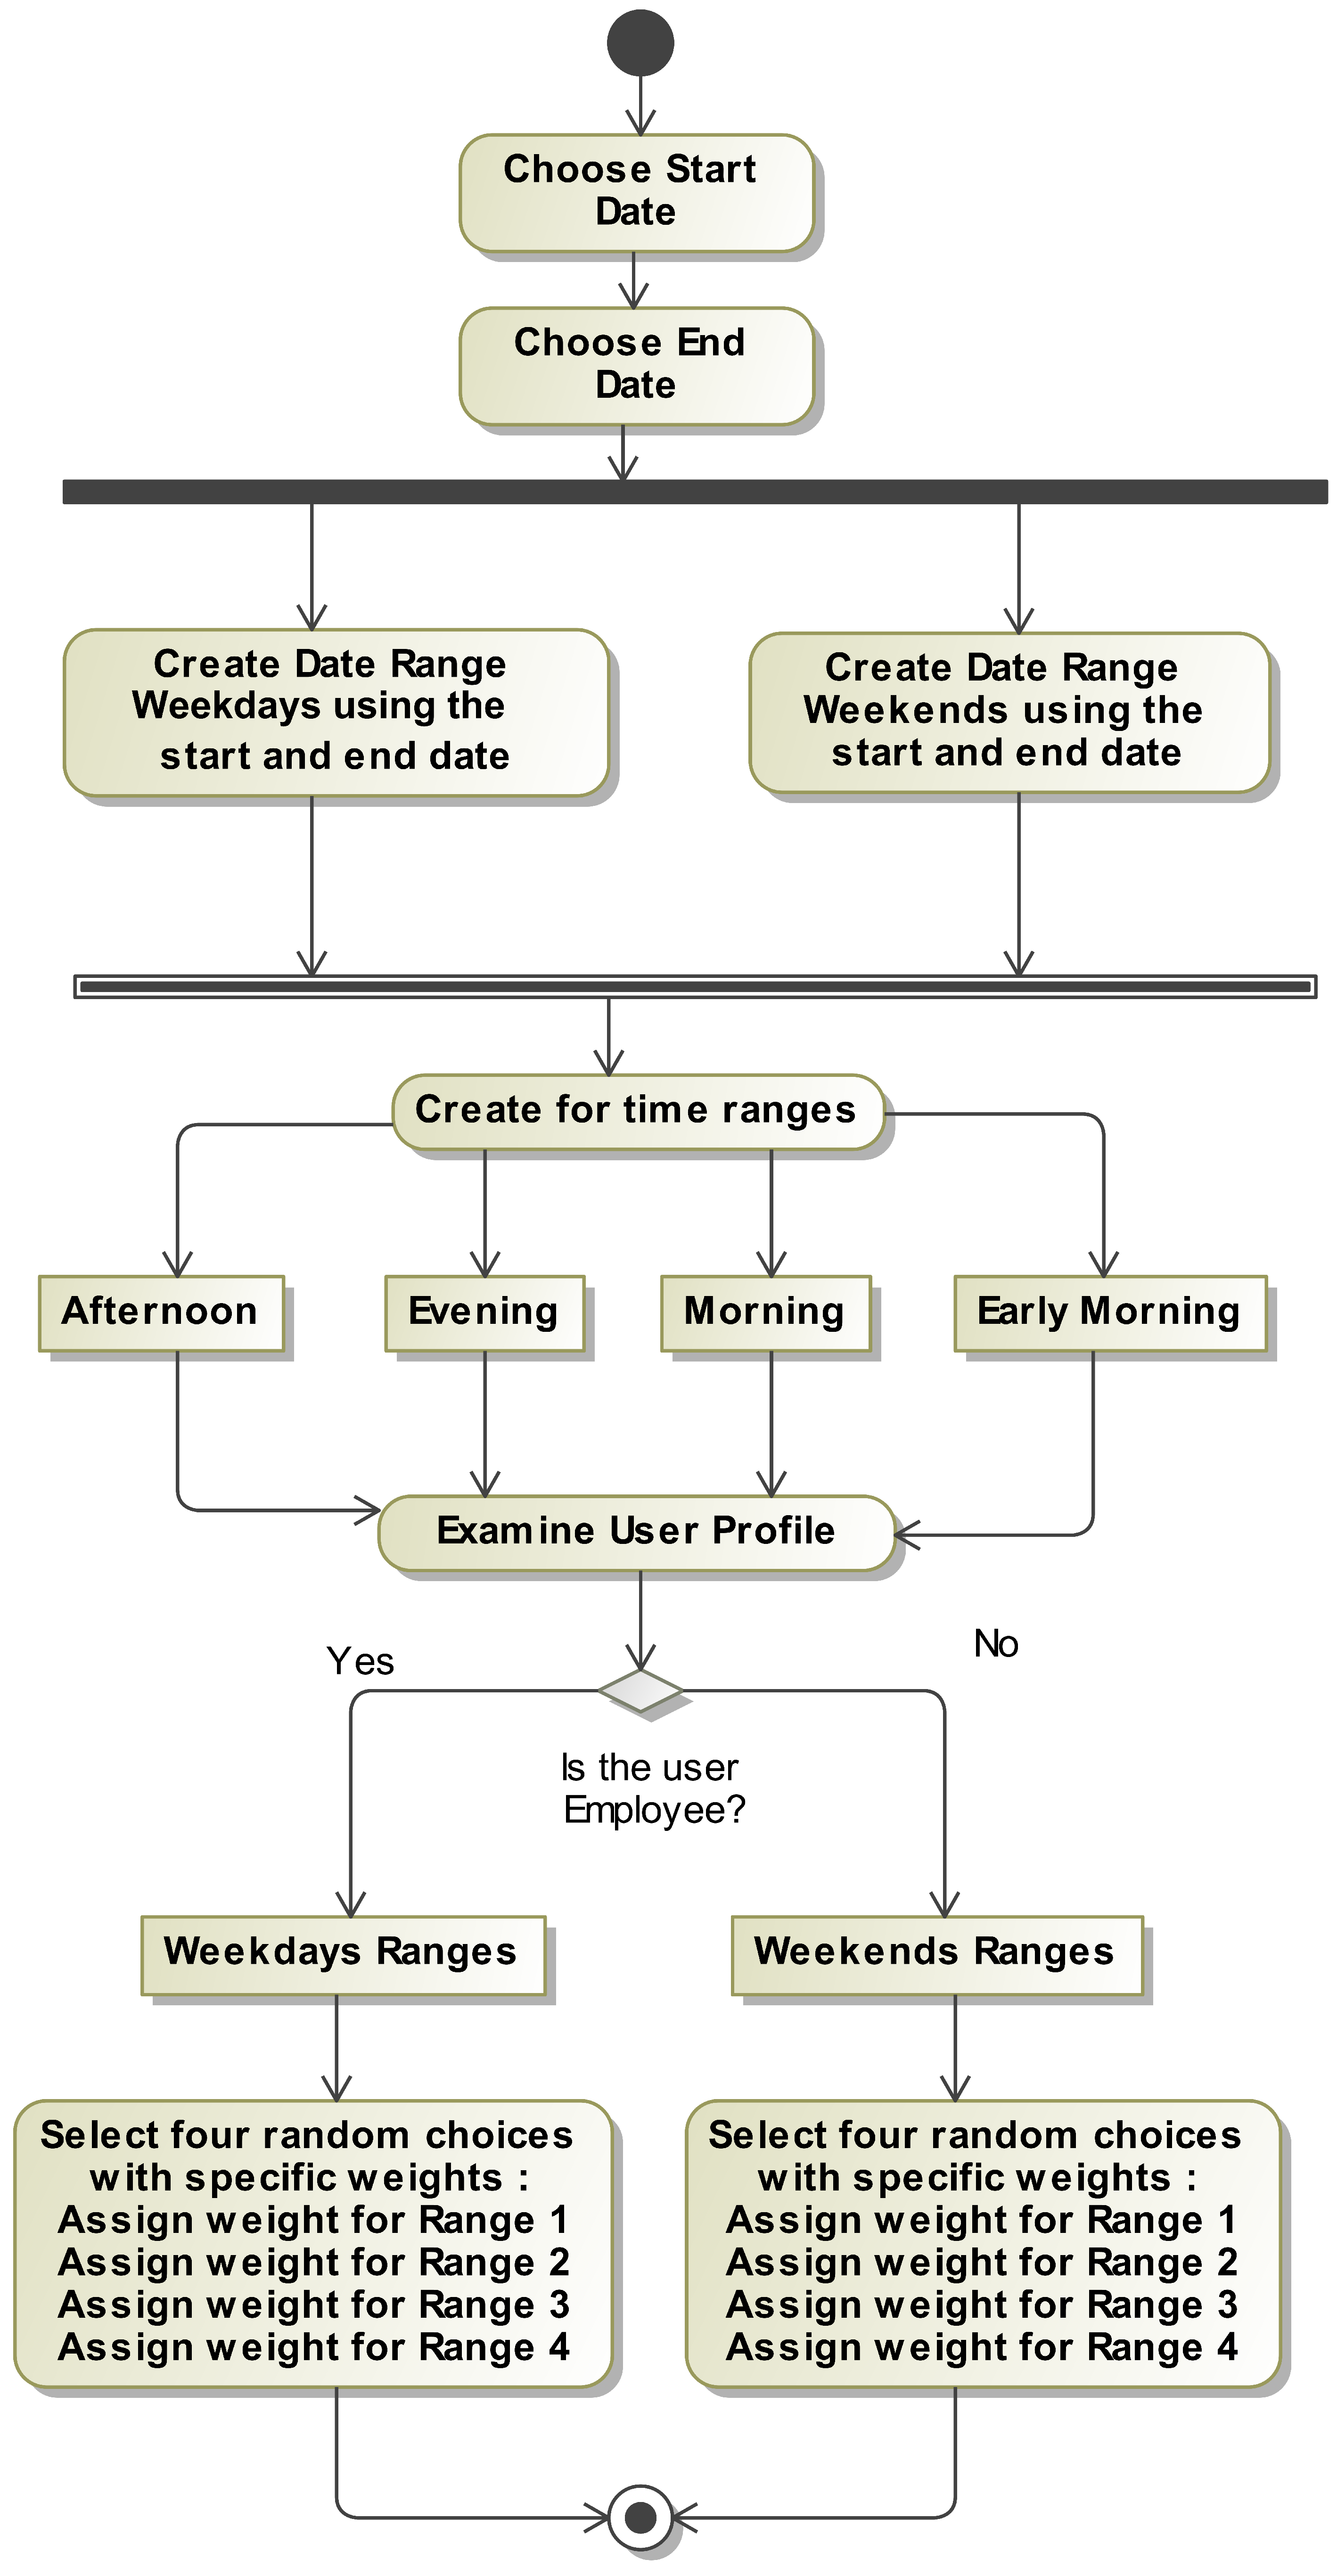
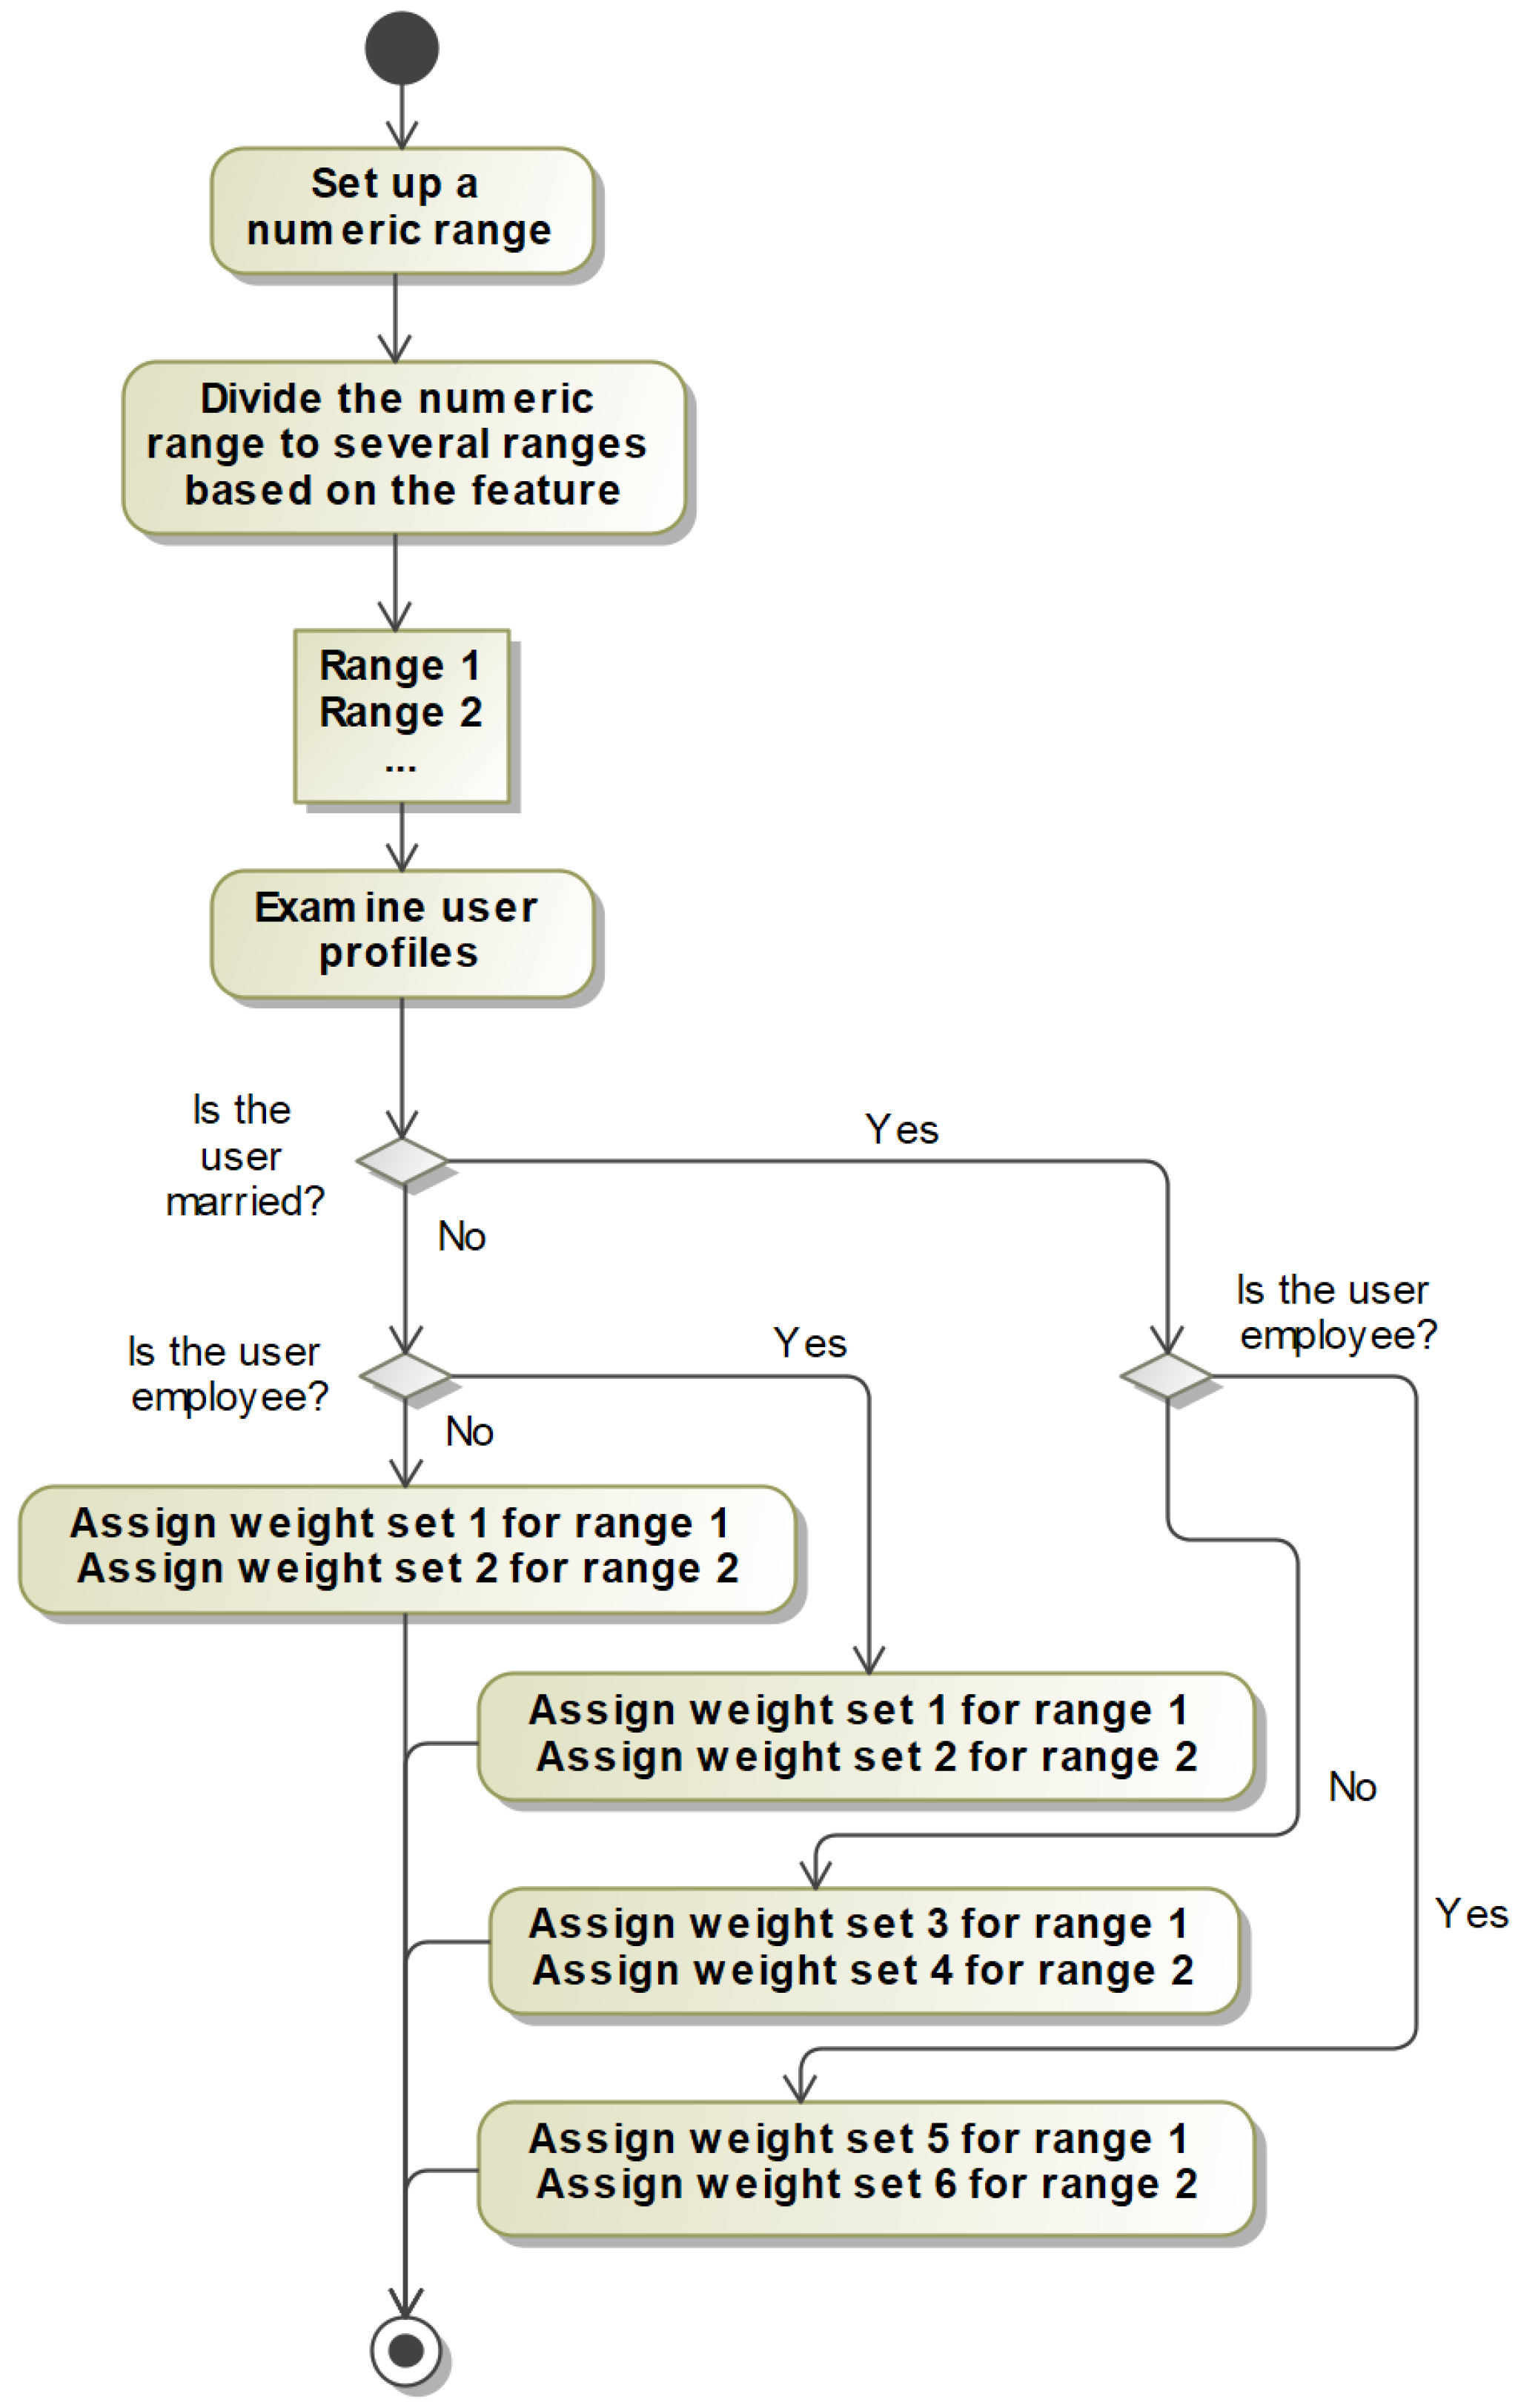
  • The ADG Engine created two algorithms: the Time-Based Anomaly Generation Process and the Numeric-Based Anomaly Generation Process. These algorithms divided time, dates, and amounts into normal and abnormal instances.
The rest of the paper is structured as follows: Section 2 centers around the most pertinent research in the field of dataset generation; Section 3 describes the method we use to generate data. Section 4 and Section 5 explore the details and configuration of the model; and, in Section 6, we test our model and discuss the results.

2. Related Work

There are several papers that use data generation engines or data expansion. In [2], Patki et al. introduced the Synthetic Data Vault (SDV), a system designed to generate synthetic data for relational databases. Their research focuses on developing generative models that can sample from the model to create synthetic data. The SDV algorithm computes statistics by considering the relationships between different database tables. It utilizes a state-of-the-art multivariate modeling technique to capture the underlying patterns in the data. By iterating through all possible relations, the SDV builds a comprehensive model of the entire database. Once the model is established, the SDV can synthesize data by sampling from any section of the database using the available relational information. This paper accomplishes most of the requirements needed to match the ADG Engine. However, there are still two differences between this paper and the ADG Engine, which are the need for an initial data distribution and anomaly features. The ADG Engine creates the data from scratch and has anomaly features included at user-specified ratios.
Another research study, presented by E. Lopez-Rojas and S. Axelsson [3], is a BankSim model. BankSim is a software simulation tool that replicates bank payment transactions using combined and summarized data obtained from a bank in Spain. The primary goal of BankSim is to create artificial data that can be effectively employed in studies related to detecting fraudulent activities. To develop and fine-tune the simulation model, statistical analysis and social network analysis (SNA) methods were applied to examine the connections between merchants and customers. The ultimate aim is for BankSim to accurately simulate different scenarios, encompassing both normal payment transactions and pre-defined fraudulent patterns. This work was designed for fraud detection, which is a bit closer to the ADG Engine. There are several differences between the ADG Engine and this model. In terms of data size, this study is limited because it has a fixed amount of observations. The study is not flexible enough to add or remove features based on user design. The research only uses one dataset for all users, which is incompatible with rational datasets. The paper only covers one application, which is the credit card application.
Zhao et al. [4] developed a Data Generation Algorithm that utilizes complex event processing (CEP) techniques. CEP involves processing real-time data streams and extracting valuable information from events as they occur. The primary objective of complex event processing is to identify significant data patterns in real-time scenarios and promptly respond to them. The authors introduce the concepts of selective event flow, sequential event flow, and causal event flow. Experimental findings demonstrate the effectiveness of this method. This paper has two differences compared to the ADG Engine: anomaly features are not included in this paper, and a variety of applications such as social media and credit cards are not provided either.
Research paper [5] represents a model of uncertain data and corresponding uncertain data generation algorithms with different types of uncertain data. The analysis and experiments show that the algorithm proposed in their work has practicality as a tool. In contrast to our ADG Engine, research [5] only shares one feature, which is unlimited data generation quantity, but it does not incorporate any other features present in our Engine.
In their study, Kim et al. [6] utilize a large-scale location-based social network (LBSN) simulation to establish a framework for simulating human behavior and generating synthetic, yet realistic, LBSN data based on typical human activity patterns. These data encompass not only the geographical locations of users over time but also their interactions within social networks. To simulate patterns of life, the researchers assign agents (representing individuals) a range of "needs" that they strive to fulfill. For instance, agents return home when they are tired, visit restaurants when they are hungry, go to work to meet their financial obligations, and visit recreational sites to socialize with friends and satisfy their social needs. This paper does not apply anomaly features and it doesn’t provide rational datasets. Initial data is required to the data generation process and it is limited to one application domain.
In their research article [7], the authors introduce a synthetic dataset generator specifically designed for tabular data. This generator has the ability to identify and utilize nonlinear causal relationships among variables during the data generation process. Traditional approaches for discovering nonlinear causalities are often inefficient. To enhance efficiency, the authors limit the causal discovery process to features that appear in frequent patterns obtained through a pattern mining algorithm. To validate their approach, the authors develop a framework for generating synthetic datasets with known causal relationships. Extensive experiments conducted on various synthetic and real datasets with known causalities demonstrate the effectiveness of the proposed method. In this research, they have only two features that match the ADG Engine. The remaining features that are related to abnormal observations or user behavior are not included.
A. Kothare et al. [8] used an open-source engine named Faker (v5.6.1) and Gaussian copula to create a platform that can generate datasets, based on user requirements as well as available resources. The user can also perform a variety of machine learning algorithms and differentiate their performance over either the generated dataset or a predefined dataset. This research uses a good tool to generate unlimited data observations with features that can be added or deleted, as no initial data are required. However, the real data aspects for abnormal user behavior are not included, which makes this research and the ADG Engine differ in five features.
In ref. [9], the authors introduce the notion of a shadow database and present a framework for creating a shadow database that closely aligns with the distribution characteristics of a production database. Additionally, they develop and implement an integrated tool for generating synthetic data. This tool utilizes the data distribution profile, including histograms derived from the source data, as input to generate the corresponding shadow database. This research has several features, such as data size and related datasets, but does not include the abnormal data design based on user behavior for several applications.
In ref. [10], the researchers conducted a study to explore the effectiveness of different synthetic data generation algorithms on various datasets. They examined the impact of SMOTE, Borderline-SMOTE, and random data generation algorithms on 33 datasets. To achieve a comprehensive evaluation, each dataset was fully balanced through synthetic data generation. The datasets were then categorized into three groups based on their balance status: balanced, partially balanced–unbalanced, and unbalanced, according to the unbalanced ratio. This research is more of a study of dataset generators, but the datasets are only applied to dataset size and real data aspects instead of abnormal features for datasets that are based on user behavior.
In their publication [11], the authors introduced a generative adversarial network (GAN) combined with differential privacy mechanisms to generate a smart healthcare dataset that is both realistic and private. The proposed approach has the ability to generate synthetic data samples that closely resemble real data, while also ensuring privacy through differential privacy techniques. The approach accommodates different scenarios, such as learning from a noisy distribution or adding noise to the learned distribution. The research team validated and assessed the effectiveness of the proposed approach using a real-world Fitbit dataset. This research has real data aspects and a rational dataset structure with unlimited datasets. However, the other abnormal user aspects with several applications are not available in this research.
The article [12] introduces an original framework designed to create synthetic data. The framework reorganizes the data generation procedure into asynchronous stages, with the goal of enhancing autonomy through two distinct methods. Firstly, programmers are empowered to craft parameterized scripts, allowing for the independent generation of a wide array of datasets. Secondly, the integration of a user interface permits domain experts to exert influence over the generation process autonomously, eliminating the need for programmer intervention. This paper has several features that the ADG Engine has but it is also missing feature flexibility, a rational database, no initial data required, and number of applications.
In the study outlined in reference [13], the researchers introduce an approach that employs an intrusion detection system (IDS) dataset for the purpose of producing synthetic tabular data representations from the original raw dataset. This approach also tackles the problem of class imbalance during the data generation process. The method involves a feature selection procedure that identifies crucial attributes contributing to precise data generation. Additionally, the study showcases similar performance results in comparison to well-known machine learning (ML) methods when applied to the task of anomaly detection. This study uses an approach to generate unlimited data observations with feature selection that can be added or deleted with real data aspects. However, rational datasets, no initial data required, and a number of applications are not included, which makes this research and the ADG Engine differ in three features.
As described in research paper [14], the authors introduce a framework for simulating and generating attacks. This framework enables the training of the attack generator using either simulated or authentic attacks in the context of vehicular ad hoc networks (VANETs). The paper outlines the framework’s structure and elucidates the configuration of a compliant attack simulator. This simulator is designed to produce valid CAM and DENM messages adhering to the standardized specifications established by the European Telecommunications Standards Institute (ETSI) within the Cooperative Intelligent Transport Systems (C-ITS) standards. This paper does not apply the following features: feature number flexibility; rational datasets that include several datasets related to each other; initial data are required to generate this data in this paper; and these data are focused on only one application.
In the tutorial provided by Sanghi and Haritsa [15], a comprehensive exploration of synthetic data generation is offered. The tutorial extensively discusses various classes of frameworks, elucidating both their advantages and constraints. Towards the conclusion, a collection of unresolved technical challenges and potential avenues for future research are outlined. In this research, they have only two features that match the ADG Engine: unlimited data generation and real data aspects.
The study conducted in reference [16] delves into the examination of conditional tabular generative adversarial networks (CTGANs) for the purpose of generating data. Specifically, the authors employ these networks to synthesize mobile sensor data that encompass both continuous and discrete attributes—an endeavor that previous cutting-edge methods had not yet tackled. The authors demonstrate that the HAR-CTGANs, in particular, yield more realistic data, leading to improved performance in downstream human activity recognition (HAR) models. Moreover, when incorporating the characteristics of HAR-CTGANs into existing state-of-the-art models, the downstream performance is also enhanced. In this research, they have these features that match the ADG Engine: unlimited data generation, feature flexibility number, user behavior, and real data aspects. The other features are missing, such as several applications, no initial data required, and rational datasets.
In article [17], the author undertook a comprehensive comparison of various Python data generation models and reached several significant conclusions. Firstly, for the task of expanding data from a limited dataset, the DataSynthesizer model emerged as the most effective tool. In scenarios requiring the generation of contact or date information, the Pydbgen and Mimesis models were deemed suitable choices. Similarly, when the objective was to generate relational data, the Synthetic Data Vault (SDV) model demonstrated remarkable suitability. For situations necessitating the creation of data from scratch with a defined data structure, Plaitpy was identified as the preferred model. When dealing with time series data generation, both the TimeSeriesGenerator and SDV models were found to be highly effective. In the realm of AI data generation, Gretel Synthetics and Scikit-learn were identified as the two most commonly used models. For tasks involving agent-based modeling to generate data for complex scenarios, Mesa emerged as the most suitable model. Finally, in the domain of image data generation, Zpy was determined to be the optimal choice.
Among the various approaches employed by synthetic data generation tools, one method involves describing the original dataset through a Bayesian network. This approach, utilized in the open-source tool DataSynthesizer, has shown effectiveness, especially for datasets containing a limited to moderate number of attributes. In study [18], the authors replaced the conventional greedy algorithm, typically used for learning the Bayesian network, with a significantly faster genetic algorithm. Additionally, the aim is to safeguard highly sensitive attributes by minimizing specific correlations within the synthetic data that could potentially expose personal information.
In study [19], the authors employed three Python-accessible synthetic data generation packages: the Synthetic Data Vault, DataSynthesizer, and Smartnoise-synth. Various data generation models within these packages were showcased using 13 tabular datasets as sample inputs for generating synthetic data. The authors proceeded to generate synthetic data from each dataset and generator combination, assessing the effectiveness of the generators through analysis of five hypothetical scenarios.
Table 1 shows a comparison of the differences between the ADG Engine and the existing data generation models. The first column is about generating a chosen number of observations in which you can enter any number you want. The second column is the flexibility of choosing a feature that is related to the research or generating more columns. The anomaly features column indicates that the data have injected some anomalous features or observations. The rational datasets feature is differentiated in whether the model is capable of generating multiple datasets related to one user or not. The real data aspect is a column that focuses on making conditions and relations between several features simulate real-world data. User behavior is studying the model that generates all the observations based on the users and has several scenarios to describe the user behavior (such as working scenario, holiday scenario, and weekend scenario). Some models require initial data observations or an initial data distribution to generate more data that are not generated from scratch or at least using libraries. The last column is classifying research papers based on the use of multiple data applications, such as credit card applications, telecommunication applications, and health care applications.

3. ADG Engine Methodology

To implement the ADG Engine, we created algorithms that generate events for each of the data platforms: credit card transaction data, bank account data, health record data, telecommunications data, and social media activity data. Instead of generating data for each one individually, isolated from the other platforms, the ADG Engine reuses the same users from one platform to another to accurately match the spread of real-life users across multiple services. From another perspective, the ADG Engine creates 100 different users and generates data instances for each user on all five data platforms. The data platforms the ADG Engine is working with can be described by the following qualities: the number of features the Engine tracks, the number of keys in the data platform, and the number of anomaly features the Engine scans for. If there should be a need to introduce a sixth data platform, it will be entirely possible to describe that data platform using these same qualities. This relationship can be seen in the block diagram shown in Figure 1.
To make the distribution of anomalies more accurate to real-life trends, we must first know the expected distribution of values. It is only in relation to the expected value that an anomaly value can be genuinely anomalous. If this distribution is constant for everyone, we simply need to specify the distribution ourselves before running the ADG Engine. However, in cases where the expected outcomes vary from person to person, the ADG Engine must have a way to dynamically calculate the expected distribution based on the user data. Figure 2 shows the process of data generation from the perspective of factors common to all five data platforms. For the user we are working with, the ADG Engine begins by instantiating the platform profiles, one profile for each platform. Then, for each of these profiles, the ADG Engine generates enough primary keys to match the requirements specified by the platform. These primary keys will be the seeds that the ADG Engine will use to randomly generate the rest of the features. At the same time, the ADG Engine identifies which features of the data platform are designated as anomaly features. Anomaly features are the features of the data platform that can have discernibly anomalous data and, as such, the ADG Engine needs to determine what the expected distribution of data is. If the anomaly feature is static, the ADG Engine uses a manually defined expected distribution ahead of time. However, if the anomaly feature is dynamic, the ADG Engine generates a function that automatically calculates the expected distribution. Once the expected distribution has been determined for all anomaly features, the ADG Engine has everything necessary to create the final data platforms, which will be explained in detail in Section 4.

4. Data Synthesis

When generating a given feature, it is possible to specify a sequence of weights pertaining to the expected ratio of values. Between competing, mutually exclusive options, the weights describe what outcome we consider likely. For example, if a time-based feature were divided into four segments—morning, afternoon, evening, and night—then a set of four weights could describe which of those sections the event is most likely to happen in. If the event is far more likely to happen in the afternoon than anytime else, a weighting of {10, 90, 10, 10} could accurately describe the ordinary baseline.
This weighing system is configurable by the user and can be set according to whatever parameters or input data are provided to it. All that must be true is that the sequence of weights specified provides a meaningful ratio between the various categories. It is also possible to specify the ratios cumulatively rather than relatively. The sequence of relative weights {10, 90, 10, 10} can be equivalently described as {10, 100, 110, 120}. If no sequence is provided at all, the events are assumed to be of equal probability.

4.1. Choosing Features Relevant to Anomaly Detection (Anomaly Factors)

From the data platforms, the ADG Engine needs to figure out which features are going to be useful for the task of anomaly detection. This decision is made after considering various specific factors. For instance, the ADG Engine studies the data outcomes associated with the feature and looks at how many possible results it has and whether those results correlate with user behavior in some way. These possible results could be one option from a set of possibilities or a subsection of a numeric range. The ADG Engine checks if the feature has a normal routine and if it has some kind of ratio between normal and abnormal results. If it does, and if one of the possible results is more common than another, the ADG Engine can label the common result as ‘normal behavior’ and the uncommon result as ‘abnormal behavior’.
The user’s personal information can be highly relevant to this endeavor, as the user’s qualities can impact the distribution of data in their observations and what trends are more normal than others. An employed person is more likely to travel on weekdays and shop outside of work hours, while a married person might see significantly different spending habits than an unmarried person. For instance, an unmarried man is unlikely to buy family-sized orders or toys for children, so transactions such as that would become abnormal.

4.2. Time-Based Anomaly Generation

Every data platform needs a time feature, but in the ADG Engine, the time feature is also one of the main anomaly factors, as the timing of events is a common way for observations to prove unusual. To make use of this, the ADG Engine begins, as shown in Figure 3, by selecting the start and end dates of the data platform, generating timestamps within that range. The default precision of the timestamps is to the minute, but it can be set to the second or the hour as needed. The ADG Engine then splits up the timestamp range into two categories—weekday and weekend—and then again into four more: early morning, morning, afternoon, and evening. These divisions will allow us to correlate the time of events with a user’s other qualities, such as employment status. A person who is at work during weekdays will be more likely to do their shopping and spend over the weekend while relying more on transportation at specific times during weekdays.
Additionally, Time-Based Anomaly Generation is written as an algorithm for an example of a credit card dataset. Algorithm 1 shows the full steps to generate the normal and anomalous date and time.
Algorithm 1 Time-based anomaly generation process for credit card transaction dataset
INPUT: Row of Time Range
OUTPUT: Normal/Abnormal Observations
1 Begin
2     Choose randomly start and end dates that have an interval of three years at least.
3     Create time range and row data per one second from the start and end dates.
4     Divide the time range into range 1 (weekdays), and range 2 (weekends).
5     Divide range 1 into range 1 (Early Morning), range 2 (Morning),
       range 3 (Afternoon), and range 4 (Evening).
6     Divide range 2 into range 1 (Early Morning), range 2 (Morning),
       range 3 (Afternoon), and range 4 (Evening).
7     Assign 4 weights; each one has 4 values that have only 1 high weight, and the
       rest are low (weights1 = (10, 10, 10, 90), weights2 = (90, 10, 10, 10), weights3 = (10,
       90, 10, 10), weights4 = (10, 10, 90, 10))
8     For all users do
9          Randomly choose one of the weights for each user.
10           IF the user is an employee:
11                 Apply the user weight to the weekend range time to choose a time.
12           ELSE:
13                 Apply the user weight to the weekday range time to choose a time.
14     End for
15 End

4.3. Numeric-Based Anomaly Generation

Numeric features are used in many ADG Engine data platforms for a variety of different purposes, including the size of a transaction, a social media post number, visit count, appointment duration, or travel time. The process of generating data for a numeric feature starts by defining the upper and lower bounds of the feature’s range and then subdividing it into smaller ranges based on the nature of the numeric feature. As an example, if we look at the features denoting the employment and marital status of the user, we can create ranges of values subdivided from the main range of permitted values and then assign the ranges a different set of weights depending on whether the user is an employee or not and whether they are married or not. This process is shown in Figure 4 and is applicable broadly across our data platform. Generally speaking, it is possible to create weighted ranges of numeric values affected by any number of other features of the dataset, allowing great flexibility in numeric feature data generation.
Additionally, Numeric-Based Anomaly Generation is written as an algorithm for an example of a credit card dataset. Algorithm 2 shows the full steps to generate the normal and anomalous numbers.
Algorithm 2 Numeric-based anomaly generation process for a credit card transaction dataset
INPUT: Row of Numeric Range
OUTPUT: Normal/Abnormal Observations
1 Begin
2     Create numeric range and row data from the range.
3     Divide the numeric range into range 1 (small amount), and range 2 (large amount).
4       For all users do
5          IF the user is an employee and Single:
6               Assign weight as weights = (90, 50)
7          ELIF the user is not an employee and Single:
8               Assign weight as weights = (10, 30)
9          ELIF the user is an employee and Married:
10               Assign weight as weights = (100, 10)
11           ELSE:
12               Assign weight as weights = (50, 50)
13     Randomly choose a number from range 1 or range 2 based on weight set.
14     End for
15 End

4.4. Variable Weights and Fixed Weights

Each set of weights has a size determined by the nature of the weighted feature. For example, the time-based feature described earlier has four possible outcomes and thus four weights. However, it is possible for the number of possible outcomes to be dynamic, changing from user to user. One user may have three credit cards associated with them, while another user may have four credit cards. The programmer can specify reasonable limits on the possible number of cards, such as a minimum of two and a maximum of five, and with that, it becomes possible to create a set of weights for each of the possible outcomes. The ADG Engine will then ensure it generates a number of credit cards that fall within the predefined boundaries, using the appropriate set of weights to generate the desired data. The total weight is not 100 due to the nature of these weights being relative rather than representing percentages. The subsequent guideline establishes the weighted probability for the selection of each element. Figure 5 shows an example of the variable probability weight system.
Probability = element weight / sum of all weights

5. Experiment Setup

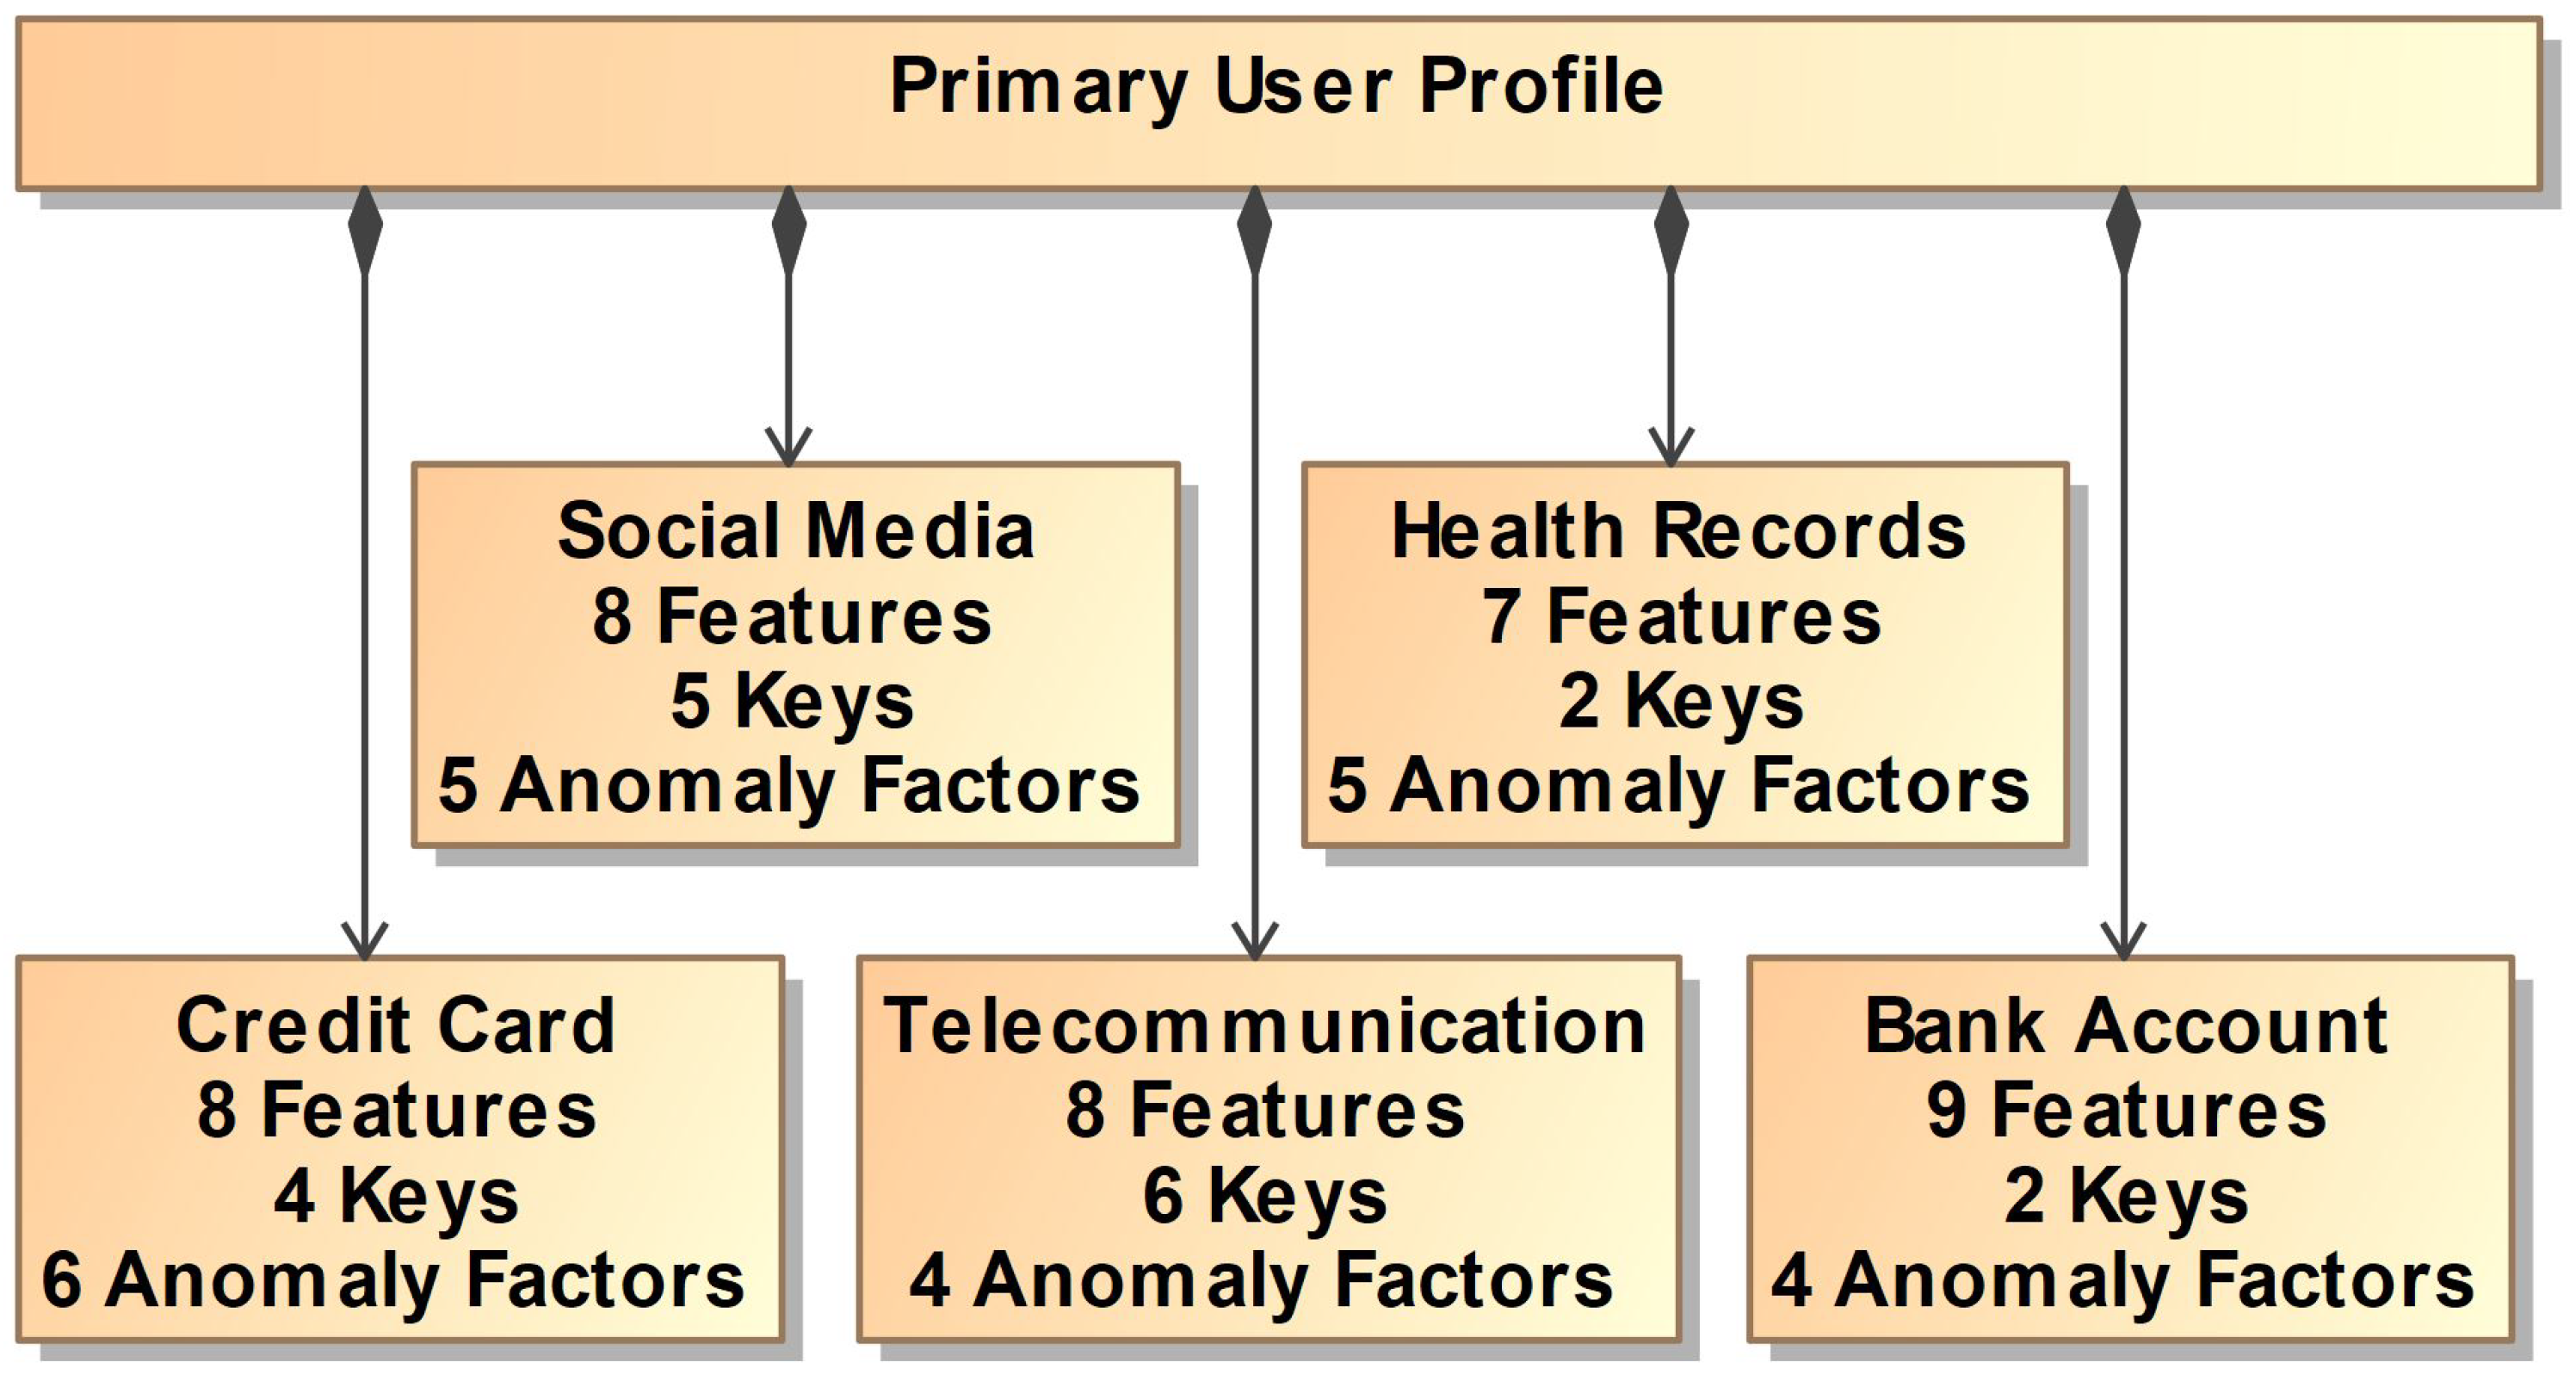
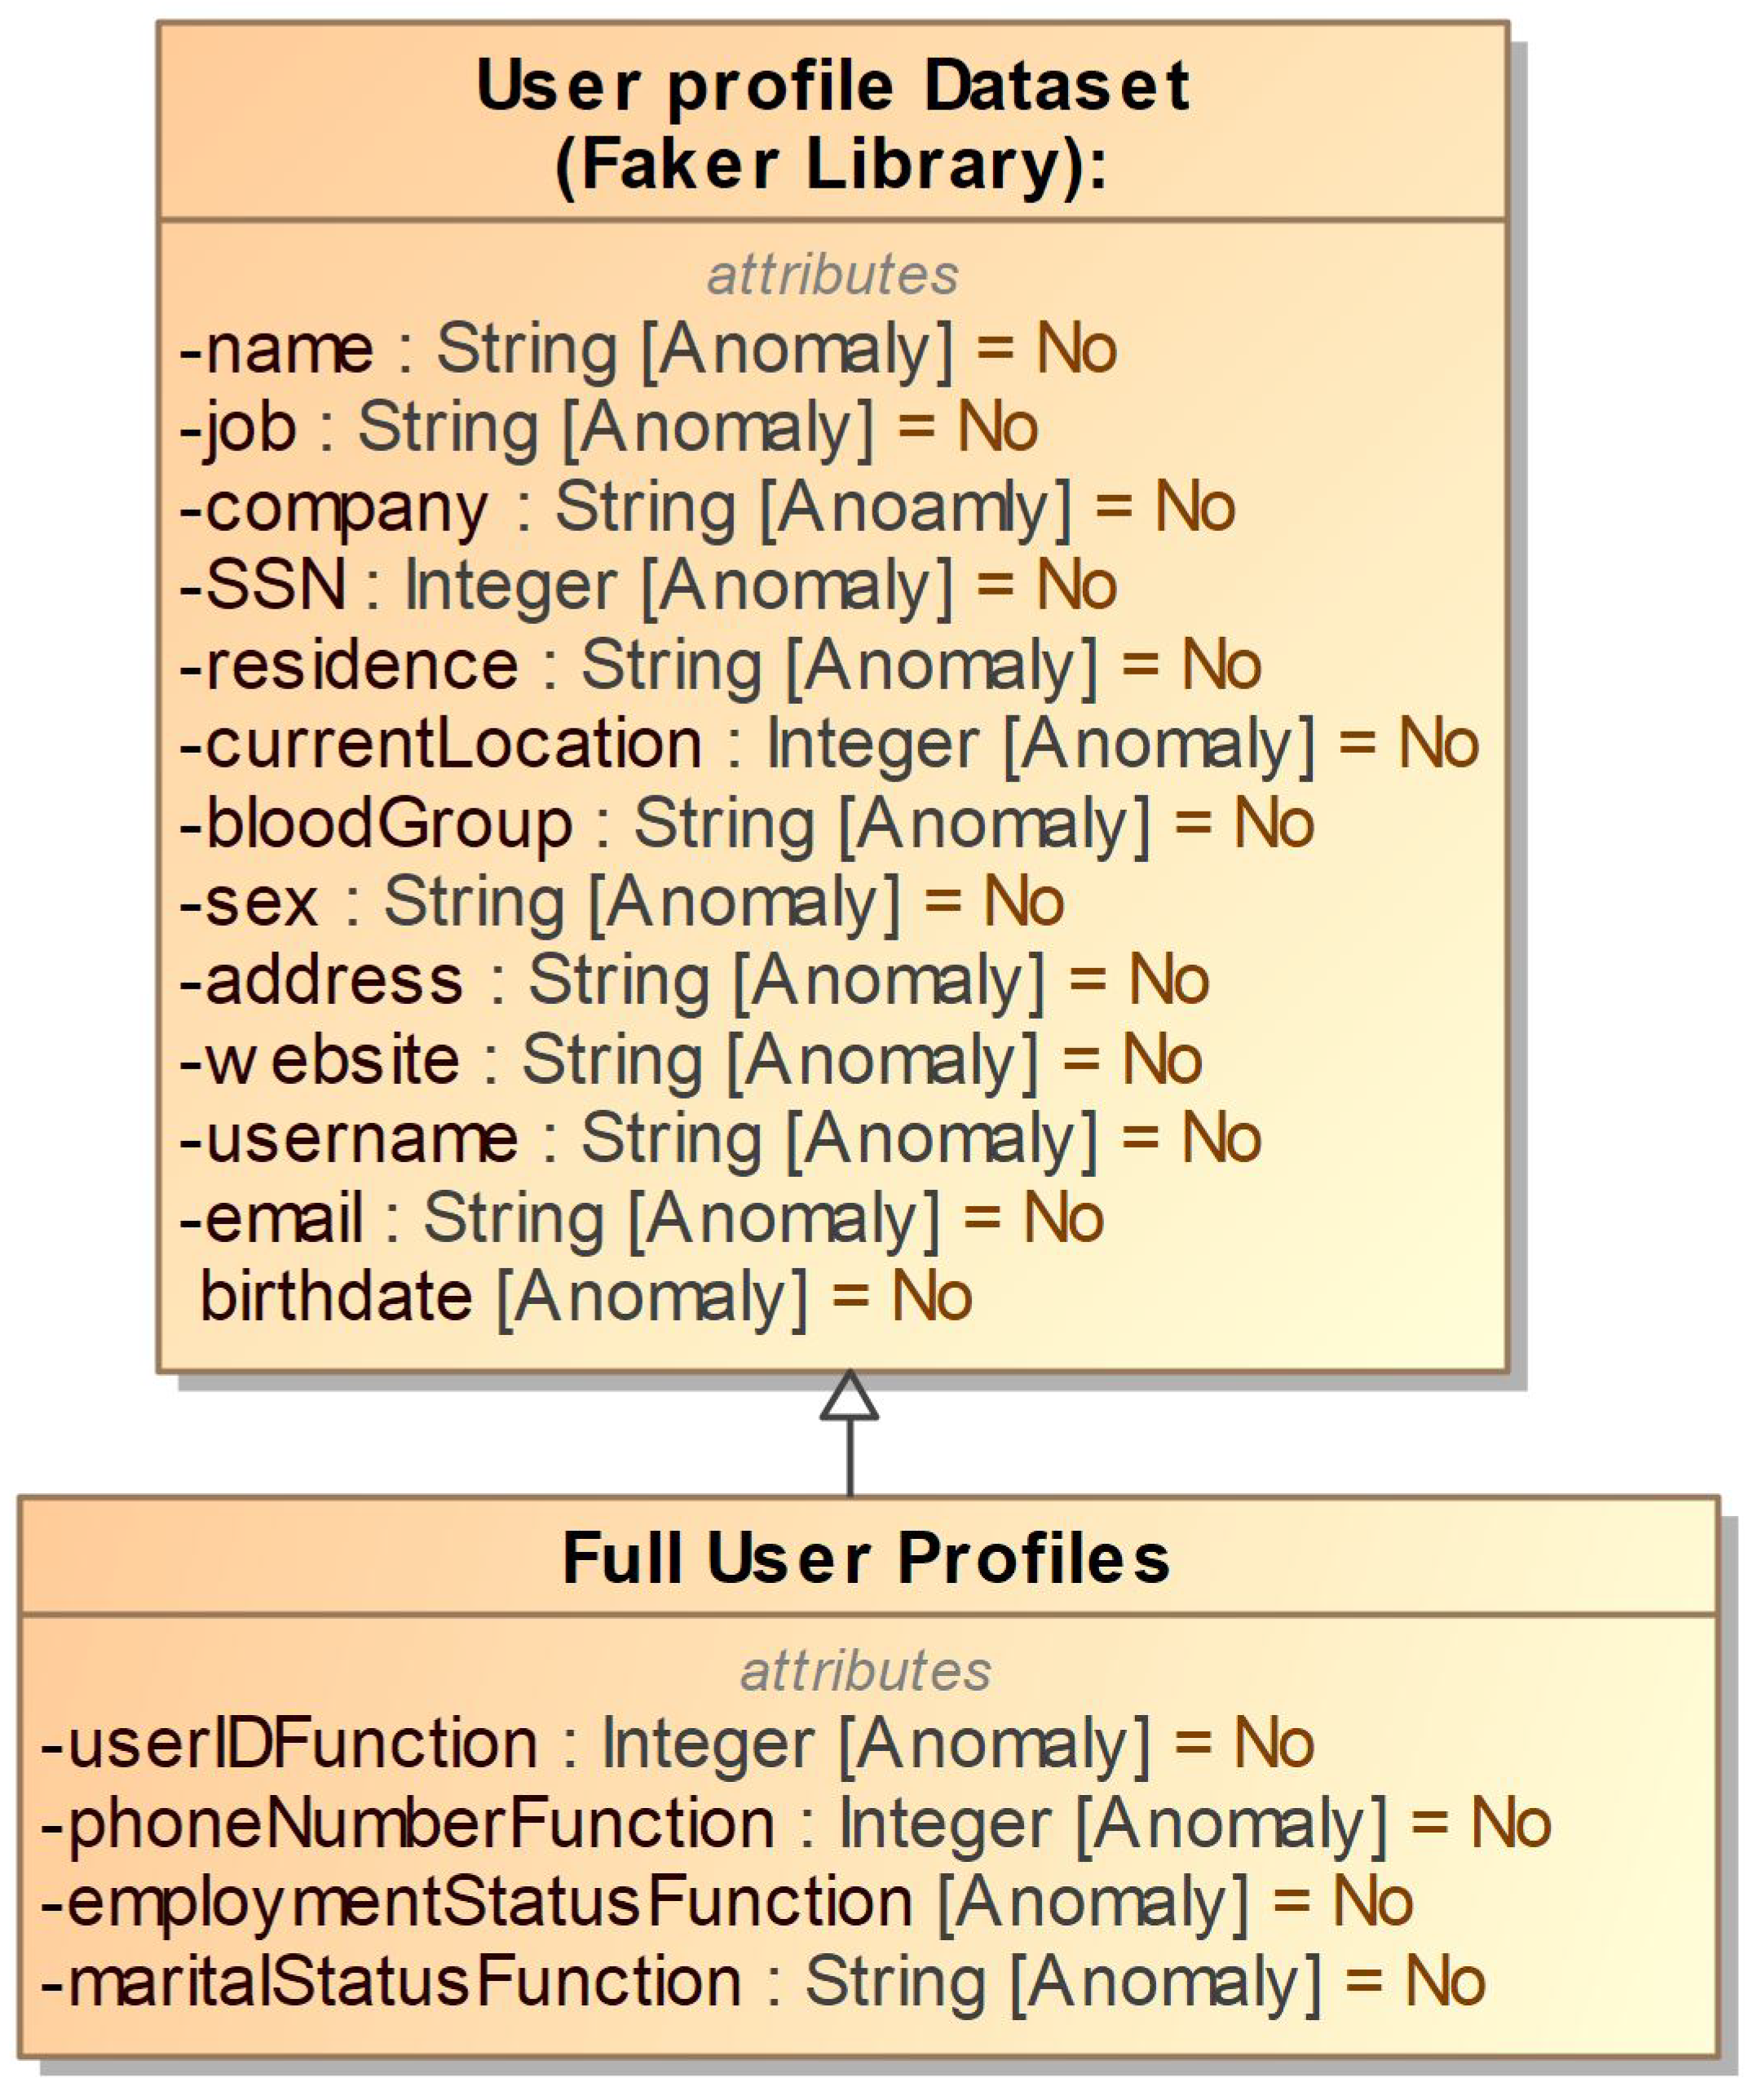
The primary data platform contains information about each user the ADG Engine tracks. Each row of the data platform represents an individual user. It includes the following features: Name, User ID Function, Phone Number Function, Marital Status Function, Employment Status Function, Job, Company, Social Security Number (SSN), Residence, Current Location, Blood Type, Website, Username, Sex, Address, Email, and Birth Date. Details for this data platform are shown in Figure 6.
This data platform holds information that is common to all other data platforms in the ADG Engine. For all other tasks in the Engine, it is possible to refer to the qualities of the users listed here. Features like age or marital status will be quite valuable for generating accurate information about this user. There are no anomaly features in this data platform, as there are no user actions listed here, but instead, this data platform includes the information necessary to calibrate the anomaly features of the other data platforms.
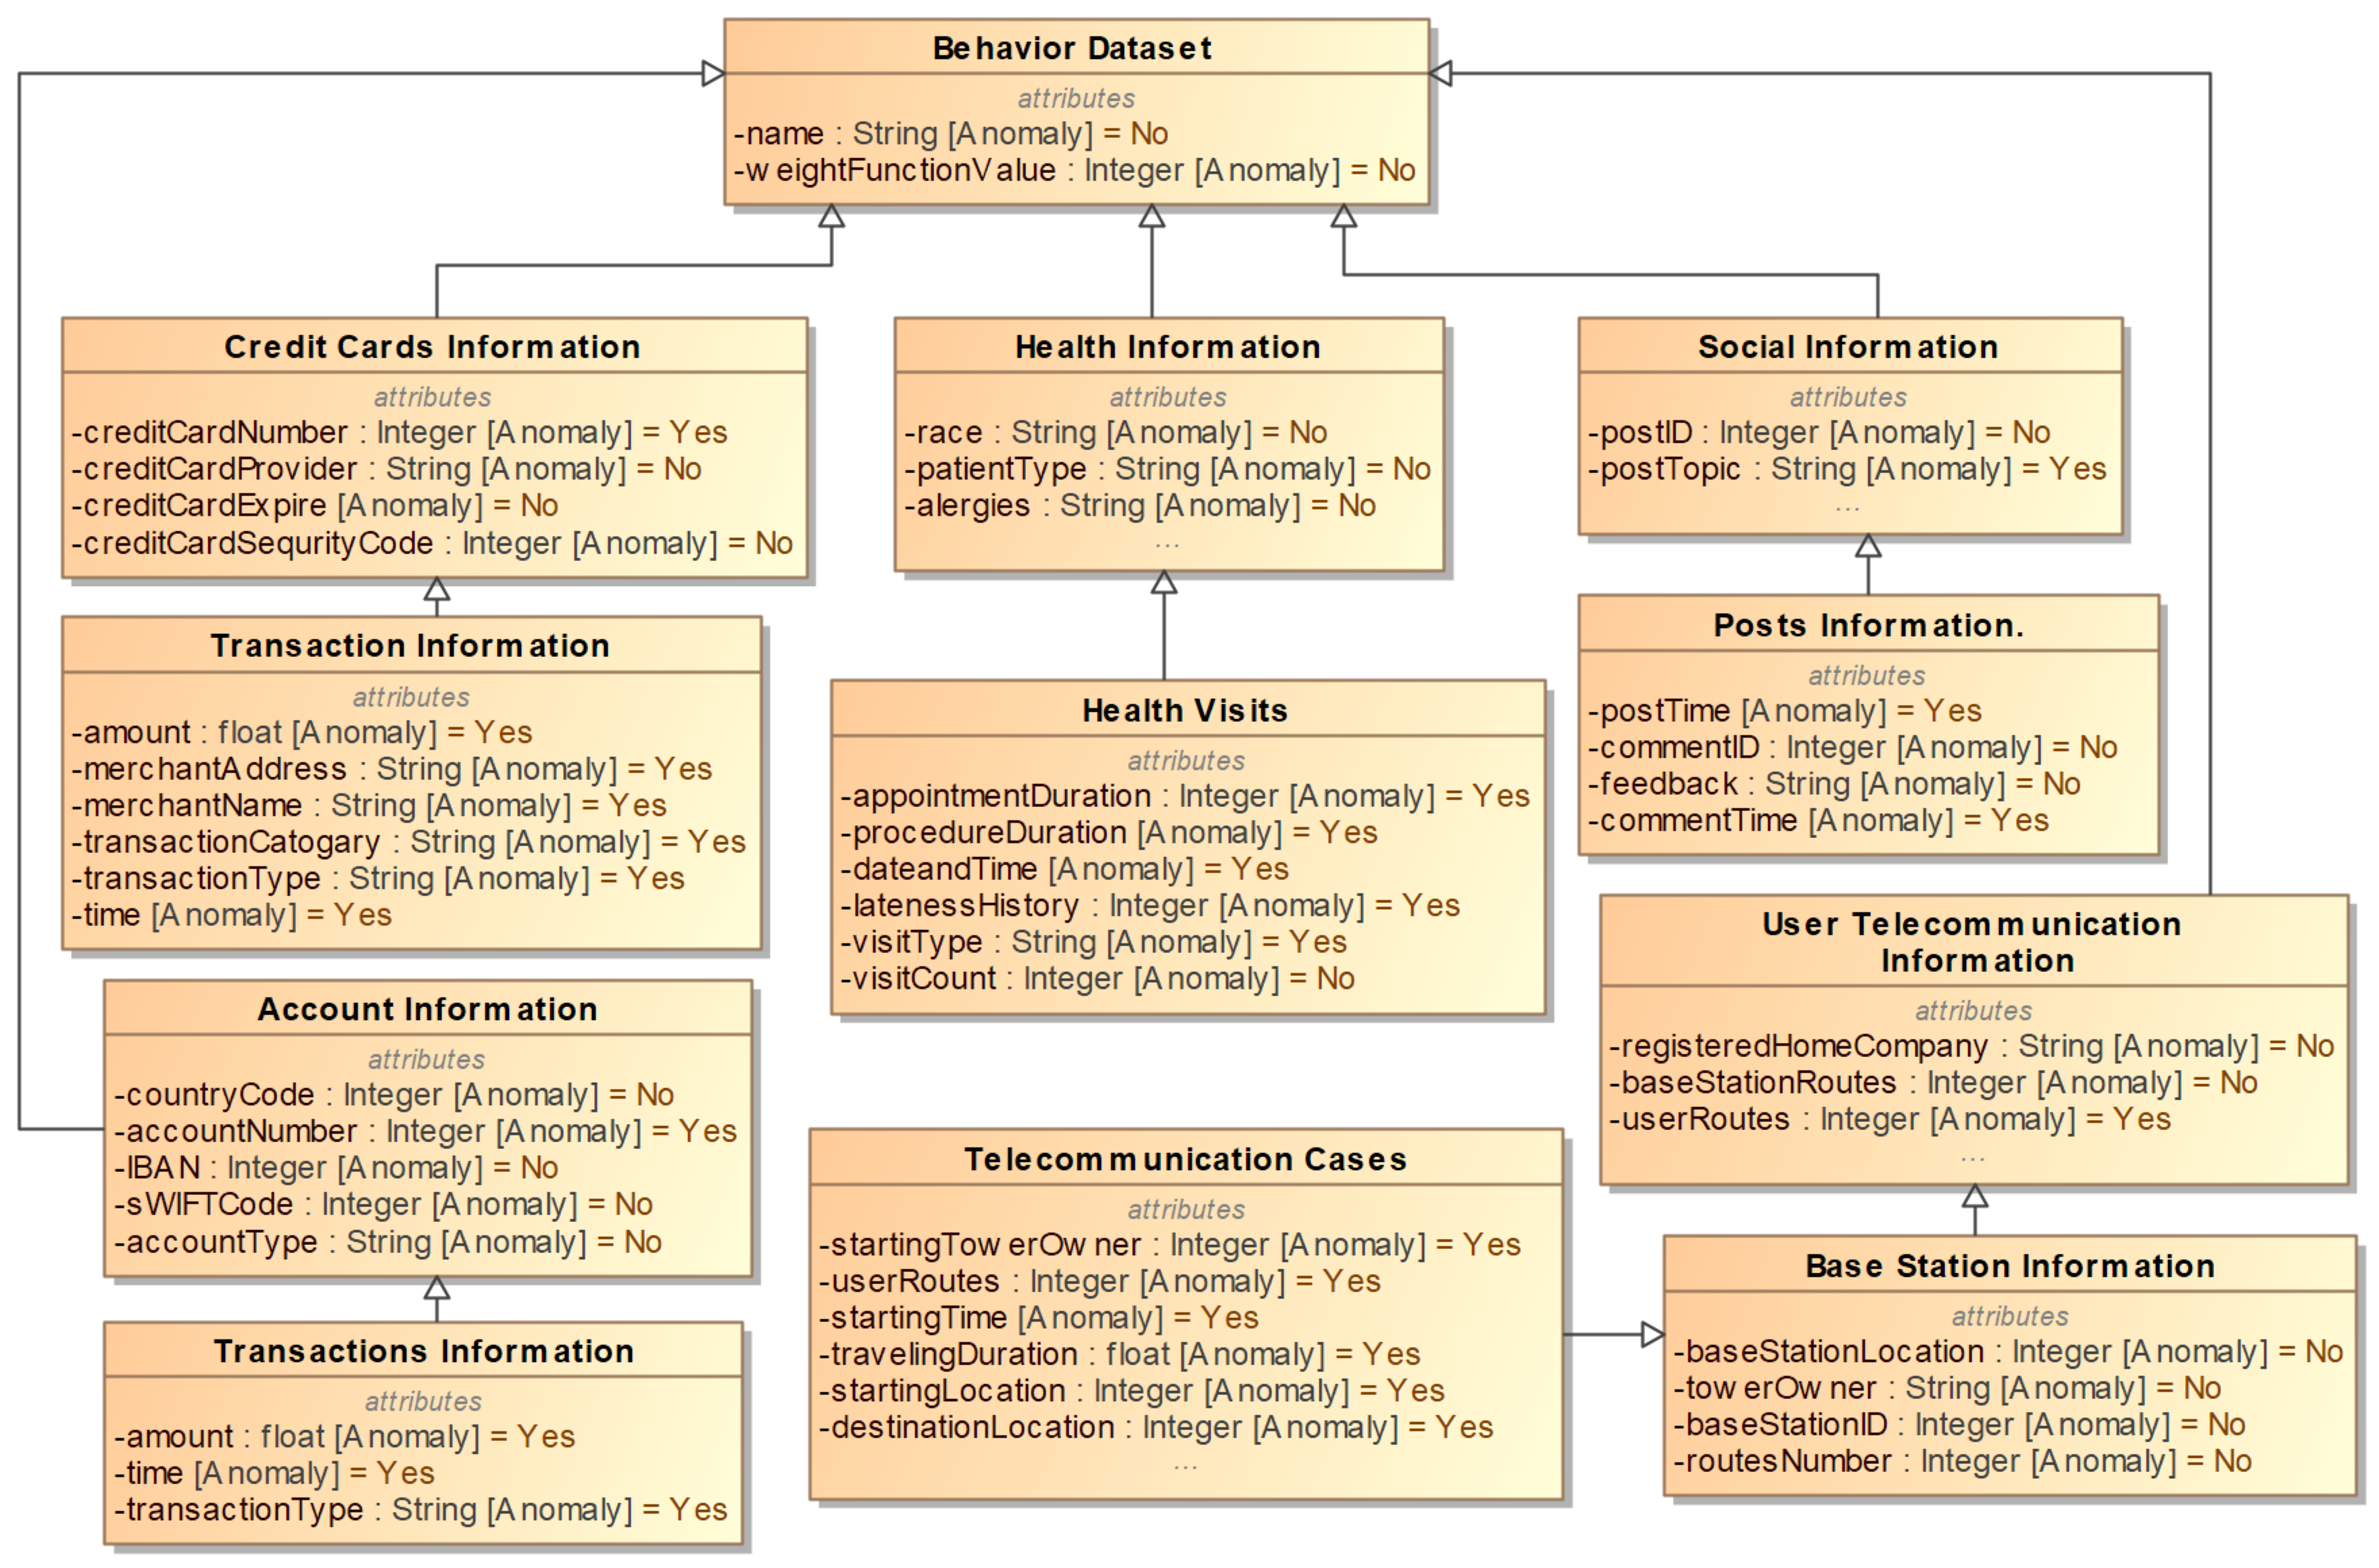
The first of our five data platforms is credit card activity. Each row of the data platform represents a single credit card transaction. This data platform includes the following features: name (string), credit card number (integer), transaction amount (float), merchant address (string), merchant name (string), transaction type (string), and time (date). The anomaly features in the credit card activity data platform are credit card number, transaction amount, merchant address, merchant name, transaction category, transaction type, and time. The relationship between this platform and the rest of the platforms can be seen in Figure 7.
The second of our five platforms is bank account activity. Each row of the data platform represents a single bank account transaction. This data platform includes the following features: name (string), transaction amount (float), time (date), country code (integer), account number (integer), IBAN (integer), SWIFT code (integer), account type (string), and transaction type (string). The anomaly features in the bank account activity data platform are account number, transaction amount, transaction type, and time. The relationship between this platform and the rest of the platforms can be seen in Figure 7.
The third of our five platforms is health records. Each row of the data platform represents a single appointment. This platform includes the following features: name (string), appointment duration (integer), procedure duration (integer), appointment date and time (date), lateness history (integer), visit type (string), and visit count (integer). The anomaly features in the health records platform are appointment duration, procedure duration, date and time, lateness history, and visit type. The relationship between this platform and the rest of the platforms can be seen in Figure 7.
The fourth of our five platforms is telecommunication activity. Each row of the platform represents a single communication. This platform includes the following features: name (string), starting tower owner (integer), registered home company (string), user routes (integer), starting time (date), travel time (float), starting location (integer), and destination location (integer). The anomaly features in the telecommunications platform are user routes, starting tower owner, starting time, traveling duration, starting location, and destination location. The relationship between this platform and the rest of the platforms can be seen in Figure 7.
The last of our five platforms is social media activity. Each row of the platform represents a single post on social media. This platform includes the following features: name (string), post ID (integer), topic of post (string), time of post (date), comment ID (integer), feedback (string), and time of comment (date). The anomaly features in the social media activity platform are: post topic, post time, and comment time. The relationship between this platform and the rest of the platforms can be seen in Figure 7.

5.1. Ethical Considerations and Privacy Compliance

To ensure the protection of user identities, sensitive personal data within all five datasets, as well as the personal information dataset, undergo a process where financial details and specific identifying information, such as social security numbers and dates of birth, are replaced with fake numerical values. This practice is crucial for safeguarding individuals’ privacy, particularly when dealing with sensitive information like financial records or personal identification details. By substituting real data with fictitious numerical values, researchers and analysts can still perform analysis or research without exposing real individuals’ information. These numerical values are carefully generated to maintain the statistical properties of the original data while ensuring that the actual identities of the individuals remain undisclosed. This approach, known as data anonymization, is a common practice in maintaining privacy compliance with regulations and ethical standards while allowing for effective data analysis and research.

5.2. Experimental and Expected Results Comparison

Table 2 describes the total size of the ADG Engine platforms after running the ADG Engine data generation algorithms. Each data platform has generated a different quantity of entries, ranging from tens of thousands of entries to over 1 million entries. The quantity of entries here is not a fixed number; running the code for a second time will produce a different observation number for each platform. In other words, the data size is chosen randomly by the algorithm in a specific range, which will produce a random number every time the algorithm is executed. For example, the first time the algorithm is run, the code might produce 1000 observations, but the second run might instead produce 3400 observations, with the quantity randomly generated every run within the range designated by the algorithm. During this test, the ADG Engine only generated the minimum number of observation necessary to guarantee a large number of observations. For example, if the ADG Engine asserts that the minimum number is 1000, then every time the data are generated, the number of observations will not be less than 1000. Table 2 also shows what proportion of the generated entries are normal behavior and what proportion represents abnormal behavior.

5.3. Examples of Several Users in One Sample of the Data Platform

Table 3 shows a list of multiple users from the data platform and the number of observations the ADG Engine has from them in the credit card platform. For each user, the ADG Engine also generated a sample ‘abnormal ratio’ by looking at the ‘amount’ feature of their observations. Both the number of observations and the abnormal ratio for the amount feature are unique for each user in the data platform.

5.4. A Sample of One User’s Data (Sonya Parsons)

Table 4 looks at one sample user by the name of Sonya Parsons. Sonya has recorded activity in each of the ADG Engine’s five data platforms, with a different number of observations in each platform. This is the input data that we will use to generate normal and abnormal data.
Table 5 shows the creation of an anomaly ratio from input data. In Sonya Parson’s recorded data in the credit card platform, the ADG Engine looks at the ‘amount’ feature describing the monetary value of each recorded activity. For simplicity, the ADG Engine only divides the feature into two ranges: one for low monetary values and one for high monetary values. Since activity with a low monetary value is much more common than activity with a high monetary value, the ADG Engine designates the low monetary value range as the normal section and the high monetary value range as the abnormal section. Table 5 then shows the normal and abnormal ratios derived from these ranges on this platform.

5.5. User Information Data

Table 6 shows more information about Sonya Parsons from the user profile platform, which we use in each of the ADG Engine’s five data platforms to help generate abnormal activities. There is no user behavior in this platform, but these data help us define what is and is not abnormal for Sonya Parsons.

6. Results

In this section, the ADG Engine examines in detail the sample data from one user across all of the ADG Engine’s five data platforms. The sample user we will be examining is ’Sonya Parsons’, whose user profile information has already been examined in the previous section. In each platform, the ADG Engine will show five sample transactions, and the ADG Engine will examine each feature of the platform individually. The time complexity in each platform is determined as follows: User Profile Data—O (n), Credit Card Transaction Data—O (n2), Bank Account Data—O (n), Health Records Data—O (n2), Telecommunications Data—O (n2), Social Media Data—O (n2).

6.1. Credit Card Platform Sample for One User

In the credit card transaction platform, the first feature as shown in Table 7 is the user’s name, which the ADG Engine already knows to be Sonya Parsons, as the ADG Engine is selecting her credit card transactions. The second feature is the credit card number, which is an anomaly feature because it is possible for a user to have multiple cards, one that they normally use and one that they rarely use. The amount feature is an anomaly feature for reasons explained previously, with certain ranges of the numeric value being more common than others. The merchant’s name and address are highly correlated features and also together serve as an anomaly feature, since it is possible for Sonya Parsons to visit some merchants more often than others. The transaction category feature is an anomaly feature because it is possible for Sonya Parsons to purchase certain types of items more often than others. For example, we see in the five sample entries that “Electronic and Technology Services” and “Toys and Sports” each appears twice, but “Hotel Services” only appears once. If we extrapolate only from these five samples, we might say that “Hotel Services” is the abnormal transaction category, but this is only a small sample of the full set of credit card transactions by Sonya Parsons. The last feature is the time of the transaction, which is an anomaly feature where, after sorting the time into one of four times of day, some times of day will be more common than others. For example, four of the five sample transactions take place in the afternoon, but only one of the five takes place in the morning, and none take place at night.

6.2. Bank Account Platform Sample for One User

Table 8 shows the bank account transaction platform. The first feature is again the user’s name, which we know to be Sonya Parsons for the purposes of this sample. The first feature is the account number, which is an anomaly feature because a user may have several bank accounts in their name and use one more than another. This is not shown in this sample because all five sample data entries from Sonya Parsons used the same account number. In the same manner as before, the amount feature and time feature are both anomaly features. The last anomaly feature of this platform is the transaction type which, similarly to the previous platform, is an anomaly feature because it is possible for one transaction type to be more common than others.

6.3. Health Records Platform Sample for One User

In the health records platform, as described in Table 9, the user registers their health information and then visits the clinic for their appointment. The second feature in the platform is ‘appointment duration’, and it is an anomaly feature because, much like the ‘amount’ features of previous platforms, the ADG Engine can divide the data into different ranges, some of which are more common than others. The duration is measured in minutes, so if appointments typically last two or three hours, then a very short appointment would be abnormal. The procedure duration feature is separated into three or four types and is not considered to be a meaningful anomaly feature. The ‘appointment date and time’ feature is an anomaly feature in the same manner as previous time-based anomaly features. ‘Lateness history’ tracks in minutes how late the user is and is an anomaly feature because, if a user is not late most of the time, then it is unusual for them to be late. ‘Visit type’ is an anomaly feature because it is possible for Sonya Parsons to visit the clinic for some reasons more often than other reasons, such as ’Dermatologist’, which appears in two of our five sample entries. The last feature of the platform, ‘visit count’, simply tracks which visit number to the clinic the current visit is, and is not considered an anomaly feature.

6.4. Telecommunications Platform Sample for One User

In the telecommunications activity platform, as shown in Table 10, the first feature describes which base station the telecommunications begins at, and it will always be the same if the user starts the telecommunication at the same geographical point. However, because the user can start telecommunications from a variety of places, this is an anomaly feature, as some starting base stations can be more common than others. The telecommunications company the user is registered to is not considered a meaningful anomaly feature, as the user remains registered to the same company for all their telecommunications with a change in registered company being rare and infrequent. The majority of the unusual work for this platform pertains to the ‘user routes’ feature, which we modeled after base stations in London, Ontario. The ADG Engine assigned every base station in London, Ontario, with an ID number in increments up from zero. Once every base station had an ID, the ADG Engine created a variety of routes that connect various base stations together in sequence and then assigned each user three to five random routes. One of these routes is the user’s routine route, and the other routes are uncommon routes. For example, in Sonya Parson’s sample platform, the common user route is (0, 17, 9, 7, 3, 26, 5), and the anomalous user route is (0, 27, 15, 22, 24, 8, 3, 2). As before, the ‘starting time’ feature is an anomaly feature because some times of day can be more common than other times of day. The ‘traveling time’ feature is derived from the ‘user route’ feature by calculating how many base stations need to be passed through and is primarily a matter of simplicity. The starting location and destination location features are both anomaly features that refer to the initial and final base stations in the routes. Both features can substantially vary and have one starting point or destination that occurs more commonly than others.

6.5. Example of User Route through London Ontario Base Stations

Figure 8 shows an example of a user route in London, Ontario. The blue line depicts the course of the user’s route, beginning at the user’s starting point and ending at the user’s destination. The user’s route also passes through three base stations along the way, extending the route to what is shown in the picture. The GPS coordinates of these base stations are as follows: (−81.314165, 43.019989), (−81.299122, 42.909328), and (−81.616511, 42.955678).

6.6. Social Media Platform Sample for One User

In the social media activity platform, as described in Table 11, the ADG Engine tracks elements such as post information, comments, and post feedback. The ’post ID’ is identical in all five of Sonya Parson’s sample events because that post received multiple likes and dislikes, each of which is treated as a separate event. The post topic is an anomaly factor, because a user may have one topic they talk about more often than other topics. Like before, time-based features such as ‘post time’ and ‘comment time’ are anomaly features for this platform. The feedback feature is considered an anomaly feature because different users have different ratios of likes and dislikes, rendering one more normal than the other.

7. Conclusions

In this paper, we created an Algorithm-based Data Generation Engine (ADG Engine) capable of efficiently generating large quantities of data to match the trends and qualities of any data that are already present. We took five platforms containing different user behaviors and linked them together into a rational platform with a user profile to reflect the fact that individual users will not use only one major service in their daily lives. We used this rational platform to determine the trends of the data within, using the user profile platform in common with all five activity platforms to help in the analysis, and we used these trends to generate new data for the platforms in a nondeterministic fashion, expanding it to whatever size we deemed fit. We injected abnormal data into normal instances at a selected ratio deemed reasonable to reflect user behavior. The five platform datasets were generated from scratch without the need for any initial data. We have developed algorithms to govern the probability weighting system for both time and numeric features. Our results show that the model matched all the criteria explained in Table 1. This shows that the generated data have many aspects that simulate real-life data and can substitute them for our research purposes. Future development of this work could include further interconnectivity of features in the platform, such as whether the normal/abnormal status of each feature can affect whether other features are generated as normal or abnormal. This would allow for the expression of higher-level trends while retaining the value of the current anomaly ratios produced by this project. Another potential improvement for the ADG Engine is to enable it to generate image datasets and consolidate all parameters into a single library for the finalization of the model.

Author Contributions

Conceptualization, I.I.M.A.S., P.V. and A.O.; Methodology, I.I.M.A.S. and A.O.; Software, I.I.M.A.S.; Validation, I.I.M.A.S., P.V. and A.O.; Formal analysis, I.I.M.A.S., P.V. and A.O.; Investigation, I.I.M.A.S. and A.O.; Resources, I.I.M.A.S. and A.O.; Data curation, I.I.M.A.S. and A.O.; Writing—original draft, I.I.M.A.S.; Writing—review & editing, I.I.M.A.S., P.V. and A.O.; Project administration, A.O.; Funding acquisition, A.O. All authors have read and agreed to the published version of the manuscript.

Funding

This work was supported by the Natural Sciences and Engineering Research Council of Canada (NSERC) [Grant no. RGPIN-2018-06250], and Taif University Researchers Supporting Project [Number TURSP-202é145], Taif University, Taif, Saudi Arabia. These supports are greatly appreciated.

Data Availability Statement

Data are contained within the article.

Acknowledgments

The authors acknowledge the NSERC research support from Western University in Canada. Additionally, the authors would like to thank Taif University’s Deanship of Graduate Studies and Scientific Research for partially funding this work.

Conflicts of Interest

The authors declare no conflict of interest.

References

  1. Voege, P.; Abu Sulayman, I.I.; Ouda, A. Smart chatbot for user authentication. Electronics 2022, 11, 4016. [Google Scholar] [CrossRef]
  2. Patki, N.; Wedge, R.; Veeramachaneni, K. The synthetic data vault. In Proceedings of the 2016 IEEE International Conference on Data Science and Advanced Analytics (DSAA), Montreal, QC, Canada, 17–19 October 2016; pp. 399–410. [Google Scholar]
  3. Lopez-Rojas, E.A.; Axelsson, S. Banksim: A bank payments simulator for fraud detection research. In Proceedings of the 26th European Modeling and Simulation Symposium, Bordeaux, France, 22–24 September 2014; pp. 144–152. [Google Scholar]
  4. Zhao, H.; Yang, Y. A data generation algorithm for internet of things based on complex event processing. In Proceedings of the 2015 IEEE International Conference on Smart City/SocialCom/SustainCom (SmartCity), Chengdu, China, 19–21 December 2015; pp. 827–831. [Google Scholar]
  5. Hu, M.; Wang, H.; Tang, D.; Li, F. Research on uncertain data generation algorithm. In Proceedings of the 2017 IEEE 2nd International Conference on Big Data Analysis (ICBDA), Beijing, China, 10–12 March 2017; pp. 120–123. [Google Scholar]
  6. Kim, J.S.; Jin, H.; Kavak, H.; Rouly, O.C.; Crooks, A.; Pfoser, D.; Wenk, C.; Züfle, A. Location-based social network data generation based on patterns of life. In Proceedings of the 2020 21st IEEE International Conference on Mobile Data Management (MDM), Versailles, France, 30 June–3 July 2020; pp. 158–167. [Google Scholar]
  7. Cinquini, M.; Giannotti, F.; Guidotti, R. Boosting Synthetic Data Generation with Effective Nonlinear Causal Discovery. In Proceedings of the 2021 IEEE Third International Conference on Cognitive Machine Intelligence (CogMI), Atlanta, GA, USA, 13–15 December 2021; pp. 54–63. [Google Scholar]
  8. Kothare, A.; Chaube, S.; Moharir, Y.; Bajodia, G.; Dongre, S. SynGen: Synthetic Data Generation. In Proceedings of the 2021 International Conference on Computational Intelligence and Computing Applications (ICCICA), Maharashtra, India, 26–27 November 2021; pp. 1–4. [Google Scholar]
  9. Hu, J.W.; Bowman, I.T.; Nica, A.; Goel, A. Distribution-driven, embedded synthetic data generation system and tool for RDBMS. In Proceedings of the 2019 IEEE 35th International Conference on Data Engineering Workshops (ICDEW), Macau, China, 8–11 April 2019; pp. 113–115. [Google Scholar]
  10. Topal, A.; Amasyali, M.F. When does Synthetic Data Generation Work? In Proceedings of the 2021 29th Signal Processing and Communications Applications Conference (SIU), Istanbul, Turkey, 9–11 June 2021; pp. 1–4. [Google Scholar]
  11. Imtiaz, S.; Arsalan, M.; Vlassov, V.; Sadre, R. Synthetic and private smart health care data generation using GANs. In Proceedings of the 2021 International Conference on Computer Communications and Networks (ICCCN), Athens, Greece, 19–22 July 2021; pp. 1–7. [Google Scholar]
  12. Petrovic, O.; Duarte, D.L.D.; Herfs, W. Generating Synthetic Data Using a Knowledge-based Framework for Autonomous Productions. In Proceedings of the 2023 IEEE/ASME International Conference on Advanced Intelligent Mechatronics (AIM), Seattle, WA, USA, 27 June–1 July 2023; pp. 1086–1093. [Google Scholar]
  13. Ganji, D.; Chakraborttii, C. Towards data generation to alleviate privacy concerns for cybersecurity applications. In Proceedings of the 2023 IEEE 47th Annual Computers, Software, and Applications Conference (COMPSAC), Torino, Italy, 26–30 June 2023; pp. 1447–1452. [Google Scholar]
  14. Rosenstatter, T.; Melnyk, K. Towards Synthetic Data Generation of VANET Attacks for Efficient Testing. In Proceedings of the 2023 IEEE Intelligent Vehicles Symposium (IV), Anchorage, AK, USA, 4–7 June 2023; pp. 1–7. [Google Scholar]
  15. Sanghi, A.; Haritsa, J.R. Synthetic Data Generation for Enterprise DBMS. In Proceedings of the 2023 IEEE 39th International Conference on Data Engineering (ICDE), Anaheim, CA, USA, 3–7 April 2023; pp. 3585–3588. [Google Scholar]
  16. DeOliveira, J.; Gerych, W. HAR-CTGAN: A Mobile Sensor Data Generation Tool for Human Activity Recognition. In Proceedings of the 2022 IEEE International Conference on Big Data (Big Data), Osaka, Japan, 17–20 December 2022; pp. 5233–5242. [Google Scholar]
  17. Bohorquez, N. Top 10 Python Packages for Creating Synthetic Data. Available online: https://www.activestate.com/blog/top-10-python-packages-for-creating-synthetic-data/ (accessed on 21 February 2024).
  18. Hittmeir, M.; Mayer, R.; Ekelhart, A. Efficient Bayesian Network Construction for Increased Privacy on Synthetic Data. In Proceedings of the 2022 IEEE International Conference on Big Data (Big Data), Osaka, Japan, 17–20 December 2022; pp. 5721–5730. [Google Scholar] [CrossRef]
  19. Kiran, A.; Kumar, S.S. A Methodology and an Empirical Analysis to Determine the Most Suitable Synthetic Data Generator. IEEE Access 2024, 12, 12209–12228. [Google Scholar] [CrossRef]
Figure 1. The relationship between user and data platforms.
Information 15 00146 g001
Figure 2. Dataset generation process.
Information 15 00146 g002
Figure 3. Time-based anomaly generation process.
Information 15 00146 g003
Figure 4. Numeric-based anomaly generation process.
Information 15 00146 g004
Figure 5. Probability weight system example.
Information 15 00146 g005
Figure 6. General data platform description.
Information 15 00146 g006
Figure 7. The five data platforms; columns, tables, types, and anomaly factors.
Information 15 00146 g007
Figure 8. London, Ontario, user route example.
Information 15 00146 g008
Table 1. Comparison of the existing data generators aiming to produce dual-mode user behavioral data.
Research PaperUnlimited Data SizeFeature Number FlexibilityAnomaly FeaturesRational DatasetsReal Data AspectsUser BehaviorNo Initial Data RequiredNumber of Applications Variety
[2]
[3]
[4]
[5]
[6]
[7]
[8]
[9]
[10]
[11]
[12]
[13]
[14]
[15]
[16]
[18]
[19]
ADG Engine
Table 2. Data platforms comparison and abnormal factors.
Dataset NameNumber of ObservationsAbnormal/Normal Ratio for Columns
Credit Card82,7156/10
Bank Account1,464,8104/9
Health Records1,428,9955/7
Telecommunication517,8104/8
Social Media671,9465/8
Table 3. Credit card data platform.
UsernameNumber of ObservationsAbnormal Ratio for Amount Feature
Sonya Parsons48717.86%
Mariah Phillips170315.9%
Ryan Ferguson36413.46%
Daniel Williamson49313.39%
Joshua York112013.66%
Table 4. One user’s number of observations in each dataset.
Dataset NameObservations Number
Credit Card487
Bank Account15,665
Health Records16,096
Telecommunication114
Social Media13,021
Table 5. Credit card platform, ‘Sonya Parsons’—amount feature.
Amount RangesNumber of Observations
Range 1 (0–500)—Normal Behavior400
Range 2 (500–1000)—Abnormal Behavior87
Total487
Abnormal Ratio(87/487) 17.86%
Normal Ratio(400/487) 82.14%
Table 6. User Information Data for ‘Sonya Parsons’.
Feature NameValue
nameSonya Parsons
userID140736587507472
phoneNumber1 (488) 882-2393
maritalStatusS
employmentStatusnon_employee
jobContractor
companyBoone, Gallagher, and Scott
SSN743-76-5026
residence9074 Brittany Cove Suite 000 South Glendaches…
currentLocation(2.798248, −56.054469)
bloodGroupB-
website[the website URL information]
usernamechristopher81
sexF
address7070 Warner Ridges Suite 228 North Kaylee, ON…
mailreyesmelody@hotmail.com
Table 7. Credit card platform sample for ’Sonya Parsons’.
NameCredit Card NumberAmountMerchant AddressMerchant NameTransaction CategoryTransaction TypeTime Prob
Sonya Parsons36917086006072$66.919365 Christian Keys Suite 532Freeman, Davis, and Jimenez[‘Electronic and Technology Services’]Purchase26-2-2016 11:36:15
Sonya Parsons36917086006072$245.591281 John PikeDavis-Houston[‘Electronic and Technology Services’]Purchase28-2-2016 13:50:34
Sonya Parsons36917086006072$481.06USNS Durham FPO AP 47489Richardson and Sons[‘Toys and Sports’]Return22-2-2016 12:53:45
Sonya Parsons36917086006072$219.9667 Chelsea Mountains Apt. 243 Morenoberg, UT…Thompson-Guzman[‘Hotel Services’]Return15-2-2016 12:43:44
Sonya Parsons36917086006072$216.8782929 Annette Shoals Thompsonshire, WY 88227Wright PLC[‘Toys and Sports’]Payment16-2-2016 14:03:15
Table 8. Bank account platform sample for ’Sonya Parsons’.
NameAccountNumberAmountTimeTransactionType
Sonya ParsonsPWIC38335764390619$118.4716-2-1998 18:51:41Deposit
Sonya ParsonsPWIC38335764390619$56.6408-12-2003 21:46:40eDeposit
Sonya ParsonsPWIC38335764390619$78.1311-06-2012 17:08:29eTransfer
Sonya ParsonsPWIC38335764390619$236.9418-07-1995 16:29:35Bill_payment
Sonya ParsonsPWIC38335764390619$518.5221-4-1999 04:46:51Withdraw
Table 9. Health records platform for ’Sonya Parsons’.
NameAppointment DurationProcedure
Duration
TimeLateness
History
Visit TypeVisit Count
Sonya Parsons118Brief28-2-2003 13:09:45absentEye Doctor226
Sonya Parsons156Extended11-4-2007 04:25:45absentRegistered Nurses679
Sonya Parsons177Intermediate05-10-2019 07:52:2710Dermatologist197
Sonya Parsons188Brief04-03-2015 02:57:550Mental Health Professionals786
Sonya Parsons1Extended04-05-2020 23:56:160Dermatologist740
Table 10. Telecommunications platform for ’Sonya Parsons’.
NameStarting Tower OwnerRegistered Home CompanyUser RoutesStarting TimeTraveling TimeStarting LocDestination Loc
Sonya ParsonsSaskTelShaw Communications(0, 17, 9, 7, 3, 26, 5)04-03-2016 04:45:5126.93105
Sonya ParsonsSaskTelShaw Communications(0, 27, 15, 22, 24, 8, 3, 2l)05-03-2016 01:06:1588.83102
Sonya ParsonsSaskTelShaw Communications(0, 17, 9, 7, 3, 26, 5)24-02-2016 13:20:2282.38105
Sonya ParsonsSaskTelShaw Communications(0, 17, 9, 7, 3, 26, 5)28-02-2016 04:41:17138.65105
Sonya ParsonsSaskTelShaw Communications(0, 17, 9, 7, 3, 26, 5)19-02-2016 20:46:4182.5105
Table 11. Social media platform for ’Sonya Parsons’.
NamePostIDPostTopicPostTimeCommentIDFeedbackCommentTime
Sonya Parsons140736587507472religion2016-03-04 16:18:01140736587507472[‘dislike’]2016-02-22 17:29:18
Sonya Parsons140736587507472religion2016-03-04 16:18:01140736587507504[‘like’]2016-02-10 17:38:33
Sonya Parsons140736587507472religion2016-03-04 16:18:01140736587507536[‘like’]2016-03-03 10:12:11
Sonya Parsons140736587507472religion2016-03-04 16:18:01140736587507568[‘dislike’]2016-02-09 13:49:23
Sonya Parsons140736587507472religion2016-03-04 16:18:01140736587507600[‘like’]2016-03-01 16:10:41
Disclaimer/Publisher’s Note: The statements, opinions and data contained in all publications are solely those of the individual author(s) and contributor(s) and not of MDPI and/or the editor(s). MDPI and/or the editor(s) disclaim responsibility for any injury to people or property resulting from any ideas, methods, instructions or products referred to in the content.

