


A New Social Media Analytics Method for Identifying Factors Contributing to COVID-19 Discussion Topics


School of Public Health and Preventive Medicine, Monash University, 553 St. Kilda Rd., Melbourne VIC 3004, Australia
Information 2023, 14(10), 545; https://doi.org/10.3390/info14100545
Submission received: 9 September 2023
/
Revised: 27 September 2023
/
Accepted: 4 October 2023
/
Published: 5 October 2023
(This article belongs to the Special Issue Artificial Intelligence and Big Data Applications)
Abstract
:Since the onset of the COVID-19 crisis, scholarly investigations and policy formulation have harnessed the potent capabilities of artificial intelligence (AI)-driven social media analytics. Evidence-driven policymaking has been facilitated through the proficient application of AI and natural language processing (NLP) methodologies to analyse the vast landscape of social media discussions. However, recent research works have failed to demonstrate a methodology to discern the underlying factors influencing COVID-19-related discussion topics. In this scholarly endeavour, an innovative AI- and NLP-based framework is deployed, incorporating translation, sentiment analysis, topic analysis, logistic regression, and clustering techniques to meticulously identify and elucidate the factors that are relevant to any discussion topics within the social media corpus. This pioneering methodology is rigorously tested and evaluated using a dataset comprising 152,070 COVID-19-related tweets, collected between 15th July 2021 and 20th April 2023, encompassing discourse in 58 distinct languages. The AI-driven regression analysis revealed 37 distinct observations, with 20 of them demonstrating a higher level of significance. In parallel, clustering analysis identified 15 observations, including nine of substantial relevance. These 52 AI-facilitated observations collectively unveil and delineate the factors that are intricately linked to five core discussion topics that are prevalent in the realm of COVID-19 discourse on Twitter. To the best of our knowledge, this research constitutes the inaugural effort in autonomously identifying factors associated with COVID-19 discussion topics, marking a pioneering application of AI algorithms in this domain. The implementation of this method holds the potential to significantly enhance the practice of evidence-based policymaking pertaining to matters concerning COVID-19.
1. Introduction
Social media analytics has been used in various ways to understand the impact of COVID-19. According to a study conducted by the World Health Organization (WHO), social media and other digital platforms created opportunities to keep people safe, informed, and connected during the pandemic [1].
By monitoring social media, analysts can also gauge public sentiment, track the spread of propaganda, and identify emerging narratives, thus offering insights into information operations and counter-messaging strategies. Furthermore, social media monitoring tools and algorithms (such as sentiment analysis, entity recognition, word frequency calculation, and topic analysis, as depicted in [2,3,4]) empower analysts to detect and analyse cyber threats in real-time, enabling proactive defence measures and the attribution of cyberattacks by identifying patterns, tracking malware propagation, and uncovering digital footprints left by threat actors. However, social media has also contributed to the spread of misinformation about COVID-19 [5,6,7,8]. In Ref. [5], a national survey by university researchers found that social media users are more likely to believe false claims about COVID-19, such as conspiracies, risk factors, and treatments. The survey also found that age, race, political party, and news source are some of the factors that influence the level of belief in COVID-19 misinformation. To eliminate these misconceptions and also to make strategic policy decisions on controlling COVID-19 crises, researchers and policymakers have been using Twitter analytics with artificial intelligence (AI) and natural language processing (NLP) (as shown in [9,10,11,12,13,14,15,16,17,18,19,20,21,22,23,24,25]). However, none of these tweet-mining technics in the area of COVID-19 (i.e., [9,10,11,12,13,14,15,16,17,18,19,20,21,22,23,24,25]) or other topics (e.g., [26,27,28,29,30,31,32,33]), have demonstrated a methodology to identify the factors correlated to Twitter discourse topics.
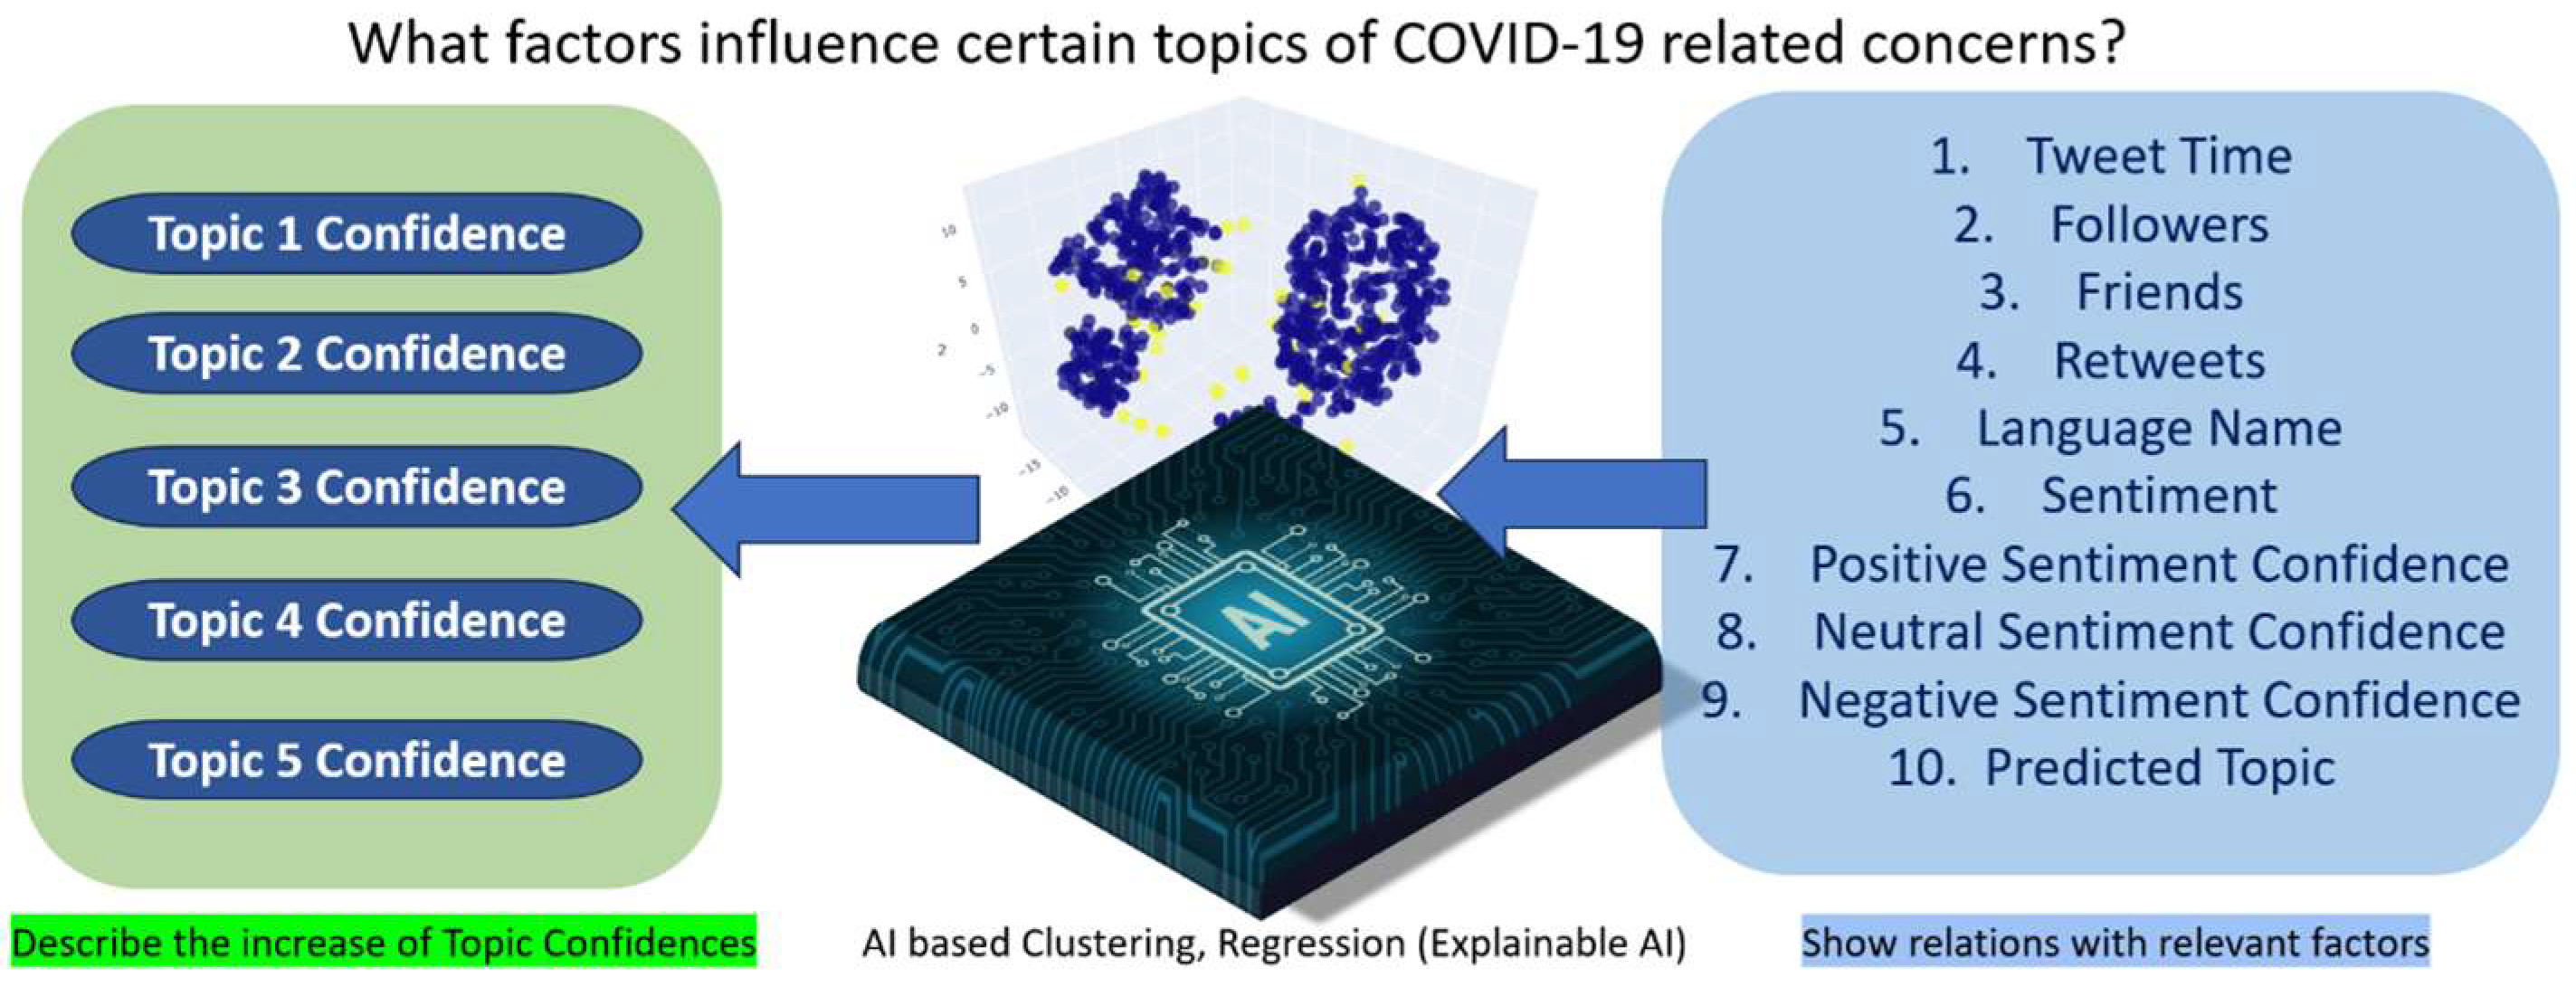
In this paper, an innovative methodology is proposed that uses AI-based services (Microsoft Cognitive Services [34]-based language detection, translation, and sentiment analysis) and algorithms (topic analysis, regression, and clustering) to autonomously identify the factors influencing COVID-19-related discussion topics, as shown in Figure 1. Moreover, the presented methodology was evaluated with 152,070 multilingual tweets, collected between 15th July 2021 and 20th April 2023. In summary, the following are the core contributions of this paper:
- An inventive framework, rooted in AI and NLP, is systematically employed. This framework integrates a spectrum of methodologies, including translation, sentiment analysis, topic analysis, regression, and clustering techniques, with the purpose of methodically discerning and expounding upon the factors that are pertinent to the diverse discourse topics encompassing COVID-19.
- This innovative approach underwent a rigorous examination and assessment, utilizing a dataset encompassing 152,070 tweets that were gathered within the temporal span from 15 July 2021 to 20 April 2023. Notably, this dataset encapsulates discourse in a wide array of 58 distinct languages.
- AI- and NLP-based regression identified and described 37 observations, of which 20 were found to be significant. Moreover, clustering techniques identified 15 observations, containing nine of significance.
- These 52 observations, generated through AI-driven methods, elucidated the relationships existing between topic confidences, encompassing Topic 1 confidence, Topic 2 confidence, Topic 3 confidence, Topic 4 confidence, and Topic 5 confidence, and an extensive array of factors. These factors included variables such as tweet time, followers, friends, retweets, language name, sentiment, positive sentiment confidence, neutral sentiment confidence, negative sentiment confidence, and predicted Topic.
- This methodology could be applied to identify factors related to any discussion topics within any micro-blogging social media platforms.
Within the rest of this paper, a background and literature review are provided (in Section 3), followed by the details of the proposed methodology (also in Section 3). Section 4 describes how the proposed methodology was evaluated with COVID-19-related tweets. Finally, Section 5 provides concluding remarks, limitations of this study, and future endeavours.
2. Background Context and Literature
In the realm of contemporary data analysis, the integration of multilingual, global sentiment analysis and topic analysis holds paramount significance when scrutinizing COVID-19-related tweets. This methodological approach encompasses a comprehensive investigation into the multifaceted linguistic expressions of a diverse global population during the pandemic. Multilingual sentiment analysis not only elucidates the emotional undercurrents within the discourse but also allows for the nuanced interpretation of sentiments across linguistic boundaries. Simultaneously, the employment of topic analysis facilitates the identification and categorization of emergent themes and topics within the vast corpus of COVID-19 tweets, ensuring a systematic exploration of the evolving narrative.
2.1. Global Perspective
A global perspective in COVID-19 tweet analysis is pivotal for recognizing international trends and disparities [9,10,11,12,13,14,15,16,17,18,19,20,21]. It enables us to identify common global concerns and regional variations, aiding policymakers in tailoring responses to specific contexts and populations.
2.2. Multilingual Analysis
The COVID-19 pandemic transcended linguistic barriers, impacting diverse populations worldwide. Multilingual analysis allows us to decipher sentiments and opinions expressed in various languages, providing a comprehensive view of global perceptions and concerns [13,14,21]. This inclusivity fosters a more accurate understanding of the pandemic’s impact on different communities.
2.3. Sentiment Analysis
Sentiment analysis delves into the emotional undercurrents of COVID-19 tweets, shedding light on public sentiment towards the pandemic, government responses, and vaccination efforts. This knowledge is invaluable for gauging public support and addressing concerns, ultimately contributing to more effective public health communication [9,10,11,12,13,14,15,16,17,18,19,20,21,35,36,37,38,39,40,41,42,43,44].
2.4. Topic Analysis
COVID-19 tweet analysis through topic analysis identifies emerging themes and discussions within the vast tweet corpus [10,11,16,22]. This aids in tracking the evolution of public discourse, from early outbreak concerns to vaccine distribution and beyond. Understanding topics informs public health strategies and crisis communication [4]. Table 1 summarizes the existing research works on COVID-19 Twitter analytics that applied sentiment analysis and topic analysis on multilingual and global tweets.
In summary, a comprehensive approach that integrates multilingual capabilities, global context, sentiment analysis, and topic analysis in COVID-19 tweet analysis is indispensable for capturing the nuanced dynamics of the pandemic’s impact, sentiments, and evolving discourse on a global scale. This research-driven approach empowers decision-makers to make informed, data-driven choices in managing and mitigating the pandemic’s effects. As seen in Table 1, none of the existing research work investigated the factors influencing COVID-19 discussion topics. This study reports the first academic work on identifying the factors behind COVID-19 discussion topics on Twitter by concurrently using sentiment analysis and topic analysis on multilingual and global tweets.
3. Materials and Methods
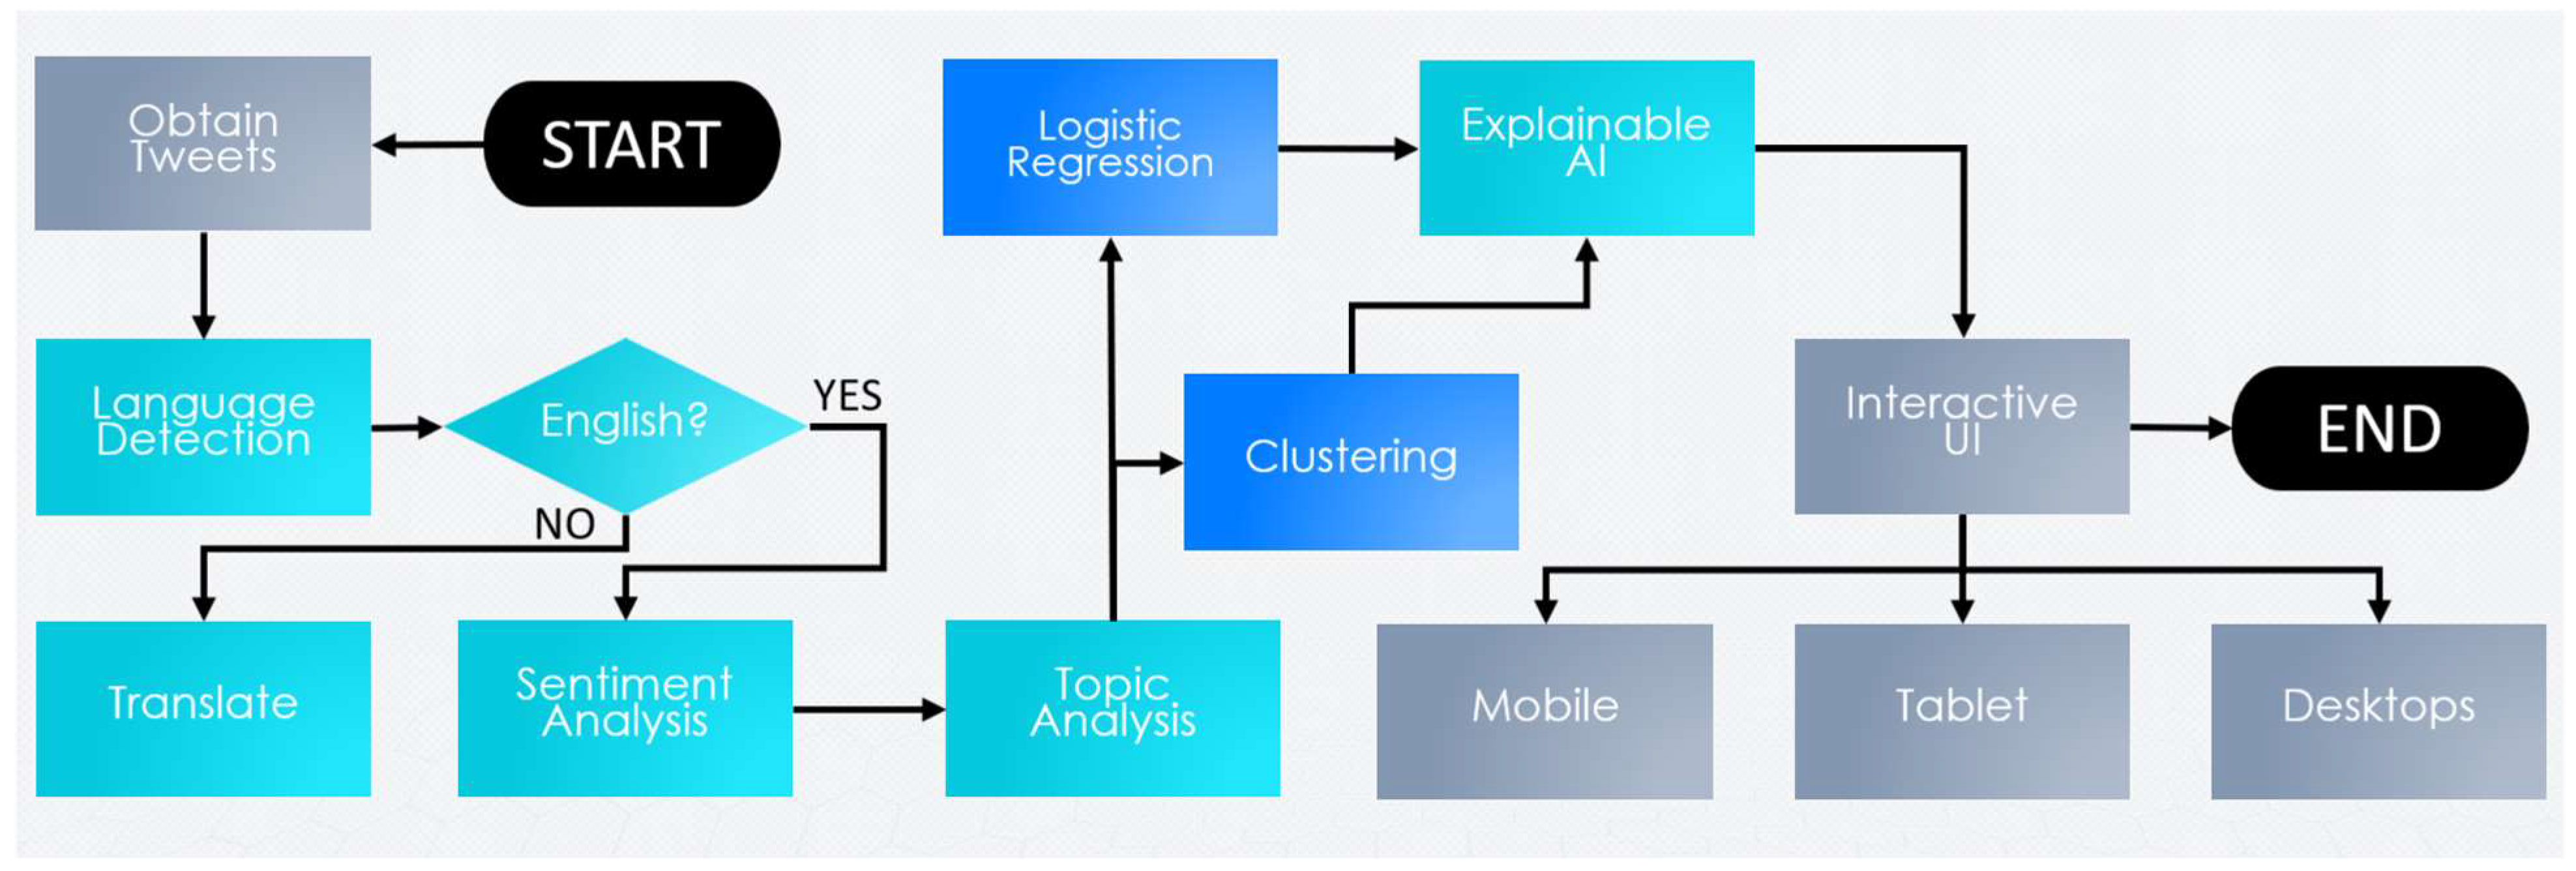
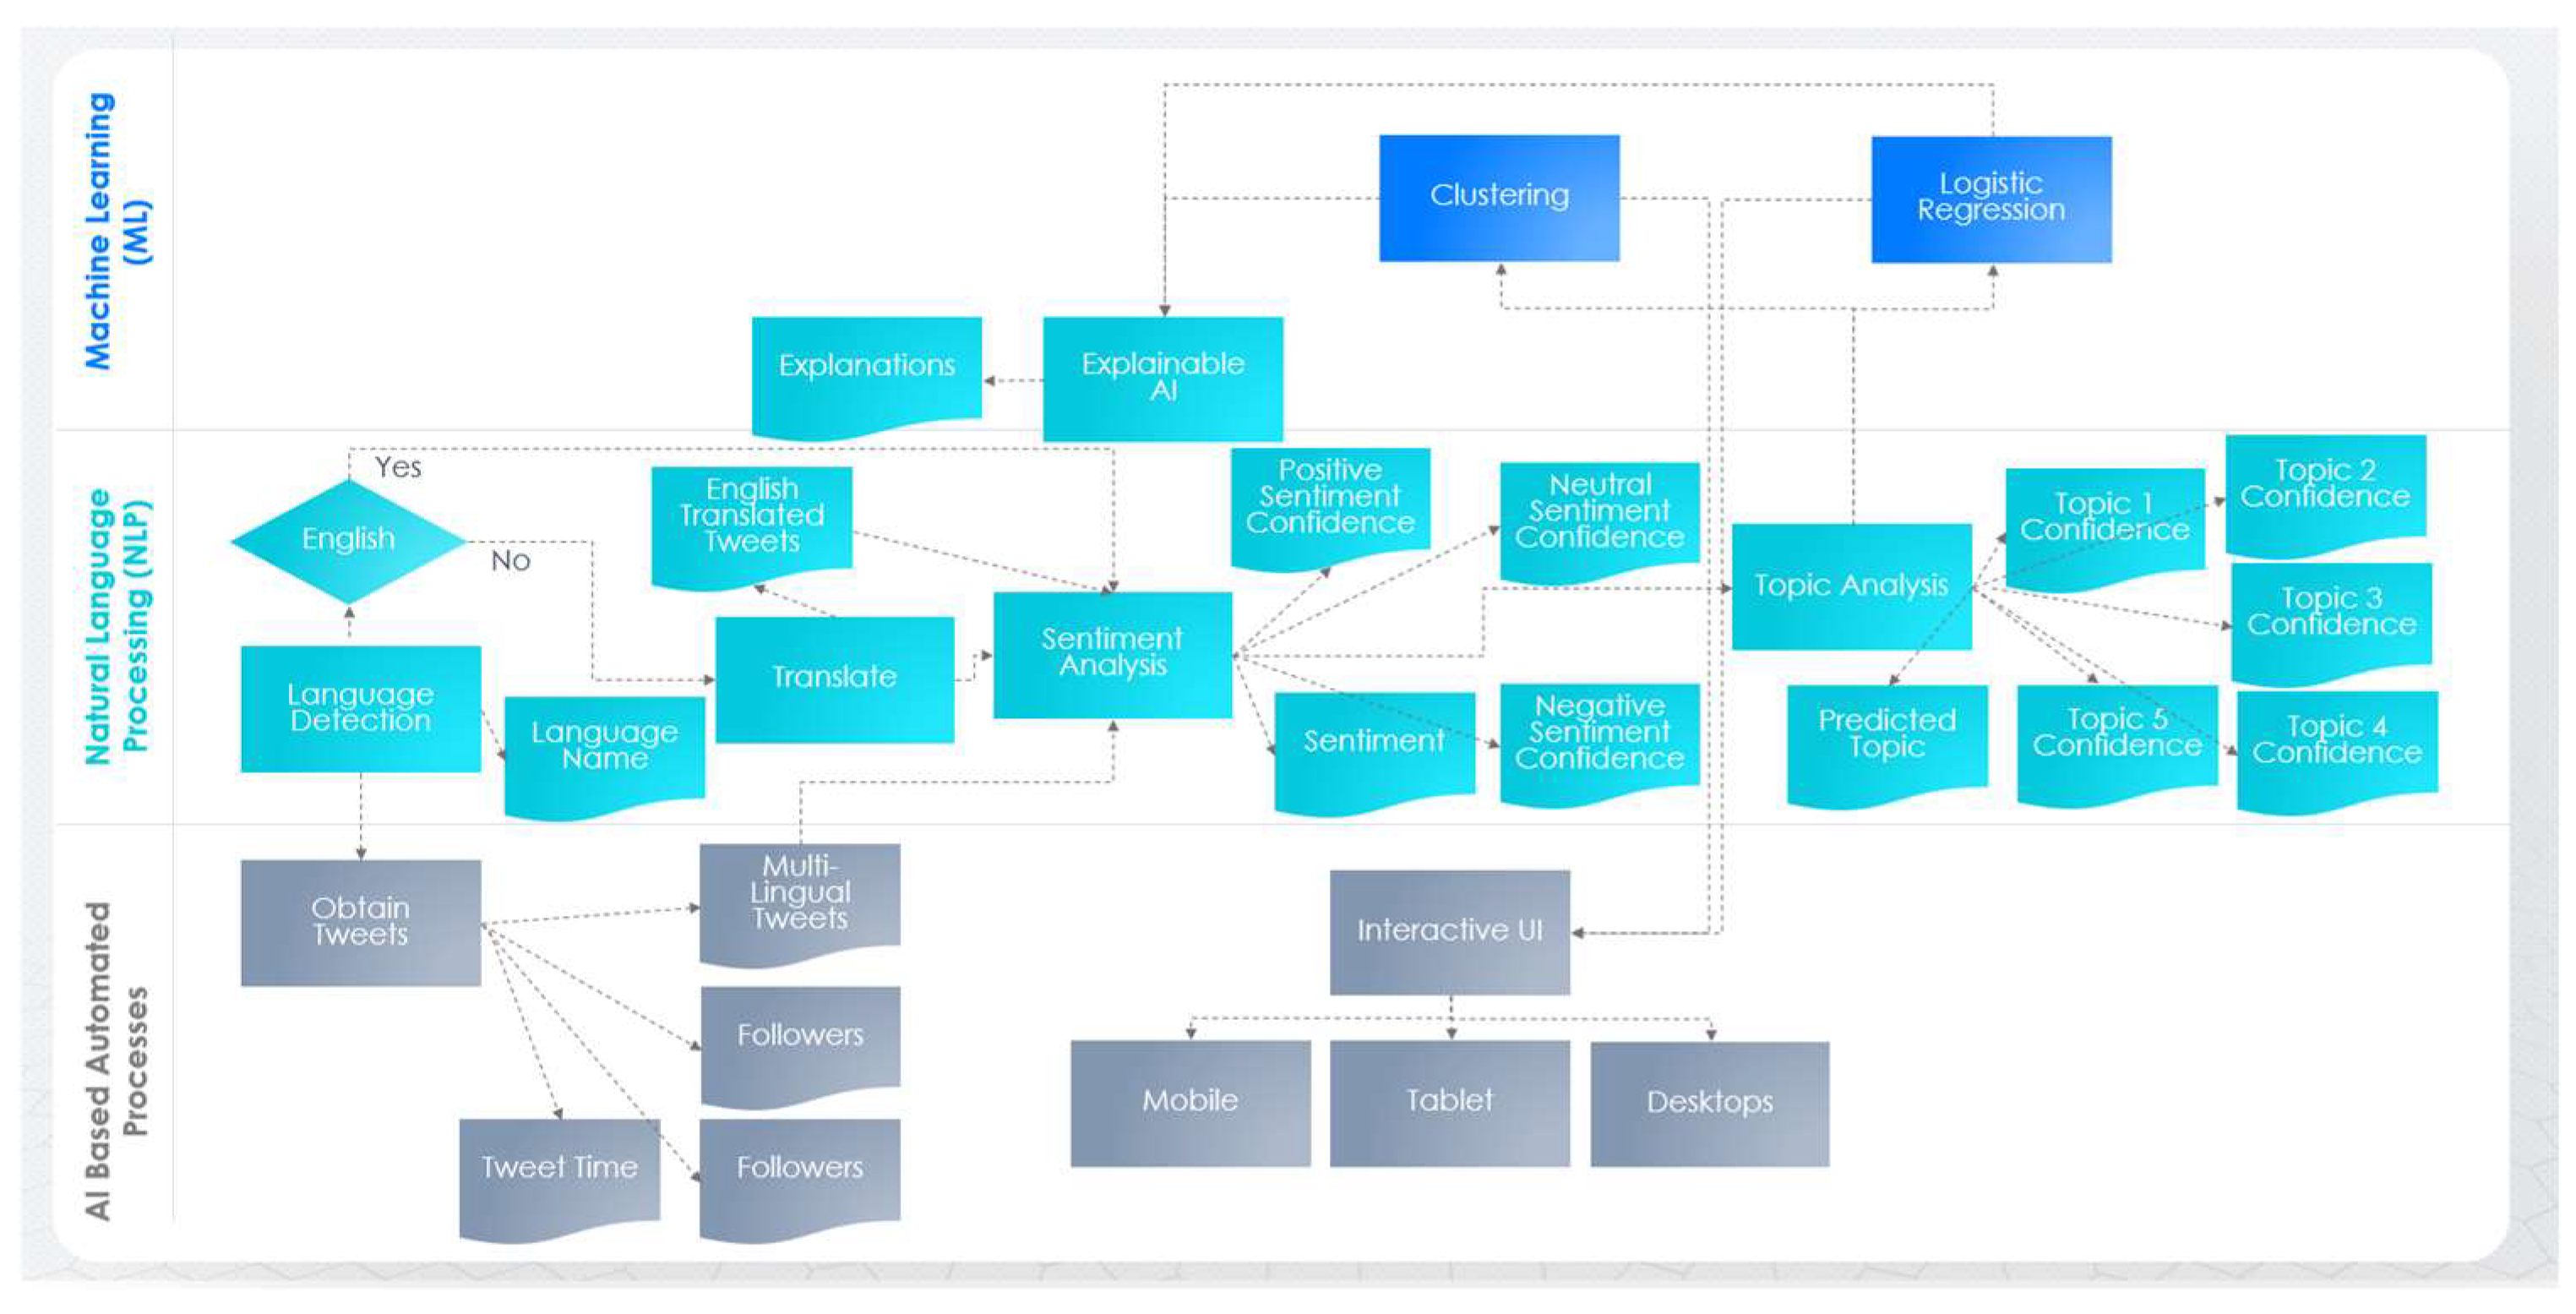
The proposed framework revolves around AI-driven processes of tweet acquisition, language detection, translation, sentiment analysis, topic analysis, and correlation analysis. The correlation analysis uses both regression and clustering techniques, and is demonstrated in Figure 2. Each of these steps are described within this section in detail.
3.1. Tweet Acquisition
At the inception of this analytical endeavour, we embark upon the acquisition of a corpus of multilingual tweets that are germane to the COVID-19 discourse. This foundational process entails the meticulous extraction of tweets that incorporate the keywords “COVID” or “CORONA”. Notably, this endeavour is not confined to the mere capture of textual content but extends to the comprehensive cataloguing of contextual parameters that encapsulate the temporal, audience-related, and propagation-related dimensions of each tweet. These dimensions include the tweet text, tweet time, followers, friends, and retweets, among other pertinent attributes. This step orchestrates the crystallization of a heterogeneous dataset, the quintessence of the analytical journey that ensues.
3.2. Language Detection
Subsequently, a critical layer of linguistic scrutiny is introduced through the mechanism of language detection. The profusion of languages within the Twitterverse necessitates an astute differentiation, rendering this phase indispensable. Herein, we leverage cutting-edge APIs, notably those furnished by Microsoft Cognitive Services, to determine the linguistic origin of each tweet. This critical linguistic assignment is chronicled as the “Language Name”. The veritable goal of this phase is the creation of a harmonious alignment of tweets with their respective linguistic affiliations, a foundational step for subsequent linguistic and sentiment analyses.
3.3. Translation (for Non-English Tweets)
In recognition of the global diversity that is inherent in Twitter discourse, where linguistic heterogeneity is the norm, an equilibrating mechanism is invoked for tweets that diverge from the English linguistic ambit. This mechanism, embodied in the translation process, endeavours to homogenize all tweets into the English language. Accordingly, those tweets that are identified as non-English in the preceding step undergo a transformational metamorphosis into English. This translation operation, facilitated by APIs such as those provided by Microsoft Cognitive Services, presents a unifying linguistic canvas, thereby fostering linguistic consistency for subsequent analytical endeavours.
3.4. Sentiment Analysis
The nuance of sentiment within the tweets, an elemental facet of the analysis, is meticulously unveiled through the prism of sentiment analysis. Each tweet within the standardized English dataset becomes a subject of scrutiny, wherein its emotional tenor in relation to the COVID-19 topic is artfully gauged. This nuanced analysis typically culminates in categorizations of tweets into one of three classes: positive, negative, or neutral. Notably, this classification is accompanied by quantified confidence scores, encapsulating the robustness of the categorization. The orchestration of this phase involves the utilization of sentiment analysis APIs, which, in the context herein, emanate from the domain of Microsoft Cognitive Services. Hence, the analytical outcome bestows upon each tweet a set of salient parameters: “Sentiment”, “Positive Sentiment Confidence”, “Neutral Sentiment Confidence”, and “Negative Sentiment Confidence”.
3.5. Topic Analysis (LDA-Based)
A pivotal stage in our analytical odyssey materializes with the advent of Latent Dirichlet Allocation (LDA)-based topic analysis. This modelling paradigm, founded upon probabilistic principles, aspires to uncover latent topics that are interwoven within the corpus of tweets. Each tweet assumes the role of a document, serving as a carrier of topic-related information. By engaging in the allocation of tweets to one or more topics, LDA bestows upon them topic affiliations, accompanied by associated confidence scores. This compositional orchestration of themes in the COVID-19 discourse begets a diverse set of parameters, most notably the “Predicted Topic” and the “Topic Confidence” scores for each tweet. This discourse-level dissection engenders insights into the salient themes permeating the Twitterverse in the context of COVID-19.
3.6. Correlation Analysis
At this juncture, the focus pivots toward the elucidation of associations, elucidating the intricate interplay between various parameters and COVID-19 discussion topics. Central to this endeavour is the endeavour to unearth correlations between the confidence levels assigned to each of the identified topics (e.g., Topic 1 confidence, Topic 2 confidence, and so forth) and a multifarious array of attributes. The palette of attributes encompasses diverse dimensions including temporal characteristics (e.g., tweet time), social dynamics (e.g., followers, friends, retweets), linguistic attributes (e.g., language name), sentiment attributes (e.g., sentiment, positive sentiment confidence, neutral sentiment confidence, negative sentiment confidence), and the very topics birthed from LDA-based topic analysis. This multifaceted inquiry invokes the services of AI-driven regression and clustering methods, eloquently weaving a tapestry of nuanced relationships, and revealing the underpinnings of the COVID-19 discourse.
Regression analysis automatically prioritizes and assesses the importance of factors for both categorical and numeric metrics. For numerical features, Microsoft’s ML.NET SDCA regression [45] was employed, using linear regression, a fundamental supervised learning technique for solving regression problems. Linear regression predicts a continuous dependent variable based on independent variables, aiming to determine the best-fit line that accurately forecasts the continuous output, thereby establishing a linear relationship, represented by Equation (1).
For categorical features, logistic regression was executed using L-BFGS logistic regression from ML.NET [46,47]. Logistic regression, a widely used supervised learning algorithm, serves purposes in both classification and regression problems. It predicts categorical dependent variables based on independent variables, employing Equation (2). Logistic regression outputs values between zero and one, making it suitable for tasks where probability estimates between two classes are needed, such as binary decisions like rainy or not rainy, 0 or 1, true or false, and so on.
Initially, logistic regression operates as a regression model. However, when a threshold is introduced, it transforms into an effective classifier. The process begins with the utilization of the logistic or sigmoid function (the process described with Equations (3)–(9)).
The sigmoid function of Equation (3) maps real numbers to interval (0, 1). Then, a hypothesis function is defined with Equation (4).
The classification decision is made on y = 1, when and y = 0 otherwise. The decision boundary is . The cost function is shown with Equation (5).
where H(p,q) is the cross-entropy of distribution q relative to distribution p and is shown with Equation (6).
In this case, y(i) ∈ {0,1} so p1 = 1 and p2 = 0. Therefore,
Similar to the selection of the quadratic cost function in linear regression, the selection of this cost function is mainly driven by the fact that it is efficient, as shown in Equation (8).
Hence, the gradient descent for logistic regression could be reflected with Equation (9).
Both linear and logistic regressions were automatically applied utilizing NLP [48].
3.7. Explanatory Analysis (NLP-Based)
The analytical sojourn reaches its culmination with a synthesis that bridges the chasm between numerical correlations and human understanding. Enter the realm of natural language processing (NLP)-based explainable AI, an ingenious avenue wherein the multifarious correlations unearthed in the prior step are rendered intelligible through human-readable narratives. By employing sophisticated NLP algorithms, this phase aspires to provide lucid elucidations that elucidate not only the “what” but also the “why” behind the identified correlations. The resulting explanations serve as the lighthouse that guides scholars and practitioners through the labyrinth of interconnected parameters, thereby fostering an enriched comprehension of the COVID-19 discussion dynamics on Twitter.
In summary, the processes of tweet acquisition, language detection, translation, sentiment analysis, and topic analysis created various attributes or factors, as shown in Table 2. These attributes are used in the correlation process (i.e., clustering, logistic regression, and explainable AI) for identifying the factors that influence COVID-19-related discussion topics (as shown in Table 2). Figure 3 demonstrates how these attributes are created as well as how these attributes are used. Algorithm 1 demonstrates our implementation of this methodology. Various notations used within Algorithm 1 are portrayed in Table 3.
| Algorithm 1: Analysing the correlated factors of COVID-19-related Twitter topics. | |||
| 1. | # Step 1: Tweet acquisition T, m, f, d, r = ExtractTweetsContainingKeywords(“COVID”, “CORONA”) | ||
| 2. | # Step 2: Language detection for tweet in T: | ||
| 3. | l = DetectLanguage(tweet) | ||
| 4. | # Step 3: Translation (for non-English tweets) T_EN = [] | ||
| 5. | for tweet in T: | ||
| 6. | if l is not “English”: | ||
| 7. | t_EN = TranslateToEnglish(tweet) | ||
| 8. | T_EN.append(t_EN) | ||
| 9. | else: | ||
| 10. | T_EN.append(tweet) | ||
| 11. | # Step 4: Sentiment analysis for tweet in T_EN: | ||
| 12. | s, p, n, u = SentimentAnalysis(tweet) | ||
| 13. | # Step 5: Topic analysis (LDA-based) Topics, c1, c2, c3, c4, c5 = PerformLDATopicAnalysis(T_EN) | ||
| 14. | # Step 6: Correlation analysis Correlations = CorrelationAnalysis({c1, c2, c3, c4, c5}→{l, f, d, r, s, p, n, u}) | ||
| 15. | # Step 7: Explanatory analysis (NLP-based) Explanations = ExplainCorrelations(Correlations) | ||
| 16. | # Display results or save to file DisplayResults(Correlations, Explanations) | ||
In summation, this academic endeavour embodies a holistic and rigorous analytical framework for the in-depth examination of COVID-19 discourse within the Twitter ecosystem. This process, characterized by its methodical granularity, encompasses diverse facets of data acquisition, linguistic analysis, sentiment assessment, thematic exploration, correlation identification, and linguistic elucidation, thereby affording a comprehensive view of the intricate discourse surrounding the pandemic within the digital public sphere. Its integration of advanced AI and NLP techniques amplifies the depth and interpretability of the insights garnered, rendering it a valuable resource for scholars in the realms of data science, linguistics, and social sciences.
4. Results and Discussion
The methodology was tested and critically evaluated with 152,070 tweets from 15 July 2021 to 20 April 2023. During these 645 days, tweets in 58 distinct languages were analysed with AI-based language detection, translation, sentiment analysis, and LDA-based topic analysis. LDA-based topic analysis identified five topics on COVID-19-related discussion. Finally, AI- and NLP-based clustering and regression algorithms were used to identify and describe the correlations between the topic confidences against each of the related variables.
Table 4 provides the details of the five topics. These topics were (1) broad discussion on corona, (2) COVID statistics and vaccination, (3) wordplay on corona, (4) COVID experiences or updates, and finally, (5) likely context of COVID in India. As seen in Table 4, each of these discerned topics demonstrated distinct patterns of word occurrences and weights. For example, within Topic 3, the word “crown” and its variations appear prominently, along with “Corona”. “Corona” in Latin means “crown”, and the name of the virus is derived from this due to its appearance under the microscope. Moreover, the COVID virus appears as football (soccer) and hence the word “Corona_Futbol” appears with a weight of 582.
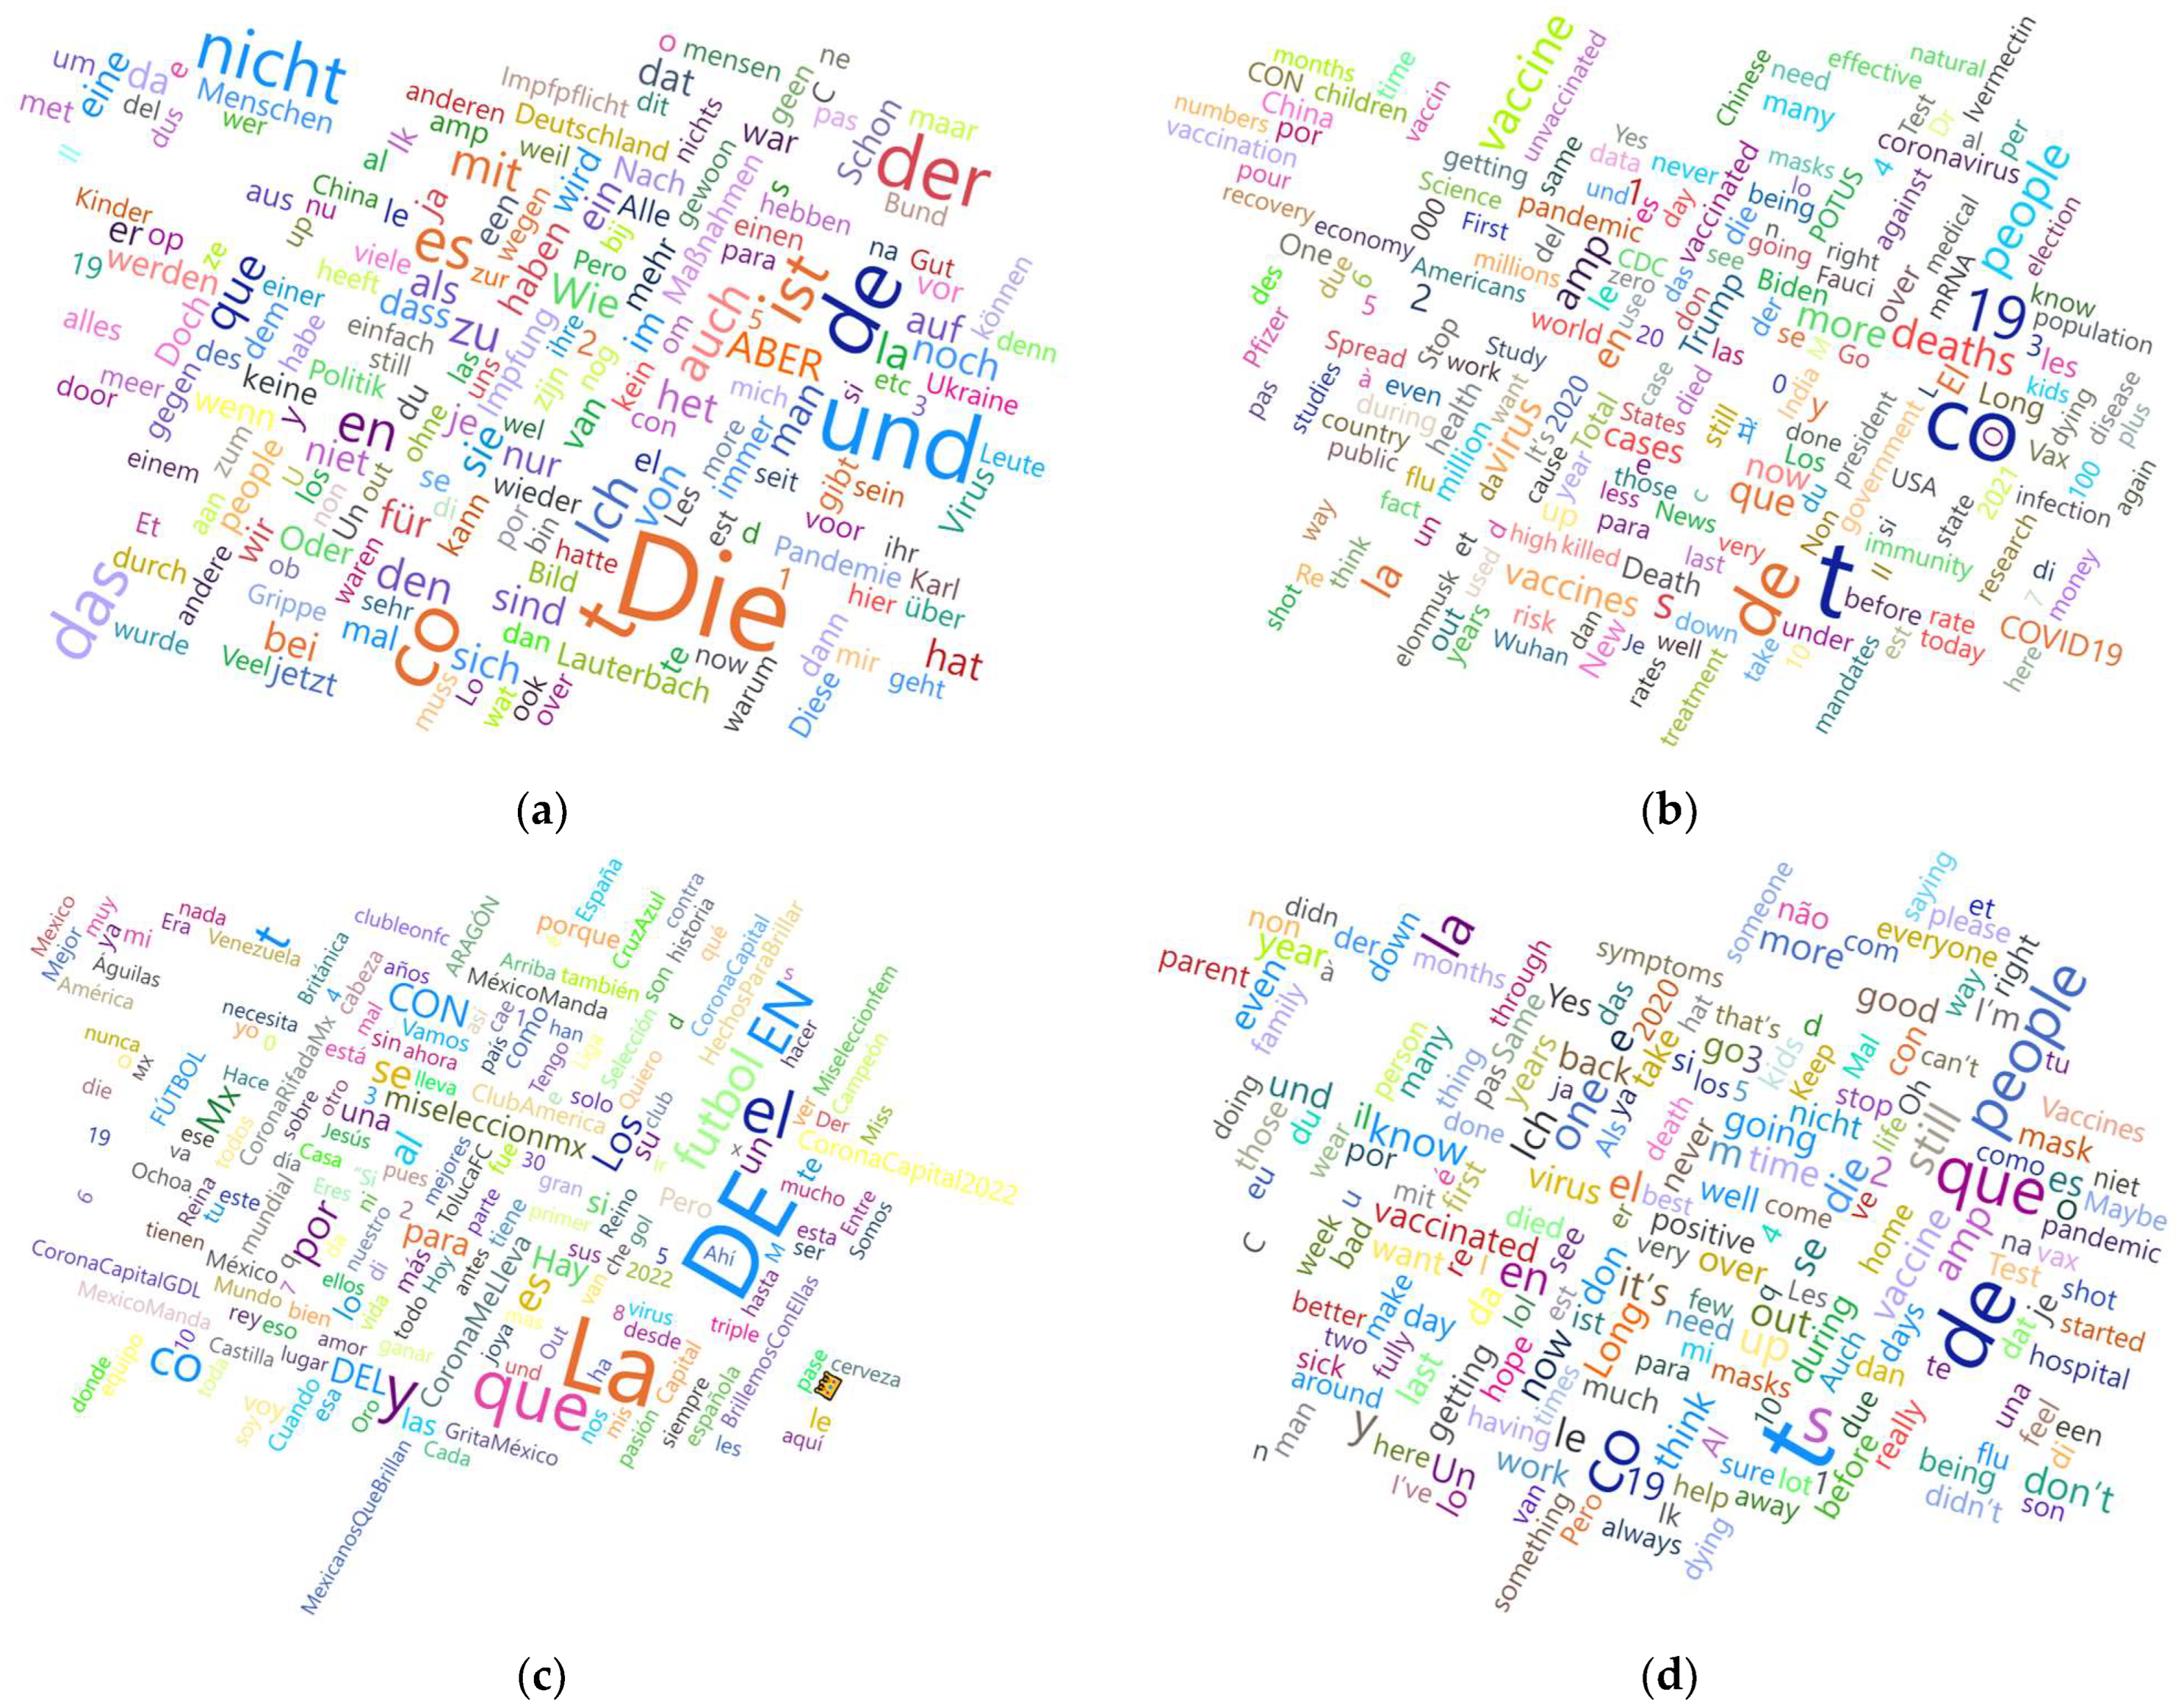
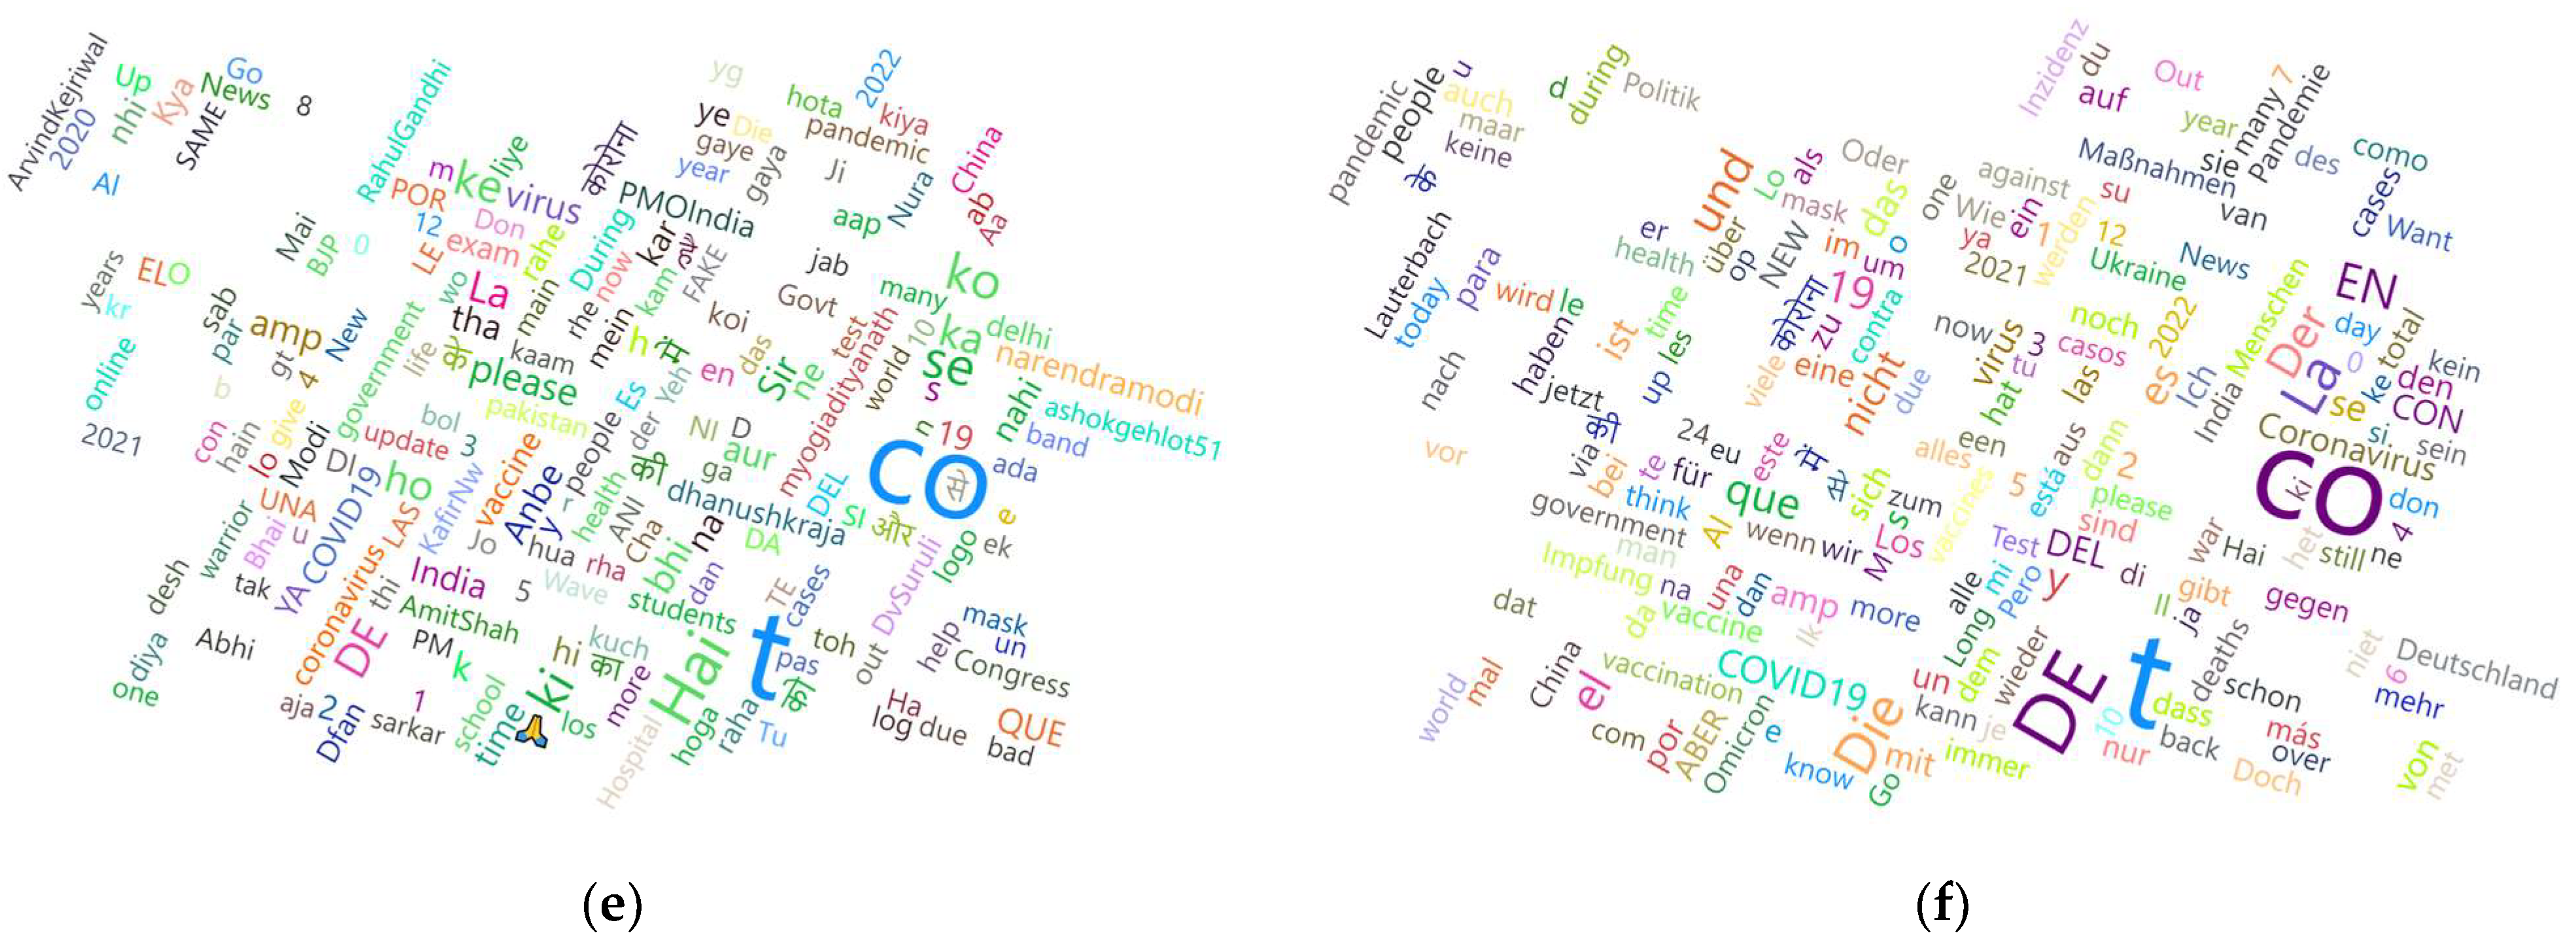
As seen in Table 5, about 60,855 tweets were in English, 30,212 tweets were in German, followed by 22,226 tweets in Spanish, 7419 in Dutch, and 5748 in French. Most interestingly, as shown in Table 5, the language distribution against each of the topics has distinctive patterns, suggesting possible correlations between topics and languages. We can see in Table 5 that Topic 2, Topic 4, and Topic 5 contain mostly English tweets. However, Topic 1 and Topic 3 demonstrate a dominance of German and Spanish tweets, respectively. Figure 4 shows the word cloud for each of the five topics. Figure 4a is mostly in the German language. Figure 4c is mostly in Spanish. Figure 4b, Figure 4d, Figure 4e, and Figure 4f are predominantly in English. It should be mentioned that default stop-words like “am”, “is”, and “at” have been removed from Figure 4. Moreover, common terminologies like “COVID”, “https”, “rt”, and “corona” have also been discarded from the word clouds shown in Figure 4. Finally, Table 6 depicts the distribution of sentiment confidences (i.e., the results of the sentiment analysis process), follower count, friend count, retweet count, and the number of distinct tweet languages against each of the topics.
As seen in Table 6, each of these five topics appear to be in distinct patterns, and AI-based clustering and regression in subsequent processes would confirm all possible correlations against each of these topics.
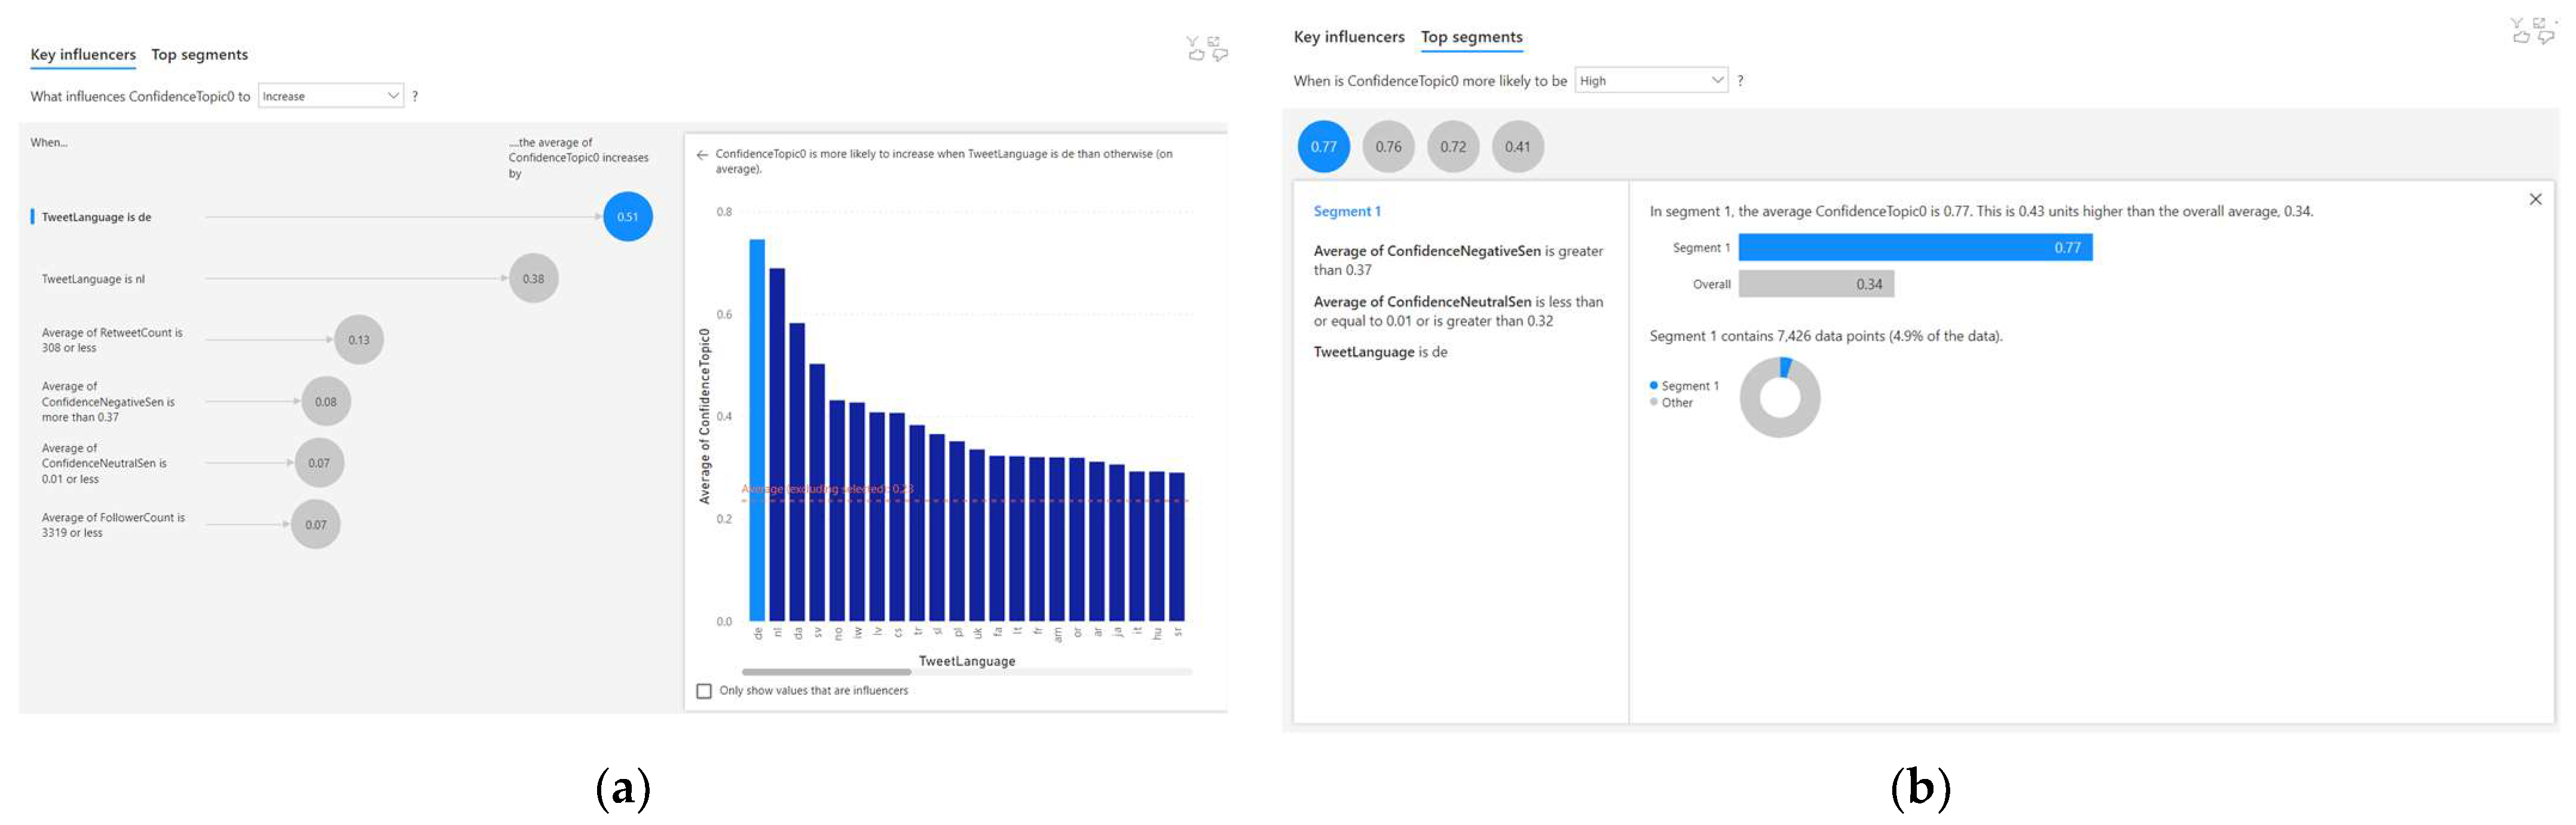
4.1. Analysing the Correlated Factors for Topic 1
For Topic 1, six correlations were discovered using the AI-based regression method. Out of these six correlations, three of them are significant (as the correlation factor is greater than or equal to 0.1). This is observed from the result of the AI-based regression analysis as depicted in Figure 5a. The three significant factors that influence Topic 1 confidence (c1) were identified to be language (l) and retweet count (r). The AI-based regression analysis uses NLP to describe these relationships. The following are three NLP-based descriptions of significant correlations:
- When the tweet language is ‘de’, the average Topic 1 confidence increases by 0.51;
- When the tweet language is ‘nl’, the average Topic 1 confidence increases by 0.38;
- When the average retweet count is 308 or less, the average Topic 1 confidence increases by 0.13.
These three significant correlations to Topic 1 confidence (c1) are also portrayed in Equations (10)–(12). The insignificant correlations (i.e., a correlation factor less than 0.1) are portrayed in Equations (13)–(15).
The automated AI-based clustering technique also discovered four clusters, as shown in Figure 5b. All clusters were found to be significant, as the Topic 1 confidence (c1) was more than or equal to 0.4.
Equations (16)–(19) depict the characteristics of these four significant clusters.
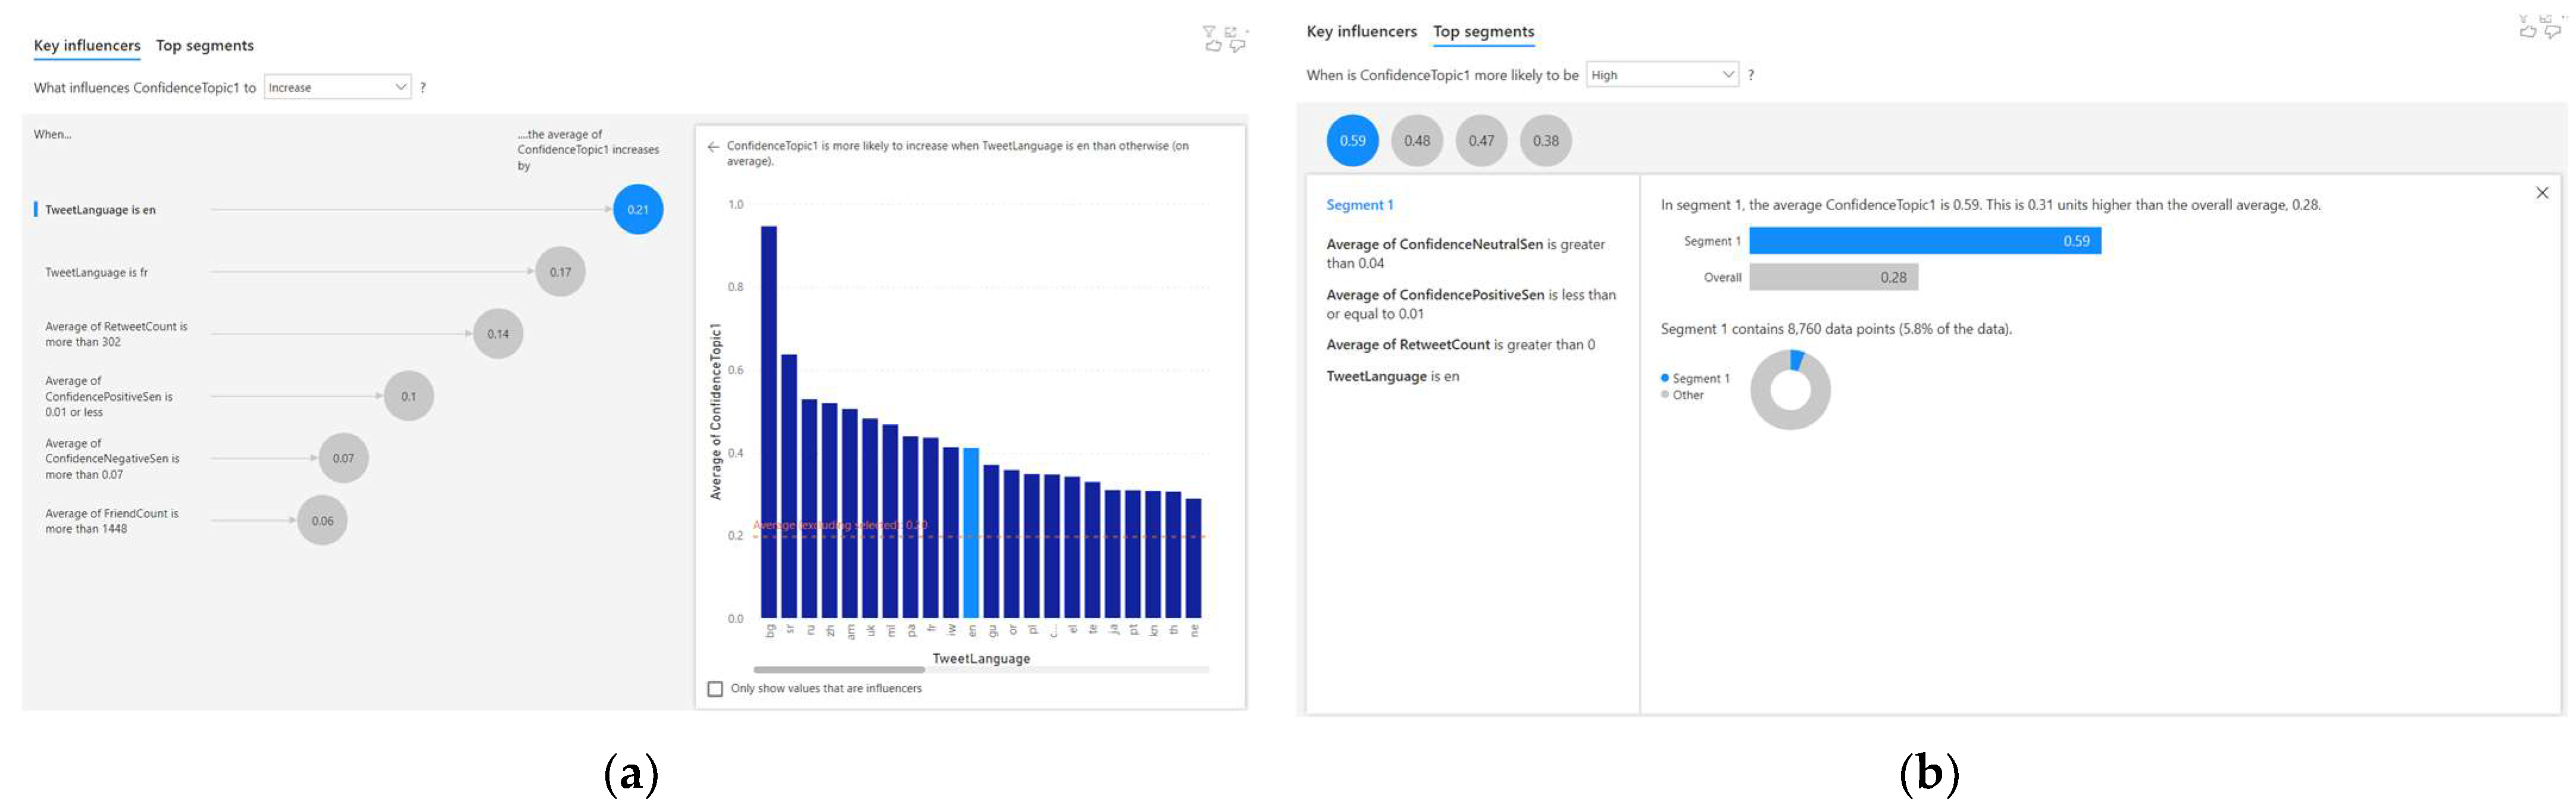
4.2. Analysing the Correlated Factors for Topic 2
For Topic 2, six correlations were discovered using the AI-based regression method. Out of these six correlations, four of them are significant (as the correlation factor is greater than or equal to 0.1). This is observed from the result of the AI-based regression analysis, as depicted in Figure 6a. The four significant factors that influence the Topic 2 confidence (c2) were identified to be the language (l), retweet count (r), and positive sentiment confidence (p). The AI-based regression analysis uses NLP to describe these relationships. The following are four NLP-based descriptions of significant correlations for Topic 2 confidence (c2):
- When the tweet language is ‘en’, the average Topic 2 confidence increases by 0.21;
- When the tweet language is ‘fr’, the average Topic 2 confidence increases by 0.17;
- When the average retweet count is more than 302, the average Topic 2 confidence increases by 0.14;
- When the average confidence-positive sentiment is 0.01 or less, the average Topic 2 confidence increases by 0.1.
These four significant correlations to the Topic 2 confidence (c2) are also portrayed in Equations (20)–(23). The insignificant correlations (i.e., a correlation factor less than 0.1) are portrayed in Equations (24)–(25).
The automated AI-based clustering technique also discovered four clusters, as shown in Figure 6b. Three out of the four clusters were found to be significant, as the Topic 2 confidence (c2) was more than or equal to 0.4.
Equations (26)–(28) depict the characteristics of these three significant clusters. Equation (29) represents the insignificant cluster (i.e., Topic 2 confidence, c2 ≤ 0.4).
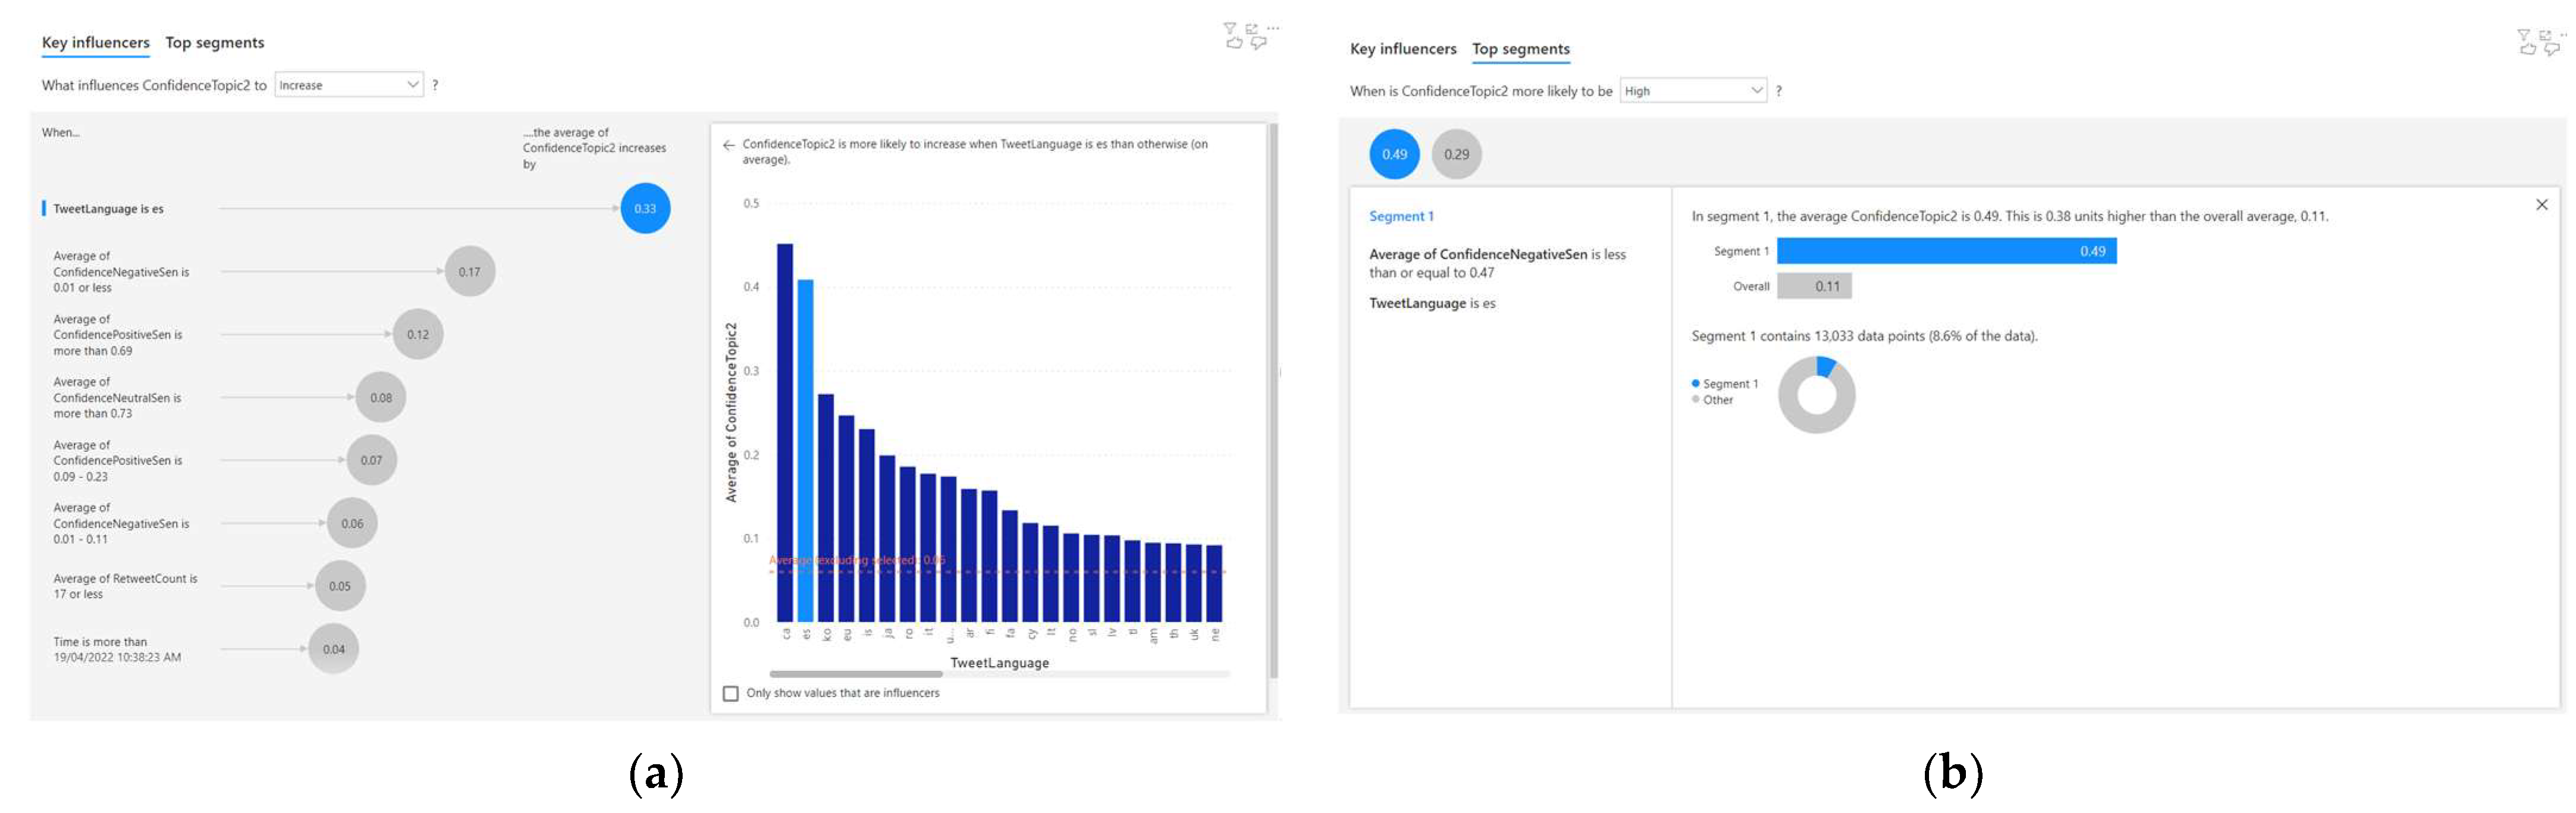
4.3. Analysing the Correlated Factors for Topic 3
For Topic 3, eight correlations were discovered using the AI-based regression method. Out of these eight correlations, three of them are significant (as the correlation factor is greater than or equal to 0.1). This is observed from the result of the AI-based regression analysis, as depicted in Figure 7a. The four significant factors that influence the Topic 3 confidence (c3) were identified to be the language (l), negative sentiment confidence (n), and positive sentiment confidence (p). The AI-based regression analysis uses NLP to describe these relationships. The following are three NLP-based descriptions of significant correlations for Topic 3 confidence (c3):
- When the tweet language is ‘es,’ the average Topic 3 confidence increases by 0.33;
- When the average confidence-negative sentiment is 0.01 or less, the average Topic 3 confidence increases by 0.17;
- When the average confidence-positive sentiment is more than 0.69, the average Topic 3 confidence increases by 0.12.
These three significant correlations to Topic 3 confidence (c3) are also portrayed in Equations (30)–(32). The insignificant correlations (i.e., a correlation factor less than 0.1) are portrayed in Equations (33)–(37).
The automated AI-based clustering technique also discovered two clusters, as shown in Figure 7b. One out of the two clusters were found to be significant, as the Topic 3 confidence (c3) was more than or equal to 0.4.
Equation (38) depicts the characteristics of the significant cluster. Equation (39) represents the insignificant cluster (i.e., Topic 3 confidence, c3 ≤ 0.4).
4.4. Analysing the Correlated Factors for Topic 4
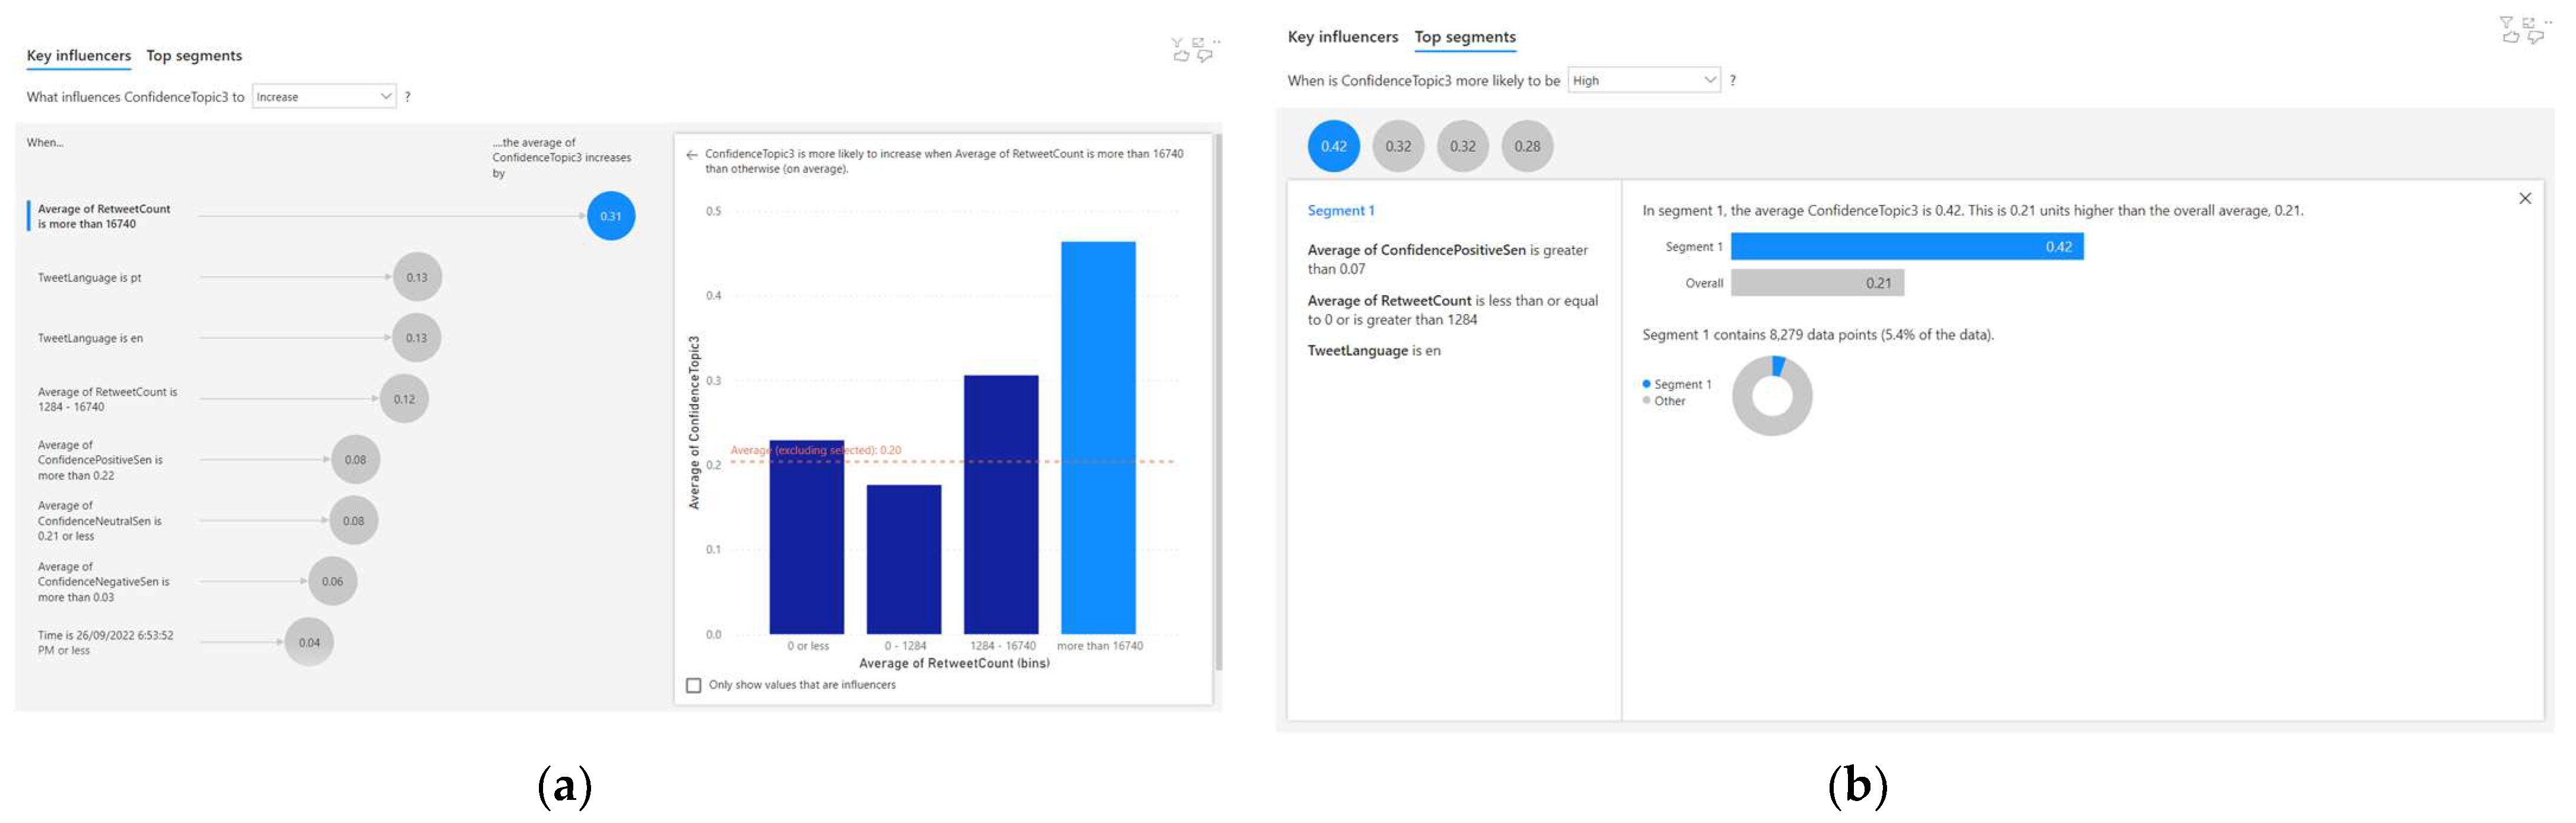
For Topic 4, eight correlations were discovered using the AI-based regression method. Out of these eight correlations, four of them are significant (as the correlation factor is greater than or equal to 0.1). This is observed from the result of the AI-based regression analysis, as depicted in Figure 8a. The two significant factors that influence the Topic 4 confidence (c4) were identified to be the retweet count (r) and language (l). The AI-based regression analysis uses NLP to describe these relationships. The following are four NLP-based descriptions of the significant correlations for Topic 4 confidence (c4):
- When the average retweet count is more than 16,740, the average Topic 4 confidence increases by 0.31;
- When the tweet language is ‘pt’, the average Topic 4 confidence increases by 0.13;
- When the tweet language is ‘en’, the average Topic 4 confidence increases by 0.13;
- When the average retweet count is 1284–16740, the average Topic 4 confidence increases by 0.12.
These four significant correlations to Topic 4 confidence (c4) are also portrayed in Equations (40)–(43). The insignificant correlations (i.e., a correlation factor less than 0.1) are portrayed in Equations (44)–(47).
The automated AI-based clustering technique also discovered four clusters, as shown in Figure 8b. One out of the four clusters was found to be significant, as the Topic 4 confidence (c4) was more than or equal to 0.4.
Equation (48) depicts the characteristics of the significant cluster. Equations (49)–(51) represent the insignificant clusters (i.e., Topic 4 confidence, c4 ≤ 0.4).
4.5. Analysing the Correlated Factors for Topic 5
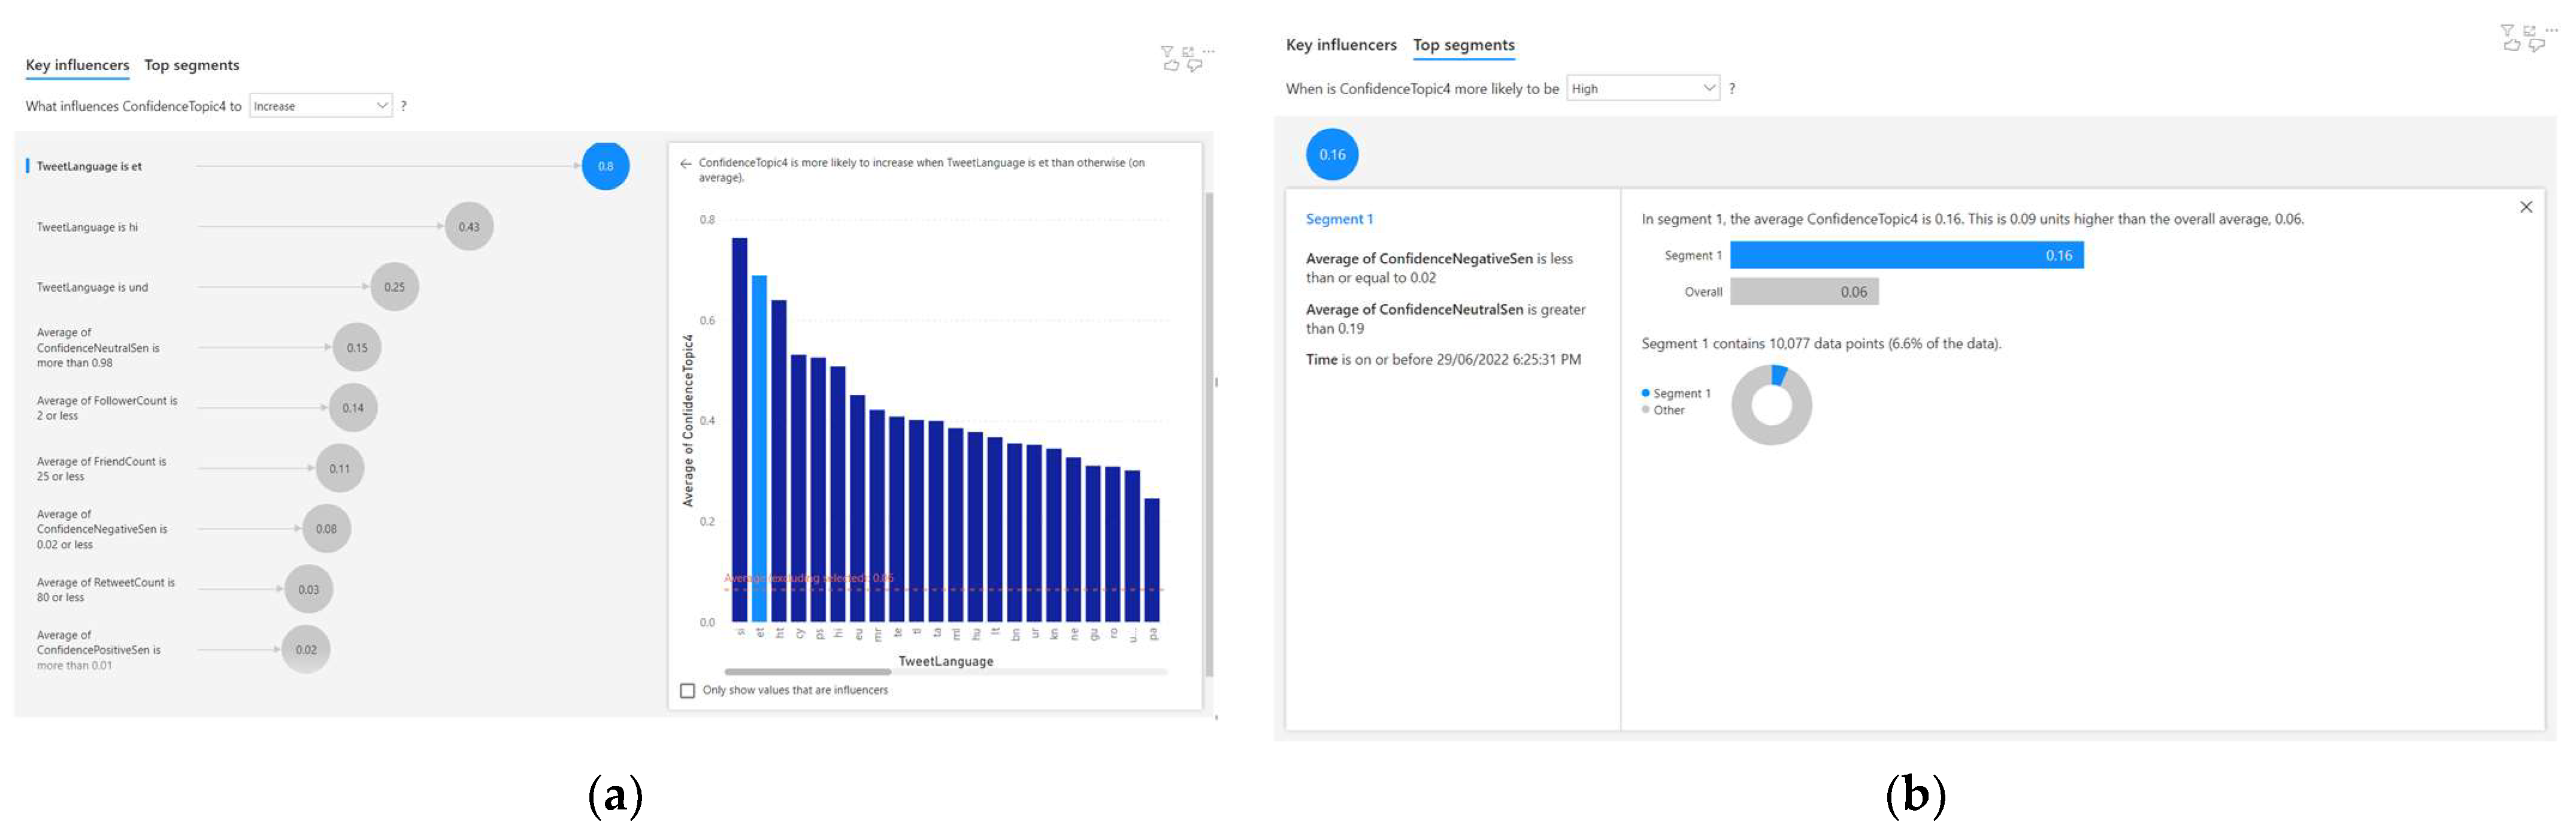
For Topic 5, nine correlations were discovered using the AI-based regression method. Out of these nine correlations, six of them are significant (as the correlation factor is greater than or equal to 0.1). This is observed from the result of the AI-based regression analysis, as depicted in Figure 9a. The three significant factors that influence the Topic 5 confidence (c5) were identified to be the language (l), neutral sentiment confidence (u), follower count (f), and friend count (d). The AI-based regression analysis uses NLP to describe these relationships. The following are six NLP-based descriptions of the significant correlations:
- When the language is ‘et’, the average Topic 5 confidence increases by 0.8;
- When the language is ‘hi’, the average Topic 5 confidence increases by 0.43;
- When the language is ‘und’, the average Topic 5 confidence increases by 0.25;
- When the average confidence-neutral sentiment is more than 0.98, the average Topic 5 confidence increases by 0.15;
- When the average follower count is 2 or less, the average Topic 5 confidence increases by 0.14;
- When average friend count is 25 or less, the average Topic 5 confidence increases by 0.11.
These six significant correlations to Topic 5 confidence (c5) are also portrayed in Equations (52)–(57). The insignificant correlations (i.e., a correlation factor less than 0.1) are portrayed in Equations (58)–(60).
The automated AI-based clustering technique also discovered one cluster, as shown in Figure 9b. This cluster was found to be significant, as the Topic 5 confidence (c5) was more than or equal to 0.4.
Equation (61) depicts the insignificant characteristics of this cluster (i.e., Topic 5 confidence, c5 ≤ 0.4).
Finally, Table 7 summarizes the results of the cluster analysis for each of the topics (i.e., Topic 1 confidence, Topic 2 confidence, Topic 3 confidence, Topic 4 confidence, and Topic 5 confidence). Moreover, this table shows how many records (i.e., population count) were used to obtain the details of these clusters. As seen in Table 7, the significant clusters (i.e., a cluster confidence greater than or equal to 0.4) are highlighted in red.
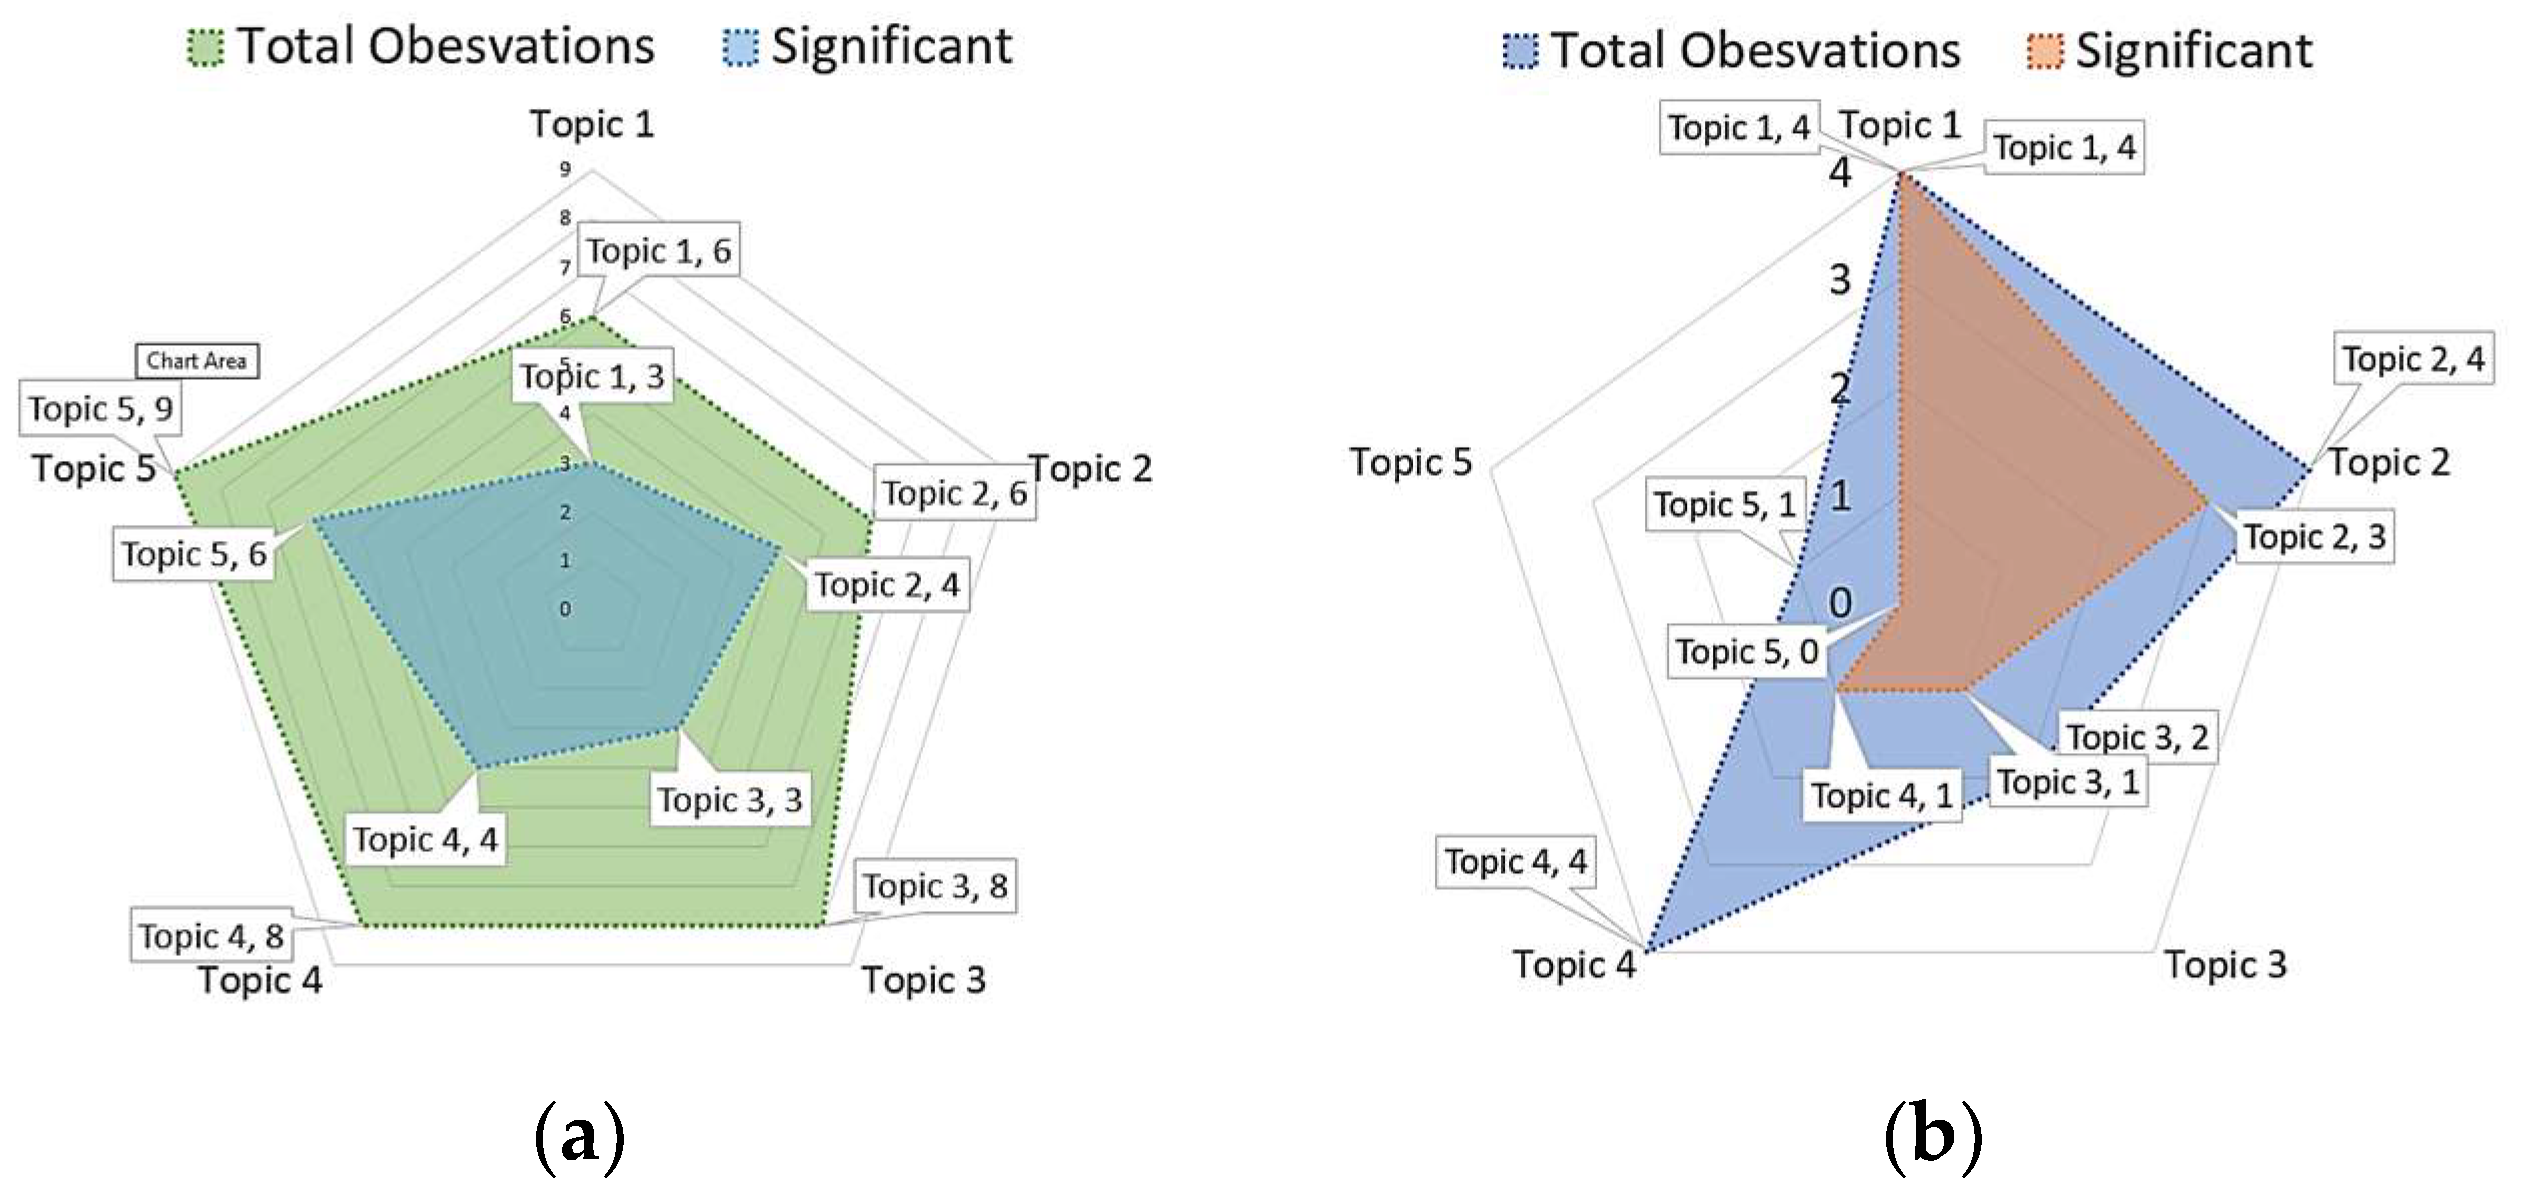
In essence, the methodology described within this paper autonomously generated 37 (six for Topic 1, six for Topic 2, eight for Topic 3, eight for Topic 4, and another nine for Topic 9) with AI-driven regression. On the other hand, AI-driven clustering automatically generated 15 observations (four for Topic 1, four for Topic 2, two for Topic 3, four for Topic 4, and another one for Topic 5). These 52 (as represented with Equations (10)–(61)) AI-driven observations identified the factors that were deemed to be correlated with discussion topics found in COVID-19-related Twitter discourse. In Figure 10, the AI-driven observations (broken down into the total observation and significant observation) are portrayed with radar charts.
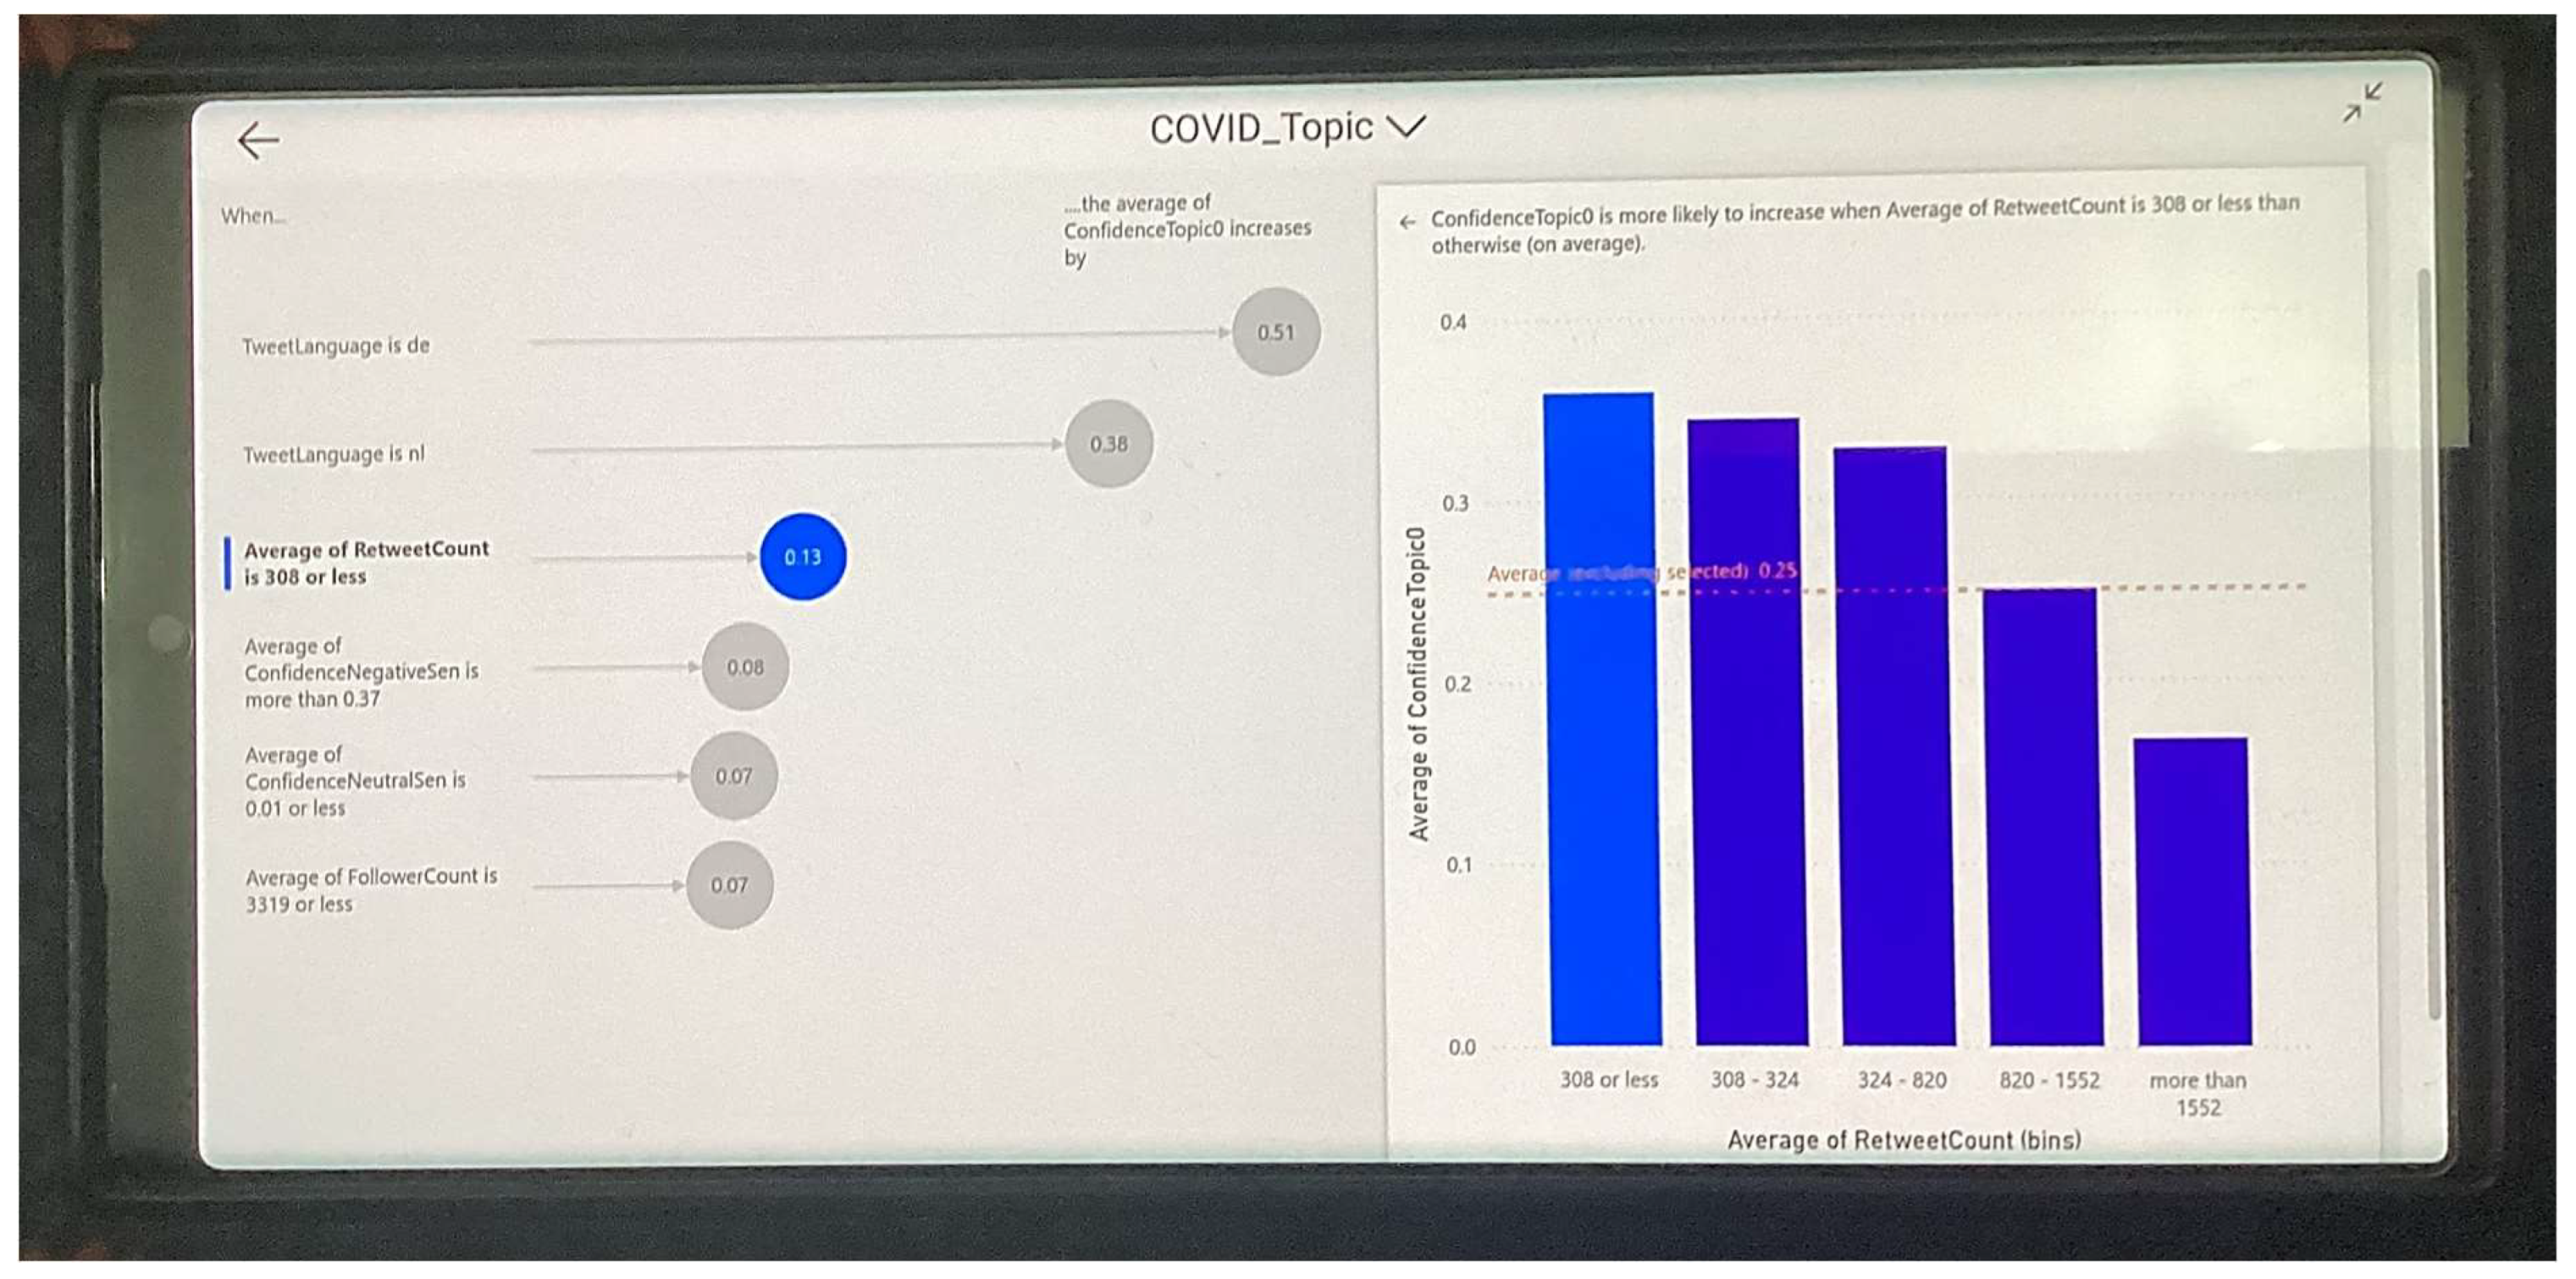
Since the proposed solution is designed to allow decision-makers to make evidence-based decisions on COVID-19-related issues based on Twitter analytics, this was deployed in mobile environments, both in iOS and Android. Figure 11 shows the deployed system in mobile environments, showing the correlation between retweets and the Topic 1 confidence (previously shown with Equation (12)).
With the deployed solution in mobile environments, a strategic decision-maker could be in a remote location, making evidence-based strategic decisions, whilst being completely mobile.
5. Conclusions
Since the emergence of the COVID-19 crisis, scholars and policymakers have adeptly harnessed Twitter as a principal reservoir for the meticulous scrutiny of public sentiments [9,10,11,12,13,14,15,16,17,18,19,20,21,22,23,24,25]. The perspicacious analysis of public sentiment engenders empirically grounded policymaking across a spectrum of COVID-19-related strategic imperatives, including, but not limited to, the imposition of lockdown measures, travel restrictions, vaccination campaigns, and the amelioration of misinformation dissemination. Consequently, the utilization of Twitter-based critical analysis has yielded substantive triumphs in the realm of COVID-19-driven decision making across multifarious dimensions.
However, none of these existing research works investigated the factors that drive COVID-19-based Twitter discourse. The present paper elucidates a systematic and methodological framework, employing artificial intelligence (AI) to autonomously unearth 52 distinct observations. This process, characterized by the utilization of both regression and clustering techniques, systematically unravels the intricate interplay between diverse factors and the topics encapsulating COVID-19 discussions on Twitter. Within this compendium of observations, 37 were ascertained through the AI-driven regression technique, while the AI-based clustering technique yielded an additional 15 observations. Furthermore, 29 of these observations bear considerable significance, denoting their pivotal role in shaping specific discourse themes.
These noteworthy observations discern an array of contributory variables encompassing tweet language, negative sentiment, positive sentiment, neutral sentiment, tweet timestamp, retweet count, friend count, and follower count, which exert discernible influences upon distinct discussion themes. Importantly, it merits emphasis that none of the extant studies on Twitter-based COVID-19 discourse, as indexed in [9,10,11,12,13,14,15,16,17,18,19,20,21,22,23,24,25], have proffered a methodology as innovative as the one advanced herein, integrating AI-powered regression and clustering techniques for the purpose of discerning the determinants of COVID-19-related discussion topics.
Furthermore, this research not only introduces an innovative methodological paradigm but also subjects this framework to rigorous evaluation, encompassing an extensive dataset spanning 645 days, commencing on 15 July 2021, and culminating on 20 April 2023. This dataset encompasses a multitude of multilingual tweets, spanning 58 distinct languages, thereby furnishing strategic decision-makers with a comprehensive toolkit for comprehending the manifold factors that govern the discourse surrounding COVID-19.
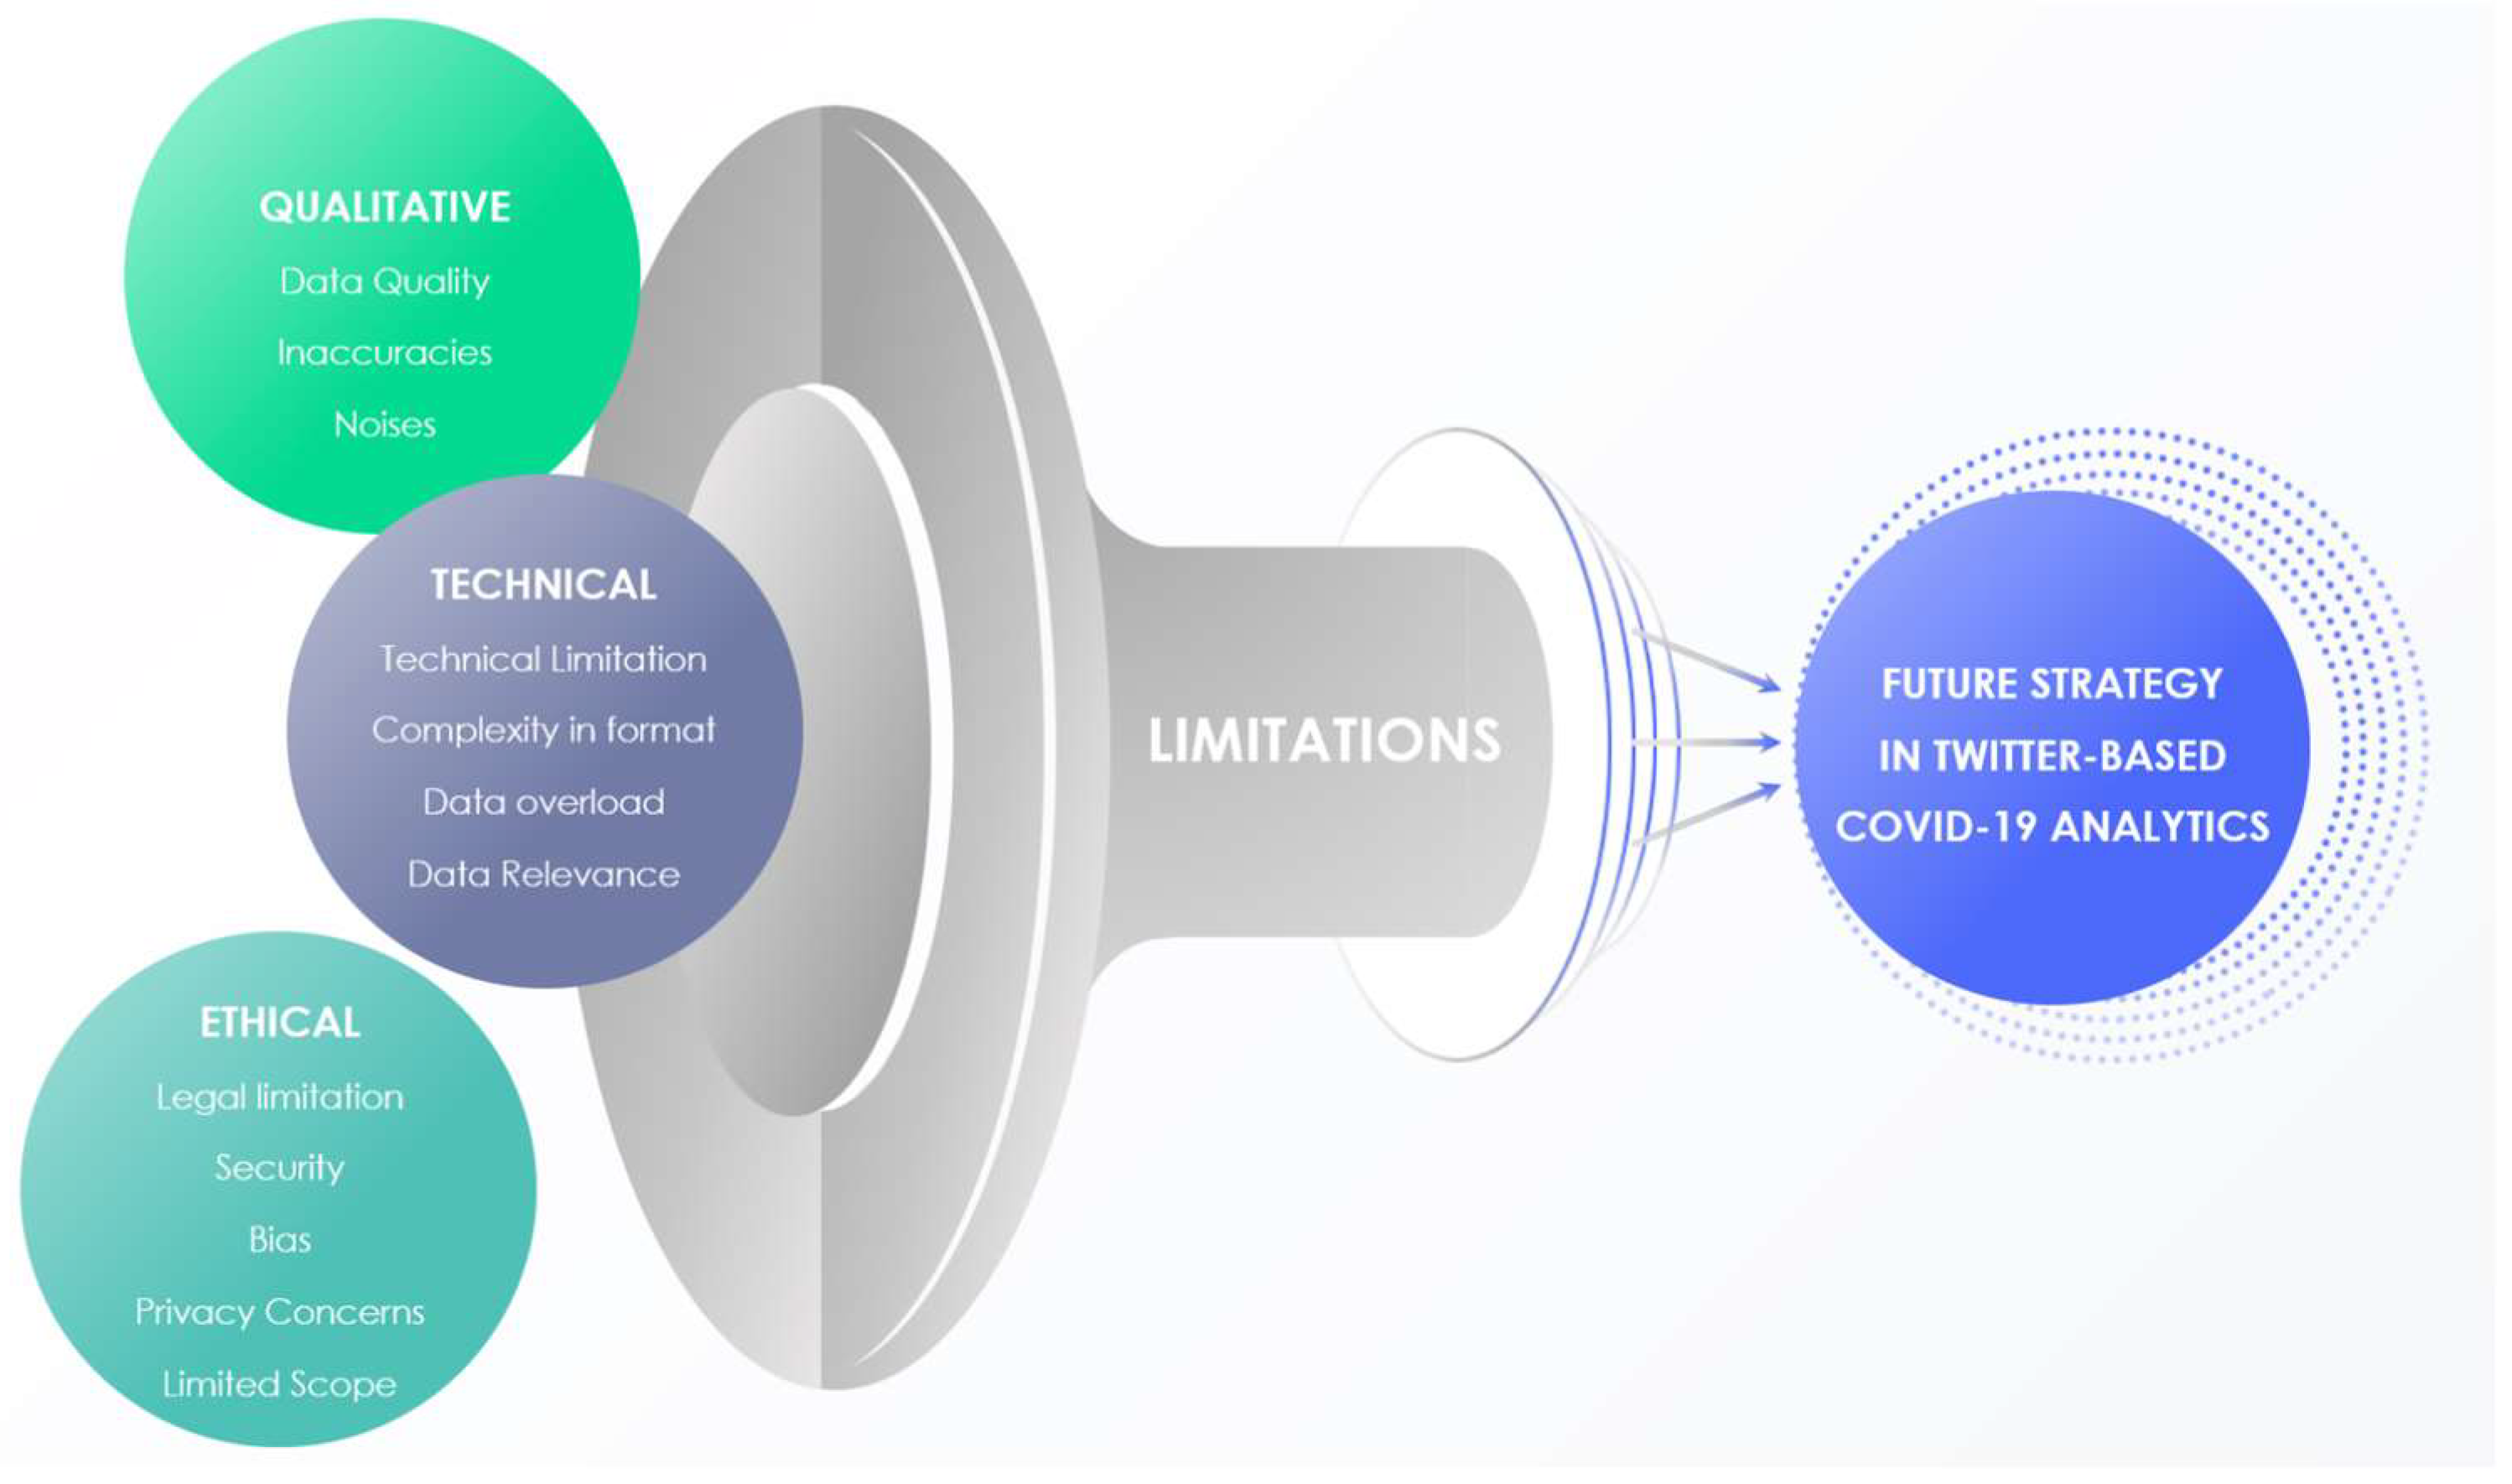
There are technical, qualitative, and ethical limitations of Twitter-based social media analytics, as apparent from [2,4,14]. Twitter has garnered acknowledgment as a fertile environment for the proliferation of disinformation and the dissemination of deceptive content, as noted in the scholarly discourse [49,50]. Within the confines of this specific investigation, a foundational proposition was laid out, positing the veracity of the entire corpus of 152,070 tweets with a cyber-related focus, subjected to scrutiny. Moreover, there are ethical issues pertaining to social media-based intelligence without the explicit permission of the social media users [51,52]. Research works in [51,52] portray ethical concerns in obtaining AI-driven intelligence from closed-network social media platforms like Facebook and LinkedIn. Users of Facebook, LinkedIn, and other closed-network platforms share their content only towards their closed group and do not consent to the intelligence acquisition of their data. In contrast, users of open platforms (like Twitter) are already aware that their contents are publicly available and could be subjected to intelligence acquisition. Consequently, an inherent constraint manifests itself in the shape of an absence of stringent validation protocols systematically applied to the open-source data sourced from the Twitter platform. As shown in Figure 12, the limitations of this work would shape the scope of future research in Twitter-based COVID-19 discourse.
Funding
This research received no external funding.
Data Availability Statement
Data would be provided upon request.
Acknowledgments
Special thanks to the COEUS Institute, Kennebunk, Maine, USA, where the author works as a Chief Technology Officer.
Conflicts of Interest
The author declares no conflict of interest.
References
- World Health Organization. Social Media & COVID-19: A Global Study of Digital Crisis Interaction among Gen Z and Millennials. 2021. Available online: https://www.who.int/news-room/feature-stories/detail/social-media-covid-19-a-global-study-of-digital-crisis-interaction-among-gen-z-and-millennials (accessed on 1 September 2023).
- Sufi, F. A New Social Media-Driven Cyber Threat Intelligence. Electronics 2023, 12, 1242. [Google Scholar] [CrossRef]
- Sufi, F. Algorithms in Low-Code-No-Code for Research Applications: A Practical Review. Algorithms 2023, 16, 108. [Google Scholar] [CrossRef]
- Sufi, F. A New AI-Based Semantic Cyber Intelligence Agent. Future Internet 2023, 15, 231. [Google Scholar] [CrossRef]
- Northwestern. Social Media Contributes to Misinformation about COVID-19. 2020. Available online: https://news.northwestern.edu/stories/2020/09/social-media-contributes-to-misinformation-about-covid-19/ (accessed on 1 September 2023).
- Hussain, A.; Ali, S.; Ahmed, M.; Hussain, S. The Anti-vaccination Movement: A Regression in Modern Medicine. Cureus 2018, 10, e2919. [Google Scholar] [CrossRef]
- Johnson, N.F.; Velásquez, N.; Restrepo, N.J.; Leahy, R.; Gabriel, N.; Oud, S.E.; Zheng, M.; Manrique, P.; Wuchty, S.; Lupu, Y. The online competition between pro- and anti-vaccination views. Nature 2020, 582, 230–233. [Google Scholar] [CrossRef]
- Benecke, O.; DeYoung, S.E. Anti-Vaccine Decision-Making and Measles Resurgence in the United States. Glob. Pediatr. Health 2019, 6, 2333794X19862949. [Google Scholar] [CrossRef]
- Li, C.-Y.; Renda, M.; Yusuf, F.; Geller, J.; Chun, S.A. Public Health Policy Monitoring through Public Perceptions: A Case of COVID-19 Tweet Analysis. Information 2022, 13, 543. [Google Scholar] [CrossRef]
- Gourisaria, M.K.; Chandra, S.; Das, H.; Patra, S.S.; Sahni, M.; Leon-Castro, E.; Singh, V.; Kumar, S. Semantic Analysis and Topic Modelling of Web-Scrapped COVID-19 Tweet Corpora through Data Mining Methodologies. Healthcare 2022, 10, 881. [Google Scholar] [CrossRef]
- Kwok, S.W.H.; Vadde, S.K.; Wang, G. Tweet Topics and Sentiments Relating to COVID-19 Vaccination Among Australian Twitter Users: Machine Learning Analysis. J. Med. Internet Res. 2021, 23, e26953. [Google Scholar] [CrossRef]
- Long, Z.; Alharthi, R.; Saddik, A.E. NeedFull—a Tweet Analysis Platform to Study Human Needs During the COVID-19 Pandemic in New York State. IEEE Access 2020, 8, 136046–136055. [Google Scholar] [CrossRef]
- Sufi, F.K. Automatic identification and explanation of root causes on COVID-19 index anomalies. MethodsX 2023, 10, 101960. [Google Scholar] [CrossRef]
- Sufi, F.K.; Razzak, I.; Khalil, I. Tracking Anti-Vax Social Movement Using AI-Based Social Media Monitoring. IEEE Trans. Technol. Soc. 2022, 3, 290–299. [Google Scholar] [CrossRef]
- Narasamma, V.L.; Sreedevi, M.; Kumar, G.V. Tweet Data Analysis on COVID-19 Outbreak. In Smart Technologies in Data Science and Communication; Lecture Notes in Networks and Systems Book Series (LNNS); Springer: Berlin/Heidelberg, Germany, 2021; Volume 210. [Google Scholar]
- Waheeb, S.A.; Khan, N.A.; Shang, X. Topic Modeling and Sentiment Analysis of Online Education in the COVID-19 Era Using Social Networks Based Datasets. Electronics 2022, 11, 715. [Google Scholar] [CrossRef]
- Storey, V.; O’Leary, D. Text Analysis of Evolving Emotions and Sentiments in COVID-19 Twitter Communication. Cognit. Comput. 2022. epub ahead of print. [Google Scholar] [CrossRef]
- Kabakus, T. A novel COVID-19 sentiment analysis in Turkish based on the combination of convolutional neural network and bidirectional long–short term memory on Twitter. Concurr. Comput. 2022, 34, e6883. Available online: https://api.semanticscholar.org/CorpusID:246851122 (accessed on 3 September 2023). [CrossRef] [PubMed]
- Joloudari, J.H.; Hussain, S.; Nematollahi, A.M.; Bagheri, R.; Fazl, F.; Alizadehsani, R.; Lashgari, R. BERT-deep CNN: State of the art for sentiment analysis of COVID-19 tweets. Soc. Netw. Anal. Min. 2022, 13, 99. [Google Scholar] [CrossRef]
- Mir, A.A.; Sevukan, R. Sentiment analysis of Indian Tweets about Covid-19 vaccines. J. Inf. Sci. 2022. epub ahead of print. [Google Scholar]
- Sufi, F.; Alsulami, M. Identifying drivers of COVID-19 vaccine sentiments for effective vaccination policy. Heliyon 2023, 9, e19195. [Google Scholar] [CrossRef]
- Lee, E.W.J.; Zheng, H.; Goh, D.H.-L.; Lee, C.S.; Theng, Y.L. Examining COVID-19 Tweet Diffusion Using an Integrated Social Amplification of Risk and Issue-Attention Cycle Framework. Health Commun. 2022. epub ahead of print. [Google Scholar] [CrossRef]
- Lanier, H.D.; Diaz, M.I.; Saleh, S.N.; Lehmann, C.U.; Medford, R.J. Analyzing COVID-19 disinformation on Twitter using the hashtags #scamdemic and #plandemic: Retrospective study. PLoS ONE 2022, 17, e0268409. [Google Scholar]
- Slavik, C.E.; Buttle, C.; Sturrock, S.L.; Darlington, J.C.; Yiannakoulias, N. Examining Tweet Content and Engagement of Canadian Public Health Agencies and Decision Makers During COVID-19: Mixed Methods Analysis. J. Med. Internet Res. 2021, 23, e24883. [Google Scholar] [CrossRef] [PubMed]
- Bijoy, B.S.; Saba, S.J.; Sarkar, S.; Islam, M.S.; Islam, S.R.; Amin, M.R.; Karmaker, S. COVID19α: Interactive Spatio-Temporal Visualization of COVID-19 Symptoms through Tweet Analysis. In Proceedings of the IUI ‘21 Companion: 26th International Conference on Intelligent User Interfaces—Companion, College Station, TX, USA, 14–17 April 2021. [Google Scholar]
- Shin, H.-S.; Kwon, H.-Y.; Seung-Jin, R. A New Text Classification Model Based on Contrastive Word Embedding for Detecting Cybersecurity Intelligence in Twitter. Electronics 2020, 9, 1527. [Google Scholar] [CrossRef]
- Zhao, J.; Yan, Q.; Li, J.; Shao, M.; He, Z.; Li, B. TIMiner: Automatically extracting and analyzing categorized cyber threat intelligence from social data. Comput. Secur. 2020, 95, 101867–101874. [Google Scholar] [CrossRef]
- Schellekens, J. Release the bots of war: Social media and Artificial Intelligence as international cyber attack. Przegląd Eur. 2021, 4, 163–179. [Google Scholar] [CrossRef]
- Sun, N.; Zhang, J.; Gao, S.; Zhang, L.Y.; Camtepe, S.; Xiang, Y. Data Analytics of Crowdsourced Resources for Cybersecurity Intelligence. In Network and System Security, Proceedings of the 14th International Conference: NSS 2020, Melbourne, VIC, Australia, 25–27 November 2020; Lecture Notes in Computer Science (including subseries Lecture Notes in Artificial Intelligence and Lecture Notes in Bioinformatics); Springer: Berlin/Heidelberg, Germany, 2020; Volume 12570, pp. 3–21. [Google Scholar]
- Subroto, A.; Apriyana, A. Cyber risk prediction through social media big data analytics and statistical machine learning. J. Big Data 2019, 6, 1–19. [Google Scholar] [CrossRef]
- Hee, V.; Jacobs, G.; Emmery, C.; Desmet, B.; Lefever, E.; Verhoeven, B.; De Pauw, G.; Daelemans, W.; Hoste, V. Automatic Detection of Cyberbullying in Social Media Text. PLoS ONE 2018, 13, e0203794. [Google Scholar]
- Shu, K.; Sliva, A.; Sampson, J.; Liu, H. Understanding Cyber Attack Behaviors with Sentiment Information on Social Media. In Social, Cultural, and Behavioral Modeling, Proceedings of the 11th International Conference: SBP-BRiMS 2018, Washington, DC, USA, 10–13 July 2018; Lecture Notes in Computer Science (including subseries Lecture Notes in Artificial Intelligence and Lecture Notes in Bioinformatics); Springer: Berlin/Heidelberg, Germany, 2018; Volume 10899, pp. 377–388. [Google Scholar]
- Alves, F.; Bettini, A.; Ferreira, P.M.; Bessani, A. Processing tweets for cybersecurity threat awareness. Inf. Syst. 2021, 95, 101586. [Google Scholar] [CrossRef]
- Microsoft Documentation. Text Analytics: A Collection of Features from AI Language that Extract, Classify, and Understand Text within Documents. 2023. Available online: https://azure.microsoft.com/en-us/products/ai-services/text-analytics (accessed on 6 August 2023).
- Pang, B.; Lee, L.; Vaithyanathan, S. Thumbs up? Sentiment classification using machine learning techniques. In Proceedings of the 2002 Conference on Empirical Methods in Natural Language Processing (EMNLP 2002), Philadelphia, PA, USA, 6–7 July 2002. [Google Scholar]
- Turney, P.D. Thumbs up or thumbs down? Semantic orientation applied. In Proceedings of the 40th Annual Meeting of the Association for Computational Linguistics, Philadelphia, PA, USA, 6–12 July 2002. [Google Scholar]
- Naseem, U.; Razzak, I.; Khushi, M.; Eklund, P.W.; Kim, J. COVIDSenti: A Large-Scale Benchmark Twitter. IEEE Trans. Comput. Soc. Syst. 2020, 8, 1003–1015. [Google Scholar] [CrossRef]
- Li, L.; Zhang, Q.; Wang, X.; Zhang, J. Characterizing the Propagation of Situational Information in Social Media During COVID-19 Epidemic: A Case Study on Weibo. IEEE Trans. Comput. Soc. Syst. 2020, 7, 556–562. [Google Scholar] [CrossRef]
- Cameron, D.; Smith, G.A.; Daniulaityte, R.; Sheth, A.P.; Dave, D.; Chen, L.; Anand, G.; Carlson, R.; Watkins, K.Z.; Falck, R. PREDOSE: A Semantic Web Platform for Drug Abuse Epidemiology using Social Media. J. Biomed. Inform. 2013, 46, 985–997. [Google Scholar] [CrossRef]
- Chen, X.; Faviez, C.; Schuck, S.; Lillo-Le-Louët, A.; Texier, N.; Dahamna, B.; Huot, C.; Foulquié, P.; Pereira, S.; Leroux, V.; et al. Mining Patients’ Narratives in Social Media for Pharmacovigilance: Adverse Effects and Misuse of Methylphenidate. Front. Pharmacol. 2018, 9, 541. [Google Scholar] [CrossRef] [PubMed]
- McNaughton, E.C.; Black, R.A.; Zulueta, M.G.; Budman, S.H.; Butler, S.F. Measuring online endorsement of prescription opioids abuse: An integrative methodology. Pharmacoepidemiol. Drug Saf. 2012, 21, 1081–1092. [Google Scholar] [CrossRef]
- Al-Twairesh, N.; Al-Negheimish, H. Surface and Deep Features Ensemble for Sentiment Analysis of Arabic Tweets. IEEE Access 2019, 7, 84122–84131. [Google Scholar] [CrossRef]
- Vashisht, G.; Sinha, Y.N. Sentimental study of CAA by location-based tweets. Int. J. Inf. Technol. 2021, 13, 1555–1567. [Google Scholar] [CrossRef] [PubMed]
- Ebrahimi; Yazdavar, H.; Sheth, A. Challenges of Sentiment Analysis for Dynamic Events. IEEE Intell. Syst. 2017, 32, 70–75. [Google Scholar] [CrossRef]
- Yu, H.-F.; Hsieh, C.-J.; Chang, K.-W.; Lin, C.-J. Large Linear Classification When Data Cannot Fit in Memory. In Proceedings of the KDD ‘10: Proceedings of the 16th ACM SIGKDD international conference on Knowledge discovery and Data Mining, Washington, DC, USA, 25–28 July 2010. [Google Scholar]
- Matthies, H.; Strang, G. The solution of non linear finite element equations. Int. J. Numer. Methods Eng. 1979, 14, 1613–1626. [Google Scholar] [CrossRef]
- Nocedal, J. Updating Quasi-Newton Matrices with Limited Storage. Math. Comput. 1980, 35, 773–782. [Google Scholar] [CrossRef]
- Microsoft Documentation. Choosing a Natural Language Processing Technology in Azure. 2020. Available online: https://docs.microsoft.com/en-us/azure/architecture/data-guide/technology-choices/natural-language-processing (accessed on 3 September 2023).
- Gurajala, S.; White, J.S.; Hudson, B.; Voter, B.R.; Matthews, J.N. Profile characteristics of fake Twitter accounts. Big Data Soc. 2016, 3, 2053951716674236. [Google Scholar] [CrossRef]
- Ajao, O.; Bhowmik, D.; Zargari, S. Fake News Identification on Twitter with Hybrid CNN and RNN Models. In Proceedings of the 9th International Conference on Social Media and Society, Copenhagen, Denmark, 18–20 July 2018. [Google Scholar]
- Golder, S.; Ahmed, S.; Norman, G.; Booth, A. Attitudes Toward the Ethics of Research Using Social Media: A Systematic Review. J. Med. Internet Res. 2017, 19, e195. [Google Scholar] [CrossRef]
- Mikal, J.; Hurst, S.; Conway, M. Ethical issues in using Twitter for population-level depression monitoring: A qualitative study. BMC Med. Ethics 2016, 17, 22. [Google Scholar] [CrossRef] [PubMed]
Figure 1.
Conceptual diagram of the proposed system (factors 5 to 10 are NLP-based).

Figure 2.
The process of analysing the correlated factors of COVID-19-related Twitter Topics.

Figure 3.
Detailed process map of the proposed system.

Figure 4.
Word Cloud for each of the analysed topics. (a) Topic 1 with 50,420 tweets (mostly German). (b) Topic 2 with 43,060 tweets (mostly English). (c) Topic 3 with 17,618 tweets (mostly Spanish). (d) Topic 4 with 30,470 tweets (mostly English). (e) Topic 5 with 10,502 tweets (mostly English). (f) All Topics with 152,070 tweets (mostly English).


Figure 5.
Identifying the correlated factors for Topic 1—broad discussion on corona. (a) Identifying 6 correlations with regression. (b) Identifying 4 correlations with clustering.
Figure 5.
Identifying the correlated factors for Topic 1—broad discussion on corona. (a) Identifying 6 correlations with regression. (b) Identifying 4 correlations with clustering.

Figure 6.
Identifying the correlated factors for Topic 2—COVID statistics and vaccination. (a) Identifying 6 correlations with regression. (b) Identifying 4 correlations with clustering.
Figure 6.
Identifying the correlated factors for Topic 2—COVID statistics and vaccination. (a) Identifying 6 correlations with regression. (b) Identifying 4 correlations with clustering.

Figure 7.
Identifying the correlated factors for Topic 3—wordplay on ‘Corona’. (a) Identifying 8 correlations with regression. (b) Identifying 2 correlations with clustering.
Figure 7.
Identifying the correlated factors for Topic 3—wordplay on ‘Corona’. (a) Identifying 8 correlations with regression. (b) Identifying 2 correlations with clustering.

Figure 8.
Identifying the correlated factors for Topic 4—COVID experiences or updates. (a) Identifying 8 correlations with regression. (b) Identifying 4 correlations with clustering.
Figure 8.
Identifying the correlated factors for Topic 4—COVID experiences or updates. (a) Identifying 8 correlations with regression. (b) Identifying 4 correlations with clustering.

Figure 9.
Identifying the correlated factors for Topic 5—Likely context of COVID in India. (a) Identifying 6 correlations with regression. (b) Identifying 1 correlation with clustering.
Figure 9.
Identifying the correlated factors for Topic 5—Likely context of COVID in India. (a) Identifying 6 correlations with regression. (b) Identifying 1 correlation with clustering.

Figure 10.
Total observations vs. significant observations for regression and cluster analysis. (a) Results of regression. (b) Results of clustering.
Figure 10.
Total observations vs. significant observations for regression and cluster analysis. (a) Results of regression. (b) Results of clustering.

Figure 11.
The proposed solution deployed on a Samsung Galaxy S23 Ultra Mobile running Android version 13.
Figure 11.
The proposed solution deployed on a Samsung Galaxy S23 Ultra Mobile running Android version 13.

Figure 12.
Limitations of the Twitter-based analysis of COVID-19 discourse.


Table 1.
Literature review on COVID-19-based Twitter analytics.
| Reference | Multilingual | Global | Sentiment Analysis | Topic Analysis | Identifying Factors of Topic |
|---|---|---|---|---|---|
| [9] | No | No | Yes | No | No |
| [23] | No | No | Yes | Yes | No |
| [10] | No | No | Yes | Yes | No |
| [11] | No | No | Yes | Yes | No |
| [22] | No | Yes | No | Yes | No |
| [12] | No | No | Yes | No | No |
| [13] | Yes | Yes | Yes | No | No |
| [24] | No | No | No | No | No |
| [25] | No | No | No | No | No |
| [14] | Yes | Yes | Yes | No | No |
| [15] | No | Yes | Yes | No | No |
| [16] | No | Yes | Yes | Yes | No |
| [17] | No | Yes | Yes | No | No |
| [18] | No | No | Yes | No | No |
| [19] | No | Yes | Yes | No | No |
| [20] | No | No | Yes | Yes | No |
| [21] | Yes | Yes | Yes | No | No |
| This Study | Yes | Yes | Yes | Yes | Yes |
Table 2.
Lifecycle of attributes/factors (processes that create or use the attributes).
| Attribute Created by | Data Object/Attribute Name | Attribute Used by |
|---|---|---|
| Obtain Tweets | Multi-Lingual Tweets | Sentiment Analysis |
| Obtain Tweets | Tweet Time | Clustering, Logistic Regression, Explainable AI |
| Obtain Tweets | Followers | Clustering, Logistic Regression, Explainable AI |
| Obtain Tweets | Retweets | Clustering, Logistic Regression, Explainable AI |
| Translate | English Translated Tweets | Sentiment Analysis |
| Language Detection | Language Name | Clustering, Logistic Regression, Explainable AI |
| Sentiment Analysis | Sentiment | Clustering, Logistic Regression, Explainable AI |
| Sentiment Analysis | Positive Sentiment Confidence | Clustering, Logistic Regression, Explainable AI |
| Sentiment Analysis | Neutral Sentiment Confidence | Clustering, Logistic Regression, Explainable AI |
| Sentiment Analysis | Negative Sentiment Confidence | Clustering, Logistic Regression, Explainable AI |
| Topic Analysis | Predicted Topic | Clustering, Logistic Regression, Explainable AI |
| Topic Analysis | Topic 1 Confidence | Clustering, Logistic Regression, Explainable AI |
| Topic Analysis | Topic 2 Confidence | Clustering, Logistic Regression, Explainable AI |
| Topic Analysis | Topic 3 Confidence | Clustering, Logistic Regression, Explainable AI |
| Topic Analysis | Topic 4 Confidence | Clustering, Logistic Regression, Explainable AI |
| Topic Analysis | Topic 5 Confidence | Clustering, Logistic Regression, Explainable AI |
| Explainable AI | Explanations | Interactive UI |
Table 3.
Description of notations.
| Notation | Description |
|---|---|
| T | Extracted tweets as the output of ExtractTweetsContainingKeywords(“COVID”, “CORONA”) |
| m | Date and time of tweet as the output of ExtractTweetsContainingKeywords(“COVID”, “CORONA”) |
| f | Follower count as the output of ExtractTweetsContainingKeywords(“COVID”, “CORONA”) |
| d | Friend count as the output of ExtractTweetsContainingKeywords(“COVID”, “CORONA”) |
| r | Retweet count as the output of ExtractTweetsContainingKeywords(“COVID”, “CORONA”) |
| l | Tweet language as detected using DetectLanguage(Tweet) |
| s | Detected sentiment as the output of SentimentAnalysis(tweet) |
| p | Positive sentiment confidence as the output of SentimentAnalysis(tweet) |
| n | Negative sentiment confidence as the output of SentimentAnalysis(tweet) |
| u | Neutral sentiment confidence as the output of SentimentAnalysis(tweet) |
| Topic | Topic ID as the output of PerformLDATopicAnalysis(T_EN) |
| c1 | Topic 1 confidence as the output of PerformLDATopicAnalysis(T_EN) |
| c2 | Topic 2 confidence as the output of PerformLDATopicAnalysis(T_EN) |
| c3 | Topic 3 confidence as the output of PerformLDATopicAnalysis(T_EN) |
| c4 | Topic 4 confidence as the output of PerformLDATopicAnalysis(T_EN) |
| c5 | Topic 5 confidence as the output of PerformLDATopicAnalysis(T_EN) |
Table 4.
Word weights across each of the five topics.
| Topic 1: Broad Discussion on Corona | Topic 2: COVID Statistics and Vaccination | Topic 3: Wordplay on ‘Corona’ | Topic 4: COVID Experiences/Updates | Topic 5: Likely Context of COVID in India | |||||
|---|---|---|---|---|---|---|---|---|---|
| Word | Weight | Word | Weight | Word | Weight | Word | Weight | Word | Weight |
| Corona | 19287 | COVID | 18257 | crown | 4871 | COVID | 9946 | Corona | 2560 |
| corona | 13595 | COVID | 15042 | Corona | 3743 | COVID | 6148 | corona | 2504 |
| people | 5770 | vaccine | 5295 | Crown | 1242 | COVID | 4899 | COVID | 932 |
| vaccination | 3255 | COVID | 4110 | https://t.co | 1161 | get | 3212 | CORONA | 710 |
| also | 3173 | cases | 3552 | Corona_Futbol | 582 | people | 3048 | https://t.co | 609 |
| measures | 2845 | people | 3413 | first | 517 | corona | 2811 | India | 589 |
| would | 2428 | deaths | 3404 | crowned | 495 | days | 2779 | hai | 533 |
| like | 2406 | new | 3379 | City | 490 | like | 2471 | amp | 446 |
| one | 2256 | vaccines | 2953 | today | 456 | got | 2250 | exam | 319 |
| many | 2241 | https://t.co | 2129 | going | 444 | died | 2134 | narendramodi | 290 |
Table 5.
Most used Tweet languages for each of the topics.
| Top 5 Ranks | All | Topic 1 | Topic 2 | Topic 3 | Topic 4 | Topic 5 | ||||||
|---|---|---|---|---|---|---|---|---|---|---|---|---|
| Language | Tweets | Language | Tweets | Language | Tweets | Language | Tweets | Language | Tweets | Language | Tweets | |
| 1 | English | 60,855 | German | 25,477 | English | 27,050 | Spanish | 10,811 | English | 18,102 | English | 4717 |
| 2 | German | 30,212 | English | 8129 | Spanish | 3697 | English | 2857 | Spanish | 3863 | Hindi | 1212 |
| 3 | Spanish | 22,226 | Dutch | 5827 | French | 2713 | Japanese | 810 | Portuguese | 1806 | Spanish | 856 |
| 4 | Dutch | 7419 | Spanish | 2999 | German | 2147 | German | 523 | German | 1609 | In | 755 |
| 5 | French | 5748 | French | 1839 | Portuguese | 1613 | Portuguese | 418 | French | 860 | Unidentified | 647 |
Table 6.
Details of NLP analysis for each of the predicted topics.
| Prediction Topic | Count of TwitterID | Average Confidence-Negative Sentiment | Average Confidence-Neutral Sentiment | Average Confidence-Positive Sentiment | Average Follower Count | Average Friend Count | Average Retweet Count | Count of Tweet Language |
|---|---|---|---|---|---|---|---|---|
| Topic 1 | 50420 | 0.559371 | 0.293209 | 0.147265 | 5646.66 | 1154.27 | 350.71 | 51 |
| Topic 2 | 43060 | 0.539859 | 0.369295 | 0.090684 | 20447.33 | 1653.85 | 961.3 | 54 |
| Topic 3 | 17618 | 0.275259 | 0.485657 | 0.238882 | 17776.81 | 1265.74 | 314.4 | 43 |
| Topic 4 | 30470 | 0.54395 | 0.252615 | 0.203355 | 3606.61 | 1346.51 | 1323.62 | 49 |
| Topic 5 | 10502 | 0.318199 | 0.521049 | 0.160704 | 21259.78 | 1045.63 | 438.74 | 52 |
Table 7.
Fifteen observations found with AI-driven clustering (9 significant observations highlighted in red).
Table 7.
Fifteen observations found with AI-driven clustering (9 significant observations highlighted in red).
| Cluster Characteristics | Cluster 1 | Cluster 2 | Cluster 3 | Cluster 4 |
|---|---|---|---|---|
| Avg. Topic 1 Confidence | 0.77 | 0.76 | 0.72 | 0.41 |
| Population Count | 7426 | 10,678 | 12,108 | 20,351 |
| Avg. Topic 2 Confidence | 0.59 | 0.48 | 0.47 | 0.38 |
| Population Count | 8760 | 11,574 | 12,573 | 10,995 |
| Avg. Topic 3 Confidence | 0.49 | 0.29 | - | - |
| Population Count | 13,033 | 9193 | - | - |
| Avg. Topic 4 Confidence | 0.42 | 0.32 | 0.32 | 0.28 |
| Population Count | 8279 | 10,395 | 10,443 | 13,471 |
| Avg. Topic 5 Confidence | 0.16 | - | - | - |
| Population Count | 10,077 | - | - | - |
Disclaimer/Publisher’s Note: The statements, opinions and data contained in all publications are solely those of the individual author(s) and contributor(s) and not of MDPI and/or the editor(s). MDPI and/or the editor(s) disclaim responsibility for any injury to people or property resulting from any ideas, methods, instructions or products referred to in the content. |
© 2023 by the author. Licensee MDPI, Basel, Switzerland. This article is an open access article distributed under the terms and conditions of the Creative Commons Attribution (CC BY) license (https://creativecommons.org/licenses/by/4.0/).
Share and Cite
MDPI and ACS Style
Sufi, F. A New Social Media Analytics Method for Identifying Factors Contributing to COVID-19 Discussion Topics. Information 2023, 14, 545. https://doi.org/10.3390/info14100545
AMA Style
Sufi F. A New Social Media Analytics Method for Identifying Factors Contributing to COVID-19 Discussion Topics. Information. 2023; 14(10):545. https://doi.org/10.3390/info14100545
Chicago/Turabian StyleSufi, Fahim. 2023. "A New Social Media Analytics Method for Identifying Factors Contributing to COVID-19 Discussion Topics" Information 14, no. 10: 545. https://doi.org/10.3390/info14100545
Note that from the first issue of 2016, this journal uses article numbers instead of page numbers. See further details here.