


Development of a Simplified Performance Monitoring System for Small and Medium Sized Ships


Abstract
:1. Introduction
1.1. Background
1.2. Literature Review
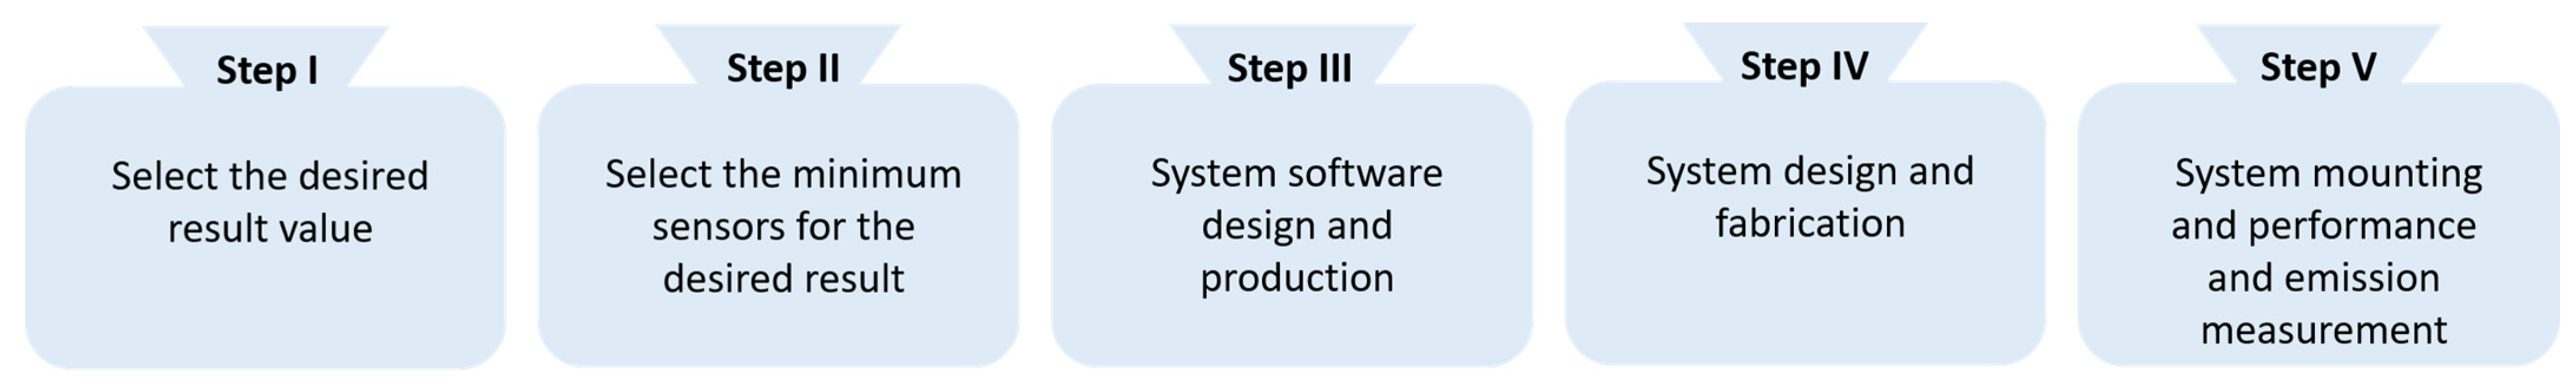
2. Methodology
3. Results
3.1. The Desired Values
3.2. Minimum Sensor Selection for the Desired Results
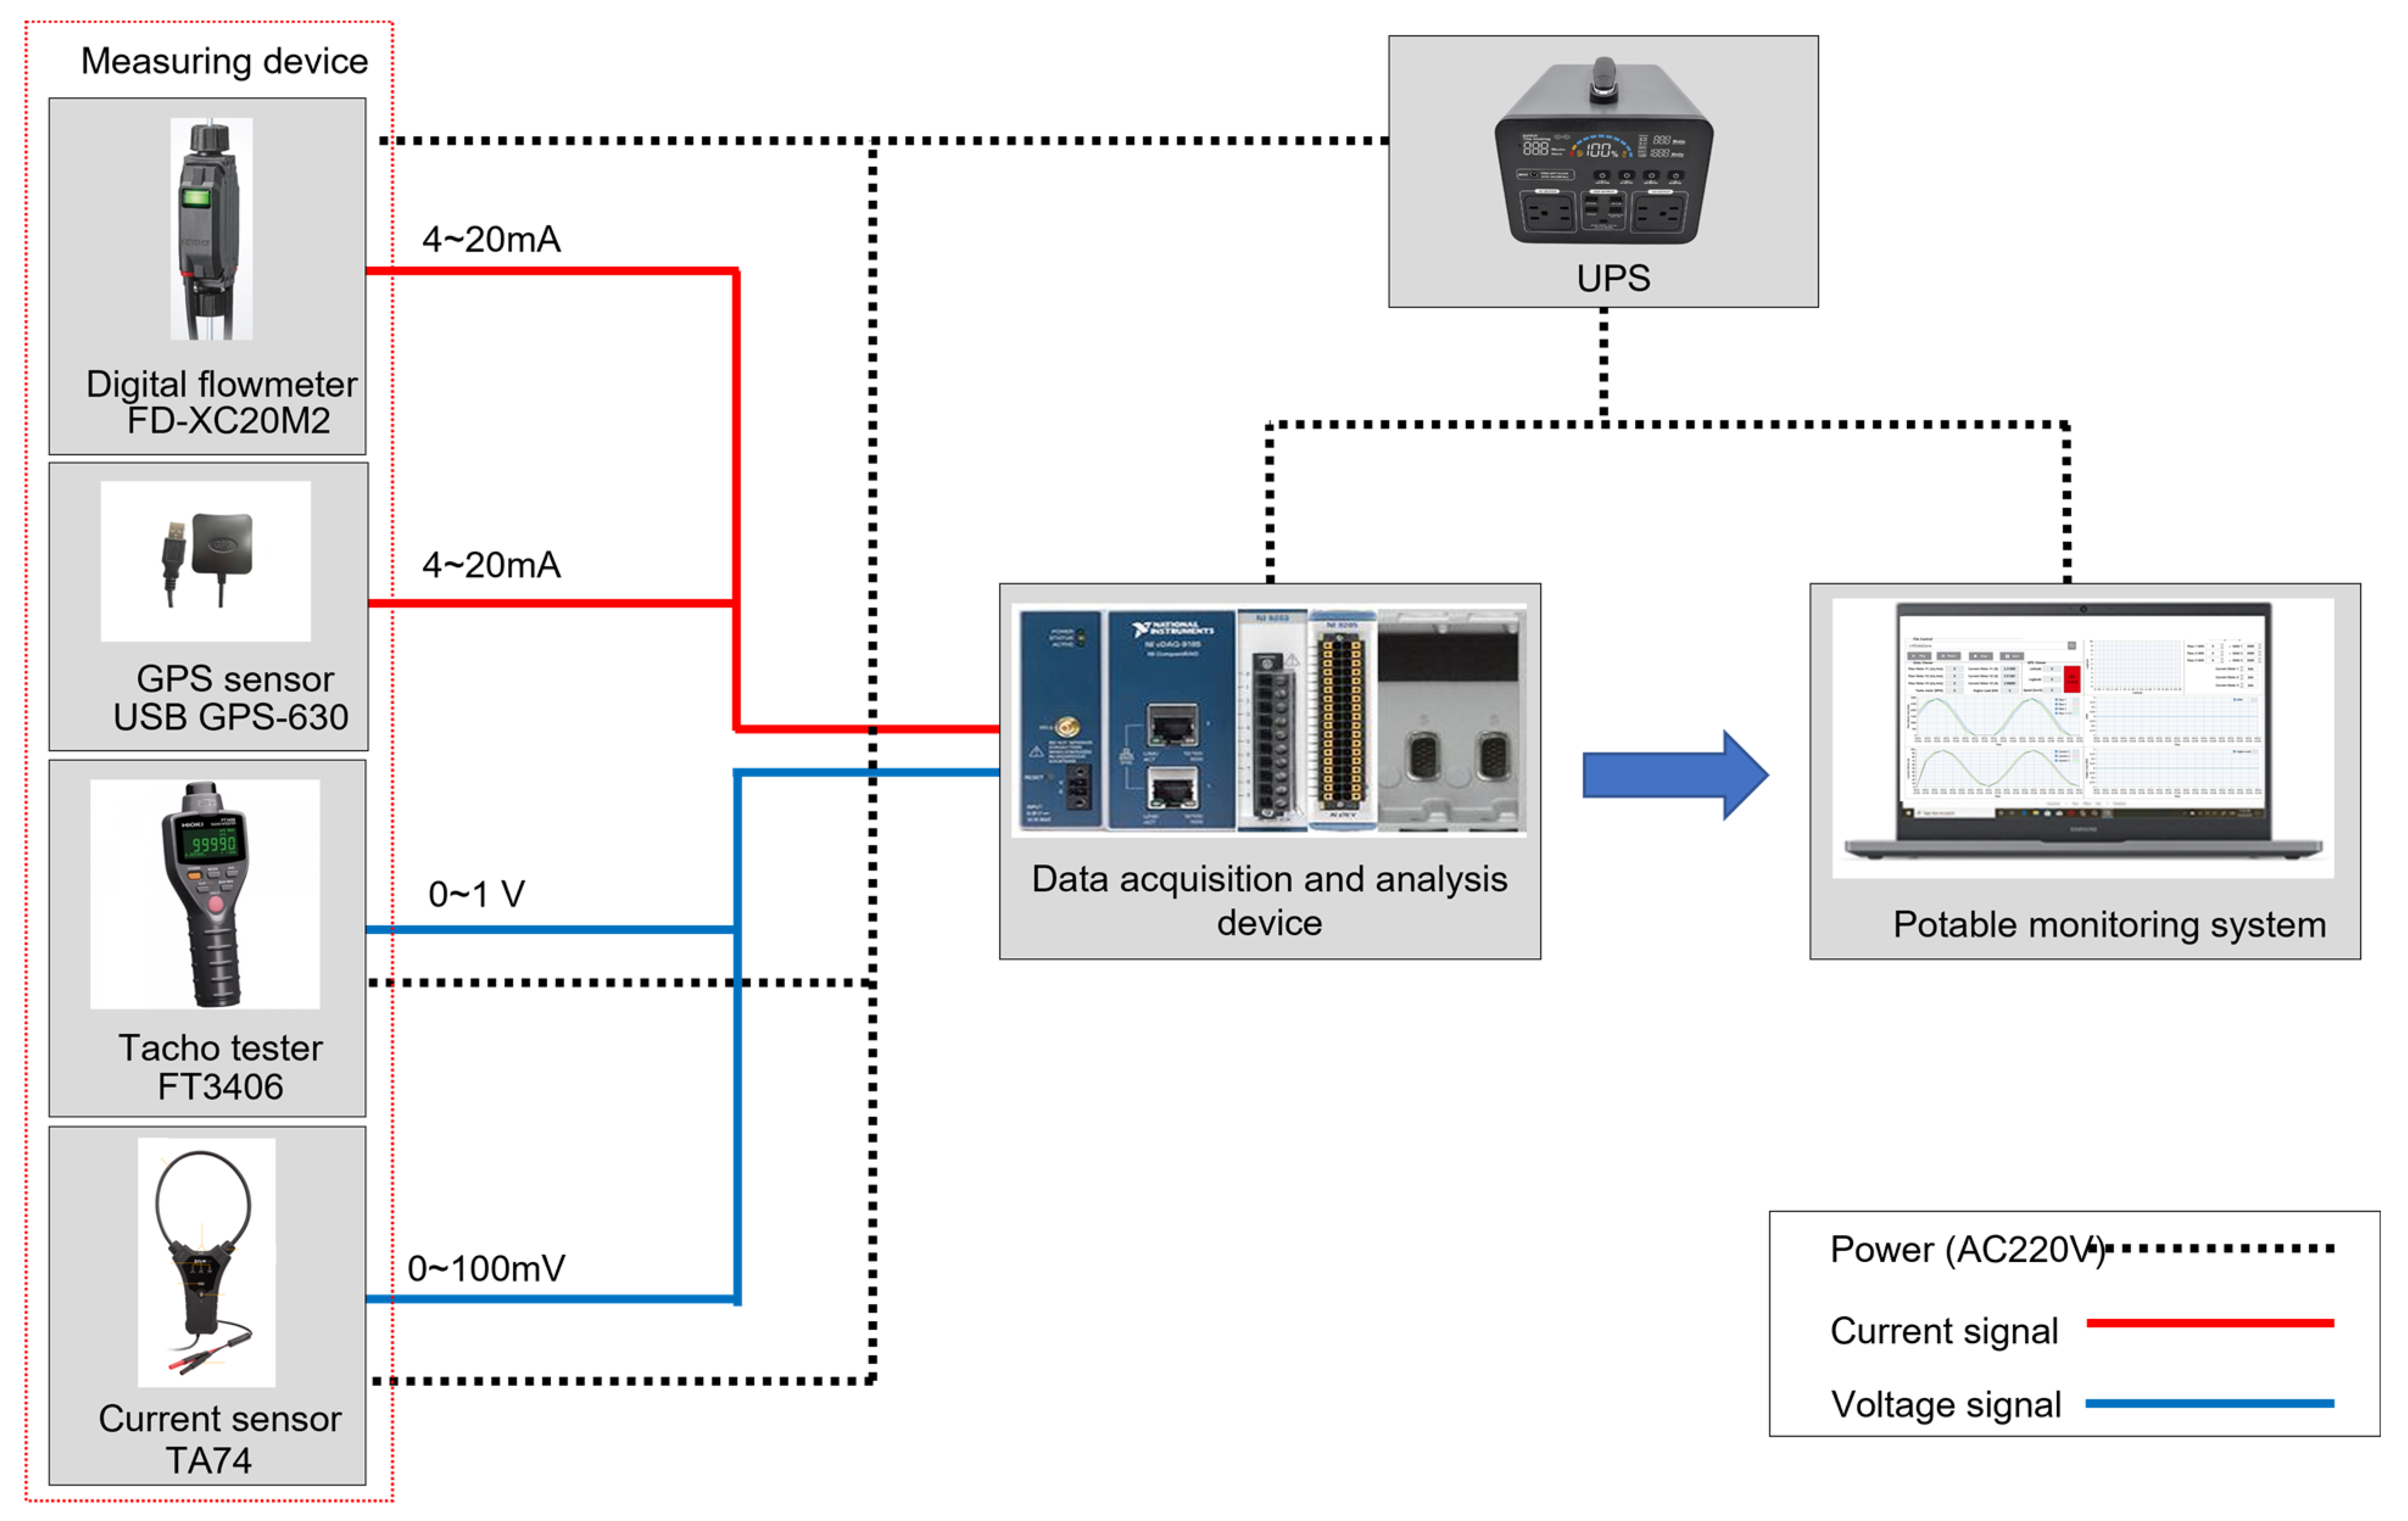
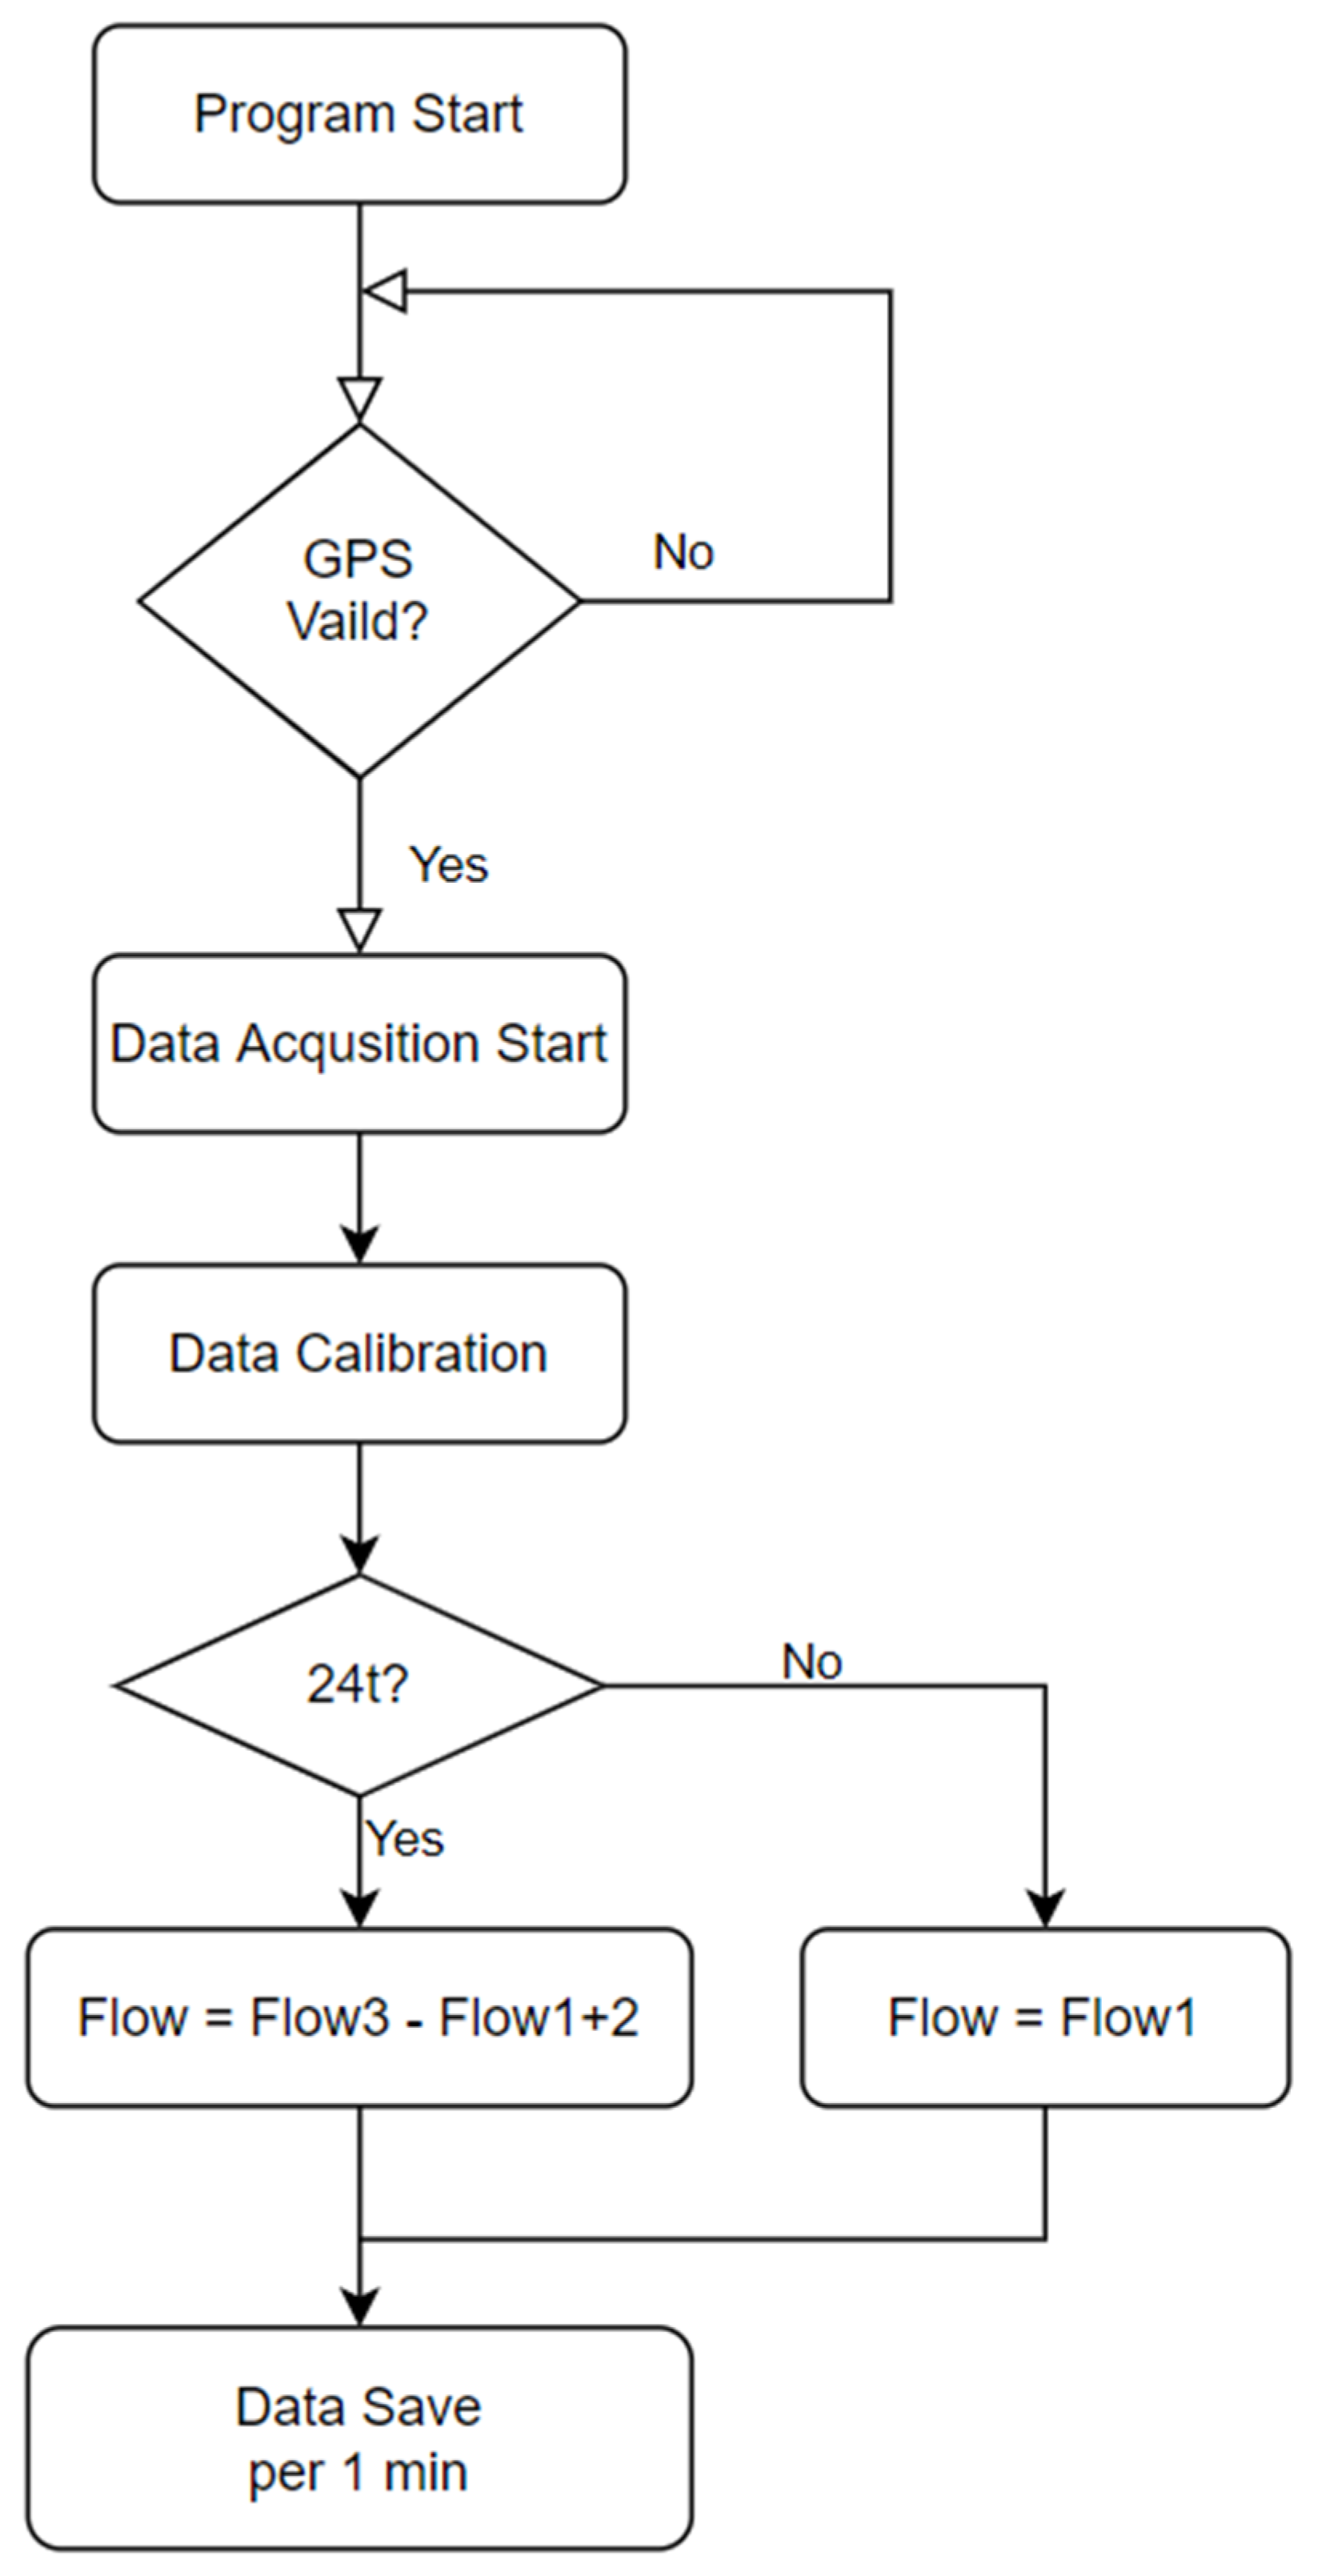
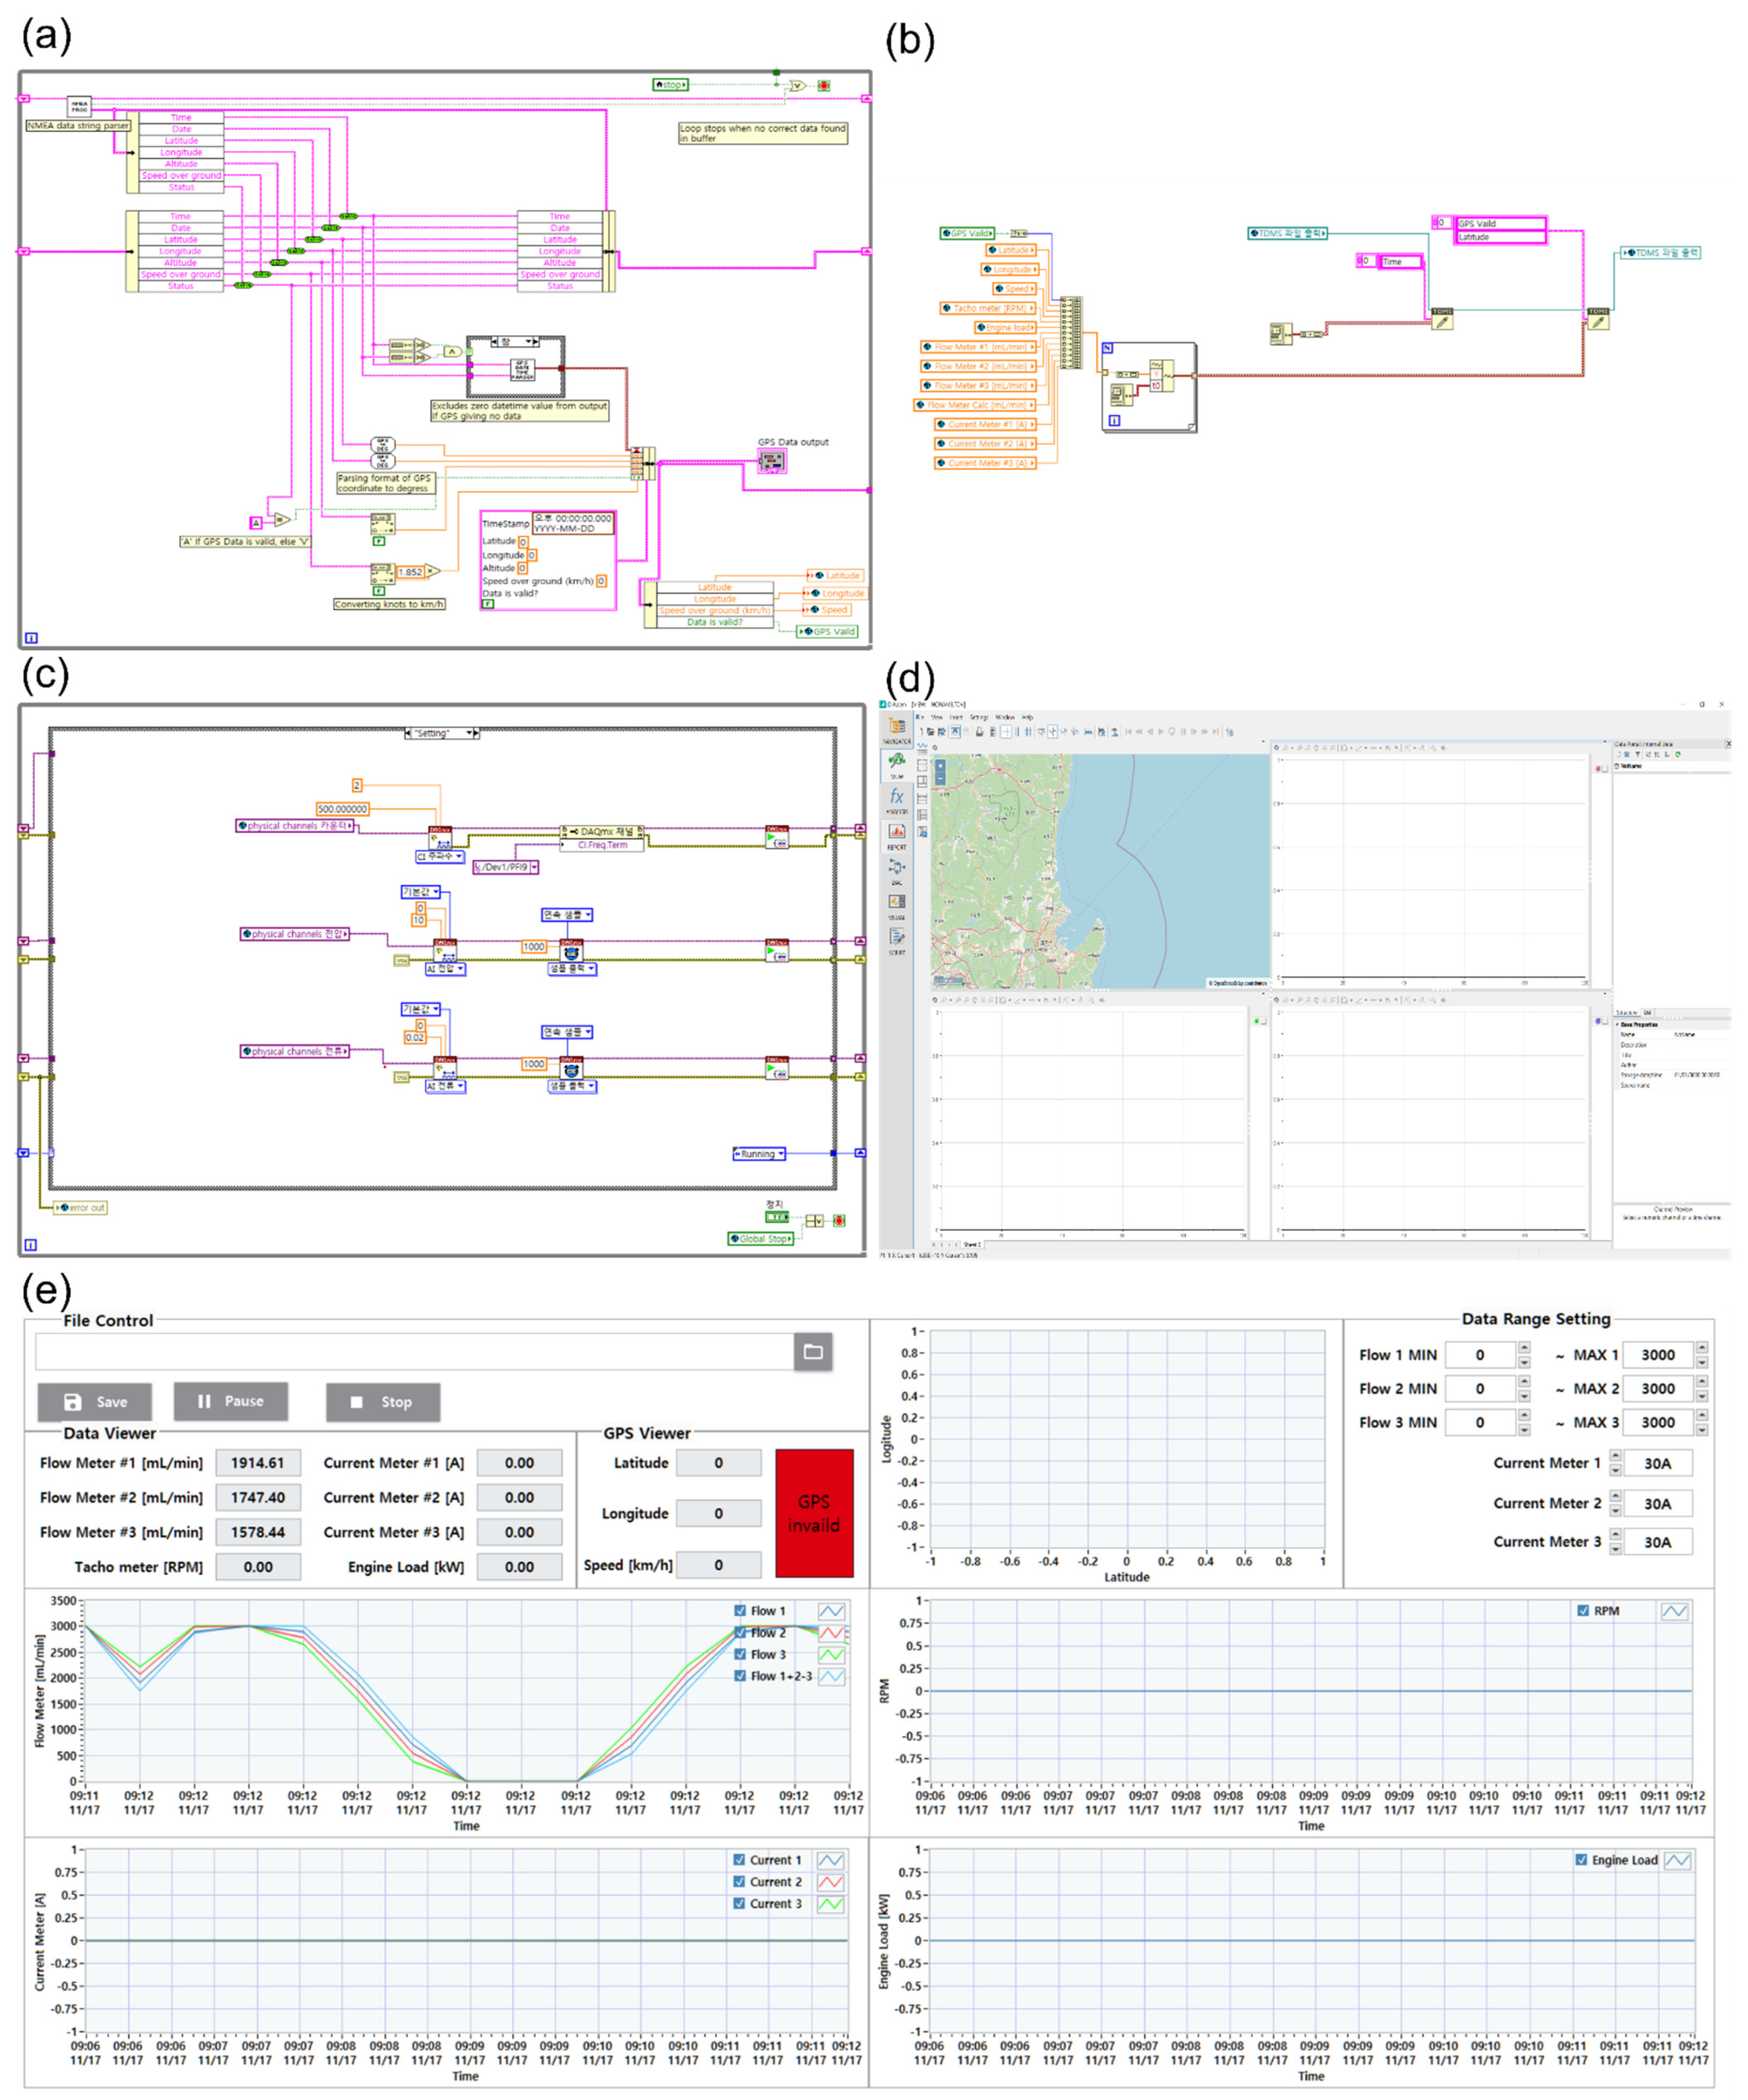
3.3. Design and Construction of a Performance-Monitoring System
3.4. Installation and the Measurement of Performance
3.4.1. Select Reference Vessel
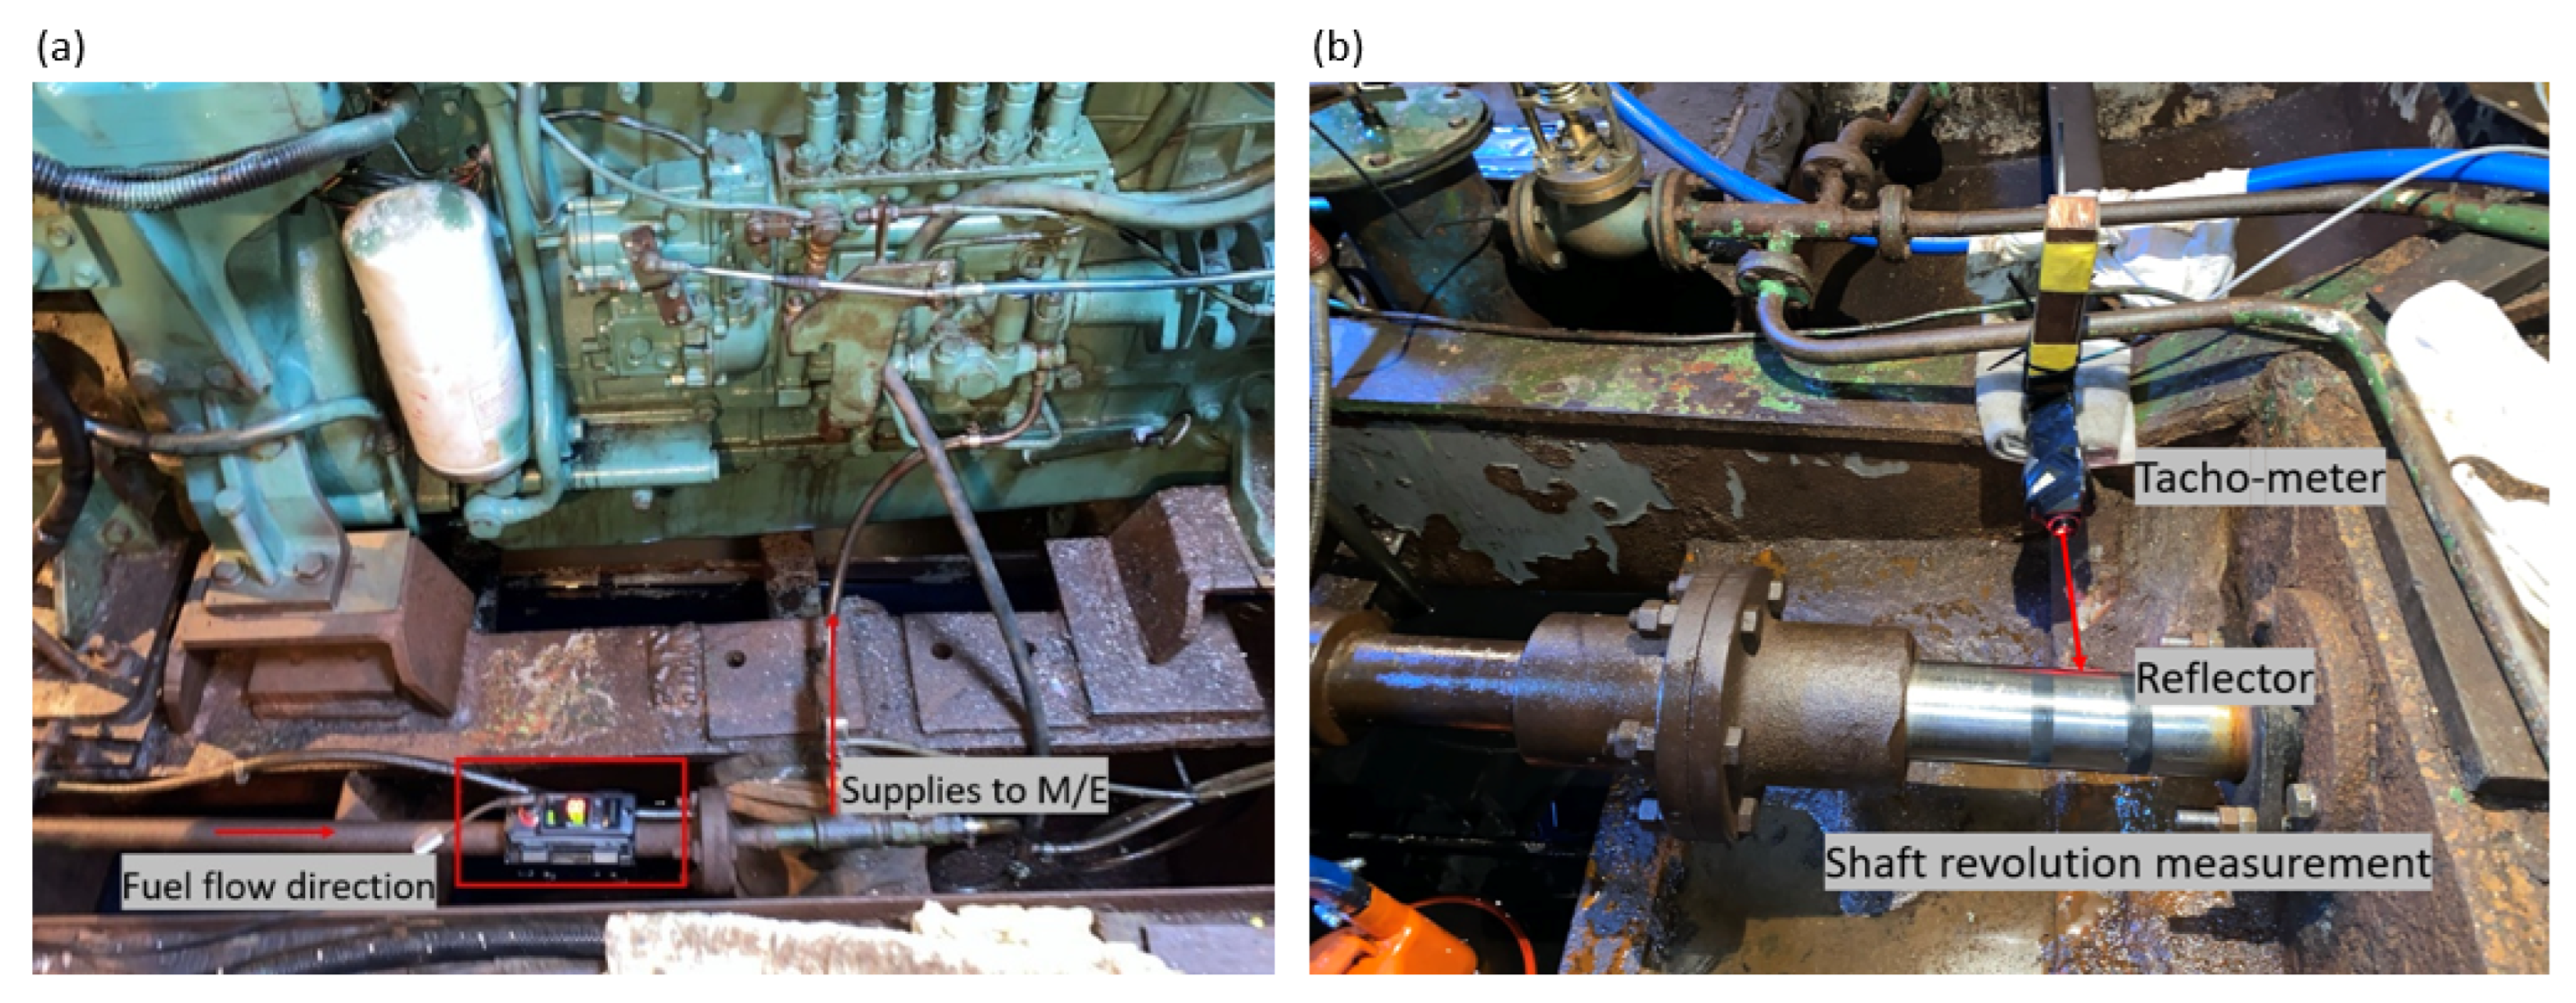
3.4.2. Installation
3.4.3. Performance Measurement
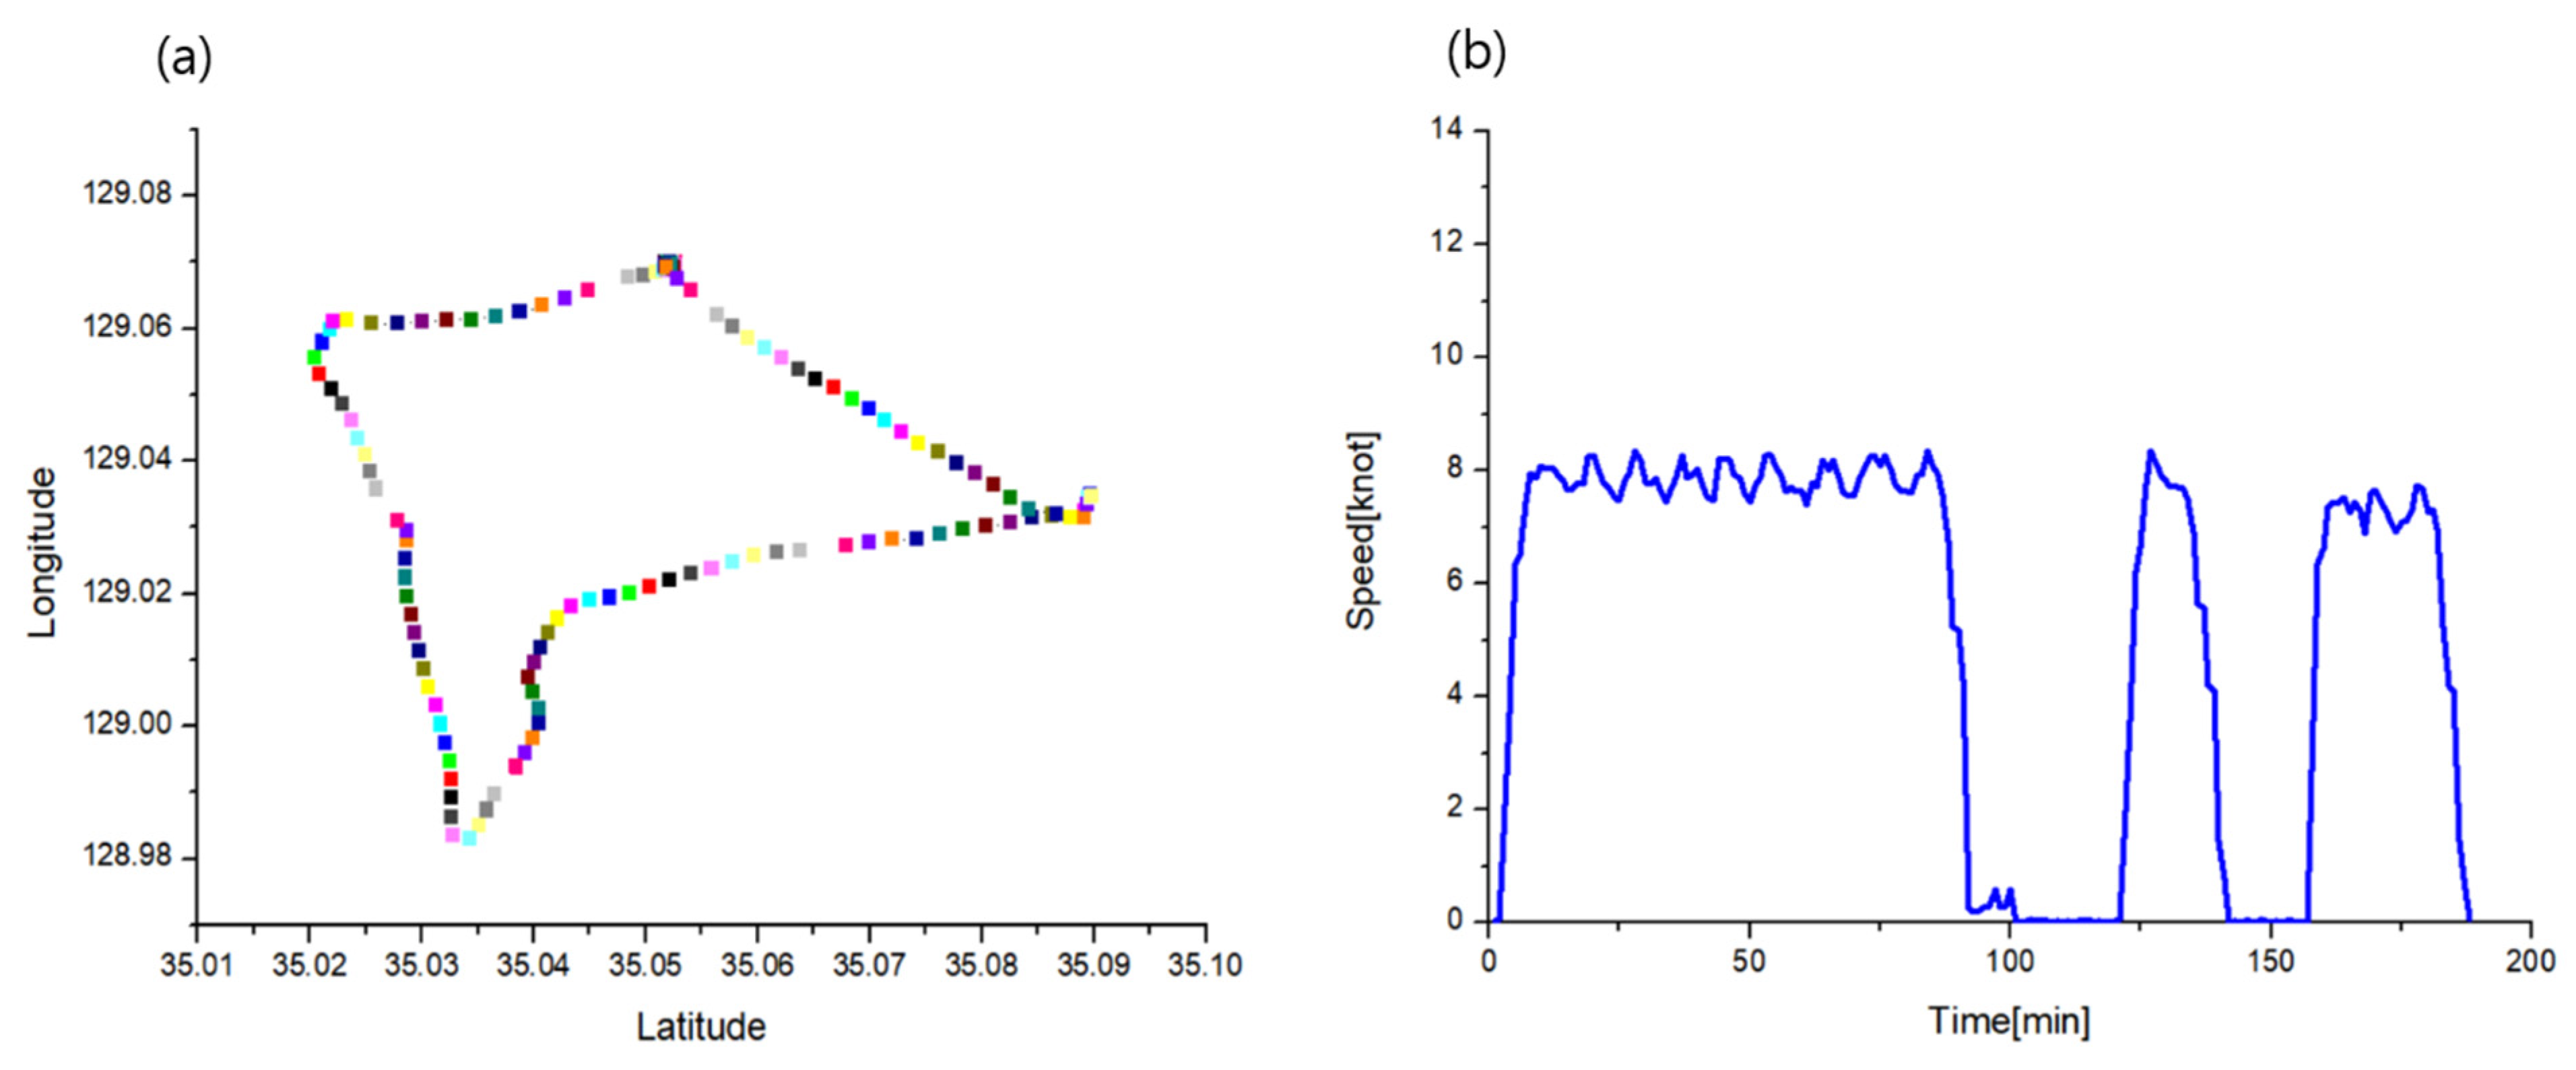
Location and Speed
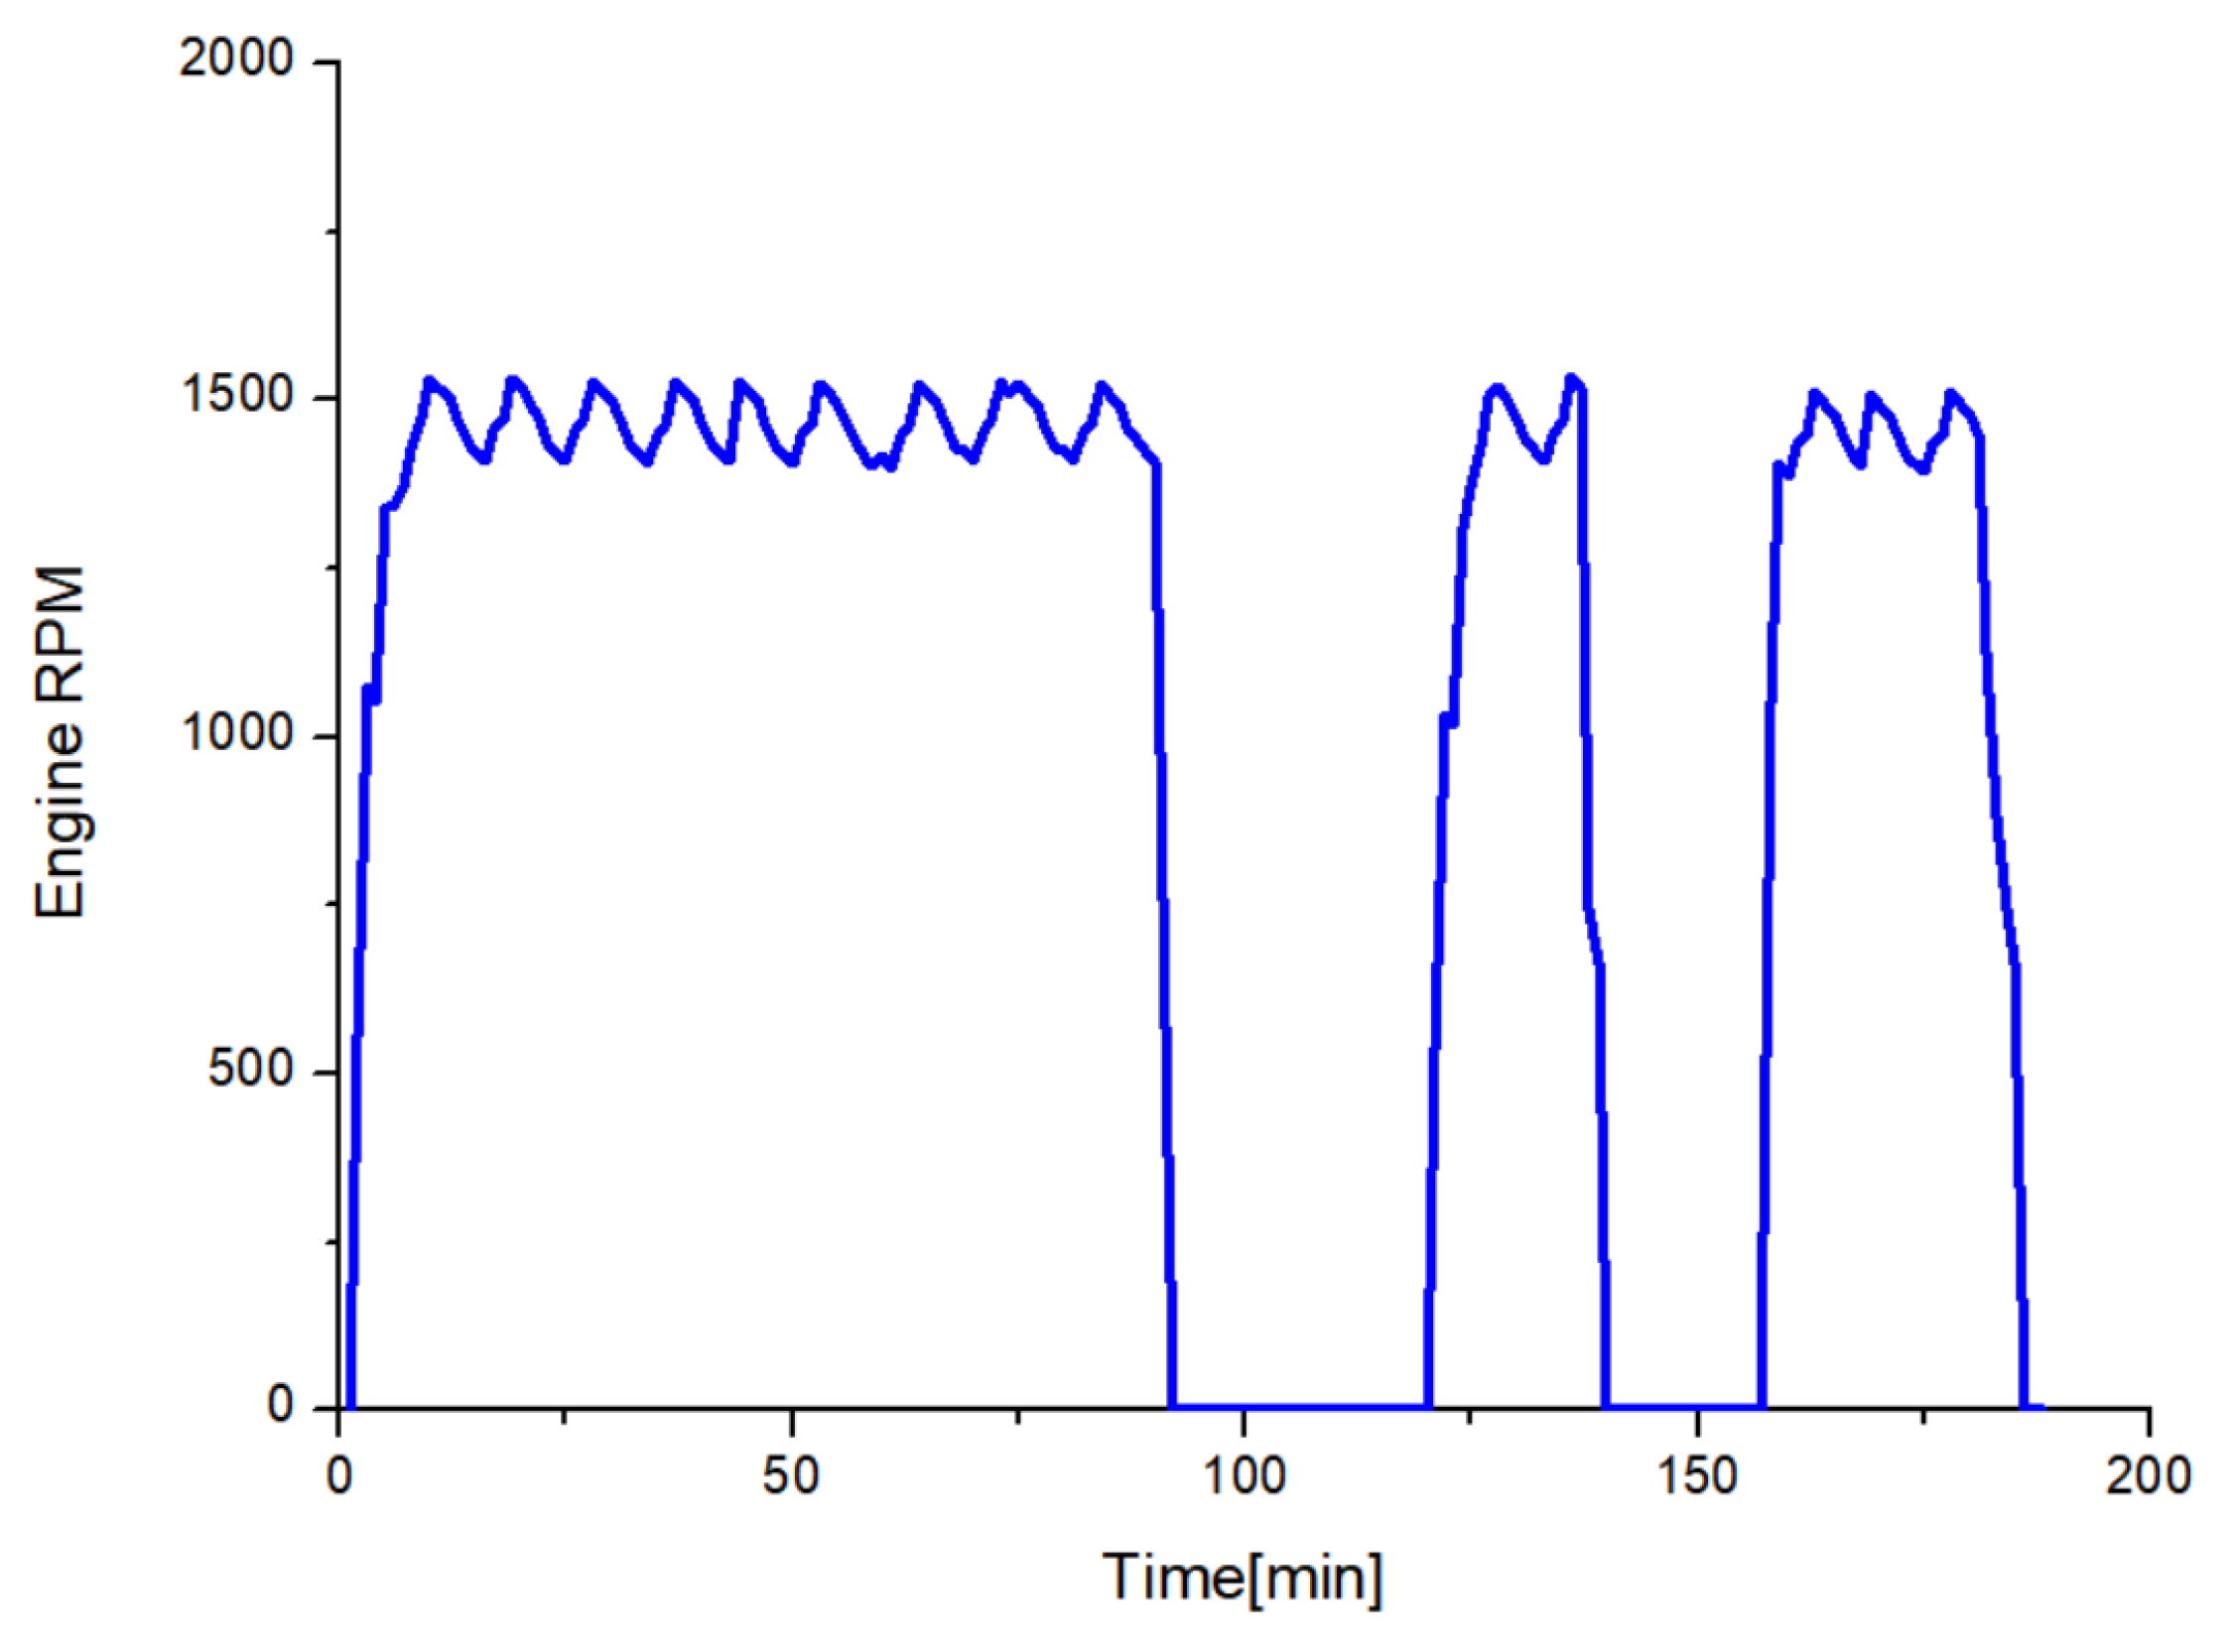
Engine Rpm
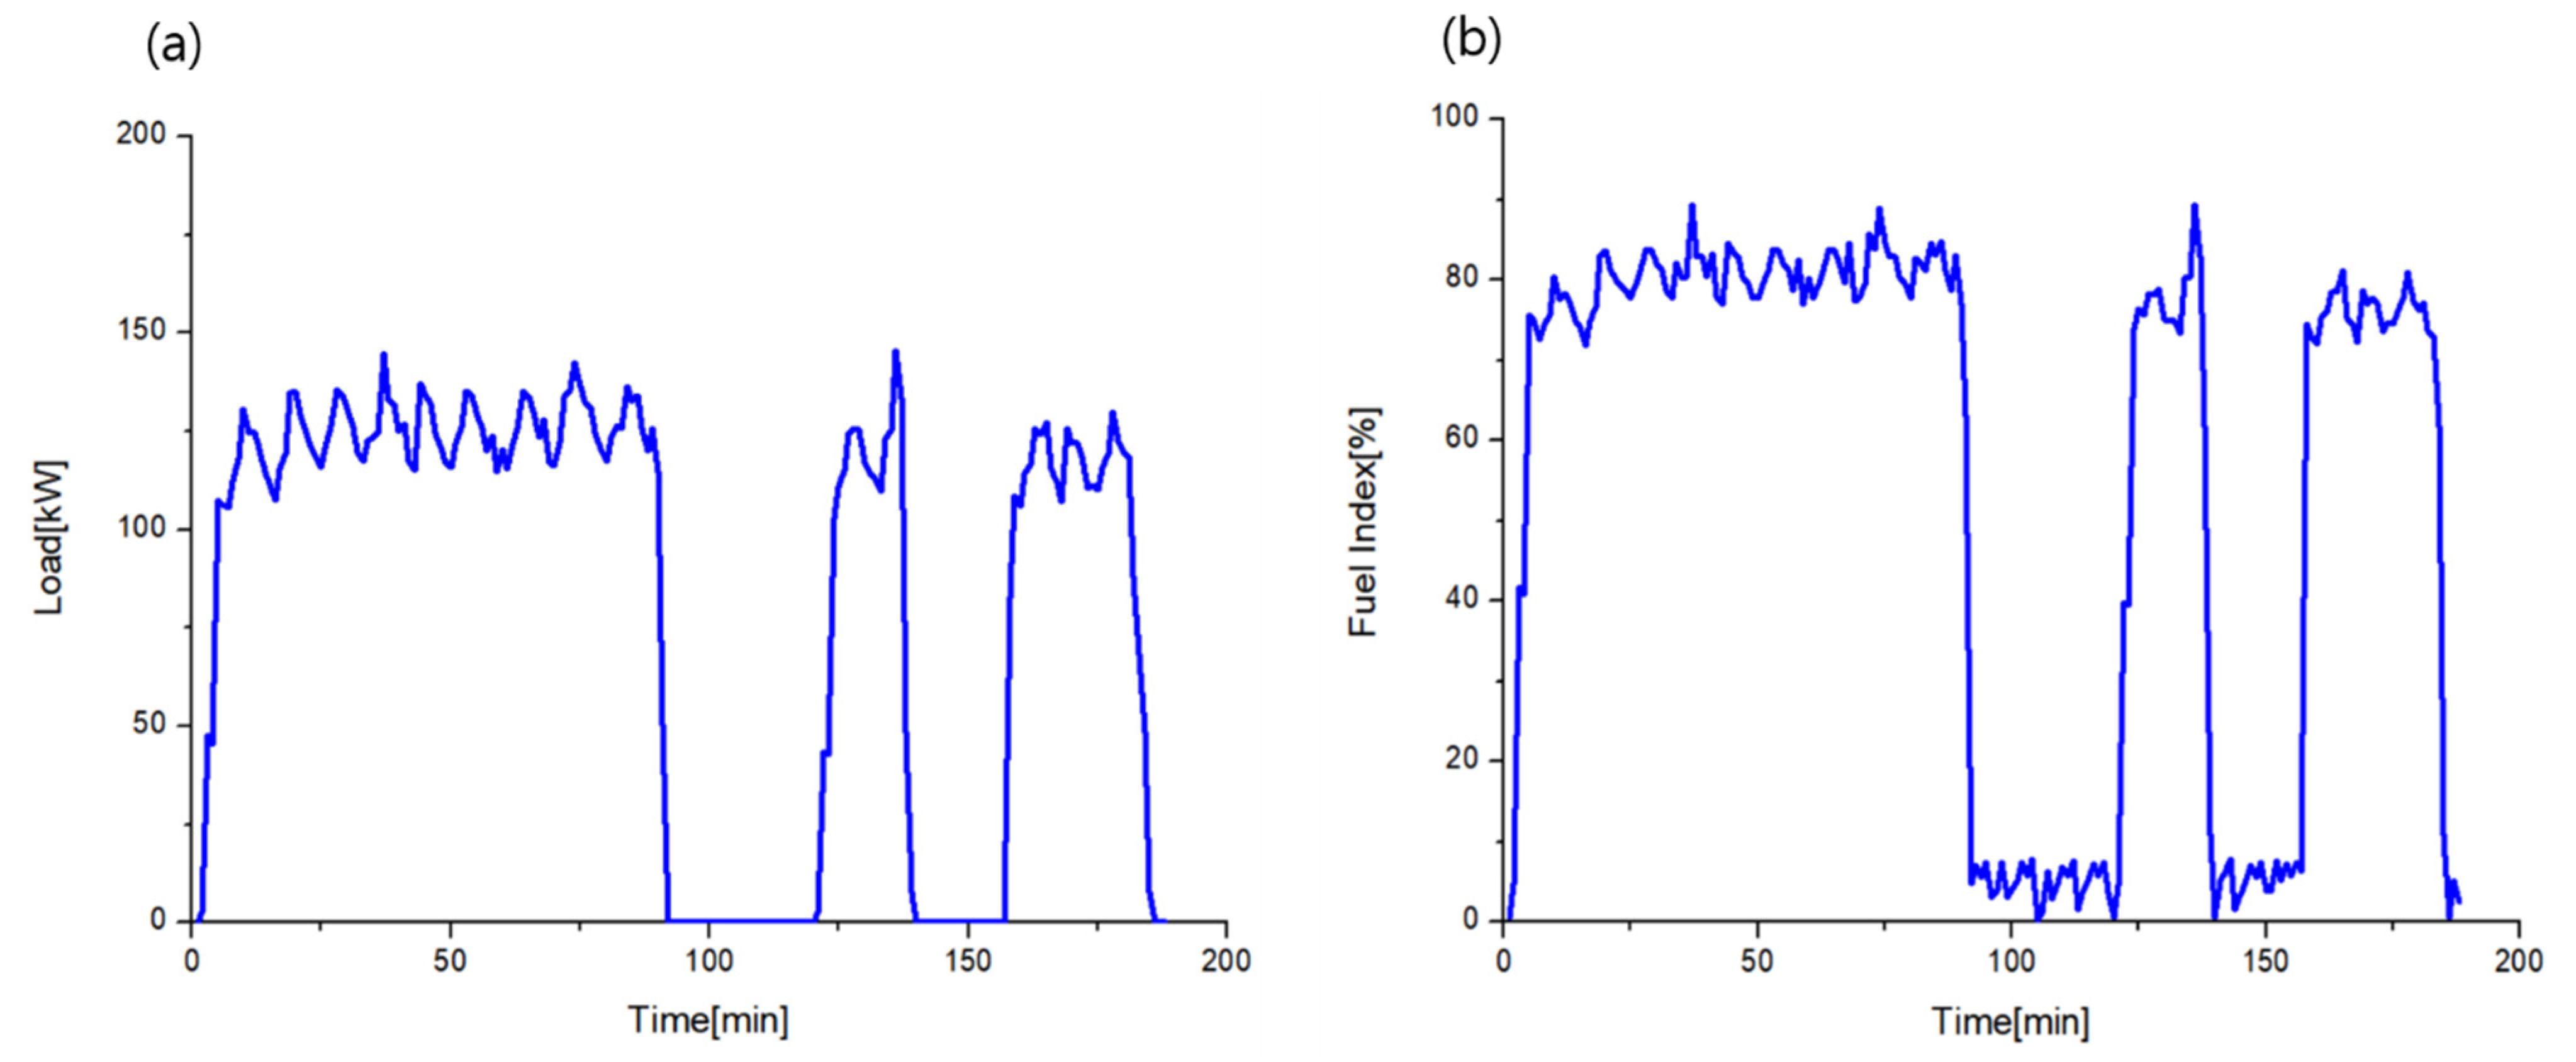
Engine Output and Fuel Index
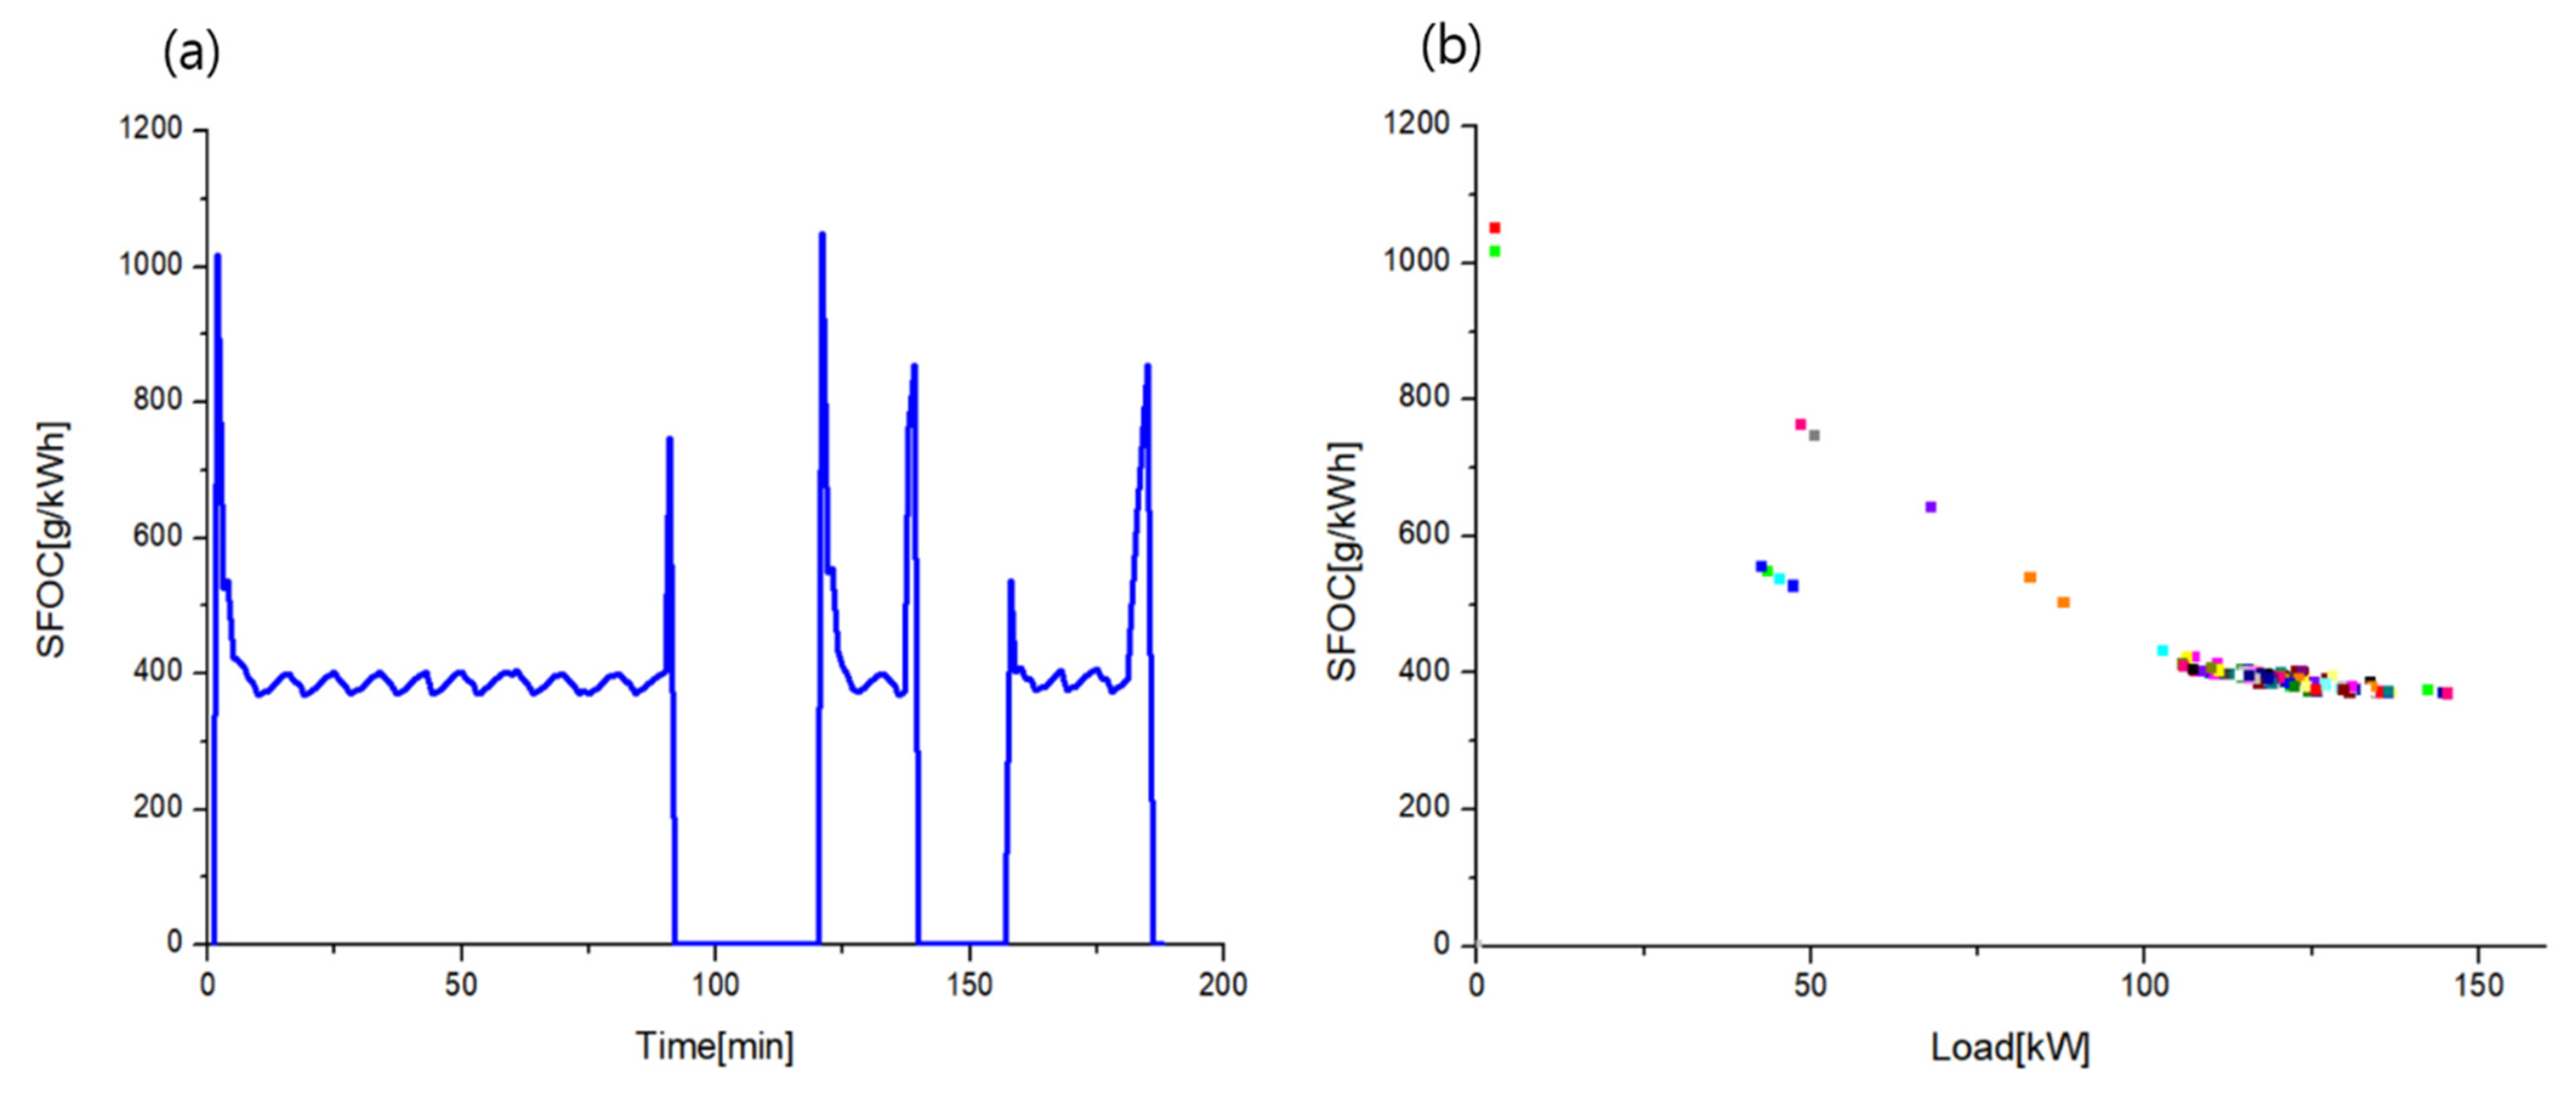
Specific Fuel Oil Consumption (SFOC) and Efficiency
Fuel Oil Consumption, Fuel Cost, and CO2 Emissions
4. Discussion
4.1. Novelty
4.2. Future Study
5. Conclusions
Author Contributions
Funding
Data Availability Statement
Conflicts of Interest
References
- IPCC. Climate Change 2022: Mitigation of Climate Change. Available online: https://www.ipcc.ch/report/ar6/wg3/ (accessed on 29 September 2022).
- IMO. MEPC 80 highlights. In Proceedings of the 80th Session of the Marine Environment Protection Committee, MEPC 80, London, UK, 3–7 July 2023. [Google Scholar]
- Association, K.S.S. Maritime Statistics. 2020. Available online: https://url.kr/ndi496 (accessed on 3 March 2023).
- Legislation, MOF (Ministiry of Oceans and Fisheries). Act on Promotion of the Development and Distribution of Environmentally Friendly Vessels. Available online: https://bitly.ws/TIH6 (accessed on 14 June 2020).
- Kwon, H.J.; Yang, H.S.; Kim, M.K.; Lee, S.G. Long-term Monitoring System for Ship’s Engine Performance Analysis Based on the Web. J. Korean Soc. Mar. Eng. 2015, 39, 483–488. [Google Scholar]
- KIMST (Korea Institute of Marine Sciences & Technology Promotion). KIMST Insight; KIMST: Seoul, Republic of Korea, 2021. [Google Scholar]
- DNV. EEXI—Energy Efficiency Existing Ship Index. Available online: https://www.dnv.com/maritime/insights/topics/eexi/index.html (accessed on 8 January 2023).
- MAN Energy Solutions. Performance Measurement Indicator; MAN Energy Solutions: Copenhagen, Denmark, 2022. [Google Scholar]
- Technology Naval. Kyma Ship Performance Analysers. Available online: https://www.naval-technology.com/contractors/propulsion/kymaas/ (accessed on 3 March 2023).
- HBM. Measurement Solutions for the Marine and Shipbuilding Industry. Available online: https://www.hbm.com/en/3064/marine-industry/ (accessed on 8 August 2022).
- Perera, L.P.; Mo, B. Marine engine operating regions under principal component analysis to evaluate ship performance and navigation behavior. IFAC-Pap. 2016, 49, 512–517. [Google Scholar] [CrossRef]
- Perera, L.P. Marine engine centered localized models for sensor fault detection under ship performance monitoring. IFAC-Pap. 2016, 49, 91–96. [Google Scholar] [CrossRef]
- Li, Z.; Ryan, C.; Huang, L.; Ding, L.; Ringsberg, J.W.; Thomas, G. A comparison of two ship performance models against full-scale measurements on a cargo ship on the Northern Sea Route. Ships Offshore Struct. 2021, 16, 237–244. [Google Scholar] [CrossRef]
- Liang, Q.; Tvete, H.; Brinks, H. Prediction of vessel propulsion power from machine learning models based on synchronized AIS-, ship performance measurements and ECMWF weather data. IOP Conf. Ser. Mater. Sci. Eng. 2019, 929, 012012. [Google Scholar] [CrossRef]
- Dalheim, Ø.Ø.; Steen, S. Preparation of in-service measurement data for ship operation and performance analysis. Ocean. Eng. 2020, 212, 107730. [Google Scholar] [CrossRef]
- Mak, L.; Sullivan, M.; Kuczora, A.; Millan, J. Ship performance monitoring and analysis to improve fuel efficiency. In Proceedings of the 2014 Oceans-St. John’s, St. John’s, NL, Canada, 14–19 September 2014; pp. 1–10. [Google Scholar]
- Aldous, L.; Smith, T.; Bucknall, R.; Thompson, P. Uncertainty analysis in ship performance monitoring. Ocean. Eng. 2015, 110, 29–38. [Google Scholar] [CrossRef]
- Du, T.; Zuo, X.; Dong, F.; Li, S.; Mtui, A.E.; Zou, Y.; Zhang, P.; Zhao, J.; Zhang, Y.; Sun, P. A self-powered and highly accurate vibration sensor based on bouncing-ball triboelectric nanogenerator for intelligent ship machinery monitoring. Micromachines 2021, 12, 218. [Google Scholar] [CrossRef] [PubMed]
- Carchen, A.; Atlar, M.; Turkmen, S.; Pazouki, K.; Murphy, A.J. Ship performance monitoring dedicated to biofouling analysis: Development on a small size research catamaran. Appl. Ocean. Res. 2019, 89, 224–236. [Google Scholar] [CrossRef]
- Hasselaar, T.W.F. An Investigation into the Development of an Advanced Ship Performance Monitoring and Analysis System; Newcastle University: Newcastle, UK, 2011. [Google Scholar]


| Item | Unit | Amount |
|---|---|---|
| Fuel oil consumption | [kg] | 106.1 |
| Fuel cost | [USD] | 100.6 |
| emissions | [kg] | 340.2 |
Disclaimer/Publisher’s Note: The statements, opinions and data contained in all publications are solely those of the individual author(s) and contributor(s) and not of MDPI and/or the editor(s). MDPI and/or the editor(s) disclaim responsibility for any injury to people or property resulting from any ideas, methods, instructions or products referred to in the content. |
© 2023 by the authors. Licensee MDPI, Basel, Switzerland. This article is an open access article distributed under the terms and conditions of the Creative Commons Attribution (CC BY) license (https://creativecommons.org/licenses/by/4.0/).
Share and Cite
Kim, S.; Kim, H.; Jeon, H. Development of a Simplified Performance Monitoring System for Small and Medium Sized Ships. J. Mar. Sci. Eng. 2023, 11, 1734. https://doi.org/10.3390/jmse11091734
Kim S, Kim H, Jeon H. Development of a Simplified Performance Monitoring System for Small and Medium Sized Ships. Journal of Marine Science and Engineering. 2023; 11(9):1734. https://doi.org/10.3390/jmse11091734
Chicago/Turabian StyleKim, Seongwan, Heemoon Kim, and Hyeonmin Jeon. 2023. "Development of a Simplified Performance Monitoring System for Small and Medium Sized Ships" Journal of Marine Science and Engineering 11, no. 9: 1734. https://doi.org/10.3390/jmse11091734