Article

Feasibility Assessment of Alternative Clean Power Systems onboard Passenger Short-Distance Ferry

by
Ahmed G. Elkafas
1,2,*,
Massimo Rivarolo
1,
Stefano Barberis
1 and
Aristide F. Massardo
1
1
Thermochemical Power Group (TPG), DIME, University of Genova, 16145 Genova, Italy
2
Department of Naval Architecture and Marine Engineering, Faculty of Engineering, Alexandria University, Alexandria 21544, Egypt
*
Author to whom correspondence should be addressed.
J. Mar. Sci. Eng. 2023, 11(9), 1735; https://doi.org/10.3390/jmse11091735
Submission received: 3 August 2023 / Revised: 28 August 2023 / Accepted: 31 August 2023 / Published: 2 September 2023
(This article belongs to the Special Issue Advanced Research on the Sustainable Maritime Transportation)

Abstract

:
In order to promote low-carbon fuels such as hydrogen to decarbonize the maritime sector, it is crucial to promote clean fuels and zero-emission propulsion systems in demonstrative projects and to showcase innovative technologies such as fuel cells in vessels operating in local public transport that could increase general audience acceptability thanks to their showcase potential. In this study, a short sea journey ferry used in the port of Genova as a public transport vehicle is analyzed to evaluate a ”zero emission propulsion” retrofitting process. In the paper, different types of solutions (batteries, proton exchange membrane fuel cell (PEMFC), solid oxide fuel cell (SOFC)) and fuels (hydrogen, ammonia, natural gas, and methanol) are investigated to identify the most feasible technology to be implemented onboard according to different aspects: ferry daily journey and scheduling, available volumes and spaces, propulsion power needs, energy storage/fuel tank capacity needed, economics, etc. The paper presents a multi-aspect analysis that resulted in the identification of the hydrogen-powered PEMFC as the best clean power system to guarantee, for this specific case study, a suitable retrofitting of the vessel that could guarantee a zero-emission journey.

1. Introduction

In recent decades, the escalating environmental challenges posed by traditional fossil fuel-powered maritime transportation have stimulated a global pursuit of eco-friendly alternatives. Also, they were stimulated by the International Maritime Organization’s (IMO) ambitious targets and challenges in 2018 [1] which aim to reduce the total annual greenhouse gas (GHG) emissions by at least 50% by 2050 compared to 2008. These targets are boosted in the revised 2023 IMO strategy [2] to achieve net-zero emissions from ships by or close to 2050 with suggested milestones for lowering GHG emissions by 20–30% in 2030, and 70–80% in 2040, both in contrast to levels in 2008. Regarding other ship emissions, Annex VI of MARPOL [3] poses limitations on nitrogen oxides (NOx), sulfur oxide (SOx), and particulate matter (PM), obliging maritime operators (ship owner, ship manager, ship craft, etc.) to engage in deep thought about current/future fuel choice and propulsion/power generation system technology [4]. The only approach to ensure a cleaner future for the maritime industry appears to be to look at alternative fuels and clean power systems rather than simply acting on an exhaust after-treatment system [5].
Particularly looking at vessels operating in coastal areas and maritime urban environments, emissions reductions are becoming more and more important [6], where nearly 70% of pollutant emissions are estimated to occur within 400 km of coastlines and where 45% of the world’s population resides [7].
In order to reduce vessels’ emissions and decarbonize the shipping sector [8,9], different measures could be put in place [10,11], acting at different levels of the vessels. The ship emission reduction measures include optimizing the efficiency of the ship engine by using waste heat recovery [12,13], working on alternative propulsion technologies such as wing sails [14] or electric hybrid propulsion [15], reducing ship resistance via trim optimization [16] or an enhanced vessel design [17], and using voyage optimization measures such as onboard energy management [18] or slow steaming concept [19,20].
Nevertheless, in order to achieve relevant emissions reduction as targeted by the IMO, it is crucial to promote alternative fuels for vessels such as natural gas [21,22], biofuels [23], and hydrogen-based e-fuels [24].
The identification of the most suitable alternative fuels in shipping depends on many aspects, technical (fuels’ own thermo-physical properties that pose a limitation on fuel storage onboard and need for a specific on-board/on-shore bunkering/refueling infrastructure) and non-technical (safety, regulatory, classification, etc.) with impacts on economic (fuel price, investment, and operational costs), environmental (emissions, well-to-tank life cycle performance) and social (availability, politics, public opinion, etc.) aspects [25,26,27,28].
At the same time, the choice of energy and power propulsion systems depends on the type of vessel, its journey profile, and its own shipbuilding/environment features (space and volumes onboard, buoyancy needs, etc.) [8,29]. In order to solve this multi-aspect problem, different tools and approaches have been promoted to guide shipping operators in the identification of the most relevant and sustainable options when looking at a retrofitting/newly built vessel construction project targeting low emissions [30]. The goal of these approaches is to identify the most suitable/worthy-of-investigation technological solution, looking at both the vessel and targeted clean power system/fuel peculiarities [31].
Particularly looking at inland waterways and short sea shipping segments [32], and thanks to demonstrations driven by different EU-funded research projects [33,34,35], fuel cell (FC) systems are gaining more and more interest as a promising solution for maritime applications, as they are characterized by a high efficiency and low level of emissions, noise, and vibrations [35]. For all of these reasons and in accordance with the FC main peculiarities presented in [36,37], the authors already reviewed the recent research development/commercial products of FC systems [35] and investigated the use of FCs onboard different types of vessels, from cruise ships [38] to research vessels [39,40,41].

Research Novelty

Starting from these previous research works, as well as inspired by other FCs equipped vessel R&D (research and development) works targeting different types of FC [7,42,43] and different fuels [44,45], in the current paper the authors will investigate the possibility of retrofitting an existing small-scale ferry operating in the port of Genova as a public transportation vehicle for citizens.
While different R&D studies investigated the possibility of applying different fuels [27] towards zero emission vessels also looking at batteries [46], different types of FCs [47], and hydrogen-based energy systems onboard vessels [48], this paper targets a small-scale vessel used for urban transport. As well as this paper highlights the uniqueness of the application by studying the possibility of installing different energy systems (also looking at different types of FC) and fuel types both from an economic, energy, and onboard integration point of view, proposing a multi-aspect retrofitting methodology and step-by-step approach.
The choice of targeting this type of vessel, as already highlighted in previous research work [49], for the proposed retrofitting project has been driven by three reasons: (1) the fact that small ferries/vessels and short sea journey vessels looking at their journey profile would require a limited power capacity of the propulsion system and fuel volumes to be stored onboard, thus overcoming main limitations related to a large hydrogen tank needing to be integrated onboard; (2) the fact that this type of vessel, looking at their journey profiles, have very frequent and precise scheduling, thus enabling potential recurrent and easy-to-plan refueling (thus further reducing the amount of fuel to be stored onboard); (3) the fact that this type of vessel operates in the urban environment where emission limitation is more urgent and where the showcase of the effectiveness of FC technologies onboard ferries could have a higher social impact in terms of public awareness.
For this purpose, this research paper delves into the application of alternative zero-emission power systems onboard small vessels used for public transport working on short-sea navigation. In this paper, different solutions will be investigated such as full battery systems and FCs fed by different fuels like pure hydrogen, ammonia, liquified natural gas (LNG), and methanol (MeOH). The paper aims to present a retrofitting case study that will be analyzed by studying multi-aspect reasons that could favor one technology instead of another. The technical feasibility aims to look at the vessel’s journey, energy needs, available volume/weights onboard, and potential daily refueling opportunities. Moreover, the paper will study the impact of applying clean power systems on the overall design of the case study from the system’s weight and size perspectives.
The multi-aspect analysis involves the economic feasibility of using clean power systems to achieve the decarbonization of ships working on short-sea navigation. This study will identify the most economically viable clean power system through cost assessment indicators such as net present value (NPV), levelized cost of energy (LCOE), return on investment (ROI), and marginal abatement cost (MAC).

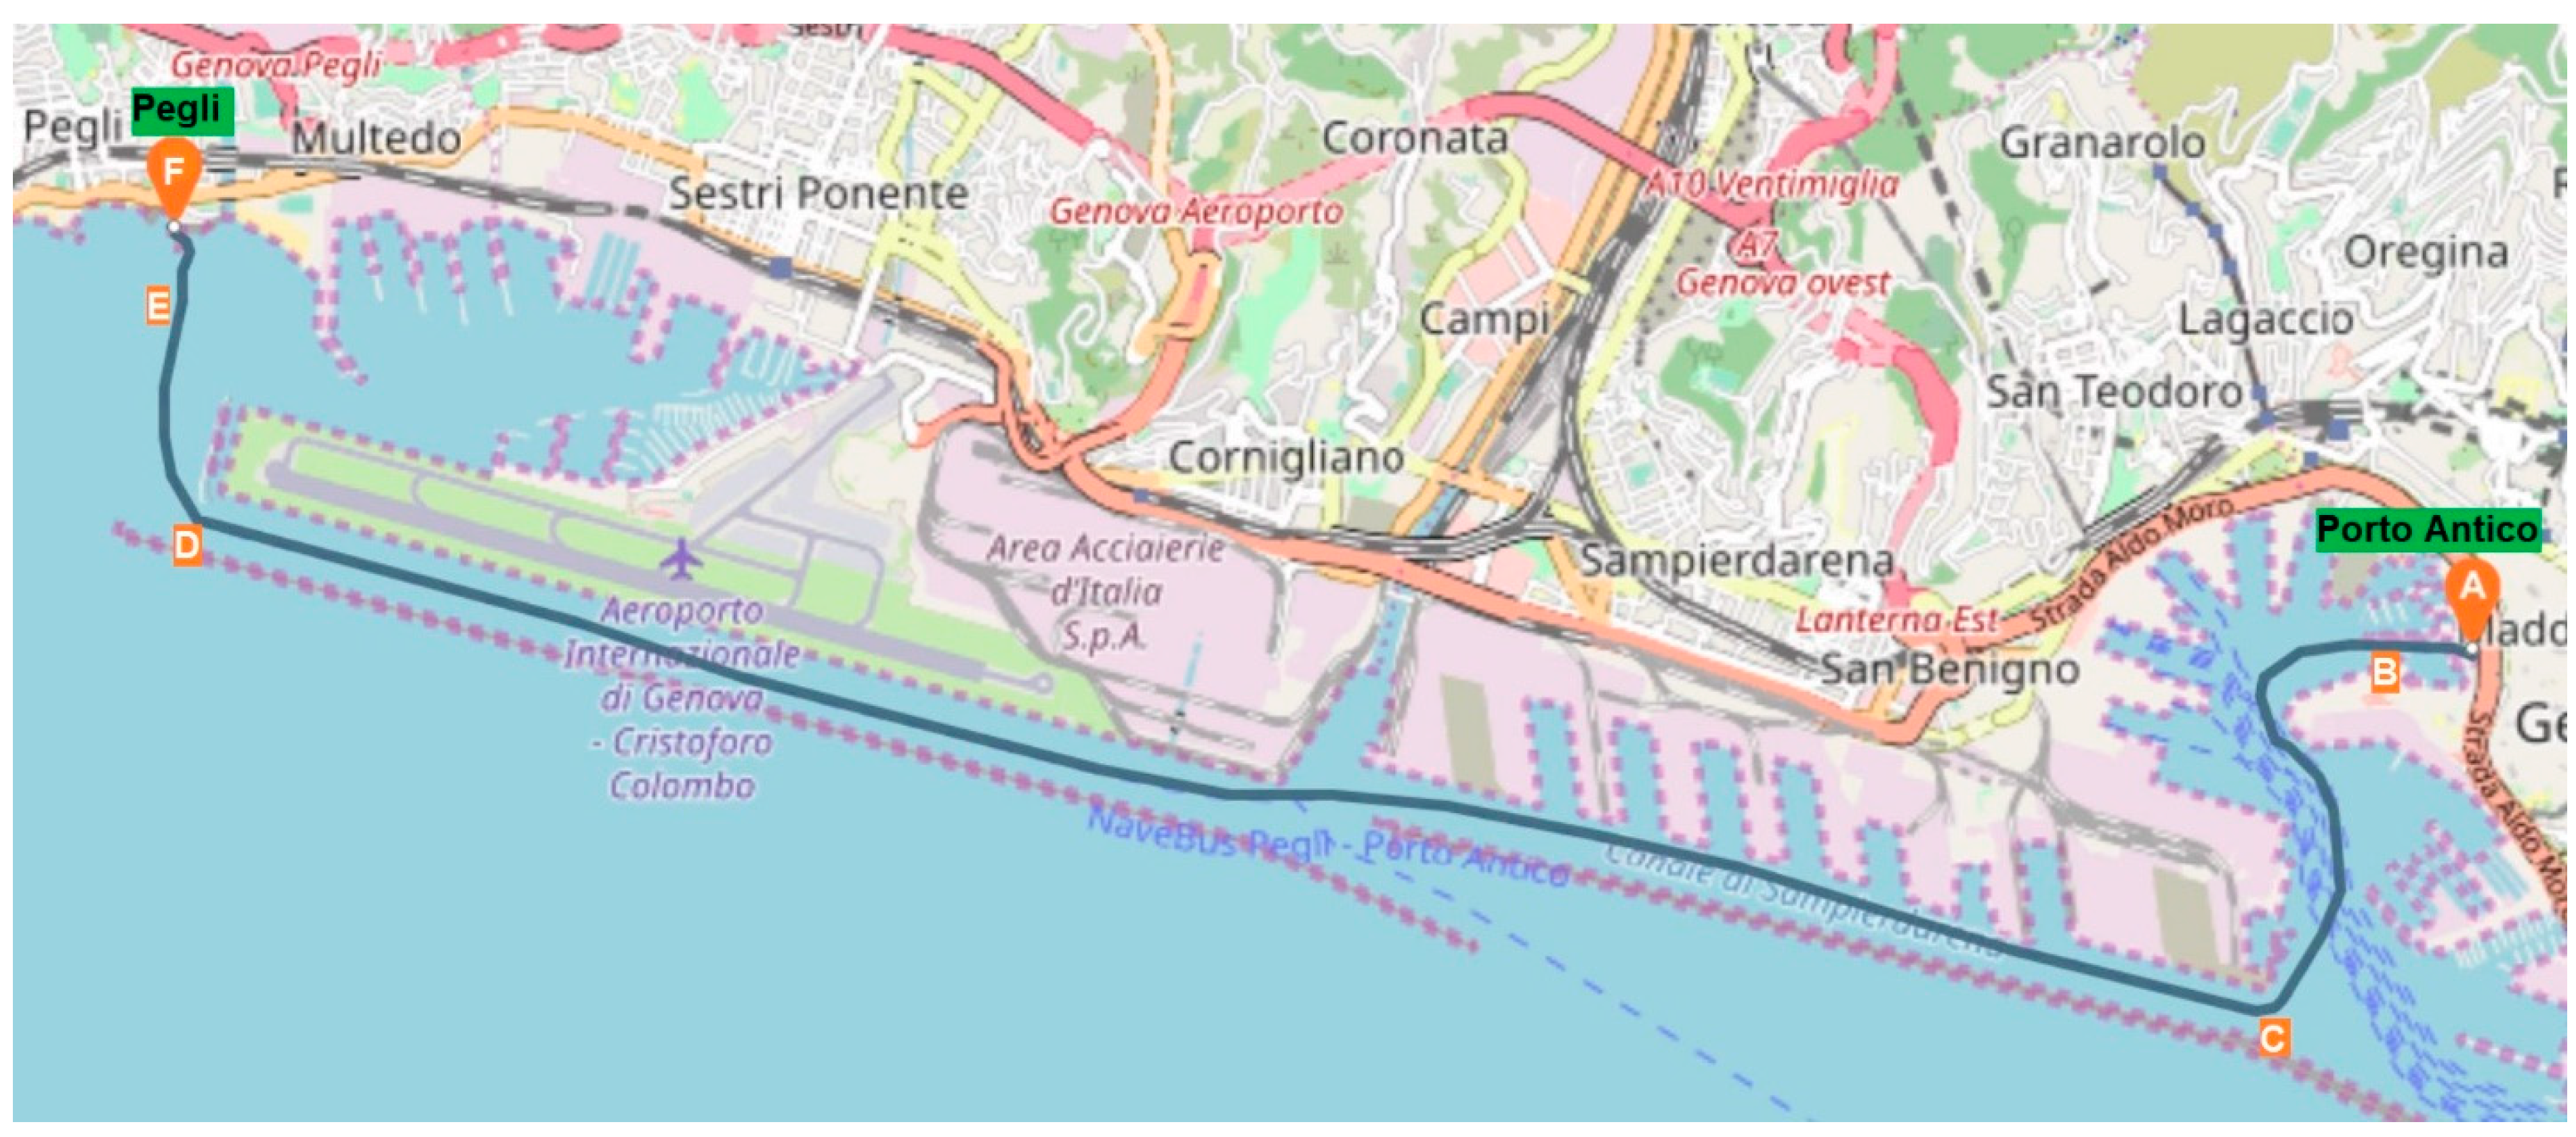
2. Case Study Description

The proposed case study is one of the passenger ferries working in short-sea navigation through Genoa city in Italy as part of the public-transport offering of the municipality. This type of vessel can be seen as an entry point/showcase for clean propulsion solutions as they do not require large storage onboard, and they have a large audience impact thus potentially increasing public awareness of clean maritime technologies. The ship is called “Rodi Jet—NaveBus” which navigates between the west side of Genoa (Pegli) and the ancient port in the city centre (the old port—Porto Antico) [50]. The maximum capacity of the ship is 362 passengers and access to the ship is guaranteed through a ramp 2.2 m long and 85 cm wide. The main specifications of the NaveBus are summarized in Table 1 [51].
The NaveBus is propelled by using two fixed-pitch propellers (FPP) powered by two diesel engines from Caterpillar 3412, each one has a maximum rated output power, footprint volume, and weight equal to 895 kW, 2.45 m3, and 1.9 tons, respectively. Moreover, there is an engine room with dimensions of 6.1 m (L) × 6.5 m (W) × 2 m (H) where the following components are located: two Caterpillar main engines, two gearboxes, a control panel, and two auxiliary generators (rated 18 kW and 6 kW) for hoteling and service generation.
Next to the engine room, there is a room containing two diesel storage tanks to be filled with 7.2 tons of marine diesel oil (MDO) at a maximum, each tank has the following dimensions (2.9 m (L) × 1.24 m (W) × 1.21 m (H)) with a footprint volume equal to 4.4 m3.
The ship is designed to operate at a maximum speed of 20 knots, but the actual service speed (as understood thanks to an interview with the local crew) for the investigated journey and route is approximately 10.2 knots in sailing mode as a maximum. This service speed at normal weather conditions can be achieved by using approximately 40% of the installed engines’ rated power (approximately 715 kW).
The NaveBus is characterized by having a specific navigational route for its trips which start in Porto Antico and sail along the Ligurian coast to Pegli, in a sea area protected from heavy winds and waves by the port of Genova Coastal Dam. The navigational route is described in Figure 1. The distance between the two ports/terminals area is 6 nautical miles (nm).
As previously mentioned, this ferry is part of the public transport offering of the city of Genova and it works integrated with other modes of public transportation such as buses and metro as it sails eight times every day during rush hours as follows: three consecutive morning trips, two trips in the afternoon, and three consecutive trips in the evening.
The operational profile of the NaveBus is characterized by different modes: passenger loading at Porto Antico port, maneuvering the ferry away from the Porto Antico terminal area (A-B), crossing the Porto Antico Channel to the west side (B-C), sailing through the Ligurian Sea (C-D), entrance of the Pegli terminal (D-E), maneuvering at the Pegli terminal (E-F), and passenger unloading. The operational profile for one day is described in Figure 2a by plotting the relation between the ferry speed and actual time in a day (daily scheduling of the NaveBus), while the operational modes of one round trip are described in Figure 2b in terms of ferry speed versus the time spent at each mode.
As shown in Figure 2, the trip that takes off from Pegli and ends in Porto Antico is quite like the other trip from Porto Antico to Pegli in terms of spending time and ship speed. Moreover, the recorded energy requirement for the two trips is the same (thanks to an interview with the local crew).
Based on the limitation of the available weight and volume onboard the ship, the current study will design a clean power system for the implementation of three consecutive trips without refueling (or recharging in the case of a full battery electric system). This is acceptable according to the daily journey profile as shown in Figure 2a; therefore, three one-way trips (OWTs) can be considered as a functional unit of the current study, to evaluate the power capacity needs and fuel needs. Looking at the daily scheduling, there is indeed the possibility to foresee two refueling/recharging periods in Porto Antico at midday and another one in the evening according to the ship’s operational schedule depicted in Figure 2a.
The paper aims to investigate the feasibility of replacing conventional diesel engines with alternative clean power systems based on FC and battery technologies. Figure 3 provides a schematic illustration of the different clean power systems (and different potential options in terms of fuel per each power system considered) taken into consideration for this study and the potential component combinations.
As shown in Figure 3, there are five categories: fuel storage system, fuel processing equipment, power generation system, power conditioning equipment, and propulsion/auxiliary system. For the power generation system, three different technologies are considered (proton exchange membrane fuel cell (PEMFC), solid oxide fuel cell (SOFC), and battery system), while looking at the fuel storage system onboard, the following fuels are considered: hydrogen, ammonia, LNG, and MeOH, with related fuel processing equipment. The power conditioning equipment is composed of a DC/DC converter, and a DC/AC inverter, while the fuel-processing equipment is based on the fuel type and consists of an ammonia cracker, natural gas reformer, and MeOH reformer. Regarding the propulsion system, the electric motor is selected to exist in all the proposed cases to deliver the required power to the FPP.

3. Feasibility Assessment Method

The paper presents a multi-aspect analysis to determine the most feasible clean power system to be implemented onboard the case study according to different aspects: ferry daily journey and scheduling, available volumes and spaces, propulsion power needs, energy storage/fuel tank capacity needed, economics, etc. Different types of clean power systems (batteries, PEMFC, and SOFC) are proposed to be investigated to assess and evaluate their effectiveness onboard from an economic and design perspective. Therefore, this target can be investigated and accomplished by using the following methodology as shown in Figure 4.
The first step is to consider the input data at the start of the assessment procedure including the ship design specifications (available volumes, surface, weights), the ship operational profile based on voyage details, daily journey/scheduling, and the power requirements. Second, the power system boundaries in terms of its power capacity needs and fuel needs must be determined and it must be identified whether it is a FC-based system or a full battery electric power system. This step includes the identification of the methods to evaluate the energy requirement and fuel mass for the identified power system. The energy requirements for each potential clean power system scenario are then determined using an energy analysis. After that, the feasibility assessment is divided into economic and design aspects, the latter one intends to look at volume/spaces onboard and assess the clean power system’s weight and volume, while the economic feasibility aspect is applied to the case study considering the total costs that contain capital expenses (CapEx), operational expenses (OpEx), and voyage expenses (VoyEx). Followed by a systematic comparison process that will be studied by using cost assessment indicators (CAI) as shown in Figure 5.
These indicators are used to quantify and reflect the performance of the power system from an economical perspective such as NPV, LCOE, ROI, and MAC. The last step of the assessment methodology is to present the results of the multi-aspect analysis and identify the best clean power system to guarantee a suitable retrofitting of the vessel and pledge a zero-emission journey to the ferry.

3.1. System Boundary Determination

System boundary determination is considered the crucial step in the methodology as it includes the methods that must be followed to calculate energy capacity and fuel consumption. This procedure is divided into two different subsections based on the applied power system (FC system and full battery system).

3.1.1. Fuel Cell System Scenario

The first step in system boundary determination is to calculate the required power capacity for the propulsion system and auxiliary system covered by using the FC system that will enable the definition of the number of FC modules/systems to be installed and foreseen onboard the ship while also looking at the typical commercial FC module/system power capacity. It is assumed that the current vessel’s power requirement for propulsion and auxiliary systems (diesel-powered ferry) can be considered constant for the new clean energy system under investigation, except for the additional load related to auxiliaries when using the FC system by adding an extra factor.
Using the same approach, fuel consumption can be calculated by considering the FC efficiency, the type of fuel, and additional equipment for fuel processing. The FC efficiency ( η F C ) depends on the FC technology type and the required load factor. Also, the quantity of fuel depends on the fuel type which differs in the lower heating value ( L H V ) measured in kWh/kg. The required fuel mass by using the FC system ( F M F C f ) to perform the identified functional unit (three OWTs) can be calculated as shown in Equation (1).
F M F C f = J o w t = 1 J o w t = 3 O M = s O M ( 1 + f s e , f ) P O M , o w t T O M , o w t η F C L H V f
where F M F C f is measured in kg, f s e , f is the extra factor for the supplementary equipment (se), subscript (f) refers to the fuel type, P O M , o w t is the average required power for each operational mode (OM) in the particular trip measured in (kW), J o w t is the number of OWT considered in the calculation, and T O M , o w t is the duration of the operational mode at each trip measured in hours. The operational modes can be classified into several modes (s) such as maneuvering, sailing, etc., as presented in Section 2.
If ammonia is used as a hydrogen storage media onboard, more equipment for fuel processing such as a cracker and purifier have to be considered for ammonia’s catalytic decomposition and the purification of residual ammonia to deliver pure hydrogen into the PEMFC [52]. Thus, the efficiency of the auxiliaries has to be considered once calculating the ammonia consumption as shown in Equation (2).
F M P E M F C N H 3 = J o w t = 1 J o w t = 3 O M = s O M ( 1 + f s e , f ) P O M , o w t T O M , o w t η F C η c r η p u L H V H 2 X H
where η c r and η p u are the efficiencies of the cracker and purifier that are assumed to be 80% and 90%, respectively, while (XH) refers to the hydrogen content in ammonia, i.e., 17.8% [43,53].
Once investigating FC integration onboard, the start-up period has to be considered too, particularly for SOFC [54,55]. For this purpose, it is proposed to install a battery rack onboard the ship to cover the heating-up energy required for the FC during the start-up period. The function of the battery rack is to heat up the system to reach its operating temperature; after that, the FC generates the required electricity to propel the ship. For PEMFC, the heating-up energy depends on the fuel used, since the utilization of ammonia as a hydrogen carrier requires more heating energy than using pure hydrogen due to the presence of a cracker and purifier. Therefore, the formula in Equation (3) can be used to determine the battery energy capacity required during the starting-up period for covering the heating-up energy of the FC system.
H E C B T , f = 1.5 P F C H E F F C , f
where H E C B T , f is the required battery energy capacity in kWh, subscript BT refers to the battery, P F C is the installed power of the FC, and H E F F C , f is the heating-up energy factor of the FC system measured in kWh/kW; its value varies with the FC type as shown in [43,56]. The capacity is proposed to be increased by 50% for considering the safety and battery’s state of charge issues.

3.1.2. Full Battery System Scenario

The battery rack is the key component of the power system under investigation, and its capacity must be adequate to ensure that the ship can travel a specific path. The lithium-ion battery type is proposed to be investigated in the current study as it has unmatched qualities compared to other types such as a high-energy capacity, lowered self-discharging rate, quick charging capability, and high number of battery cycles [57,58]. The installed battery rack’s energy capacity must be raised by 20% due to slow battery deterioration, which causes a capacity drop of up to 20% of its original capacity [59]. Additionally, the installed battery rack’s energy capacity has to be raised by an additional 30% (10% for safety and 20% to keep the minimal level of capacity) [59]. Consequently, the battery rack’s energy capacity ( E C B T ) has to coincide with the energy requirement of the ship to perform the functional unit and has to be raised by an overall percentage equal to 50% for the reasons listed before. Thus, it can be calculated as shown in Equation (4).
E C B T = J o w t = 1 J o w t = 3 O M = s O M 1.5 P O M , o w t T O M , o w t
Since the battery lifetime can be given and expressed as the number of battery cycles, the batteries are replaced several times based on the ship’s lifetime and the number of trips per year. The number of replacements ( N R E , B T ) can be calculated as shown in Equation (5).
N R E , B T = L T s h i p J o w t , a n n 3 Y B c 1
where L T s h i p is the lifetime of ship in years, J o w t , a n n is the number of OWT annually (ann), and Y B c is the number of battery cycles. The first part of Equation (5) is divided by three as each battery cycle is assumed to cover three consecutive trips as a functional unit for the case study. Moreover, a subtraction of one exists in Equation (5) that indicates the initial installation of batteries in the investment phase.

3.2. Total Cost Assessment Method

The economic evaluation of different power systems can be performed by using the total cost assessment which considers the total costs of a power system configuration during the ship’s lifetime. In this study, the total costs have been divided into three terms CapEx, OpEx, and VoyEx.
Firstly, the CapEx represents the investment and installation costs of the power system. The OpEx includes the maintenance/operating and replacement costs. Moreover, VoyEx denotes the costs of fuel consumption/electricity onboard the ship annually. Therefore, the total cost of the clean power system can be calculated as shown in Equation (6).
T C c p s = C a p E x c p s + n = 1 L T O p E x c p s , n + n = 1 L T V o y E x c p s , n
where T C c p s is the total cost of a clean power system (cps) over its lifetime, and (n) is the number of years in the ship’s lifetime (LT).

3.2.1. Capital Expenses (CapEx)

The CapEx is the total investment cost of the clean power system. The proposed clean power system is composed of five categories which are the power generation system, fuel storage system, power conditioning equipment, fuel processing equipment, and electric motors. The power generation system can be PEMFC, SOFC, or battery racks. The fuel storage system cost is an important component of a clean energy system’s CapEx because the fuel is different from conventional marine fuels, especially in the case of a power system’s replacement like the current study. The cost of power conditioning equipment includes the cost of a DC/DC converter and DC/AC inverter. The formula that is used to calculate the CapEx of the proposed clean power system is shown in Equation (7).
C a p E x c p s = C F p s × P p s + C F f s s × F C F C f + p c e C F p c e × P p s + C F e m × P p s + o c C F o c × P p s
where P p s is the rated power of the proposed power system measured in kW in the case of PEMFC or SOFC and measured in kWh in the case of full battery electric system. In Equation (7), there are cost factors (CF) that vary with the components as follows: C F p s is the cost factor of the power system measured in EUR/kW or EUR/kWh, C F f s s is the cost factor of the fuel storage system measured in EUR/kg-fuel, C F p c e is the cost factor of the power conditioning equipment measured in EUR/kW, C F e m is the cost factor of the electric motor measured in EUR/kW, and C F o c is the cost factor of other components such as the reformer and cracker measured in EUR/kW. The cost factors of the power system components and their major technical parameters are shown in Table 2.
The cost factors for storage tanks of ammonia, methanol, and LNG can be calculated by using the mathematical equations available in [30] that correlate the required storage capacity with the cost of the storage tank.

3.2.2. Operational Expenses (OpEx)

The second term in the total cost is the OpEx which includes the maintenance cost of the power system annually and the replacement cost of some parts of the power system over its lifetime. For all power systems, it is assumed that maintenance costs are associated with a growth rate of 2% annually. The maintenance cost of an electric battery power system is taken as 1% of its CapEx per year [62]. While the batteries must be replaced a certain number of times during the ship’s lifetime as calculated before in Equation (5), the cost of this can be calculated based on the forecasted average price in [61].
Similarly, the operational expenses of the FC system include maintenance costs and replacement costs. The annual maintenance cost of PEMFC and SOFC is assumed to be 2% of their CapEx [62]. The crucial parameter in the FC power system’s OpEx is the replacement cost as it is dependent on the FC lifetime and the forecasted number of replacements over the ship’s lifetime. Based on the literature review [56,68], the lifetime of FCs is approximately 20,000 h and their stacks must be replaced after implementing these operational hours, while the Balance-of-Plant (BoP) system of FC racks demonstrates a prolonged lifespan compared to its stack; therefore, only the replacement of FC stacks will be considered. As a result of the forecasted development in the market size of FCs in the transportation sector, the FC prices may be reduced to about half of today’s price [64]. Hence, the replacement cost of FC stacks is set to be 50% of its CapEx [64]. The number of replacements of the FC power system ( N R E , F C ) can be calculated as shown in Equation (8).
N R E , F C = L T s h i p J o w t , a n n T o w t Z F C 1
where L T s h i p is the lifetime of the ship in years, J o w t , a n n is number of OWTs per year, T o w t is the duration of OWT in (h), and Z F C is the lifetime of FC in hours. In the formula, there is a subtraction of one indicating the initial installation of FC in the investment step.
For the power conditioning equipment and the electric motor, there is no replacement required due to the high expected lifetime, but the annual operation and maintenance cost could be taken as 1% of its CapEx [62,69].

3.2.3. Voyage Expenses (VoyEx)

In the current paper, the VoyEx is based on the annual consumption of the energy carrier and its type. To estimate the annual VoyEx, it must be calculated by multiplying the energy carrier (fuel or electricity) consumption per trip by its price (EUR/kWh), then making a summation over all the trips per year as shown in Equation (9).
V o y E x c p s = J o w t = 1 J o w t , a n n E C C c p s , o w t C F e c
where V o y E x f is the annual VoyEx in EUR/year, E C C is the energy carrier/fuel consumption measured in kWh, and C F e c is the cost of the energy carrier measured in EUR/kWh. The cost of hydrogen, ammonia, LNG, and methanol based on the recent prices are 100, 81, 58, and 61 EUR/MWh, respectively [56,70,71], while the electricity cost is assumed to be 226 EUR/MWh based on the average price in the last five years in Italy [72]. Due to the lack of information available regarding the bunkering operation fees of alternative fuels, these fees have been neglected in the current study.

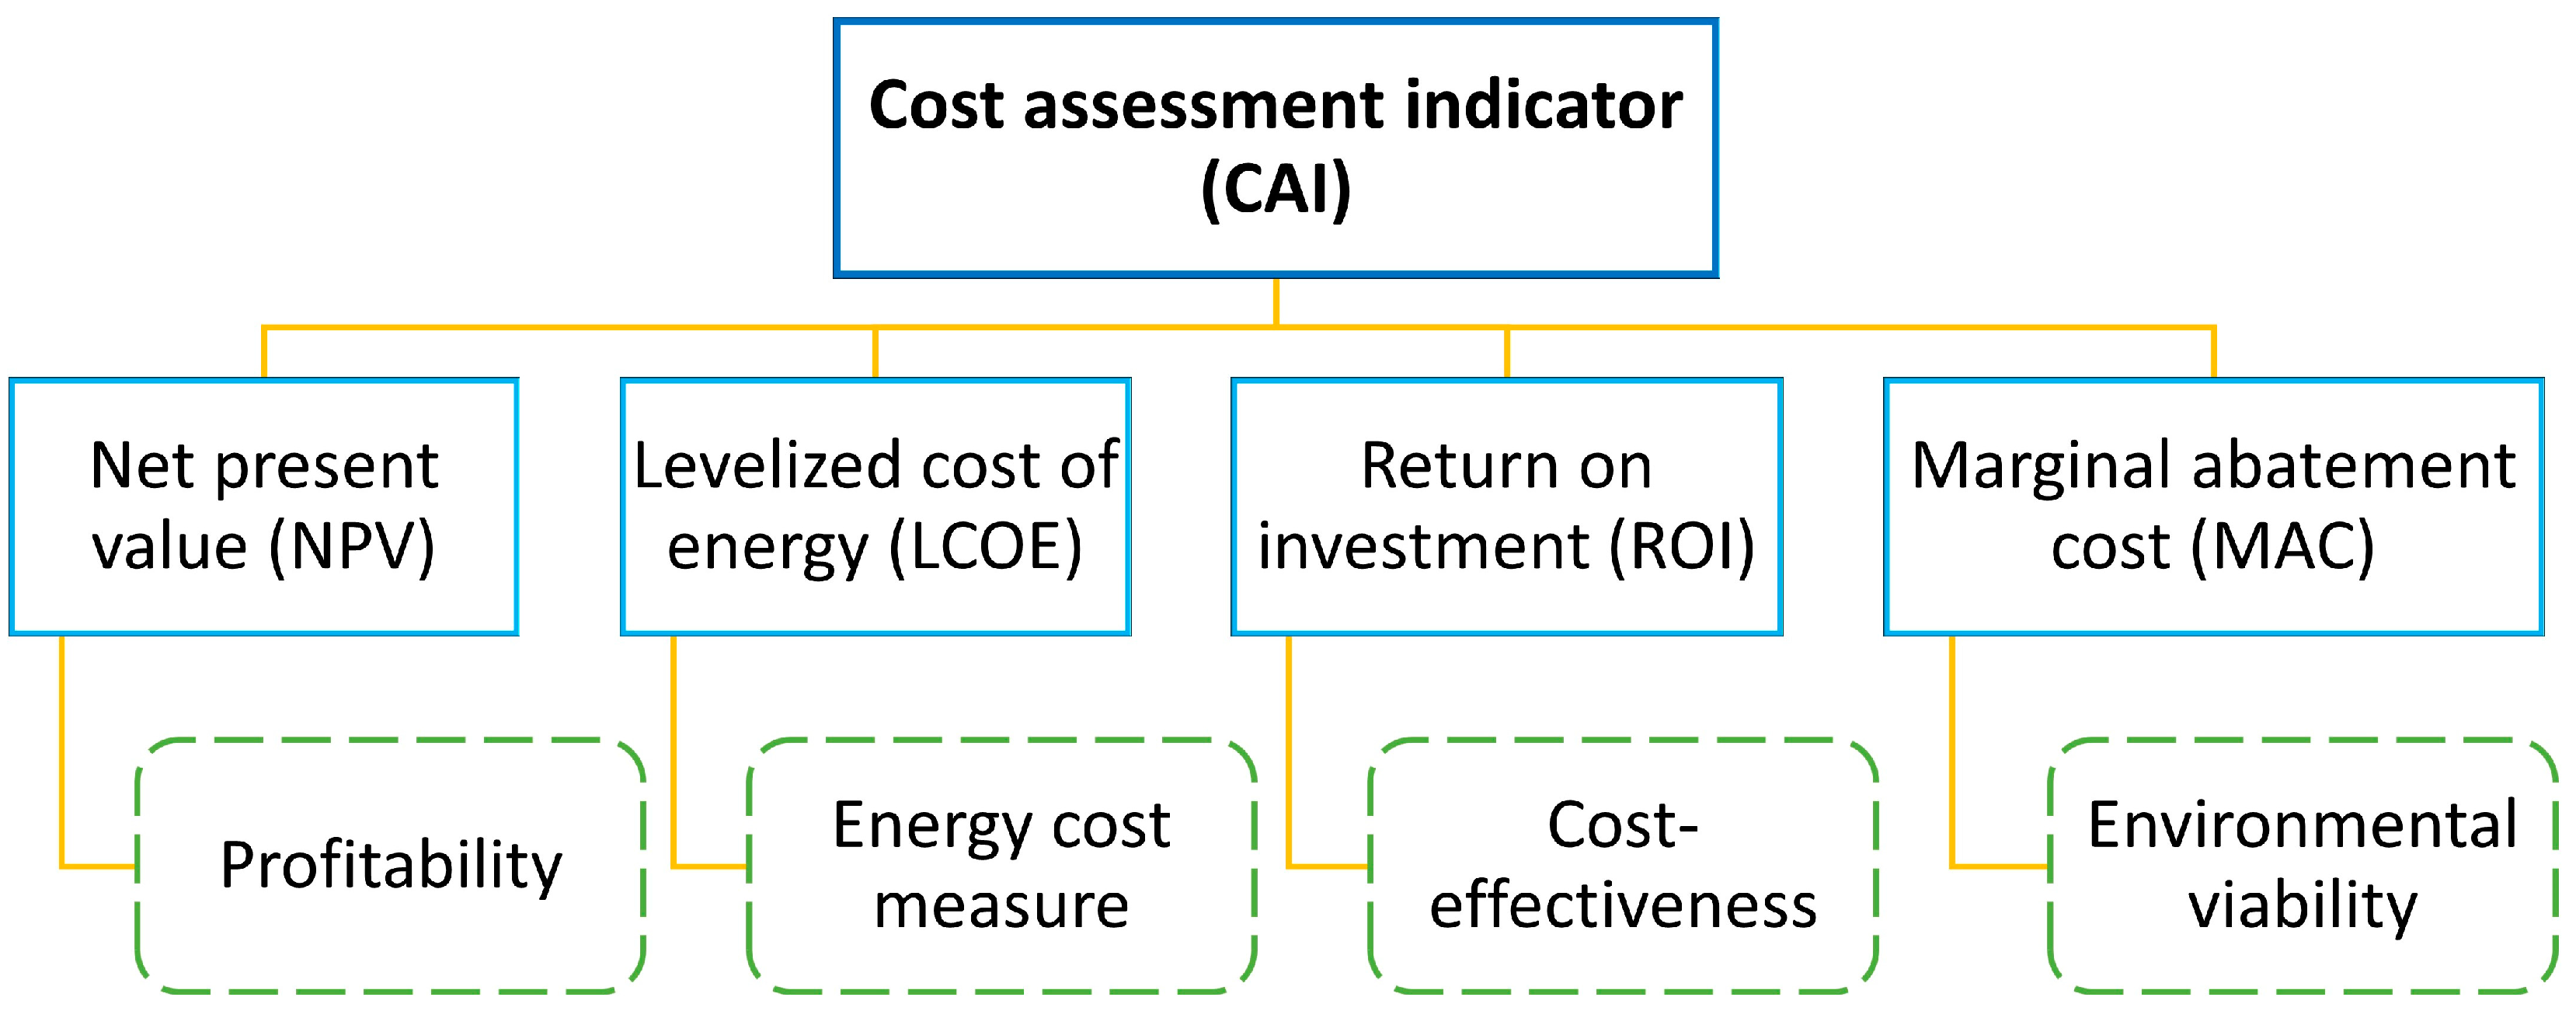
3.3. Cost Assessment Indicators

By bringing the entire expenses of various power systems down to the Net Present Value (NPV), it is possible to compare their total costs with each other. According to Equation (10), the NPV of the proposed clean power system (cps) is evaluated.
N P V c p s = C a p E x c p s + n = 1 L T O p E x c p s , n ( 1 + d ) n + n = 1 L T V o y E x c p s , n ( 1 + d ) n
where d implies a discount rate that is set at 5%, and n is the number of years. Furthermore, LCOE can be used to compare different alternative power systems in terms of the energy cost measure on a consistent basis. LCOE depends mainly on the NPV of the clean power system and the total energy generated from it. LCOE can be calculated as shown in Equation (11) [73], in which E o w t , n is the total energy generated in MWh during OWT through the year (n).
L C O E c p s = N P V c p s n = 1 L T J o w t = 1 J o w t , a n n E o w t , n ( 1 + d ) n
Additionally, the return on investment (ROI) may be calculated in order to gain a sense of the cost-effectiveness of the clean power system, as presented in Equation (12).
R O I c p s = n = 1 n = 20 O p E x D P , n O p E x c p s , n + n = 1 n = 20 V o y E x D P , n V o y E x c p s , n C a p E x c p s C a p E x c p s
As shown in Equation (12), the ROI is based on the difference between the operational and voyage expenses of each clean power system and the diesel-powered system (DP). The annual operational costs of diesel power systems are assumed to be 5 EUR/kW (2% of CapEx per year) as reported in [62], while its VoyEx is based on the recent price of diesel fuel (1.85 EUR/Liter) in Genoa refueling stations [74].
Moreover, MAC is a crucial indicator in the economic and environmental assessment, specifically in the case of evaluating the financial rationale for pursuing and investing in a clean power system [75,76]. The MAC is defined as the ratio between the costs or savings that would be incurred from the retrofitting process of the vessel’s power system and the abated emissions over the lifetime of the ship that could guarantee a zero-emission journey to the ferry [77]. This indicator can be calculated for each power system by considering the total capital costs and the annual costs/savings discounted over the lifetime of the clean power system. The total capital costs and the annual costs discounted to the present value are expressed as NPV which can be calculated by using Equation (10). For the case study of retrofitting process, the savings result from the removed OpEx and VoyEx of the diesel-powered system discounted to the present value. In this study, the formula shown in Equation (13) can be used to calculate the MAC [78].
M A C c p s = N P V c p s ( n = 1 L T O p E x D P , n + V o y E x D P , n ( 1 + d ) n ) n = 1 L T ( E C O 2 , D P E C O 2 , c p s )
where E C O 2 , D P is the annual carbon dioxide (CO2) emissions displaced from the diesel-powered system that is proposed to be replaced and E C O 2 , c p s is the annual CO2 emissions resulting from the clean power system, if available. The displaced annual CO2 emissions from the diesel-powered system can be calculated by multiplying the annual diesel fuel consumption by the CO2 emission factor (3.206 kg-CO2/kg-fuel) [79]. On the other hand, there are no CO2 emissions from all power systems that are proposed in the paper except the SOFC system powered by natural gas: its emission rate is equal to 308 kgCO2/MWhe (per each electricity unit produced) as reported in the datasheet of Bloom Energy [80]. Moreover, the SOFC system powered by methanol has a significant CO2 emission resulting from the methanol reforming process that can be calculated as shown in [81,82].
Since cost-assessment indicators depend on various assumptions such as the costs of fuel energy and electricity, sensitivity analysis is proposed to be applied for discussion regarding the credibility of the results. In the sensitivity analysis, the fuel and electricity costs are proposed to be varied by ±30%, with an increment of 10%.

3.4. Design Feasibility Assessment Method

The feasibility assessment based on the design perspective intends to evaluate the weight and volume of the clean power system to assess its viability to be installed onboard. Similar to the economic feasibility, the weight and volume of the proposed clean power system is based on the weight/volume of each component as shown in Equations (14) and (15).
W c p s = P p s G D p s + W f s s + p c e P p s G D p c e + P p s G D e m + W o c
V c p s = P p s V D p s + V f s s + p c e P p s V D p c e + P p s V D e m + V o c
where W c p s and V c p s are weight in (kg) and volume in (m3) of the clean power system. The weight and volume of each component is expressed in terms of its gravimetric power density (GD) and volumetric power density (VD) as (GD) is measured in kW/kg, while (VD) is measured in kW/m3. As shown in Equations (14) and (15), the weight and volume are based on the rated power of the proposed power system ( P p s ).
Regarding the fuel storage system, its weight and volume ( W f s s and V f s s ) can be calculated based on the mathematical functions in [30] that correlate the required storage capacity with the weight and volume of the storage tank. These functions were created using extensive market research, literature studies, and confidential discussions with the authors’ research group’s industry partners. There are mathematical functions for storage tanks of hydrogen, ammonia, LNG, and MeOH; moreover, there are other functions for fuel-processing equipment to calculate its weight ( W o c ) and volume ( V o c ).
Based on the technical specifications gathered by the authors in [35] for the commercial products of PEMFC and SOFC, there is a suitable PEMFC commercial product from Ballard [83] called Fcwave, which is designed for maritime applications and certified by DNV to be employed in marine environments. For the SOFC, there is a commercial system available from Bloom Energy called Energy Server 5 [80] which is utilized for stationary applications and not certified yet to be employed in marine environments. Regarding the full battery scenario, there is a commercial product available in the market from Corvus that is called Corvus Dolphin Energy [84], and it can be selected for the design feasibility assessment of the case study. The technical specification of the selected commercial products is shown in Table 3 with a focus on the volumetric density and gravimetric density.
The weight and volume of the electric motor can be calculated based on the commercial products available from ABB [85] that are fulfilled with classification societies’ requirements. Furthermore, the weight and volume of the power conditioning equipment such as DC/DC converters can be calculated based on a commercial product available in [86]. It is considered to use the same power condition equipment for all clean power systems.

4. Results and Discussion

This section investigates the feasibility results of replacing the conventional diesel power system onboard the NaveBus by using three alternative power system scenarios. The section is divided into three subsections, the first one is related to the energy analysis results based on the alternative power system scenarios, while the second and third subsections represent the feasibility assessment results from the economic and design points of view, respectively.

4.1. Energy Analysis Results

The energy analysis is a critical investigation, especially in the replacement of a conventional system with a clean one such as that proposed in this paper, because the number of installed FC/battery modules depends on the required power/energy to accomplish the identified functional unit. Moreover, energy evaluation is crucial for designing a suitable fuel storage system, especially by using alternative fuels characterized by a different volumetric density compared to conventional diesel fuel. Based on the collected data onboard the ferry and the operational profile described in Figure 2, the electric power and energy requirements for the case study are shown in Table 4.
In fact, the FC efficiency varies with the rated power and the load factor for each operational mode. For the current study, this variation can be between 46.5% and 53.5% for PEMFC, while the efficiency varies between 51.5% and 58.5% for the SOFC scenario. On the other hand, the energy capacity of the full battery scenario must be increased by 50% more than the estimated energy at each operational mode as presented in Section 3.1.2. The results of the electric energy requirements based on the FC system and full battery scenarios are shown in Figure 6.
As shown in Figure 6 (left side), the total electric energy capacity to accomplish the functional unit of the case study (three OWTs) by using PEMFC and SOFC must be 2579 kWh and 2333 kWh, respectively, while the total battery capacity must be 1830 kWh. The sailing operational mode (C-D) contributes about 78% of the total required energy capacity for all scenarios.
The required fuel mass can be calculated for the PEMFC and SOFC scenarios by considering the LHV of each fuel. The results of fuel mass are shown in Figure 6 (right side) after adding a design margin of 10% for all cases.
As shown in Figure 6 (right side), the total required fuel mass to accomplish three trips in the case of the PEMFC powered by hydrogen and ammonia is 86 kg and 673 kg, respectively. Furthermore, in the case of SOFC scenario, the required mass of LNG, MeOH and ammonia is 190 kg, 463 kg, and 489 kg, respectively.

4.2. Economic Feasibility Assessment Results

In this subsection, the results of the economic feasibility for the alternative power systems are presented based on the methodology discussed in Section 3. The results of the total cost of alternative clean power systems are presented in Figure 7, in which different options are assessed based on different cost categories that include the capital cost of the power system. Moreover, it includes the total expected OpEx and VoyEx over the lifetime of the ship (that is assumed to be 20 years).
As shown in Figure 7, the VoyEx expenses have the highest contribution to the total cost over other expenses for all PEMFC scenarios and the full battery scenario; this is because of the high expenses of the fuel/electricity. The ammonia-powered SOFC system demands a significant quantity of ammonia; hence, its VoyEx costs are greater than the SOFC systems operated by LNG or methanol. Although SOFC power systems have a higher efficiency than PEMFC and require less fuel to generate electricity onboard the ship, the CapEx of SOFC systems powered by different fuels is higher than the CapEx of PEMFC systems and full battery systems. On the other hand, the OpEx of the full battery system is quite similar to the PEMFC systems, while it is lower than the OpEx of SOFC systems. The OpEx of SOFC systems is constant when using different fuels, as it depends on the replacement cost and maintenance cost that is independent of the type of fuel.
To figure out the profitability of the clean power system, the total costs are converted to the NPV to compare the alternative options with each other as presented in Figure 8. The results show that the hydrogen-powered PEMFC system is the best option in terms of NPV for the replacement of the existing power system onboard the NaveBus, as its NPV is equal to EUR 5.8 million which is lower than other clean power systems. Moreover, the NPV of ammonia powered PEMFC system and full battery system is EUR 6 million and 6.2 million, respectively. Due to the high VoyEx of the full battery system, the NPV of a full battery system is greater than that of a PEMFC system.
The NPV of SOFC systems depends on the fuel type and ranges from around EUR 8.1 million to 8.8 million. When a hydrogen PEMFC system is compared to SOFC power systems in terms of NPV, it is lower than them by about EUR 2.4–3 million depending on the type of fuel used inside the SOFC. This is mainly because of the high capital expenditure of the SOFC power system and the low OpEx of the PEMFC power system.
Furthermore, it is important to assess the energy cost level of the different clean power systems that can be determined by calculating the LCOE as presented in Section 3.3. The results reveal that the LCOE of the full battery system is equal to 427 EUR/MWh, while the LCOE of the PEMFC powered by hydrogen and ammonia is 396 EUR/MWh and 410 EUR/MWh, respectively. On the other hand, the LCOE of the SOFC power system varies between 558 EUR/MWh and 600 EUR/MWh based on the fuel type. Therefore, the hydrogen-powered PEMFC system is the most economically feasible option for the retrofitting process onboard the NaveBus as it has the lowest cost of energy, followed by the full battery system scenario.
The cost-effectiveness of retrofitting the conventional diesel power system onboard the NaveBus with a clean power system is evaluated by using the concept of ROI as discussed in Section 3.3. The ROI is calculated based on the operational and voyage expenses difference between the diesel power system and the proposed clean power system over the lifetime of the ship. The results are shown in Figure 9.
As shown in Figure 9, the ROI varies with the power system whether it is a PEMFC, SOFC, or full battery system. The results show that the full battery system scenario has the greatest profitability trend over other alternatives, as its ROI equal to 211% with an annualized ROI equal to 5.8%, while the ROI of a PEMFC operated by hydrogen and ammonia is 170% and 140%, with an annualized ROI equal to 5.1% and 4.5%, respectively. The PEMFC system and full battery system accomplish a high profitability because of their low CapEx at the initial investment and the low OpEx compared to the high diesel fuel costs that were eliminated by the retrofitting process. On the other hand, the SOFC system operated by ammonia has a negative ROI that proves that the system will not accomplish a profit over the entire lifetime of the ship due to its high CapEx and VoyEx.
The environmental viability of an alternative power system must be assessed when considering the retrofitting of a ship’s power system and investing in a clean power system as an emission reduction option. Therefore, the MAC of each scenario is calculated to figure out its environmental viability and ease the investment decision. The MAC is based on the NPV results and the expected displaced CO2 emissions when applying the alternative power system. Figure 10 shows the MAC results of different power systems on the y-axis, while the total CO2 emissions abated over the lifetime are shown on the x-axis. The negative values of MAC indicate the amount of cost-saving that was achieved to abate 1 ton of CO2, while the positive values refer to the cost required to abate 1 ton of CO2.
A total of 18,255 tons of CO2 are expected to be displaced over the lifetime by using a full battery system, a PEMFC operated by hydrogen or ammonia, and an SOFC system operated by ammonia. As shown in Figure 10, the hydrogen-powered PEMFC system has the highest environmental viability, as it abates a high amount of emissions at the lowest price. Moreover, the hydrogen PEMFC will guarantee a saving equal to 60 EUR per ton of CO2 abated; therefore, this scenario should be prioritized for the retrofitting process. This scenario is followed by PEMFC operated by ammonia and the full battery system, as they also guarantee a saving equal to 49 and 35 EUR/ton-CO2, respectively.
Although the capital cost of the SOFC system operated by different fuels is almost the same and their MAC has a positive value, the MAC when using ammonia (103 EUR/ton-CO2) is better than for SOFC operated by LNG and methanol (115 and 169 EUR/ton-CO2). The SOFC system operated by LNG and methanol displaces an amount of CO2 emissions equal to 11,041 and 8516 tons, respectively, over the entire lifetime which is equal to 60% and 47% of the abated CO2 emissions by other systems.
The variation in clean power system energy carriers (fuels and electricity) costs has impacts on VoyEx, of course. Such variations may arise due to uncertainty in their market prices (both quite volatile in recent years); therefore, it is crucial to discuss the credibility of the results by applying a sensitivity analysis. The effect of changing fuel and electricity costs on LCOE for each clean power system is shown in Figure 11.
As shown in Figure 11, by increasing the prices of energy carriers/fuels for different systems, the LCOE value is increased by a significant amount, especially the full battery and PEMFC systems as their LCOE increases by about 24% and 18%, respectively, when their energy carrier/fuel costs increase by 30%. This significant increasing trend resulted from the higher contribution of the VoyEx parameter in the total costs of the full battery and PEMFC systems. On the other hand, the LCOE of SOFC systems is increased by about 7–9% when fuel costs rise by 30%, as their VoyEx parameter has a lower contribution to their total costs when compared to their CapEx.
Moreover, the sensitivity analysis proves the credibility of the baseline case results, which show that with increasing or decreasing fuel costs as shown in Figure 11, the hydrogen-powered PEMFC has the lowest LCOE (468 EUR/MWh with a fuel cost change of +30%), followed by ammonia-powered PEMFC (483 EUR/MWh with a fuel cost change of +30%), and the full battery system (529 EUR/MWh with an electricity cost change of +30%), while the LCOE of the SOFC system powered by LNG, methanol, and ammonia (with a fuel cost change of +30%) is 595, 608, and 651 EUR/MWh, respectively.

4.3. Design Feasibility Assessment Results

This subsection investigates the feasibility results of replacing the conventional diesel power system onboard the NaveBus by using three alternative power system scenarios from the design point of view. For the retrofitting process of the NaveBus, there are some components that will be removed such as two diesel main engines, two gearboxes, two auxiliary generators, and two diesel fuel tanks. The estimated weight and volume of these removed parts is 16 tons and 26 m3.
By looking at the power and energy analysis results, the required power for the NaveBus at the maximum service speed reaches 750 kW, while the required battery energy capacity to perform three OWTs is 1830 kWh based on the full battery system scenario. Therefore, the weight and volume of the different power generation systems can be evaluated as discussed in Section 3.4. Moreover, the fuel mass has been calculated as shown in Figure 6 and by applying the mathematical formulas in [30], the weight and volume of the storage tanks can be calculated. The weight and volume of the different clean power systems are described in Figure 12 after applying the formula in Equations (14) and (15).
As shown in Figure 12, the most feasible scenario to guarantee a suitable retrofitting of the vessel in terms of weight and volume is the hydrogen-powered PEMFC system followed by the full battery system and the PEMFC system powered by ammonia. The ferry’s power system can be retrofitted by a hydrogen-powered PEMFC system without issues, as its weight and volume (11 tons and 17 m3) are lower than the removed parts’ weight and volume by a considerable percentage (31.3% and 34.6%). Moreover, the weight of the full battery system and PEMFC system powered by ammonia is 15 tons, while their volume is 11 m3 and 25 m3, respectively.
Although the SOFC has the advantage of fuel flexibility and higher electrical efficiencies than the PEMFC systems, the results showed that the power system based on SOFC is not feasible from the design point of view to be fitted inside the NaveBus as a propulsion system because of the limitation in volume and weight. The total weight of the SOFC system fueling by different fuels varies between 49 tons and 51 tons, while its volume is 88 m3, where the power generation unit contributes about 75–80% of the total weight and 83% of the total volume.
For the hydrogen-powered PEMFC scenario (the most feasible scenario), the required power for the NaveBus can be covered using four modules of Ballard Fcwave [83] that can deliver a rated power of up to 800 kW. Therefore, Figure 13 shows the block diagram of the propulsion system including the main components such as the FC modules, battery rack, DC/DC converters, DC/AC inverter, electric motor, and FPP. The four PEMFC modules are distributed through the engine room. Each PEMFC rack supplies power to the DC bus main switchboard (SWBD) through a DC/DC converter. The propulsion power is delivered to the electric motor through a DC/AC inverter.
Moreover, the ship service switchboard is supplied with electric power through a DC/AC inverter to deliver the required power for hoteling services such as lighting, fans, pump, etc. There is a small lithium-ion battery rack to support the PEMFC system during the transient loads and to cover the heating up energy required for the FC during the start-up period. The battery rack can be charged when the FC racks provide the load to propel the ship.
Furthermore, for the full battery system, based on the technical specifications of the battery rack available from Corvus [84] and that mentioned in Table 3, the required energy capacity of 1830 kWh can be covered by using 14 packs (each pack includes 16 modules, while the capacity of each module is 8.3 kWh).
Figure 14 shows the block diagram of the full electrical battery propulsion system including the main components such as the battery racks, DC/DC converters, DC/AC inverter, DC bus main switchboard, electric motor, and FPP. There are seven racks installed on each side of the ship to keep its stability and connected by the main SWBD through a DC/DC converter.

5. Conclusions

The current paper investigates the feasibility of replacing the conventional power system by using alternative clean power systems onboard one of the passenger ferries belonging to the short-sea navigation fleet. The case study is a ferry implementing a short sea journey and used in the port of Genova as a public transport vehicle. The ferry is analyzed to evaluate a “zero emission propulsion” retrofitting process. This type of ship is considered a suitable case for examining the viability of innovative technologies in the maritime industry because of their low energy consumption, their large audience impact, and their navigational routes which are close to the ports and the shore. The investigated clean power systems include fuel cell technologies and a full battery electric system. PEMFC, a low-temperature FC technology, and SOFC, a high-temperature FC, are both examined in this paper. The PEMFC is proposed to be operated by using alternative clean fuels such as hydrogen and ammonia, while LNG, MeOH, and ammonia are evaluated to power the SOFC.
The paper assesses the feasibility of installing the alternative clean power system instead of the diesel-powered system from the energy, design, and economic perspectives. The design assessment approach includes the assessment of the system’s weight and size with an emphasis on defining the system components, while cost-assessment indicators were employed to assess the viability of the power system from an economical perspective. The following is a summary of the study’s major results:
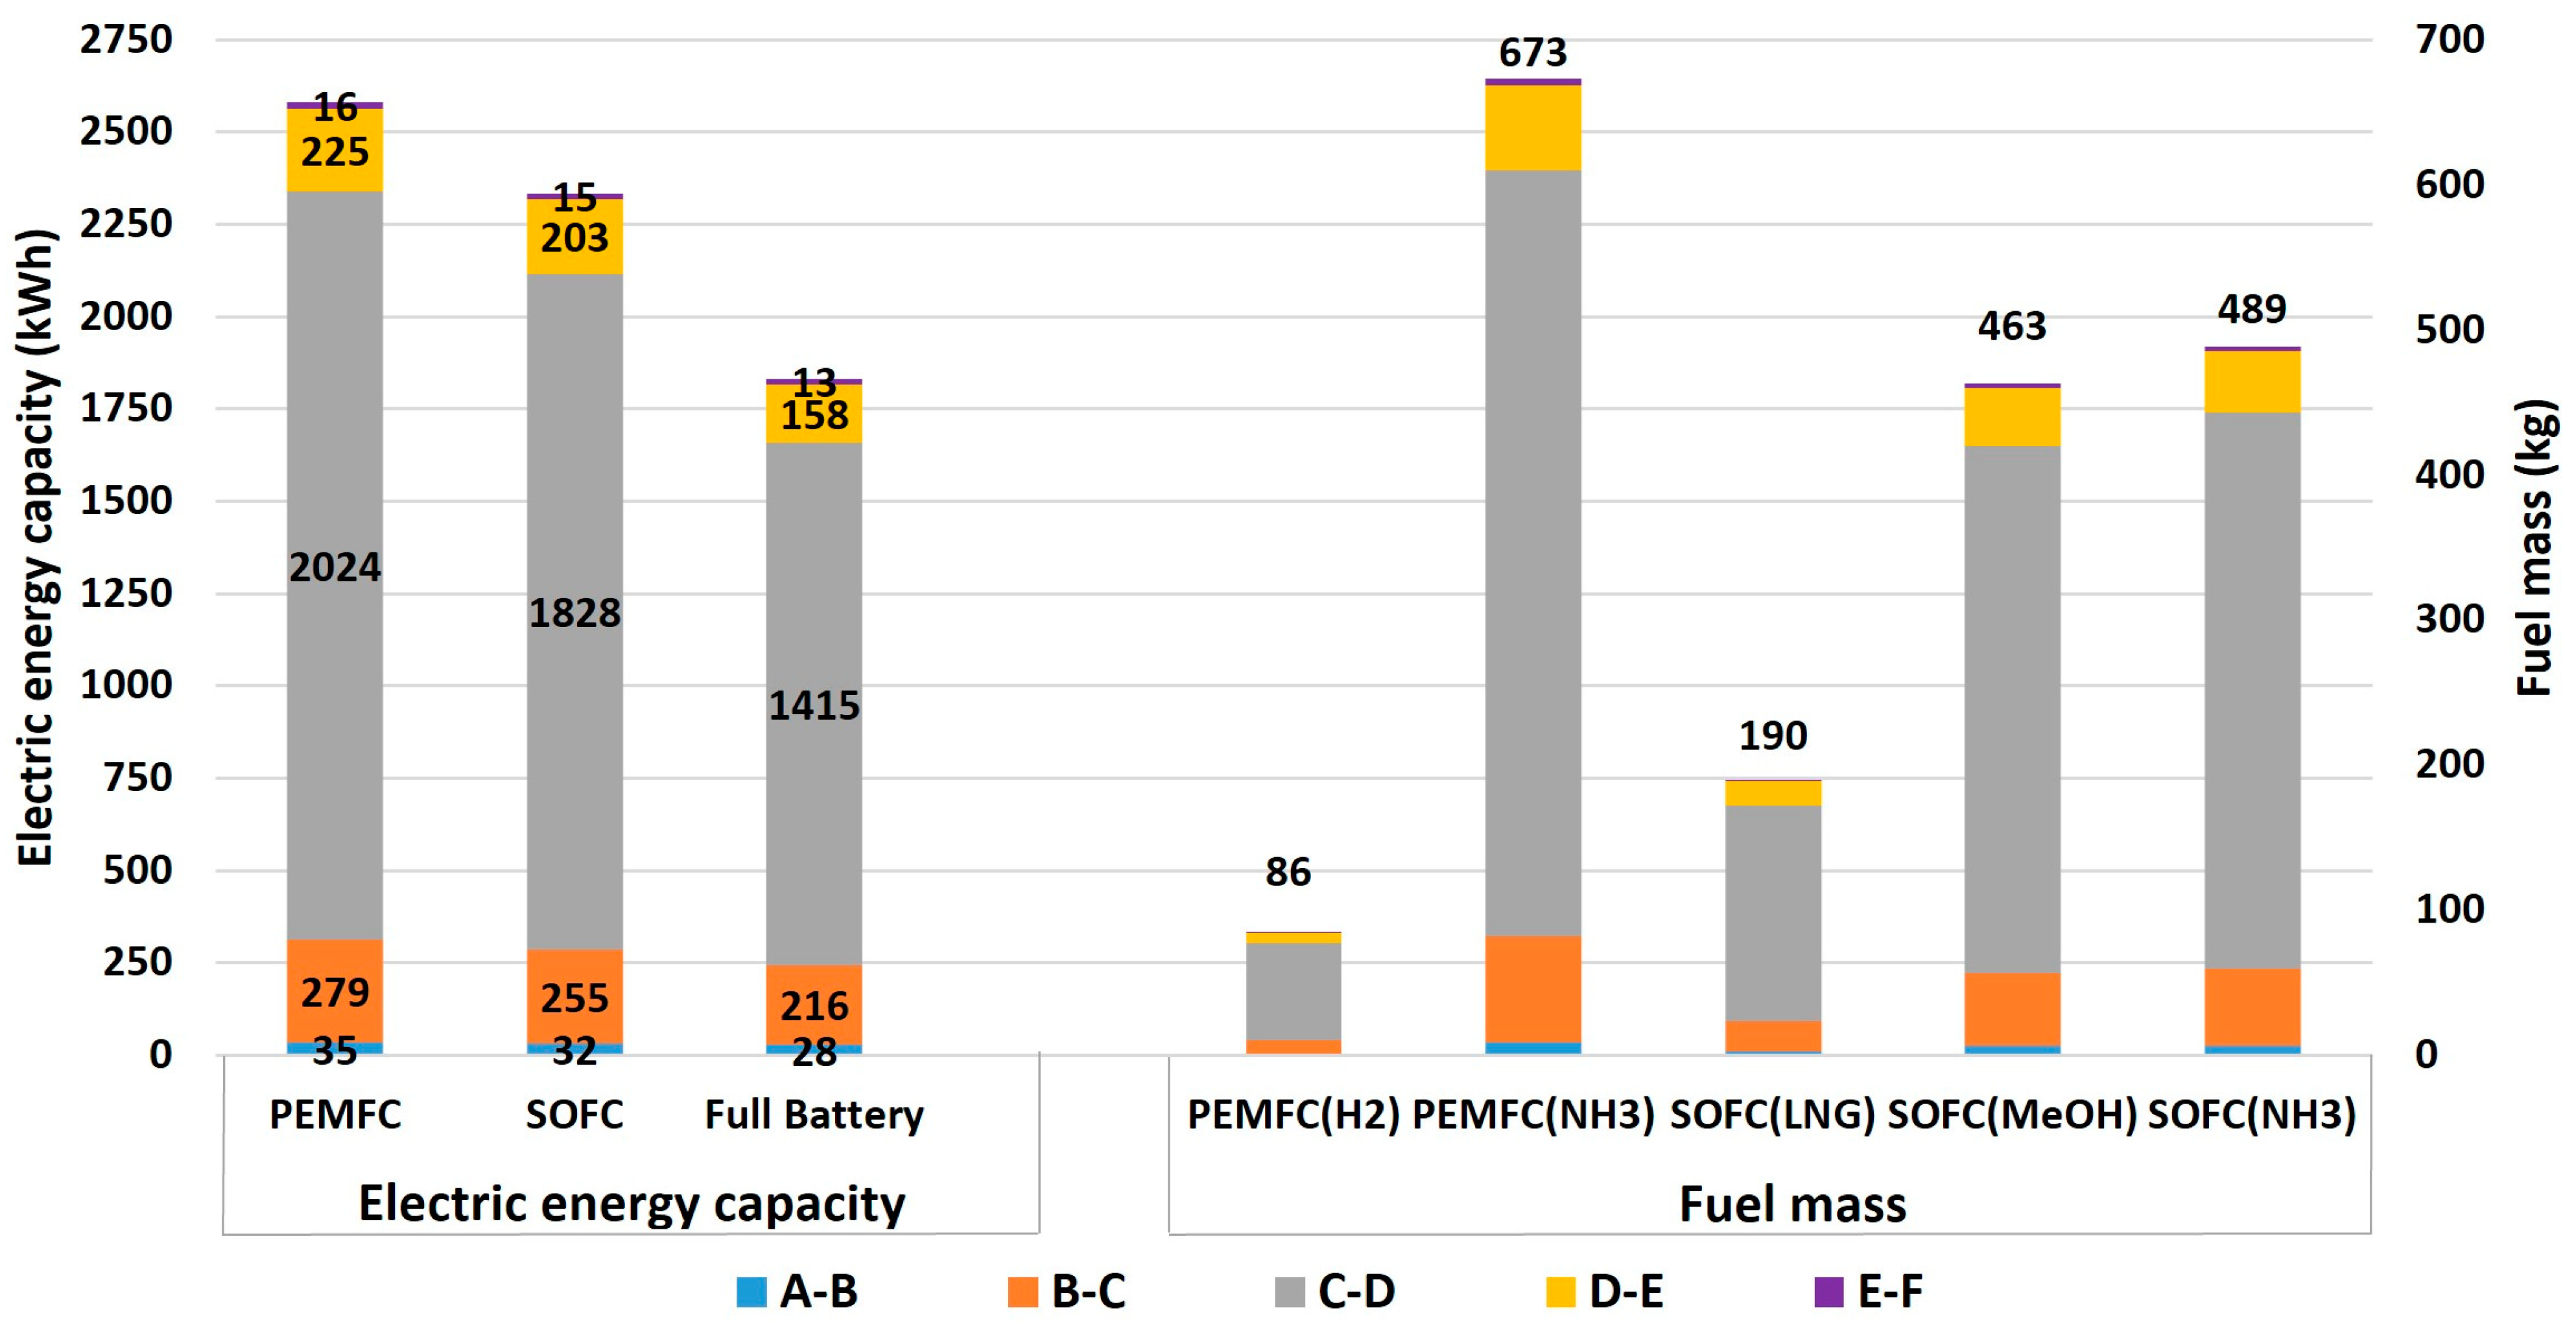
  • The total fuel energy capacity to accomplish the target three OWTs by using PEMFC and SOFC must be 2579 kWh and 2333 kWh, respectively, while the required battery energy capacity is 1830 kWh for the full battery system scenario.
  • Among the options taken into consideration, the PEMFC system fueled by hydrogen and ammonia has the lowest total costs at EUR 8.4 million and 8.6 million, respectively. However, due to its high voyage expenses (electricity cost), the full battery system scenario has a total cost of roughly EUR 9.6 million.
  • Despite the fact that the SOFC is more fuel-efficient and takes less fuel to produce electricity, the total cost assessment showed that the power system based on SOFC has higher total costs than other solutions.
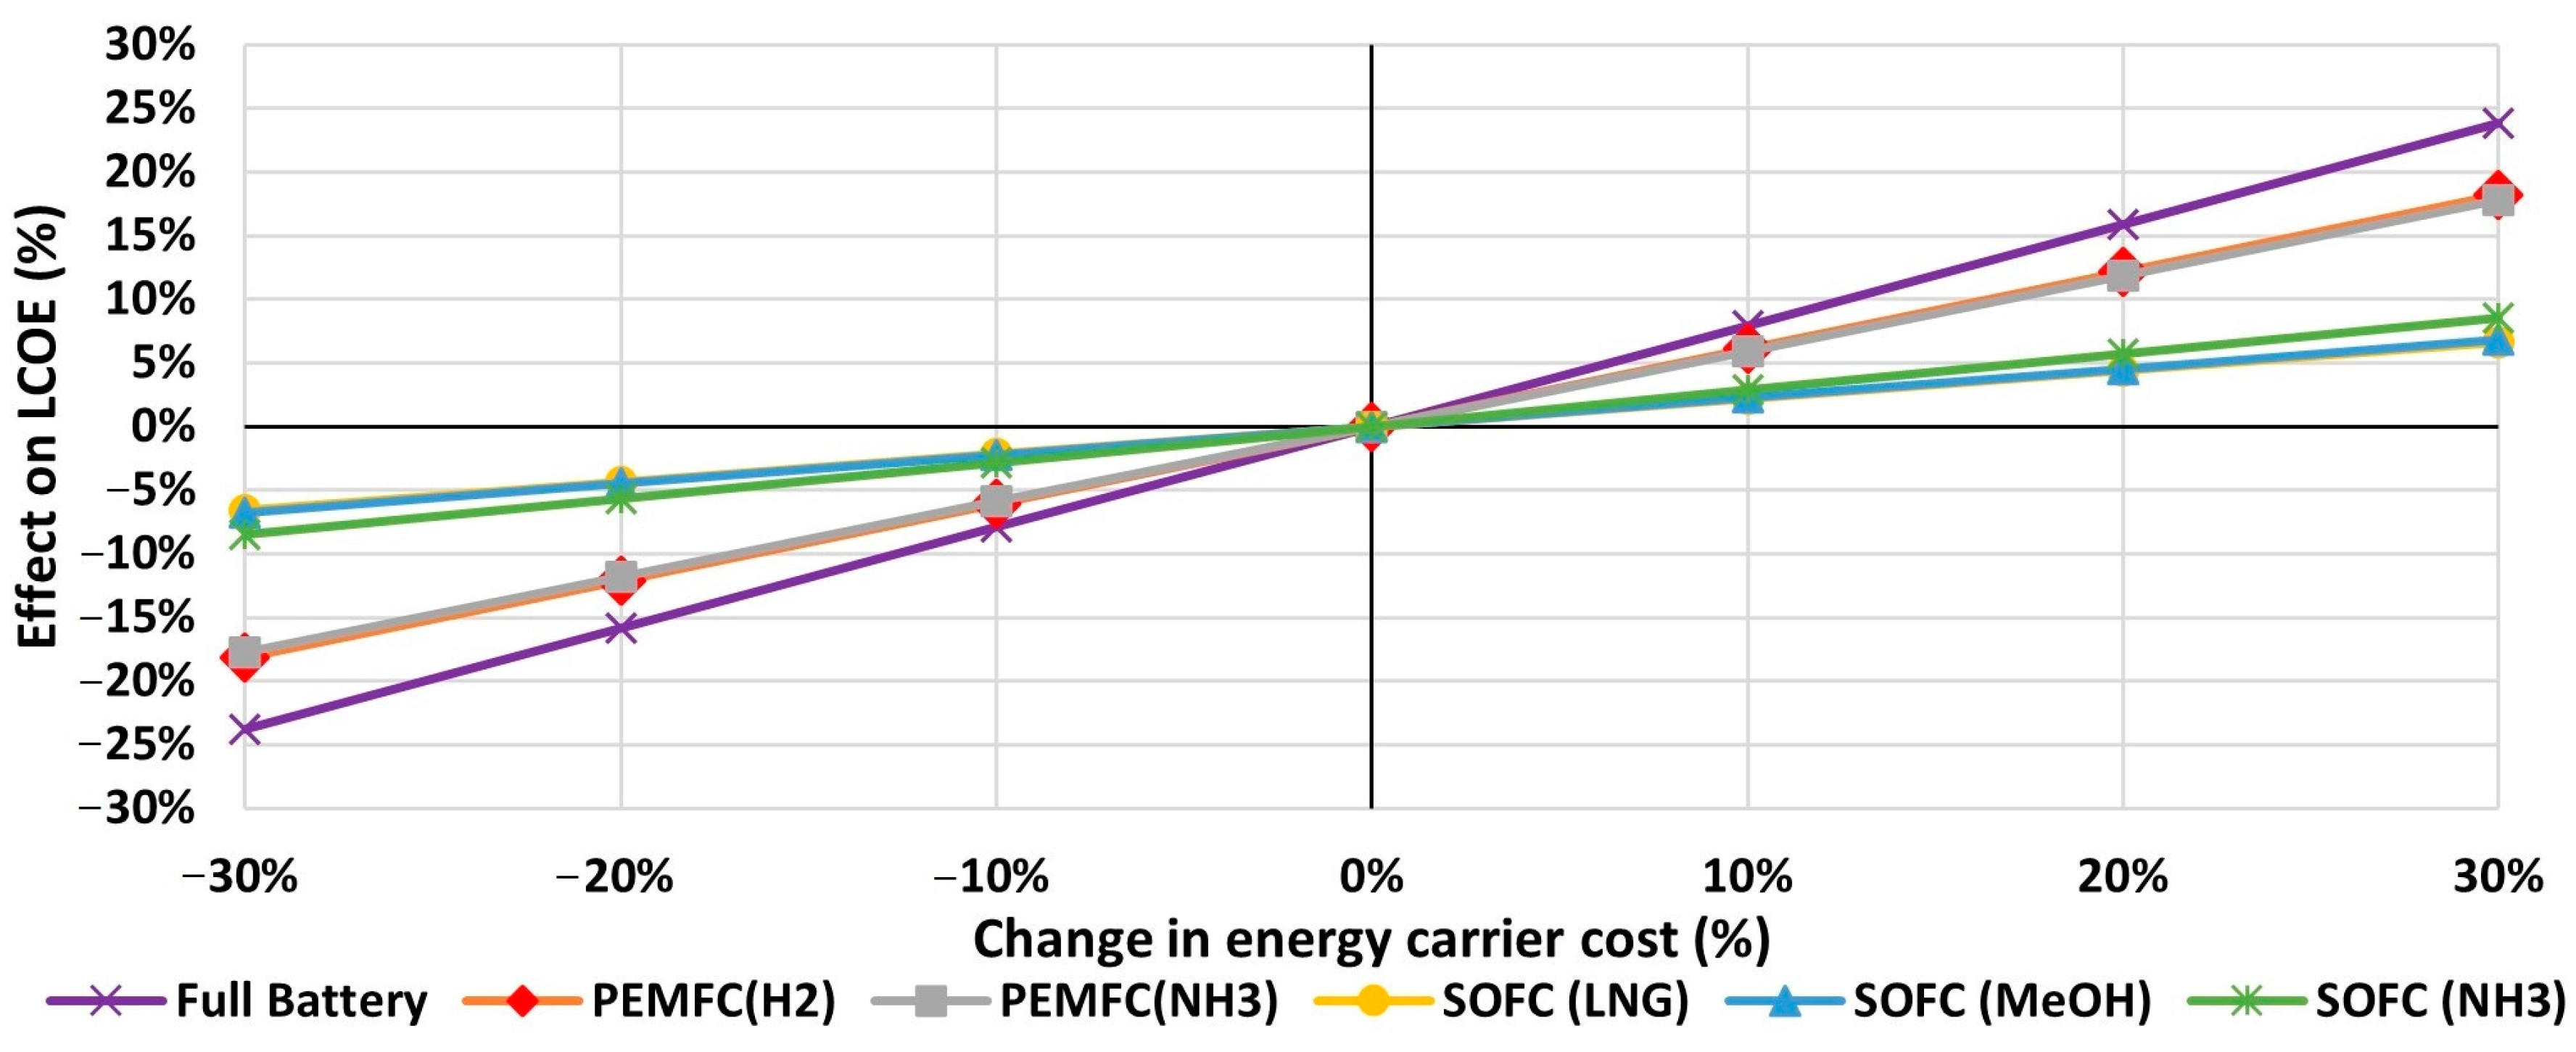
  • The results showed that the LCOE of the PEMFC system powered by hydrogen and ammonia is 396 EUR/MWh and 410 EUR/MWh, while the full battery system’s LCOE is 427 EUR/MWh. On the other hand, the LCOE of the SOFC power system varies depending on the fuel type and its value is between 558 and 600 EUR/MWh.
  • The results indicated that the cost-effectiveness of retrofitting the conventional diesel power system onboard the NaveBus by the full battery system scenario is viable and achieves an ROI equal to 211%. Moreover, the PEMFC system operated by hydrogen and ammonia has a high profitability trend, as the ROI is 170% and 140%, respectively.
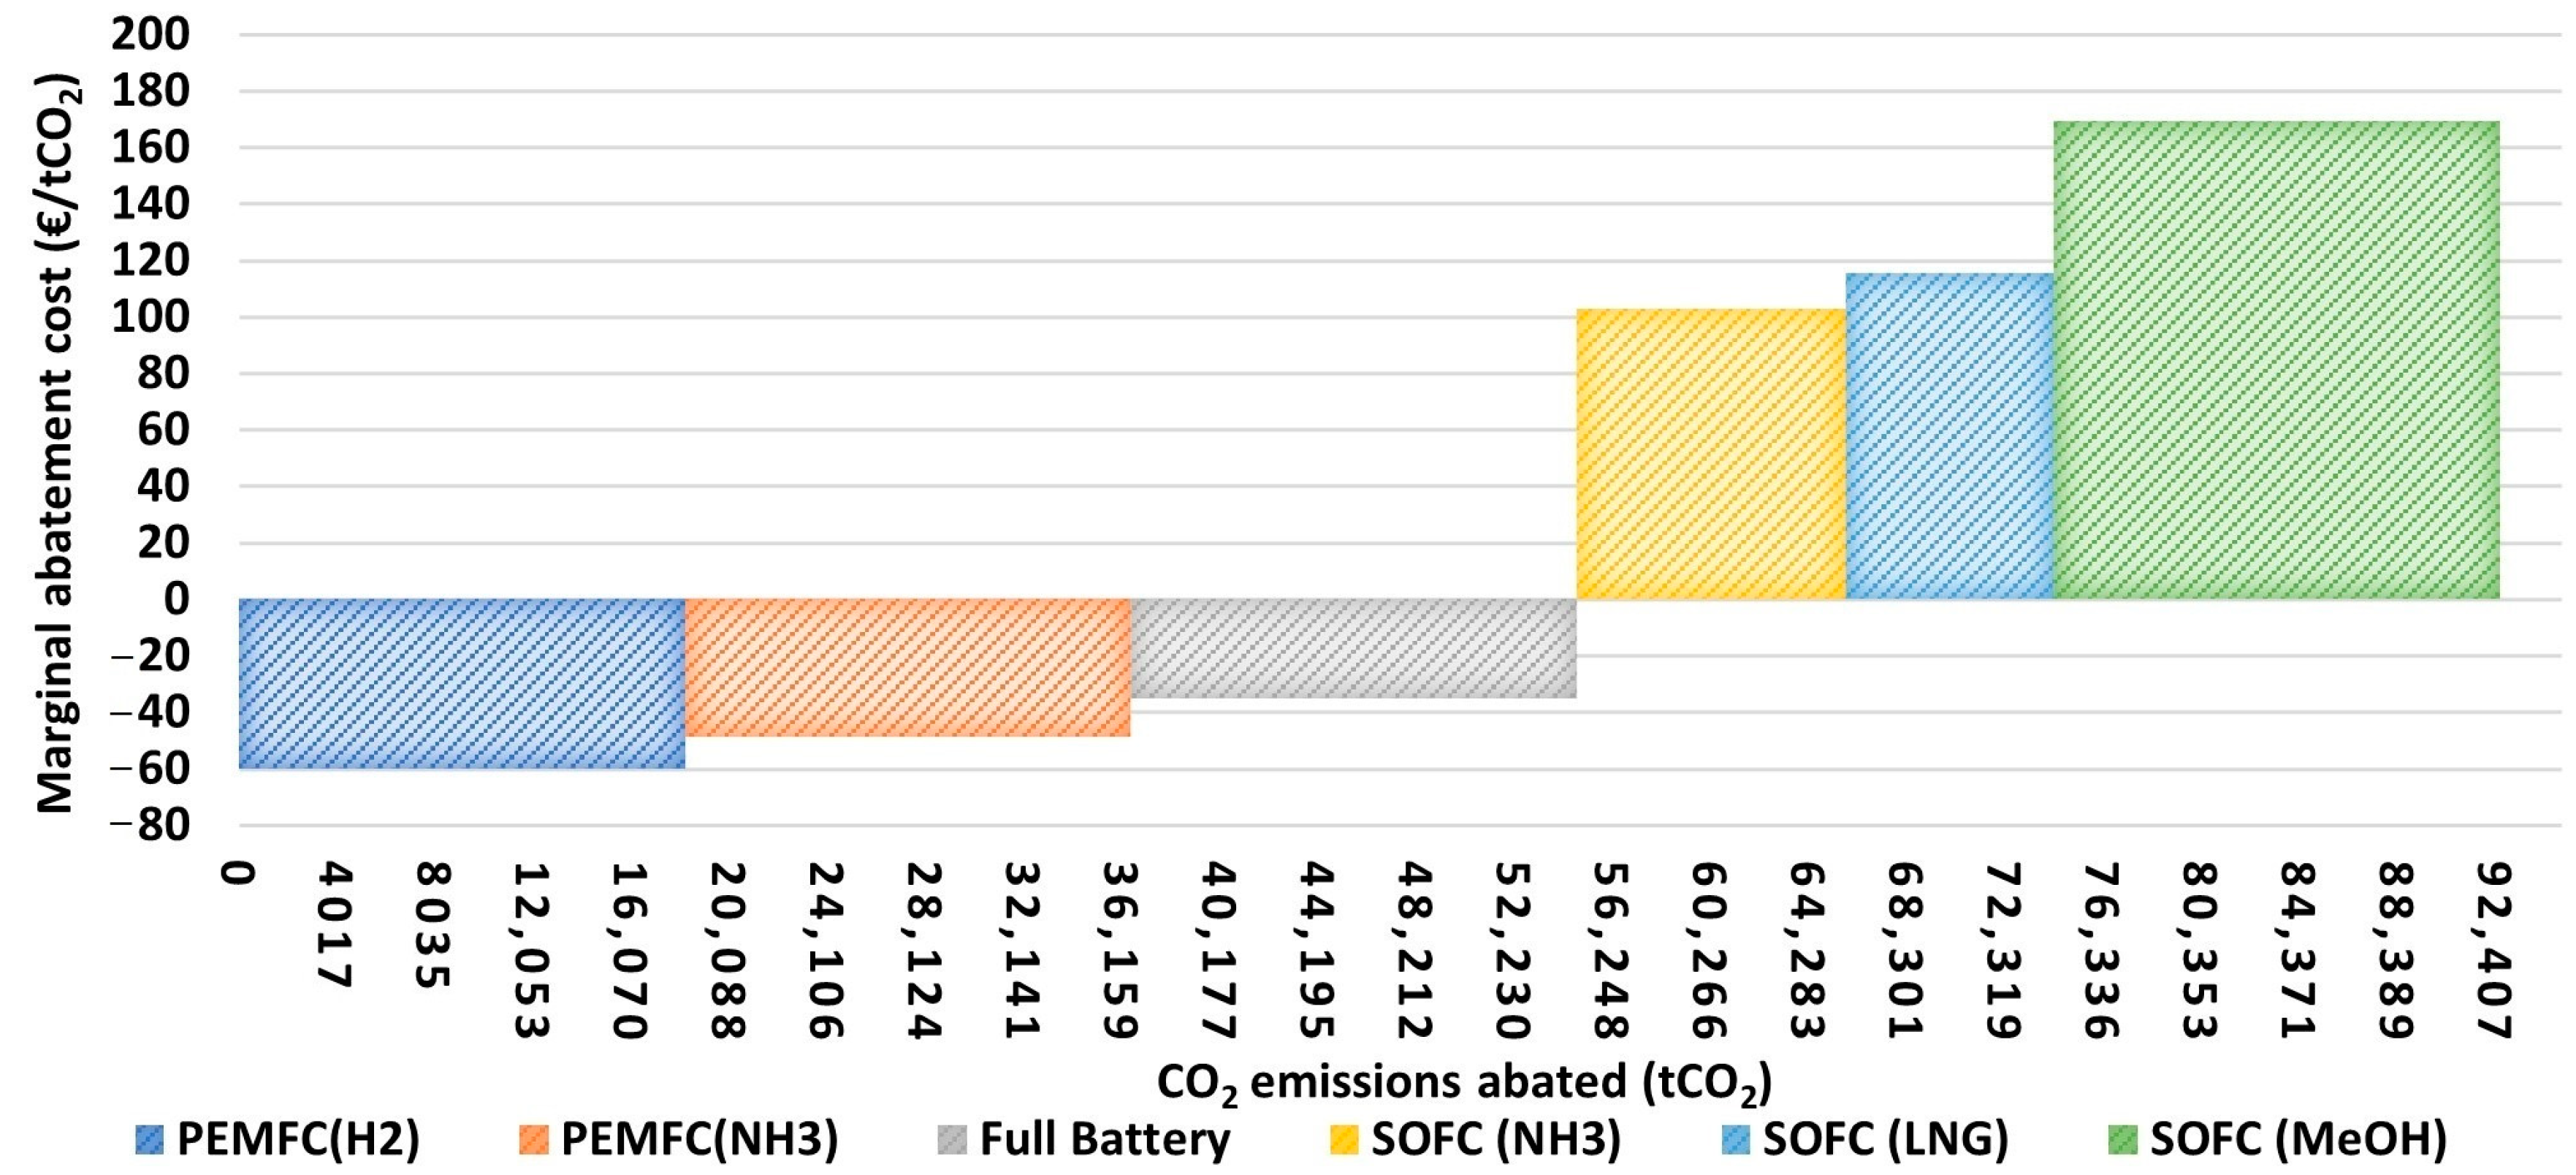
  • The PEMFC system powered by hydrogen has the best environmental viability over other options, since it achieves a high reduction in CO2 over the lifetime of the ship with a saving of 60 EUR/ton-CO2; hence, this scenario should be given priority during the retrofitting process.
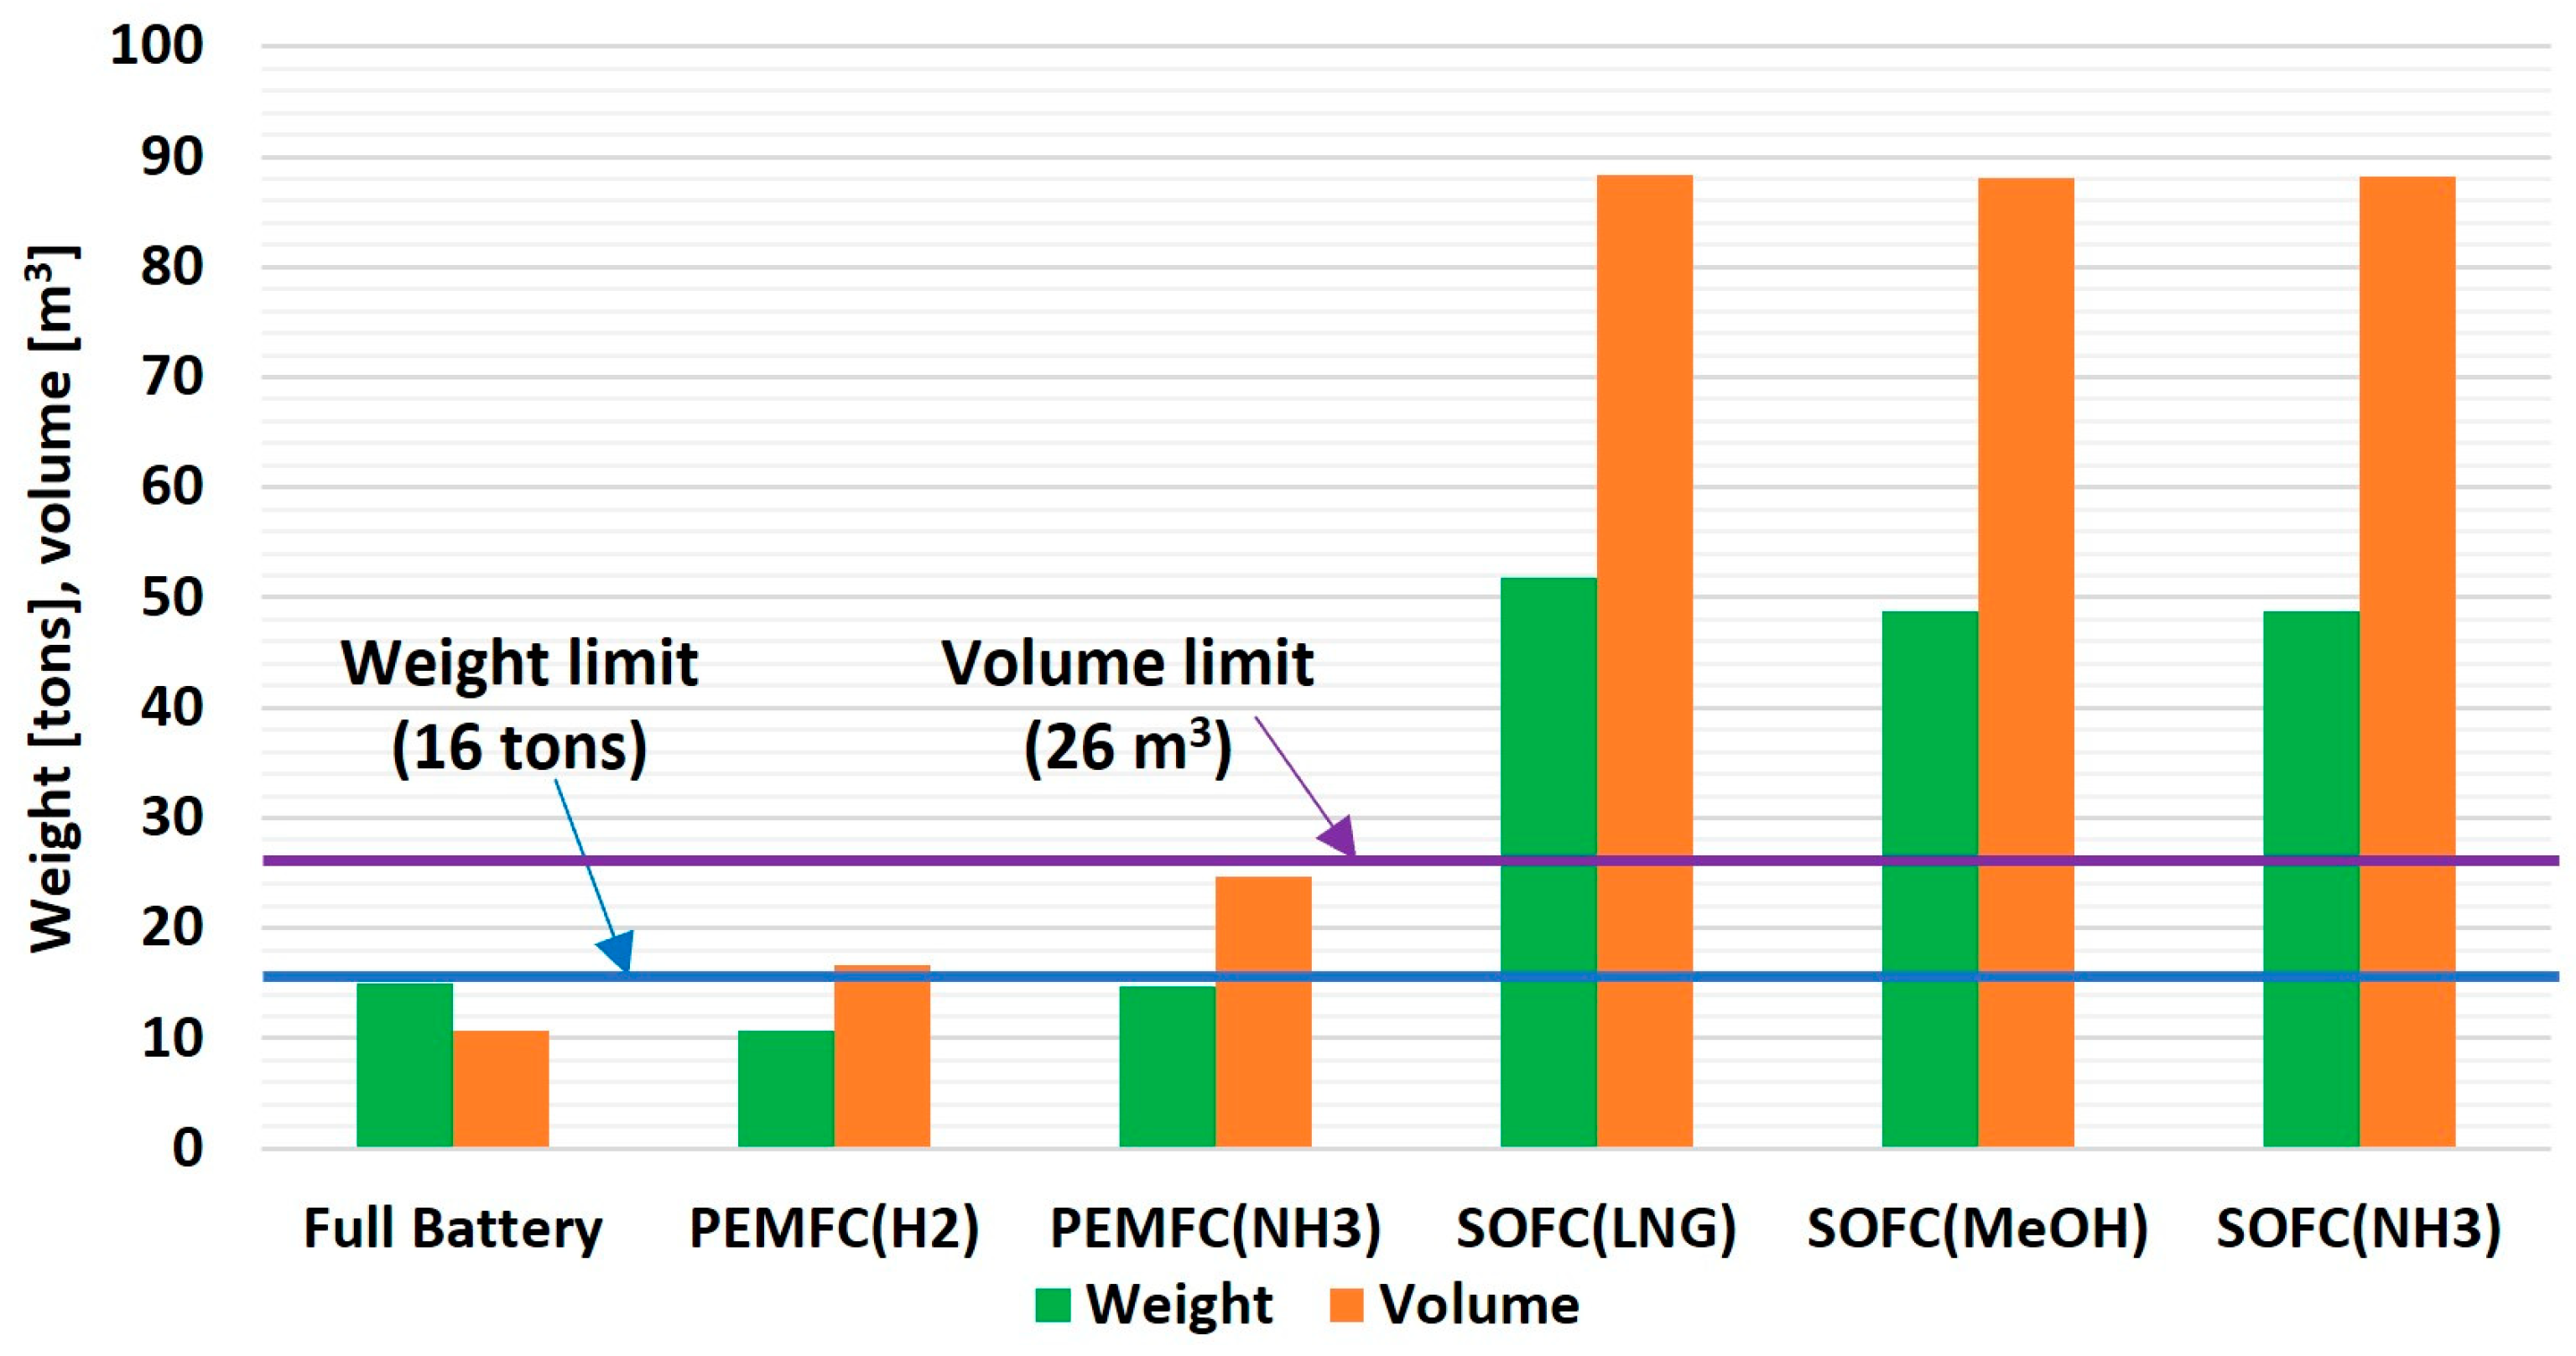
  • From a weight and volume perspective, the hydrogen-powered PEMFC system is considered the best clean power system to guarantee, for this specific case study, a suitable retrofitting of the diesel power system This is because its weight is lower by 31.3% compared to the removed parts’ weight, and its volume is lower by 34.6% compared to the removed parts’ volume.
  • The performed design feasibility study indicated that the power system based on SOFC technology could not be fitted inside the case study because of the limitation in volume and weight that is available onboard. The total weight of the SOFC system fueling by different fuels varies between 49 tons and 52 tons, while its volume is 88 m3.
Even though the paper primarily focuses on the NaveBus as a case study, the technical and economic feasibility assessment methodology that has been developed is generally applicable to other short-distance passenger ferries to achieve the decarbonization of ships working on short-sea navigation. For larger vessels, particularly looking at economic methodology, it would be important to consider savings in terms of CO2 taxes (as the vessel could be subject to ETS) and externalities (e.g., savings form sanitary systems expenses due to lower NOx, SOx, and PM emissions in urban environments).

Author Contributions

Conceptualization, A.G.E. and S.B.; methodology, A.G.E.; software, A.G.E.; validation, M.R. and A.F.M.; formal analysis, A.G.E.; investigation, A.G.E. and S.B.; resources, S.B. and M.R.; data curation, A.G.E.; writing—original draft preparation, A.G.E. and S.B.; writing—review and editing, S.B. and M.R.; visualization, A.G.E. and M.R.; supervision, A.F.M. All authors have read and agreed to the published version of the manuscript.

Funding

This research received no external funding.

Institutional Review Board Statement

Not applicable.

Informed Consent Statement

Not applicable.

Data Availability Statement

Not applicable.

Acknowledgments

The authors would like to acknowledge the technical support from the Liguria Via Mare Consortium and NaveBus crew for providing us with the required data for the case study.

Conflicts of Interest

The authors declare no conflict of interest.

Nomenclature

Abbreviations
BoPBalance of plant
CAICost-assessment indicators
CO2Carbon dioxide
DCDirect current
DNVDet Norske Veritas
ETSEmission trading system
EUEuropean Union
FCFuel cell
FPPFixed-pitch propellers
GHGGreenhouse gases
IMOInternational Maritime Organization
LCOELevelized cost of energy
LNGLiquefied natural gas
MACMarginal abatement cost
MARPOLInternational Convention for the Prevention of Pollution from Ships
MDOMarine diesel oil
MeOHMethanol
NOxNitrogen oxide
NPVNet present value
OWTOne-way trip
PEMFCProton exchange membrane fuel cell
PMParticulate matter
ROIReturn on investment
R&DResearch and development
SOFCSolid oxide fuel cell
SOxSulfur oxide
Variables
CapExCapital expenses (EUR)
CFCost factor (EUR/kW or EUR/kWh or EUR/kg-fuel)
dDiscount rate (%)
EElectricity energy generated (kWh)
ECEnergy capacity (kWh)
ECCEnergy carrier consumption (kWh)
f Extra factor for the supplementary equipment (-)
FMFuel mass (kg)
GDGravimetric density (kW/kg)
HECHeating up energy capacity (kWh)
HEFHeating up energy factor (kWh/kW)
JNumber of one-way trips (-)
LHVLower heating value (kWh/kg)
LTLifetime (years)
nNumber of years (year)
NNumber of replacements (-)
P Rated power of fuel cell (kW)
OpExOperating expenses (EUR)
T Operational time [hour]
VVolume (m3)
VDVolumetric density (kW/m3)
VoyExVoyage expenses (EUR)
WWeight (kg)
XHHydrogen content in ammonia (%)
YNumber of battery cycles (-)
ZLifetime of fuel cell (hours)
η Efficiency (%)
Subscripts
annAnnual
BCBattery cycles
BTBattery
cpsClean power system
crCracker
DPDiesel-powered system
ecEnergy carrier
emElectric motor
fFuel type
FCFuel cell
fssFuel storage system
ocOther components
OMOperational mode
pcePower conditioning equipment
psPower system
puPurifier
seSupplementary equipment
REReplacement

References

  1. IMO. Initial IMO Strategy on Reduction of GHG Emissions from Ships; Resolution MEPC.304(72); International Maritime Organization (IMO): London, UK, 2018; Available online: https://wwwcdn.imo.org/localresources/en/KnowledgeCentre/IndexofIMOResolutions/MEPCDocuments/MEPC.304(72).pdf (accessed on 20 July 2023).
  2. IMO. 2023 IMO Strategy on Reduction of GHG Emissions from Ships; Resolution MEPC.377(80); International Maritime Organization (IMO): London, UK, 2023; pp. 1–18. Available online: https://www.imo.org/en/OurWork/Environment/Pages/2023-IMO-Strategy-on-Reduction-of-GHG-Emissions-from-Ships.aspx (accessed on 27 July 2023).
  3. IMO. Amendments to the Annex of the Protocol of 1997 to Amend the International Convention for the Prevention of Pollution from Ships, 1973, as Modified by the Protocol of 1978; Resolution MEPC.203(62); International Maritime Organization (IMO): London, UK, 2013; Available online: https://wwwcdn.imo.org/localresources/en/KnowledgeCentre/IndexofIMOResolutions/MEPCDocuments/MEPC.203(62).pdf (accessed on 20 July 2023).
  4. Schinas, O.; Stefanakos, C.N. Selecting Technologies towards Compliance with MARPOL Annex VI: The Perspective of Operators. Transp. Res. D Transp. Environ. 2014, 28, 28–40. [Google Scholar] [CrossRef]
  5. Brynolf, S.; Magnusson, M.; Fridell, E.; Andersson, K. Compliance Possibilities for the Future ECA Regulations through the Use of Abatement Technologies or Change of Fuels. Transp. Res. D Transp. Environ. 2014, 28, 6–18. [Google Scholar] [CrossRef]
  6. Viana, M.; Hammingh, P.; Colette, A.; Querol, X.; Degraeuwe, B.; de Vlieger, I.; van Aardenne, J. Impact of Maritime Transport Emissions on Coastal Air Quality in Europe. Atmos. Environ. 2014, 90, 96–105. [Google Scholar] [CrossRef]
  7. Wu, P.; Bucknall, R. Hybrid Fuel Cell and Battery Propulsion System Modelling and Multi-Objective Optimisation for a Coastal Ferry. Int. J. Hydrogen Energy 2020, 45, 3193–3208. [Google Scholar] [CrossRef]
  8. Reusser, C.A.; Pérez Osses, J.R. Challenges for Zero-Emissions Ship. J. Mar. Sci. Eng. 2021, 9, 1042. [Google Scholar] [CrossRef]
  9. Mallouppas, G.; Yfantis, E.A. Decarbonization in Shipping Industry: A Review of Research, Technology Development, and Innovation Proposals. J. Mar. Sci. Eng. 2021, 9, 415. [Google Scholar] [CrossRef]
  10. RICARDO. Technological, Operational and Energy Pathways for Maritime Transport to Reduce Emissions Towards 2050. Available online: https://www.concawe.eu/publication/technological-operational-and-energy-pathways-for-maritime-transport-to-reduce-emissions-towards-2050-concawe-review-31-1/ (accessed on 1 August 2023).
  11. Bouman, E.A.; Lindstad, E.; Rialland, A.I.; Strømman, A.H. State-of-the-Art Technologies, Measures, and Potential for Reducing GHG Emissions from Shipping—A Review. Transp. Res. D Transp. Environ. 2017, 52, 408–421. [Google Scholar] [CrossRef]
  12. Theotokatos, G.; Rentizelas, A.; Guan, C.; Ancic, I. Waste Heat Recovery Steam Systems Techno-Economic and Environmental Investigation for Ocean-Going Vessels Considering Actual Operating Profiles. J. Clean. Prod. 2020, 267, 121837. [Google Scholar] [CrossRef]
  13. Olaniyi, E.O.; Prause, G. Investment Analysis of Waste Heat Recovery System Installations on Ships’ Engines. J. Mar. Sci. Eng. 2020, 8, 811. [Google Scholar] [CrossRef]
  14. Li, C.; Wang, H.; Sun, P. Numerical Investigation of a Two-Element wingsail for Ship Auxiliary Propulsion. J. Mar. Sci. Eng. 2020, 8, 333. [Google Scholar] [CrossRef]
  15. Elkafas, A.G.; Shouman, M.R. A Study of the Performance of Ship Diesel-Electric Propulsion Systems from an Environmental, Energy Efficiency, and Economic Perspective. Mar. Technol. Soc. J. 2022, 56, 52–58. [Google Scholar] [CrossRef]
  16. Elkafas, A.G. Advanced Operational Measure for Reducing Fuel Consumption Onboard Ships. Environ. Sci. Pollut. Res. 2022, 29, 90509–90519. [Google Scholar] [CrossRef] [PubMed]
  17. Spinelli, F.; Mancini, S.; Vitiello, L.; Bilandi, R.N.; De Carlini, M. Shipping Decarbonization: An Overview of the Different Stern Hydrodynamic Energy Saving Devices. J. Mar. Sci. Eng. 2022, 10, 574. [Google Scholar] [CrossRef]
  18. Ren, Y.; Zhang, L.; Shi, P.; Zhang, Z. Research on Multi-Energy Integrated Ship Energy Management System Based on Hierarchical Control Collaborative Optimization Strategy. J. Mar. Sci. Eng. 2022, 10, 1556. [Google Scholar] [CrossRef]
  19. Elkafas, A.G.; Shouman, M.R. Assessment of Energy Efficiency and Ship Emissions from Speed Reduction Measures on a Medium Sized Container Ship. Trans. R. Inst. Nav. Archit. Int. J. Marit. Eng. 2021, 163, 121–132. [Google Scholar] [CrossRef]
  20. Elkafas, A.G.; Rivarolo, M.; Massardo, A.F. Environmental Economic Analysis of Speed Reduction Measure Onboard Container Ships. Environ. Sci. Pollut. Res. 2023, 30, 59645–59659. [Google Scholar] [CrossRef] [PubMed]
  21. Ruiz Zardoya, A.; Oregui Bengoetxea, I.; Lopez Martinez, A.; Loroño Lucena, I.; Orosa, J.A. Methodological Design Optimization of a Marine LNG Internal Combustion Gas Engine to Burn Alternative Fuels. J. Mar. Sci. Eng. 2023, 11, 1194. [Google Scholar] [CrossRef]
  22. Elkafas, A.G.; Khalil, M.; Shouman, M.R.; Elgohary, M.M. Environmental Protection and Energy Efficiency Improvement by Using Natural Gas Fuel in Maritime Transportation. Environ. Sci. Pollut. Res. 2021, 28, 60585–60596. [Google Scholar] [CrossRef]
  23. Sagin, S.; Karianskyi, S.; Madey, V.; Sagin, A.; Stoliaryk, T.; Tkachenko, I. Impact of Biofuel on the Environmental and Economic Performance of Marine Diesel Engines. J. Mar. Sci. Eng. 2023, 11, 120. [Google Scholar] [CrossRef]
  24. Nerheim, A.R.; Æsøy, V.; Holmeset, F.T. Hydrogen as a Maritime Fuel–Can Experiences with LNG Be Transferred to Hydrogen Systems? J. Mar. Sci. Eng. 2021, 9, 743. [Google Scholar] [CrossRef]
  25. Brynolf, S.; Fridell, E.; Andersson, K. Environmental Assessment of Marine Fuels: Liquefied Natural Gas, Liquefied Biogas, Methanol and Bio-Methanol. J. Clean. Prod. 2014, 74, 86–95. [Google Scholar] [CrossRef]
  26. Elkafas, A.G.; Elgohary, M.M.; Shouman, M.R. Implementation of Liquefied Natural Gas as a Marine Fuel to Reduce the Maritime Industries Climate Impact. Nav. Eng. J. 2022, 134, 125–135. [Google Scholar]
  27. Elkafas, A.G.; Rivarolo, M.; Massardo, A.F. Assessment of Alternative Marine Fuels from Environmental, Technical, and Economic Perspectives Onboard Ultra Large Container Ship. Trans. R. Inst. Nav. Archit. Int. J. Marit. Eng. 2022, 164, 125–134. [Google Scholar] [CrossRef]
  28. Shim, H.; Kim, Y.H.; Hong, J.P.; Hwang, D.; Kang, H.J. Marine Demonstration of Alternative Fuels on the Basis of Propulsion Load Sharing for Sustainable Ship Design. J. Mar. Sci. Eng. 2023, 11, 567. [Google Scholar] [CrossRef]
  29. Vladimir, N.; Bakica, A.; Perčić, M.; Jovanović, I. Modular Approach in the Design of Small Passenger Vessels for Mediterranean. J. Mar. Sci. Eng. 2022, 10, 117. [Google Scholar] [CrossRef]
  30. Rivarolo, M.; Rattazzi, D.; Magistri, L.; Massardo, A.F. Multi-Criteria Comparison of Power Generation and Fuel Storage Solutions for Maritime Application. Energy Convers. Manag. 2021, 244, 114506. [Google Scholar] [CrossRef]
  31. Kim, K.; Park, K.; Roh, G.; Choung, C.; Kwag, K.; Kim, W. Proposal of Zero-Emission Tug in South Korea Using Fuel Cell/Energy Storage System: Economic and Environmental Long-Term Impacts. J. Mar. Sci. Eng. 2023, 11, 540. [Google Scholar] [CrossRef]
  32. van Biert, L.; Visser, K. Chapter 3—Fuel Cells Systems for Sustainable Ships. In Sustainable Energy Systems on Ships; Baldi, F., Coraddu, A., Mondejar, M.E., Eds.; Elsevier: Amsterdam, The Netherlands, 2022; pp. 81–121. ISBN 978-0-12-824471-5. [Google Scholar] [CrossRef]
  33. FLAGSHIPS Projects. Available online: https://flagships.eu/about/ (accessed on 24 November 2022).
  34. Wang, X.; Zhu, J.; Han, M. Industrial Development Status and Prospects of the Marine Fuel Cell: A Review. J. Mar. Sci. Eng. 2023, 11, 238. [Google Scholar] [CrossRef]
  35. Elkafas, A.G.; Rivarolo, M.; Gadducci, E.; Magistri, L.; Massardo, A.F. Fuel Cell Systems for Maritime: A Review of Research Development, Commercial Products, Applications, and Perspectives. Processes 2023, 11, 97. [Google Scholar] [CrossRef]
  36. van Biert, L.; Godjevac, M.; Visser, K.; Aravind, P.V. A Review of Fuel Cell Systems for Maritime Applications. J. Power Sources 2016, 327, 345–364. [Google Scholar] [CrossRef]
  37. Xing, H.; Stuart, C.; Spence, S.; Chen, H. Fuel Cell Power Systems for Maritime Applications: Progress and Perspectives. Sustainability 2021, 13, 1213. [Google Scholar] [CrossRef]
  38. Rivarolo, M.; Rattazzi, D.; Lamberti, T.; Magistri, L. Clean Energy Production by PEM Fuel Cells on Tourist Ships: A Time-Dependent Analysis. Int. J. Hydrogen Energy 2020, 45, 25747–25757. [Google Scholar] [CrossRef]
  39. Cavo, M.; Rivarolo, M.; Gini, L.; Magistri, L. An Advanced Control Method for Fuel Cells—Metal Hydrides Thermal Management on the First Italian Hydrogen Propulsion Ship. Int. J. Hydrogen Energy 2023, 48, 20923–20934. [Google Scholar] [CrossRef]
  40. Elkafas, A.G.; Barberis, S.; Rivarolo, M. Thermodynamic Analysis for SOFC/ICE Integration in Hybrid Systems for Maritime Application. E3S Web Conf. 2023, 414, 02002. [Google Scholar] [CrossRef]
  41. Cavo, M.; Gadducci, E.; Rattazzi, D.; Rivarolo, M.; Magistri, L. Dynamic Analysis of PEM Fuel Cells and Metal Hydrides on a Zero-Emission Ship: A Model-Based Approach. Int. J. Hydrogen Energy 2021, 46, 32630–32644. [Google Scholar] [CrossRef]
  42. Bassam, A.M.; Phillips, A.B.; Turnock, S.R.; Wilson, P.A. An Improved Energy Management Strategy for a Hybrid Fuel Cell/Battery Passenger Vessel. Int. J. Hydrogen Energy 2016, 41, 22453–22464. [Google Scholar] [CrossRef]
  43. Kim, K.; Roh, G.; Kim, W.; Chun, K. A Preliminary Study on an Alternative Ship Propulsion System Fueled by Ammonia: Environmental and Economic Assessments. J. Mar. Sci. Eng. 2020, 8, 183. [Google Scholar] [CrossRef]
  44. Qu, J.; Feng, Y.; Zhu, Y.; Wu, B.; Wu, Y.; Xiao, Z.; Zheng, S. Assessment of a Methanol-Fueled Integrated Hybrid Power System of Solid Oxide Fuel Cell and Low-Speed Two-Stroke Engine for Maritime Application. Appl. Therm. Eng. 2023, 230, 120735. [Google Scholar] [CrossRef]
  45. Lee, G.N.; Kim, J.M.; Jung, K.H.; Park, H.; Jang, H.S.; Lee, C.S.; Lee, J.W. Environmental Life-Cycle Assessment of Eco-Friendly Alternative Ship Fuels (MGO, LNG, and Hydrogen) for 170 GT Nearshore Ferry. J. Mar. Sci. Eng. 2022, 10, 755. [Google Scholar] [CrossRef]
  46. Wang, H.; Boulougouris, E.; Theotokatos, G.; Zhou, P.; Priftis, A.; Shi, G. Life Cycle Analysis and Cost Assessment of a Battery Powered Ferry. Ocean. Eng. 2021, 241, 110029. [Google Scholar] [CrossRef]
  47. de-Troya, J.J.; Álvarez, C.; Fernández-Garrido, C.; Carral, L. Analysing the Possibilities of Using Fuel Cells in Ships. Int. J. Hydrogen Energy 2016, 41, 2853–2866. [Google Scholar] [CrossRef]
  48. Korberg, A.D.; Brynolf, S.; Grahn, M.; Skov, I.R. Techno-Economic Assessment of Advanced Fuels and Propulsion Systems in Future Fossil-Free Ships. Renew. Sustain. Energy Rev. 2021, 142, 110861. [Google Scholar] [CrossRef]
  49. Dall’Armi, C.; Micheli, D.; Taccani, R. Comparison of Different Plant Layouts and Fuel Storage Solutions for Fuel Cells Utilization on a Small Ferry. Int. J. Hydrogen Energy 2021, 46, 13878–13897. [Google Scholar] [CrossRef]
  50. MarineTraffic. Rodi Jet. Available online: https://www.marinetraffic.com/en/ais/details/ships/shipid:5792556/mmsi:247209800/imo:8012140/vessel:RODI_JET (accessed on 24 June 2023).
  51. LiguriaViaMare. Rodi Jet Motor Vessel. Available online: https://www.whalewatchliguria.it/en/news-31/whale-watching-rodi-jet-motor-vessel.html (accessed on 24 June 2023).
  52. Zhao, J.F.; Liang, Q.C.; Liang, Y.F. Simulation and Study of PEMFC System Directly Fueled by Ammonia Decomposition Gas. Front. Energy Res. 2022, 10, 819939. [Google Scholar] [CrossRef]
  53. Giddey, S.; Badwal, S.P.S.; Munnings, C.; Dolan, M. Ammonia as a Renewable Energy Transportation Media. ACS Sustain. Chem. Eng. 2017, 5, 10231–10239. [Google Scholar] [CrossRef]
  54. Wang, Y.; Ruiz Diaz, D.F.; Chen, K.S.; Wang, Z.; Adroher, X.C. Materials, Technological Status, and Fundamentals of PEM Fuel Cells—A Review. Mater. Today 2020, 32, 178–203. [Google Scholar] [CrossRef]
  55. Bicer, Y.; Dincer, I. Clean Fuel Options with Hydrogen for Sea Transportation: A Life Cycle Approach. Int. J. Hydrogen Energy 2018, 43, 1179–1193. [Google Scholar] [CrossRef]
  56. Perčić, M.; Vladimir, N.; Jovanović, I.; Koričan, M. Application of Fuel Cells with Zero-Carbon Fuels in Short-Sea Shipping. Appl. Energy 2022, 309, 118463. [Google Scholar] [CrossRef]
  57. Nuchturee, C.; Li, T.; Xia, H. Energy Efficiency of Integrated Electric Propulsion for Ships—A Review. Renew. Sustain. Energy Rev. 2020, 134, 110145. [Google Scholar] [CrossRef]
  58. EMSA. Study on Electrical Energy Storage for Ships, Battery Systems for Maritime Applications—Technology, Sustainability and Safety, European Maritime Safety Agency. Available online: http://www.emsa.europa.eu/sustainable-shipping/new-technologies/download/6186/4507/23.html (accessed on 23 July 2023).
  59. Perčić, M.; Frković, L.; Pukšec, T.; Ćosić, B.; Li, O.L.; Vladimir, N. Life-Cycle Assessment and Life-Cycle Cost Assessment of Power Batteries for All-Electric Vessels for Short-Sea Navigation. Energy 2022, 251, 123895. [Google Scholar] [CrossRef]
  60. Clean Hydrogen JU. Strategic Research and Innovation Agenda (SRIA) 2021–2027. Agenda 2022, 2021, 2027. Available online: https://www.clean-hydrogen.europa.eu/about-us/key-documents/strategic-research-and-innovation-agenda_en (accessed on 23 July 2023).
  61. Ioannis, T.; Dalius, T.; Natalia, L. Li-Ion Batteries for Mobility and Stationary Storage Applications—Scenarios for Costs and Market Growth; Publications Office of the European Union: Luxembourg, 2018; ISBN 9789279972546. Available online: https://publications.jrc.ec.europa.eu/repository/handle/JRC113360 (accessed on 22 July 2023).
  62. Kanchiralla, F.M.; Brynolf, S.; Malmgren, E.; Hansson, J.; Grahn, M. Life-Cycle Assessment and Costing of Fuels and Propulsion Systems in Future Fossil-Free Shipping. Environ. Sci. Technol. 2022, 56, 12517–12531. [Google Scholar] [CrossRef]
  63. de Vries, N. Safe and Effective Application of Ammonia as a Marine Fuel, Delft of Technology. Master’s Thesis, Delft University of Technology, Delft, The Netherlands, 2019. [Google Scholar]
  64. Bellotti, D.; Rivarolo, M.; Magistri, L. A Comparative Techno-Economic and Sensitivity Analysis of Power-to-X Processes from Different Energy Sources. Energy Convers. Manag. 2022, 260, 115565. [Google Scholar] [CrossRef]
  65. Ikäheimo, J.; Kiviluoma, J.; Weiss, R.; Holttinen, H. Power-to-Ammonia in Future North European 100% Renewable Power and Heat System. Int. J. Hydrogen Energy 2018, 43, 17295–17308. [Google Scholar] [CrossRef]
  66. Becker, W.L.; Braun, R.J.; Penev, M.; Melaina, M. Design and Technoeconomic Performance Analysis of a 1MW Solid Oxide Fuel Cell Polygeneration System for Combined Production of Heat, Hydrogen, and Power. J. Power Sources 2012, 200, 34–44. [Google Scholar] [CrossRef]
  67. Baldi, F.; Brynolf, S.; Maréchal, F. The Cost of Innovative and Sustainable Future Ship Energy Systems. In Proceedings of the 32nd International Conference on Efficiency, Cost, Optimization, Simulation and Environmental Impact of Energy Systems, Wroclaw, Poland, 23 June 2019. [Google Scholar]
  68. Ma, S.; Lin, M.; Lin, T.E.; Lan, T.; Liao, X.; Maréchal, F.; Van herle, J.; Yang, Y.; Dong, C.; Wang, L. Fuel Cell-Battery Hybrid Systems for Mobility and off-Grid Applications: A Review. Renew. Sustain. Energy Rev. 2021, 135, 110119. [Google Scholar] [CrossRef]
  69. Grzesiak, S. Alternative Propulsion Plants for Modern LNG Carriers. New Trends Prod. Eng. 2018, 1, 399–407. [Google Scholar] [CrossRef]
  70. Argus. Hydrogen and Future Fuels, Market News, Analysis and Prices. Available online: https://www.argusmedia.com/en/power/argus-hydrogen-and-future-fuels (accessed on 24 July 2023).
  71. Argus. Sample Report: Argus Marine Fuels. Available online: https://www.argusmedia.com/en/oil-products/argus-marine-fuels (accessed on 24 July 2023).
  72. EuroStat. Electricity Prices for Non-Household Consumers. Available online: https://ec.europa.eu/eurostat/web/energy/database (accessed on 28 July 2023).
  73. Aldersey-Williams, J.; Rubert, T. Levelised Cost of Energy—A Theoretical Justification and Critical Assessment. Energy Policy 2019, 124, 169–179. [Google Scholar] [CrossRef]
  74. GlobalPetrolPrices Genoa Diesel Prices. Available online: https://www.globalpetrolprices.com/Italy/Genoa/diesel_prices/ (accessed on 15 July 2023).
  75. Nepomuceno de Oliveira, M.A.; Szklo, A.; Castelo Branco, D.A. Implementation of Maritime Transport Mitigation Measures According to Their Marginal Abatement Costs and Their Mitigation Potentials. Energy Policy 2022, 160, 112699. [Google Scholar] [CrossRef]
  76. Wu, S.; Miao, B.; Chan, S.H. Feasibility Assessment of a Container Ship Applying Ammonia Cracker-Integrated Solid Oxide Fuel Cell Technology. Int. J. Hydrogen Energy 2022, 47, 27166–27176. [Google Scholar] [CrossRef]
  77. Ejder, E.; Arslanoğlu, Y. Evaluation of Ammonia Fueled Engine for a Bulk Carrier in Marine Decarbonization Pathways. J. Clean. Prod. 2022, 379, 134688. [Google Scholar] [CrossRef]
  78. Eide, M.S.; Longva, T.; Hoffmann, P.; Endresen, Ø.; Dalsøren, S.B. Future Cost Scenarios for Reduction of Ship CO2 Emissions. Marit. Policy Manag. 2011, 38, 11–37. [Google Scholar] [CrossRef]
  79. IMO. Fourth IMO Greenhouse Gas Study; International Maritime Organization: London, UK, 2020; pp. 197–212. Available online: https://www.imo.org/en/ourwork/Environment/Pages/Fourth-IMO-Greenhouse-Gas-Study-2020.aspx (accessed on 10 July 2023).
  80. BloomEnergy. The Bloom Energy Server 5. Available online: https://www.bloomenergy.com/resource/bloom-energy-server/ (accessed on 4 June 2023).
  81. Lee, H.; Jung, I.; Roh, G.; Na, Y.; Kang, H. Comparative Analysis of On-Board Methane and Methanol Reforming Systems Combined with HT-PEM Fuel Cell and CO2 Capture/Liquefaction System for Hydrogen Fueled Ship Application. Energies 2020, 13, 224. [Google Scholar] [CrossRef]
  82. Byun, M.; Lee, B.; Lee, H.; Jung, S.; Ji, H.; Lim, H. Techno-Economic and Environmental Assessment of Methanol Steam Reforming for H2 Production at Various Scales. Int. J. Hydrogen Energy 2020, 45, 24146–24158. [Google Scholar] [CrossRef]
  83. Ballard. Marine Modules. Available online: https://www.ballard.com/fuel-cell-solutions/fuel-cell-power-products/marine-modules (accessed on 3 September 2022).
  84. Corvus. Energy storage solutions - Corvus Dolphin Energy. Available online: https://corvusenergy.com/products/energy-storage-solutions/corvus-dolphin-energy/ (accessed on 20 May 2023).
  85. ABB. Low Voltage Water Cooled Motors. Available online: https://new.abb.com/motors-generators/iec-low-voltage-motors/process-performance-motors/water-cooled-motors (accessed on 15 July 2023).
  86. Foripower. DC/DC Converter. Available online: https://www.foripower.com/index_84.aspx?lcoid=84 (accessed on 15 July 2023).
Figure 1. Navigational route of the NaveBus between Porto Antico and Pegli. (A-B) maneuvering at Porto Antico terminal, (B-C) crossing Porto Antico channel, (C-D) Sailing mode, (D-E) entrance of Pegli terminal, (E-F) maneuvering at Pegli terminal.
Jmse 11 01735 g001
Figure 2. The operational profile of the NaveBus for (a) one day, (b) one round trip.
Jmse 11 01735 g002
Figure 3. Conceptual diagram for clean power systems design considered in the current study.
Jmse 11 01735 g003
Figure 4. Overview of the steps applied in the assessment methodology.
Jmse 11 01735 g004
Figure 5. Identification of cost assessment indicators and their impact categories.
Jmse 11 01735 g005
Figure 6. The required electric energy capacity (left side) and fuel mass (right side) to perform three OWTs based on different scenarios for each operational mode.
Jmse 11 01735 g006
Figure 7. The cost assessment results of different alternative power systems.
Jmse 11 01735 g007
Figure 8. Total cost comparison between clean power systems in terms of the net present value.
Jmse 11 01735 g008
Figure 9. Return on investment of different clean power systems.
Jmse 11 01735 g009
Figure 10. Marginal abatement cost for reducing CO2 emissions by using different alternative clean power systems.
Jmse 11 01735 g010
Figure 11. Sensitivity analysis results focusing on the effect of energy carrier/fuel costs on the LCOE of the considered system.
Jmse 11 01735 g011
Figure 12. Weight and volume results of different power system scenarios.
Jmse 11 01735 g012
Figure 13. Design of propulsion system electrical architecture block diagram based on PEMFC.
Jmse 11 01735 g013
Figure 14. Full battery power system electrical architecture block diagram.
Jmse 11 01735 g014
Table 1. Characteristics of the case study (NaveBus).
ParameterUnitValue
Maximum number of passengers(-)362
Length overall(m)28.6
Breadth(m)6.92
Depth(m)2.34
Draught(m)1.14
Maximum displacement(tons)84.3
Maximum design speed(knots)20
Service speed(knots)10.2
Main engine type(-)2 × Caterpillar 3412
Main engine power(kW)2 × 895
Fuel tank capacity(tons)7.4
Table 2. Investment cost factors and technical parameters for power system components.
ComponentCost Factor (CF)Technical ParameterReference
PEMFC1500 EUR/kW η p e a k = 55 % , ZFC = 20,000 h[60]
SOFC5000 EUR/kW η p e a k = 60 % , ZFC = 20,000 h[60]
Battery210 EUR/kWhYBC = 5000[58,61]
DC/DC converter120 EUR/kW η = 98 % , LT = 25 years[62]
Electric motor250 EUR/kW η = 96 % , LT = 25 years[48,63]
Hydrogen tank480 EUR/kgH2LT = 25 years[64,65]
LNG reformer370 EUR/kWLT = 25 years[66]
MeOH reformer475 EUR/kWLT = 25 years[62]
Ammonia cracker250 EUR/kWLT = 25 years[67]
Table 3. Technical specifications of commercial products for PEMFC, SOFC, and battery.
ParameterPEMFC [83]SOFC [80]Battery Pack [84]
SupplierBallardBloom EnergyCorvus
Rated power (kW)200330132.5 kWh
Voltage range (V)350–720480576–797
Physical dimensions L × W × H (m)1.21 × 0.74 × 2.25.5 × 2.6 × 2.11.85 × 0.5 × 0.67
Weight (kg)100015,800782
Volumetric density (kW/m3)101.411.12214 kWh/m3
Gravimetric density (kW/kg)0.20.0210.169 kWh/kg
Table 4. Electric power and energy requirements to perform a one-way trip.
Operational ModeTime (min)Rated Power (kW)Energy Consumption (kWh)
A-B1.462586.3
B-C6.2845847.9
C-D25.16750314.4
D-E3.1068135.2
E-F1.021692.9
Total37 407
Disclaimer/Publisher’s Note: The statements, opinions and data contained in all publications are solely those of the individual author(s) and contributor(s) and not of MDPI and/or the editor(s). MDPI and/or the editor(s) disclaim responsibility for any injury to people or property resulting from any ideas, methods, instructions or products referred to in the content.

