Article

Life-Cycle and Applicational Analysis of Hydrogen Production and Powered Inland Marine Vessels

Liverpool Logistics Offshore and Marine Research Institute (LOOM), Faculty of Engineering, Liverpool John Moores University, Liverpool L3 3AF, UK
*
Author to whom correspondence should be addressed.
J. Mar. Sci. Eng. 2023, 11(8), 1611; https://doi.org/10.3390/jmse11081611
Submission received: 14 June 2023 / Revised: 3 August 2023 / Accepted: 8 August 2023 / Published: 17 August 2023
(This article belongs to the Special Issue Novel Maritime Techniques and Technologies, and Their Safety)

Abstract

:
Green energy is at the forefront of current policy, research, and engineering, but some of the potential fuels require either a lot of deeper research, or a lot of infrastructure before they can be implemented. In the case of hydrogen both are true. This report aims to analyse the potential of hydrogen as a future fuel source by performing a life-cycle assessment. Through this the well-to-tank phase of fuel production, and the usage phase of the system have been analysed. Models have also been created for traditional fuel systems to best compare results. The results show that hydrogen has great potential to convert marine transport to operating off green fuels when powered through low-carbon energy sources, which could reduce a huge percentage of the international community’s greenhouse gas emissions. Hydrogen produced through wind powered alkaline electrolysis produced emission data 5.25 g of CO2 equivalent per MJ, compared to the 210 g per MJ produced by a medium efficiency diesel equivalent system, a result 40 times larger. However, with current infrastructure in most countries not utilising a great amount of green energy production, the effects of hydrogen usage could be more dangerous than current fuel sources, owing to the incredible energy requirements of hydrogen production, with even grid (UK) powered electrolysis producing an emission level of 284 g per MJ, which is an increase against standard diesel systems. From this the research concludes that without global infrastructure change, hydrogen will remain as a potential fuel rather than a common one.

1. Introduction

Shipping is responsible for 1.7% of global greenhouse emissions, and with other industries looking to move to renewability at a much quicker pace than shipping, some predictions estimating that shipping could account for between “10–13% within a few decades” [1,2]. While other forms of transport have potentially an easier route to carbon-neutrality, marine vessels face a unique set of challenges, with many systems operating for extended periods away from energy infrastructure and requiring relatively high energy demands during standard operation.
Advancements in battery standards have met the requirements of small to medium sized vessels especially as hybrid systems operating within ferries, but current technology doesn’t appear to be at the point where it is ready to make the leap to large scale shipping [3]. LNG (Liquified Natural Gas) is often totted as the next best solution, but it still doesn’t meet climate targets, and if high methane slip is prevalent, could potentially be worse than some diesel options [4].
Hydrogen has been theorised as a potentially green solution with almost no pollution, that could revolutionise our transport energy sector, with “Green-Hydrogen” (hydrogen produced solely through non-carbon producing sources) as a pathway to the EU achieving their climate goals by 2050 [5]. But most hydrogen today is produced through a grid mix, which usually leads to “grey” or “brown” hydrogen where the production is fuelled by heavy fossil fuel usage and is especially problematic in developing countries with slower renewable progression [5,6]. Hydrogen production through high emission means could potentially lead to a global increase in greenhouse gas emission and push the international community further away from climate goals.
The emission levels of hydrogen production lie entirely with the method and energy source used to produce the fuel, steam reforming is the most common method currently used but electrolysis is fast becoming the idealised path to meeting climate goals, as the method only requires electricity and water. Due to having no first-hand emissions during production, the effect that electrolysis has on the environment is entirely dependent on how the electricity used is generated, with “brown hydrogen twice as carbon intensive as grey hydrogen, and grey hydrogen 9 times more carbon intensive than green” [7]. This research will look into the emissions and global warming potential of both steam reforming and electrolysis, and how different energy sources effect the emission results of both.
While the ambitions of hydrogen advocates stretch far, all the way to the largest of marine vessels, the current reality is that only a handful of ships operate commercially and fuelled solely by hydrogen, with most being small scale passenger ferries [8]. Small inland passenger ferries have many benefits as a marine propulsion test-bed system, being close to land and small in size and energy requirements reduces research scope and cost. As this type of vessel is most suitable for current emission analysis of fuel production and usage, this research will be conducted as a case study with all results being derived from a 400-ton inland ferry with a combined propulsion and auxiliary energy requirement of 600 kW.
Finally, this research will attempt to analyse the previously mentioned fuel types, production methods, and vessel requirements in the form of an LCA (Life Cycle Assessment). A life cycle assessment is a methodology and process of analysing the environmental impact of a product through parts of, or the entire life cycle, by looking deeper into production and supply chains. For example, a personal motor vehicle could be analysed solely by its direct emissions, but it wouldn’t give an accurate picture of the vehicles total contribution. In this case and LCA would look at the production, supply, and transport of each component from fuel to parts, before finally looking at the end-of-life process. This gives a much broader and deeper view of the impact of the subject and can show hidden forms emissions, previously unnoticed. LCAs’ can be used to analyse single phases, such as usage or end-of-life, or it can be used to analyse an entire life cycle, usually called “cradle-to-grave”.
LCAs’ are quite reliant on their entry data, which can mostly determine their accuracy and effectiveness, but most reputable LCA programmes will usually invest in keeping up to date data, specialised for most major industrial nations, which is the case for ‘GaBi’, the software that will be used during this research [9,10]. This research will also focus only on fuel production, known as ‘well-to-tank’, and usage, with ship and infrastructure production, and end-of-life, not considered. While this may leave out some relevant data, it will allow the author to focus greater on the differences in fuel types and productions.
A few papers have been published in recent years looking into the feasibility of hydrogen as marine fuel in the form of an LCA, one of which published in 2022 found better results through using a hydrogen internal combustion engine, rather than using a fuel cell system [11], but that using hydrogen was often dependent on the source of hydrogen. Another piece of research from 2022 also concluded similar results, but also looked into the decommissioning stage of the life cycle and found that up to a 44% reduction in environmental impact could be achieved if recycling was to take place, but that fuel cell systems would potentially expose aquatic life to more toxic substances than using a diesel system [12]. One piece of research that focused on an LCA of small inland ships operating in the Republic of Korea found that switching to almost any system over an efficient diesel would lead to an increase in global warming potential emissions [13]. All 3 of the previous pieces of research found that hydrogen-based systems would only have optimistic potential after system and infrastructure change on both a national and international level, but also at industry level [11,12,13]. One piece of research published in 2018 that looked into ammonia alongside hydrogen found that hydrogen was only marginally better results from hydrogen usage over ammonia but noted that ammonia has ore infrastructure and research conducted and would therefore be easier to use potentially in a hybrid system with carbon-based fuels that would speed up a transition period [14]. One piece of research published in 2022 used a parametric trend LCA which accounts for a greater number of cases, as opposed to a traditional LCA which will usually only investigate one case-study [15]. The results of this piece of research echoed similar sentiments of high potential but only when green sources were used to power the production of the fuel, but proposed LNG utilised through fuel cells as alternative until widespread green hydrogen could be implemented. Another piece published in 2022 supported the notion that hydrogen powered marine vehicles, specifically autonomous ones, could reduce carbon emissions when compared to standard forms [16]. Other research has looked into the viability of storage and production from a marine perspective with comments made on the difficulty of long term facilitation away from land, but also the difficulty of producing truly green hydrogen [17].
This research aims to conduct an LCA on potential future marine fuel options by analysing different production methods and energy sources, while comparing the results to current common fuels with varying efficiencies, to show the difference between emissions and global warming potential. This will be done by:
  • Using LCA specialist software to consider the production methods and energy sources of hydrogen fuel during both the ‘well to tank’ phase, and the usage phase.
  • Using LCA specialist software to model diesel and natural gas systems for an equivalent vessel.
  • Comparing results for both hydrogen and traditional fuels to analyse the environmental impact of each system and offer suggestions for usage cases.

2. Fuel Production and Usage Processes

2.1. Production

2.1.1. Steam Reforming

The production of hydrogen is at the heart of the debate and future potential-ness of the fuel as possible source of clean power, with it still dividing many in the community. Steam reforming has always been, and still is, the method of choice for industrial level production and requires less energy than many other methods [18]. Methane, in the form of natural gas or biogas, is combined with steam between 700 °C and 1000 °Cs at high pressures with a catalyst [19]. This process occurs in the form of chemical Reactions (1) and (2). Under the conditions mentioned the methane and water vapor will react to form hydrogen and carbon monoxide, following this a secondary reaction will take place between further water vapor and carbon monoxide to produce further hydrogen and carbon dioxide.
Reactions (1) and (2) show the chemical reactions occurring during the steam reforming process:
C H 4 + H 2 O C O + 3 H 2
C O + H 2 O C O 2 + 3 H 2
Steam reforming requires both electrical energy as well as heat energy, with the latter usually produced by natural gas combustion as it is often readily available in hydrogen production facilities. With many western industrial nations reliant on natural gas for a large proportion of electricity production, this can lead to steam reforming fuelled almost entirely on natural gas. Previous LCAs have shown that steam reforming can produce around 8.9 kg of carbon dioxide per kg of hydrogen during production, and 10.6 kg of carbon dioxide per kg of hydrogen as a whole lifecycle assessment [20]. The steam reforming process can have high efficiencies, potentially up to 85% but cannot escape carbon dioxide pollution and methane slip and so will never be able to produce green hydrogen [21].
Carbon capture is a method deployed to stop the release of carbon dioxide into the environment by pumping the gas into geological formations, whether they be natural ones, or emptied oil and gas cavities [22]. In theory this is a simple solution to the rampant release of carbon dioxide, but the reality is far more complex with the process being complicated and expensive [23]. In some situations this can be applied to steam reforming to lower the environmental impact at the expense of higher costs.

2.1.2. Electrolysis

Alkaline electrolysis is often seen as the best option for transitioning to a hydrogen fuelled world, the process can theoretically produce completely green hydrogen, with some studies suggesting the production method could “decarbonise around 18% of energy related sectors” [24]. Water, in the presence of a catalyst, an anode, a cathode, and an electrical current will convert into hydrogen and oxygen gas, which can be seen in the following reactions.
Reactions (3) and (4) show the electrochemical reactions occurring during the hydrogen alkaline electrolysis process, the former representing the cathode reaction, and the latter representing the anode:
2 H 2 O + 2 e H 2 + 2 O H
2 O H H 2 O + 1 2 O 2 + 2 e
Figure 1 shows the structure and function of a hydrogen electrolyser with water coming through the lower anode side before the reaction passes through the central membrane and the two gases exit the system separately.
The electrolysis process is an incredibly energy intensive process in comparison to other processing forms, requiring around 195 MJ per kg of hydrogen [18], which is over seven times greater than the combined electrical and heat energy required for the same quantity of hydrogen through steam reforming [18]. Such high energy requirements puts the full weight of production emissions onto the energy source itself, with the UK currently producing 54.5% of its’ electricity through low carbon means [25], it would lead to a large increase in emissions if production of hydrogen was quickly switched to electrolysis.
Production powered by energy sourced from low carbon means is potentially the solution to this issue, but the problem is compounded by how large the energy requirements are, something renewables can’t generally produce for low investment costs. US-based research theorised that it would take 850 new large scale nuclear power plants to replace the petrol sector of the US economy [26], this is not only just a partial percentage of US transport, but also just below twice the current number of nuclear power plants in the entire world [27]. This demonstrates just how large of an infrastructural dilemma green hydrogen is. This research will only consider this form of electrolysis.

2.2. Fuel Cells

2.2.1. Molten Carbonate Fuel Cells

Fuel cells are the engine equivalent for hydrogen fuel, operating as a converter of fuel substances into energy and by-products. There are a few different types of fuel cells but the most notable two that will be investigated further are MCFCs (Molten carbonate fuel cell), and PEMFCs (Proton exchange membrane fuel cell).
MCFCs are fuel cells that use high temperatures and a “molten carbonate salt mixture as an electrolyte” [28], to help process the reaction. When pumped hydrogen gas meets the molten mixture at an anode, a reaction occurs between the two substances, which can be observed in the chemical reaction below [29].
Reactions (5) and (6) show the electrochemical reactions occurring during the molten carbonate fuel cell process, the former representing the cathode reaction, and the latter representing the anode:
H 2 + 2 C O 3 2 2 H 2 O + 2 C O 2 + 4 e
O 2 + 2 C O 2 + 4 e 2 C O 3 2
This reaction takes place in an MCFC, which can be seen in Figure 2. It is noted that the only final by product is water, thus completing a theoretically clean energy cycle with only some extra energy put into the system. MCFC systems have reached levels of 47% efficiency with regards to only electricity production, but 40% is more applicable to standard systems [30,31]. MCFC systems can reach higher levels of efficiency if heat energy is utilised, as the system produces excess amounts, but for the purposes of this research into small scale vessel, this will not be considered.
MCFCs can take a particularly long time to start up and have less versatility than other forms of fuel cells [32], but the systems are reliable and used for a multitude of means, especially in cases where excess heat can be utilised.

2.2.2. Proton Exchange Membrane Fuel Cells

Proton exchange membrane fuel cells still operate in a slightly similar way, with the only major by product being water. These fuel cells are made of thin layers arranged into individual cells, each of which has a central membrane, with a gas diffusion and anode/cathode layer on each side, followed by a bipolar plate on either side, and finally a set of current collectors on the end of each side. These are then pushed together with a set of compression plates [33,34,35]. Each bipolar plate has narrow grooves to transport each gas along the surface of a gas diffusion plate, after which the hydrogen will make contact with the electrode in the central membrane and split into positively charged hydrogen ions and electrons, these spare electrons will follow the circuitry before attaching to oxygen atoms. Finally, the positively charged hydrogen atoms will continue through the membrane and join the negatively charged oxygen to form water [36]. These systems have been demonstrated to be functionally flexible and could be utilised at different scales [37].
Reactions (7) and (8) show the electrochemical reaction that occurs in a proton exchange membrane fuel cell, the former representing the cathode reaction, and the latter representing the anode:
2 H 2 4 H + + 4 e
O 2 + 4 H + + 4 e 2 H 2 O
Figure 3 shows a PEMFC system. Significant progress has been made in recent years with regards to PEMFC advancement, specifically in the marine field, with an Italian university developing a test bed prototype that operates 2 branches of 4 cell stacks, each with a 30 kW rating, giving a total power rating of 240 kW [38,39]. While much was learnt, and a few things needed altering, the overwhelming result was successful and positive, demonstrating liability for marine operation of this style of system.

2.3. LCA Software and Result Management

The LCA processing software GaBi, version: 9.2.1.68, has been used for all derived data and functions as an energy and resource accountant by tracking flows in a given system [10]. GaBi is software package owned by Sphera and holds an extensive set of constantly updated data regarding a whole range of systems, processes and resources that users can use to create various models. Processes and systems can also be created by users, as in the case of this research. The various resources and emissions are pre-set, such as grid electricity supply, diesel mix, and carbon dioxide, and can be used within formulated processes that are scalable to suit a variety of engineering systems [10]. Within GaBi there are free and fixed parameters that are used to derive quantities. Free parameters act as raw numbers per quantity, which are then assigned to an input or output, as well as a scaling factor and unit. Fixed parameters are derived usually from a calculation relating to other free parameters but can once again be assigned to an input or output, be given a scaling factor, and a unit. The authors have created 38 unique flows and multiple unique processes all with varying amounts of total inputs and outputs that in some cases can reach into the hundreds or thousands, for this research. For this reason, it is not possible to display all of these systems within this paper.
Figure 4 shows the developed process for marine diesel GENSET (Engine and generator combination). The free parameters, represented by a given value, and the fixed parameter, represented as a calculation of other parameters, can be seen in the parameter section. Below this the inputs and outputs can be seen, in this case the diesel fuel input represented as 1 kg, and the various emissions in kg and electrical energy in MJ as the outputs. In this case the electrical energy out is represented as the energy value of diesel in MJ per kg times the efficiency of this diesel system. In this situation the diesel in and energy out are represented as flows and so can be assigned later in the plan, and the emissions are represented as straight emissions to atmosphere. From this a subsequent process can use energy from this source, and depending on how much energy is required, GaBi will scale and account for emissions, energy and resources involved. General air from atmosphere that will be used in combustion is not represented here as it is highly variable and does not provide any extra meaningful data.
One of the main ways that the results of this research will be analysed is through GWP (100 years), which stands for global warming potential and is a method of scaling elements and compounds against carbon dioxide. In a 100-year scaling greater weight is given to compounds that have a long-term effect on the environment, whereas a 20-year GWP will give greater weight to compounds that have a short-term effect.
The system that will be used to scale this is the CML registry, which is a database of compounds with a factor level for each as to measure everything as a carbon dioxide equivalent amount [40]. For example, methane emissions to air have a characterisation factor of 28 kg, meaning that for every one kg of methane released to atmosphere, the GWP measurement will account for 28 kg of CO2 equivalent [41].

3. LCA Formulation

3.1. Hydrogen Production from Electrolysis

The first hydrogen production method analysed is electrolysis, in which a GaBi process and flow has been created and can be seen in Figure 5. Within this flow the various inputs can be seen, electricity, steel electrodes, and de-ionised water, all supplied at 192 MJ, 1.1 × 10⁻⁶ kg, and 10 L per kg of produced hydrogen, respectively [18]. The hydrogen flow is then transferred into the compressor process which once again uses electricity at 4.14 MJ per kg of hydrogen [42]. Alongside this diesel is also used within modern medium sized trucks to move both the steel required for electrolysis and to transport the compressed hydrogen tanks to the vessel, which is preformulated by GaBi. The next stage is the fuel cell that will convert every kg of hydrogen into 65.3 MJ of electricity and 8.5 L of water. Note that both are lower than initial inputs of electricity and water as there are losses due to efficiency and incomplete conversion. In this case the flow is presented with a PEM fuel cell, but this can be switched to an MC fuel cell and will be subsequently explained in a later section.
In Figure 5, the electricity is carried from the fuel cell to the marine motor and auxiliary process, as stated previously it is running at a full 600 kW rating per hour. This is a fixed process and cannot be scaled by GaBi, which in turn scales every other parameter and process to meet the requirements of this process. This will effectively scale the fuel cell usage to the hydrogen’s usage needs. This demonstrates how the GaBi scaling system operates to account for every resource and emission.
The electricity source that powers both the electrolysis and the compression can be switched to a multitude of options supplied by GaBi, such as, UK-Grid, UK-Nuclear, UK-Wind Power, and many others. This can also be applied to other countries. Within this case study the grid mix will always be used, with wind and natural gas used alongside to compare. Finally, for electrolysis, further energy sources have been used to make a comparison between sources, as opposed to production methods, vessel fuel types, and fuel cell variants. Results obtained for PEMFC and MCFC where electrolysis is used to produce the hydrogen fuel, the following sources have been used to power the electrical power required by the electrolysis system; heavy fuel oil, coal, natural gas, grid mix (UK data), solar, hydro, wind, and nuclear.
From these flows GaBi will process and graphically represent accumulated data from each flow. From this, total emissions, global warming potential, and other useful data can be derived and presented.

3.2. Hydrogen Production from Steam Reforming

The second production method analysed is hydrogen steam reforming, in the instance of Figure 6 it is without CC (carbon-capture). The flow can be viewed as two sides, production, and post-production, with postproduction being entirely the same as the electrolysis and fuel cell equivalent. In the case of the production process different inputs are required. The steam reforming process requires Natural gas, for production, Thermal energy, and electrical energy. For Figure 6, that is natural gas at 2.89 kg, electrical energy from grid mix at 13.8 MJ, thermal energy from natural gas at 12.8 MJ, nickel catalyst at 4.4 × 10⁻⁴ kg, all per kg of hydrogen [18]. Water is also used at 13.8 kg per kg of hydrogen but GaBi accounts for this without needing a separate input, and carbon dioxide is released at 8.9 kg per kg of hydrogen produced [18].
In the case of steam reforming some of the variables can be switched in order to obtain different results. This research has obtained data for 3 different instances, with each having thermal energy from natural gas followed by electricity from; grid mix, natural gas, and wind power. This is then repeated for MC fuel cells, using matching variables.
Finally, a variant of each steam reforming flow has been created with carbon capture, in which all previously released carbon dioxide is captured. The amount remains at 8.9 kg of carbon dioxide per kg of hydrogen produced but isn’t emitted to the environment.

3.3. Hydrogen Fuel Cells

For the purposes of this research, only two fuel cell systems will be analysed; MCFCs’ (Molten Carbonate Fuel Cells), and PEMFCs’ (Proton-Exchange Membrane Fuel Cells). While both work in different ways, explored deeper in the background theory section, for the purposes of the LCA both systems have the same effect, with the only differences coming from MCFCs having lower efficiencies than PEMFCs. In the case of this research PEMFCs have an efficiency of 55% which represents an output of 65.34 MJ per kg of hydrogen fuel used [28]. MCFCs have an efficiency of 46% representing an output of 54.65 MJ per kg of hydrogen fuel used [28]. For most cases in this research there is an identical PEMFC and MCFC version of each flow, but except for the efficiency, no other factor is changed.
Because the MCFC operates at a lower efficiency, and as mentioned previously that each input is scaled to meet to the output requirements, The input and output totals, except for energy used by propeller system, are increased in comparison to the PEMFC, which will be seen in the results.

3.4. Diesel GENSET

For comparison against hydrogen production methods, a diesel GENSET system has been considered. As with all hydrogen production methods, the same propellor motor system has been used with matching hours used and energy requirements. The flows for the diesel GENSET, as seen in Figure 7, are simplified models that account only for fuel in, engine, generator and final motor. There is 3 different variations of the diesel GENSET flow, divided into 3 efficiency levels. High efficiency has a 50% engine efficiency and 96% generator efficiency, medium has an efficiency at 40% for the engine and 93% for the generator, and finally low has an efficiency at 30% for the engine and 90% for the generator. The efficiency levels are purely based on power delivered to the motor against fuel input, heat energy is not considered as useful energy within this research but could theoretically be utilised in certain vessels. It can be considered that larger vessels that operate constantly at cruising speeds, such as bulk carriers and container vessels, will have efficiencies in the medium to high range, while smaller vessels that perform a lot of maneuvers, such as inland ferries and personal use vessels, will have efficiencies within the low to medium range [43]. While this will still ultimately depend on a wide multitude of use and equipment factors, for the purposes of this research it can be considered an appropriate range.
In Figure 7 the inputs and outputs of the system are shown. Air intake is not considered as it doesn’t affect the emissions of the system, they have been accounted for separately, which can be seen. All emission data is derived from IMO (International Maritime Organization) LCA data [44].

3.5. Natural Gas GENSET

The liquified natural gas GENSET operates much in the same way as the diesel version, with a simplified flow of fuel, propellor motor and, in this case, a single GENSET process. This can be seen in Figure 8. There are 3 efficiency variables of high, medium, and low, with a combined GENSET efficiency of 45% for high, 40% for medium, and 35% for low. Much the same as every other flow in this research, the 600 kW motor and auxiliary system run at a constant rating [43].

4. Results

All data will be presented in this section, by form of production and fuel cell system, with comments reserved until the discussion section. Data will be presented in table and graph form where applicable.

4.1. Hydrogen from Electrolysis

The first results in Table 1 show the GWP (100 years) kg per MJ of electrolysis with different energy sources and different fuel cell technologies. Heavy fuel oil with MCFC has the highest GWP with 1.08 kg of carbon dioxide equivalent produced per MJ, and nuclear power through PEMFC has the lowest production of carbon dioxide equivalent at 4.53 g per MJ. The most applicable result is the grid mix result which has carbon dioxide equivalent of 0.284 kg.
The data from Table 1 is compiled into Figure 9, which shows the results for different sources in graph form.
Table 2 shows the emissions data for electrolysis through different energy sources, in the form of grams per MJ used by the PEMFC system. The table shows CO (carbon monoxide), CO2 (carbon dioxide), CH4 (methane), NOXs (nitrogen oxides), SOXs (sulphur oxides), and NMVOC (non-methane volatile organic compounds). This is then subsequently displayed in graph form in Figure 10 for all data aside from carbon dioxide which is represented in Figure 11. The corresponding data for MCFCs can be seen in Table A1 and Figure A1 in the Appendix A.

4.2. Hydrogen from Steam Reforming

Table 3 shows GWP (100 years) for steam reforming powered by different sources, for both PEMFC and MCFC systems. This is followed by Figure 12 which shows the same data as Table 3 but in graph form for comparison. Both graphs represent the data in the form of kg of CO2 equivalent per MJ used by the system operating at 600 kW. Table 3 shows two sets of data, one “with CC” which shows data for when carbon capture is being utilised, and “without CC” where all carbon dioxide emissions are released to the atmosphere. This data is subsequently displayed in Figure 12.
Figure 13 Shows the data from Table 4 in graph form for comparison of results. With carbon capture, only CO2 levels change, and so all data for with and without CC is identical for all other emissions. Carbon dioxide data is not included due to being so large in comparison to other results so is displayed in Figure 14. The corresponding data for MCFCs can be seen in Table A2 and Figure A2 in the Appendix B.

4.3. Traditional Fuel Systems

Table 5 shows the GWP (100 years) for diesel systems and Table 6 for gas systems, with each divided into high, medium, and low efficiency. It should be noted that the efficiencies aren’t the same but represent the low to high range of each fuel type system. The data is represented in kg per MJ used by the system.
The data from Table 5 and Table 6 Is represented in Figure 15 GWP (100 years), kg per MJ used through traditional fuel systems with different efficiency levels. Once again in kg per MJ used by the system.
Table 7 and Table 8 Shows the emissions from diesel and gas systems respectively. Data is represented as grams per MJ used by the system.
Figure 16 shows the data from Table 7 and Table 8. In graph form. Once again data is represented in grams per MJ used by the system. Carbon dioxide is not included as it would skew the rest of the data. Only medium efficiency is considered only as the difference between efficiencies isn’t as important as the comparison between the fuel types.
Finally, the data for carbon dioxide emissions for both systems is represented in Figure 17. The data is represented as grams per MJ used by the system.

5. Discussion

The following discussion is divided into 3 sections: Section 5.1. Results Analysis, Section 5.2. Case Study Recommendations and Section 5.3. Research Analysis. The first will investigate the results obtained throughout the research and will compare them. The second, Case study analysis, will investigate the feasibility of a using hydrogen fuel system in a future theoretical vessel, as outlined in the introduction. Finally, the research analysis will investigate how this research was conducted and what improvements could have been made.

5.1. Results Analysis

One of the objectives of this research is to compile and analyse data that has been produced within this research, which will be done in this section by discussing and comparing results, before commenting on changes and inefficiencies. The data that has been collected shows two major things, the first is what was expected, that there could be a major reduction in greenhouse gas emissions through using a hydrogen system. The second is something less expected, which is to how much of an effect the production method and energy source can have on the results.
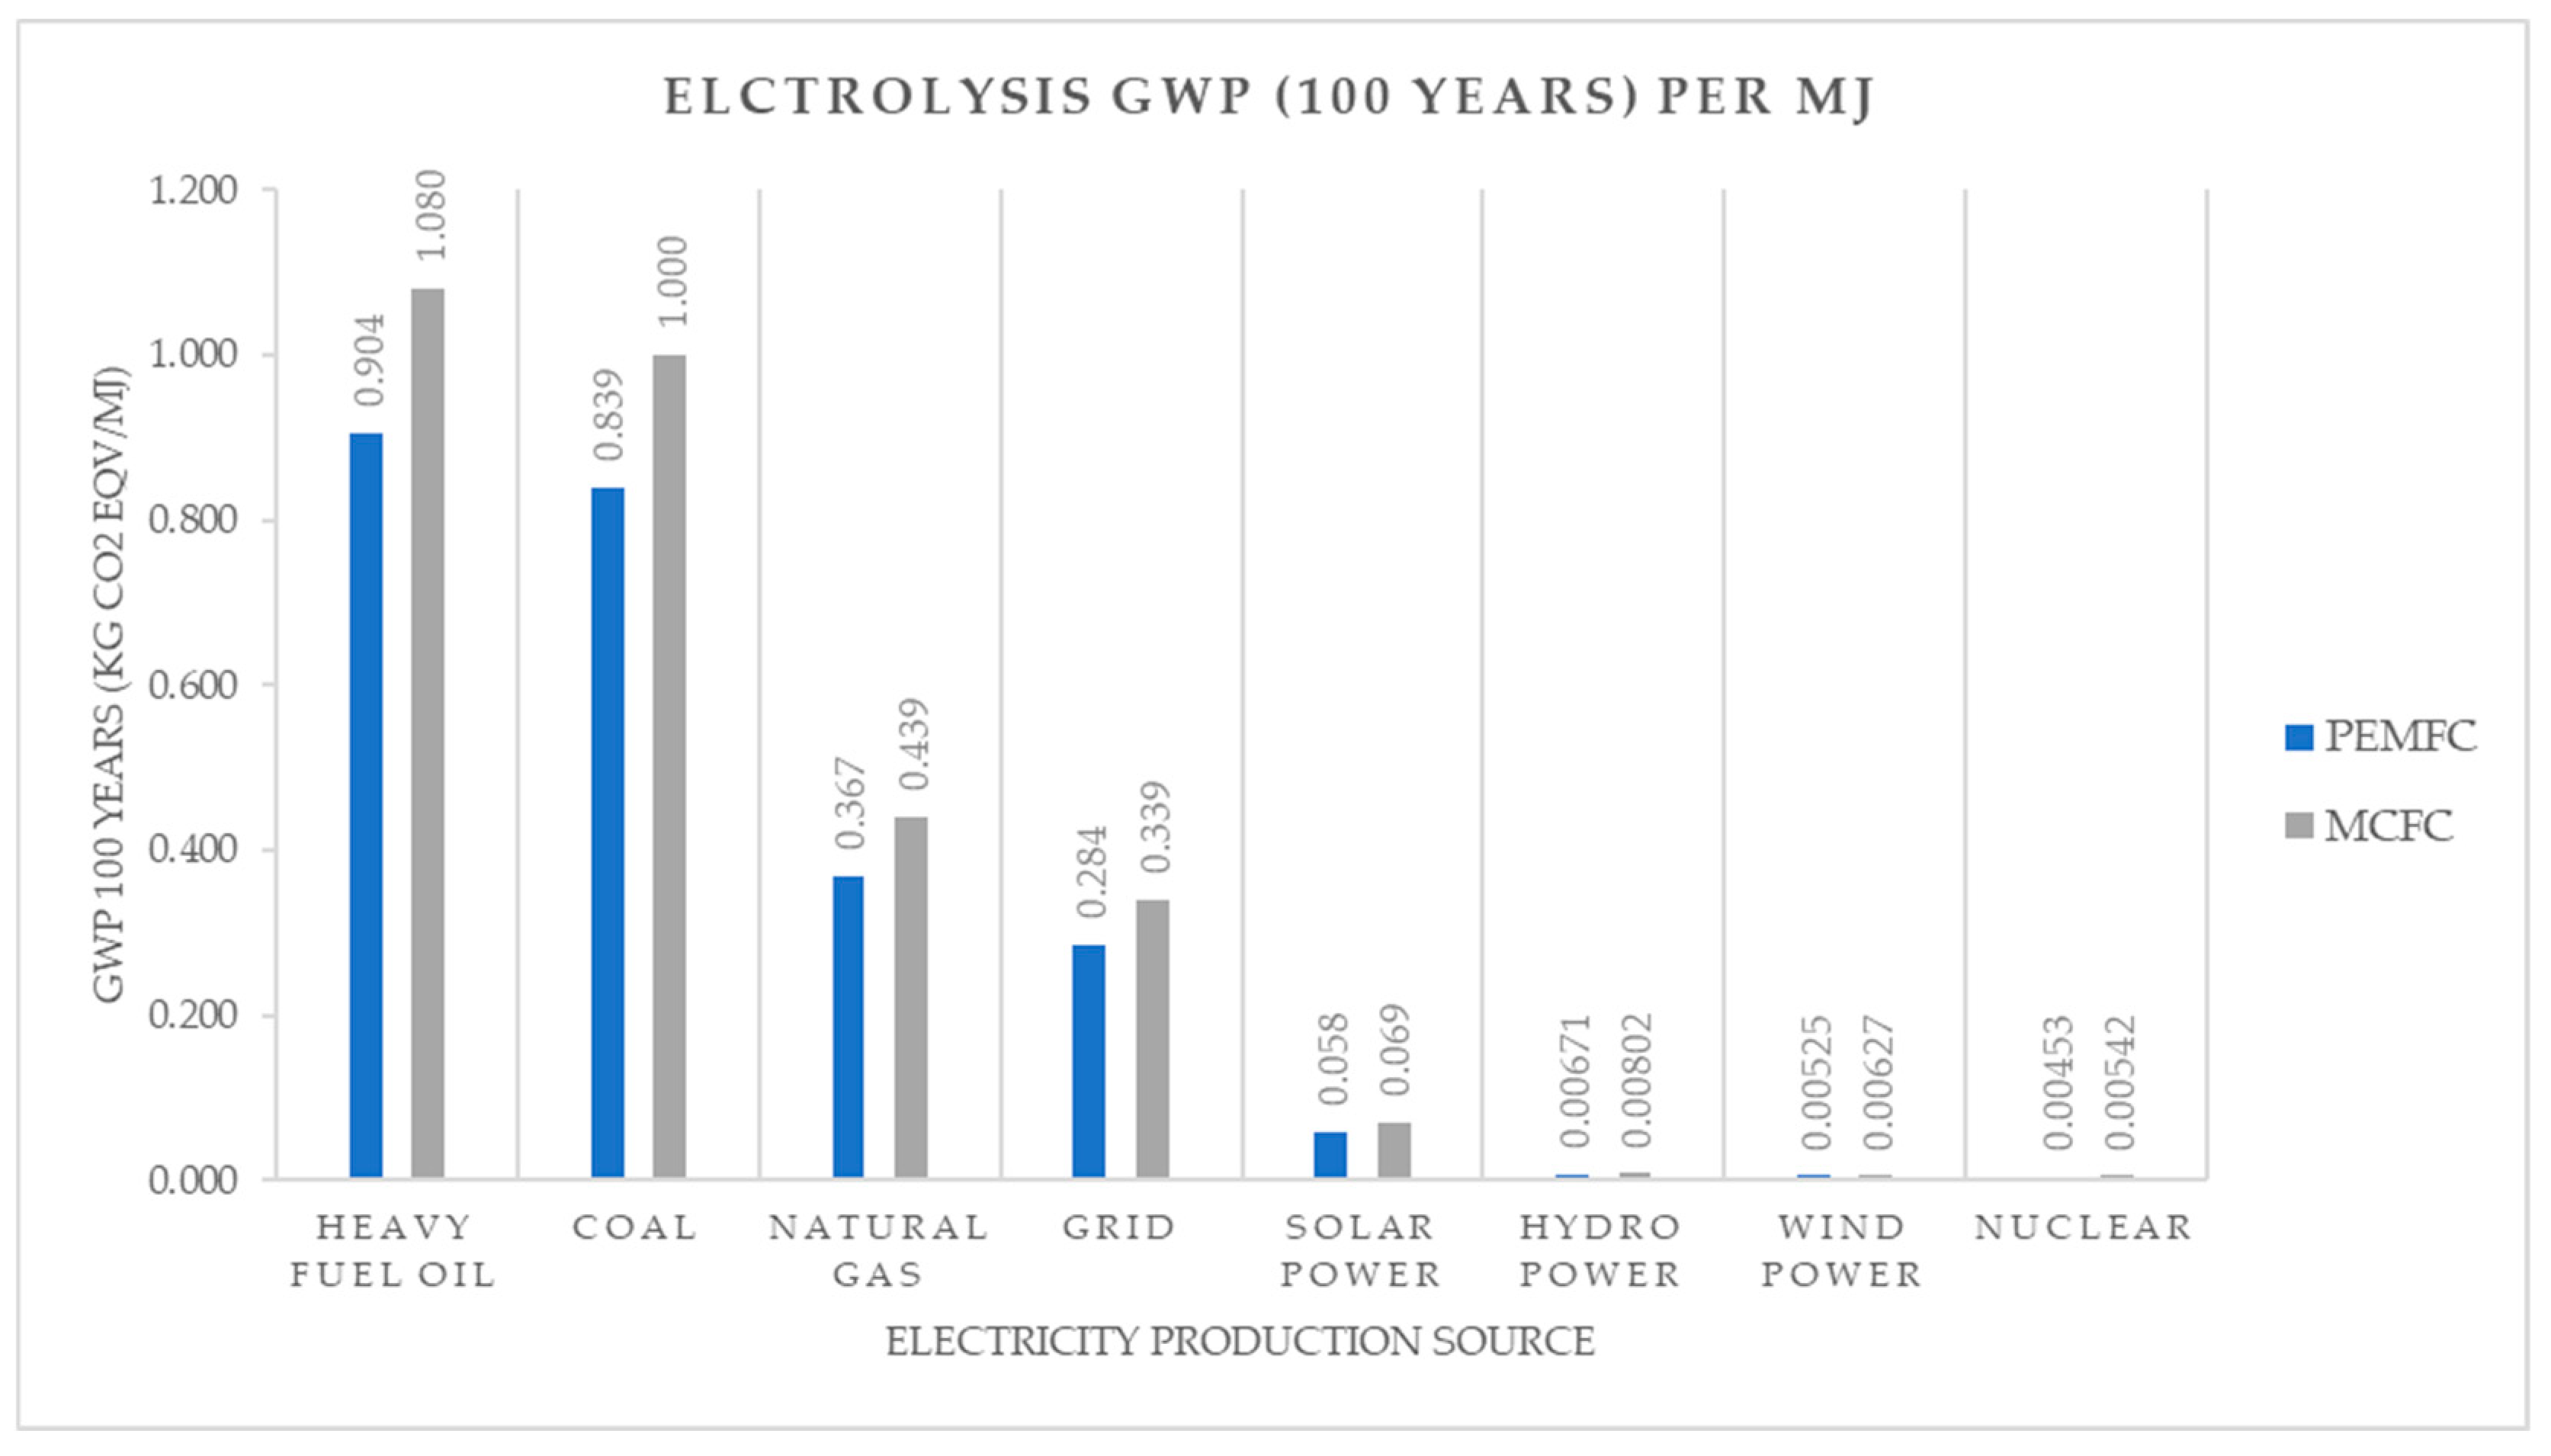
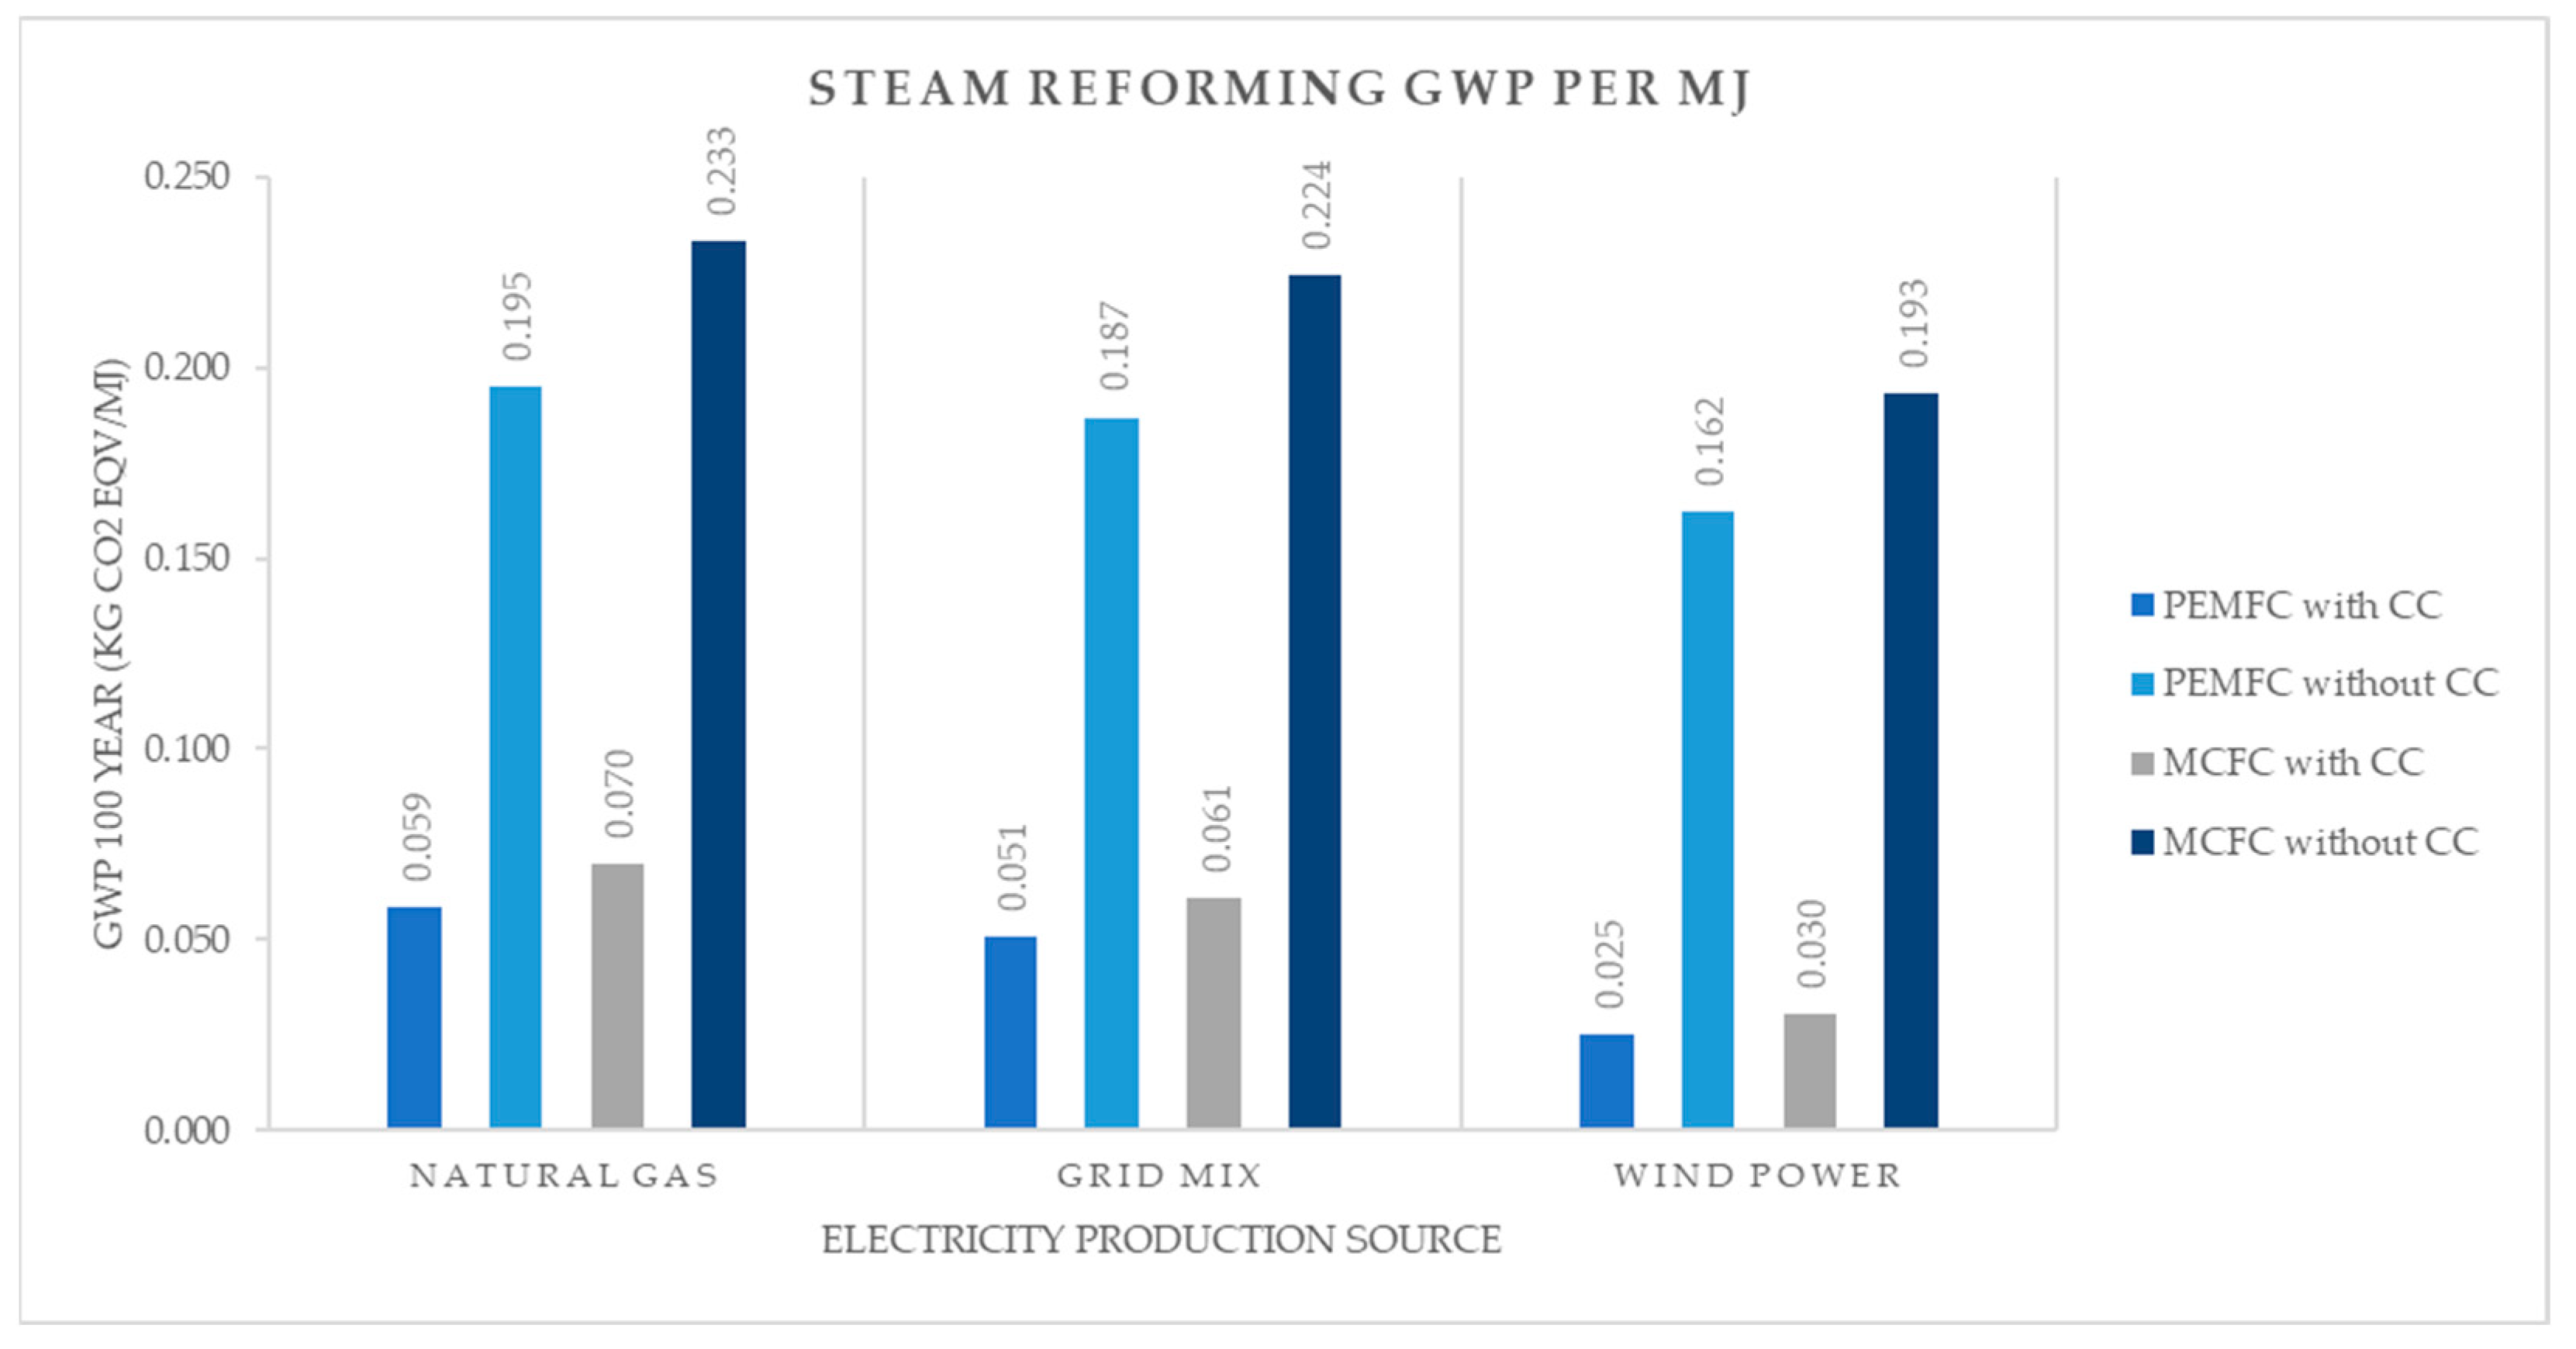
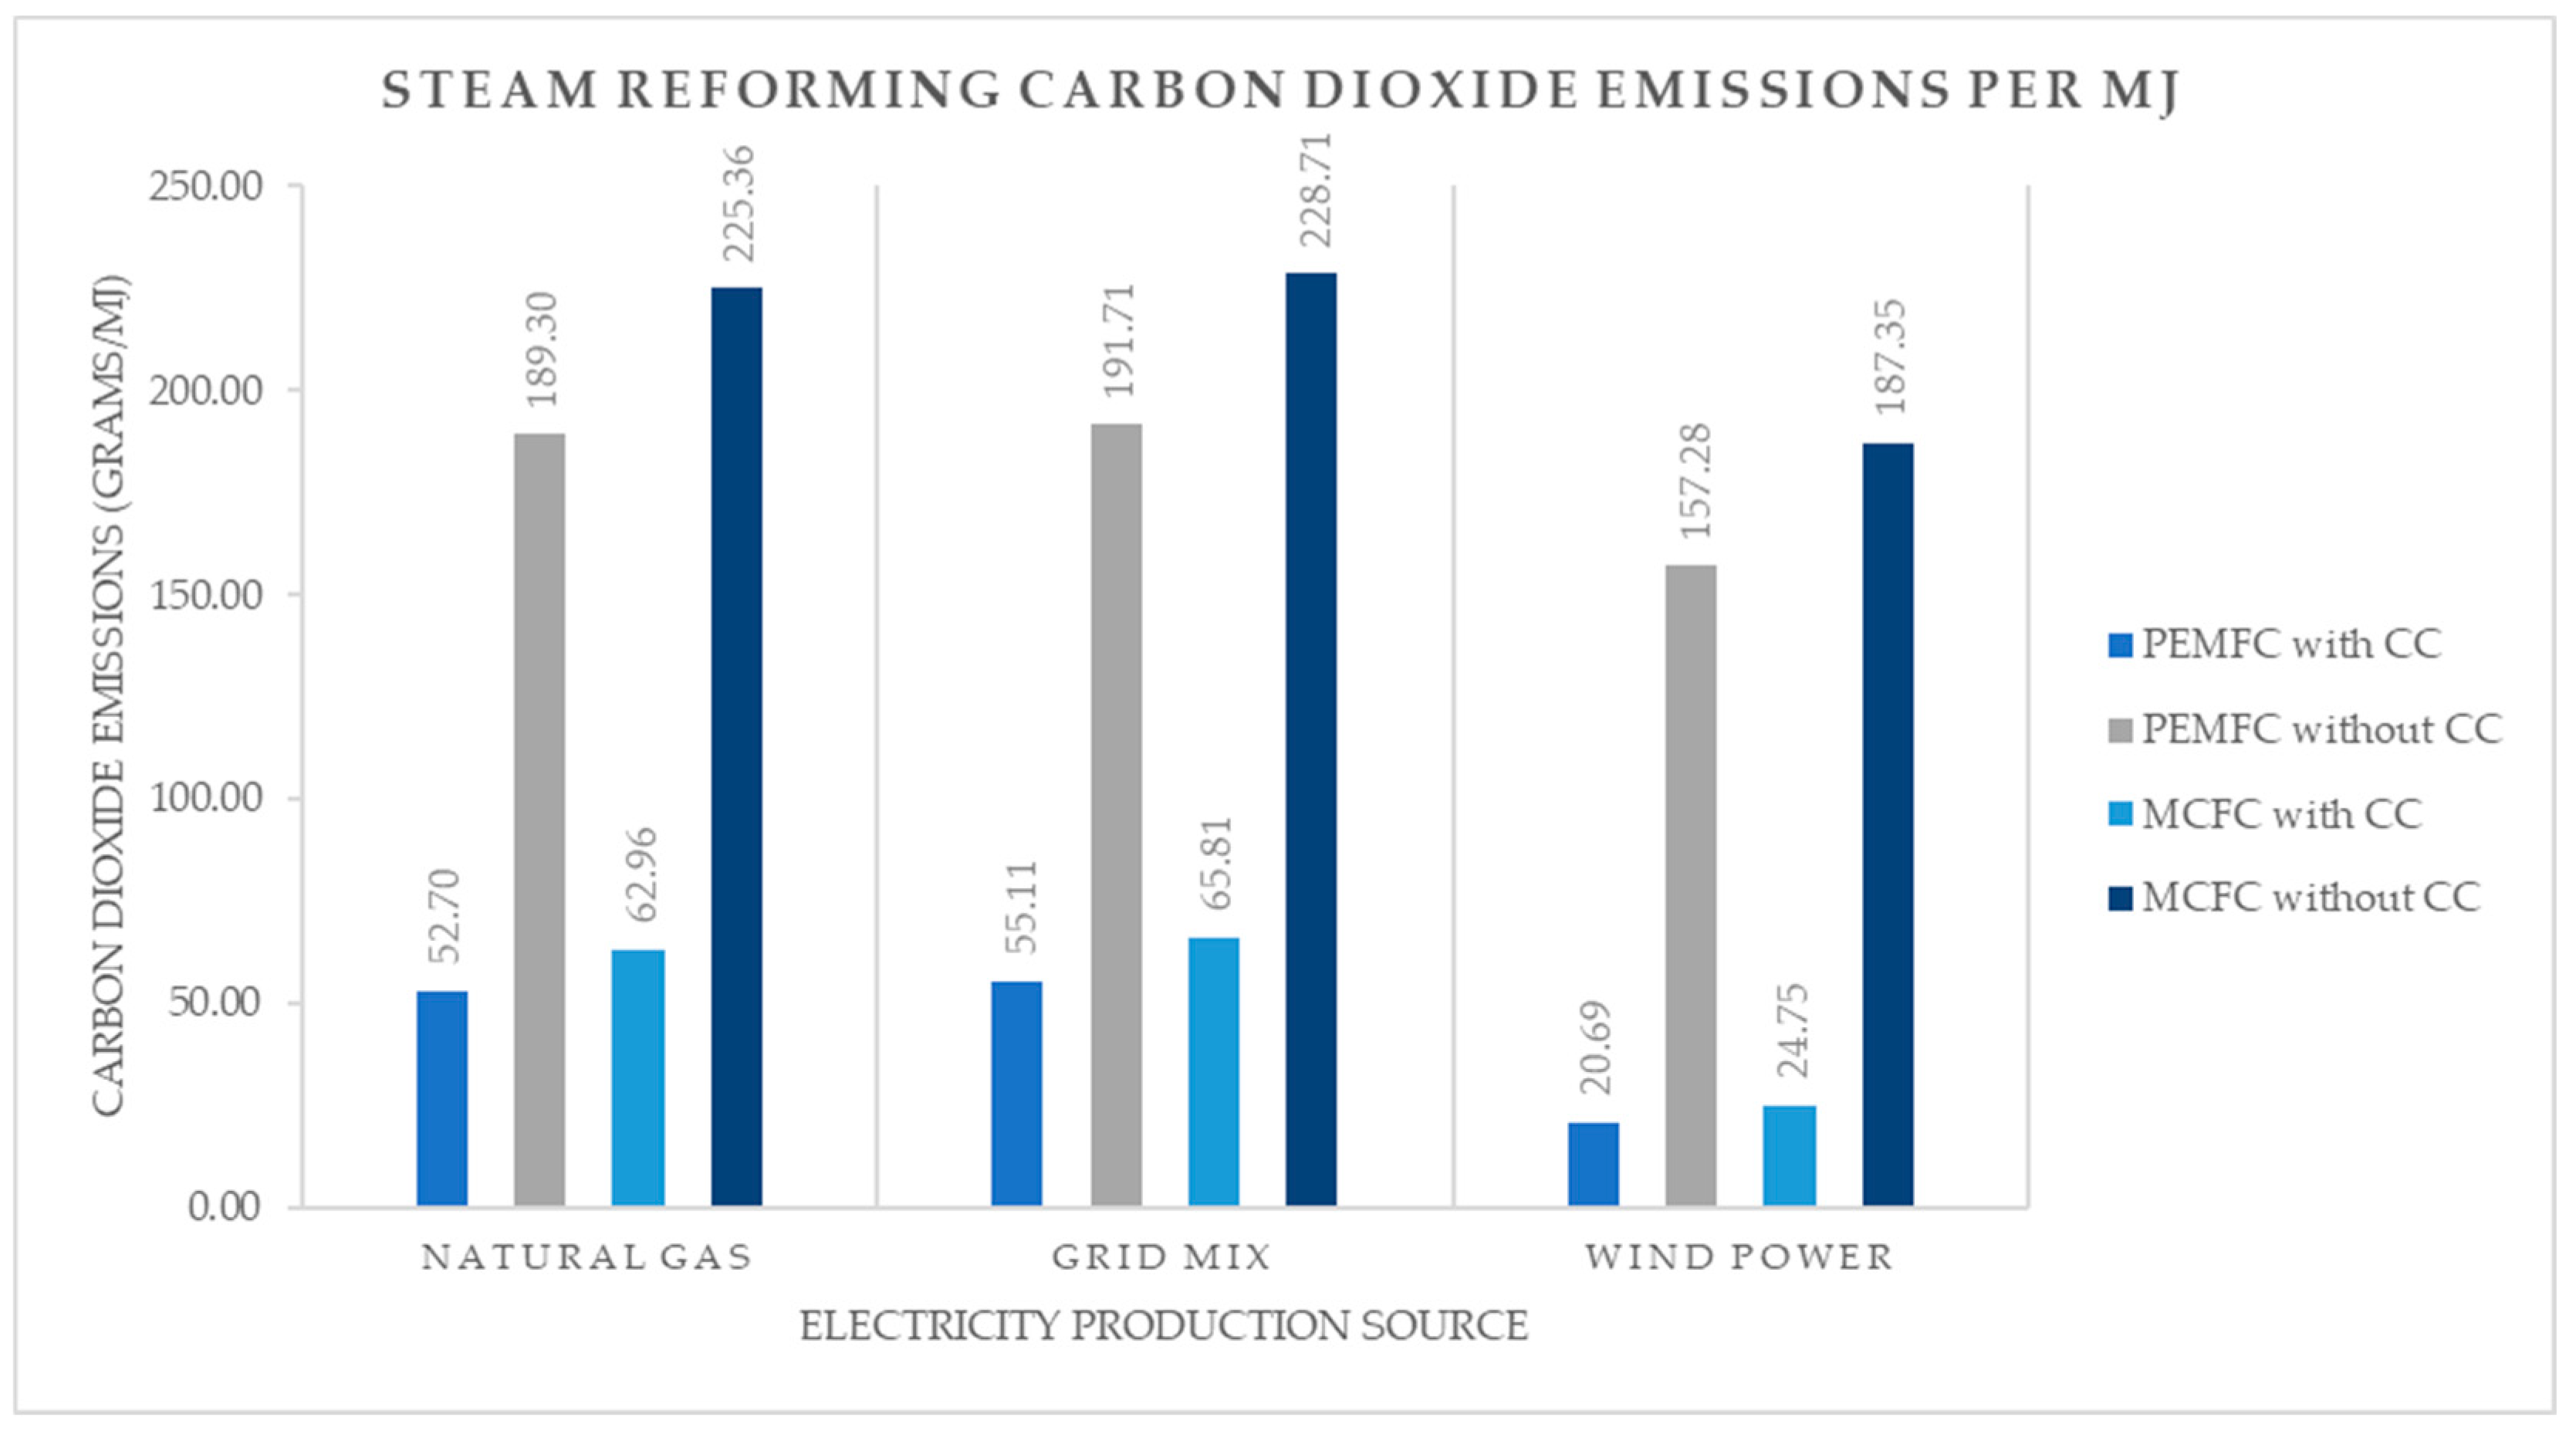
While the GWP (100 years) data isn’t the only metric that should be judged, it does give a good general indication of the environmental impact of the production method. Grid mix data for hydrogen from electrolysis and steam reforming is likely the most relevant for comparison against other fuels as it is most likely the means that will be used for production. The results from each GWP table offer a good comparison for a usage case, with grid powered electrolysis being overwhelmingly the worst-case situation against medium efficiency traditional fuel systems and steam reforming. Electrolysis through an MCFC system produced 0.339 kg per MJ which is 0.115 kg per MJ worse than the next highest producing system of steam reforming without CC through a MCFC system. Except for grid powered electrolysis, all other forms produced GWP data within the same region of 0.187–0.224 kg per MJ. Interestingly, when CC isn’t considered, the production method and system that produced the least potential on average was the natural gas system.
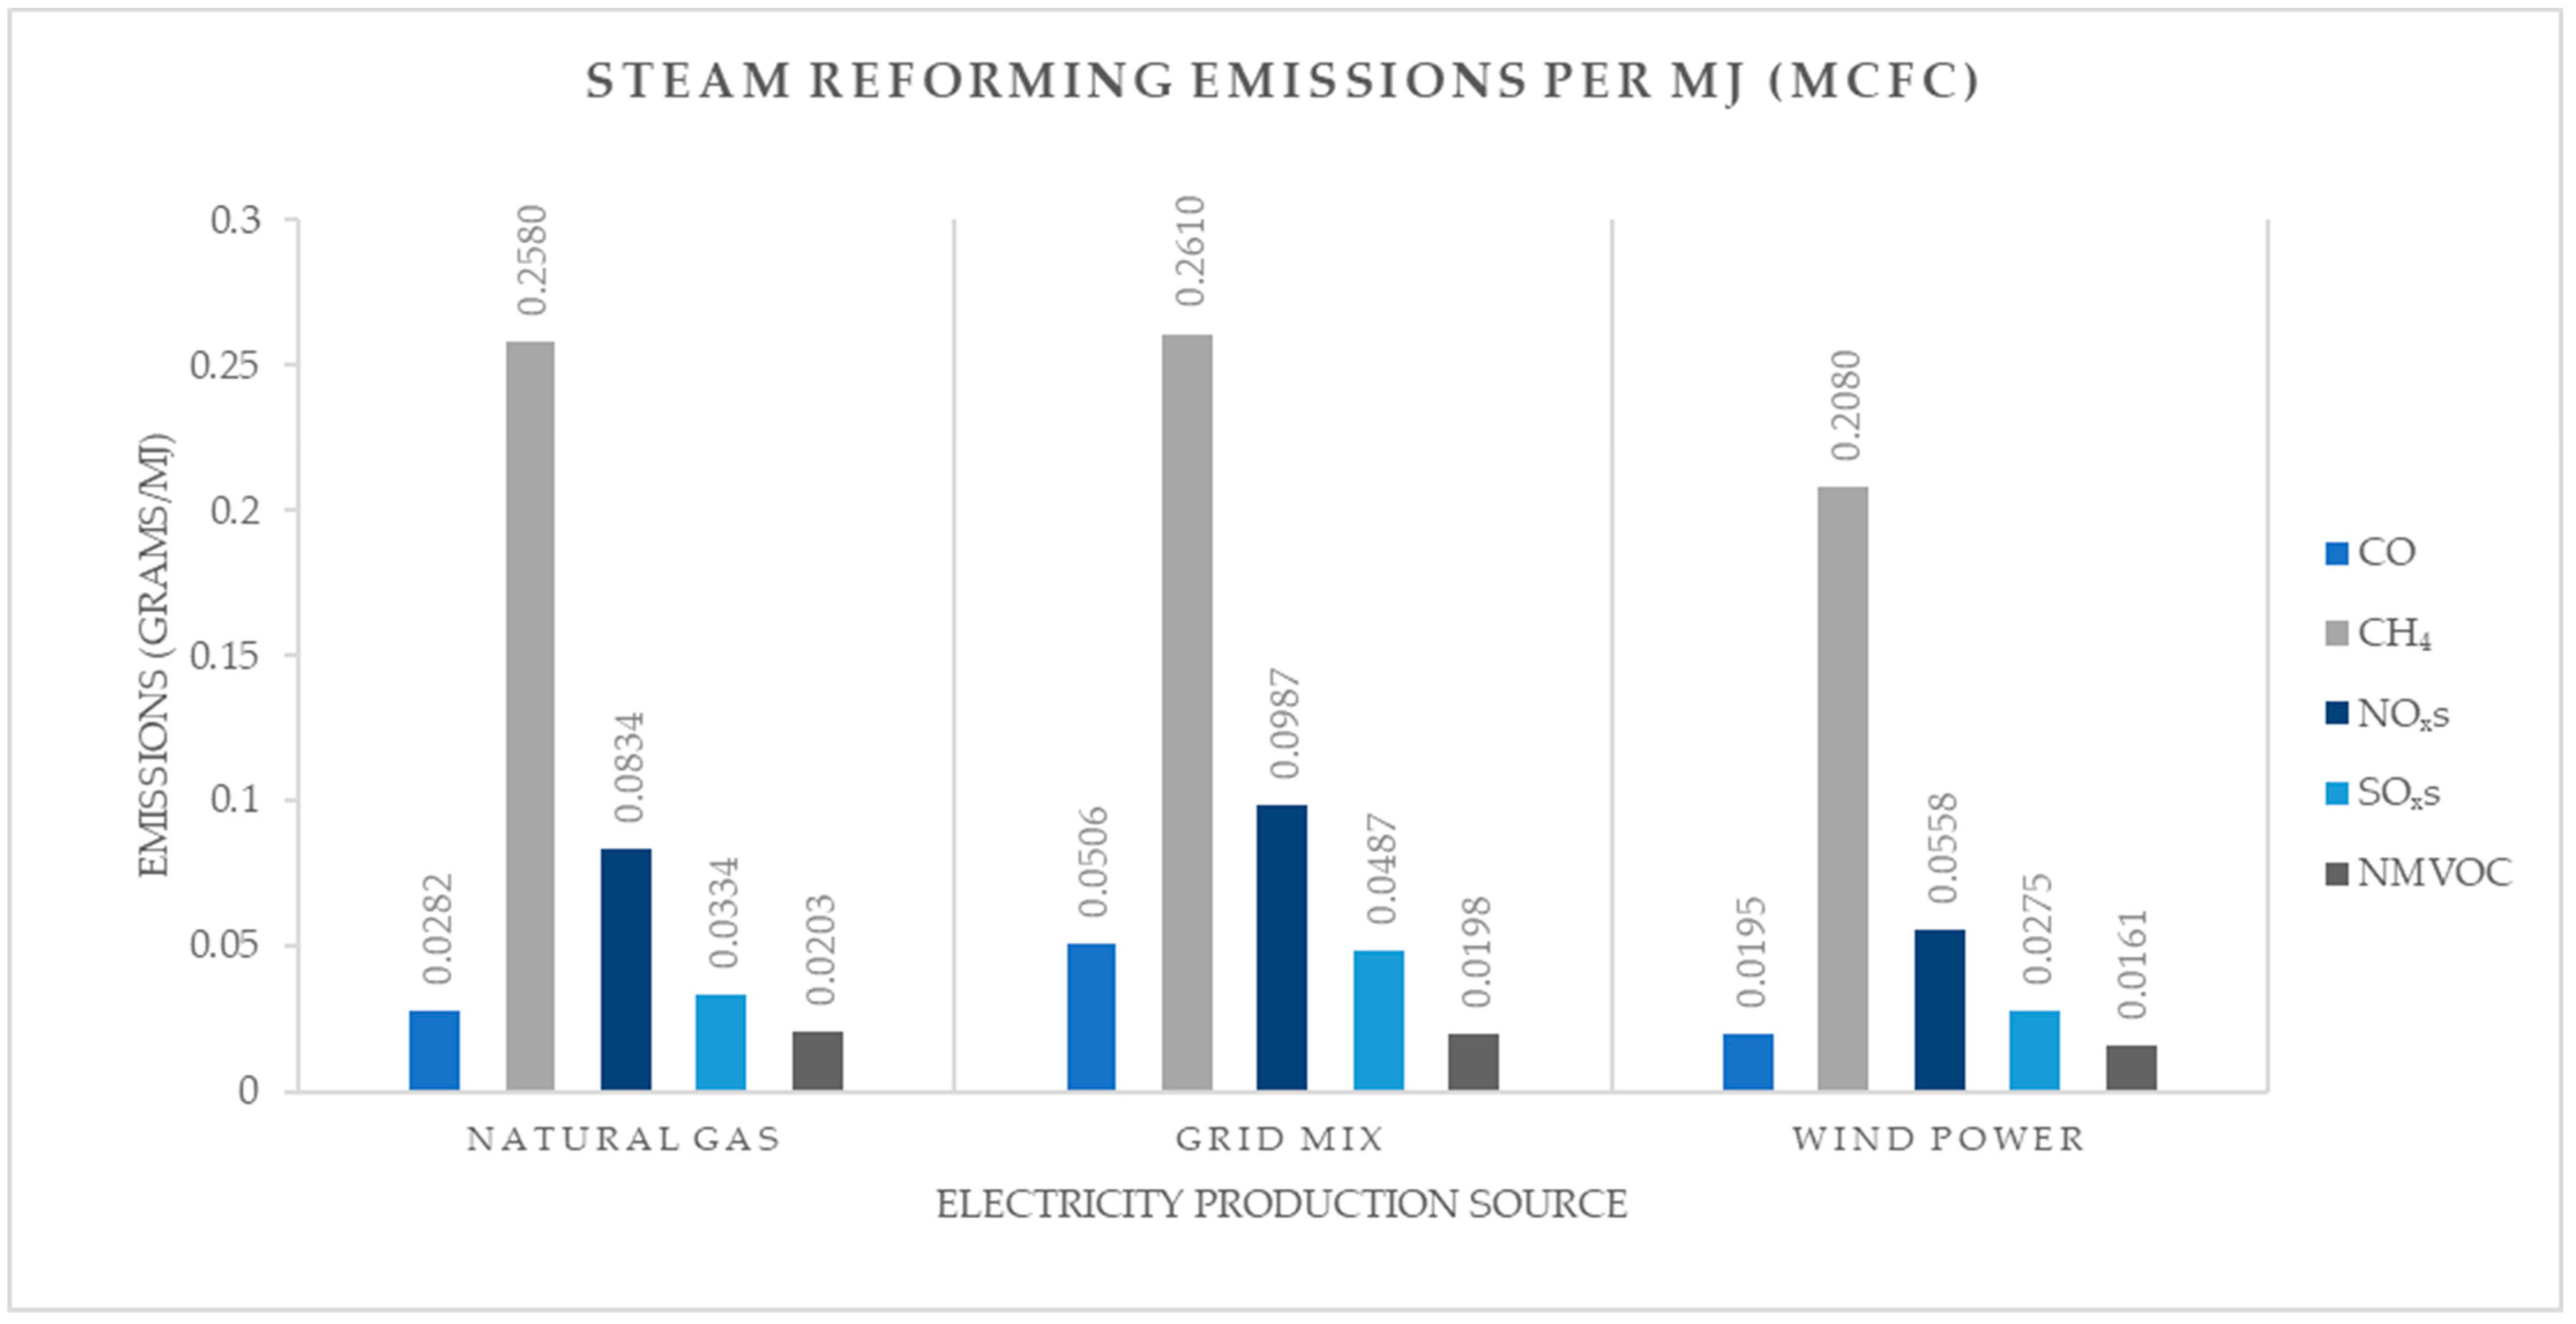
When CC is considered then steam reforming is clearly the best solution, producing only 0.051 kg per MJ through a PEMFC system, and sourced from grid electricity. This is a reduction of 0.288 kg per MJ against electrolysis from grid energy through a MCFC system. This shows how electrolysis is actually quite an environmentally dangerous production method when only standard grid energy is considered, something that is not often mentioned when discussing hydrogen as a future fuel source. This data is potentially even more concerning when it is considered that the UK has more low carbon electricity production than transitioning and underdeveloped economies, such as China where in 2021 55% of electricity production is from coal [45]. This is where the data recorded from electrolysis with coal powered energy is more relevant, with 1 MJ of usage through a MCFC system producing 1 kg of CO2 equivalent. Apart from electrolysis production with electricity sourced from HFO through a MCFC system at 1.08 kg per MJ, no other production method or fuel system produced results anywhere near that, with the next worse performing source producing less than half of the GWP CO2 equivalent kg.
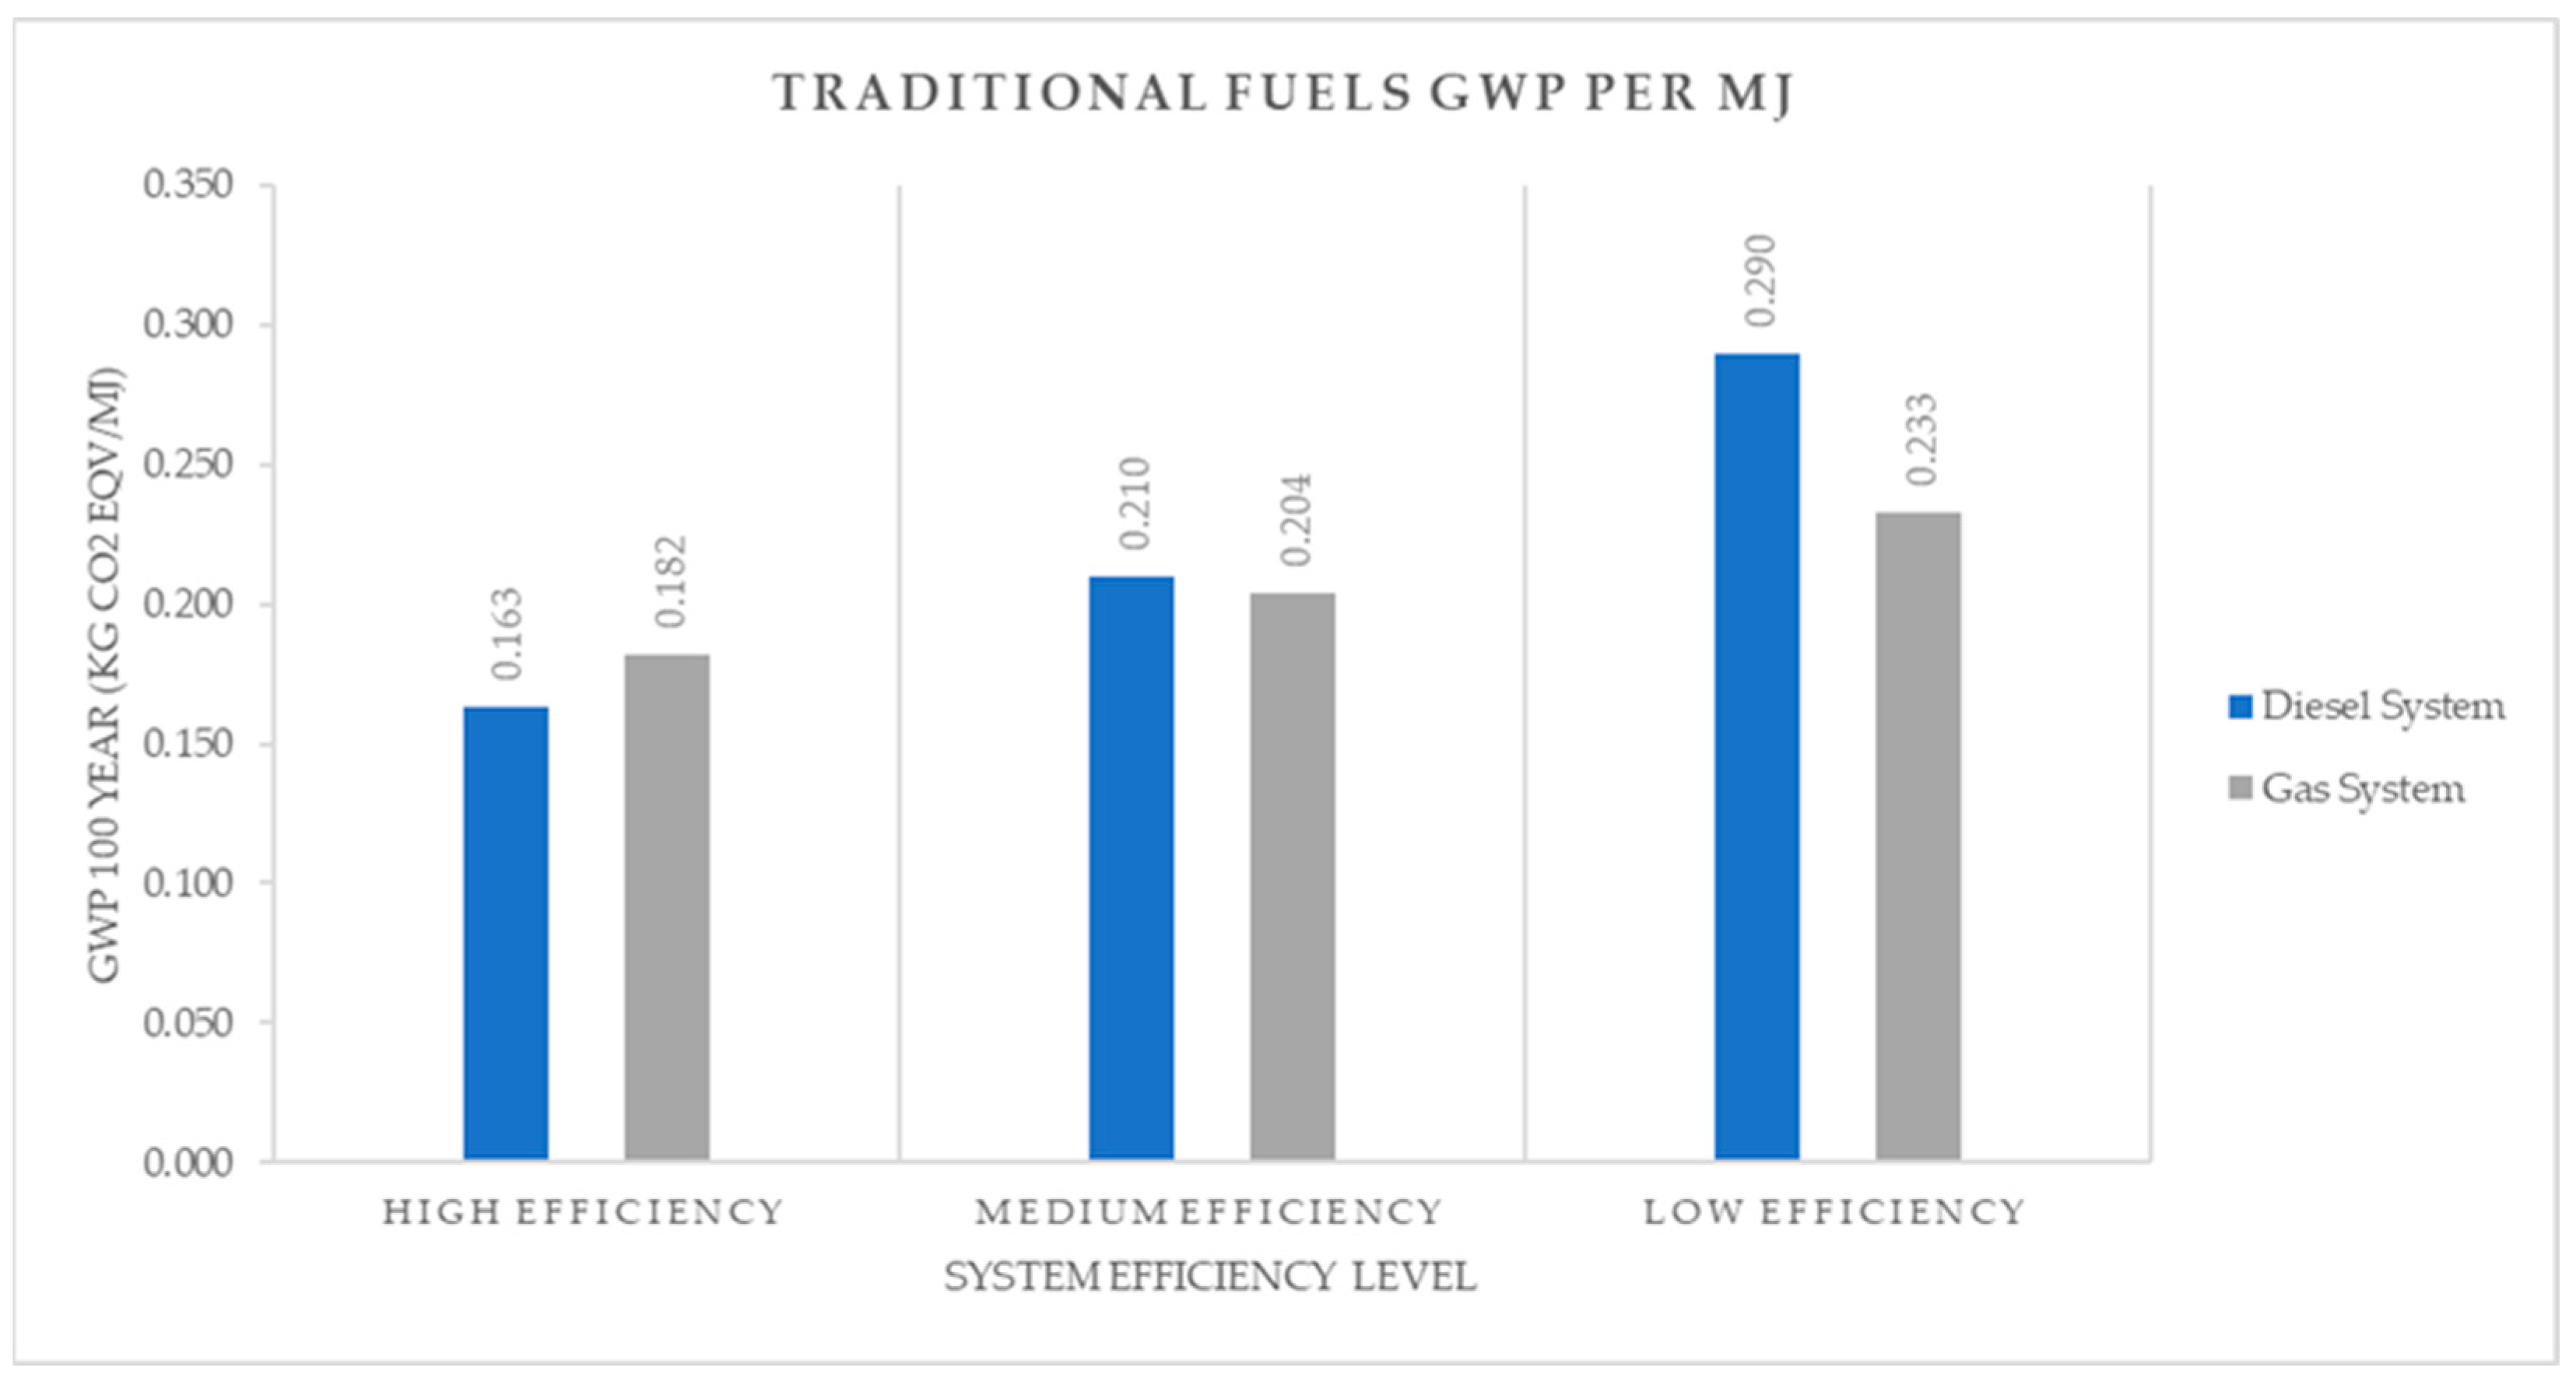
While the data produced through medium efficiency and grid mix of electricity, or through high carbon sources, overwhelmingly show that electrolysis has much higher emission data than comparable systems, the benefits of electrolysis can be fully observed when low-carbon sources and high efficiency systems are compared. Electrolysis produced through wind power or nuclear energy and used in a PEMFC system has a GWP emissions of 0.00525 and 0.00453 kg per MJ respectively. This is a huge reduction against the best-case situations for each other fuel type and fuel production process. Steam reforming powered by wind energy, utilising CC, and used in a PEMFC system produced 0.025 kg per MJ of GWP, almost 5 times higher than wind powered electrolysis, and diesel and gas systems producing 0.163 and 0.182 kg per MJ of GWP respectively, which is at best is over 31 times more than wind powered electrolysis.
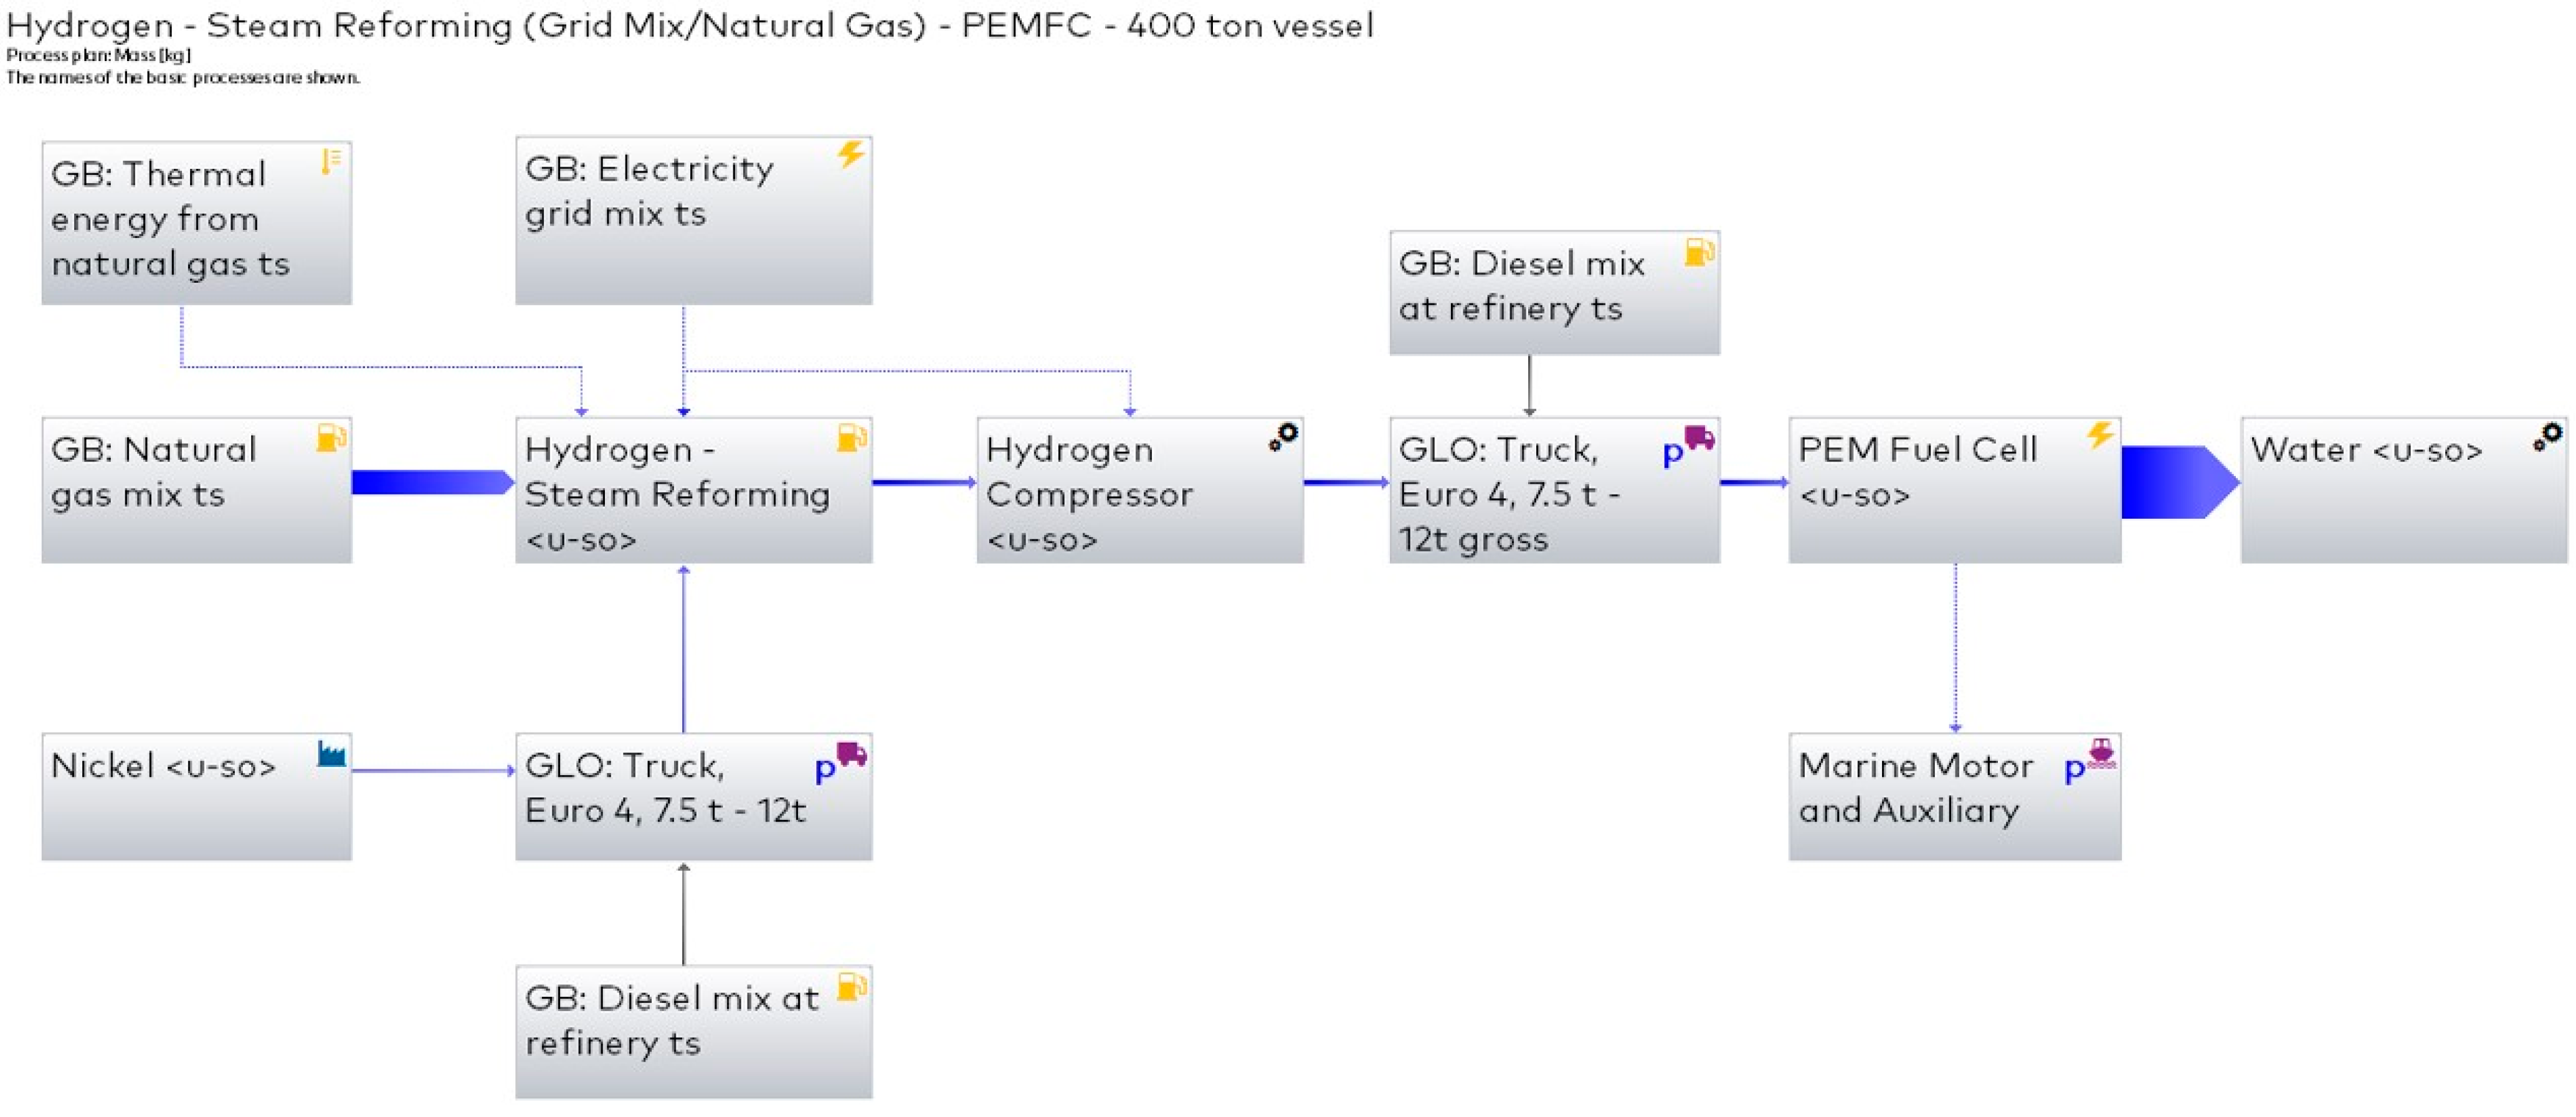
This data shows where the high aspirations of the scientific community towards green hydrogen comes from. While most national grids contain a diverse mix of energy sources, a theoretically green grid, or a production company that can source its’ own green energy has great potential to create hydrogen that could be used to power incredibly low-carbon producing systems. In our theoretical system of a 600 kW propulsion and auxiliary system with a PEM fuel cell would produce only 11.34 kg of GWP per hour, or 90.72 kg a day during regular operation. An equivalent steam reforming system with CC would produce 438.88 kg in the same day period. Finally, a high efficiency diesel or gas system would produce 2816.64 kg and 3144.96 kg of GWP respectively, for the same day period. The difference between these amounts is incredibly significant and demonstrates the high ceiling potential of the fuel source.
It should be noted that it would be quite difficult to produce enough green energy from low-carbon sources to have much of an impact on the sector. Large energy infrastructure can be incredibly expensive for private companies and political bureaucracy can slow the transition of national grids to low-carbon electricity production. A large-scale transition to the fuel source would be an immense challenge that seems unlikely, but small-scale changes could be made to facilitate small scale transitioning. A small ferry company, such as the one discussed within this research, could potentially install their own wind power to produce the fuel themselves, the cost would be high but would theoretically produce green fuel. On the other end of the scale a large international shipping company could invest in larger scale infrastructure to slowly transition their fleets to either solely hydrogen systems, or hybrid systems.
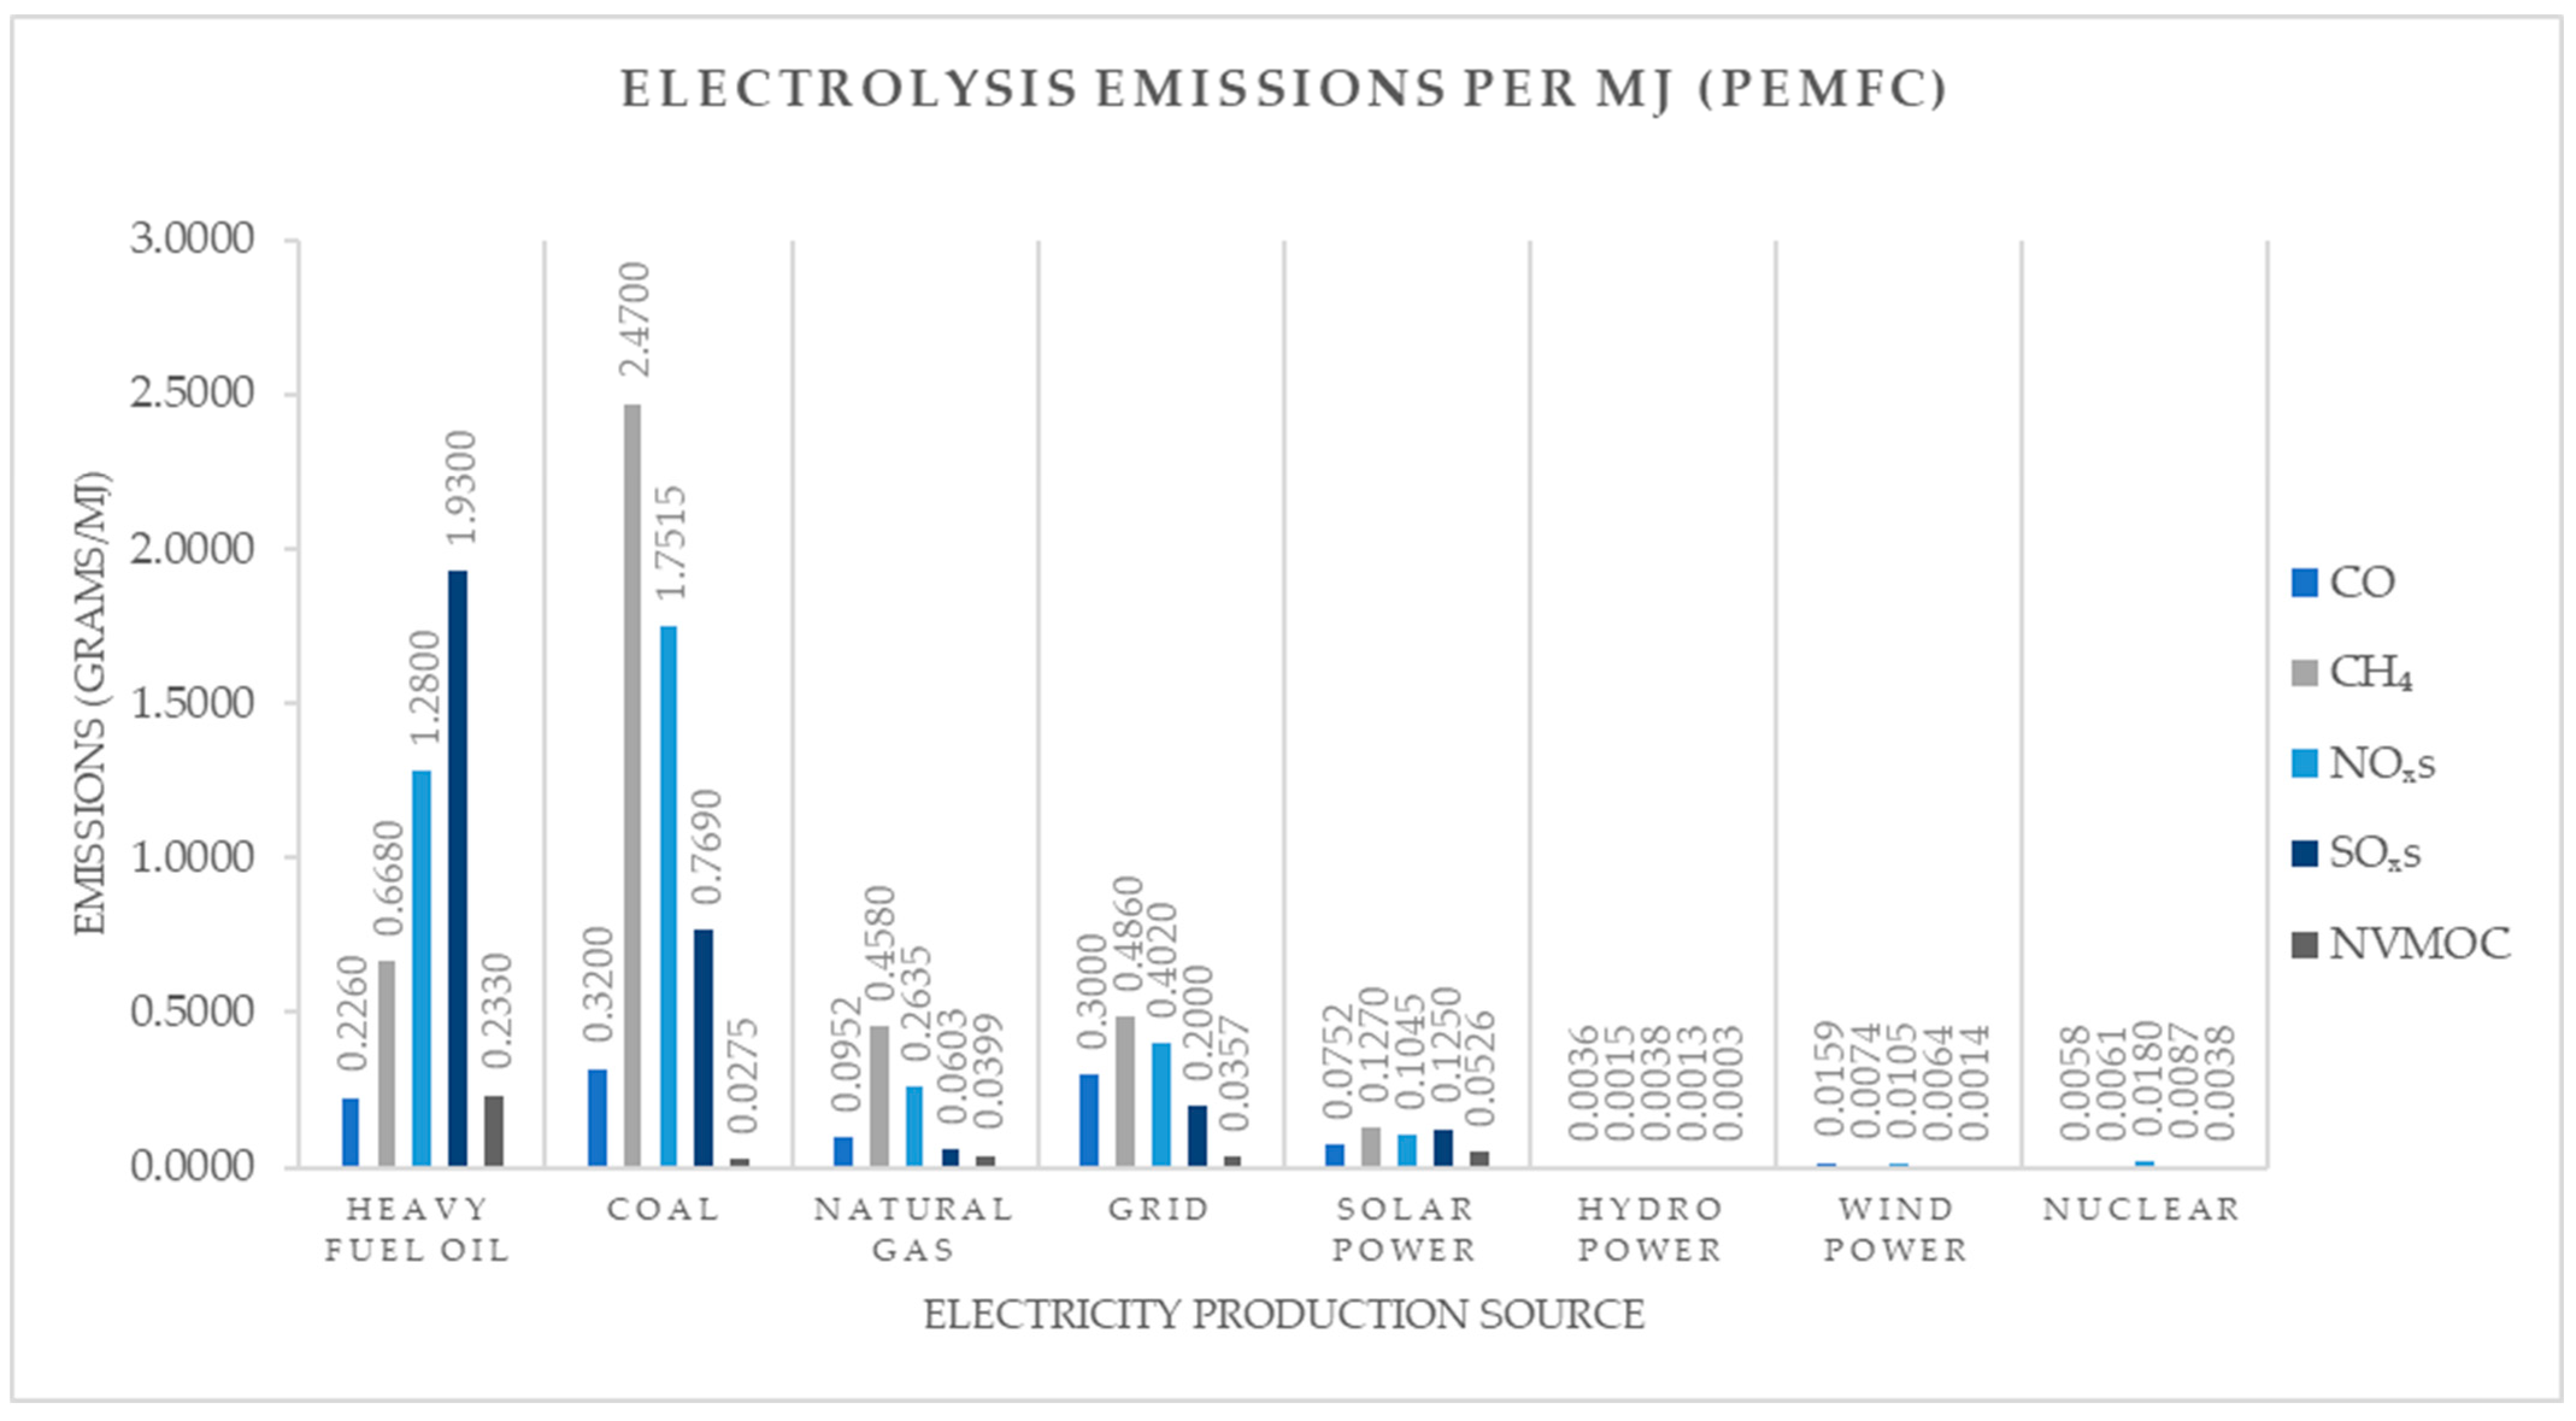
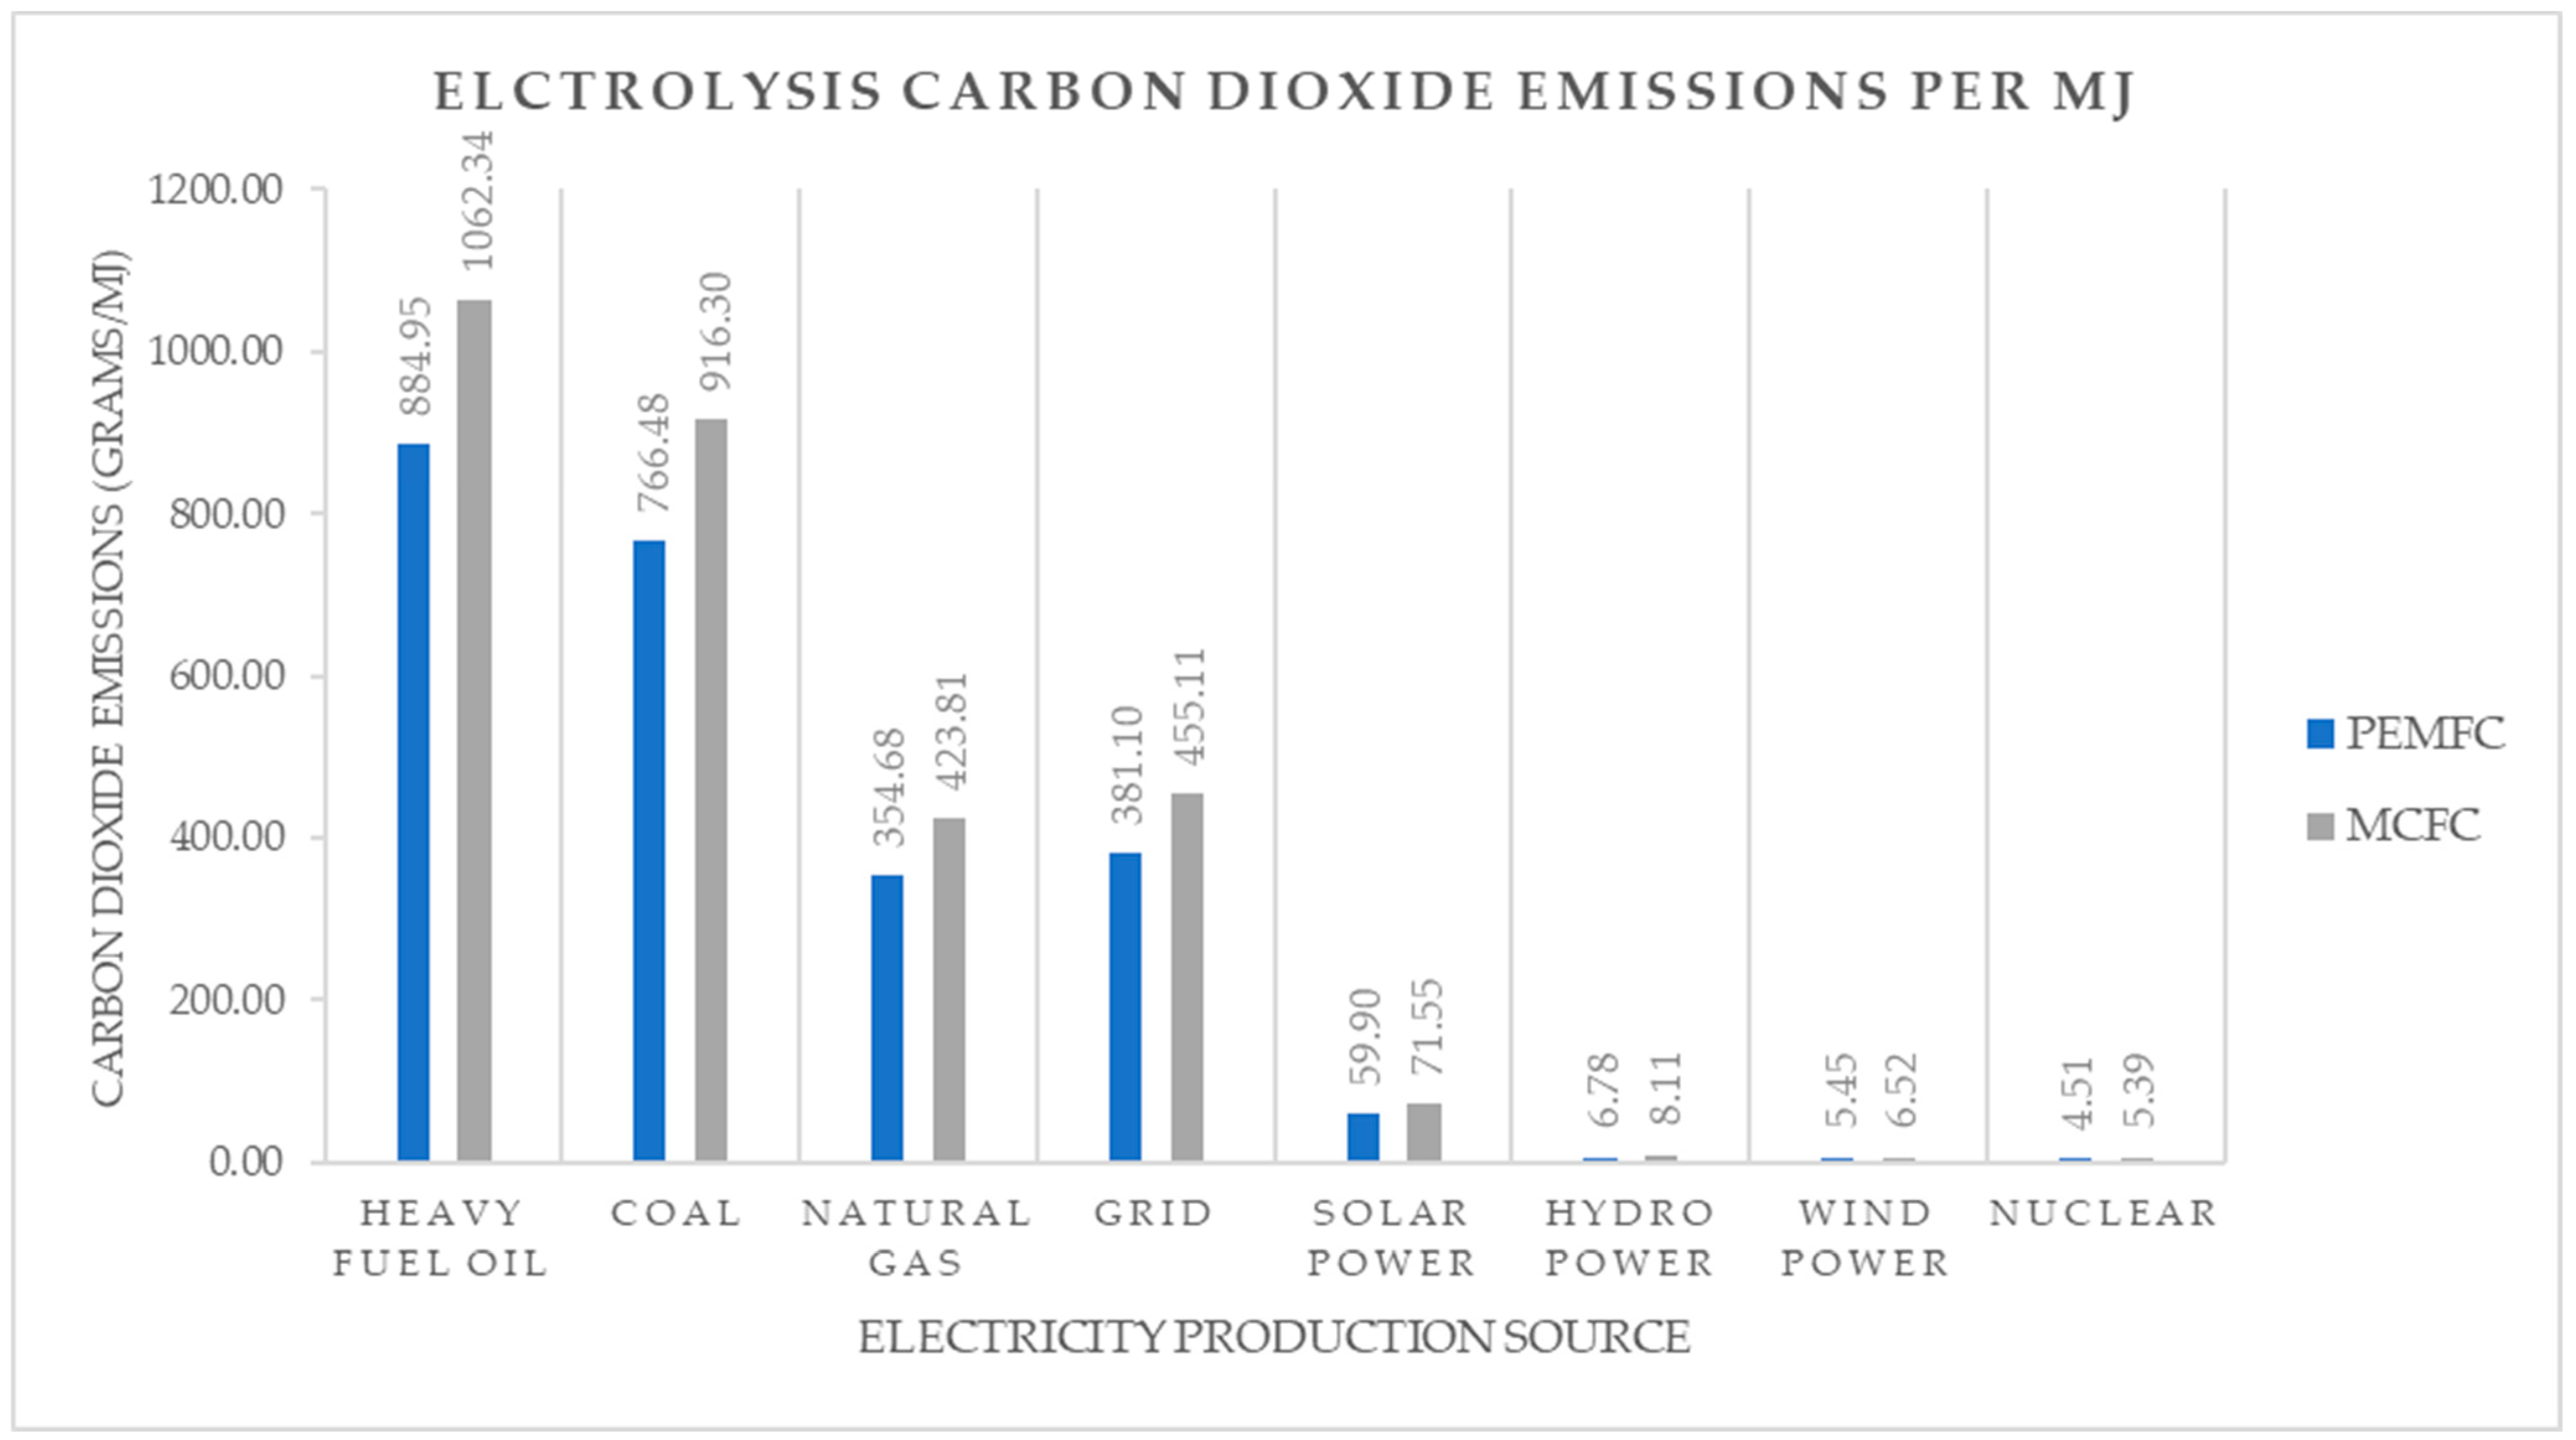
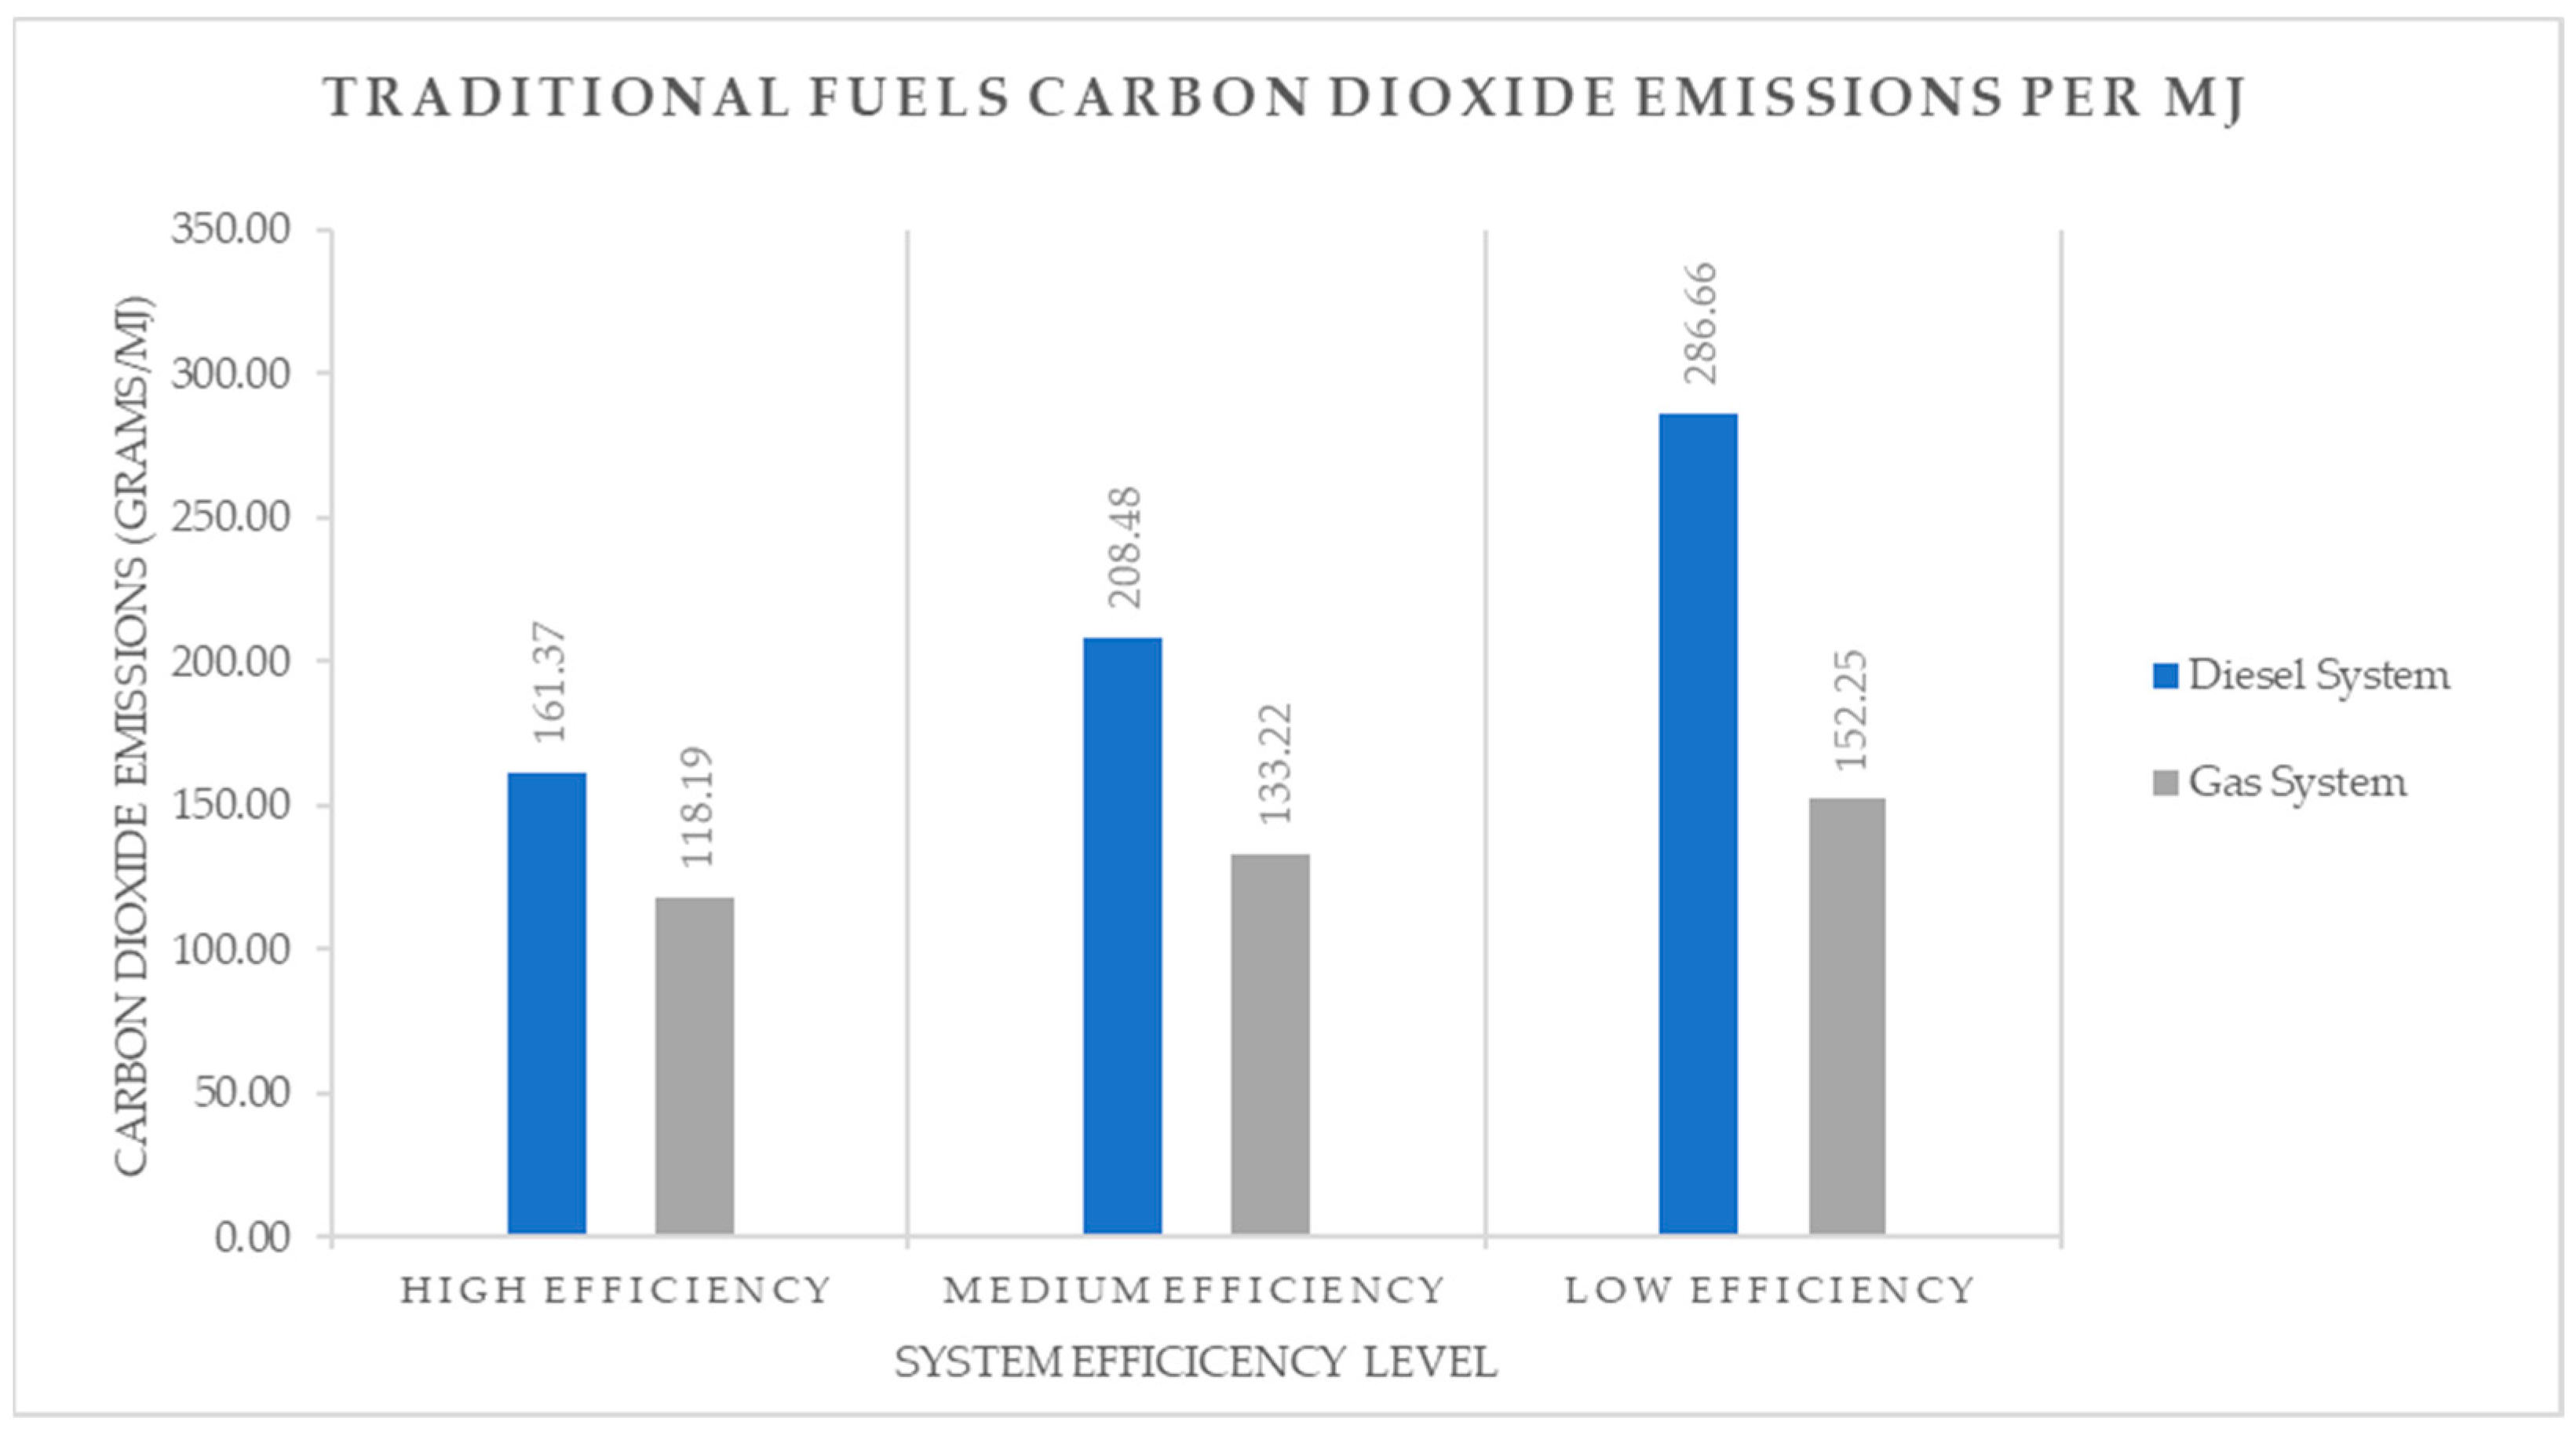
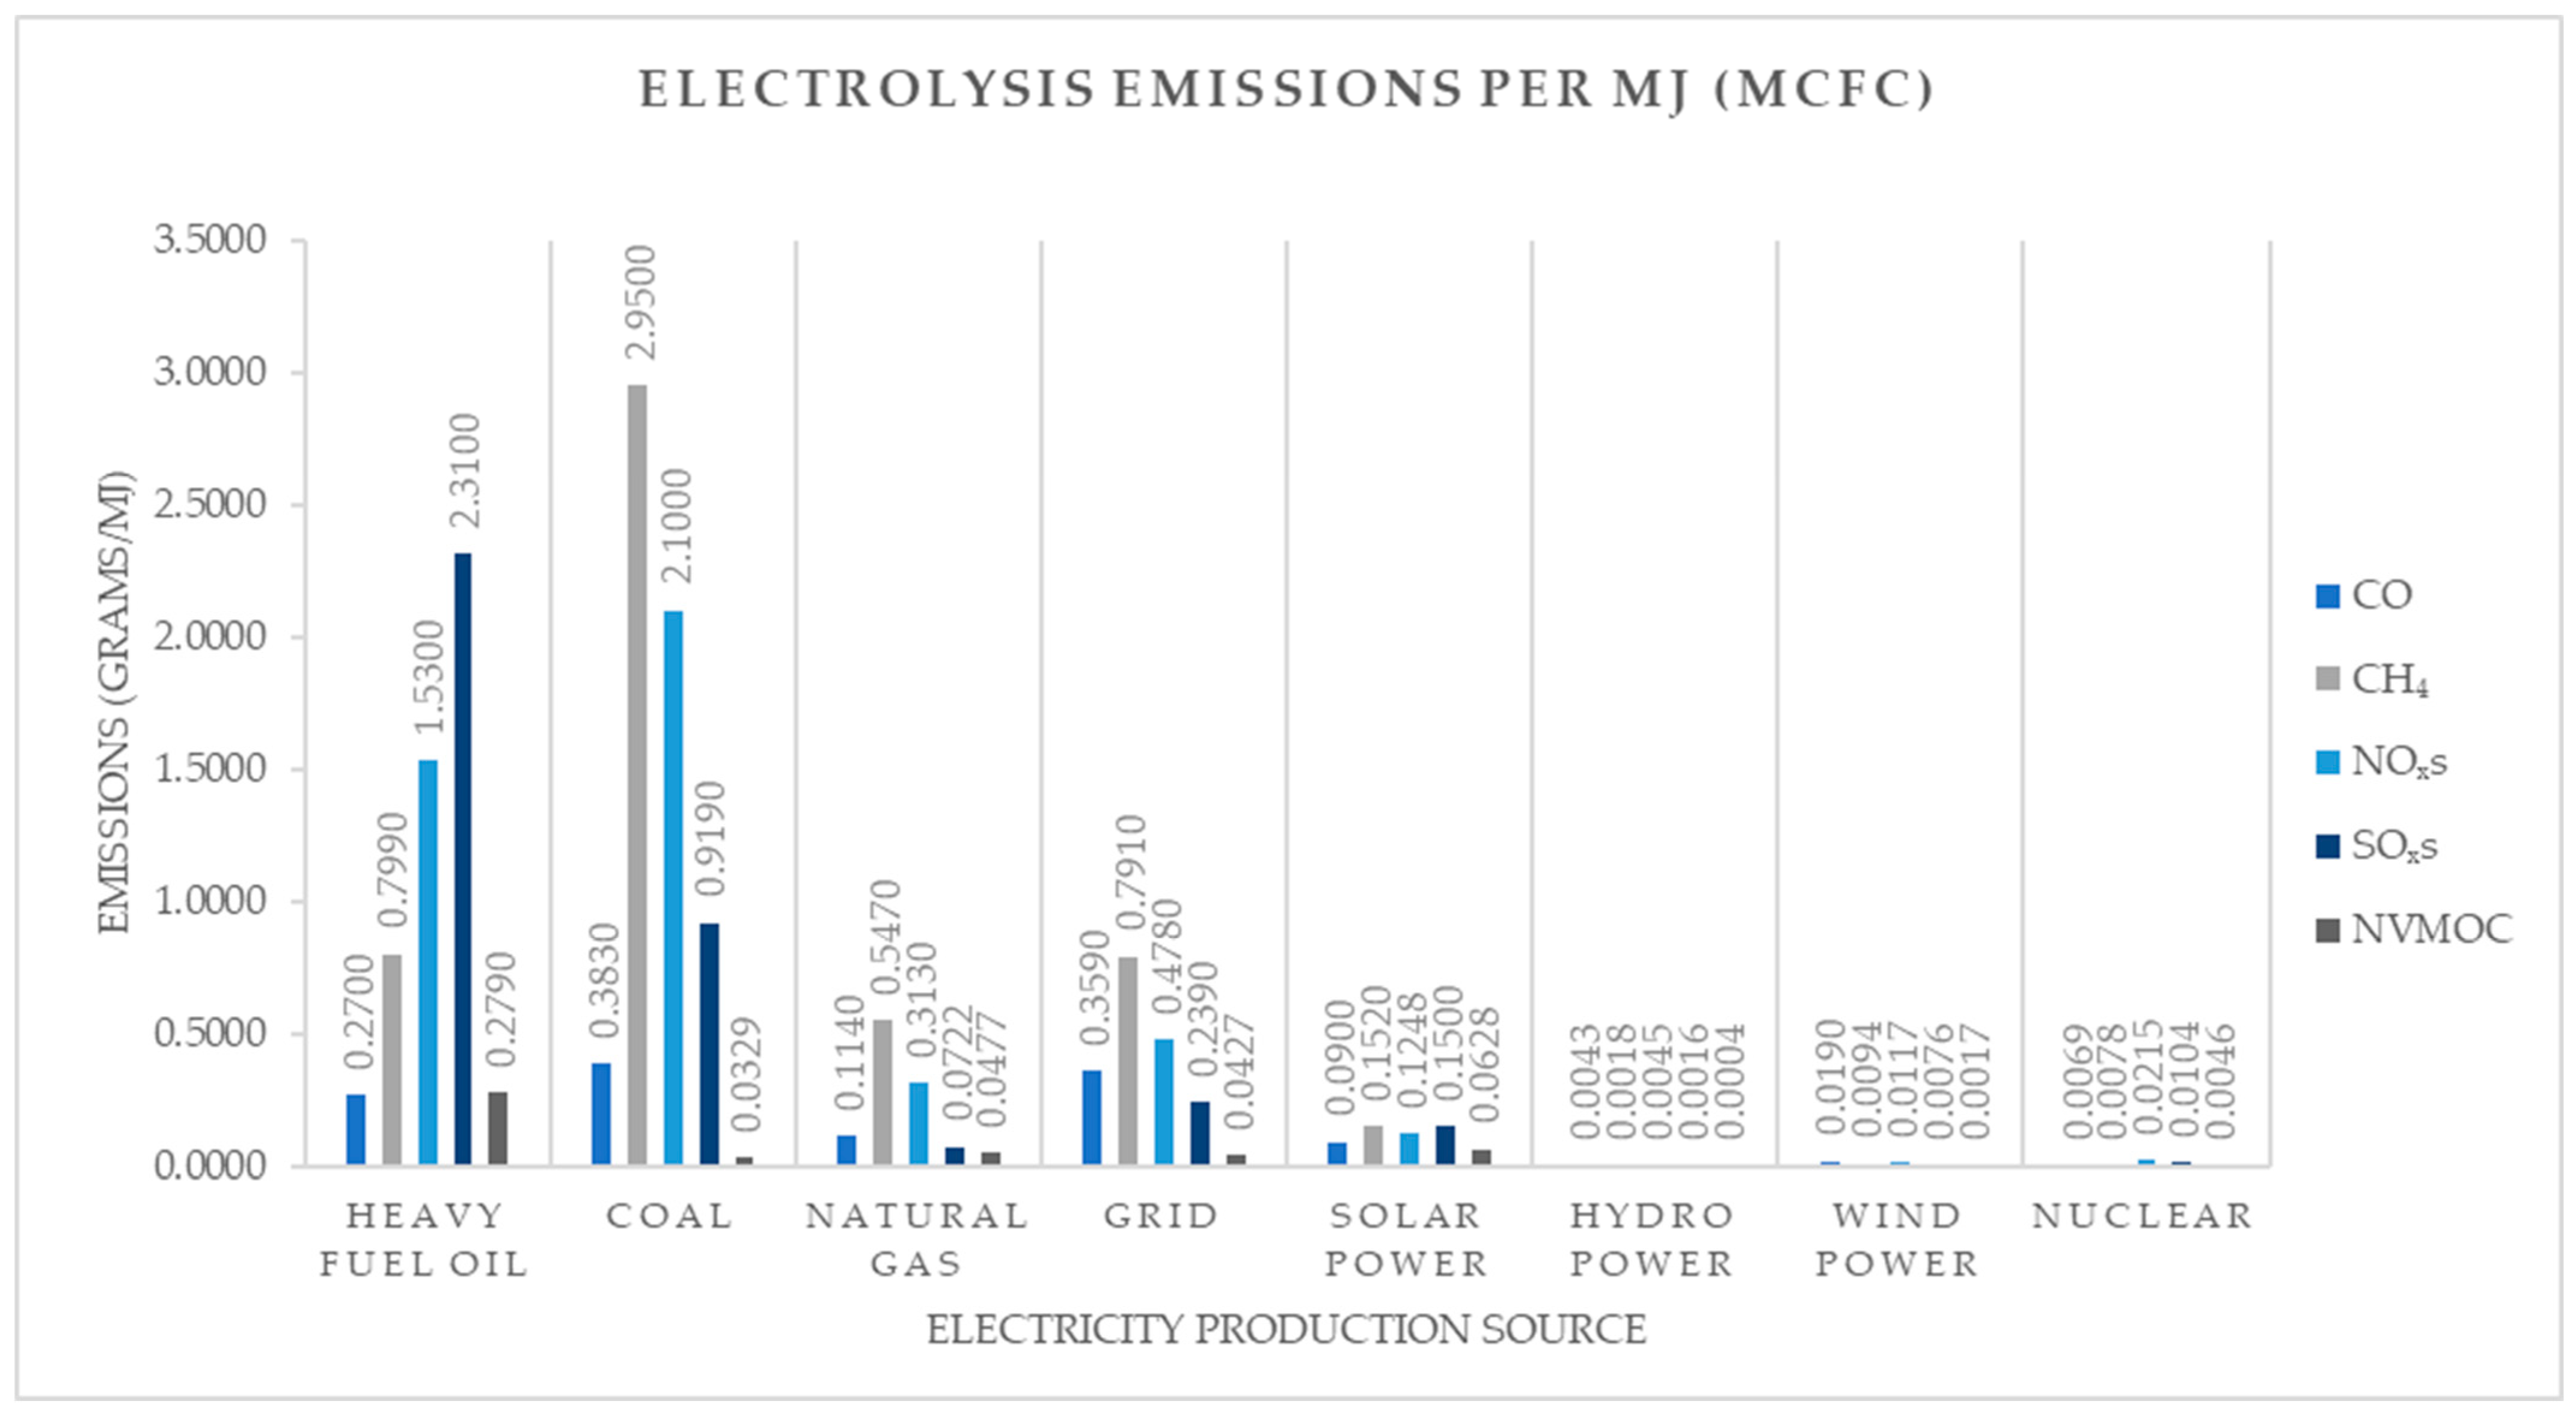
While GWP is a good measure of the overall environmental impact of systems and procedures, as it gives each released element a weighted equivalent to carbon dioxide, it is also useful however to look at the individual emissions. In this research the main emissions that are measured are carbon monoxide, carbon dioxide, methane, SOXs (combined sulphur oxides), NOXs (combined nitrogen oxides), and NMVOC. The most talked about emission is usually carbon dioxide and is the focus of a lot of research. Within this research in particular the view that natural gas is a transitional fuel can be observed better than in the general GWP measurement. During electrolysis it can be observed that the amount of carbon dioxide released by coal and HFO is over double that of natural gas, with coal powered electrolysis through a PEMFC system producing 766.48 g per MJ in comparison to the same system powered by natural gas producing 354.68 g per MJ.
One of the more unexpected results of the research was the increased level of emissions from solar energy in comparison to other low-carbon sources. Carbon dioxide emissions were 8.83 times higher than the next highest low-carbon source, and while the amount is still closer to hydro power than the natural gas above it, it still represents an issue with transitioning to solar energy. Solar is usually the most unpredictable and lowest producing of the major low-carbon sources measured. The SOXs emissions of solar power were over double that of natural gas at 0.1250 and 0.0603 g per MJ, respectively, from a PEMFC system with production from electrolysis. This isn’t solely due to natural gas having lower SOXs emissions as the rest of the low-carbon sources also had much lower emission levels, even the closest one, nuclear at 0.0087 g per MJ for an equivalent system, which is 14.37 times smaller than the solar power emission levels.
The high emissions levels of solar power could be attributed the life-cycle requirements to energy output ratio, in most situations a hydro station or wind turbine would require less infrastructure and investment in comparison to solar panels for the same life-cycle energy output.
Another interesting observation is the fairly low emissions of hydro power for all measured compounds, except for carbon dioxide. With the exception of carbon monoxide emissions from nuclear, which is just below twice, all other sources have at least twice the emissions per MJ of hydro power. This is dragged down by the higher levels of carbon dioxide in comparison to other low-carbon sources, but this is still lower than levels of solar power.
The increased level of methane released to atmosphere from natural gas can be observed in the electrolysis data, steam reforming data, and gas system data. In most cases an equivalent system will produce less methane, apart from coal and HFO powered electrolysis, which could be attributed to high levels of methane slip from the source.
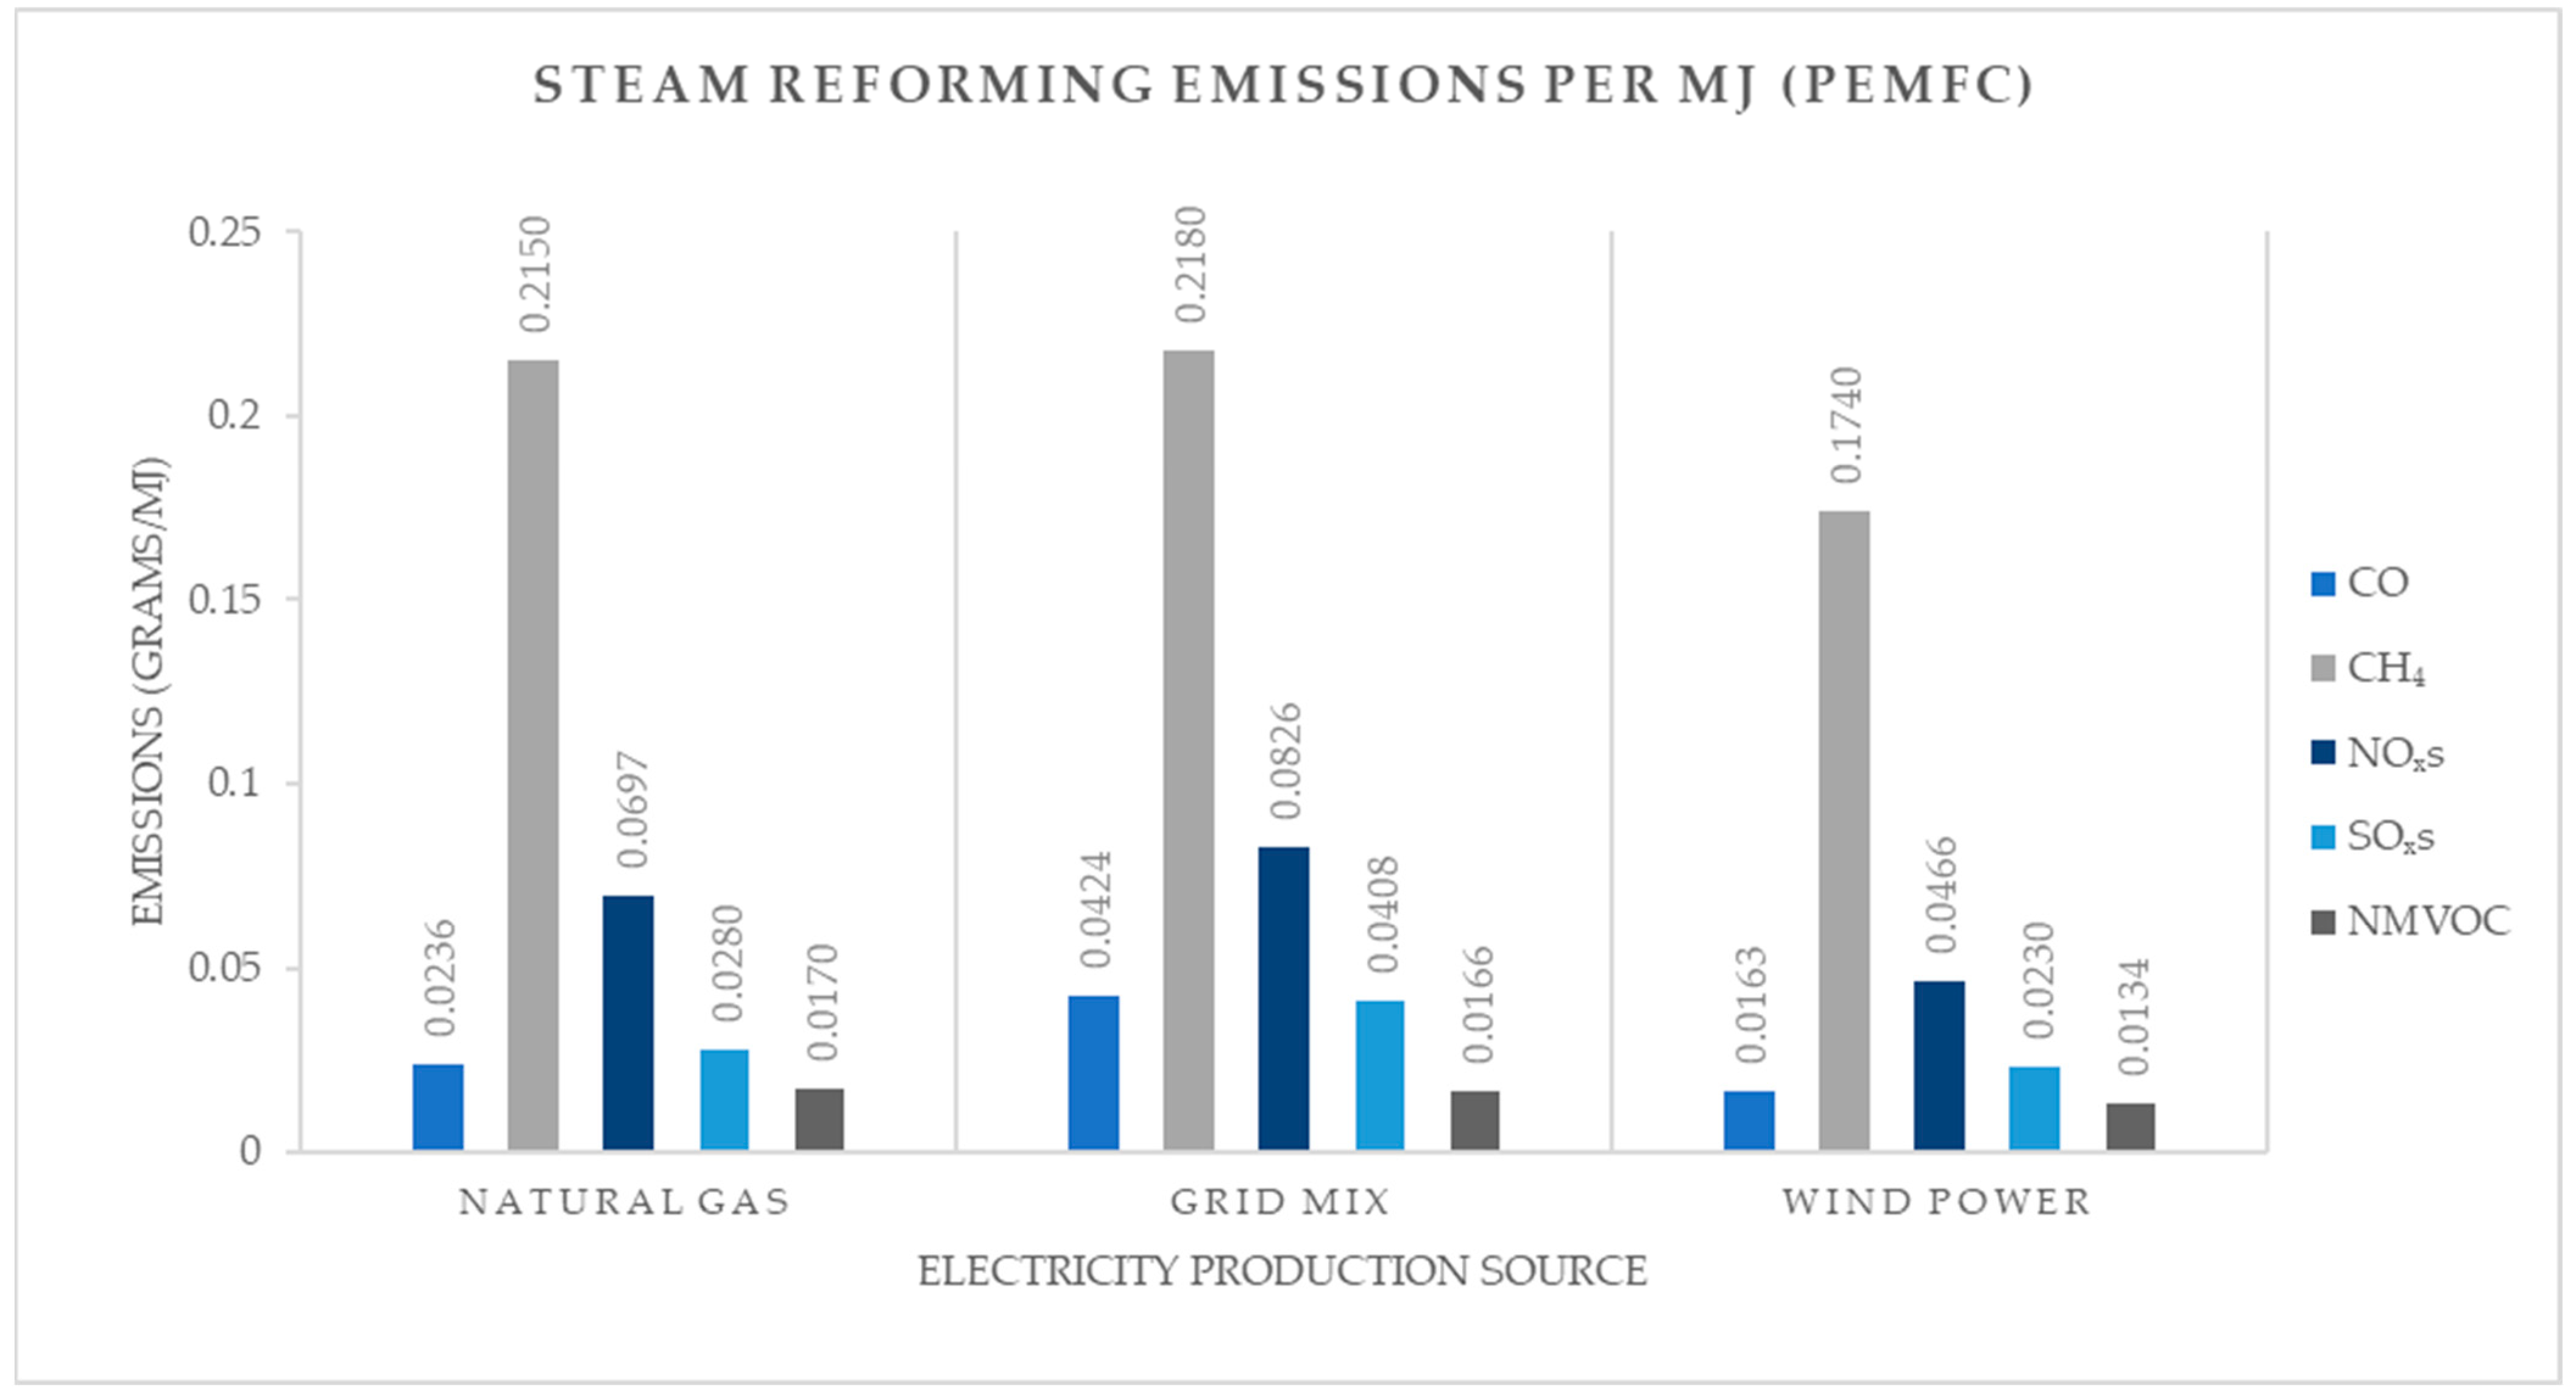
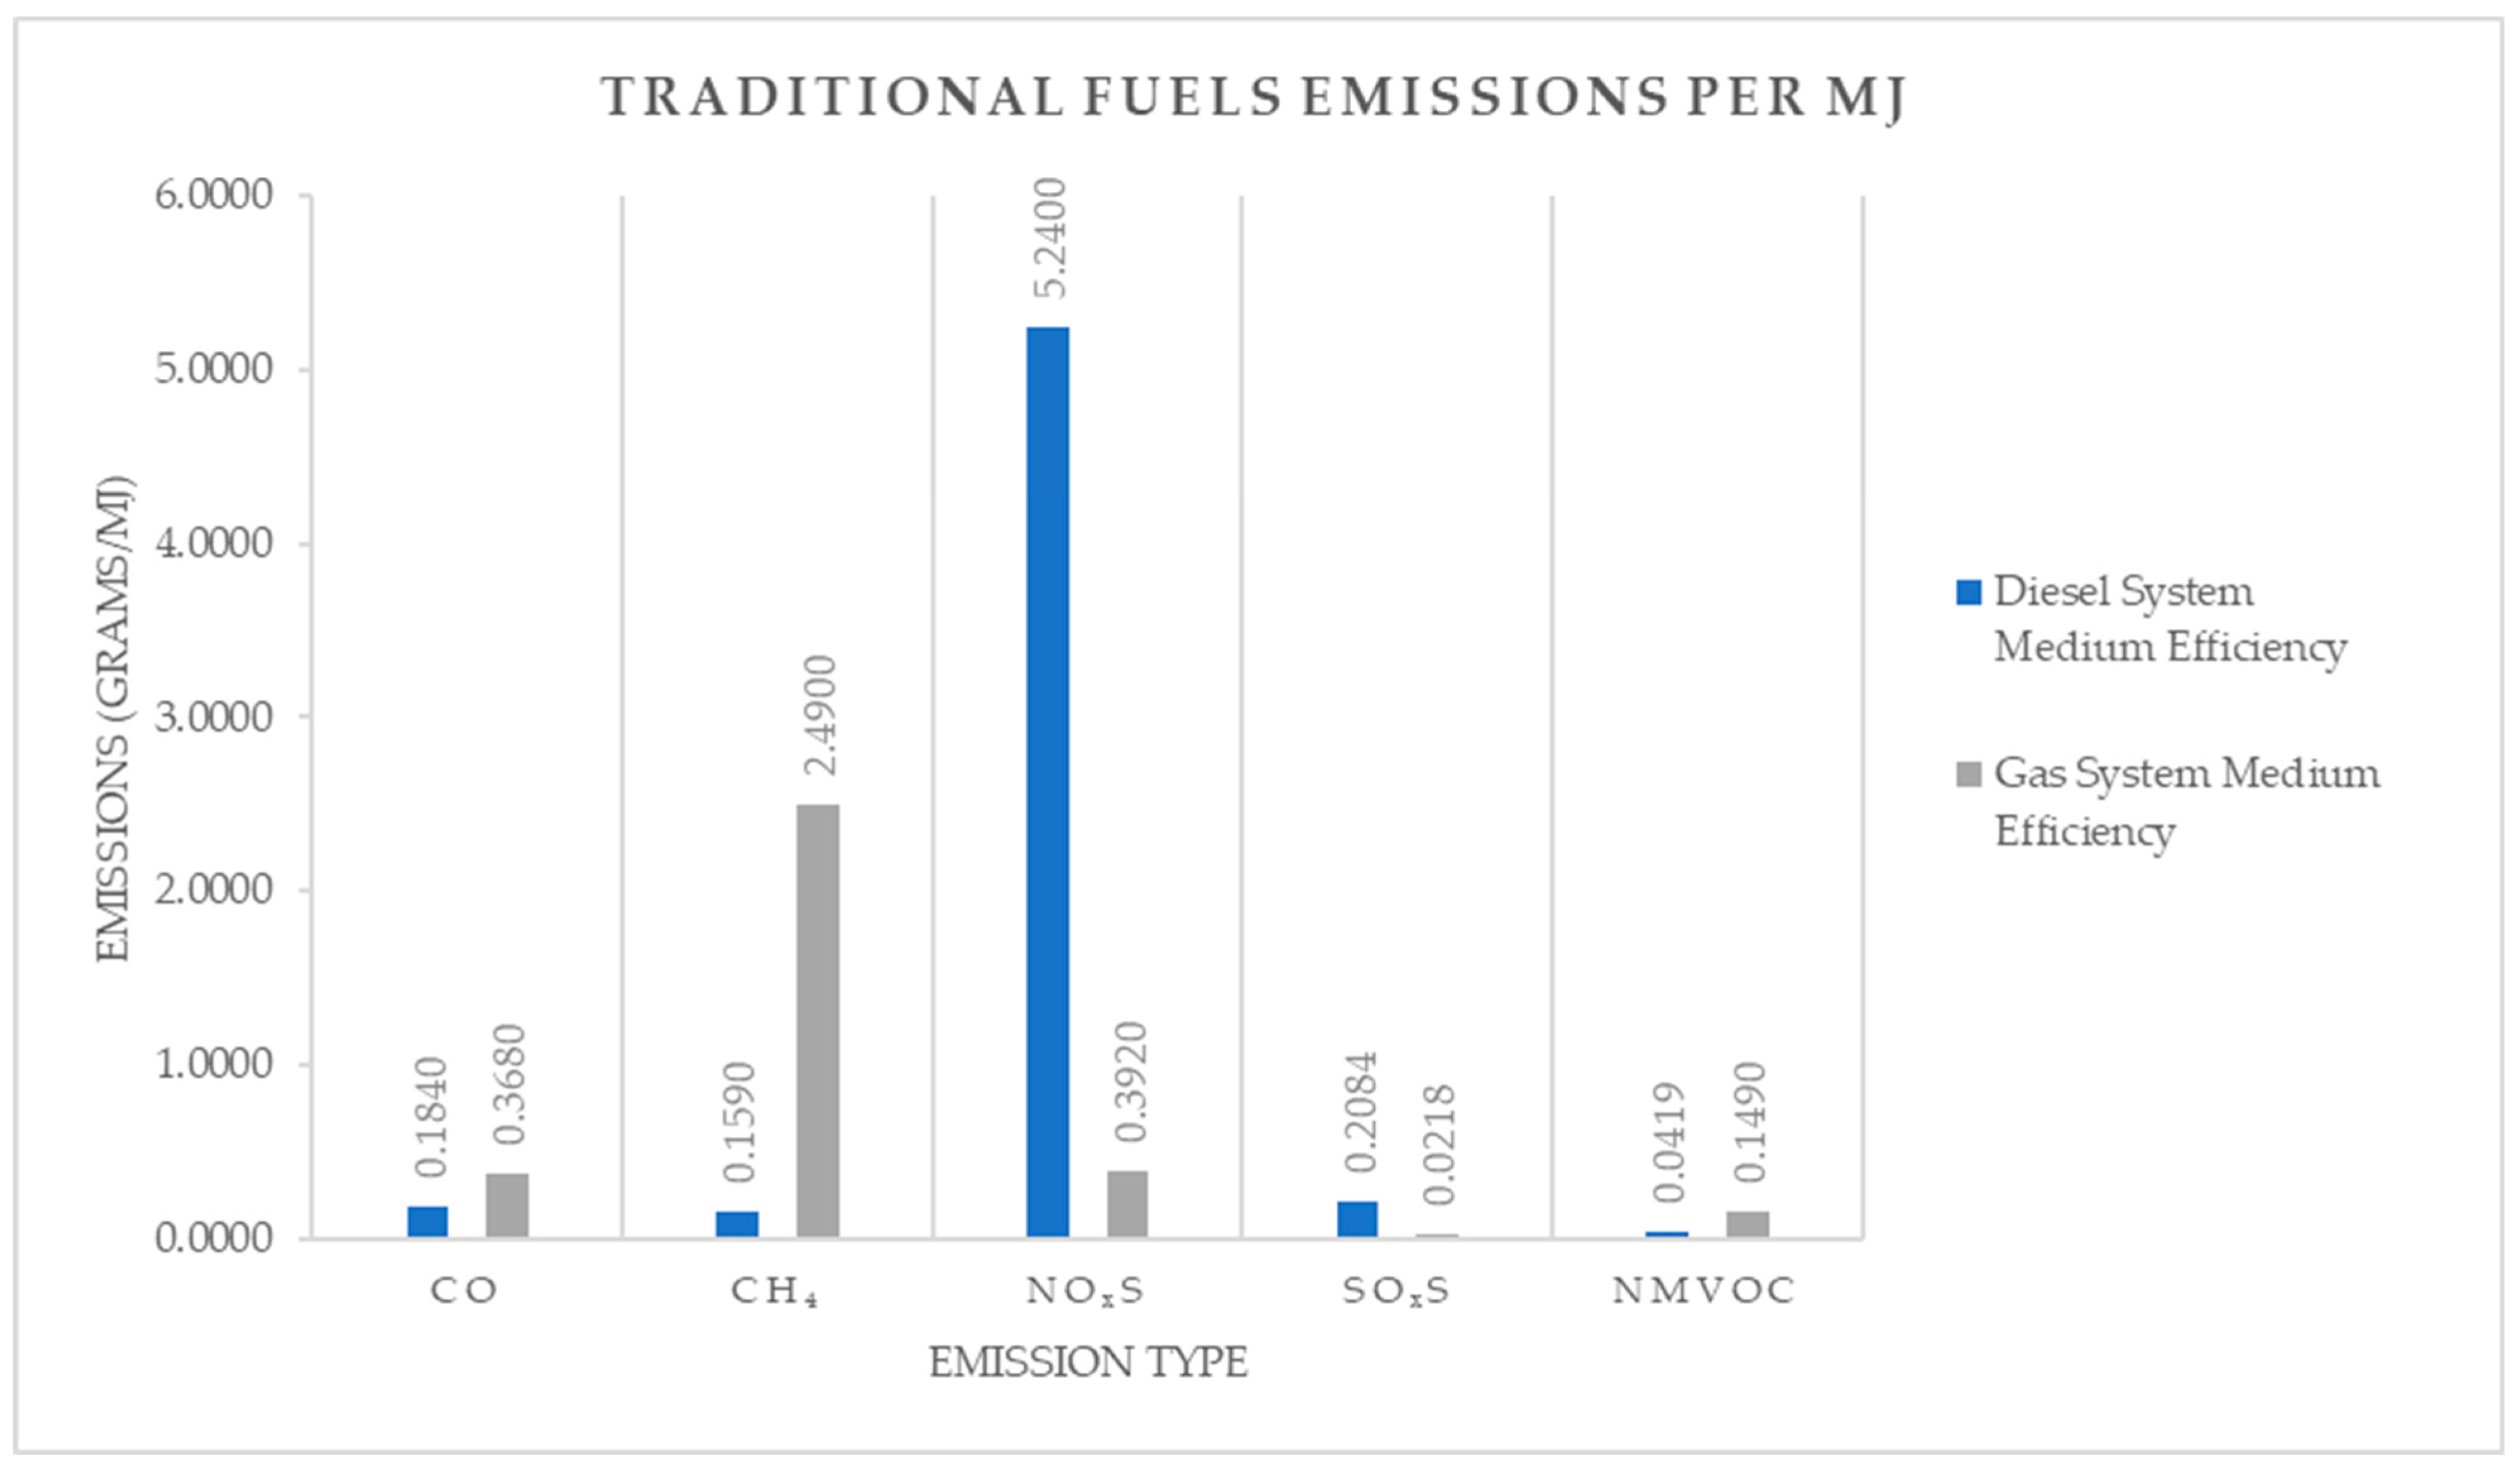
When looking further at the emissions of traditional fuels, there is an observable increase in NOXs emissions from a diesel system, with grams per MJ only really comparing to coal powered electrolysis. This represents a major challenge for marine shipping as a majority relies on diesel systems and thus there is a high level of NOXs emissions. This is partially why natural gas is seen as a transitional alternative, having much lower NOXs levels.
While natural gas may have lower NOXs and carbon dioxide levels, this isn’t the case for all emissions. Methane has already been discussed but another raised emission is NMVOC, an emission set that can be dangerous to humans, and so this increased rate is quite concerning.

5.2. Case Study Recommendations

One of the aims set out in the introduction of this research was to review the effectiveness of a hydrogen system for usage cases, in this case an inland ferry, which would operate for 8 h a day, and aim to reduce the accompanying carbon footprint.
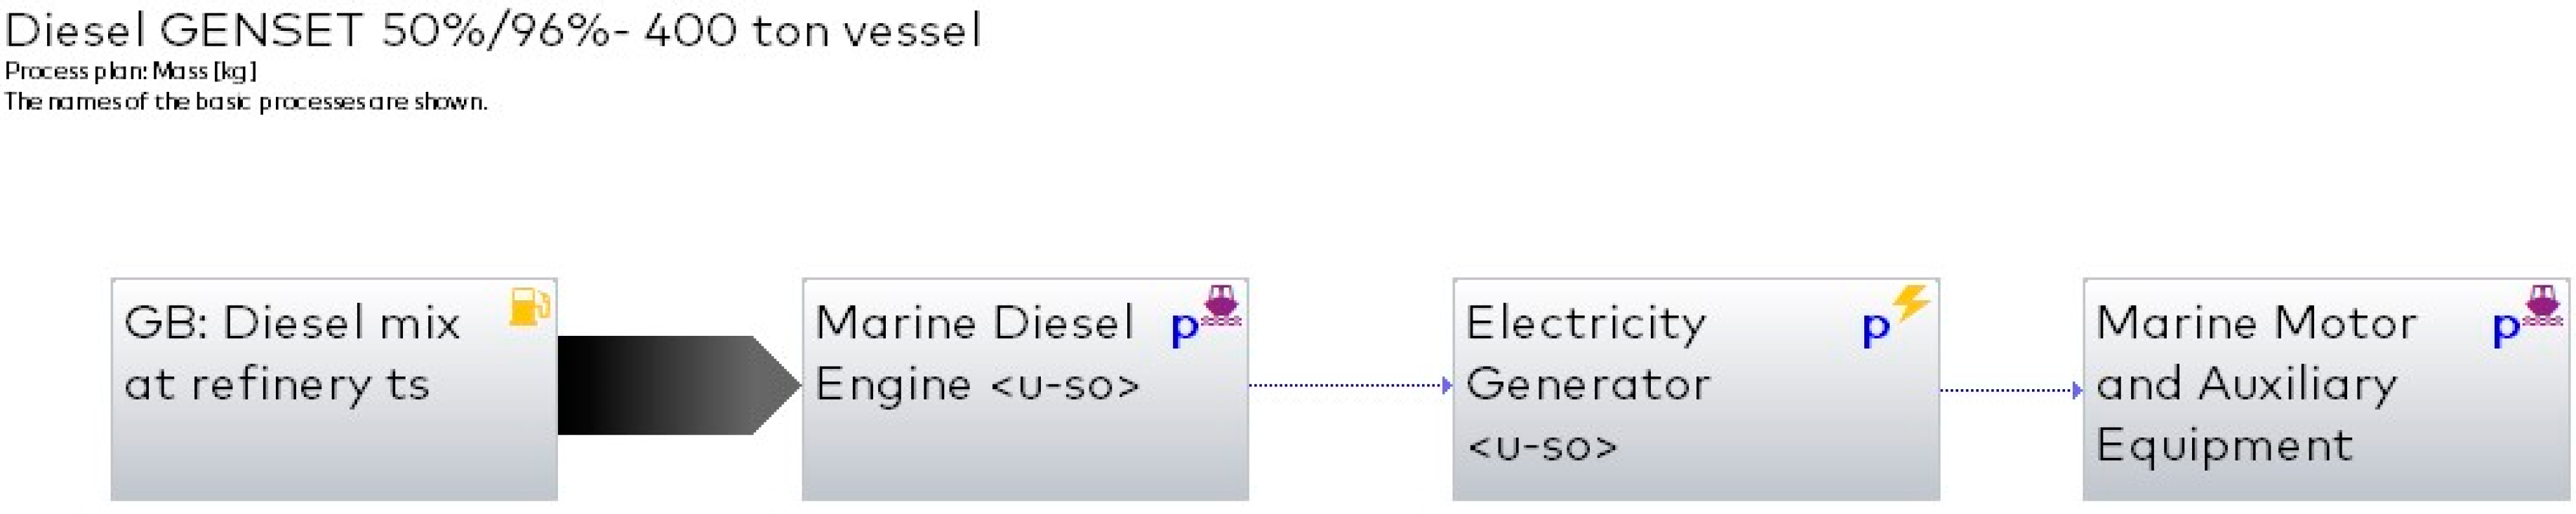
If we use a medium efficiency diesel system as a current benchmark which produces 453.6 kg of CO2 equivalent GWP an hour, which scales to 3628.8 kg a day, or 1324.5 tons a year. By operating a hydrogen PEMFC system powered through wind energy that figure could be reduced to 90.72 kg a day, or 33.11 tons a year, an annual amount equivalent to just over 9 days of operation of the diesel system. It would be theoretically possible for a ferry company to invest in a single small to medium sized turbine, and the electrolysis equipment needed, and subsequently pay itself off in the life-cycle of the vessel, against buying the diesel needed. However, this would be quite a big undertaking if the company was relatively small.
If the installation of this equipment is too much investment, then a hydrogen PEMFC could still be implemented if a source can be found that utilises carbon capture for steam reforming, with even grid power producing 109.94 kg of GWP an hour, which is around 321 tons a year, still a massive improvement over diesel levels that are 4 times greater, even if it isn’t as ambitious as the green hydrogen route. The only issue with this is that it sacrifices a good amount of emission reduction for a system and fuel that will be more expensive to operate than diesel.
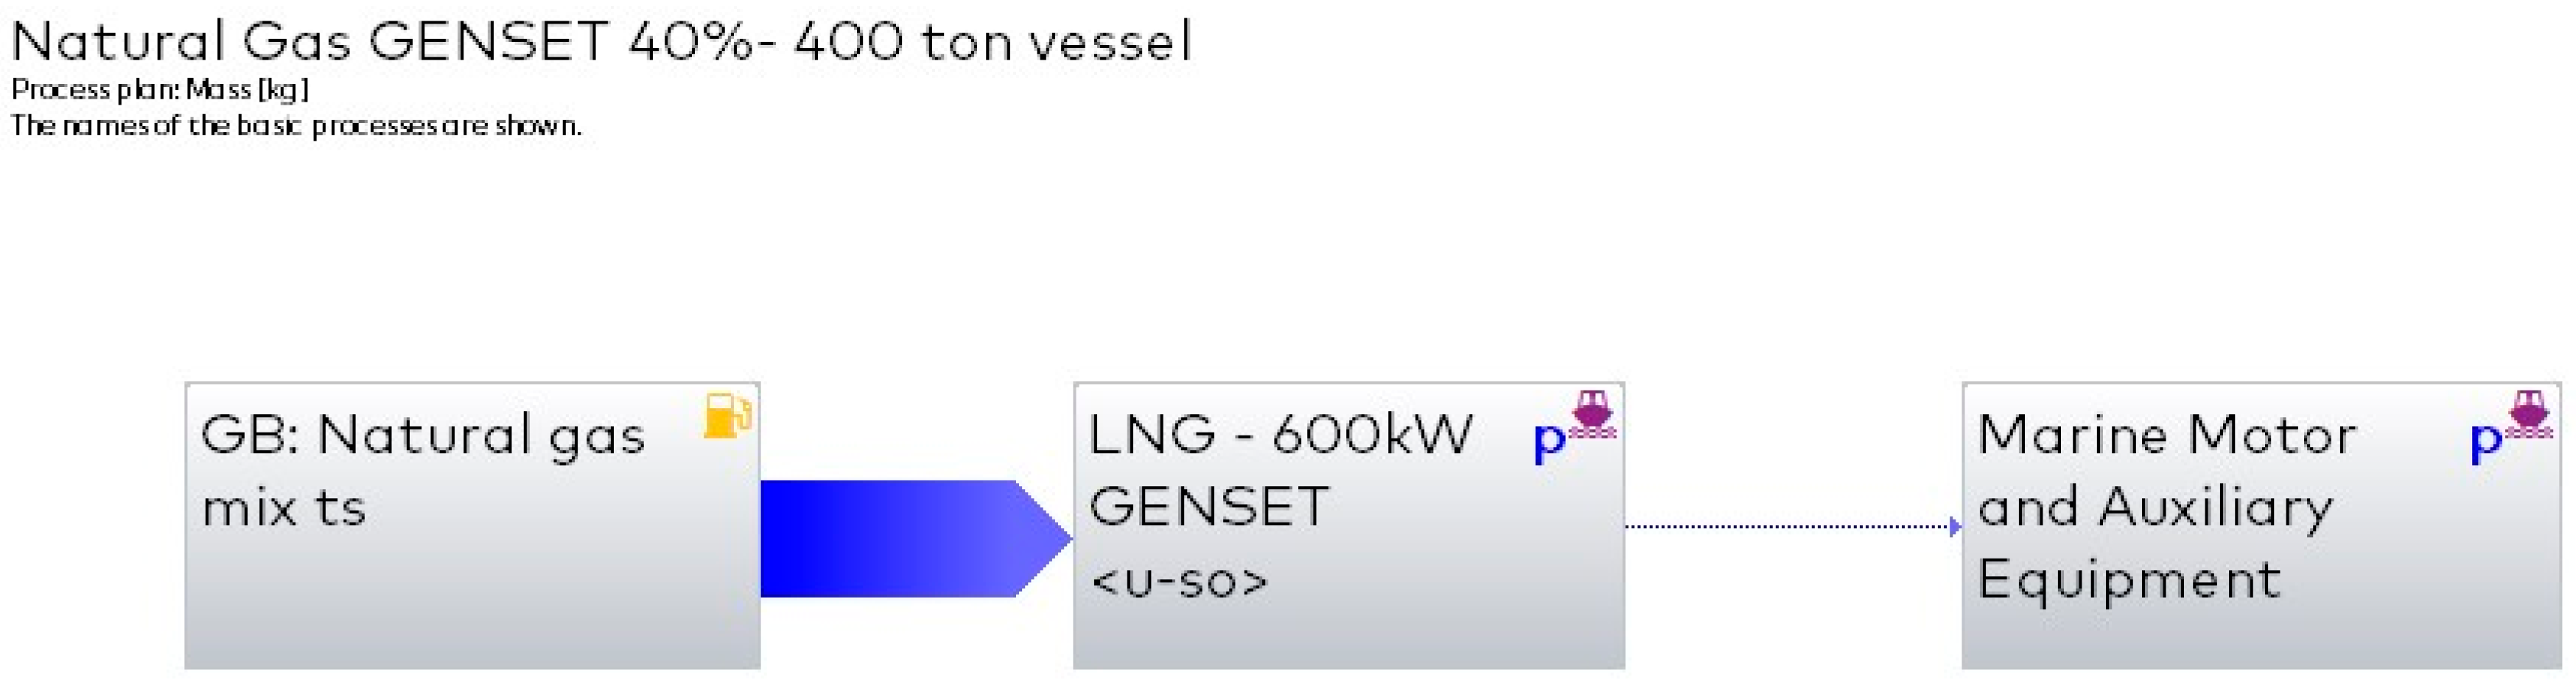
Finally, if the last solution is still not suitable then it can be considered that a gas system would be the next best option. Through a gas system the GWP of the system wouldn’t be massively reduced, but it would offer greatly reduced NOXs levels, and slightly reduced SOXs levels, at the expense of increased methane. As both SOXs and NOXs are dangerous and toxic to human and animal life, it can be considered that a ferry operating in a small stretch of water between two major cities that has switched from diesel to gas would benefit the health of the local residents, and this a step in the right direction, all be it a small one.

5.3. Research Analysis

This research was carried out with the aims and objectives in mind, and while there are things that would be changed in future work, the overall outcome meets the objectives laid out and is a useful piece of research into hydrogen as a potential fuel source.
Understanding the LCA software was the most challenging part of this research, alongside time management. Between these two factors, the development of models was delayed, and initial plans produced results that weren’t entirely accurate, and so all models were redeveloped and processed. On the flip side of this, once a functioning model was developed for a hydrogen production method, it was quite easy to alter results for a different energy source. This led to a slow initial set of data followed by a sudden growth in data size. If time management had been better utilised then this expansion could have happened earlier and allowed for greater writing time, or further time to investigate different production methods or fuel types.
Another comment on the LCA models produced is that they are likely quite simplistic, accounting for only major inputs and outputs, and leaving out a lot of small factors. This doesn’t make the data inaccurate though, the data produced provides a very clear view of the differences between systems and subsequent data from extended plans would necessarily change the overall differences but would just increase the precision of results.
Another change that could increase the accuracy of results is using more precise starting data, for example the data used for diesel and gas systems comes from the IMO and is applicable to all marine transport, but this could be too general, especially when it is factored that this research aimed to look at the effects of a small inland ferry. Data that was produced solely for vessels of this size and usage would likely lead to increased accuracy in the final results, but this still wouldn’t change the overall narrative of the current results.
One final change that could increase the usefulness of the data produced is in the emissions measured, as GaBi measures all manner of output emissions, the basic elements listed in the results could be considered a small part of the effect, even if it is the bulk of greenhouse gas emissions. Further data from GaBi could demonstrate a much bigger impact, whether that be the resources used to produce the machines that produce the energy or fuels, or into the local environmental change to land and water. This data could create a more complex picture that leads to much better understanding of the effect of hydrogen as a fuel type, something that most research hasn’t delved deep into as of yet.
Despite the changes mentioned, the effectiveness of this research is still evident, with the data clearly showing how electrolysis of hydrogen could be used to create a green fuel cycle. It also showed how electrolysis could be dangerous though, especially in mixed grid systems that utilise coal, natural gas, and other carbon producing fuels, and even solar energy showed higher than expected emissions. Nonetheless this data provides a clear pathway to developing green energy, and how it must be done to achieve international climate goals.

6. Conclusions

This research aimed to carry out an LCA on hydrogen as a potential fuel for marine transport. The need for potential fuels was outlined within the literature section, and with hydrogen being one of the best contenders, it was investigated how it operated and how it was produced, which demonstrated the possibility of utilising the fuel source and why it is worth researching.
The next objective was mapping the hydrogen well-to-tank phase and use phase. This was a slow process as detailed in the research analysis section, but the result was a detailed accurate system of both production and utilisation. After this the mapping of traditional fuels was done which set a benchmark for current standards and gave a useful index for comparisons. While the traditional fuel systems could be seen as slightly simplistic, they still offer a pretty good picture of the environmental impact of the fuel systems.
Finally, the results were analysed with, some expected, and some interesting notations. The data showed that the general impact of diesel and gas were the same at 210 and 204 g of CO2 equivalent per MJ of operation at medium efficiency respectively, while the individual emissions data gave a much deeper insight into the differences between the fuels. The method of hydrogen production and how it was powered gave an interesting insight into the potential of the fuel source, with the fuel almost always needing some sort of stipulation to make it greener than traditional fuels, such as steam reformed hydrogen reducing MCFC GWP emissions from 224 g per MJ to 61 g per MJ when carbon capture was utilised, or electrolysis powered from grid energy switched to wind power making a reduction in GWP emissions from 284 g per MJ to 5.25 g per MJ through an PEMFC system. Whether that be low-carbon electricity powering the system, carbon capture utilised, or a combination of the two, some system needed to be implemented to achieve a desirable result. The overwhelming result of grid powered hydrogen could be considered partially underwhelming, with both cases performing around the same, or worse than traditional fuels at 284 g per MJ for electrolysis produced hydrogen through a PEMFC and 187 g per MJ from grid powered steam reforming through a PEMFC, this is compared to 210 and 204 g of CO2 equivalent per MJ of operation at medium efficiency of a diesel genset system and a gas genset system respectively.
With progress in green energy infrastructure, even if it be slow, it could lead to this eventually not being the case, and it is feasible that if research continued at the pace it is, alongside that change, green hydrogen could be ready to revolutionise the world within the next few decades, but this research demonstrates that this isn’t the time for the transition just yet, and the wider issue of green energy production should be addressed before a switch to hydrogen is put into motion.

Author Contributions

Conceptualization, M.K. and E.B.-D.; methodology, M.K.; software, M.K.; data curation, M.K., writing—original draft preparation, M.K.; writing—review and editing, E.B.-D., O.P. and M.A., supervision, E.B.-D. All authors have read and agreed to the published version of the manuscript.

Funding

This research received no external funding.

Institutional Review Board Statement

Not applicable.

Informed Consent Statement

Not applicable.

Data Availability Statement

The data that support the findings of this study are available from the corresponding author upon reasonable request.

Conflicts of Interest

The authors declare no conflict of interest.

Appendix A

Table A1. Emissions, kg per MJ of electrolysis with different energy sources and a MCFC system.
Electricity SourceEmissions per MJ for MCFC System (g/MJ)
COCO2CH4NOXsSOXsNMVOC
Heavy Fuel Oil0.27001062.340.79901.53002.31000.2790
Coal0.3830916.302.95002.10000.91900.0329
Natural Gas0.1140423.810.54700.31300.07220.0477
Grid (UK)0.3590455.110.79100.47800.23900.0427
Solar0.090071.550.15200.12480.15000.0628
Hydro0.00438.110.00180.00450.00160.0004
Wind0.01906.520.00940.01170.00760.0017
Nuclear0.00695.390.00780.02150.01040.0046
Figure A1. Emissions from electrolysis with different energy sources, and an MCFC system in grams per MJ.
Jmse 11 01611 g0a1

Appendix B

Table A2. Emissions, grams per MJ of steam reforming with different energy sources and a MCFC system.
Electricity SourceEmissions per MJ for MCFC System (g/MJ)
COCO2CH4NOXsSOXsNMVOC
With CCNatural Gas0.028262.960.25800.08340.03340.0203
Grid (UK)0.050665.810.26100.09870.04870.0198
Wind0.019524.750.20800.05580.02750.0161
Without CCNatural Gas0.0282225.360.25800.08340.03340.0203
Grid (UK)0.0506228.710.26100.09870.04870.0198
Wind0.0195187.350.20800.05580.02750.0161
Figure A2. Emissions, grams per MJ used through steam reforming with different energy sources and an MCFC system.
Jmse 11 01611 g0a2

References

  1. Ritchie, H.; Roser, M.; Rosado, P. CO2 and Greenhouse Gas Emissions. Our World in Data 2020. Available online: https://ourworldindata.org/co2-emissions?utm_source=tri-city%20news&utm_campaign=tricity%20news%3A%20outbound&utm_medium=referral#citation (accessed on 5 March 2023).
  2. Emissions-Free Sailing is Full Steam Ahead for Ocean-Going Shipping. Available online: https://ec.europa.eu/research-and-innovation/en/horizon-magazine/emissions-free-sailing-full-steam-ahead-ocean-going-shipping#:~:text=Shipping%2C%20while%20essential%20for%20trade,worldwide%20greenhouse%20gases%20(GHG) (accessed on 5 March 2023).
  3. Alnes, O.; Eriksen, S.; Vartdal, B.J. Battery-Powered Ships: A Class Society Perspective. IEEE Electrif. Mag. 2017, 5, 10–21. [Google Scholar] [CrossRef]
  4. Balcombe, P.; Staffell, I.; Kerdan, I.G.; Speirs, J.F.; Brandon, N.P.; Hawkes, A.D. How can LNG-fuelled ships meet decarbonisation targets? An environmental and economic analysis. Energy 2021, 227, 120462. [Google Scholar] [CrossRef]
  5. Panchenko, V.A.; Daus, Y.V.; Kovalev, A.A.; Yudaev, I.V.; Litti, Y.V. Prospects for the production of green hydrogen: Review of countries with high potential. Int. J. Hydrogen Energy 2023, 48, 4551–4571. [Google Scholar] [CrossRef]
  6. Park, C.; Koo, M.; Woo, J.; Hong, B.I.; Shin, J. Economic valuation of green hydrogen charging compared to gray hydrogen charging: The case of South Korea. Int. J. Hydrogen Energy 2022, 47, 14393–14403. [Google Scholar] [CrossRef]
  7. From Grey and Brown to Green and Blue: Low-Carbon Hydrogen in Refining. Available online: https://www.woodmac.com/news/opinion/from-grey-and-brown-to-green-and-blue-low-carbon-hydrogen-in-refining/#:~:text=Brown%20hydrogen%20is%20two%20times,carbon%20hydrogen%20use%20as%20feedstock (accessed on 9 March 2023).
  8. Shakeri, N.; Zadeh, M.; Bremnes Nielson, J. Hydrogen Fuel Cells for Ship Electric Propulsion: Moving Toward Greener Ships. IEEE Electrif. Mag. 2020, 8, 27–43. [Google Scholar] [CrossRef]
  9. Hetherington, A.C.; Borrion, A.L.; Griffiths, O.G.; McManus, M.C. Use of LCA as a development tool within early research: Challenges and issues across different sectors. Int. J. Life Cycle Assess. 2014, 19, 130–143. [Google Scholar] [CrossRef]
  10. Sphera. GaBi, version 9.2.1.68; Sphera Solutions, Inc.: Chicago, IL, USA, 2022. [Google Scholar]
  11. Fernandez-Rios, A.; Santos, G.; Pinedo, J.; Santos, E.; Ruiz-Salmon, I.; Laso, J.; Lyne, A.; Ortiz, A.; Ortiz, I.; Irabien, A.; et al. Environmental sustainability of alternative marine propulsion technologies powered by hydrogen—A life cycle assessment approach. Sci. Total Environ. 2022, 820, 153189. [Google Scholar] [CrossRef]
  12. Chen, Z.S.; Lam, J.S.L. Life cycle assessment of diesel and hydrogen power systems in tugboats. Transp. Res. Part D Transp. Environ. 2022, 103, 103192. [Google Scholar] [CrossRef]
  13. Lee, G.N.; Kim, J.M.; Jung, K.H.; Park, H.; Jang, H.S.; Lee, C.S.; Lee, J.W. Environmental Life-Cycle Assessment of Eco-Friendly Alternative Ship Fuels (MGO, LNG, and Hydrogen) for 170 GT Nearshore Ferry. J. Mar. Sci. Eng. 2022, 10, 755. [Google Scholar] [CrossRef]
  14. Bicer, Y.; Dincer, I. Clean fuel options with hydrogen for sea transportation: A life cycle approach. Int. J. Hydrogen Energy 2018, 43, 1179–1193. [Google Scholar] [CrossRef]
  15. Jang, H.; Jeong, B.; Zhou, P.; Ha, S.; Park, C.; Nam, D.; Rashedi, A. Parametric trend life cycle assessment for hydrogen fuel cell towards cleaner shipping. J. Clean. Prod. 2022, 372, 133777. [Google Scholar] [CrossRef]
  16. De Lorenzo, G.; Piraino, F.; Longo, F.; Tine, G.; Boscaino, V.; Panzavecchia, N.; Caccia, M.; Fragiacomo, P. Modelling and Performance Analysis of an Autonomous Marine Vehicle Powered by a Fuel Cell Hybrid Powertrain. Energies 2022, 15, 6926. [Google Scholar] [CrossRef]
  17. Panić, I.; Cuculić, A.; Ćelić, J. Color-coded hydrogen: Production and storage in maritime sector. J. Mar. Sci. Eng. 2022, 10, 1995. [Google Scholar] [CrossRef]
  18. Dufour, J.; Serrano, D.P.; Gálvez, J.L.; González, A.; Soria, E.; Fierro, J.L.G. Life cycle assessment of alternatives for hydrogen production from renewable and fossil sources. Int. J. Hydrogen Energy 2012, 37, 1173–1183. [Google Scholar] [CrossRef]
  19. Office of Energy, Efficiency, & Renwable Energy. Hydrogen Production: Natural Gas Reforming. Available online: https://www.energy.gov/eere/fuelcells/hydrogen-production-natural-gas-reforming (accessed on 8 March 2023).
  20. Alhamdani, Y.A.; Hassim, M.H.; Ng, R.T.; Hurme, M. The estimation of fugitive gas emissions from hydrogen production by natural gas steam reforming. J. Hydrog. Energy 2017, 42, 9342–9351. [Google Scholar] [CrossRef]
  21. Nikolaidis, P.; Poullikkas, A. A comparative overview of hydrogen production processes. Renew. Sustain. Energy Rev. 2017, 67, 597–611. [Google Scholar] [CrossRef]
  22. Wilberforce, T.; Olabi, A.G.; Sayed, E.T.; Elsaid, K.; Abdelkareem, M.A. Progress in carbon capture technologies. Sci. Total Environ. 2021, 761, 143203. [Google Scholar] [CrossRef]
  23. Al-Mamoori, A.; Krishnamurthy, A.; Rownaghi, A.A.; Rezaei, F. Carbon capture and utilization update. Energy Technol. 2017, 5, 834–849. [Google Scholar] [CrossRef]
  24. Oliveira, A.M.; Beswick, R.R.; Yan, Y. A green hydrogen economy for a renewable energy society. Curr. Opin. Chem. Eng. 2021, 33, 100701. [Google Scholar] [CrossRef]
  25. Department for Business, Energy & Industrial Strategy. UK Energy in Brief 2022. Available online: https://assets.publishing.service.gov.uk/government/uploads/system/uploads/attachment_data/file/1130451/UK_Energy_in_Brief_2022.pdf (accessed on 8 March 2023).
  26. Balzani, V.; Armaroli, N. Energy for a Sustainable World: From the Oil Age to A Sun-Powered Future, 1st ed.; Wiley: Weinheim, Germany, 2010. [Google Scholar]
  27. Number of Operable Nuclear Power Reactors Worldwide as of May 2022, by Country. Available online: https://www.statista.com/statistics/267158/number-of-nuclear-reactors-in-operation-by-country/ (accessed on 8 March 2023).
  28. Mekhilef, S.; Saidur, R.; Safari, A. Comparative study of different fuel cell technologies. Renew. Sustain. Energy Rev. 2012, 16, 981–989. [Google Scholar] [CrossRef]
  29. Dicks, A.L. Molten carbonate fuel cells. Curr. Opin. Solid State Mater. Sci. 2004, 8, 379–383. [Google Scholar] [CrossRef]
  30. Bischoff, M. Molten carbonate fuel cells: A high temperature fuel cell on the edge to commercialization. J. Power Sources 2006, 160, 842–845. [Google Scholar] [CrossRef]
  31. Integrating Molten Carbonate Fuel Cell Technology Into a Cement Plant Offers Both Low-Emission Cement and Power Production, CESAR Study Shows. Available online: https://www.cesarnet.ca/blog/integrating-molten-carbonate-fuel-cell-technology-cement-plant-offers-both-low-emission-cement (accessed on 9 March 2023).
  32. Kulkarni, A.; Giddey, S. Materials issues and recent developments in molten carbonate fuel cells. J. Solid State Electrochem. 2012, 16, 3123–3146. [Google Scholar] [CrossRef]
  33. Kandlikar, S.G.; Lu, Z. Thermal management issues in a PEMFC stack—A brief review of current status. Appl. Therm. Eng. 2009, 29, 1276–1280. [Google Scholar] [CrossRef]
  34. Sharma, S.; Pollet, B.G. Support materials for PEMFC and DMFC electrocatalysts—A review. J. Power Sources 2012, 208, 96–119. [Google Scholar] [CrossRef]
  35. Ge, J.; Higier, A.; Liu, H. Effect of gas diffusion layer compression on PEM fuel cell performance. J. Power Sources 2006, 159, 922–927. [Google Scholar] [CrossRef]
  36. Costamagna, P.; Srinivasan, S. Quantum jumps in the PEMFC science and technology from the 1960s to the year 2000: Part II. Engineering, technology development and application aspects. J. Power Sources 2001, 102, 253–269. [Google Scholar] [CrossRef]
  37. De Lorenzo, G.; Agostino, R.G.; Fragiacomo, P. Dynamic electric simulation model of a Proton Exchange Membrane electrolyzer system for hydrogen production. Energies 2022, 15, 6437. [Google Scholar] [CrossRef]
  38. Gadducci, E.; Lamberti, T.; Rivarolo, M.; Magistri, L. Experimental campaign and assessment of a complete 240-kW Proton Exchange Membrane Fuel Cell power system for maritime applications. Int. J. Hydrogen Energy 2022, 47, 22545–22558. [Google Scholar] [CrossRef]
  39. Pham, T.H. Towards Alkali-Stable Polymers and Hydroxide Exchange Membranes Functionalized with Alicyclic Quaternary Ammonium Cations. Ph.D. Thesis, Lund University, Lund, Sweden, 2019. [Google Scholar]
  40. Silva, D.A.L.; Mendes, N.C.; Varanda, L.D.; Ometto, A.R.; Lahr, F.A.R. Life cycle assessment of urea formaldehyde resin: Comparison by CML (2001), EDIP (1997) and USEtox (2008) methods for toxicological impact categories. In Proceedings of the 20th CIRP International Conference on Life Cycle Engineering, Singapore, 17–19 April 2013. [Google Scholar]
  41. Life Cycle Assessment (LCA): CML Global Warming Potential (GWP) Characterization Factors. Available online: https://deiso.co.jp/life-cycle-assessment-lca-cml-global-warming-potential-characterization-factors/ (accessed on 15 March 2023).
  42. Office of Energy, Efficiency, & Renwable Energy-Hydrogen and Fuel Cells Program Record. Available online: https://www.hydrogen.energy.gov/pdfs/9013_energy_requirements_for_hydrogen_gas_compression.pdf (accessed on 9 March 2023).
  43. Chi, H.; Pedrielli, G.; Ng, S.H.; Kister, T.; Bressan, S. A framework for real-time monitoring of energy efficiency of marine vessels. Energy 2018, 145, 246–260. [Google Scholar] [CrossRef]
  44. IMO—Third IMO Greenhouse Gas Study 2014. Available online: https://wwwcdn.imo.org/localresources/en/OurWork/Environment/Documents/Third%20Greenhouse%20Gas%20Study/GHG3%20Executive%20Summary%20and%20Report.pdf (accessed on 15 February 2023).
  45. U.S. Energy Information Administration. Country Analysis Executive Summary: China. 2022. Available online: https://www.eia.gov/international/content/analysis/countries_long/China/china.pdf (accessed on 9 June 2023).
Figure 1. Hydrogen electrolyser.
Jmse 11 01611 g001
Figure 2. Molten carbonate fuel cell.
Jmse 11 01611 g002
Figure 3. Proton exchange membrane fuel cell.
Jmse 11 01611 g003
Figure 4. Marine diesel engine process [10].
Jmse 11 01611 g004
Figure 5. Hydrogen electrolysis flow plan [10].
Jmse 11 01611 g005
Figure 6. Steam reforming process of hydrogen model [10].
Jmse 11 01611 g006
Figure 7. Diesel GENSET model [10].
Jmse 11 01611 g007
Figure 8. Natural gas GENSET model plan [10].
Jmse 11 01611 g008
Figure 9. GWP (100 years), kg per MJ used through electrolysis with different energy sources.
Jmse 11 01611 g009
Figure 10. Emissions from electrolysis with different energy sources, and PEMFC system in grams per MJ.
Jmse 11 01611 g010
Figure 11. Carbon dioxide emissions from electrolysis with different energy sources, for PEMFC and MCFC system in grams per MJ.
Jmse 11 01611 g011
Figure 12. GWP (100 years), kg per MJ used through steam reforming with different energy sources.
Jmse 11 01611 g012
Figure 13. Emissions, grams per MJ used through steam reforming with different energy sources and a PEMFC system.
Jmse 11 01611 g013
Figure 14. Carbon dioxide emissions from steam reforming with different energy sources, for PEMFC and MCFC systems, in grams per MJ.
Jmse 11 01611 g014
Figure 15. GWP (100 years), kg per MJ used through traditional fuel systems with different efficiency levels.
Jmse 11 01611 g015
Figure 16. Emissions, grams per MJ used through traditional fuel systems.
Jmse 11 01611 g016
Figure 17. Carbon dioxide emissions from traditional fuel systems with different efficiency levels, in grams per MJ.
Jmse 11 01611 g017
Table 1. GWP (100 years), kg per MJ from electrolysis with different energy sources.
Electricity SourceGWP (100 years) per MJ (kg CO2 eqv/MJ)
PEMFCMCFC
Heavy Fuel Oil0.9041.080
Coal0.8391.000
Natural Gas0.3670.439
Grid (UK)0.2840.339
Solar0.0580.069
Hydro0.006710.00802
Wind0.005250.00627
Nuclear0.004530.00542
Table 2. Emissions, grams per MJ of electrolysis with different energy sources and a PEMFC system.
Electricity SourceEmissions per MJ for PEMFC System (g/MJ)
COCO2CH4NOXsSOXsNMVOC
Heavy Fuel Oil0.2260884.650.66801.28001.93000.2330
Coal0.3200766.482.47001.75150.76900.0275
Natural Gas0.0952354.680.45800.26350.06030.0399
Grid (UK)0.3000381.100.48600.40200.20000.0357
Solar0.075259.900.12700.10450.12500.0526
Hydro0.00366.780.00150.00380.00130.0003
Wind0.01595.450.00740.01050.00640.0014
Nuclear0.00585.510.00610.01800.00870.0038
Table 3. GWP (100 years), kg per MJ used through steam reforming with different energy sources.
Electricity SourceGWP (100 Years) per MJ
(kg CO2 eqv/MJ)
PEMFCMCFC
With CCNatural Gas0.0590.070
Grid (UK)0.0510.061
Wind0.0250.030
Without CCNatural Gas0.1950.233
Grid (UK)0.1870.224
Wind0.1620.193
Table 4. Emissions, grams per MJ of steam reforming with different energy sources and a PEMFC system.
Electricity SourceEmissions per MJ for PEMFC System (g/MJ)
COCO2CH4NOXsSOXsNMVOC
With CCNatural Gas0.023652.700.21500.06970.02800.0170
Grid (UK)0.042455.110.21800.08260.04080.0166
Wind0.016320.690.17400.04660.02300.0134
Without CCNatural Gas0.0236189.300.21500.06970.02800.0170
Grid (UK)0.0424191.710.21800.08260.04080.0166
Wind0.0163157.280.17400.04660.02300.0134
Table 5. GWP (100 years), kg per MJ used through a diesel system with different efficiency levels.
Diesel SystemGWP (100 Years) per MJ
(kg CO2 eqv/MJ)
High Efficiency0.163
Medium Efficiency0.210
Low Efficiency0.290
Table 6. GWP (100 years), kg per MJ used through a gas system with different efficiency levels.
Gas SystemGWP (100 Years) per MJ
(kg CO2 eqv/MJ)
High Efficiency0.182
Medium Efficiency0.204
Low Efficiency0.233
Table 7. Emissions, grams per MJ from a diesel system with different efficiency levels.
Diesel SystemEmissions per MJ (g/MJ)
COCO2CH4NOXsSOXsNMVOC
High Efficiency0.1430161.370.12304.06000.16100.0383
Medium Efficiency0.1840208.480.15905.24000.20840.0419
Low Efficiency0.2540286.660.21907.23000.28640.0681
Table 8. Emissions, grams per MJ from a gas system with different efficiency levels.
Gas SystemEmissions per MJ (g/MJ)
COCO2CH4NOXsSOXsNMVOC
High Efficiency0.3270118.192.21000.34900.01940.1320
Medium Efficiency0.3680133.222.49000.39200.02180.1490
Low Efficiency0.4200152.252.85000.44900.02490.1700
Disclaimer/Publisher’s Note: The statements, opinions and data contained in all publications are solely those of the individual author(s) and contributor(s) and not of MDPI and/or the editor(s). MDPI and/or the editor(s) disclaim responsibility for any injury to people or property resulting from any ideas, methods, instructions or products referred to in the content.

