
Measuring Resilience to Sea-Level Rise for Critical Infrastructure Systems: Leveraging Leading Indicators
 , , and
Abstract
:1. Introduction
2. Delineating Risks in the Context of Sea Level Rise
- Coastal Flooding—Recent studies project increased frequency of flooding events with rising sea levels [24]. Coastal flooding occurs when water levels or waves surpass critical thresholds for low-lying shorelines and defense structures [25,26,27]. Flood intensity assessment employs static and dynamic models. Static models use a “bathtub” approach to estimate flood depths and spatial extent based on projected relative sea level rise (SLR) scenarios [28]. Non-linear hydrodynamic response models consider coastal topography, land use, storm characteristics, wave effects, and storm surge to generate more accurate predictions. These models incorporate damage functions related to flood water depth, accounting for SLR, land subsidence, and flood surge [23,29,30]. Some models consider additional factors like hydrodynamics, landforms, relief, geology, and shoreline displacement [31]. Studies focusing on specific regions, such as Australia [32], Canada [33], and the USA [34], highlight high-risk shorelines with low resilience to coastal flooding due to low relief, erodible substrate, subsidence, and high wave energies.
- Inland Flooding—In addition to coastal flooding, rising sea levels are associated with rising groundwater tables, which extend the risks of inland flooding for low-lying areas located further inland from shorelines. As such, the response of groundwater tables to sea levels, precipitation, and water extraction and use is an essential input for assessing risks due to inland flooding. This relation is generally predicted through process simulation models such as MODFLOW. The predicted response is then incorporated to evaluate the exposure and potential impacts on various systems and communities [21,35]. For a further detailed analysis of the process simulation models predicting groundwater response to sea levels, we refer the interested reader to the detailed review conducted in [35].Coastal erosion—Also known as “shoreline retreat”, coastal erosion is another projected risk caused by SLR. It is a change in the morphology of coasts due to several factors, which include, in addition to SLR, the sediment supply, wave energy, tidal currents, and wind action. Prediction of shoreline response to SLR has been challenging due to the highly dynamic nature of the process and the undetermined interactions between the contributing factors. One of the early approaches to quantifying shoreline change is known as the “Bruun Rule”. This method was developed by Bruun in 1954 [36] and has been extensively used in shaping societal responses to future sea levels. The Bruun Method proposes a linear relationship between SLR and shoreline recession based on equilibrium profile theory, as visually presented in Figure 2. Several refinements were later published by Bruun and other researchers and are incorporated as the basis for recent models aiming to capture shoreline change, including GENESIS and SBEACH. For more details on these models, we refer the reader to a review of the history of this method, its applications, and drawbacks provided in [37].
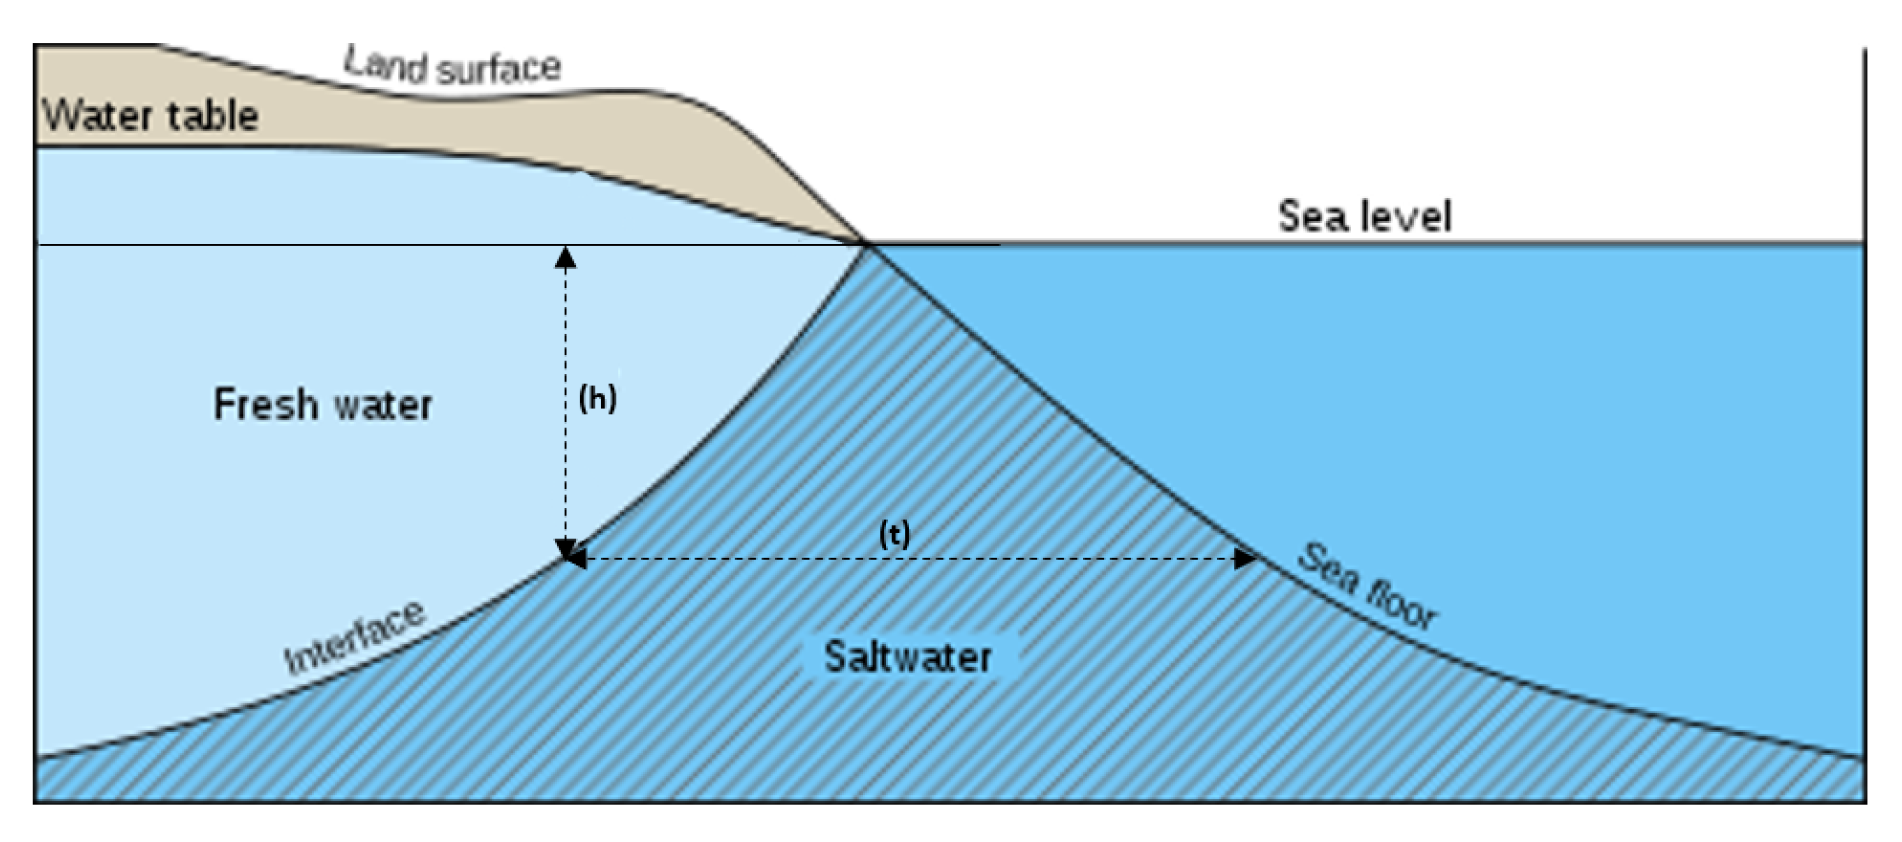
- Saltwater intrusion—Saltwater intrusion is the encroachment of saline water into fresh groundwater regions in coastal aquifers, leading to a reduction in freshwater availability. Saltwater is pushed upstream from the ocean with forces exerted by rising sea levels. These forces, coupled with the decreasing volumes of freshwater due to periodic dry seasons and increased pumping activities, cause the saltwater to intrude even further into the fresh aquifers.
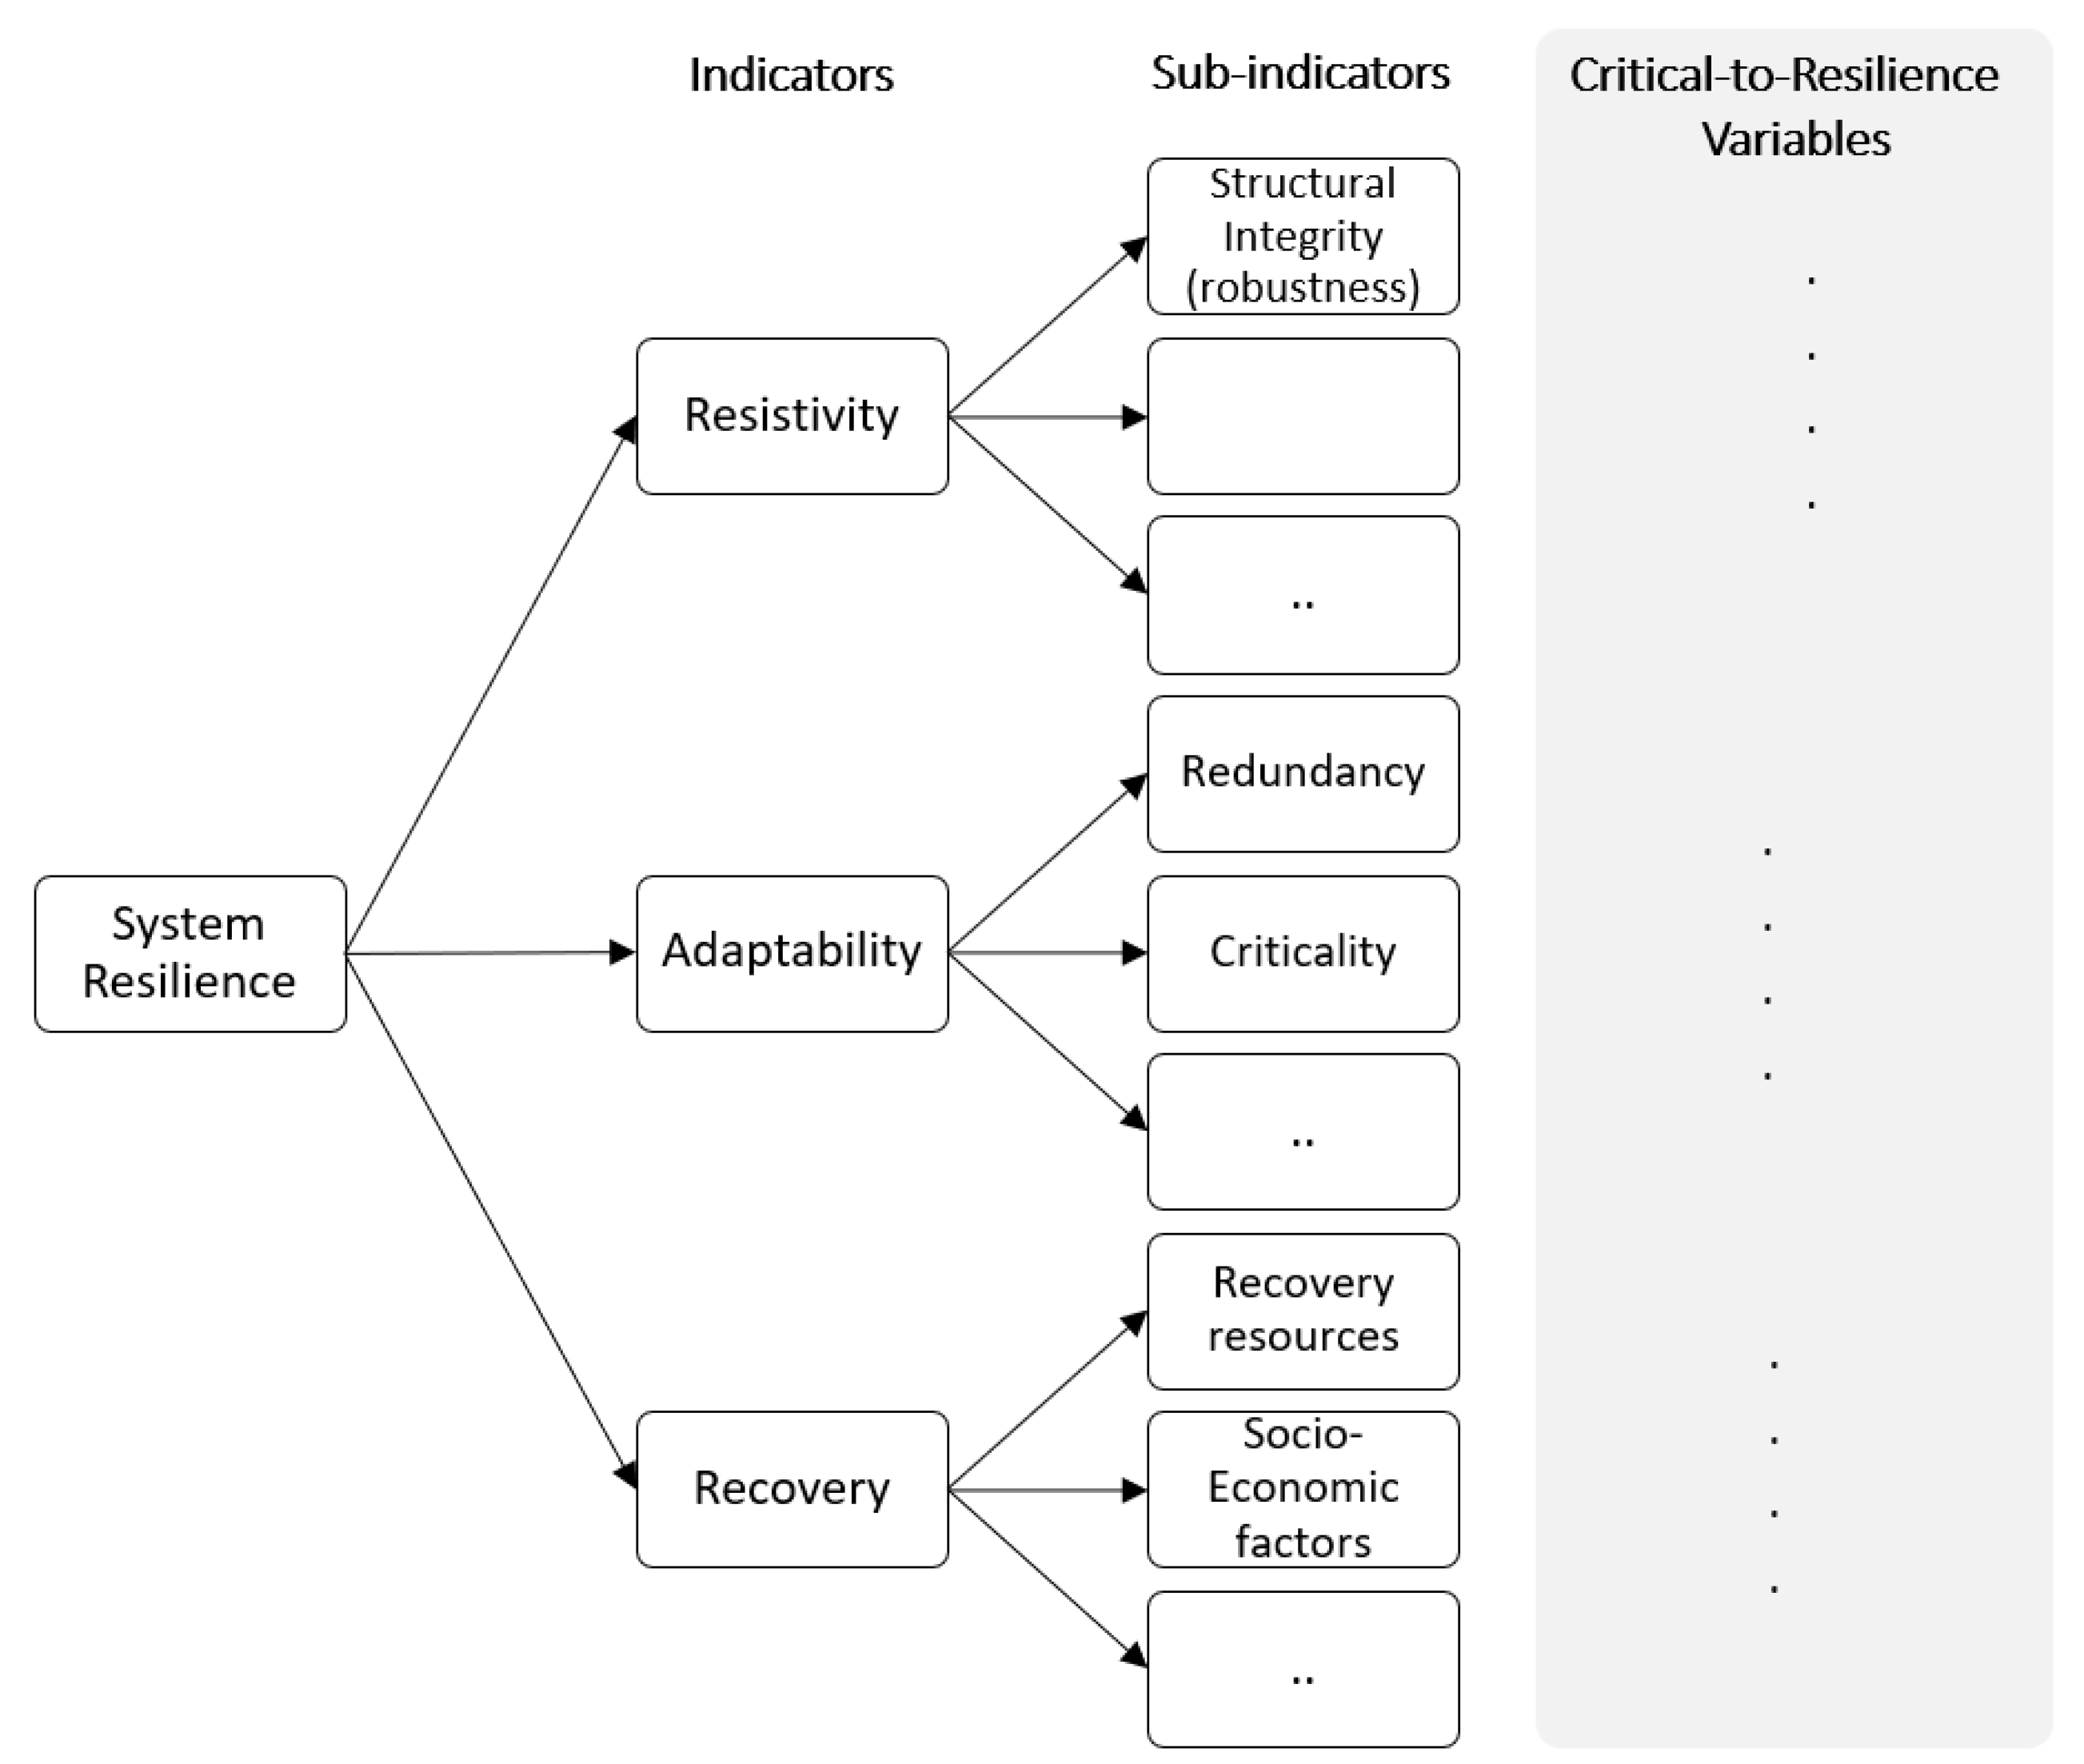
3. Resilience-Critical Indicators
3.1. Transportation Infrastructure
- Measuring Resistivity—The resistive capacity of road networks is often determined by the structural integrity/robustness of the network foundations and surface material, its ability to drain excess surface runoff, and the robustness of the flood defense structure protecting the network. The structural integrity of pavement structures plays a crucial role in determining the ability of road networks to resist SLR-related risks, including heavy rainfall and surface flooding. The resilient modulus, structural number (SN) of different pavement layers, pavement moisture content, International Roughness Index (IRI), and extent of rutting and cracking, as measured by rut and crack depths and lengths, are some of the identified resilience-leading indicators to quantify the strength of pavement structures [49]. In addition to the surface robustness, the robustness of the foundations and other critical components of transportation systems, including bridges and bridge crossings, has drawn particular attention in the context of resilience assessment studies. In this regard, various measures have been proposed, including the actual condition of exposed bridges, as determined by the National Bridge Inspection Standards (NBIS) [50], as well as some design-related features that may accelerate future bridge scouring, such as geometry (skew), length of maximum span, scour critical rating, the presence of channel protection measures (such as steel sheeting or riprap), and cross-sectional area that may exacerbate the potential for erosion (or scouring) of the streambed [50]. On the water side, the amount of high and lowland flooding could reduce the top clearance between ships and bridges and thus, also disturb the operations of maritime transportation systems. Such measures are utilized to assess the ability of ports to resist inundation events [51].
- Measuring Adaptability—The adaptability of a transportation network is a key determinant of its serviceability during adverse events. Various metrics have been developed to quantify the adaptive capacity of transportation networks, most of which are derived from the principles of graph theory. They focus on measures such as connectivity, accessibility, mobility, and redundancy. While these metrics have been widely discussed in the literature, few studies have considered them in the context of SLR. For details on these measures, we refer the reader to work reported by Geurs and van Wee (2004) [56], Leobons et al. (2019) [57], and Sun et al. (2020) [58].
- Measuring Recovery—Recovery capacity of transportation infrastructure in the context of SLR has not been widely addressed in the literature. Nonetheless, several measures developed by earlier researchers in the context of generic disruptions are relevant and worth mentioning. For instance, Chang et al. [76] evaluated post-disaster system performance of network coverage and transport accessibility and proposed metrics for the urban rail and highway transportation systems. They based their analysis on the 1995 Hyogoken–Nanbu Earthquake that devastated Kobe, Japan. Similarly, Peeta et al. [77] developed a post-disaster connectivity index between origin–destination nodes in transportation networks. While many studies have assessed post-disaster recovery efforts in the transportation sector, limited attention was given to pre-disaster adaptation in the context of recovery.
3.2. Water Supply and Distribution Infrastructure
- Measuring Resistivity—Aquifers and sources of freshwater supply constitute an integral component of the water supply infrastructure, and their disruption can have a significant impact on the entire system. As such, their ability to resist disruptions resulting from SLR, mainly due to saltwater intrusion, has gained attraction in research in recent years. Various indicators have been proposed in the literature to evaluate the aquifer’s resistance to saltwater intrusion, including the type of aquifer, its hydraulic conductivity, thickness, depth to groundwater, and perpendicular distance inland from the shoreline. Generally, those indicators are measured using process simulation models, such as the GALDIT Model [85]. In addition to the aquifer characteristics, the saltwater-freshwater interface characteristics are utilized to assess the potential of saltwater intrusion. Conceptual saltwater intrusion models such as the Ghyben-Herzberg approximation are employed to determine the position of the freshwater-saltwater transition zone based on the ratio of the thickness of the freshwater zone to the depth below the mean sea level. For more detailed mathematical formulations of these measures, we refer the interested reader to the studies conducted by Werner et al. [39,86].
- Measuring Adaptability—The ability of a water supply and distribution system to adapt to SLR is influenced by how well both the supply sources and distribution network can adapt to disruptions. These disruptions can be localized pipe failures or long-term freshwater shortages affecting the system entirely. On the supply side, the inability to satisfy a minimum daily threshold of freshwater is considered a critical condition for the system; this threshold is estimated to be 50% of the expected water demand [92] or 1000 m per capita. according to the Food and Agriculture Organization (FAO) of the United Nations. To mathematically evaluate this ability, the proposed measures focus on evaluating the excess (or redundant) amounts of supply measured relative to the minimum thresholds, such as the shortage Index (SI), Stability Degree (SD) [93], and the expected freshwater availability per capita given the anticipated risks [90,94]. In addition, where reservoirs constitute part of the system, proposed measures include the multivariate resilience index that combines the Inflow-Demand Reliability indicator (IDR) and the Water Storage Resilience indicator (WSR) [95]. These indicators assess the changes in the inflow to reservoirs due to climate conditions, including rising sea levels and the reservoir storage capacity relative to the forecasted demand and the hydrological variability. Although this composite index was deployed in the context of drought, it can also be utilized in assessing resilience to relevant risks due to SLR.
- Measuring Recovery—Compromising the water quality due to saltwater intrusion and pollution is a major threat caused by SLR. Therefore, measures assessing the extent of water pollution have been proposed to assess the ability of water supply systems to recover following possible disruptions. Some of the proposed leading indicators include the percentage of rivers and stream miles that meet applicable water quality standards [90]. Other measures integrate the social element by accounting for the size of the population and the level of economic development (Gross Domestic Product) in the areas serviced by the supply source under study. These measures could also be used to reflect the criticality of the system as they are direct projections for the expected demand, hence the amount of effort required to adapt to possible disruptions.
3.3. Wastewater Collection and Treatment Infrastructure
- Measuring Resistivity—Various leading measures are introduced in the literature to assess the ability of the different system components to resist risks associated with SLR. Some of the proposed measures assess the robustness of the system components, such as the elevation of a wastewater treatment facility or its critical components such as pump motors, aeration tanks [99], and outlet pipes (discharge points) [108,109]. Other measures evaluate the robustness of the existing flood defense structures [99].
- Measuring Adaptability—The literature on measuring the adaptability of wastewater collection and treatment systems focuses on the criticality, redundancy, and connectivity of the system’s components. The criticality of a wastewater treatment facility can be evaluated through various measures, including the population it serves and the Discharge Monitoring Reports (DMR) violations index. The DMR violations index measures the percentage of effluent violations and serves as an indicator of the facility’s ability to adapt to daily stress and increased vulnerability to flooding events [21,113]. Another measure employed to evaluate criticality is the elevation of pipes and manholes in relation to the expected future groundwater levels. According to Friedrich et al. [108], network elements with an elevation between 0 and 2 m are considered critical under a worst-case scenario of a 2.8-meter rise in sea level. Additionally, the network clustering coefficient, measured as a function of the total length of pipes and the number of manholes within a region [108], and proximity to other critical infrastructure systems [110] are employed to evaluate an unfavorable and critical situation, where regions with high densities of network components lead to a diminished ability to adapt to failure. In assessing the criticality of OSTDS, measures such as proximity to other infrastructure systems, including public or private drinking water wells, waterbodies, and surface drainage lines (watersheds), which can function as channels that accelerate transferring the effluent to nearby freshwater sources, are proposed in the literature [111].
- Measuring Recovery—To assess the recovery of wastewater treatment and collection systems, a few leading indicators, including the availability of multiple backup parts, such as pump motors [99], and the resourcefulness resiliency index [113] are proposed. For the OSTD systems, the resilience index proposed by [111] employs leading indicators that reflect the ease with which adaptations can be made in the event of failure. The adaptation options in this context include structural improvement of the existing system or extension to the existing sewer network. Specific measures in this context include distance to existing and planned sewer lines, distance to sewer overflow locations, and the moratorium status of the pump station basin to which the on-site system belongs. Moreover, socio-economic conditions, measured by the median household income, are also incorporated into the proposed metric.
3.4. Energy Generation and Transmission Infrastructure
- Measuring Resistivity—The response capacities of energy infrastructure are assessed at the supply (S) and transmission (T) component levels. On both the power generation and transmission sides, damages resulting from SLR are primarily attributed to flooding and inundation of critical system components such as power plants, substations, distribution circuits, and buried cables. The literature has extensively examined the ability of the existing energy infrastructure to resist inundation. Proposed resilience-critical metrics are based on a system’s structural integrity, a base elevation of its critical equipment relative to the expected flood levels, and the likelihood of failure of flood defense structures [119,120,121]. Additionally, higher salinity levels accelerate the processes of corrosion, fouling, and scaling along the surfaces of the cooling tower and the condenser; thereby, decreasing thermal performance, leading indicators capturing the ability of the cooling systems to resist failures caused by salinity are also proposed [122].
- Measuring Adaptability—Diversification of energy supply, including fuel mix and multi-sourcing, is one of the essential strategies to hedge against energy supply risks [124] and as such, related indicators have been employed to capture their resilience. In this regard, the proposed leading indicators assess the diversity of energy supply sources by means of three key elements: (1) “variety" represented by the number and nature of sources, (2) “balance" represented by the spread across different sources, and (3) “disparity" signifying the degree to which the sources are different [125]. While metrics have been commonly referenced to the first two elements, no clear metrics are reported in the literature to measure disparity in energy supply [126]. Among the proposed metrics are the fuel import dependence, calculated based on net imports or the Shannon index introduced by the Asian Pacific Energy Research Center (APERC) [102], the Herfindahl-Hirschman Index as a measure of market concentration [127], and the degree of dependence on reserves of energy sources to assess energy security [128].
- Measuring Recovery—The ability of energy systems to rebuild after disruptions can be assessed through the use of financial, technical, and governance-related indicators. These indicators include the availability of financial resources measured in GDP per capita, the amount of private investment into energy infrastructure, the percentage of technically qualified personnel in the energy sector and electric utilities, and the average outage times [140]. Additional indicators include the availability of recovery resources that are quantified by the number and size of recovery crews working in the energy sector [126]. When historical data is available, lagging indicators such as Mean Time to Repair (MTTR) and Random Time to Repair (RTTR) can also be utilized [126].
3.5. Agricultural Systems
- Measuring Resistivity—The resistive capacity of agricultural lands is governed by their ability to resist excess water, waterlogging, and increased salinity. The ability to resist waterlogging is shaped by the drainage capacity, soil moisture content, and availability of efficient flood defense structures that can keep water out of the fields [144]. Drainage systems help maintain the groundwater at an adequate level that sustains the productivity of the agricultural land. Therefore, the importance of maintaining the drainage infrastructure, including the associated equipment and machinery, is emphasized in the literature. The drainage capacity with respect to the expected inundation levels and the maintenance frequency of the drainage infrastructure is used as leading indicators for resistivity [144]. Additionally, soil water (moisture) percentage [148] and the Standard Precipitation Index (SPI) [149] are other proposed leading indicators that can assess the reduction in crop yield as a result of the increased moisture content measured relative to the soil saturation capacity [150]. Although soil moisture is generally used to assess the response of agricultural fields to projected drought conditions, it can also be used in the context of flooding to assess resistance to excess water. Actual soil moisture data can be obtained from several national and global soil moisture database such as the surface satellite soil moisture dataset provided by the Soil Moisture and Ocean Salinity (SMOS). Another source is the root zone soil moisture dataset made available by the Canadian Meteorology Center’s Regional Deterministic Prediction System (RDPS) [151]. In addition to the soil moisture content, depth to groundwater table is also proposed to measure the likelihood of diminished yield due to inland flooding [152].
- Measuring Adaptability—The majority of the studies within this category examine adaptability to SLR from the perspectives of the community and household rather than solely from the agricultural field. Proposed indicators include the ratio of rice production in a region to its gross domestic product (GDP), the number of employees engaged in the agriculture sector, the number of households with a primary income source from agriculture, the average net income per household from agricultural production, the percentage of households with alternative livelihood options besides agriculture, the percentage of paddy land in the total area, the percentage of rural population per square kilometer, and the percentage of rain-fed fields compared to irrigation-dependent fields [145]. With a special focus on agricultural fields, Antle et al. [155] have proposed a spatial heterogeneity indicator, which utilizes physical characteristics of the soil, such as biogeochemistry, moisture, and texture, and measures the endowment capacity of resources by assessing the proportion of farmers with access to alternate technology and other resources.
- Measuring Recovery—The majority of the recovery measures published in the body of literature are community-centric, which is in tune with the adaptation measures. These measures are mostly socio-economic in nature, including the literacy rate, represented by the proportion of individuals who possess reading and writing proficiency, the poverty rate, represented by the percentage of individuals below the poverty line, and the agricultural income share, represented by the percentage of crop production in relation to the region’s Gross Domestic Product (GDP) [145].
4. Results and Insights: Operationalizing SLR Resilience with Leading Indicators
4.1. Multidimensionality and Composite Indicators
4.2. Integration: From Local View to Global Perspective
4.3. Inclusion and Coordination: From Infrastructure-Centered Resilience to People-Centered Resilience
5. Conclusions
Author Contributions
Funding
Institutional Review Board Statement
Informed Consent Statement
Data Availability Statement
Conflicts of Interest
References
- Kopp, R.E.; Kemp, A.C.; Bittermann, K.; Horton, B.P.; Donnelly, J.P.; Gehrels, W.R.; Hay, C.C.; Mitrovica, J.X.; Morrow, E.D.; Rahmstorf, S. Temperature-driven global sea-level variability in the Common Era. Proc. Natl. Acad. Sicences USA 2016, 113, E1434–E1441. [Google Scholar] [CrossRef]
- Hudson, T.; Keating, K.; Pettit, A. Cost Estimation for Coastal Protection—Summary of Evidence; Technical Report, Environmental Agency Report—SC080039/R7; Environmental Agency: London, UK, 2015. [Google Scholar]
- Büyüközkan, G.; Ilıcak, Ö.; Feyzioğlu, O. A review of urban resilience literature. Sustain. Cities Soc. 2022, 77, 103579. [Google Scholar] [CrossRef]
- Ribeiro, P.J.G.; Gonçalves, L.A.P.J. Urban resilience: A conceptual framework. Sustain. Cities Soc. 2019, 50, 101625. [Google Scholar] [CrossRef]
- Penaloza, G.A.; Saurin, T.A.; Formoso, C.T.; Herrera, I.A. A resilience engineering perspective of safety performance measurement systems: A systematic literature review. Saf. Sci. 2020, 130, 104864. [Google Scholar] [CrossRef]
- Hinze, J.; Thurman, S.; Wehle, A. Leading indicators of construction safety performance. Saf. Sci. 2013, 51, 23–28. [Google Scholar] [CrossRef]
- OECD. Handbook on Constructing Composite Indicators: Methodology and User Guide; OECD: Paris, France, 2008; p. 158. [Google Scholar] [CrossRef]
- Cutter, S.L.; Boruff, B.J.; Shirley, W.L. Social vulnerability to environmental hazards. Soc. Sci. Q. 2003, 84, 242–261. [Google Scholar] [CrossRef]
- Beccari, B. A comparative analysis of disaster risk, vulnerability and resilience composite indicators. PLoS Curr. 2016, 8. [Google Scholar] [CrossRef]
- Azevedo de Almeida, B.; Mostafavi, A. Resilience of infrastructure systems to sea-level rise in coastal areas: Impacts, adaptation measures, and implementation challenges. Sustainability 2016, 8, 1115. [Google Scholar] [CrossRef] [Green Version]
- Rus, K.; Kilar, V.; Koren, D. Resilience assessment of complex urban systems to natural disasters: A new literature review. Int. J. Disaster Risk Reduct. 2018, 31, 311–330. [Google Scholar] [CrossRef]
- Bruneau, M.; Chang, S.E.; Eguchi, R.T.; Lee, G.C.; O’Rourke, T.D.; Reinhorn, A.M.; Shinozuka, M.; Tierney, K.; Wallace, W.A.; Winterfeldt, D.V. A framework to quantitatively assess and enhance the seismic resilience of communities. Earthq. Spectra 2003, 19, 733–752. [Google Scholar] [CrossRef] [Green Version]
- Liu, W.; Song, Z. Review of studies on the resilience of urban critical infrastructure networks. Reliab. Eng. Syst. Saf. 2020, 193, 106617. [Google Scholar] [CrossRef]
- Wang, C.H.; Blackmore, J.M. Resilience concepts for water resource systems. J. Water Resour. Plan. Manag. 2009, 135, 528–536. [Google Scholar] [CrossRef]
- Douxchamps, S.; Debevec, L.; Giordano, M.; Barron, J. Monitoring and evaluation of climate resilience for agricultural development—A review of currently available tools. World Dev. Perspect. 2017, 5, 10–23. [Google Scholar] [CrossRef]
- Hosseini, S.; Barker, K.; Ramirez-Marquez, J.E. A review of definitions and measures of system resilience. Reliab. Eng. Syst. Saf. 2016, 145, 47–61. [Google Scholar] [CrossRef]
- Asadzadeh, A.; Kötter, T.; Salehi, P.; Birkmann, J. Operationalizing a concept: The systematic review of composite indicator building for measuring community disaster resilience. Int. J. Disaster Risk Reduct. 2017, 25, 147–162. [Google Scholar] [CrossRef]
- Serdar, M.Z.; Koç, M.; Al-Ghamdi, S.G. Urban transportation networks resilience: Indicators, disturbances, and assessment methods. Sustain. Cities Soc. 2022, 76, 103452. [Google Scholar] [CrossRef]
- Shin, S.; Lee, S.; Judi, D.R.; Parvania, M.; Goharian, E.; McPherson, T.; Burian, S.J. A systematic review of quantitative resilience measures for water infrastructure systems. Water 2018, 10, 164. [Google Scholar] [CrossRef] [Green Version]
- Nik, V.M.; Perera, A.; Chen, D. Towards climate resilient urban energy systems: A review. Natl. Sci. Rev. 2021, 8, nwaa134. [Google Scholar] [CrossRef]
- Hummel, M.A.; Berry, M.S.; Stacey, M.T. Sea level rise impacts on wastewater treatment systems along the US coasts. Earth’s Future 2018, 6, 622–633. [Google Scholar] [CrossRef] [Green Version]
- Montgomery, M.; Kunreuther, H. Pricing storm surge risks in Florida: Implications for determining flood insurance premiums and evaluating mitigation measures. Risk Anal. 2018, 38, 2275–2299. [Google Scholar] [CrossRef]
- Small, C.; Gornitz, V.; Cohen, J.E. Coastal hazards and the global distribution of human population. Environ. Geosci. 2000, 7, 3–12. [Google Scholar] [CrossRef]
- Catanese, A.J. Charting the Course: Where Is South Florida Heading; Florida Atlantic University: Boca Raton, FL, USA, 2006. [Google Scholar]
- Ayyub, B.M.; Braileanu, H.G.; Qureshi, N. Prediction and impact of sea level rise on properties and infrastructure of Washington, DC. Risk Anal. Int. J. 2012, 32, 1901–1918. [Google Scholar] [CrossRef] [PubMed]
- Genovese, E.; Green, C. Assessment of storm surge damage to coastal settlements in Southeast Florida. J. Risk Res. 2015, 18, 407–427. [Google Scholar] [CrossRef]
- Idier, D.; Rohmer, J.; Bulteau, T.; Delvallée, E. Development of an inverse method for coastal risk management. Natl. Hazards Earth Syst. Sci. 2013, 13, 999–1013. [Google Scholar] [CrossRef] [Green Version]
- Kopp, R.E.; Gilmore, E.A.; Little, C.M.; Lorenzo-Trueba, J.; Ramenzoni, V.C.; Sweet, W.V. Usable science for managing the risks of sea-level rise. Earth’s Future 2019, 7, 1235–1269. [Google Scholar] [CrossRef] [Green Version]
- Poon, Y.; Sanders, B.; Mason, R.; Stein, R. Sea Level Rise Impact Assessment and Mitigation Alternatives Development for Balboa Island and Little Balboa Island, City of Newport Beach, California. In Coastal Engineering Practice (2011); American Society of Civil Engineers: Reston, VA, USA, 2011; pp. 373–383. [Google Scholar]
- Sathaye, J.; Dale, L.; Larsen, P.; Fitts, G.; Koy, K.; Lewis, S.; Lucena, A. Estimating Risk to California Energy Infrastructure from Projected Climate Change; Lawrence Berkeley National Laboratory: Berkeley, CA, USA, 2012. [Google Scholar]
- Gornitz, V. Vulnerability of the East Coast, USA to future sea level rise. In Proceedings of the Skagen Symposium, Skagen, Denmark, 2–5 September 1990; pp. 201–237. [Google Scholar]
- Abuodha, P.A.; Woodroffe, C.D. Assessing vulnerability to sea-level rise using a coastal sensitivity index: A case study from southeast Australia. J. Coast. Conserv. 2010, 14, 189–205. [Google Scholar] [CrossRef]
- Shaw, J.; Taylor, R.B.; Forbes, D.L.; Ruz, M.H. Sensitivity of the Canadian coast to sea-level rise. In Coastal Zone; American Society of Civil Engineers: Reston, VA, USA, 1994; p. 2377. [Google Scholar]
- Thieler, E.R.; Hammar-Klose, E.S. National Assessment of Coastal Vulnerability to Sea-Level Rise: Preliminary Results for the US Atlantic Coast; Technical Report; US Geological Survey: Reston, VA, USA, 1999. [Google Scholar]
- Buzzanga, B.A. Precipitation and Sea Level Rise Impacts on Groundwater Levels in Virginia Beach, Virginia; Old Dominion University: Norfolk, VA, USA, 2017. [Google Scholar]
- Bruun, P. Coast Erosion and the Development of Beach Profiles; US Beach Erosion Board: Vicksburg, MS, USA, 1954; Volume 44. [Google Scholar]
- Cooper, J.A.G.; Pilkey, O.H. Sea-level rise and shoreline retreat: Time to abandon the Bruun Rule. Glob. Planet. Chang. 2004, 43, 157–171. [Google Scholar] [CrossRef]
- Verruijt, A. A note on the Ghyben-Herzberg formula. Hydrol. Sci. J. 1968, 13, 43–46. [Google Scholar] [CrossRef]
- Werner, A.D.; Simmons, C.T. Impact of sea-level rise on sea water intrusion in coastal aquifers. Groundwater 2009, 47, 197–204. [Google Scholar] [CrossRef]
- Ketabchi, H.; Mahmoodzadeh, D.; Ataie-Ashtiani, B.; Simmons, C.T. Sea-level rise impacts on seawater intrusion in coastal aquifers: Review and integration. J. Hydrol. 2016, 535, 235–255. [Google Scholar] [CrossRef]
- Romanazzi, A.; Gentile, F.; Polemio, M. Modelling and management of a Mediterranean karstic coastal aquifer under the effects of seawater intrusion and climate change. Environ. Earth Sci. 2015, 74, 115–128. [Google Scholar] [CrossRef]
- Bles, T.; Besseminder, J.; Chevreuil, M.; Danielsson, P.; Falemo, S.; Venmans, A.; Ennesser, Y.; Löfroth, H. Climate change risk assessments and adaptation for roads–results of the ROADAPT Project. Transp. Res. Procedia 2016, 14, 58–67. [Google Scholar] [CrossRef] [Green Version]
- Watkiss, P.; Hunt, A. Projection of economic impacts of climate change in sectors of Europe based on bottom up analysis: Human health. Clim. Chang. 2012, 112, 101–126. [Google Scholar] [CrossRef] [Green Version]
- Armstrong, A.; Flood, M.; Meyer, M. Development of Adaptation Framework for Climate Change Engineering Assessment of Transportation Assets. In ICSI 2014: Creating Infrastructure for a Sustainable World; American Society of Civil Engineers: Reston, VA, USA, 2014; pp. 150–163. [Google Scholar]
- Balijepalli, C.; Oppong, O. Measuring vulnerability of road network considering the extent of serviceability of critical road links in urban areas. J. Transp. Geogr. 2014, 39, 145–155. [Google Scholar] [CrossRef]
- Lu, Q.C.; Peng, Z.R.; Zhang, J. Identification and prioritization of critical transportation infrastructure: Case study of coastal flooding. J. Transp. Eng. 2015, 141, 04014082. [Google Scholar] [CrossRef]
- Suarez, P.; Anderson, W.; Mahal, V.; Lakshmanan, T.R. Impacts of flooding and climate change on urban transportation: A systemwide performance assessment of the Boston Metro Area. Transp. Res. Part Transp. Environ. 2005, 10, 231–244. [Google Scholar] [CrossRef]
- Knott, J.F.; Daniel, J.S.; Jacobs, J.M.; Kirshen, P. Adaptation planning to mitigate coastal-road pavement damage from groundwater rise caused by sea-level rise. Transp. Res. Rec. 2018, 2672, 11–22. [Google Scholar] [CrossRef]
- Valenzuela, Y.B.; Rosas, R.S.; Mazari, M.; Risse, M.; Rodriguez-Nikl, T. Resilience of road infrastructure in response to extreme weather events. In Proceedings of the International Conference on Sustainable Infrastructure (ASCE), New York, NY, USA, 26–28 October 2017; pp. 349–360. [Google Scholar]
- Shields, G.M. Resiliency planning: Prioritizing the vulnerability of coastal bridges to flooding and scour. Procedia Eng. 2016, 145, 340–347. [Google Scholar] [CrossRef] [Green Version]
- Nursey-Bray, M.; Blackwell, B.; Brooks, B.; Campbell, M.L.; Goldsworthy, L.; Pateman, H.; Rodrigues, I.; Roome, M.; Wright, J.T.; Francis, J.; et al. Vulnerabilities and adaptation of ports to climate change. J. Environ. Plan. Manag. 2013, 56, 1021–1045. [Google Scholar] [CrossRef]
- Cavalli, M.; Trevisani, S.; Comiti, F.; Marchi, L. Geomorphometric assessment of spatial sediment connectivity in small Alpine catchments. Geomorphology 2013, 188, 31–41. [Google Scholar] [CrossRef]
- Kalantari, Z.; Ferreira, C.S.S.; Koutsouris, A.J.; Ahlmer, A.K.; Cerdà, A.; Destouni, G. Assessing flood probability for transportation infrastructure based on catchment characteristics, sediment connectivity and remotely sensed soil moisture. Sci. Total. Environ. 2019, 661, 393–406. [Google Scholar] [CrossRef] [PubMed]
- Pedrozo-Acuna, A.; Moreno, G.; Mejía-Estrada, P.; Paredes-Victoria, P.; Breña-Naranjo, J.A.; Meza, C. Integrated approach to determine highway flooding and critical points of drainage. Transp. Res. Part D Transp. Environ. 2017, 50, 182–191. [Google Scholar] [CrossRef]
- Dawson, D.; Shaw, J.; Gehrels, W.R. Sea-level rise impacts on transport infrastructure: The notorious case of the coastal railway line at Dawlish, England. J. Transp. Geogr. 2016, 51, 97–109. [Google Scholar] [CrossRef] [Green Version]
- Geurs, K.T.; Wee, B.V. Accessibility evaluation of land-use and transport strategies: Review and research directions. J. Transp. Geogr. 2004, 12, 127–140. [Google Scholar] [CrossRef]
- Leobons, C.M.; Campos, V.B.G.; de Mello Bandeira, R.A. Assessing urban transportation systems resilience: A proposal of indicators. Transp. Res. Procedia 2019, 37, 322–329. [Google Scholar] [CrossRef]
- Sun, W.; Bocchini, P.; Davison, B.D. Resilience metrics and measurement methods for transportation infrastructure: The state of the art. Sustain. Resilient Infrastruct. 2020, 5, 168–199. [Google Scholar] [CrossRef]
- Taylor, M. An accessibility approach in assessing regional road network vulnerability. In Proceedings of the Australasian Transport Research Forum (ATRF), 31ST, Gold Coast, QLD, Australia, 2–3 October 2008; Volume 31. [Google Scholar]
- Sohn, J. Evaluating the significance of highway network links under the flood damage: An accessibility approach. Transp. Res. Part Policy Pract. 2006, 40, 491–506. [Google Scholar] [CrossRef]
- Demirel, H.; Kompil, M.; Nemry, F. A framework to analyze the vulnerability of European road networks due to Sea-Level Rise (SLR) and sea storm surges. Transp. Res. Part Policy Pract. 2015, 81, 62–76. [Google Scholar] [CrossRef]
- Kermanshah, A.; Derrible, S. Robustness of road systems to extreme flooding: Using elements of GIS, travel demand, and network science. Nat. Hazards 2017, 86, 151–164. [Google Scholar] [CrossRef]
- Hansen, W.G. How accessibility shapes land use. J. Am. Inst. Planners 1959, 25, 73–76. [Google Scholar] [CrossRef]
- López, E.; Gutiérrez, J.; Gómez, G. Measuring regional cohesion effects of large-scale transport infrastructure investments: An accessibility approach. Eur. Plan. Stud. 2008, 16, 277–301. [Google Scholar] [CrossRef] [Green Version]
- Goodwin, P.B. A quality margin in transport. Traffic Eng. Control. 1992, 33, 661–665. [Google Scholar]
- Lhomme, S.; Serre, D.; Diab, Y.; Laganier, R. Analyzing resilience of urban networks: A preliminary step towards more flood resilient cities. Natl. Hazards Earth Syst. Sci. 2013, 13, 221–230. [Google Scholar] [CrossRef] [Green Version]
- Xu, X.; Chen, A.; Jansuwan, S.; Yang, C.; Ryu, S. Transportation network redundancy: Complementary measures and computational methods. Transp. Res. Part Methodol. 2018, 114, 68–85. [Google Scholar] [CrossRef]
- Kim, S.; Choi, S.; Kim, C. The framework for measuring port resilience in Korean port case. Sustainability 2021, 13, 11883. [Google Scholar] [CrossRef]
- Cho, H.; Park, H. Constructing resilience model of port infrastructure based on system dynamics. Disaster Manag. 2017, 7, 245–254. [Google Scholar] [CrossRef] [Green Version]
- Tachaudomdach, S.; Upayokin, A.; Kronprasert, N.; Arunotayanun, K. Quantifying Road-Network Robustness toward Flood-Resilient Transportation Systems. Sustainability 2021, 13, 3172. [Google Scholar] [CrossRef]
- Sadler, J.M.; Haselden, N.; Mellon, K.; Hackel, A.; Son, V.; Mayfield, J.; Blase, A.; Goodall, J.L. Impact of sea-level rise on roadway flooding in the Hampton Roads region, Virginia. J. Infrastruct. Syst. 2017, 23, 05017006. [Google Scholar] [CrossRef] [Green Version]
- Scott, D.M.; Novak, D.C.; Aultman-Hall, L.; Guo, F. Network robustness index: A new method for identifying critical links and evaluating the performance of transportation networks. J. Transp. Geogr. 2006, 14, 215–227. [Google Scholar] [CrossRef]
- Jafino, B.A. An equity-based transport network criticality analysis. Transp. Res. Part Policy Pract. 2021, 144, 204–221. [Google Scholar] [CrossRef]
- Corley, H.W.; David, Y.S. Most vital links and nodes in weighted networks. Oper. Res. Lett. 1982, 1, 157–160. [Google Scholar] [CrossRef]
- Messner, S.; Moran, L.; Reub, G.; Campbell, J. Climate change and sea level rise impacts at ports and a consistent methodology to evaluate vulnerability and risk. WIT Trans. Ecol. Environ. 2013, 169, 141–153. [Google Scholar]
- Chang, S.E.; Nojima, N. Measuring post-disaster transportation system performance: The 1995 Kobe earthquake in comparative perspective. Transp. Res. Part A Policy Pract. 2001, 35, 475–494. [Google Scholar] [CrossRef]
- Peeta, S.; Salman, F.S.; Gunnec, D.; Viswanath, K. Pre-disaster investment decisions for strengthening a highway network. Comput. Oper. Res. 2010, 37, 1708–1719. [Google Scholar] [CrossRef]
- Chen, X.Z.; Lu, Q.C.; Peng, Z.R.; Ash, J.E. Analysis of transportation network vulnerability under flooding disasters. Transp. Res. Rec. 2015, 2532, 37–44. [Google Scholar] [CrossRef]
- Bhamidipati, S. Simulation framework for asset management in climate-change adaptation of transportation infrastructure. Transp. Res. Procedia 2015, 8, 17–28. [Google Scholar] [CrossRef] [Green Version]
- Noland, R.B.; Wang, S.; Kulp, S.; Strauss, B.H. Employment accessibility and rising seas. Transp. Res. Part Transp. Environ. 2019, 77, 560–572. [Google Scholar] [CrossRef]
- Kundzewicz, Z.W.; Mata, L.J.; Arnell, N.W.; Döll, P.; Jimenez, B.; Miller, K.; Oki, T.; Şen, Z.; Shiklomanov, I. The implications of projected climate change for freshwater resources and their management. Hydrol. Sci. J. 2008, 53, 3–10. [Google Scholar] [CrossRef]
- Hay, J.E.; Mimura, N. Sea-level rise: Implications for water resources management. Mitig. Adapt. Strateg. Glob. Chang. 2005, 10, 717–737. [Google Scholar] [CrossRef]
- Hashimoto, T.; Stedinger, J.R.; Loucks, D.P. Reliability, resiliency, and vulnerability criteria for water resource system performance evaluation. Water Resour. Res. 1982, 18, 14–20. [Google Scholar] [CrossRef] [Green Version]
- Rodina, L. Defining “water resilience”: Debates, concepts, approaches, and gaps. Wiley Interdiscip. Rev. Water 2019, 6, e1334. [Google Scholar] [CrossRef]
- Lobo-Ferreira, J.P.; Chachadi, A.G.; Diamantino, C.; Henriques, M.J. Assessing aquifer vulnerability to seawater intrusion using GALDIT Method. Part 1: Application to the Portuguese aquifer of Monte Gordo. In Proceedings of the 4th Inter Celtic Colloquium on Hydrology and Management of Water Resources, Guimaraes, Portugal, 11–13 July 2005. [Google Scholar]
- Werner, A.D.; Ward, J.D.; Morgan, L.K.; Simmons, C.T.; Robinson, N.I.; Teubner, M.D. Vulnerability indicators of sea water intrusion. Groundwater 2012, 50, 48–58. [Google Scholar] [CrossRef]
- Krol, M.S.; de Vries, M.J.; van Oel, P.R.; de Araújo, J.C. Sustainability of small reservoirs and large scale water availability under current conditions and climate change. Water Resour. Manag. 2011, 25, 3017–3026. [Google Scholar] [CrossRef] [Green Version]
- Eum, H.I.; Vasan, A.; Simonovic, S.P. Integrated reservoir management system for flood risk assessment under climate change. Water Resour. Manag. 2012, 26, 3785–3802. [Google Scholar] [CrossRef]
- Raje, D.; Mujumdar, P.P. Reservoir performance under uncertainty in hydrologic impacts of climate change. Adv. Water Resour. 2010, 33, 312–326. [Google Scholar] [CrossRef]
- Liu, D.; Chen, X.; Nakato, T. Resilience assessment of water resources system. Water Resour. Manag. 2012, 26, 3743–3755. [Google Scholar] [CrossRef]
- Agathokleous, A.; Christodoulou, C.; Christodoulou, S.E. Topological robustness and vulnerability assessment of water distribution networks. Water Resour. Manag. 2017, 31, 4007–4021. [Google Scholar] [CrossRef]
- Amarasinghe, P.; Liu, A.; Egodawatta, P.; Barnes, P.; McGree, J.; Goonetilleke, A. Quantitative assessment of resilience of a water supply system under rainfall reduction due to climate change. J. Hydrol. 2016, 540, 1043–1052. [Google Scholar] [CrossRef]
- Hsu, N.S.; Cheng, W.C.; Cheng, W.M.; Wei, C.C.; Yeh, W.W.G. Optimization and capacity expansion of a water distribution system. Adv. Water Resour. 2008, 31, 776–786. [Google Scholar] [CrossRef]
- Wright, R.; Herrera, M.; Parpas, P.; Stoianov, I. Hydraulic resilience index for the critical link analysis of multi-feed water distribution networks. Procedia Eng. 2015, 119, 1249–1258. [Google Scholar] [CrossRef] [Green Version]
- Mehran, A.; Mazdiyasni, O.; AghaKouchak, A. A hybrid framework for assessing socioeconomic drought: Linking climate variability, local resilience, and demand. J. Geophys. Res. Atmos. 2015, 120, 7520–7533. [Google Scholar] [CrossRef]
- Li, M.; Chen, Z.; Finlayson, B.; Wei, T.; Chen, J.; Wu, X.; Xu, H.; Webber, M.; Barnett, J.; Wang, M. Water diversion and sea-level rise: Potential threats to freshwater supplies in the Changjiang River estuary. Estuarine, Coast. Shelf Sci. 2015, 156, 52–60. [Google Scholar] [CrossRef]
- Ren, K.; Huang, S.; Huang, Q.; Wang, H.; Leng, G.; Fang, W.; Li, P. Assessing the reliability, resilience and vulnerability of water supply system under multiple uncertain sources. J. Clean. Prod. 2020, 252, 119806. [Google Scholar] [CrossRef]
- Maiolo, M.; Pantusa, D.; Carini, M.; Capano, G.; Chiaravalloti, F.; Procopio, A. A new vulnerability measure for water distribution network. Water 2018, 10, 1005. [Google Scholar] [CrossRef] [Green Version]
- Blumenau, A.; Brooks, C.; Finn, E.; Turner, A. Effects of Sea Level Rise on Water Treatment & Wastewater Treatment Facilities; Worcester Polytechnic Institute: Worcester, MA, USA, 2011. [Google Scholar]
- Balaei, B.; Wilkinson, S.; Potangaroa, R.; McFarlane, P. Investigating the technical dimension of water supply resilience to disasters. Sustain. Cities Soc. 2020, 56, 102077. [Google Scholar] [CrossRef]
- Wu, X.; Blockley, D.I.; Woodman, N.J. Vulnerability Analysis of Structural Systems, Part I: Rings and clusters, Civ. Eng. Syst. 1993, 10, 301–317. [Google Scholar]
- Pinto, J.; Varum, H.; Bentes, I.; Agarwal, J. A theory of vulnerability of water pipe network (TVWPN). Water Resour. Manag. 2010, 24, 4237–4254. [Google Scholar] [CrossRef]
- Archetti, F.; Candelieri, A.; Soldi, D. Network analysis for resilience evaluation in water distribution networks. Environ. Eng. Manag. J. 2015, 14, 1261–1270. [Google Scholar]
- Yazdani, A.; Otoo, R.A.; Jeffrey, P. Resilience enhancing expansion strategies for water distribution systems: A network theory approach. Environ. Model. Softw. 2011, 26, 1574–1582. [Google Scholar] [CrossRef]
- Todini, E. Looped water distribution networks design using a resilience index based heuristic approach. Urban Water 2000, 2, 115–122. [Google Scholar] [CrossRef]
- Creaco, E.; Fortunato, A.; Franchini, M.; Mazzola, M.R. Water distribution network robust design based on energy surplus index maximization. Water Sci. Technol. Water Supply 2015, 15, 1253–1258. [Google Scholar] [CrossRef]
- Prasad, T.D.; Park, N.S. Multiobjective genetic algorithms for design of water distribution networks. J. Water Resour. Plan. Manag. 2004, 130, 73–82. [Google Scholar] [CrossRef]
- Friedrich, E.; Kretzinger, D. Vulnerability of wastewater infrastructure of coastal cities to sea level rise: A South African case study. Water Sa 2012, 38, 755–764. [Google Scholar] [CrossRef] [Green Version]
- Cao, A.; Esteban, M.; Mino, T. Adapting wastewater treatment plants to sea level rise: Learning from land subsidence in Tohoku, Japan. Nat. Hazards 2020, 103, 885–902. [Google Scholar] [CrossRef]
- Chughtai, F.; Zayed, T. Infrastructure condition prediction models for sustainable sewer pipelines. J. Perform. Constr. Facil. 2008, 22, 333–341. [Google Scholar] [CrossRef]
- Amer, L.; Erkoc, M.; Celik, N.; Andiroglu, E. Operationalizing Resilience: A Deductive Fault-Driven Resilience Index for Managing Adaptation; Working Paper; University of Miami: Coral Gables, FL, USA, 2023; Available online: https://img1.wsimg.com/blobby/go/012b1713-6ea8-48a0-a6f5-63c9fa78e8d7/downloads/Resilience_Metric_OSTDS.pdf?ver=1682739052788 (accessed on 1 June 2023).
- Hoghooghi, N.; Pippin, J.S.; Meyer, B.K.; Hodges, J.B.; Bledsoe, B.P. Frontiers in assessing septic systems vulnerability in coastal Georgia, USA: Modeling approach and management implications. PLoS ONE 2021, 16, e0256606. [Google Scholar] [CrossRef] [PubMed]
- Karamouz, M.; Rasoulnia, E.; Zahmatkesh, Z.; Olyaei, M.A.; Baghvand, A. Uncertainty-based flood resiliency evaluation of wastewater treatment plants. J. Hydroinform. 2016, 18, 990–1006. [Google Scholar] [CrossRef]
- Zhang, C.; Wang, Y.; Li, Y.; Ding, W. Vulnerability analysis of urban drainage systems: Tree vs. loop Networks. Sustainability 2017, 9, 397. [Google Scholar] [CrossRef] [Green Version]
- Poulter, B.; Goodall, J.L.; Halpin, P.N. Applications of network analysis for adaptive management of artificial drainage systems in landscapes vulnerable to sea level rise. J. Hydrol. 2008, 357, 207–217. [Google Scholar] [CrossRef]
- Zimmerman, R.; Faris, C. Infrastructure impacts and adaptation challenges. Ann. New York Acad. Sci. 2010, 1196, 63–86. [Google Scholar] [CrossRef]
- Schaeffer, R.; Szklo, A.S.; de Lucena, A.F.P.; Borba, B.S.M.C.; Nogueira, L.P.P.; Fleming, F.P.; Troccoli, A.; Harrison, M.; Boulahya, M.S. Energy sector vulnerability to climate change: A review. Energy 2012, 38, 1–12. [Google Scholar] [CrossRef]
- Sharifi, A.; Yamagata, Y. Principles and criteria for assessing urban energy resilience: A literature review. Renew. Sustain. Energy Rev. 2016, 60, 1654–1677. [Google Scholar] [CrossRef] [Green Version]
- Bierkandt, R.; Auffhammer, M.; Levermann, A. US power plant sites at risk of future sea-level rise. Environ. Res. Lett. 2015, 10, 124022. [Google Scholar] [CrossRef]
- Brown, S.; Hanson, S.; Nicholls, R.J. Implications of sea-level rise and extreme events around Europe: A review of coastal energy infrastructure. Clim. Chang. 2014, 122, 81–95. [Google Scholar] [CrossRef]
- FEMA. Multi-Hazard Loss Estimation Methodology: Flood Model, HAZUS-MH MR4, Technical Manual; FEMA, Mitig Div: Washington, DC, USA, 2009. [Google Scholar]
- Shirazi, Y.A.; Carr, E.W.; Parsons, G.R.; Hoagland, P.; Ralston, D.K.; Chen, J. Increased operational costs of electricity generation in the Delaware River and Estuary from salinity increases due to sea-level rise and a deepened channel. J. Environ. Manag. 2019, 244, 228–234. [Google Scholar] [CrossRef]
- Shafieezadeh, A.; Onyewuchi, U.P.; Begovic, M.M.; DesRoches, R. Age-dependent fragility models of utility wood poles in power distribution networks against extreme wind hazards. IEEE Trans. Power Deliv. 2013, 29, 131–139. [Google Scholar] [CrossRef]
- Kruyt, B.; Vuuren, D.P.V.; de Vries, H.J.; Groenenberg, H. Indicators for energy security. Energy Policy 2009, 37, 2166–2181. [Google Scholar] [CrossRef]
- Stirling, A. Multicriteria diversity analysis: A novel heuristic framework for appraising energy portfolios. Energy Policy 2010, 38, 1622–1634. [Google Scholar] [CrossRef]
- Panteli, M.; Mancarella, P.; Trakas, D.N.; Kyriakides, E.; Hatziargyriou, N.D. Metrics and quantification of operational and infrastructure resilience in power systems. IEEE Trans. Power Syst. 2017, 32, 4732–4742. [Google Scholar] [CrossRef] [Green Version]
- Chaudry, M.; Ekins, P.; Ramachandran, K.; Shakoor, A.; Skea, J.; Strbac, G.; Wang, X.; Whitaker, J. Building a Resilient UK Energy System; Energy Research Centre: London, UK, 2011. [Google Scholar]
- Molyneaux, L.; Wagner, L.; Froome, C.; Foster, J. Resilience and electricity systems: A comparative analysis. Energy Policy 2012, 47, 188–201. [Google Scholar] [CrossRef]
- Roege, P.E.; Collier, Z.A.; Mancillas, J.; McDonagh, J.A.; Linkov, I. Metrics for energy resilience. Energy Policy 2014, 72, 249–256. [Google Scholar] [CrossRef]
- Gupta, E. Oil vulnerability index of oil-importing countries. Energy Policy 2008, 36, 1195–1211. [Google Scholar] [CrossRef]
- Dewenter, T.; Hartmann, A.K. Large-deviation properties of resilience of power grids. New J. Phys. 2015, 17, 015005. [Google Scholar] [CrossRef]
- Watts, D.J.; Strogatz, S.H. Collective dynamics of ‘small-world’networks. Nature 1998, 393, 440–442. [Google Scholar] [CrossRef] [PubMed]
- Bai, H.; Miao, S. Hybrid flow betweenness approach for identification of vulnerable line in power system. IET Gener. Transm. Distrib. 2015, 9, 1324–1331. [Google Scholar] [CrossRef]
- Pepyne, D.L. Topology and cascading line outages in power grids. J. Syst. Sci. Syst. Eng. 2007, 16, 202–221. [Google Scholar] [CrossRef]
- Fang, J.; Su, C.; Chen, Z.; Sun, H.; Lund, P. Power system structural vulnerability assessment based on an improved maximum flow approach. IEEE Trans. Smart Grid 2016, 9, 777–785. [Google Scholar] [CrossRef]
- Cuadra, L.; Salcedo-Sanz, S.; Ser, J.D.; Jiménez-Fernández, S.; Geem, Z.W. A critical review of robustness in power grids using complex networks concepts. Energies 2015, 8, 9211–9265. [Google Scholar] [CrossRef] [Green Version]
- Koc, Y.; Warnier, M.; Kooij, R.; Brazier, F. Structural vulnerability assessment of electric power grids. In Proceedings of the 11th IEEE International Conference on Networking, Sensing and Control, Miami, FL, USA, 7–9 April 2014; pp. 386–391. [Google Scholar]
- Panteli, M.; Mancarella, P. Influence of extreme weather and climate change on the resilience of power systems: Impacts and possible mitigation strategies. Electr. Power Syst. Res. 2015, 127, 259–270. [Google Scholar] [CrossRef]
- Wenli, F.; Zhigang, L.; Ping, H.; Shengwei, M. Cascading failure model in power grids using the complex network theory. IET Gener. Transm. Distrib. 2016, 10, 3940–3949. [Google Scholar] [CrossRef]
- Gasser, P.; Suter, J.; Cinelli, M.; Spada, M.; Burgherr, P.; Hirschberg, S.; Kadziński, M.; Stojadinović, B. Comprehensive resilience assessment of electricity supply security for 140 countries. Ecol. Indic. 2020, 110, 105731. [Google Scholar] [CrossRef]
- Challinor, A.J.; Watson, J.; Lobell, D.B.; Howden, S.M.; Smith, D.R.; Chhetri, N. A meta-analysis of crop yield under climate change and adaptation. Nat. Clim. Chang. 2014, 4, 287–291. [Google Scholar] [CrossRef] [Green Version]
- Mall, R.K.; Gupta, A.; Sonkar, G. Effect of climate change on agricultural crops. In Current Developments in Biotechnology and Bioengineering; Elsevier: Amsterdam, The Netherlands, 2017; pp. 23–46. [Google Scholar]
- Manik, S.M.; Pengilley, G.; Dean, G.; Field, B.; Shabala, S.; Zhou, M. Soil and crop management practices to minimize the impact of waterlogging on crop productivity. Front. Plant Sci. 2019, 10, 140. [Google Scholar] [CrossRef] [Green Version]
- Chen, X.; Zong, Y. Major impacts of sea-level rise on agriculture in the Yangtze delta area around Shanghai. Appl. Geogr. 1999, 19, 69–84. [Google Scholar] [CrossRef]
- Thuy, N.N.; Anh, H.H. Vulnerability of rice production in Mekong River Delta under impacts from floods, salinity and climate change. Int. J. Adv. Sci. Eng. Inf. Technol. 2015, 5, 272–279. [Google Scholar] [CrossRef]
- Asseng, S.; Zhu, Y.; Basso, B.; Wilson, T.; Cammarano, D. Simulation Modeling: Applications in Cropping Systems; Elsevier: Amsterdam, The Netherlands, 2014. [Google Scholar]
- Rial-Lovera, K.; Davies, W.P.; Cannon, N.D. Implications of climate change predictions for UK cropping and prospects for possible mitigation: A review of challenges and potential responses. J. Sci. Food Agric. 2017, 97, 17–32. [Google Scholar] [CrossRef]
- Rossato, L.; Alvalá, R.C.; Marengo, J.A.; Zeri, M.; Cunha, A.P.; Pires, L.; Barbosa, H.A. Impact of soil moisture on crop yields over Brazilian semiarid. Front. Environ. Sci. 2017, 5, 73. [Google Scholar] [CrossRef] [Green Version]
- Thilakarathne, M.; Sridhar, V. Characterization of future drought conditions in the Lower Mekong River Basin. Weather. Clim. Extrem. 2017, 17, 47–58. [Google Scholar] [CrossRef]
- Chifflard, P.; Kranl, J.; zur Strassen, G.; Zepp, H. The significance of soil moisture in forecasting characteristics of flood events. A statistical analysis in two nested catchments. J. Hydrol. Hydromechanics 2018, 66, 1. [Google Scholar] [CrossRef] [Green Version]
- Champagne, C.; White, J.; Berg, A.; Belair, S.; Carrera, M. Impact of soil moisture data characteristics on the sensitivity to crop yields under drought and excess moisture conditions. Remote Sens. 2019, 11, 372. [Google Scholar] [CrossRef] [Green Version]
- Kahlown, M.A.; Azam, M. Individual and combined effect of waterlogging and salinity on crop yields in the Indus basin. Irrig. Drain. J. Int. Comm. Irrig. Drain. 2002, 51, 329–338. [Google Scholar] [CrossRef]
- Hanks, R.J.; Ashcroft, G.L.; Rasmussen, V.P.; Wilson, G.D. Corn production as influenced by irrigation and salinity—Utah studies. Irrig. Sci. 1978, 1, 47–59. [Google Scholar] [CrossRef]
- Maas, E.V.; Hoffman, G.J. Crop salt tolerance—Current assessment. J. Irrig. Drain. Div. 1977, 103, 115–134. [Google Scholar] [CrossRef]
- Antle, J.M.; Capalbo, S.M.; Elliott, E.T.; Paustian, K.H. Adaptation, spatial heterogeneity, and the vulnerability of agricultural systems to climate change and CO2 fertilization: An integrated assessment approach. Clim. Chang. 2004, 64, 289–315. [Google Scholar] [CrossRef]
- Hély, V.; Antoni, J.P. Combining indicators for decision making in planning issues: A theoretical approach to perform sustainability assessment. Sustain. Cities Soc. 2019, 44, 844–854. [Google Scholar] [CrossRef]
- Renschler, C.S.; Frazier, A.E.; Arendt, L.A.; Cimellaro, G.P.; Reinhorn, A.M.; Bruneau, M. A Framework for Defining and Measuring Resilience at the Community Scale: The PEOPLES Resilience Framework; MCEER: Buffalo, NY, USA, 2010. [Google Scholar]
- Kotzee, I.; Reyers, B. Piloting a social-ecological index for measuring flood resilience: A composite index approach. Ecol. Indic. 2016, 60, 45–53. [Google Scholar] [CrossRef]
- Li, T.; Zhang, H.; Yuan, C.; Liu, Z.; Fan, C. A PCA-based method for construction of composite sustainability indicators. Int. J. Life Cycle Assess. 2012, 17, 593–603. [Google Scholar] [CrossRef]
- Tonmoy, F.N.; El-Zein, A. Safety, Reliability and Risk Analysis: Beyond the Horizon; Chapter Vulnerability of Infrastructure to Sea Level Rise: A Combined Outranking and System-Dynamics Approach; Tayor & Francis Group: Abingdon, UK, 2014; pp. 2407–2414. [Google Scholar]
- Rinaldi, M.; He, Z. Decision support systems to manage irrigation in agriculture. Adv. Agron. 2014, 123, 229–279. [Google Scholar]
- Snoussi, M.; Ouchani, T.; Khouakhi, A.; Niang-Diop, I. Impacts of sea-level rise on the Moroccan coastal zone: Quantifying coastal erosion and flooding in the Tangier Bay. Geomorphology 2009, 107, 32–40. [Google Scholar] [CrossRef]
- Ciscar, J.C.; Dowling, P. Integrated assessment of climate impacts and adaptation in the energy sector. Energy Econ. 2014, 46, 531–538. [Google Scholar] [CrossRef]
- Eijgenraam, C.; Kind, J.; Bak, C.; Brekelmans, R.; den Hertog, D.; Duits, M.; Roos, K.; Vermeer, P.; Kuijken, W. Economically efficient standards to protect the Netherlands against flooding. Interfaces 2014, 44, 7–21. [Google Scholar] [CrossRef] [Green Version]
- Garner, G.G.; Keller, K. Using direct policy search to identify robust strategies in adapting to uncertain sea-level rise and storm surge. Environ. Model. Softw. 2018, 107, 96–104. [Google Scholar] [CrossRef] [Green Version]
- Sellberg, M.M.; Ryan, P.; Borgström, S.; Norström, A.V.; Peterson, G.D. From resilience thinking to Resilience Planning: Lessons from practice. J. Environ. Manag. 2018, 217, 906–918. [Google Scholar] [CrossRef] [PubMed]
- Tariq, H.; Pathirage, C.; Fernando, T. Measuring community disaster resilience at local levels: An adaptable resilience framework. Int. J. Disaster Risk Reduct. 2021, 62, 102358. [Google Scholar] [CrossRef]


| Resilience-Critical Indicators | |||||||||
|---|---|---|---|---|---|---|---|---|---|
| Resistive | Adaptive | ||||||||
| Ref. | Risk Type | Age/Condition | Drainage Capability | Protection Measures | Connectivity | Accessibility | Redundancy | Criticality | Recovery |
| [47] | CF | ✓ | ✓ | ||||||
| [45] | CF | ✓ | ✓ | ✓ | |||||
| [44] | CF | ✓ | ✓ | ||||||
| [46] | CF | ✓ | ✓ | ||||||
| [61] | CF | ✓ | ✓ | ✓ | ✓ | ||||
| [78] | CF | ✓ | |||||||
| [79] | CF | ✓ | ✓ | ||||||
| [50] | CF | ✓ | ✓ | ||||||
| [55] | CF | ✓ | |||||||
| [49] | CF | ✓ | |||||||
| [71] | CF | ✓ | |||||||
| [54] | CF | ✓ | ✓ | ||||||
| [62] | CF | ✓ | |||||||
| [48] | IF | ✓ | |||||||
| [53] | CF | ✓ | ✓ | ||||||
| [80] | CF | ✓ | |||||||
| [70] | CF | ✓ | ✓ | ||||||
| Resilience-Critical Indicators | |||||||||||
|---|---|---|---|---|---|---|---|---|---|---|---|
| Resistive | Adaptive | ||||||||||
| Ref. | Risk Type 1 | System Component | Age/Condition | Reservoirs Robustness | Supply Robustness | Hydrological Response | Connectivity | Reliability | Redundancy | Criticality | Recovery |
| [95] | WS | S | ✓ | ✓ | ✓ | ||||||
| [99] | WS | S/D | ✓ | ✓ | ✓ | ||||||
| [90] | CF | S | ✓ | ✓ | ✓ | ✓ | |||||
| [92] | WS | S | ✓ | ||||||||
| [105] | CF | S | ✓ | ||||||||
| [107] | Generic | D | ✓ | ✓ | |||||||
| [98] | Generic | D | ✓ | ✓ | |||||||
| [91] | Generic | D | ✓ | ✓ | ✓ | ||||||
| [94] | Generic | D | ✓ | ✓ | ✓ | ||||||
| [104] | Generic | D | ✓ | ✓ | ✓ | ||||||
| [103] | Generic | D | ✓ | ✓ | ✓ | ||||||
| [85] | SWI | S | ✓ | ||||||||
| [39] | SWI | S | ✓ | ||||||||
| [96] | SWI | S | ✓ | ||||||||
| [97] | Generic | S | ✓ | ||||||||
| [87] | Generic | S | ✓ | ||||||||
| [88] | CF | S | ✓ | ||||||||
| [102] | Generic | D | ✓ | ✓ | ✓ | ||||||
| Resilience-Critical Indicators | ||||||||||
|---|---|---|---|---|---|---|---|---|---|---|
| Resistive | Adaptive | |||||||||
| Ref. | Risk Type 1 | System Component | Age/Condition | Robustness of Collection System | Robustness of Treatment System | Protection Measures | Connectivity | Redundancy | Criticality | Recovery |
| [110] | Generic | C | ✓ | |||||||
| [99] | CF | C/T | ✓ | ✓ | ✓ | ✓ | ||||
| [108] | CF/IF | C/T | ✓ | ✓ | ✓ | |||||
| [113] | CF | T | ✓ | ✓ | ✓ | ✓ | ✓ | |||
| [21] | CF/IF | T | ✓ | ✓ | ✓ | ✓ | ||||
| [109] | CF/IF/SWI | T | ✓ | |||||||
| [111] | CF/IF | OSTDS | ✓ | ✓ | N/A. | N/A. | ✓ | ✓ | ✓ | |
| Resilience-Critical Indicators | |||||||||||
|---|---|---|---|---|---|---|---|---|---|---|---|
| Resistive | Adaptive | ||||||||||
| Ref. | Risk Type 1 | System Component | Age/Condition | Robustness of Supply | Robustness of Transmission | Protection Measures | Diversion in Supply/Generation | Reliability | Redundancy | Criticality | Recovery |
| [134] | Generic | T | ✓ | ||||||||
| [130] | Generic | S | ✓ | ✓ | |||||||
| [121] | CF | S/T | ✓ | ||||||||
| [102] | Generic | S | ✓ | ||||||||
| [127] | Generic | S | ✓ | ||||||||
| [128] | Generic | S | ✓ | ✓ | |||||||
| [123] | W | T | ✓ | ✓ | |||||||
| [129] | Generic | S | ✓ | ||||||||
| [131] | Generic | T | ✓ | ||||||||
| [119] | CF | S | ✓ | ||||||||
| [133] | Generic | T | ✓ | ✓ | |||||||
| [135] | Generic | T | ✓ | ||||||||
| [139] | Generic | T | ✓ | ✓ | |||||||
| [118] | Generic | T | ✓ | ✓ | |||||||
| [126] | Generic | S/T | ✓ | ✓ | |||||||
| [122] | SWI | S | |||||||||
| [140] | Generic | S/T | ✓ | ✓ | ✓ | ✓ | ✓ | ✓ | |||
| Resilience-Critical Indicators | |||||||||
|---|---|---|---|---|---|---|---|---|---|
| Resistive | Adaptive | ||||||||
| Crop Tolerance to Excess Water | |||||||||
| Ref. | Risk Type 1 | Depth to Groundwater | Soil Conditions | Drainage Capacity/Efficiency | Protection Measures | Crop Tolerance to Excess Salinity | Resources Endowments | Criticality | Recovery |
| [144] | CF/IF/SWI/SE | ✓ | ✓ | ✓ | ✓ | ||||
| [148] | Generic | ✓ | |||||||
| [150] | CF/IF | ✓ | |||||||
| [151] | PT | ✓ | |||||||
| [145] | CF/IF/SWI/SE | ✓ | ✓ | ✓ | |||||
| [152] | CF/SWI | ✓ | ✓ | ✓ | |||||
| [155] | Generic | ✓ | ✓ | ✓ | |||||
| [153] | SWI | ✓ | |||||||
| [149] | Generic | ✓ | |||||||
Disclaimer/Publisher’s Note: The statements, opinions and data contained in all publications are solely those of the individual author(s) and contributor(s) and not of MDPI and/or the editor(s). MDPI and/or the editor(s) disclaim responsibility for any injury to people or property resulting from any ideas, methods, instructions or products referred to in the content. |
© 2023 by the authors. Licensee MDPI, Basel, Switzerland. This article is an open access article distributed under the terms and conditions of the Creative Commons Attribution (CC BY) license (https://creativecommons.org/licenses/by/4.0/).
Share and Cite
Amer, L.; Erkoc, M.; Feagin, R.A.; Kameshwar, S.; Mach, K.J.; Mitsova, D. Measuring Resilience to Sea-Level Rise for Critical Infrastructure Systems: Leveraging Leading Indicators. J. Mar. Sci. Eng. 2023, 11, 1421. https://doi.org/10.3390/jmse11071421
Amer L, Erkoc M, Feagin RA, Kameshwar S, Mach KJ, Mitsova D. Measuring Resilience to Sea-Level Rise for Critical Infrastructure Systems: Leveraging Leading Indicators. Journal of Marine Science and Engineering. 2023; 11(7):1421. https://doi.org/10.3390/jmse11071421
Chicago/Turabian StyleAmer, Lamis, Murat Erkoc, Rusty A. Feagin, Sabarethinam Kameshwar, Katharine J. Mach, and Diana Mitsova. 2023. "Measuring Resilience to Sea-Level Rise for Critical Infrastructure Systems: Leveraging Leading Indicators" Journal of Marine Science and Engineering 11, no. 7: 1421. https://doi.org/10.3390/jmse11071421