1. Introduction
Extreme sea level (ESL) flooding is a significant threat to low-lying coastal areas that can result in direct and indirect impacts on communities and their underlying critical infrastructure. The risk is further exacerbated with long-term stressors including sea-level rise (SLR) and vertical land movement (VLM) [
1,
2,
3,
4]. With the increase in severity and frequency of ESL events in the future, the coastal protection, investment planning and resilience for coastal communities is of upmost importance. Critical infrastructures (CI) are vital to the functioning of these coastal communities. Without underlying services such as energy, power, telecommunication, transport and water, the communities’ quality of life is severely impacted.
In the past, these CI systems would provide their services independently. However, they are becoming increasingly complex and reliant on each other for regular operation. For example, with the increasing number of smart monitoring systems, telecommunication and power infrastructures are required for the normal operation of many control systems [
5]. These links are known as interdependencies. Formally defined, a dependency refers to the unidirectional relationship and interdependency indicates the bidirectional interaction between two independent CIs [
6]. Interdependencies can be physical, cyber, and geographic in nature, leading to coupling between two CIs. While studies traditionally look at the effect of ESL on individual infrastructure networks (such as water [
7] and transport [
8] networks) independently, there is a move to looking at these networks as a whole.
When considering these dependencies within and between CI systems, these outages can extend beyond the original hazard extent. A localised earthquake or flood can cause cascading failures throughout an entire infrastructure system [
9,
10]. Cascades can propagate in severity and magnitude to bring down vast swaths of services in a region from a singular failure point. While there have been studies that consider interdependencies that focus on other hazards such as earthquakes and typhoons, less have investigated the impact of ESL on multiple critical infrastructure systems, considering interdependencies at a local level.
This study offers a demonstration of the incorporation of an interdependency model and combines it with an ESL infrastructure risk assessment to gain a holistic view of the direct and indirect loss of critical utilities to coastal communities. It addresses a research gap in the practical application of quantifying infrastructure impacts to local communities with respect to ESL flooding. This is achieved by incorporating a “network-of-networks” interdependency model into the risk assessment workflow. The resulting model is built such that it is hazard agnostic and flexible for different site locations and varying types of infrastructures assessed. In the remainder of the paper, we first present our methodology for quantifying the direct and indirect impact on a coastal community. This is then applied to a case study of South Dunedin, New Zealand, quantifying the vulnerability of electricity, telecommunication, road, water supply, and wastewater infrastructure to service disruptions from coastal flooding. Finally, we review the results, their ability to be used in decision-making, and the applicability of the modelling approach for assessing the impacts of ESL.
2. Materials and Methods
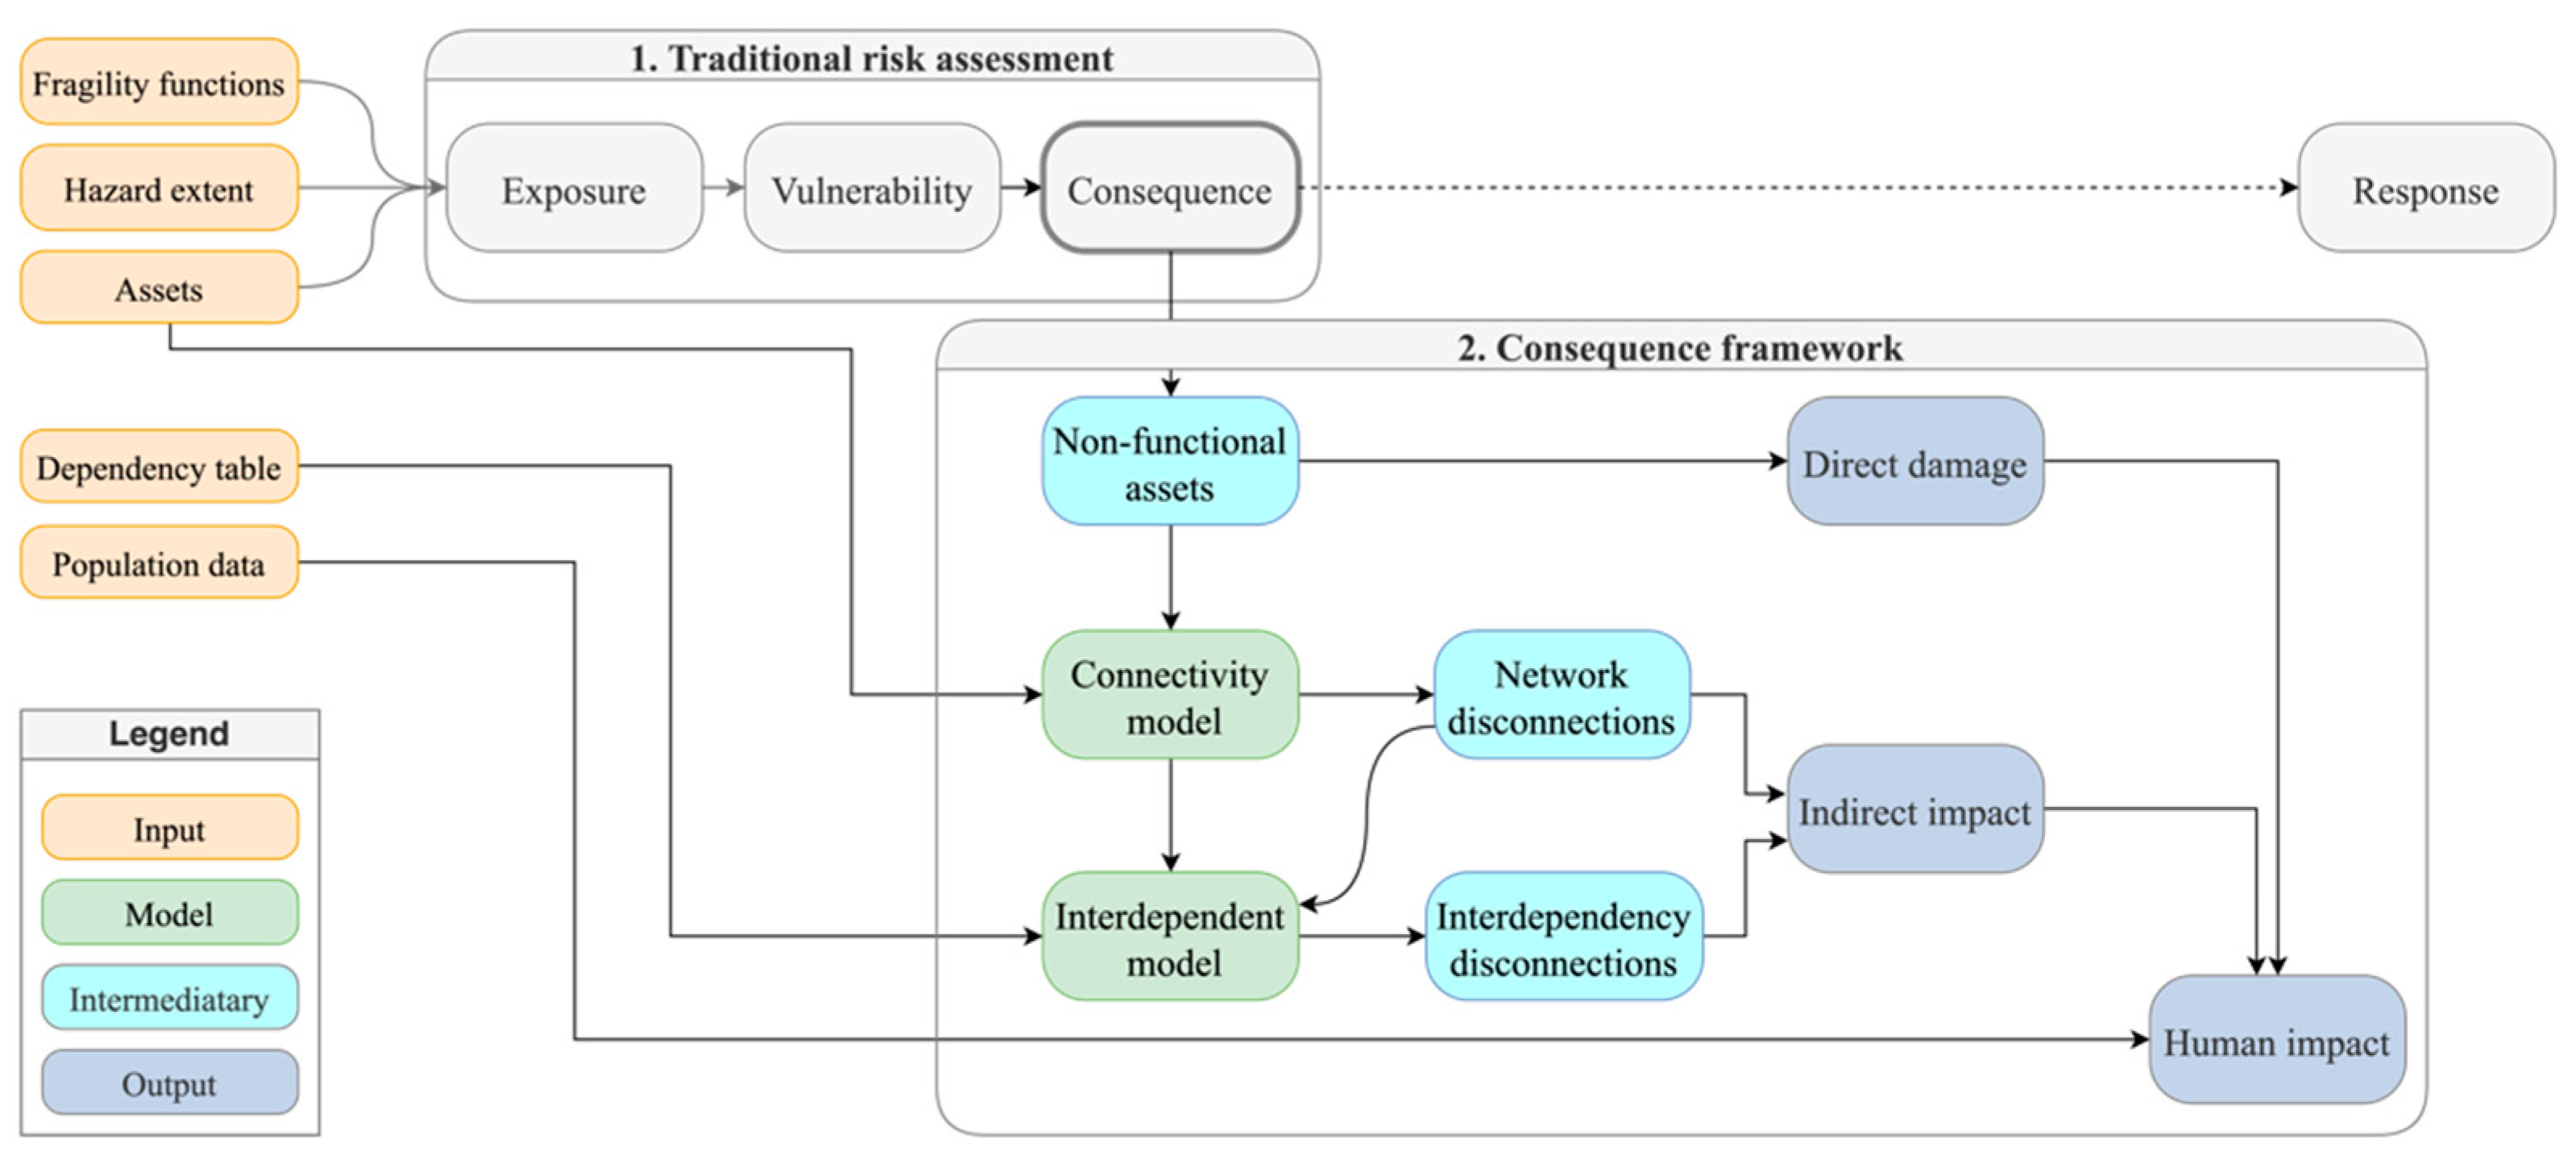
Figure 1 provides an overview of a general risk assessment framework adapted for our later case study input and output requirements (
Section 3). The goal of the framework is to quantify the disruption of infrastructure interdependencies in terms of impact to the community.
2.1. Risk Assessment
First, a traditional exposure and vulnerability assessment takes all component asset data and hazard scenarios to give the non-functional and directly damaged assets as output (as grouped in box 1 of
Figure 1). A hazard scenario is calculated as a spatial extent, and the assets are partitioned into component points, lines, and polygons. In an exposure assessment, the hazard extent is intersected geospatially with the assets. This identifies which assets are located within the hazard zone and may therefore be at risk of being impacted by the hazard. Once the assets at risk have been identified, vulnerability assessments are performed to estimate the probability of damage or failure of each asset given the intensity of the hazard. This is achieved by applying fragility or vulnerability functions to assets, which are either experimentally or empirically developed probability distributions for a specific damage state (light, moderate, severe, collapse, and no damage) given the intensity of a hazard. By sampling from the probability distribution multiple times, the likely damage state of a component can be estimated, and the consequences of the damage can then be evaluated through different lenses, such as physical, functional, social, and economic loss as a result of the failure of a particular infrastructure asset.
2.2. Consequence Framework
In a typical risk assessment, only direct impacts of the hazard need to be considered (i.e., box 1 of
Figure 1) [
11]. However, when evaluating critical infrastructure functionality, the indirect impacts also need to be factored in [
9]. The indirect impacts can be classified as two types: (1) network disconnections that occur within an infrastructure network, and (2) disruptions caused by the interdependent interactions with other critical infrastructure networks. The steps to quantify these are shown in the consequence framework (box 2 of
Figure 1), where each critical infrastructure network is converted into a network graph or connectivity model by using topology to form the connectivity model, and interdependent links are created between asset components across infrastructure networks. This follows the general approach used widely across the literature [
9,
10,
12,
13].
There are examples of existing tools that allow the modelling of these indirect impacts, such as DOMINO [
14] and IN-CORE [
15]. We have identified the need to create a framework to add to this, because other tools are not always fit-for-purpose. Other implementations are also mostly limited to the interactions between two to three different critical infrastructure networks. The aim of the development of this framework is to represent both direct and indirect impacts for different critical infrastructure assets and networks. The proposed framework includes two components to capture these effects: a connectivity model that captures intra-network disruptions, and an interdependent model that captures complex inter-network interactions. The details of these components are further elaborated in the following sections.
2.2.1. Connectivity Model
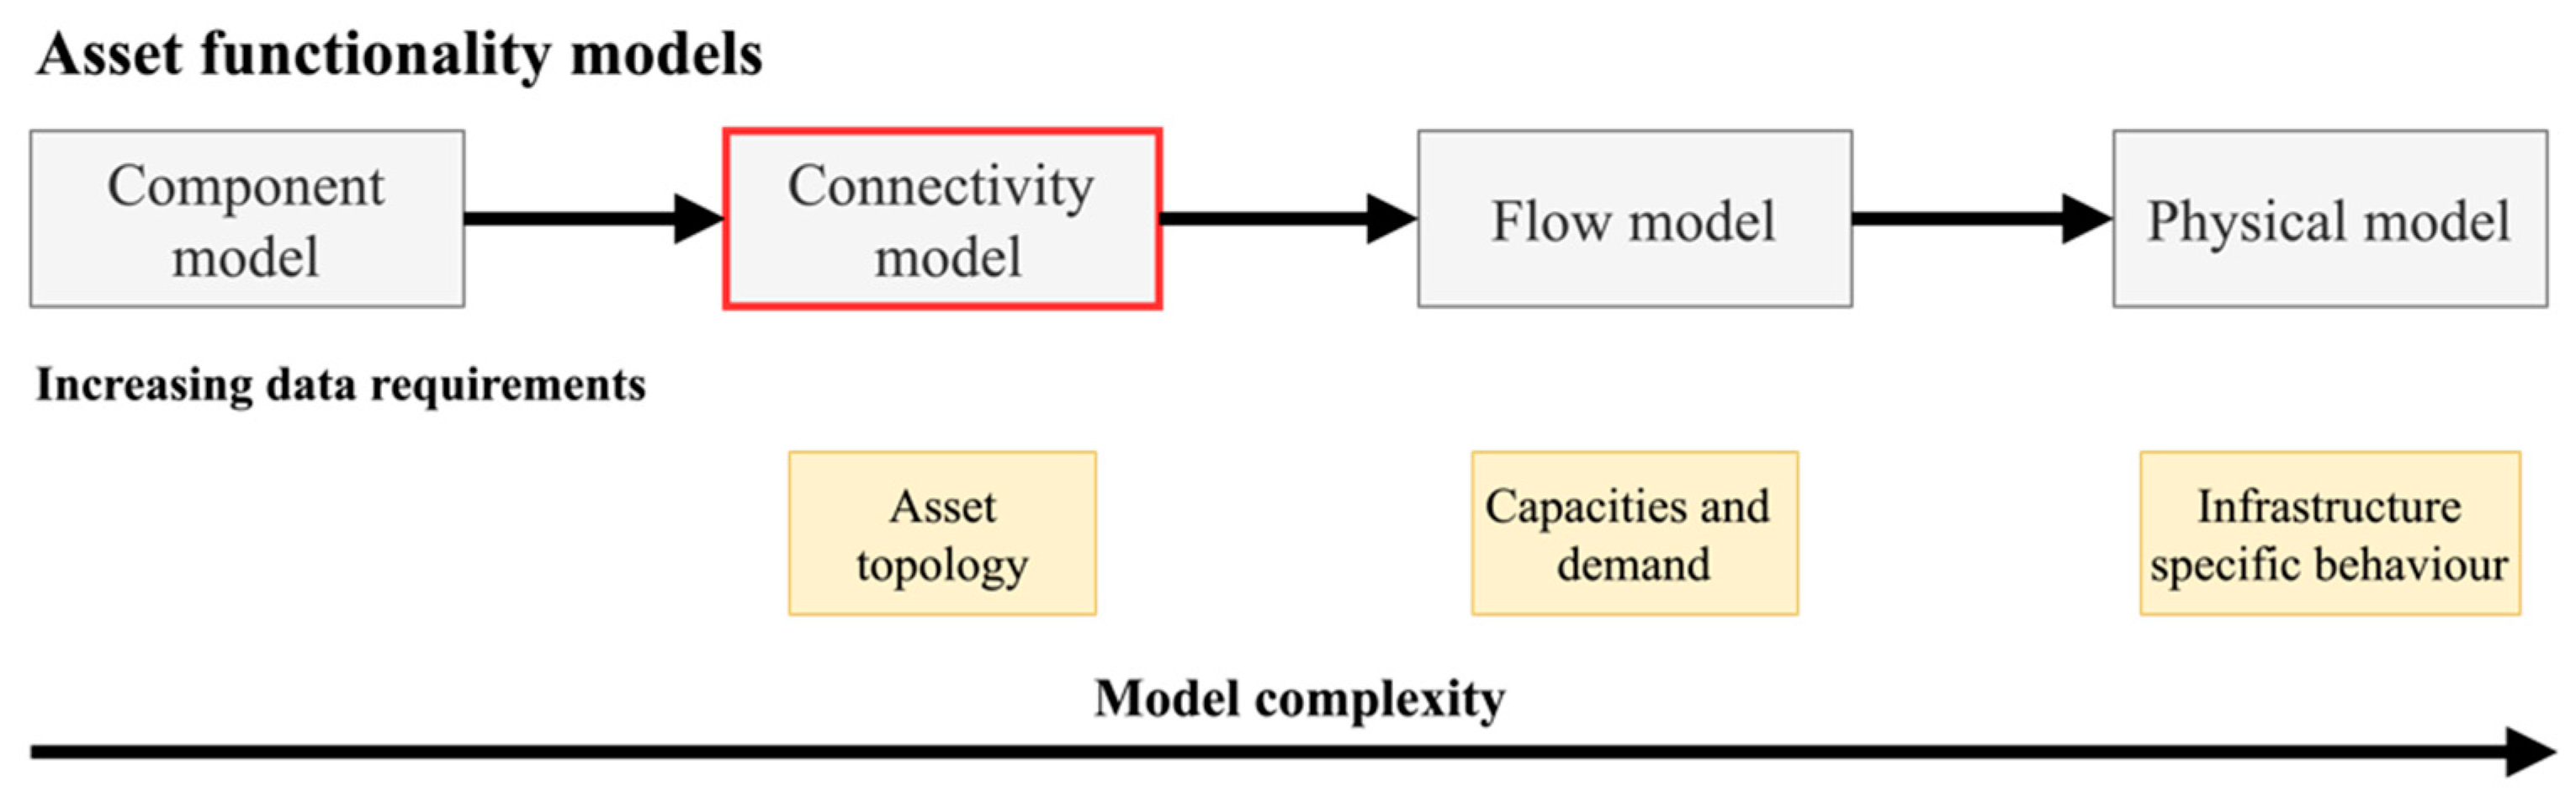
The most intuitive method for representing infrastructure network functionality and capturing how direct impacts propagate through a network, is to create a network graph using graph theory. Infrastructure asset components can be represented as networks of nodes (points) which are interconnected with edges (lines). A network graph can be directed, undirected, and multi-graphed (allowing for parallel edges connecting two nodes). Along with this, there are additional model formulations of networks which can be implemented with additional data, such as capacities and demands of assets to create flow networks. For critical infrastructure networks, a functionality network analysis can be broadly split to three main levels of analysis, with each level requiring an increasing amount of data to characterise the network. This is summarised in
Figure 2.
We start with a basic non-connected component model, which is useful for conducting the loss modelling of buildings and structures. Each infrastructure component is intersected with a potential hazard to understand the exposure. In this analysis, the connectivity between components is not taken into consideration.
In the second level, a connectivity model is created, where the components are converted into a network graph consisting of nodes and edges as discussed previously. Geospatially adjacent assets are linked together to form a network. The connectivity of components can be calculated, where connectivity is defined if a path of edges exists between two nodes.
Flow models are an extension of the connectivity model, where the capacities and loads of components are incorporated into the model. This can allow for more insight into potential overloading effects within the network that can trigger cascading failures because of a lack of network capacity.
Finally, physical flow models are the most complex network model, which add physics-based equations to simulate the physical behaviour of the infrastructure network. When using topology models, a contagion-based failure model is usually assumed, where the failure of one node is propagated to its adjacent nodes. However, most systems do not cascade in a localised fashion. For example, when power network components fail, the redistribution of power follows electrical physical laws (Ohm’s Law, Kirchhoff’s law), which results in the non-local spread of component failures. This allows the simulation of complex intra-network cascade mechanisms including voltage collapse and cascading overloads [
16,
17].
While there are domain-specific tools to create physical flow models for each infrastructure network and provide an accurate representation of critical nodes and their failure modes [
5], the disadvantages are that they are computationally expensive, especially if the network is large, or when multiple different CIs are modelled simultaneously. Physical flow models also require potentially sensitive infrastructure data and expert domain and specific system knowledge to implement the simulation.
Capacity and demand information can also be difficult to obtain because of the sensitivity of infrastructure data in some countries and sectors. Due to this, a connectivity model was chosen and used to model each infrastructure network within this framework.
2.2.2. Cross-Infrastructure Dependencies
To model the interdependencies between infrastructure networks, several methods can be used, including agent-based models, economic models and complex network theory [
18]. Of the four different classes of interdependencies identified by Rinaldi [
6], only geographic and physical interdependencies will be modelled using complex network theory. These dependency relationships are modelled using a dependency table, which maps the relationship between two asset types across different critical infrastructure networks as a dependency.
2.2.3. Human Consequences
In this assessment of human or societal impact, two key steps are undertaken. Firstly, the population is assigned to the respective area, which can be accomplished by utilising census data or by distributing the population to individual dwellings for more precise estimation. Then, for each damage scenario, damaged nodes and edges can be removed from the network graph to represent a non-functional asset, and a connectivity analysis is performed to return the indirect impact via network disconnections. Both types of impact are summarised in terms of human impact by using this population data supplemented with data from other domains, such as population demographics and socioeconomic deprivation [
19]. Once the impact and consequences are ascertained, an appropriate response can be taken to reduce the risk. This framework can be iteratively applied to evaluate the effects of different approaches to find the options that cause the largest reduction in consequence.
3. Case Study
3.1. Study Location
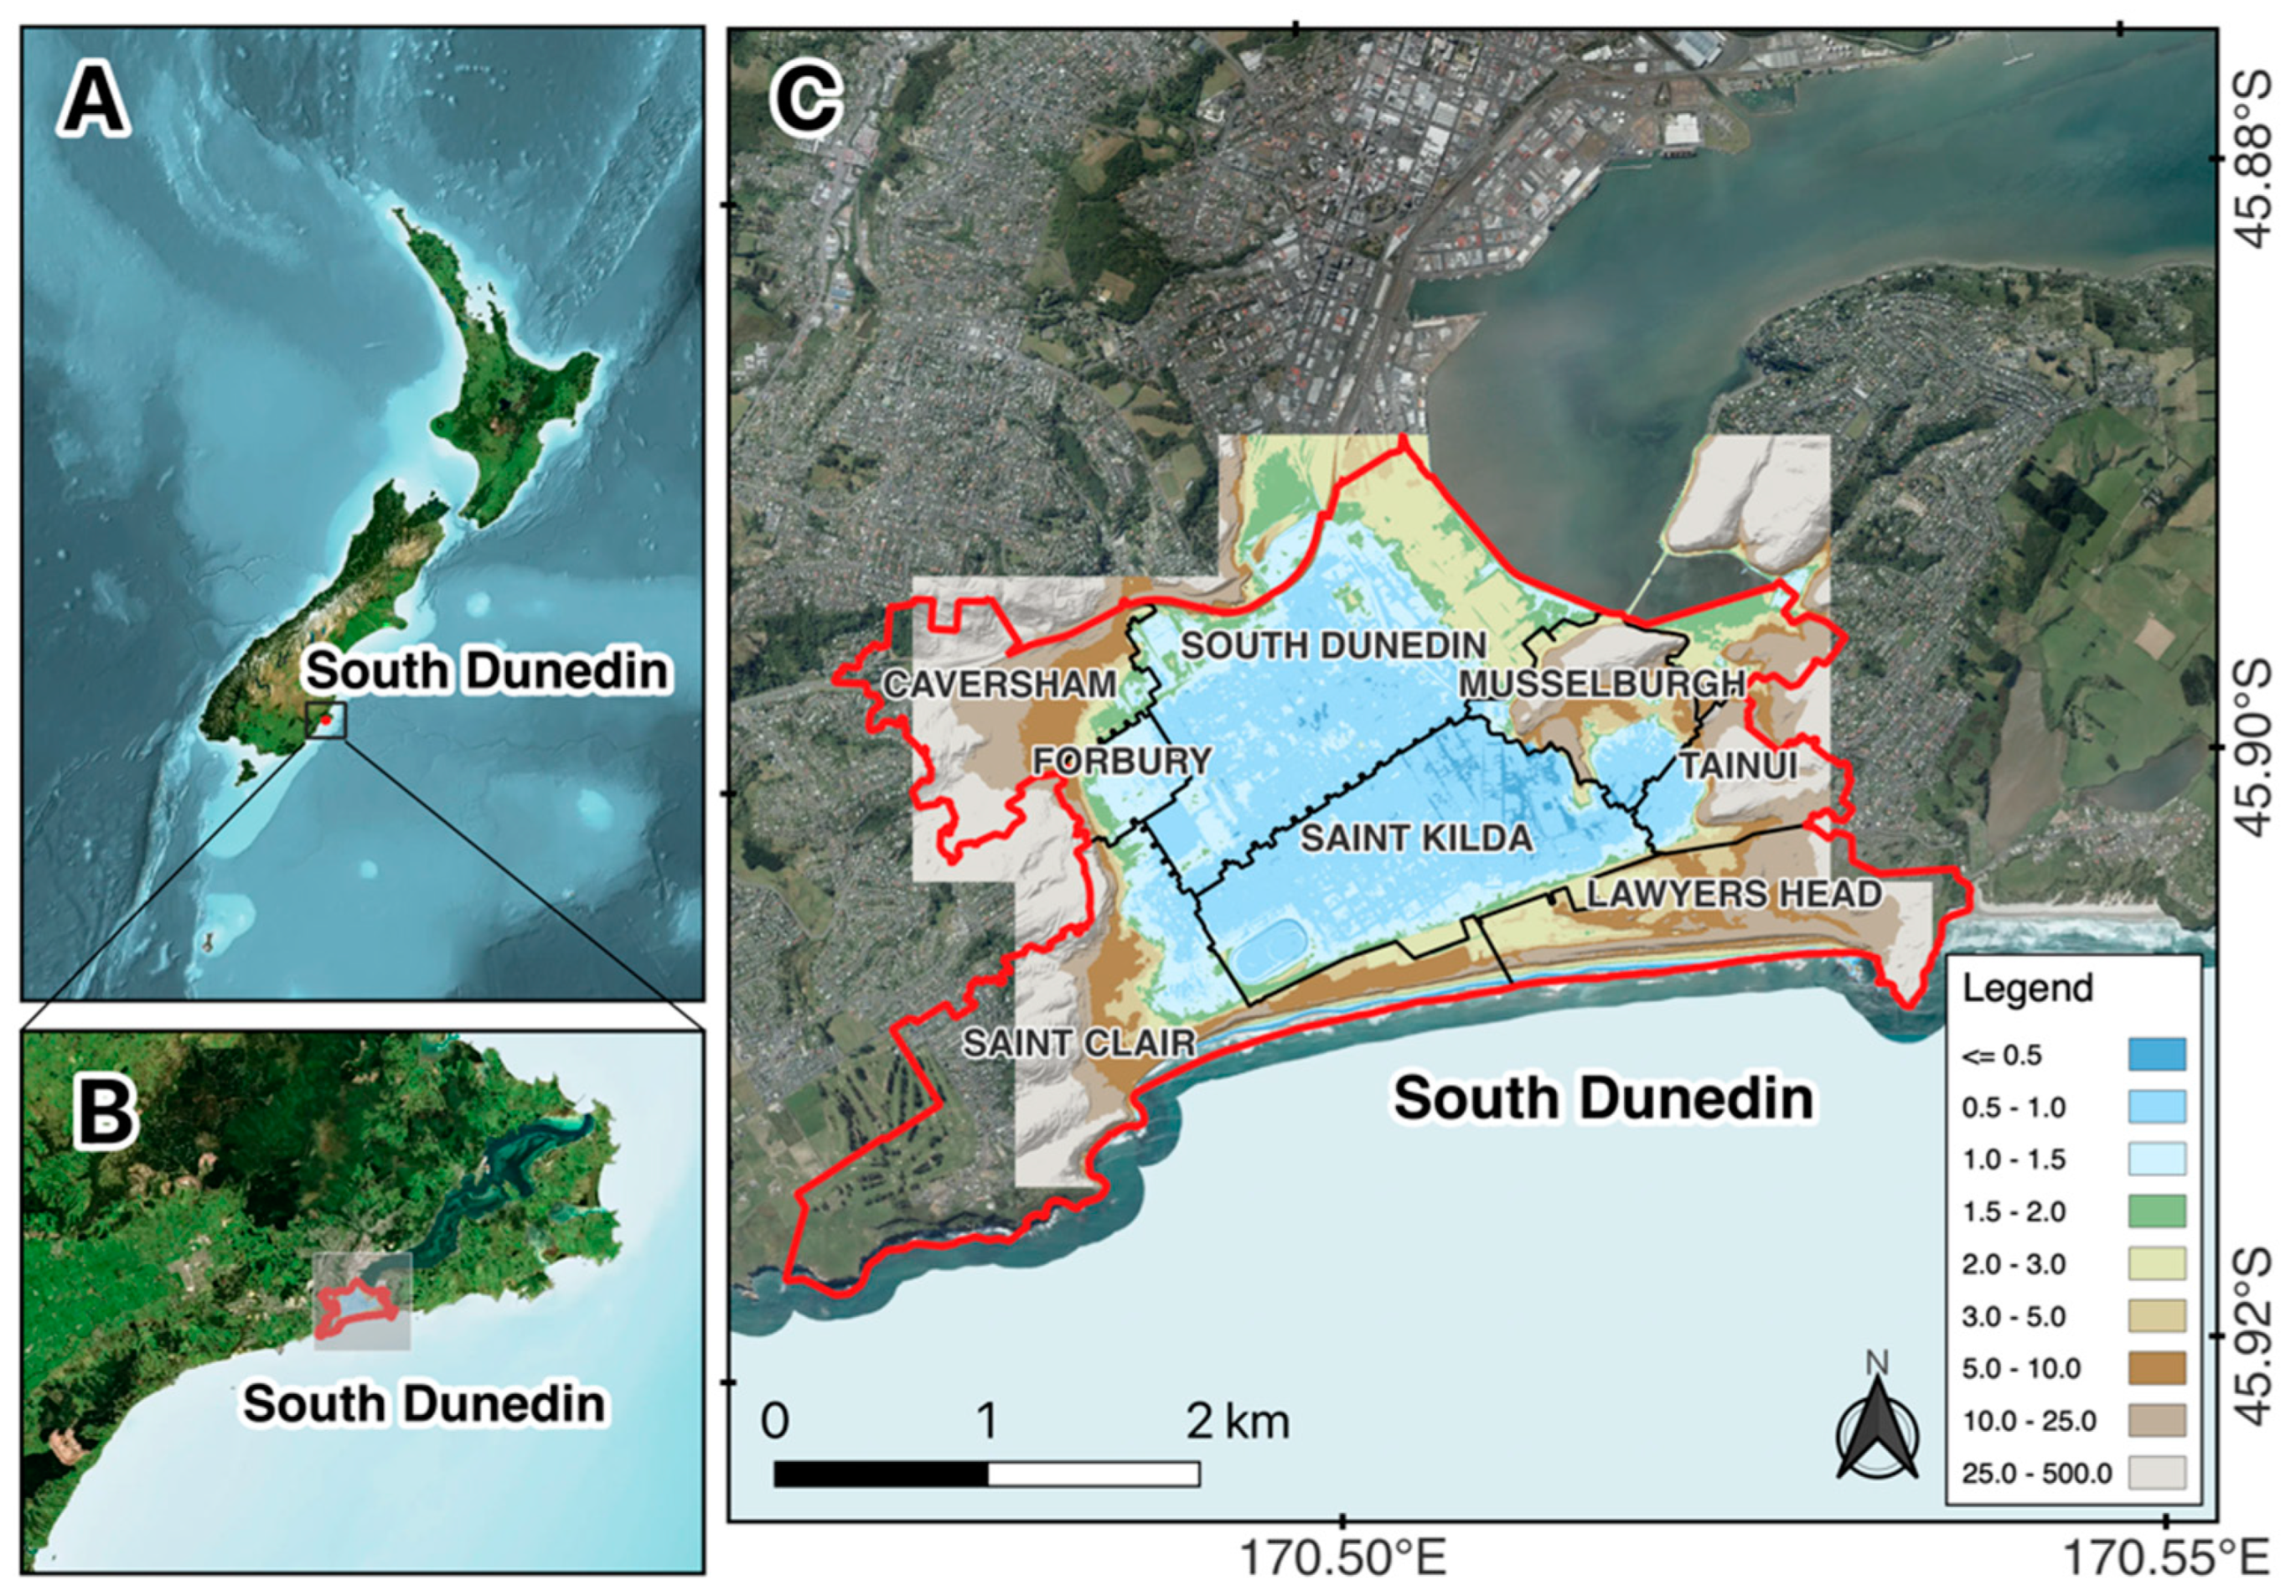
To demonstrate our risk framework and methodology, a case study was performed in a local community exposed to coastal inundation exacerbated by rising sea levels. Dunedin is a coastal city and the second most populated one on the South Island of New Zealand.
Figure 3 illustrates the residential suburbs (i.e., South Dunedin, Forbury, St Clair and St Kilda) located on a low-lying coastal plain between the Pacific Ocean and Otago Harbour. These suburbs are collectively referred to as “South Dunedin”. South Dunedin suburbs reached a population of 13,977 in 2018 [
20], forming the highest suburban population densities in the wider Dunedin urban area. The suburbs are a highly important residential area for Dunedin City, housing a relatively large workforce and supporting several key commercial and industrial areas, schools, and recreational facilities.
South Dunedin is built largely on reclaimed salt marsh land less than three meters above present-day mean sea level (MSL) [
23]. The geomorphic setting and low elevation mean the area is subject to various natural hazards [
24] with future coastal flooding in response to relative sea-level rise (RSLR) being a high concern. Several national-scale studies enumerate building [
25,
26] and infrastructure network component [
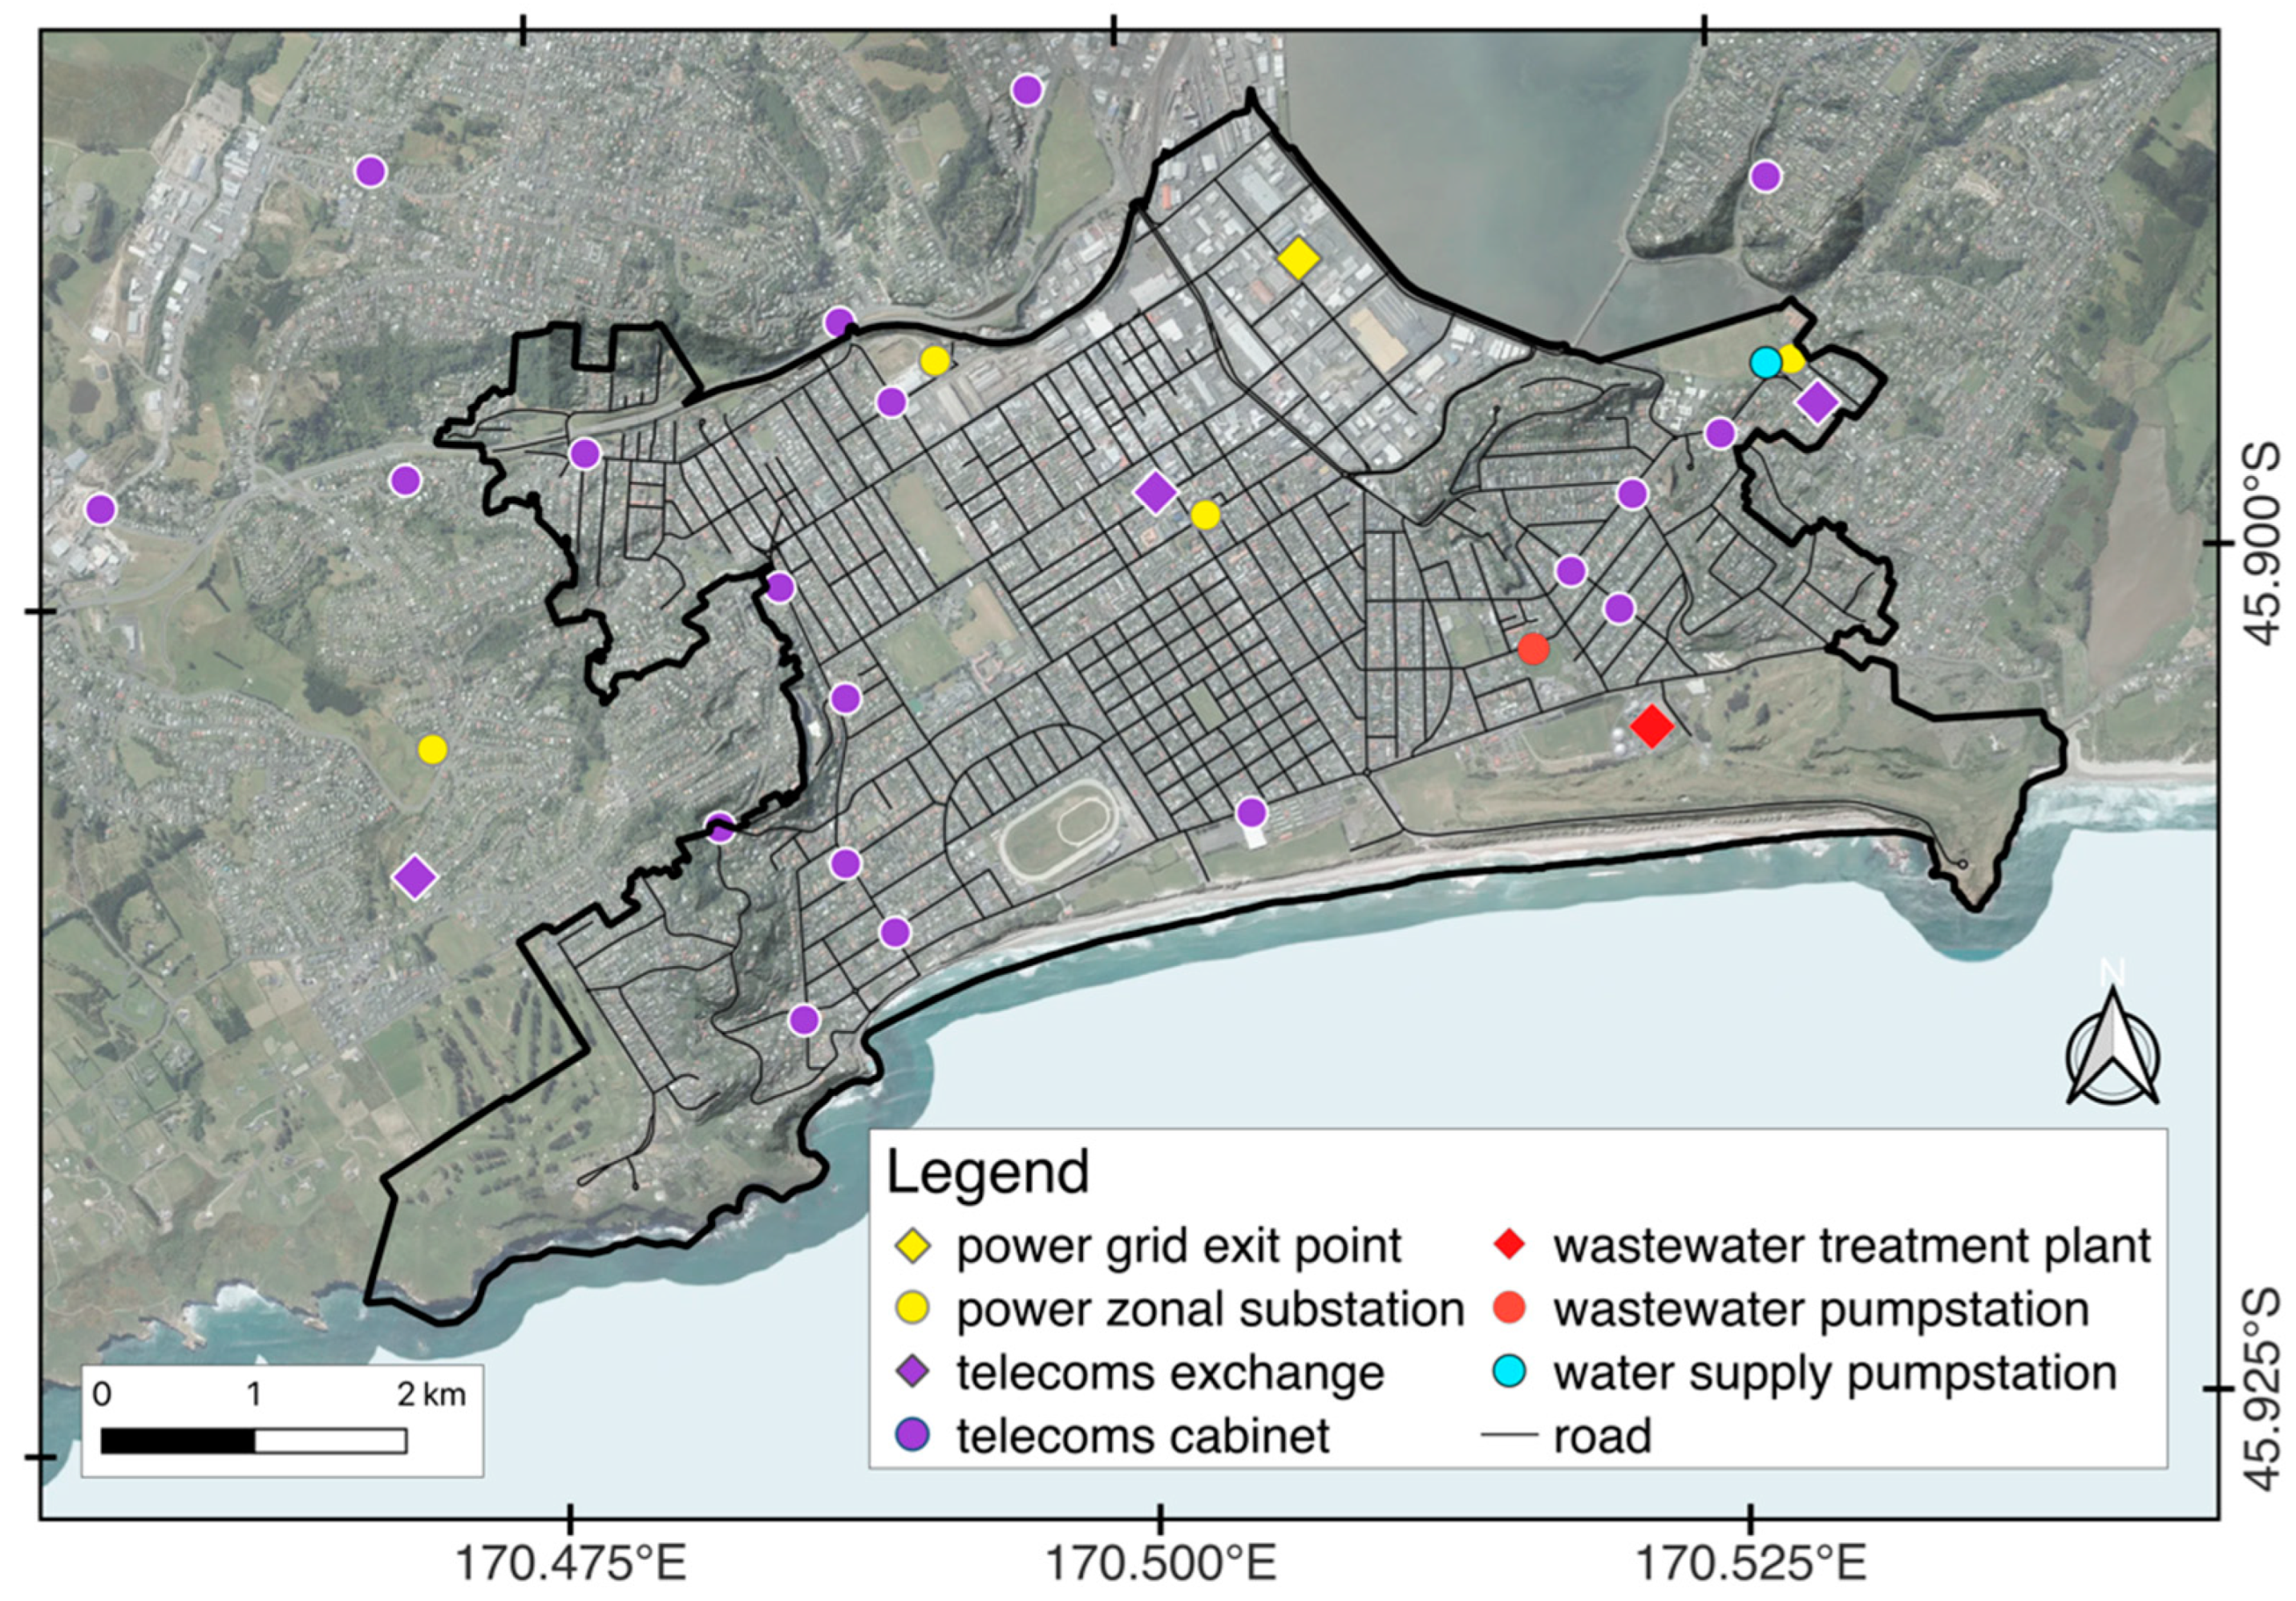
27] exposure to extreme sea level (ESL)-driven coastal flooding and RSLR in the Dunedin urban area. While exposures are not directly reported for South Dunedin in these studies, 0.3 to 1 m RSLR is expected to double present-day building and network component exposure to 100-year ESL flooding. As depicted in
Figure 4, several key infrastructure network components servicing South Dunedin could be exposed to future 100-year ESL flooding. Thus, investigating direct and indirect service disruption across multiple interdependent networks is timely with 0.3 to 1 m RSLR projected to occur for the Dunedin urban area in the next 40 to 90 years under Shared Socioeconomic Pathways (SSPs) median SSP2-4.5 and SSP5-8.5 scenarios for the region, when also considering vertical land movement caused by seismic tectonic uplift, land compaction or sediment accumulation [
28].
3.2. Coastal Flood Hazard
Our investigation uses 100-year ARI ESL flooding scenarios developed by Paulik et al. [
26] for present-day and future higher sea levels. Here, flood inundation from 100-year ARI ESL water surface heights were mapped at a 2 m horizontal resolution onto high-resolution airborne LiDAR DEMs for the Dunedin urban area [
21]. A static “bathtub” inundation model approach was applied to calculate DEM raster cells at topographical elevations below a corresponding ESL elevation [
29]. An inundation depth above ground was computed for DEM grid cells from the difference between ESL water surface height and underlying terrain elevation. The model identifies raster cells with a hydrologic connection to the coastline to reduce potential overestimation of flood inundation over land (i.e., a raster cell is inundated if at least one of its cardinal neighbours are inundated and hydraulically connected to the coastline through local topography [
29]). Topographic structures (i.e., levees) protecting land from flooding were digitised as vector polylines, where present and identifiable using aerial imagery from Land Information New Zealand (LINZ). In the absence of publicly available information on flood protection structure design levels, protection afforded to land is assumed up to corresponding 100-year ESL heights at present-day MSL. ESL flood maps were derived for 0 m SLR and thereafter at 0.1 m SLR increments up to 2 m. Using this approach for inundation mapping creates 21 RSLR scenarios, which are independent of future RSLR projections. We consider RSLR up to 2 m as a sufficient representation of projected scenarios and their uncertainties for the Dunedin urban area expected over the next 100 years under various shared socioeconomic pathways (SSPs) [
30].
3.3. Assets
Table 1 shows the infrastructure networks that were assessed by converting their key components into nodes and edges. A graph is created by connecting node assets with their incident edge assets to form a network. Asset data were obtained through available open-source data and service providers.
For each asset class type, an appropriate vulnerability function (i.e., depth–damage curve) was selected from the current literature. We assume buried infrastructure (pipes and cables) are not affected given they are frequently exposed to water (via infiltration and ground water). We also assume that power poles and overhead lines are not exposed. In the absence of asset floor heights, several sites were visited, and the height of the lowest flood protection structure was surveyed. For the remainder of the sites, we have assumed the floor height to be the minimum of that asset type. For roads, a different approach was used to characterize accessibility in lieu of using a fragility function. A road segment was considered inaccessible if the flood depth exceeded the average wheel height of a typical civilian car, as this captures the accessibility in the evacuation phase immediately post flood for the community.
3.4. Risk Assessment
The direct impact exposure and vulnerability assessment was conducted using the open-source software RiskScape [
33]. The flood hazard depth was sampled at the asset centroid, and for roads, all intersections with the hazard were recorded. An asset is considered non-functional and directly damaged if the damage ratio of the corresponding flood depth exceeds 0.5. The value of 0.5 is selected, to represent a “severe” damage state [
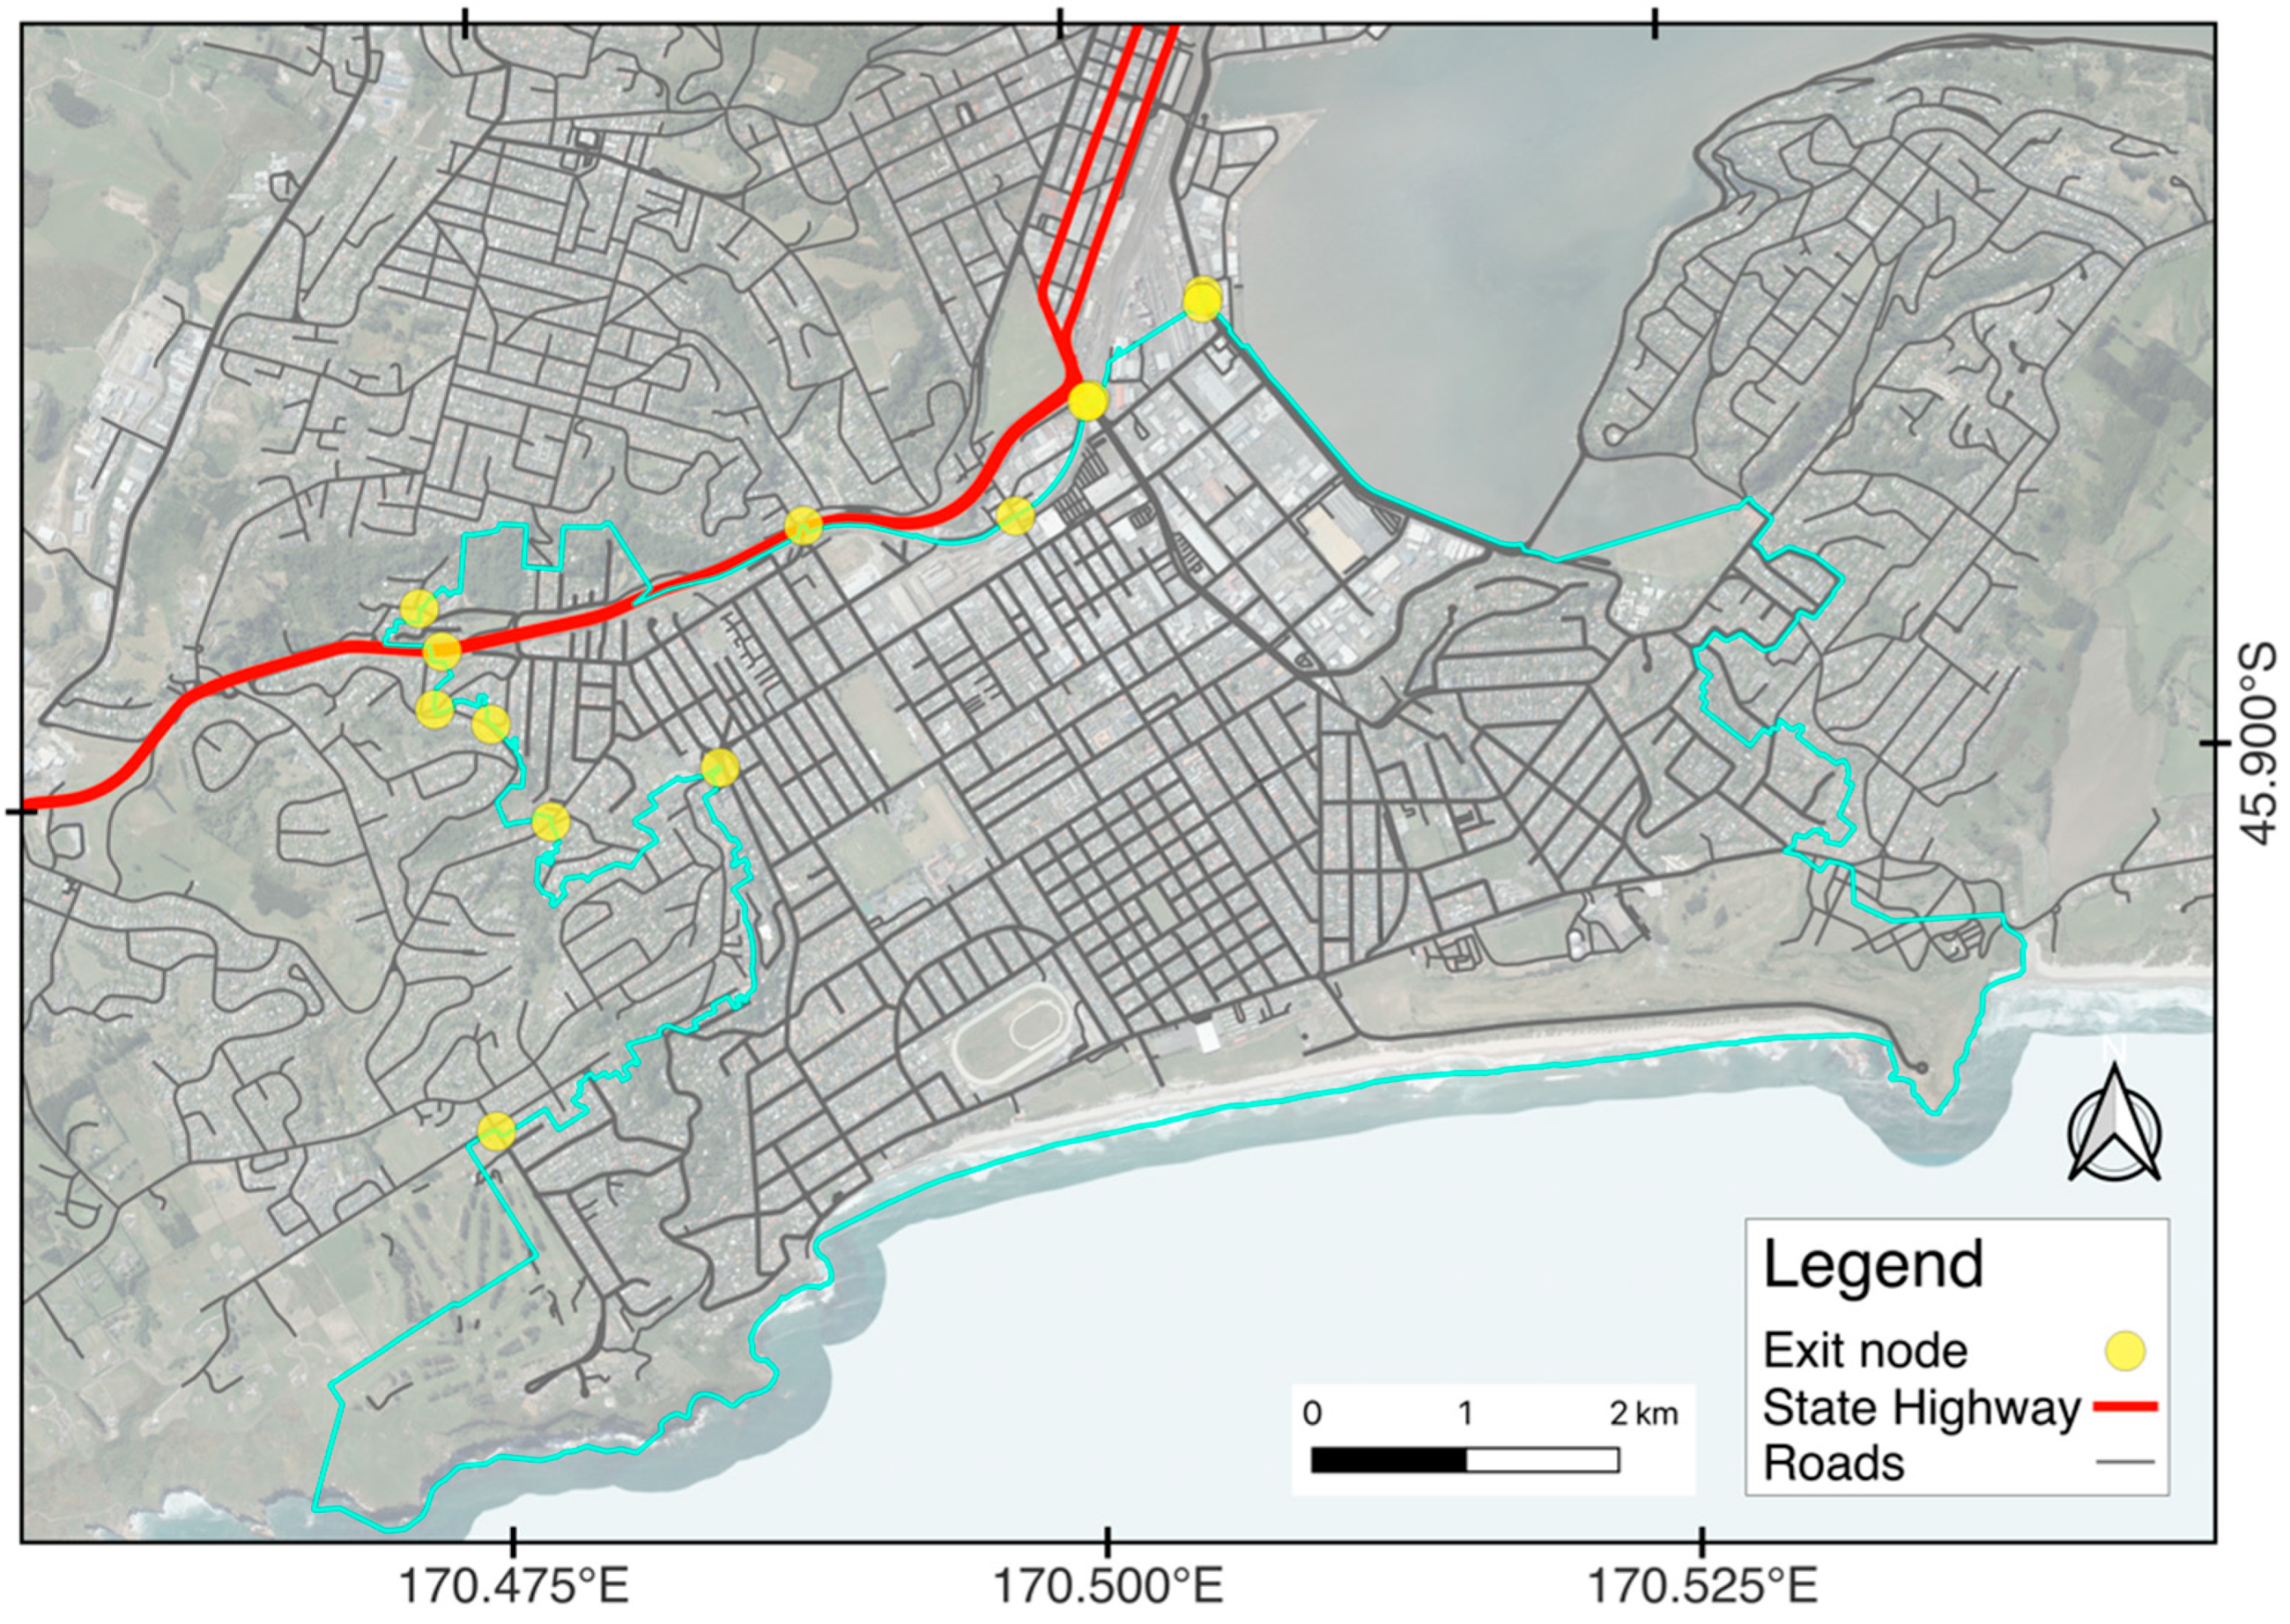
32]. The connectivity model is built by connecting asset nodes to their source node using pipe and line data. Where unavailable, asset nodes were connected to source nodes via the shortest path along road corridors, following the assumption that utilities generally follow the road network. For roads, a network graph was readily available using the library OSMNx [
34]. The source nodes were points on the boundary edge of the study extent that can access the state highway.
Figure 5 shows an example of these nodes.
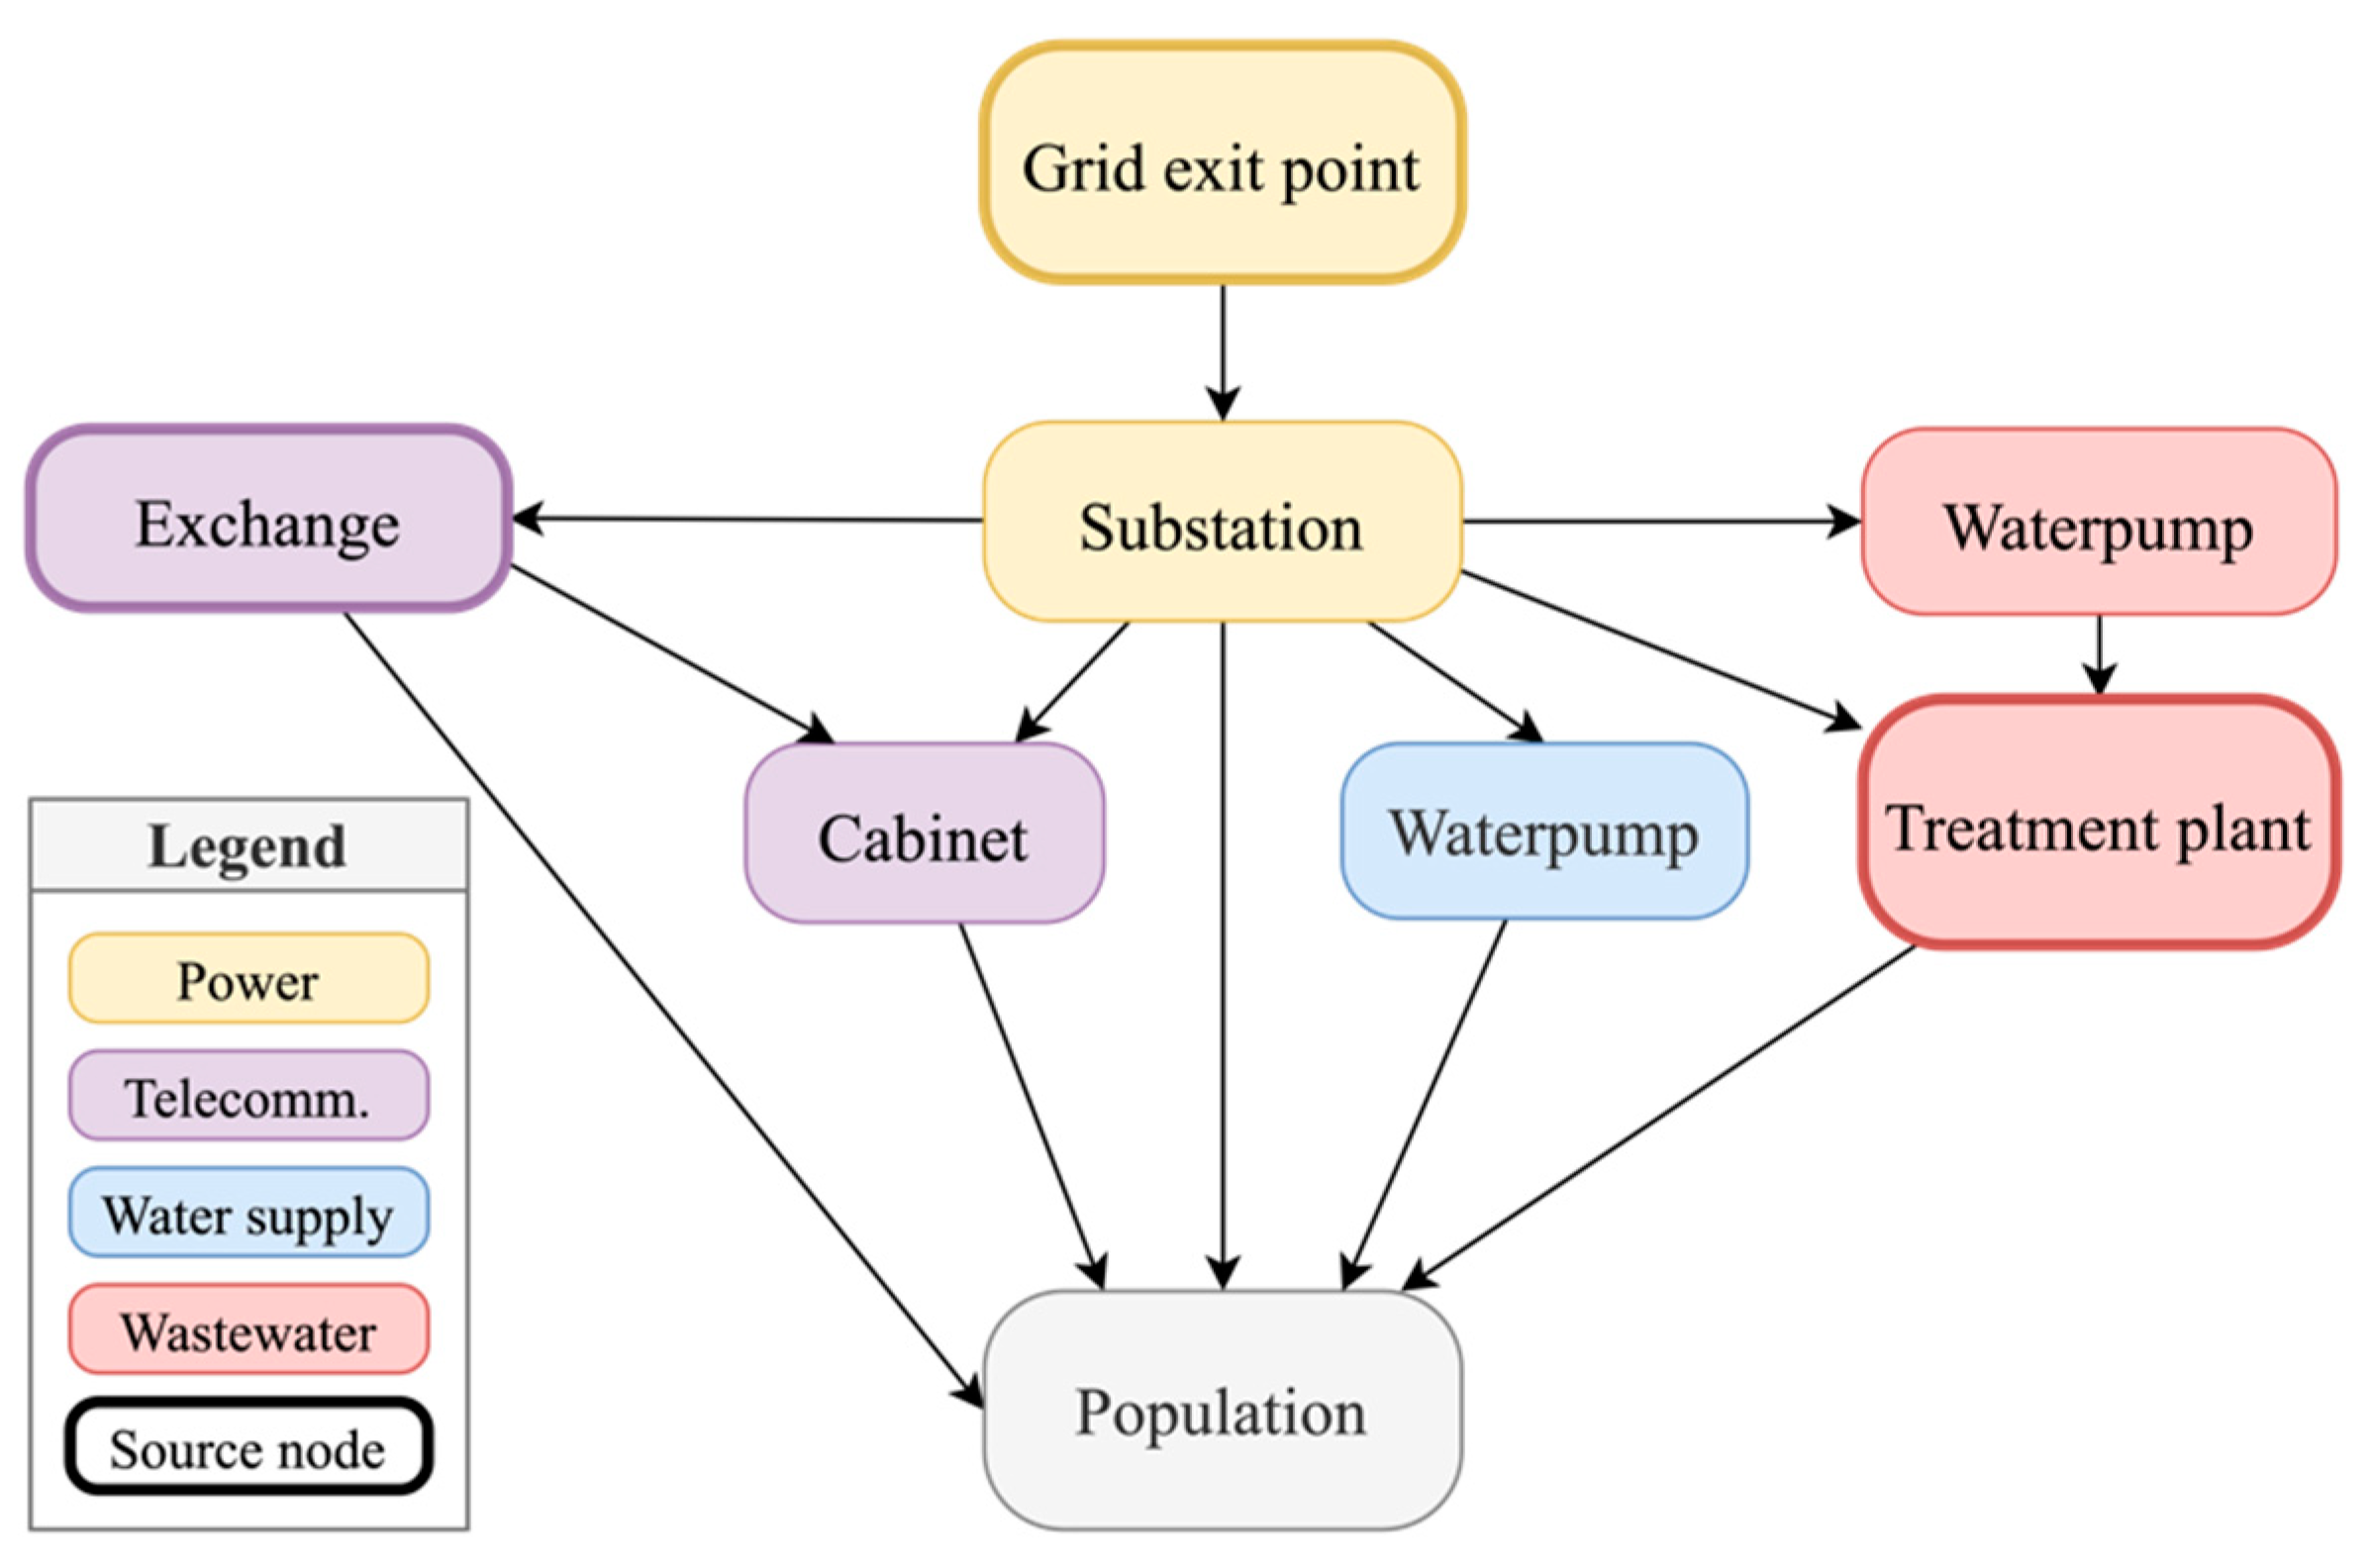
Figure 6 gives a summary of the overall dependencies and links between asset types and population. Three types of relationship are captured in the analysis. Within a network, the relationship is inferred from the topology by first defining a source node type, and then connecting it to the downstream nodes. For cross-infrastructure links, links were defined first as a rule between two asset components, and then each dependent link was created by assuming that the closest (Euclidean distance) substation services the node. The overall disruption is then quantified by incorporating census data to estimate the population without service/access. For each census unit (statistical area 1, SA1) [
20], the same approach of taking the closest service node of each infrastructure to the centroid of the unit was used.
4. Results and Discussion
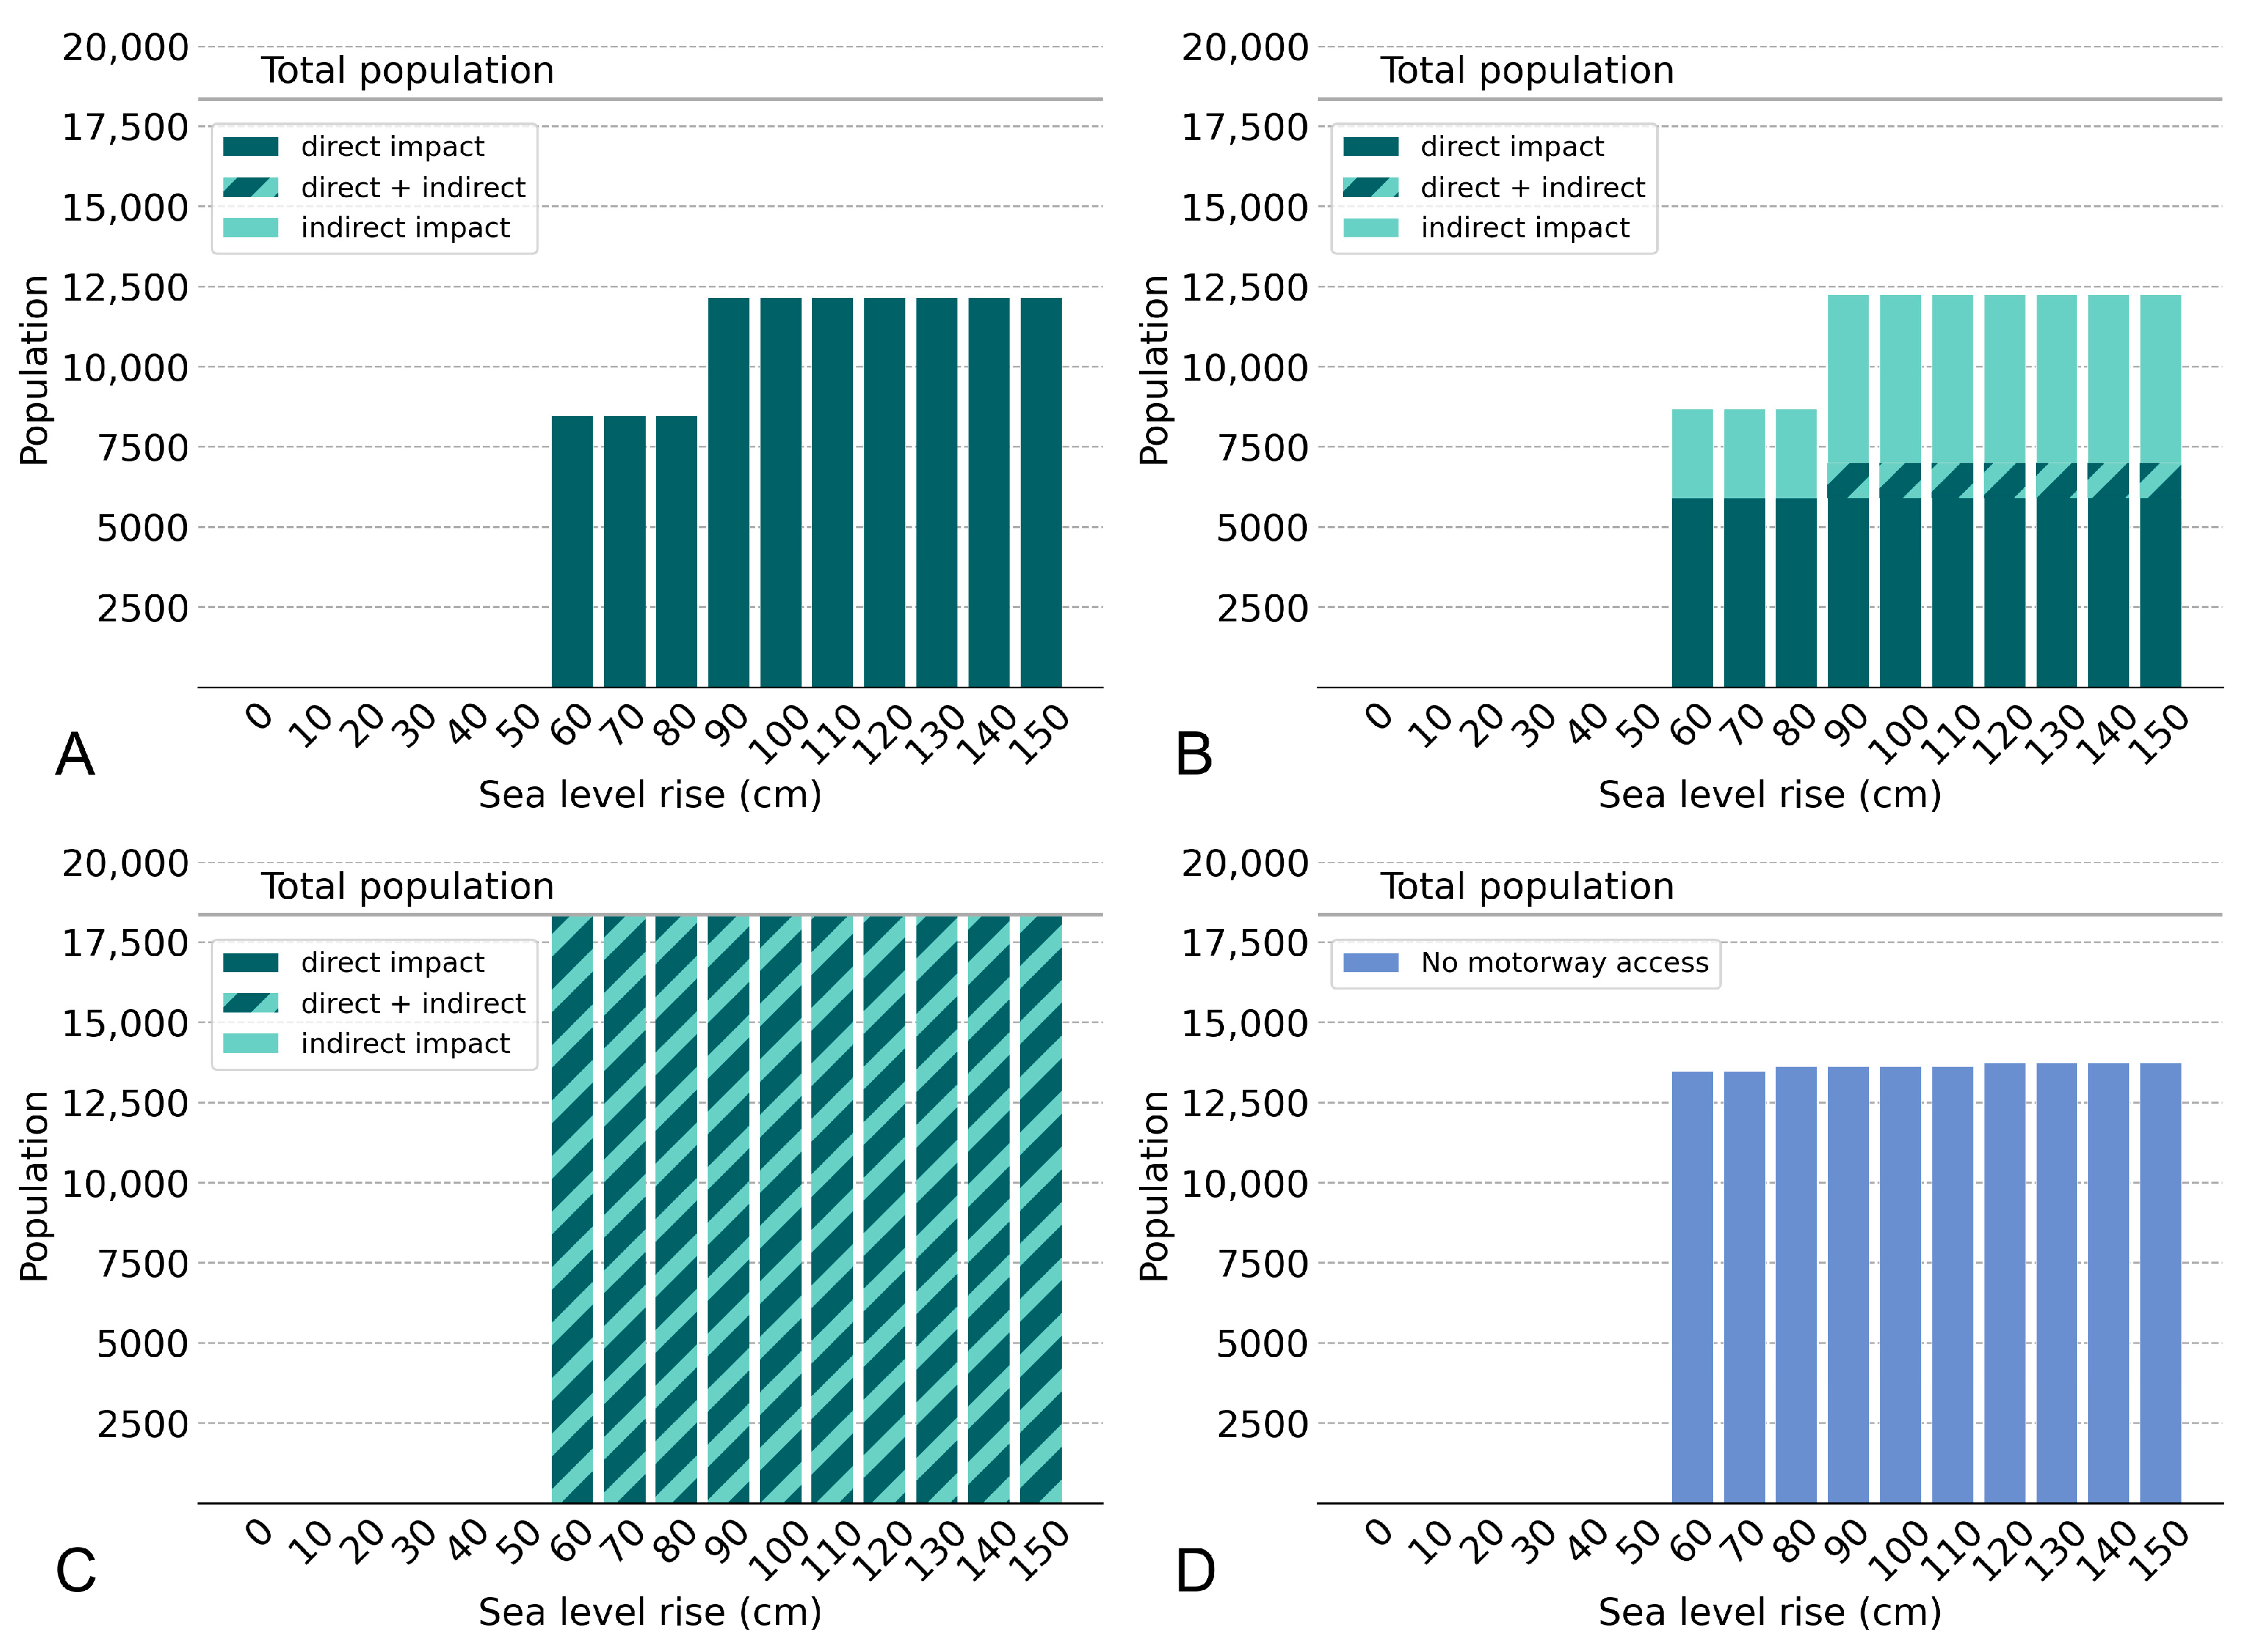
Figure 7 summarises the direct and indirect impact on the population in South Dunedin in terms of loss of infrastructure service across power, communications, wastewater, and roads. It clearly illustrates a pronounced ‘tipping point’ that occurs at 60 cm of sea-level rise (SLR) combined with the 100-year ARI inundation event, beyond which a large proportion of the modelled population experiences a loss of access to services. At this specific combination of events, the flooding is observed within the low-elevation basin area in the middle of South Dunedin. As the extent of the flooding directly impacts a large area, we do not observe indirect impacts surpassing the direct impacts, a trend often observed in other interdependency case studies [
9,
10,
12].
For the power and communications networks, a second step is observed at 90 cm SLR, where a second substation had failed, leading to an indirect loss of service to the communications network to areas outside of the basin area. For wastewater, the Musselburgh pumpstation upstream of the wastewater treatment plant is directly inundated at the 60 cm SLR tipping point, and loses its power source.
At 60 cm SLR, areas with the most service loss are located where elevation is low. As the direct impact dominates in this analysis, this is expected.
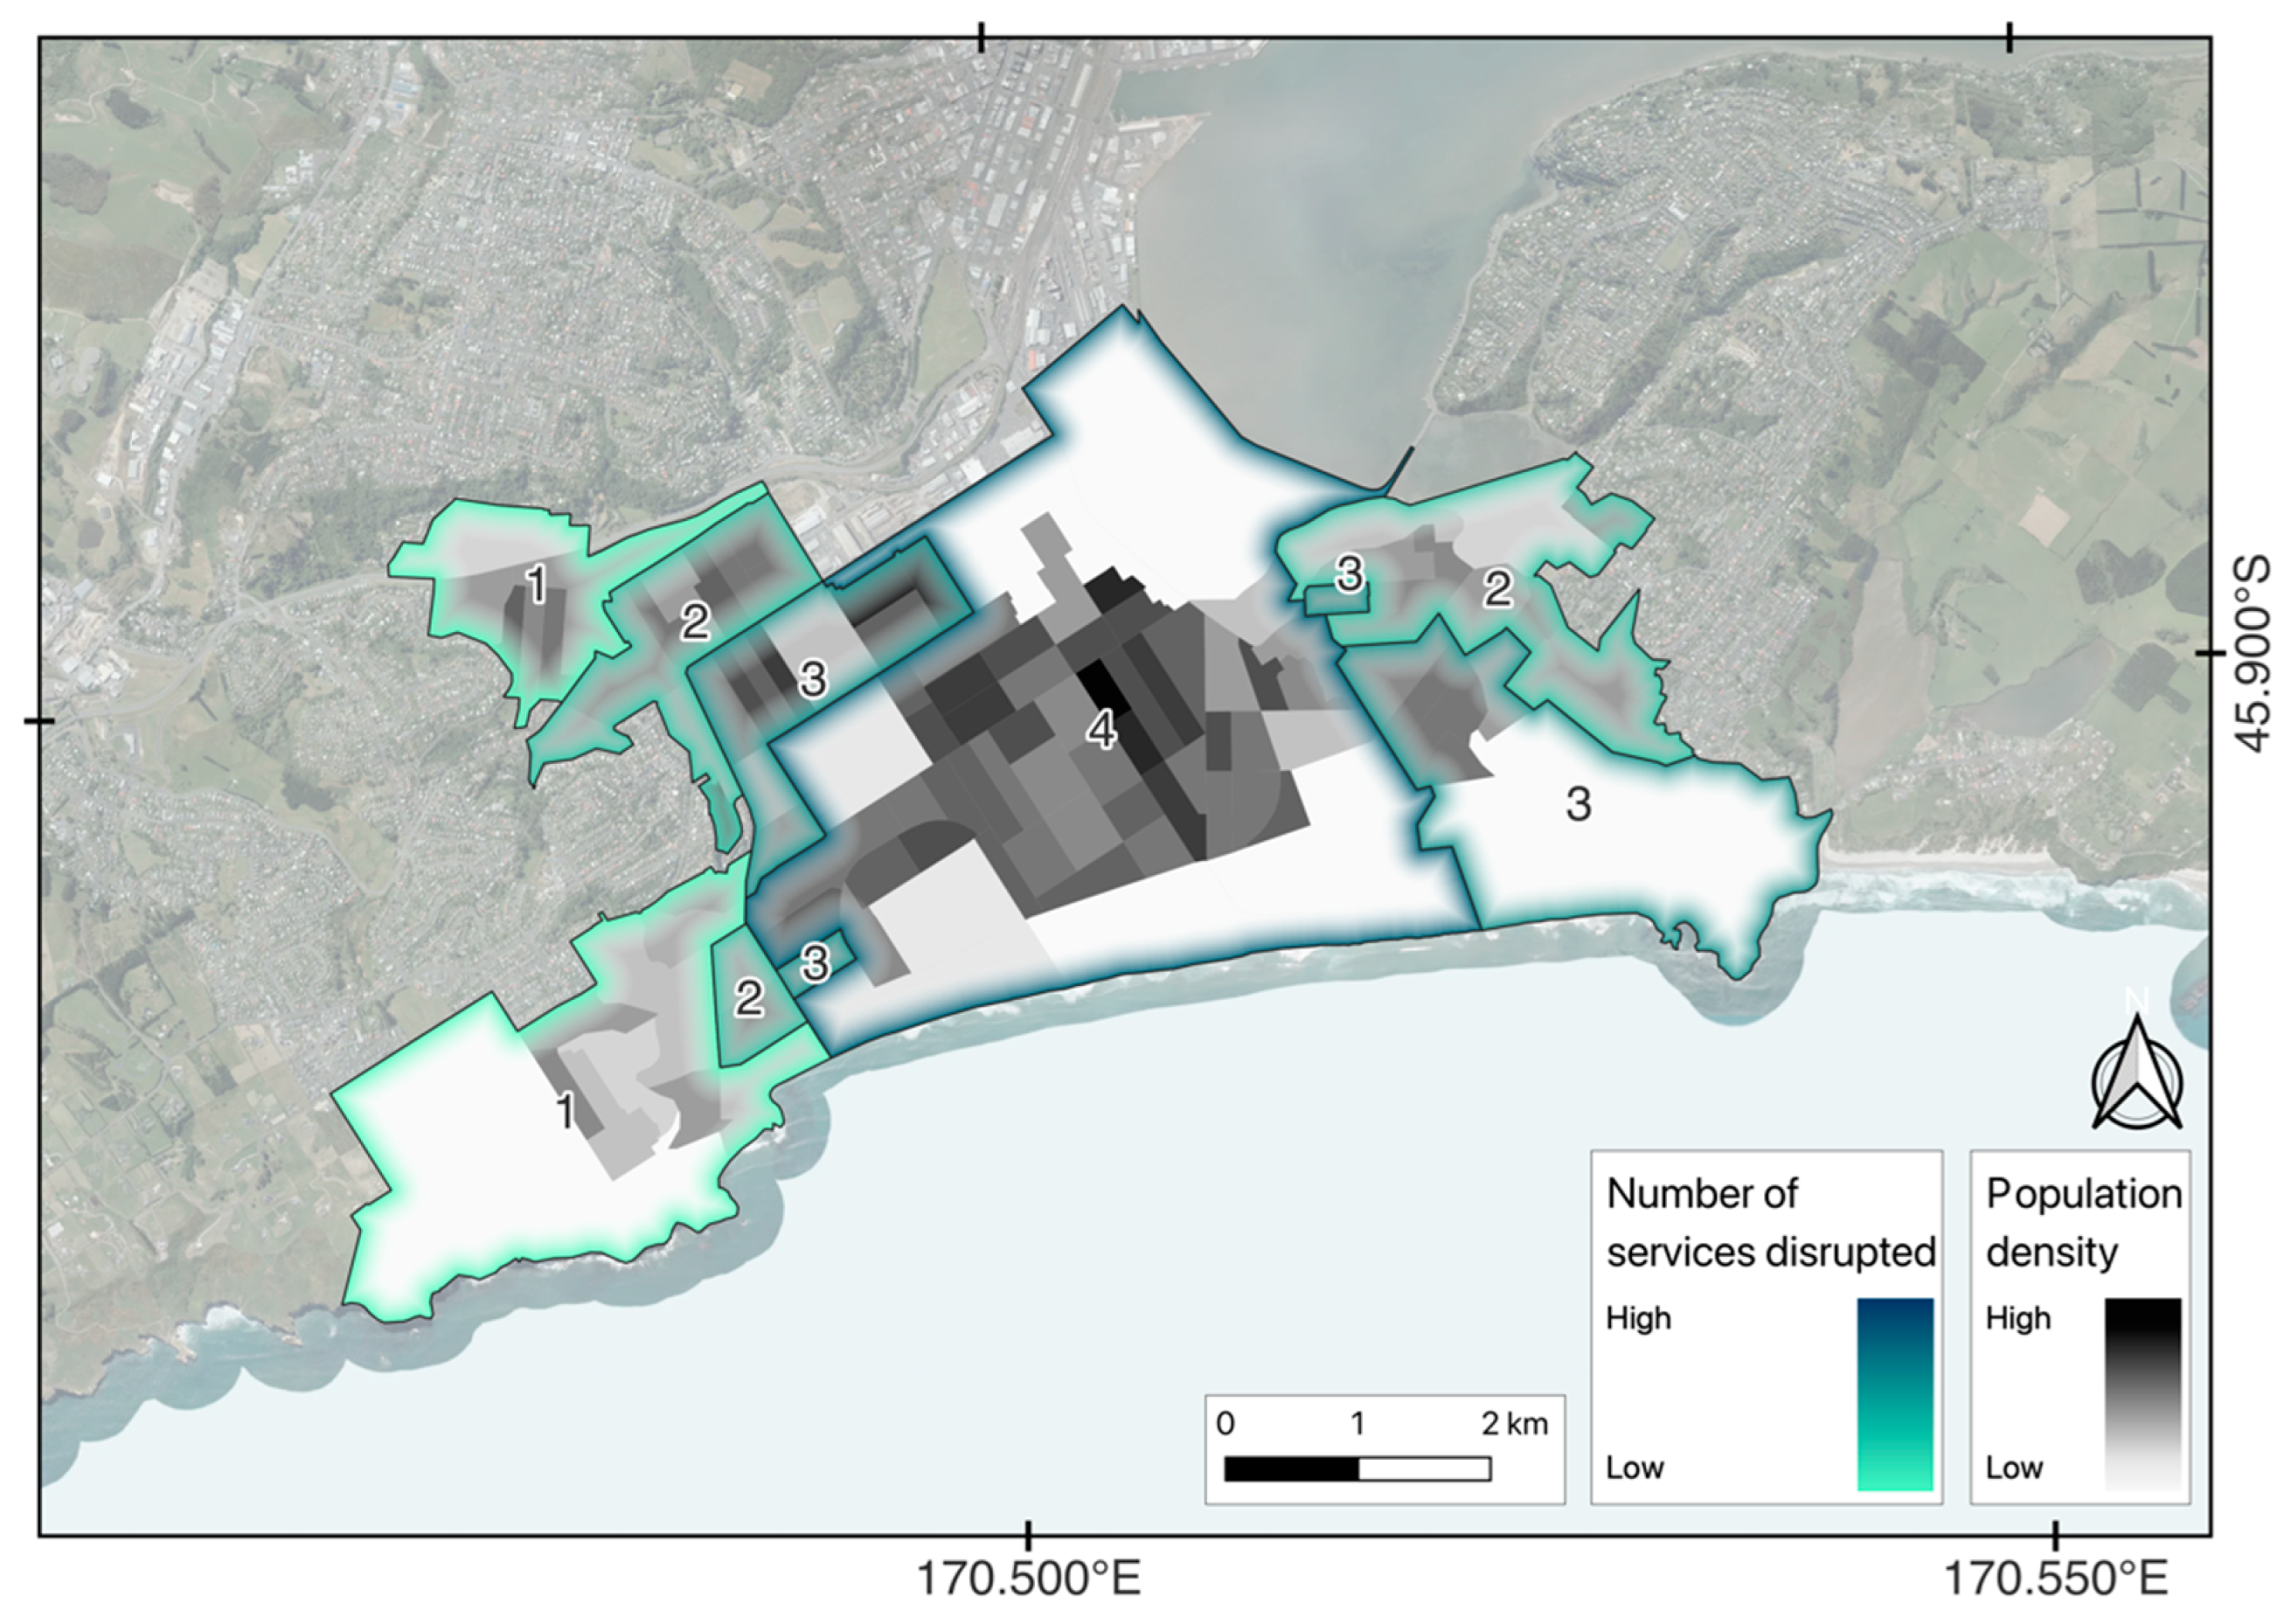
Figure 8 illustrates that the population centre of South Dunedin (located in the South Dunedin and St. Kilda suburbs) is the most susceptible to critical infrastructure loss. Most of the indirect impact of loss of communications cabinets were found on the southern side in the suburbs of Saint Clair, where the loss of the St. Kilda substation disrupts the power supply to them.
We note that the wastewater treatment plant services a greater extent than the South Dunedin suburbs within the study extent. The Musselburgh wastewater pumpstation that is disrupted by the tipping point services the greater Dunedin area, affecting approximately 80,000 residents outside of South Dunedin [
35]. Similarly, for road access, many areas were completely flooded and could not be accessed. The eastern peninsula of South Dunedin outside of the study extent would lose road access and be indirectly cut off from the mainland. We note that the eastern peninsula also loses road access to the mainland in the tipping point scenario, which is estimated to have approximately 10,500 residents. Overall, the results demonstrate that the indirect impacts of an isolated flooding event in South Dunedin will extend far beyond the area of inundation.
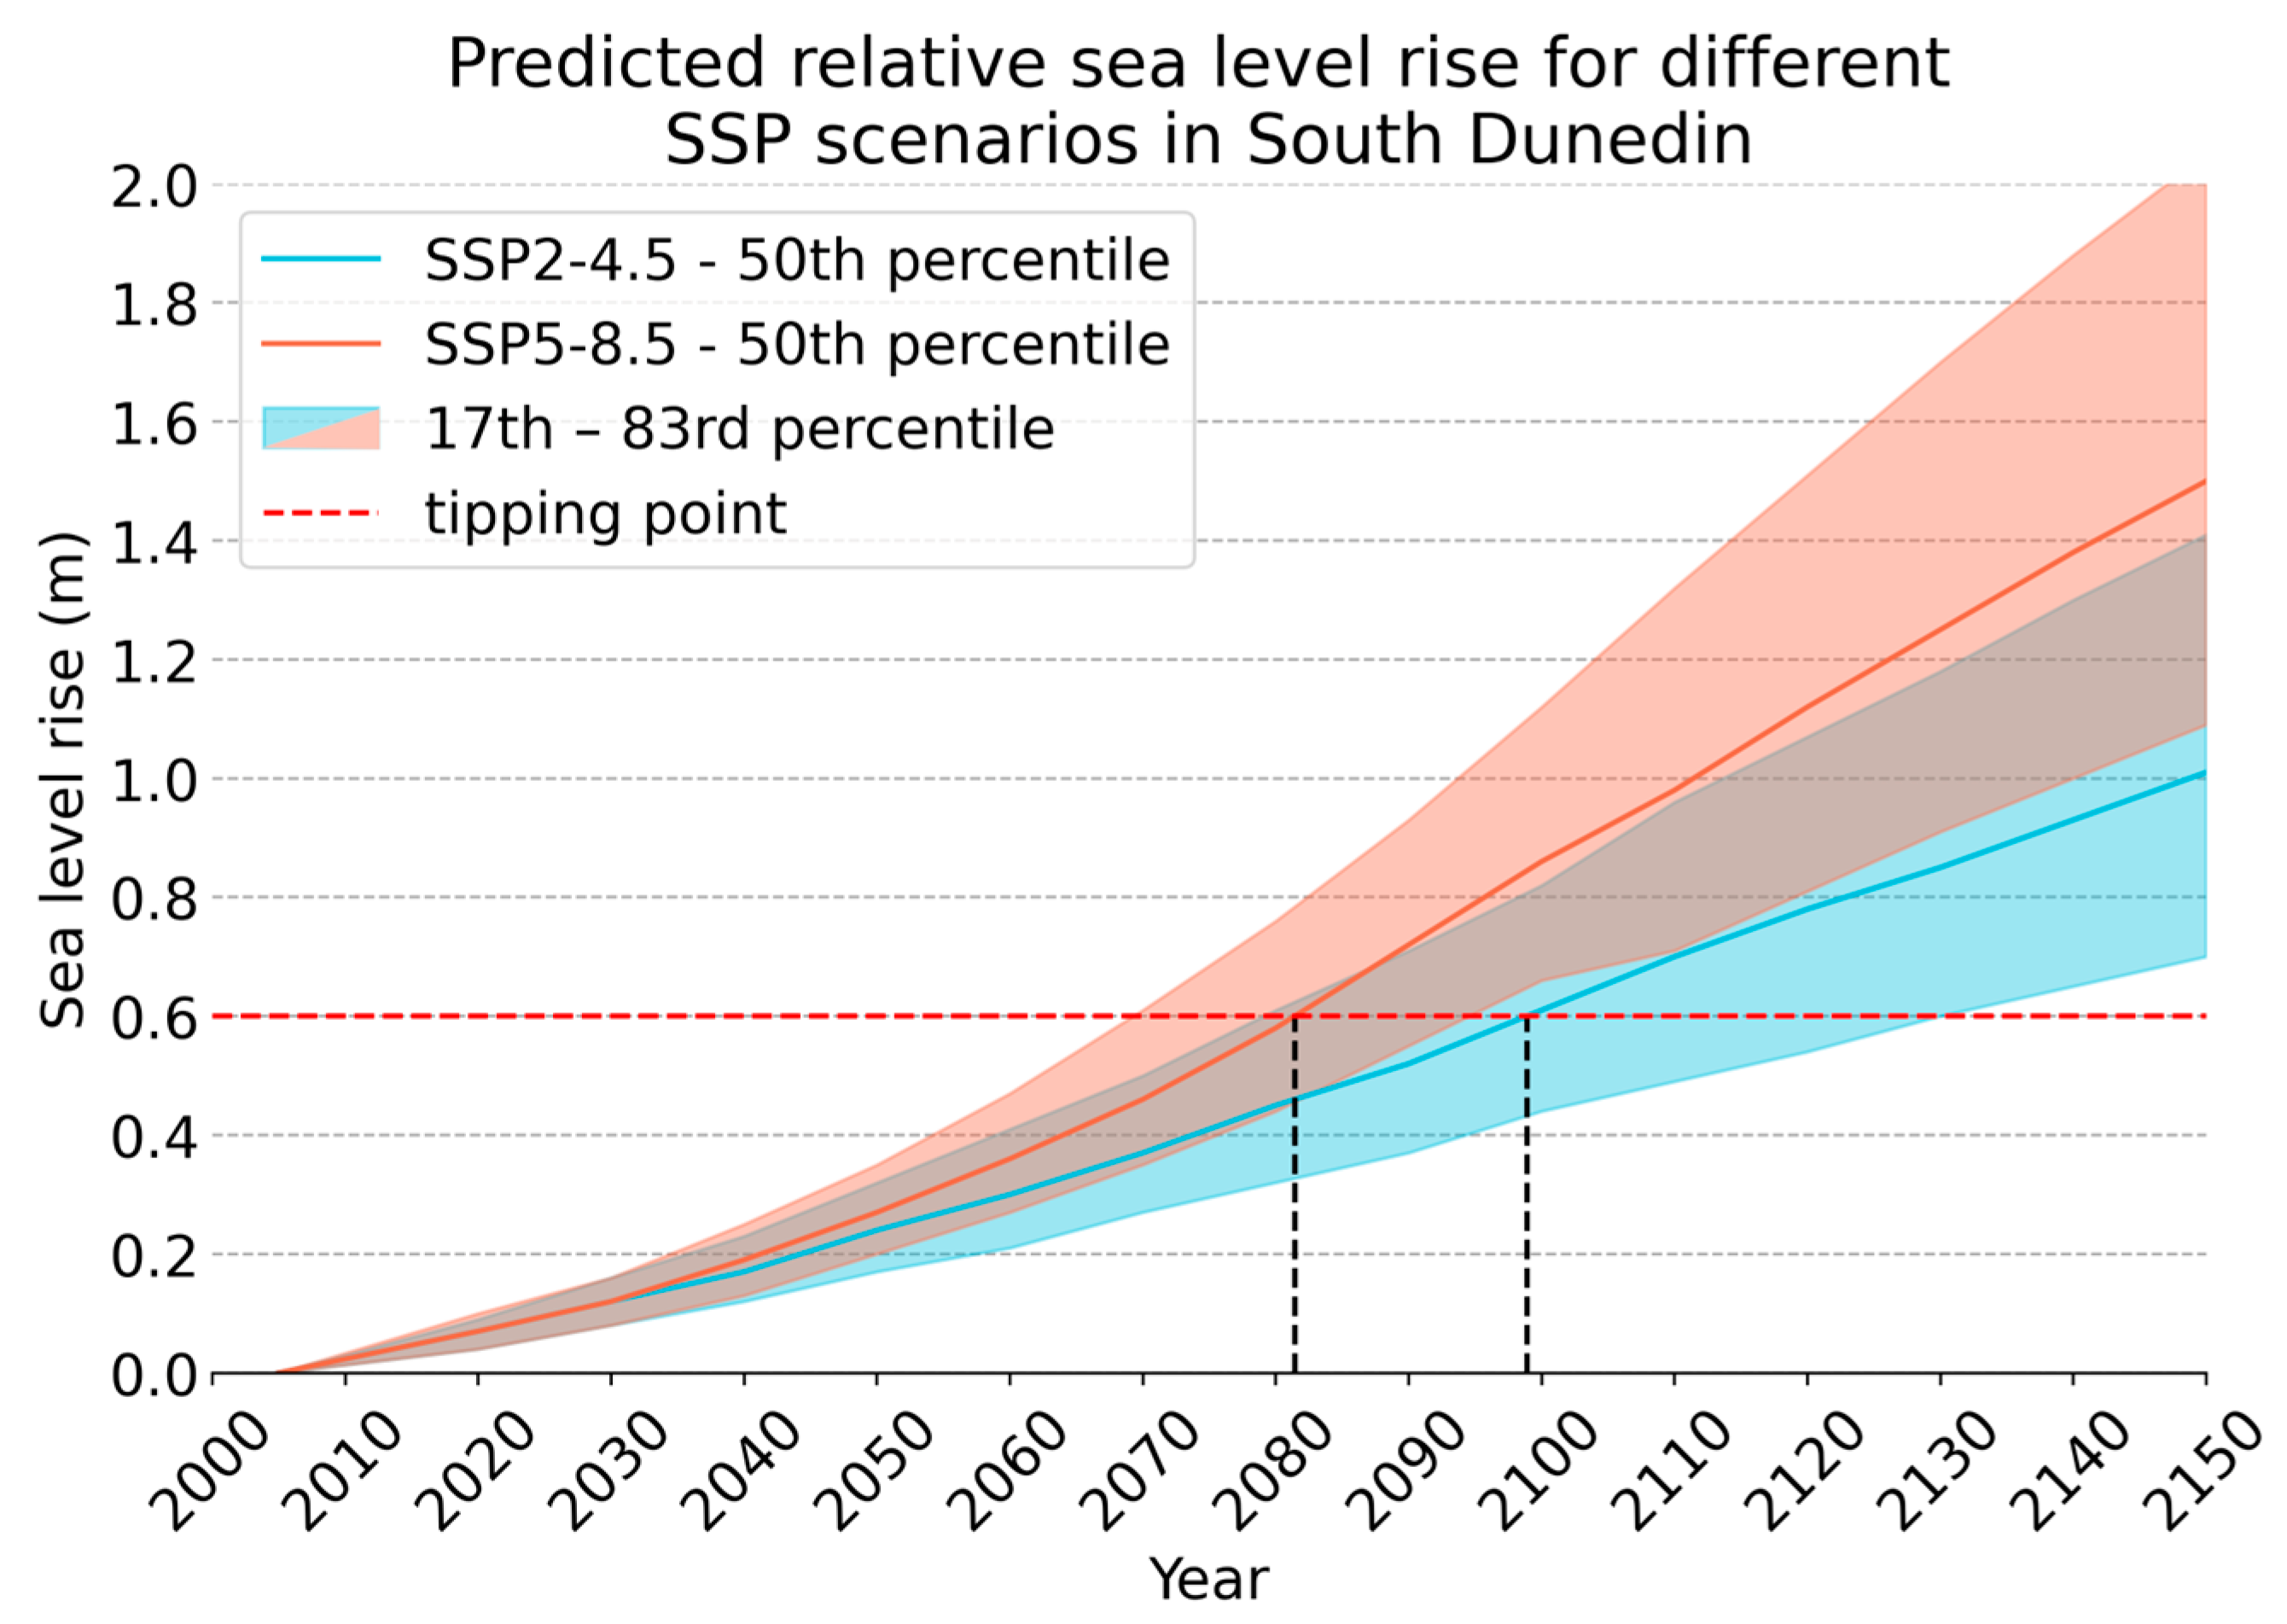
The results provide an initial view and approximate time period to implement adaptations. To provide additional context, the implications of this modelling are linked to the projected SLR scenarios for the region; here, we have used SSP2-4.5 and SSP5-8.5 scenarios with the 50th percentile and the 17th–83rd percentile range.
Figure 9 presents these sea-level rise scenarios over time, including the effect of vertical land movement [
28]. This shows that in the more pessimistic scenario, the impacts discussed previously could be observed in approximately 60 years for the 50th percentile, pushing out to 80 years for the more optimistic scenario. Regardless, these are both within normal planning timeframes and the design life of many infrastructure assets such that adaptation should be considered a priority.
In the static bathtub model, studies have shown that on flat terrain, inundation extents and depth are often overestimated. As such, further refinements to the hazard data will need to be made, such as incorporating a hydrodynamic ESL model, prior to making decisions on specific future adaptations. The next steps to extend the framework are to add stochastic components to the model to test their relative sensitivity to the model. Uncertainty can be accounted for in the hazard (different realisations of flood events), the vulnerability assessment (using different fragility functions and consequence thresholds), and when assessing the interdependencies (strength of the connections, uncertainty of the network configuration). The framework can be adapted to the higher resolution hazard data by increasing the level of detail of the asset consequence model to give better results. In this case, the hydrodynamic model could be paired with a physical hydraulic model of the wastewater system to understand the full outage impacts of the ESL hazard, as well as understanding the full intra-network hydraulic effects of wastewater backflow.
5. Conclusions
This study has presented a risk assessment framework accounting for direct and indirect impacts, and has been demonstrated using a scenario focussing on the effects of extreme sea level (ESL) flooding on critical infrastructure. The base methodology presented here is adaptable and additional analyses, such as estimating recovery times, can be incorporated. In the case study, we have found that further analysis, such as a probabilistic assessment, did not prove beneficial due to the coarse nature of the hazard data. Further refinements to the hazard data, such as incorporating a hydrodynamic ESL model would be beneficial in obtaining a better resolution result to inform future adaptations. Further work would also need to be conducted on other hazards exacerbated by SLR, such as groundwater flooding. We would have expected that our interdependency methodology could have been applied to any hazard at any scale, but from the case study, we have found that modelling interdependencies at a suburb level has challenges capturing the indirect impact of assets. Barring road infrastructure, because edges (pipes and lines) were not exposed, and that there were few nodes, the indirect impacts are not as widespread. A higher resolution of asset data, such as including the street-level transformers, would increase the effects of indirect impacts.
With a possibility of reaching our identified 60 cm SLR in 60–80 years, the consequences and impact of an ESL flood event on critical infrastructure services would be catastrophic. Despite the temporal uncertainty, this timeframe corresponds with many long-term infrastructure and planning decisions and still reflects an urgency to take these findings into consideration when making decisions about the city’s future infrastructure.
Author Contributions
Conceptualization, C.L., A.W. and R.P.; methodology, C.L. and A.W.; software, C.L. and A.W.; writing—original draft preparation, C.L.; writing—review and editing, C.L., A.W., R.P., L.W. and C.Z.; visualization, C.L.; supervision, A.W.; project administration, R.P.; funding acquisition, R.P. All authors have read and agreed to the published version of the manuscript.
Funding
This work is supported by the New Zealand Ministry of Business, Innovation and Employment (MBIE) under a) Deep South Science Challenge (MBIE CONTRACT NUMBER: C01X14121), Resilience to Nature’s Challenges National Science Challenge (MBIE CONTRACT NUMBER: CO5X1901) and c) Strategic Science Investment Fund (Projects CARH2305 & CARH2405—National Institute of Water and Atmospheric Research).
Data Availability Statement
GIS data (infrastructure assets, DEM, 100-year ARI hazard extent) are all publicly available. The hazard maps incorporating sea-level rise were supplied by the National Institute of Water and Atmospheric Research (NIWA) (URL:
https://niwa.co.nz/natural-hazards/our-services/extreme-coastal-flood-maps-for-aotearoa-new-zealand, accessed on 14 June 2023) [
37]. All base maps used were sourced from the LINZ Data Service and licensed by Otago Regional Council for re-use under the Creative Commons Attribution 4.0 International licence.
Conflicts of Interest
The authors declare no conflict of interest.
References
- Vitousek, S.; Barnard, P.L.; Fletcher, C.H.; Frazer, N.; Erikson, L.; Storlazzi, C.D. Doubling of Coastal Flooding Frequency within Decades Due to Sea-Level Rise. Sci. Rep. 2017, 7, 1399. [Google Scholar] [CrossRef] [Green Version]
- Stephens, S.A.; Bell, R.G.; Lawrence, J. Developing Signals to Trigger Adaptation to Sea-Level Rise. Environ. Res. Lett. 2018, 13, 104004. [Google Scholar] [CrossRef]
- Hunter, J. Estimating Sea-Level Extremes under Conditions of Uncertain Sea-Level Rise. Clim. Chang. 2010, 99, 331–350. [Google Scholar] [CrossRef]
- Sweet, W.V.; Park, J. From the Extreme to the Mean: Acceleration and Tipping Points of Coastal Inundation from Sea Level Rise. Earth’s Future 2014, 2, 579–600. [Google Scholar] [CrossRef]
- Korkali, M.; Veneman, J.G.; Tivnan, B.F.; Bagrow, J.P.; Hines, P.D.H. Reducing Cascading Failure Risk by Increasing Infrastructure Network Interdependence. Sci. Rep. 2017, 7, 44499. [Google Scholar] [CrossRef] [Green Version]
- Rinaldi, S.M.; Peerenboom, J.P.; Kelly, T.K. Identifying, Understanding, and Analyzing Critical Infrastructure Interdependencies. IEEE Control Syst. 2001, 21, 11–25. [Google Scholar] [CrossRef]
- Allen, T.R.; Crawford, T.; Montz, B.; Whitehead, J.; Lovelace, S.; Hanks, A.D.; Christensen, A.R.; Kearney, G.D. Linking Water Infrastructure, Public Health, and Sea Level Rise: Integrated Assessment of Flood Resilience in Coastal Cities. Public Work. Manag. Policy 2019, 24, 110–139. [Google Scholar] [CrossRef]
- Sun, J.; Chow, A.C.H.; Madanat, S.M. Multimodal Transportation System Protection against Sea Level Rise. Transp. Res. Part D Transp. Environ. 2020, 88, 102568. [Google Scholar] [CrossRef]
- Davies, A.; Zorn, C.; Wilson, T.; Wotherspoon, L.; Beavan, S.; Davies, T.; Hughes, M. Infrastructure Failure Propagations and Recovery Strategies from an Alpine Fault Earthquake Scenario. BNZSEE 2021, 54, 82–96. [Google Scholar] [CrossRef]
- Zorn, C.; Pant, R.; Thacker, S.; Shamseldin, A.Y. Evaluating the Magnitude and Spatial Extent of Disruptions Across Interdependent National Infrastructure Networks. ASCE-ASME J. Risk Uncertain. Eng. Syst. Part B Mech. Eng. 2020, 6, 020904. [Google Scholar] [CrossRef]
- Koks, E.E.; Rozenberg, J.; Zorn, C.; Tariverdi, M.; Vousdoukas, M.; Fraser, S.A.; Hall, J.W.; Hallegatte, S. A Global Multi-Hazard Risk Analysis of Road and Railway Infrastructure Assets. Nat. Commun. 2019, 10, 2677. [Google Scholar] [CrossRef] [Green Version]
- Pant, R.; Thacker, S.; Hall, J.W.; Alderson, D.; Barr, S. Critical Infrastructure Impact Assessment Due to Flood Exposure. J. Flood Risk Manag. 2018, 11, 22–33. [Google Scholar] [CrossRef]
- Mühlhofer, E.; Koks, E.E.; Kropf, C.M.; Sansavini, G.; Bresch, D.N. A Generalized Natural Hazard Risk Modelling Framework for Infrastructure Failure Cascades. Reliab. Eng. Syst. Saf. 2023, 234, 109194. [Google Scholar] [CrossRef]
- Polytechnique Montréal Domino. Available online: https://www.polymtl.ca/centre-risque-performance/en/domino (accessed on 30 May 2023).
- Interdependent Networked Community Resilience Modeling Environment. Available online: https://incore.ncsa.illinois.edu/ (accessed on 1 June 2023).
- Huang, X.; Gao, J.; Buldyrev, S.V.; Havlin, S.; Stanley, H.E. Robustness of Interdependent Networks under Targeted Attack. Phys. Rev. E 2011, 83, 065101. [Google Scholar] [CrossRef] [PubMed] [Green Version]
- Mendonça, D.; Wallace, W.A. Impacts of the 2001 World Trade Center Attack on New York City Critical Infrastructures. J. Infrastruct. Syst. 2006, 12, 260–270. [Google Scholar] [CrossRef] [Green Version]
- Ouyang, M. Review on Modeling and Simulation of Interdependent Critical Infrastructure Systems. Reliab. Eng. Syst. Saf. 2014, 121, 43–60. [Google Scholar] [CrossRef]
- Atkinson, J.; Salmond, C.; Crampton, P. NZDep2018 Index of Deprivation; University of Otago: Wellington, New Zealand, 2020. [Google Scholar]
- Stats NZ 2018 Census Individual (Part 1) Total New Zealand by Statistical Area 1. Available online: https://datafinder.stats.govt.nz/layer/104612-2018-census-individual-part-1-total-new-zealand-by-statistical-area-1/ (accessed on 30 May 2023).
- Otago Regional Council Otago—Dunedin and Mosgiel LiDAR 1m DEM (2021)—National Elevation||GIS Data Map Mapping|LINZ Data Service. Available online: https://data.linz.govt.nz/layer/107710-otago-dunedin-and-mosgiel-lidar-1m-dem-2021/ (accessed on 30 May 2023).
- Fire and Emergency New Zealand Fire and Emergency NZ Localities—GIS Data Map Mapping—LINZ Data Service. Available online: https://data.linz.govt.nz/layer/104830-fire-and-emergency-nz-localities/ (accessed on 13 June 2022).
- Glassey, P.J. How Future Sea Level Rise Will Affect South Dunedin. Int. J. EI 2018, 1, 40–49. [Google Scholar] [CrossRef] [Green Version]
- Goldsmith, M.J.; Hornblow, S. The Natural Hazards of South Dunedin; Otago Regional Council: Dunedin, New Zealand, 2016; ISBN 978-0-908324-35-4.
- Bell, R.; Paulik, R.; Wadhwa, S. Coastal Hazard and Climate-Change Risk Exposure in New Zealand: Comparing Regions and Urban Areas. In Proceedings of the International Federation of Surveyors (FIG) Working Week, Christchurch, New Zealand, 2–6 May 2016. [Google Scholar]
- Paulik, R.; Stephens, S.; Wild, A.; Wadhwa, S.; Bell, R.G. Cumulative Building Exposure to Extreme Sea Level Flooding in Coastal Urban Areas. Int. J. Disaster Risk Reduct. 2021, 66, 102612. [Google Scholar] [CrossRef]
- Paulik, R.; Stephens, S.; Bell, R.; Wadhwa, S.; Popovich, B. National-Scale Built-Environment Exposure to 100-Year Extreme Sea Levels and Sea-Level Rise. Sustainability 2020, 12, 1513. [Google Scholar] [CrossRef] [Green Version]
- Naish, T.; Levy, R.H.; Hamling, I.J.; Garner, G.; Hreinsdóttir, S.; Kopp, R.E.; Golledge, N.R.; Bell, R.; Paulik, R.; Lawrence, J.; et al. The Significance of Vertical Land Movements at Convergent Plate Boundaries in Probabilistic Sea-Level Projections for AR6 Scenarios: The New Zealand Case. ESS Open Arch. 2022. [Google Scholar] [CrossRef]
- Yunus, A.; Avtar, R.; Kraines, S.; Yamamuro, M.; Lindberg, F.; Grimmond, C. Uncertainties in Tidally Adjusted Estimates of Sea Level Rise Flooding (Bathtub Model) for the Greater London. Remote Sens. 2016, 8, 366. [Google Scholar] [CrossRef] [Green Version]
- Intergovernmental Panel on Climate Change (IPCC). The Ocean and Cryosphere in a Changing Climate: Special Report of the Intergovernmental Panel on Climate Change, 1st ed.; Cambridge University Press: Cambridge, UK, 2022; ISBN 978-1-00-915796-4. [Google Scholar]
- Kok, M.; Huizinga, H.J.; Vrouwenfelder, A.C.W.M.; Barendregt, A. Standard Method 2004. Damage and Casualties Caused by Flooding; Road and Hydraulic Engineering Institute: Amsterdam, The Netherlands, 2004. [Google Scholar]
- Reese, S.; Ramsay, D. RiskScape: Flood Fragility Methodology; Vulnerability, Resilience, and Adaptation Objective 2 Reports; NIWA: Wellington, New Zealand, 2010. [Google Scholar]
- Paulik, R.; Horspool, N.; Woods, R.; Griffiths, N.; Beale, T.; Magill, C.; Wild, A.; Popovich, B.; Walbran, G.; Garlick, R. RiskScape: A Flexible Multi-Hazard Risk Modelling Engine. Nat. Hazards 2022, 1–18. [Google Scholar] [CrossRef]
- Boeing, G. OSMnx: New Methods for Acquiring, Constructing, Analyzing, and Visualizing Complex Street Networks. Comput. Environ. Urban Syst. 2017, 65, 126–139. [Google Scholar] [CrossRef] [Green Version]
- Dunedin City Council Wastewater Treatment Plants—Dunedin City Council. Available online: https://www.dunedin.govt.nz/services/wastewater/wastewater-treatment-plants (accessed on 30 May 2023).
- Searise NZ Searise. Available online: https://www.searise.nz/maps-2 (accessed on 20 September 2022).
- Stephens, S.; Paulik, R. Mapping New Zealand’s Exposure to Coastal Flooding and Sea-Level Rise; National Institute of Water & Atmospheric Research: Wellington, New Zealand, 2023. [Google Scholar]
| Disclaimer/Publisher’s Note: The statements, opinions and data contained in all publications are solely those of the individual author(s) and contributor(s) and not of MDPI and/or the editor(s). MDPI and/or the editor(s) disclaim responsibility for any injury to people or property resulting from any ideas, methods, instructions or products referred to in the content. |
© 2023 by the authors. Licensee MDPI, Basel, Switzerland. This article is an open access article distributed under the terms and conditions of the Creative Commons Attribution (CC BY) license (https://creativecommons.org/licenses/by/4.0/).


