Article

Hydraulic Response and Overtopping Performance of Single-Layer Double Cube Unit Armored Mound Breakwater

1
Builders Ecole D’Ingenieurs, 1 Rue Pierre et Marie Curie, 14610 Epron, France
2
Normandie University, UNICAEN, UNIROUEN, CNRS, M2C, 14000 Caen, France
3
School of Civil Engineering, College of Engineering, University of Tehran, 16th Azar St., Enghelab Sq., Tehran 1417466191, Iran
4
Cerema Eau Mer Fleuves, 60280 Margny-Lès-Compiègne, France
*
Author to whom correspondence should be addressed.
J. Mar. Sci. Eng. 2023, 11(7), 1382; https://doi.org/10.3390/jmse11071382
Submission received: 2 June 2023 / Revised: 23 June 2023 / Accepted: 1 July 2023 / Published: 6 July 2023
(This article belongs to the Special Issue Advanced Studies in Breakwaters and Coastal Protection)

Abstract

:
A newly developed friction-interlocking armor unit called the ‘Double cube’ (DC) was designed to improve the performance of a concrete armor unit used in river/marine structures against currents/waves actions. The DC unit is an octagonal-shaped block made up of two parts: an upper cube set on a lower base that is either square or octagonal in shape. The innovative design aims to provide good performance in terms of stability, to allow for high tolerance placement with various contact points, and to allow for ease of placement. The DC’s shape and placement enhance the unit’s stability by bringing the center of gravity closer to the underlayer and by providing a large contact surface with the surrounding blocks that reduces the chance of extraction and limits movements (rocking, lifting) via the “keystone” effect. The characteristics of this new unit provide a relatively high hydraulic stability number for the armor layer (NS = 2.9), a favorable hydraulic performance due to energy dissipation from turbulence and aeration, as well as a high roughness coefficient (γf ≈ 0.46), helping to reduce overtopping.

1. Introduction

Among all the various parts composing a rubble mound breakwater, the armor layer represents the key component of the structure’s stability. It is composed either of quarry stones or of artificial concrete armor units. The latter can be efficient alternatives to replace the rock armor materials when one cannot provide the appropriate natural rocks in sufficient quantity or size to ensure stability (CIRIA [1]).
In the context of climate change and significant sea level rise, coastal engineers and scientists are still conducting extensive research on developing new types of artificial armor units to improve performance, reducing the amount of concrete used, and limit the visual and environmental impacts.
Key considerations for an artificial unit are:
  • Hydraulic stability.
  • Good performance in terms of run-up and overtopping.
  • Structural robustness.
  • Ease and speed of placement with sufficient tolerances, ease of handling and simplicity of lifting.
  • Easy prefabrication with a simple mold composed of limited parts.
  • Ease of storage.
In recent decades, there has been a resurgence of interest in structurally robust forms: Accropode®I, Coreloc®, Xbloc® (CIRIA [1]), and Crablock (Salauddin et al. [2,3]), and particularly for simpler shapes, Cubipod® (Gómez-Martín and Medina [4,5]) and C-ROC (Perrin et al. [6]). It is also worth mentioning that during recent years, many new regular-placed armor blocks have been introduced in the literature, such as Xbloc® Plus (Reedijk et al. [7]), Chi (Park et al. [8]), Starblock (Safari et al. [9,10,11,12]), and TB-CUBE (Peng et al. [13]).
The stability of concrete armor units against waves is achieved through the units’ own weight, friction, and interlocking (CERC [14], CIRIA [1]). Setting aside the hollowed units, which are placed in a tight regular pattern side by side and rather confined to revetments, the best performing units in terms of hydraulic stability are those that mobilize strong interlocking, for example, the Dolos. However, since the failure of the Sines breakwater, engineers have been hesitant to use slender units, which are thought to be structurally fragile (Bakker et al. [15,16]). Bulky units such as Accropode®I appear to be more preferred by coastal structure designers. For the same reason—the significance of the structural integrity of armor blocks—some of the most basic armor blocks, such as cubes, are frequently employed in the design of breakwaters. Concrete armor blocks may be placed in one or two layers according to a random or a regular pattern (Van Gent and Luis [17]).
Nowadays, the most commonly used armor blocks are double-layer cube-shaped blocks and interlocking-type armor blocks. Interlocking type armor blocks can be placed in single-layer or double-layer placements. Single-layer interlocking armor blocks are particularly interesting for economic reasons, due to their cost efficiency (CIRIA [1]).
The objective of this group was primarily to propose optimized shapes leading to high strength and high stability, and secondarily to reduce overtopping. These characteristics led to the development of high-interlocking units with more empty spaces between units, leading to an increased porosity of the armor layer. The major drawback regarding the placement of these types of units is that the placement can strongly affect the hydraulic stability of the armor layer (Jensen [18]). The random placement method, used for most single-layer blocks, is constrained by several rules governing the blocks’ orientation, as well as their positioning or number of contacts. The latter affects the placement process and thus, the cost of the entire project (CIRIA [1]).
This is one of reasons that authors such as Bhageloe [19], d’Angremond et al. [20], Van Gent et al. [21,22,23], Van Buchem [24], Van Gent and Luis [17], Van der Lem et al. [25], Van Gent and van der Werf [26], and Vieira et al. [27,28,29] proposed that single-layer-placed cubes could be an economically interesting alternative solution for the construction of the armor layer.
However, simple single-layer cubes suffer from a huge disadvantage, as they tend to fit face-to-face during storms. (Medina et al. [30]). In such cases, the placement tends to form a heterogeneous porous armor layer with areas of high cube concentration to the detriment of other parts with less protective cover (Figure 1).
Low porosity cubes arranged closely together are likely to experience excessive pore pressure inside the breakwater, which is unfavorable for stability. Consequently, a damaged armor layer cannot not provide sufficient cover for exposed underlayers; therefore, such an arrangement would increase the risk of material extraction. A single armor layer of cubes, if not designed with a very low porosity, would likely experience significant settlement. Moreover, the edges and sharp corners of the cubes would be subjected to localized breakages, not only during placement but also throughout the life of the structure (Safari [9]).
Therefore, even if the hydraulic stability performance is acceptable, the outer surface of the armor would be rather smooth, as the units would be parallel to the breakwater’s slope, thus enhancing the overtopping rates.
In general, cubes placed in a single layer exhibit a stability number (Ns) between 2 and 3, depending on the packing density of the armor layer (Van Gent et al. [21,22,23]). Regarding overtopping, the roughness coefficient is close to 0.5 for the single-layer cube armor layer, whereas it decreases to 0.47 for cubes in two layers, resulting in an unexpectedly small gap (CIRIA [1]).
The Cubipod® recently developed by the PCUPV laboratory (Ports and Coasts of the University of Valencia Polytecnic) also illustrates the strong interest in the simple cube shape. This unit is based on a cube shape with a protrusion (half pyramid) located on each face. In order to avoid face-to-face contact, the cubes are moved away from one another; protrusions are used. This design is intended to obtain a greater, more uniform porosity. (Gómez-Martín and Medina [4,5]). Nevertheless, this unit does not provide higher stability in a single layer compared to other existing irregularly placed armor units. (Salauddin et al. [2]).
This demonstrates that a more effective concrete armor can be proposed with a simple shape, while still assuring an easy placement method and construction. From a general point of view, stability is closely related to interlocking. In contrast, a strong interlocking results in a low surface porosity and permeability, leading to unsatisfactory hydraulic responses (Safari et al. [11]). This contradiction between stability and overtopping provides an incentive to look for innovative unit forms able to reach an optimal compromise.
The main purpose of this research is to develop a new artificial unit, namely the ‘Double Cube’ or DC, for breakwater protection against wave action. DC is comprised of a cubic base with chamfered corners and an upper half with a cubic shape that has a smaller cross section than the base part. The basic design idea consists in developing a bulky armor unit (Dupray and Roberts [31]) that fulfills the following main criteria:
  • Able to be placed in a single layer on a 3V: 4H slope.
  • A homogeneous porosity.
  • Easy to place; it might be an advantage that the unit could be placed on a filter made of rather small size elements to avoid surface irregularities.
  • High hydraulic stability (expected NS (KD) ≈ 2.9 (18)).
  • High rough surface armoring (γf ≈ 0.46).
All physical modeling tests were performed in 2D wave flume, the units being placed on a uniform slope and subjected to irregular waves. Section 2 presents the DC’s shape and the logic of the geometry unit. Section 3 focuses on two proposed placements for DC units, ‘Direct placement’ and ‘Random placement’. Section 4 presents physical model tests and explains the armor damage analysis and overtopping measurement used in this research. Section 5 and Section 6 describe the 2D hydraulic stability tests of DC models and provide a comparison with the other single armor units. Finally, the most relevant conclusions of this research are provided in Section 7.

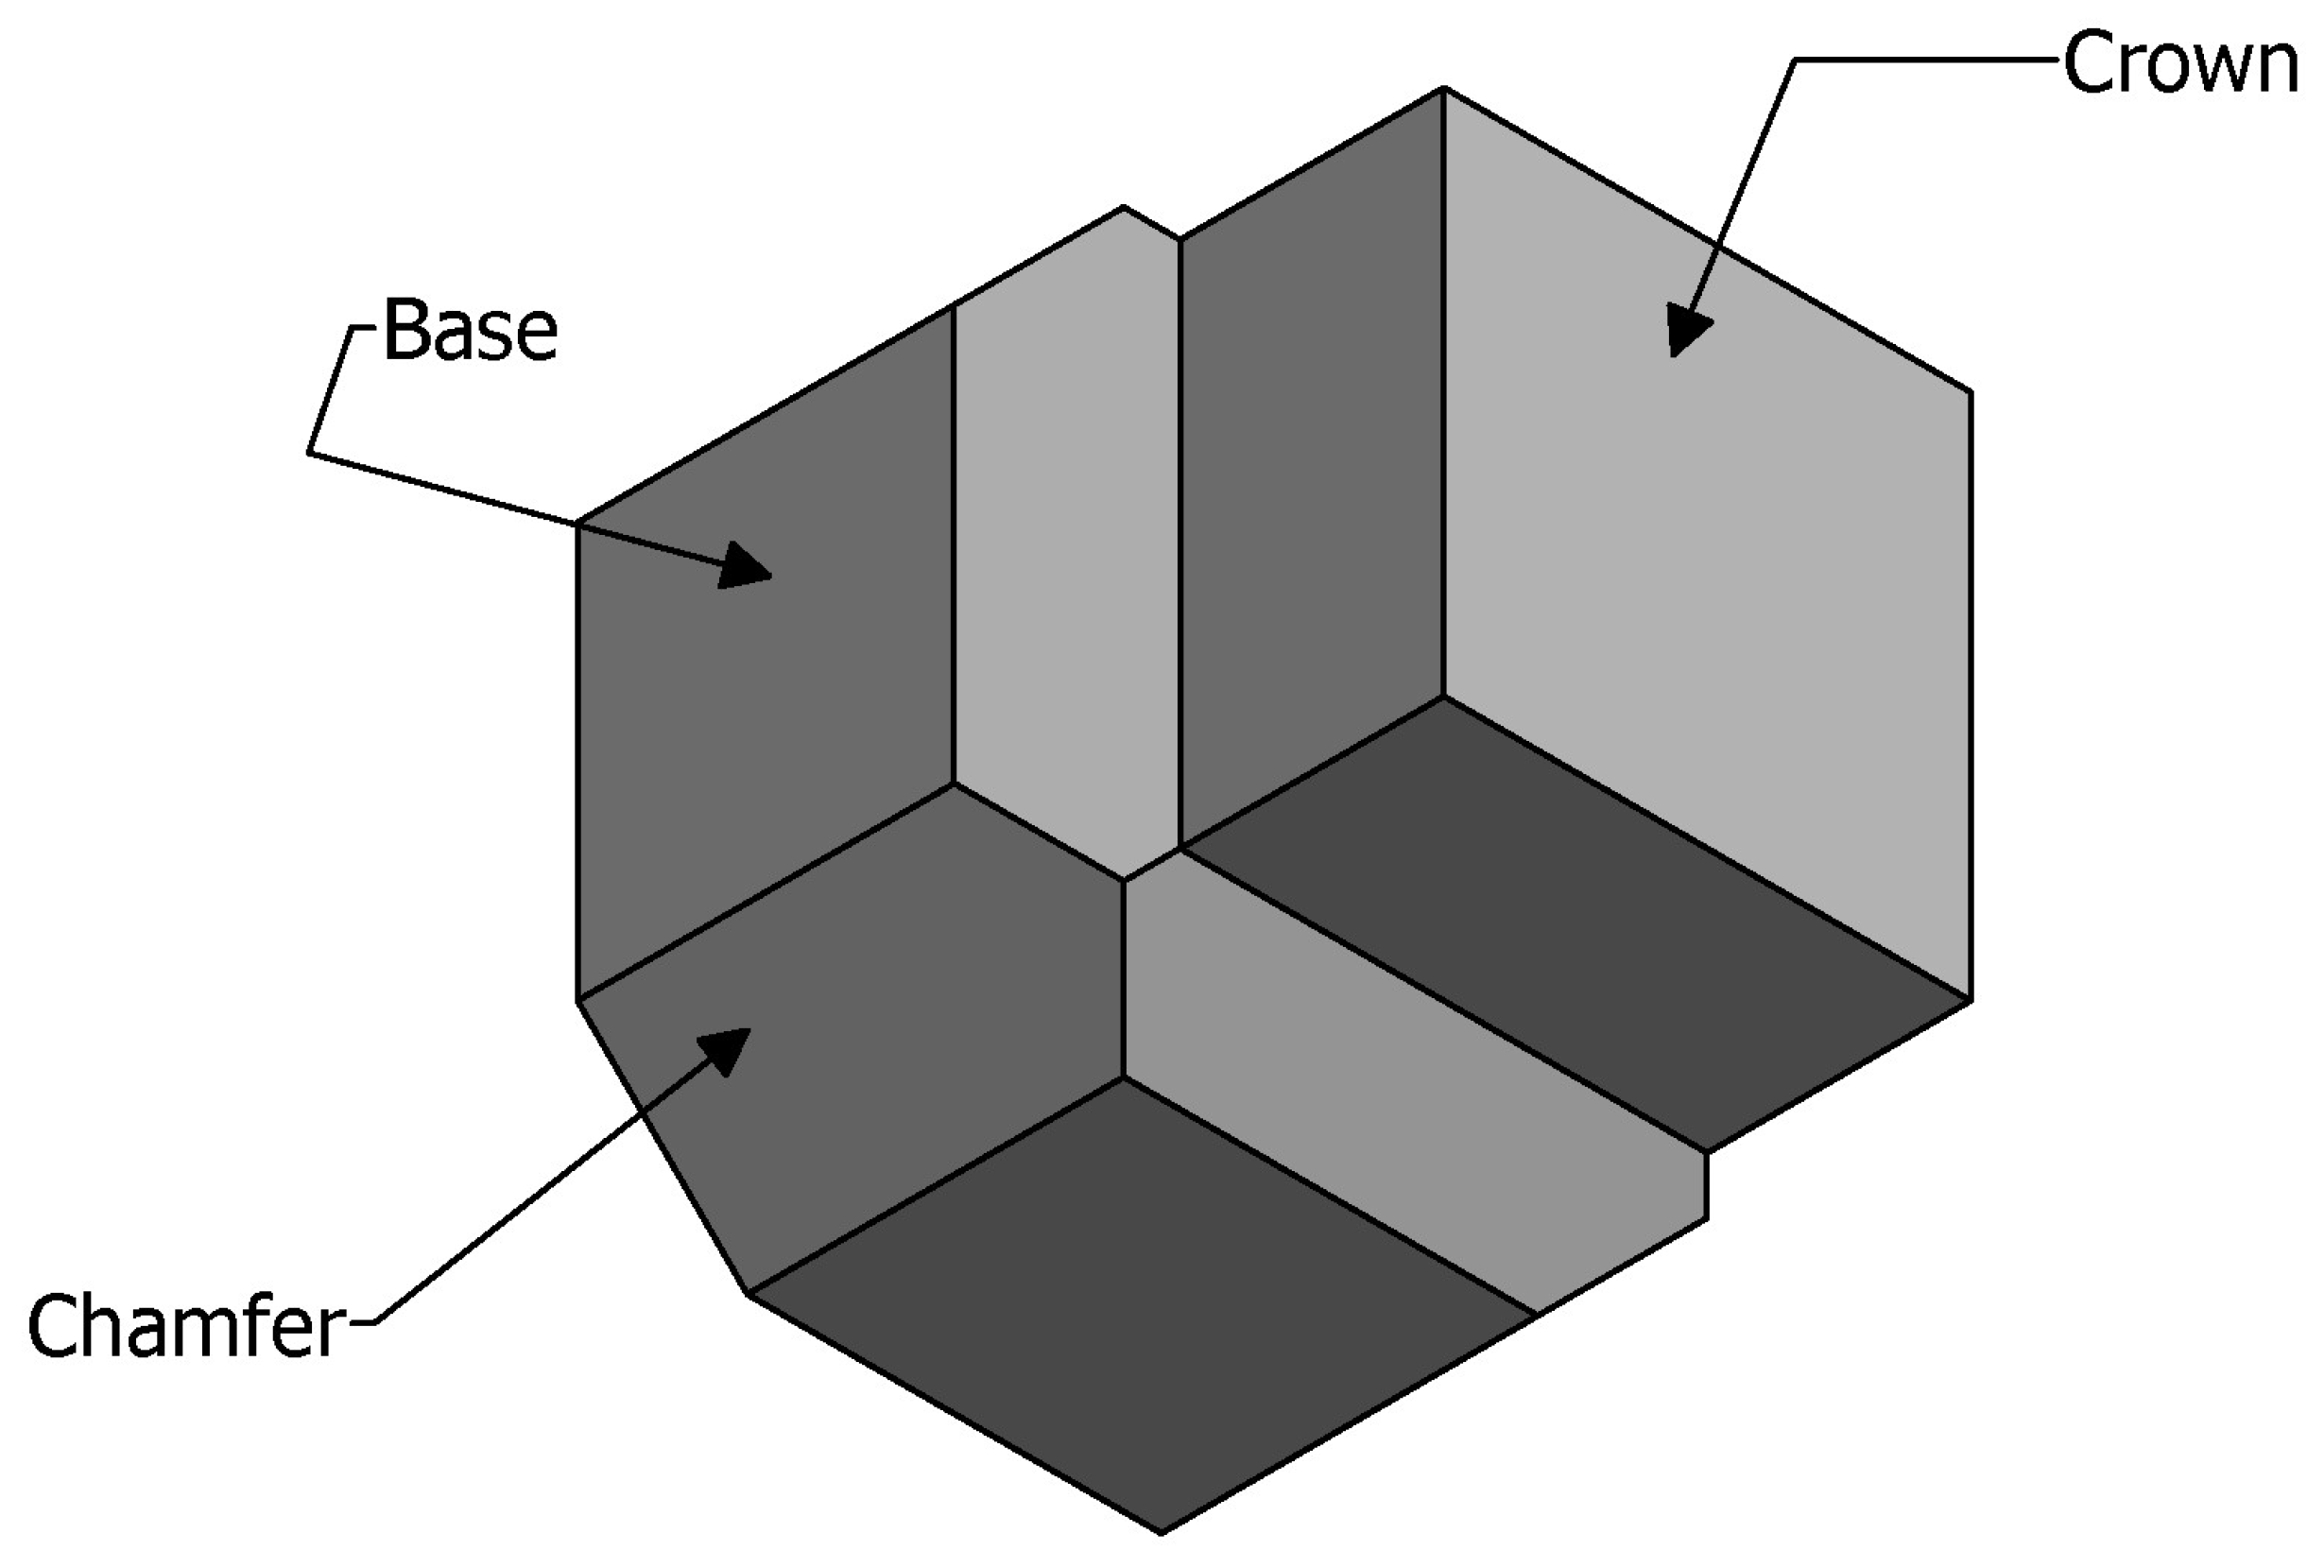
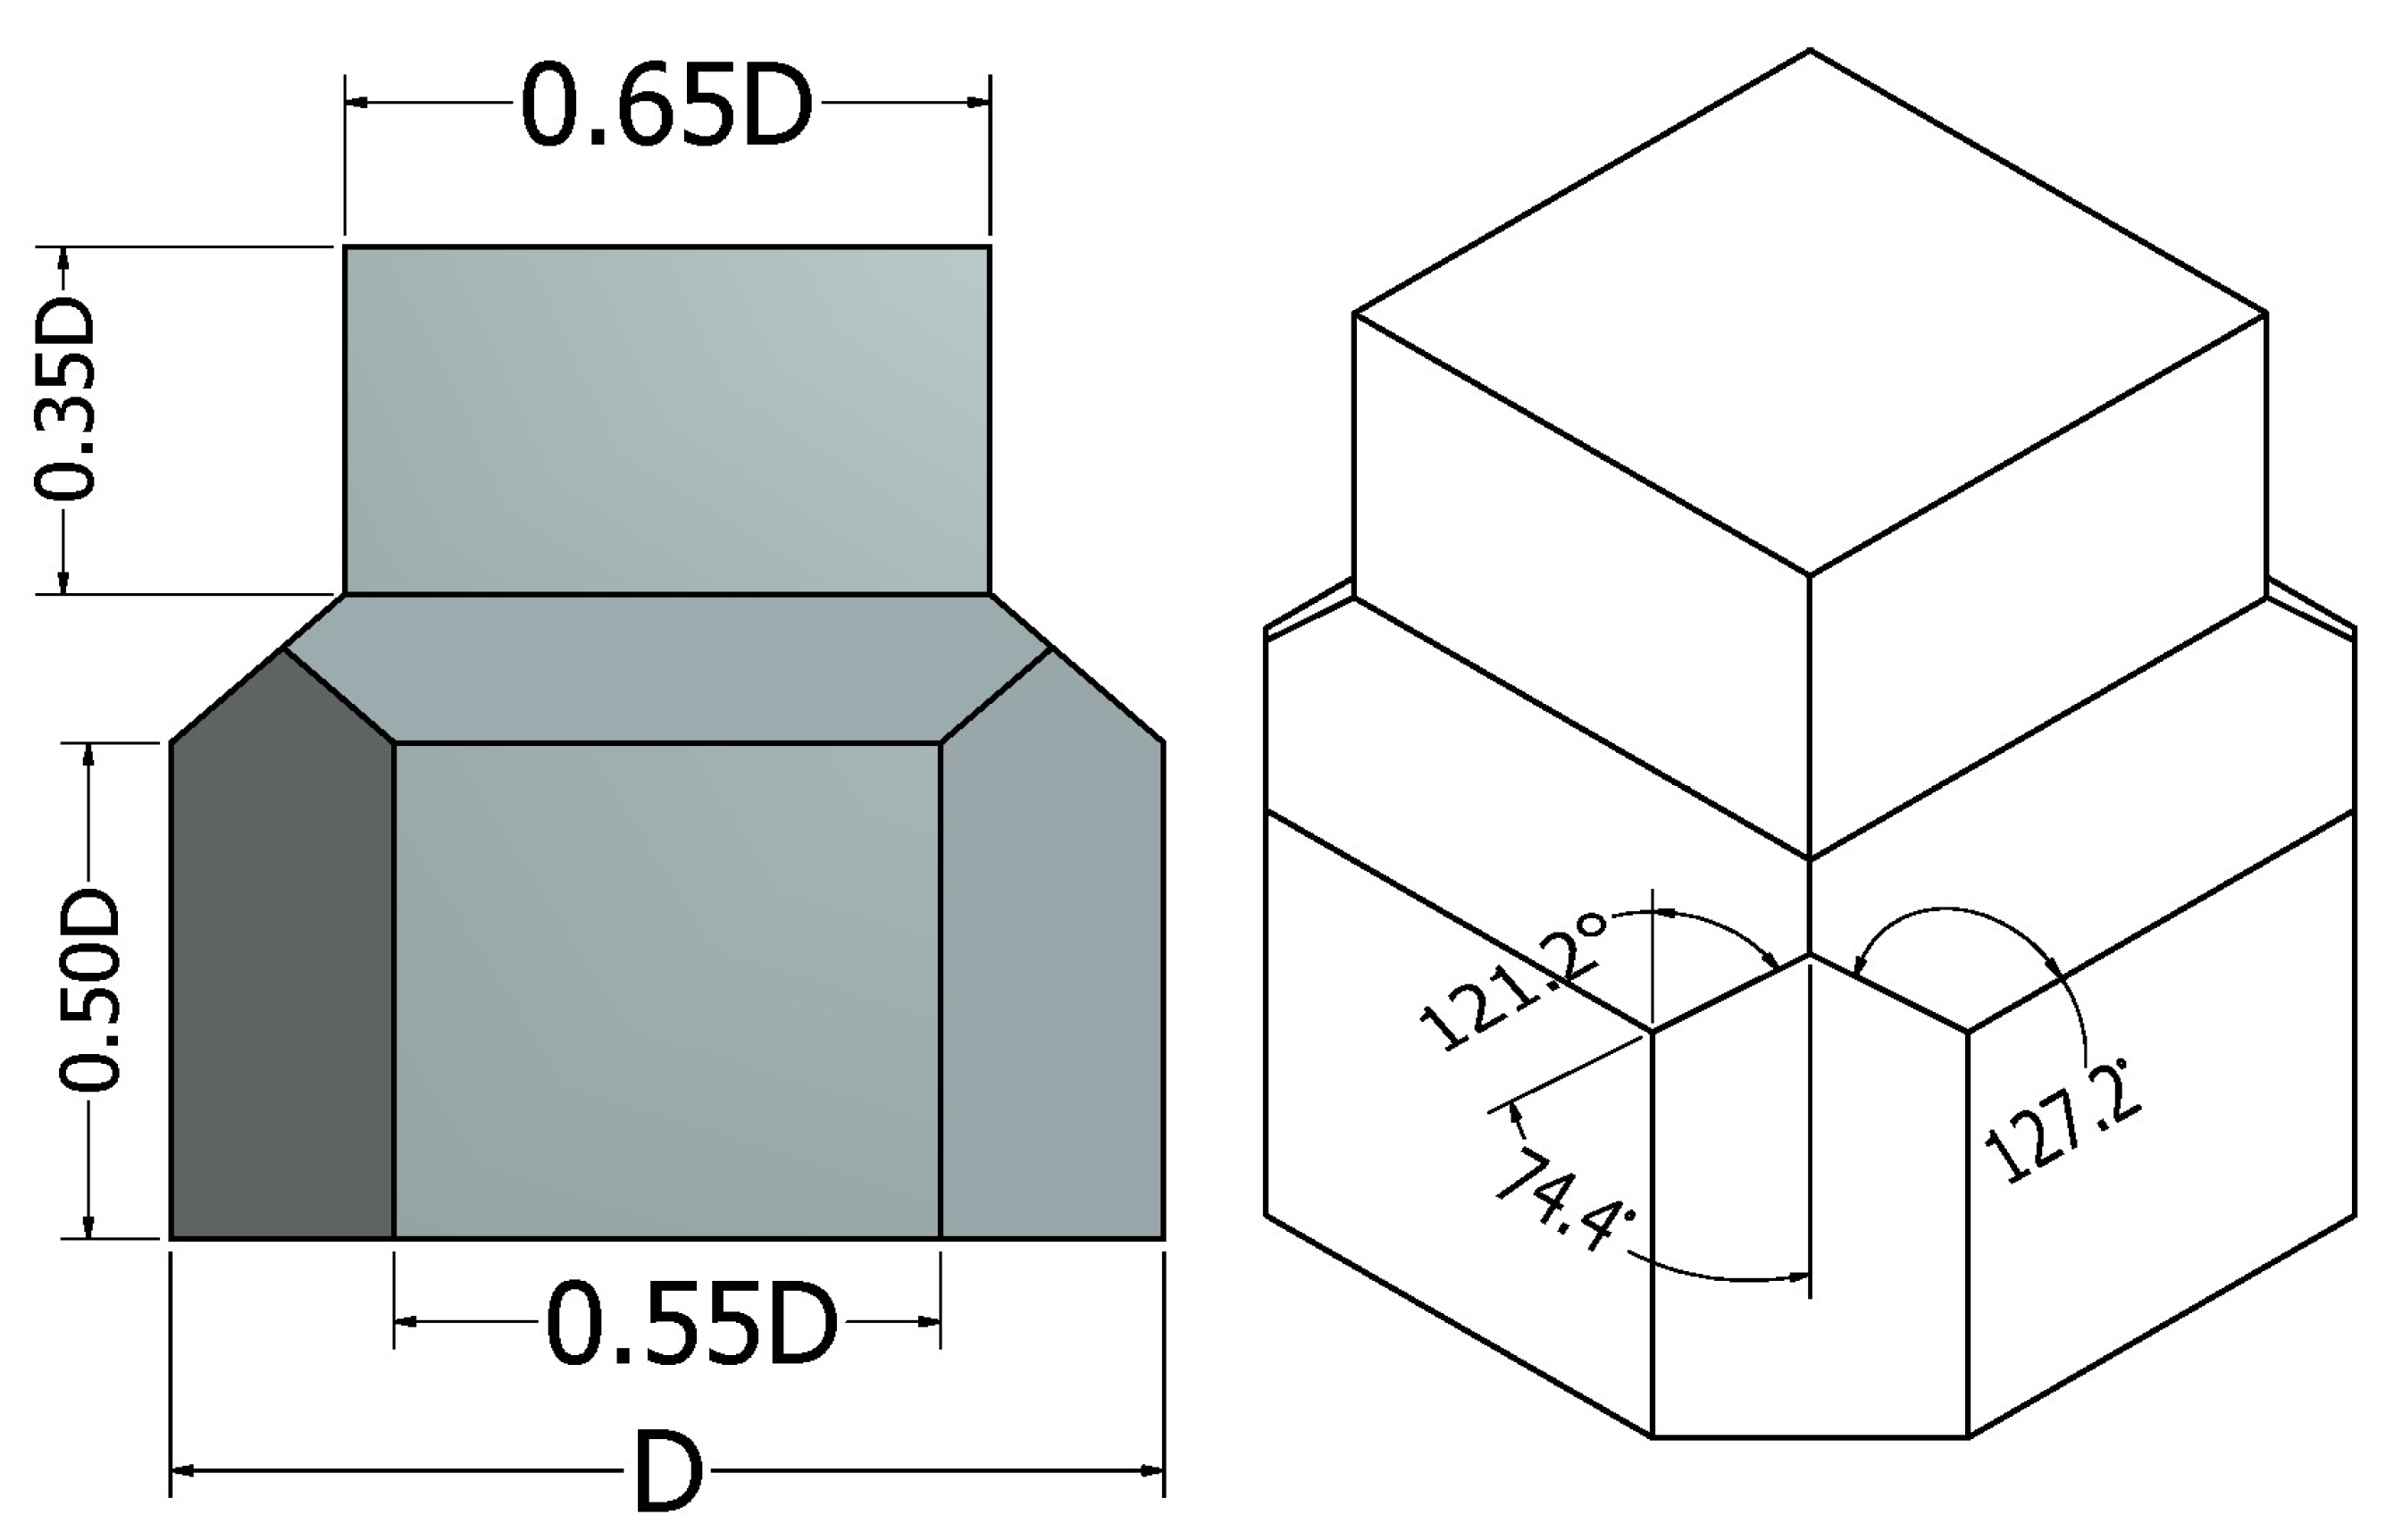
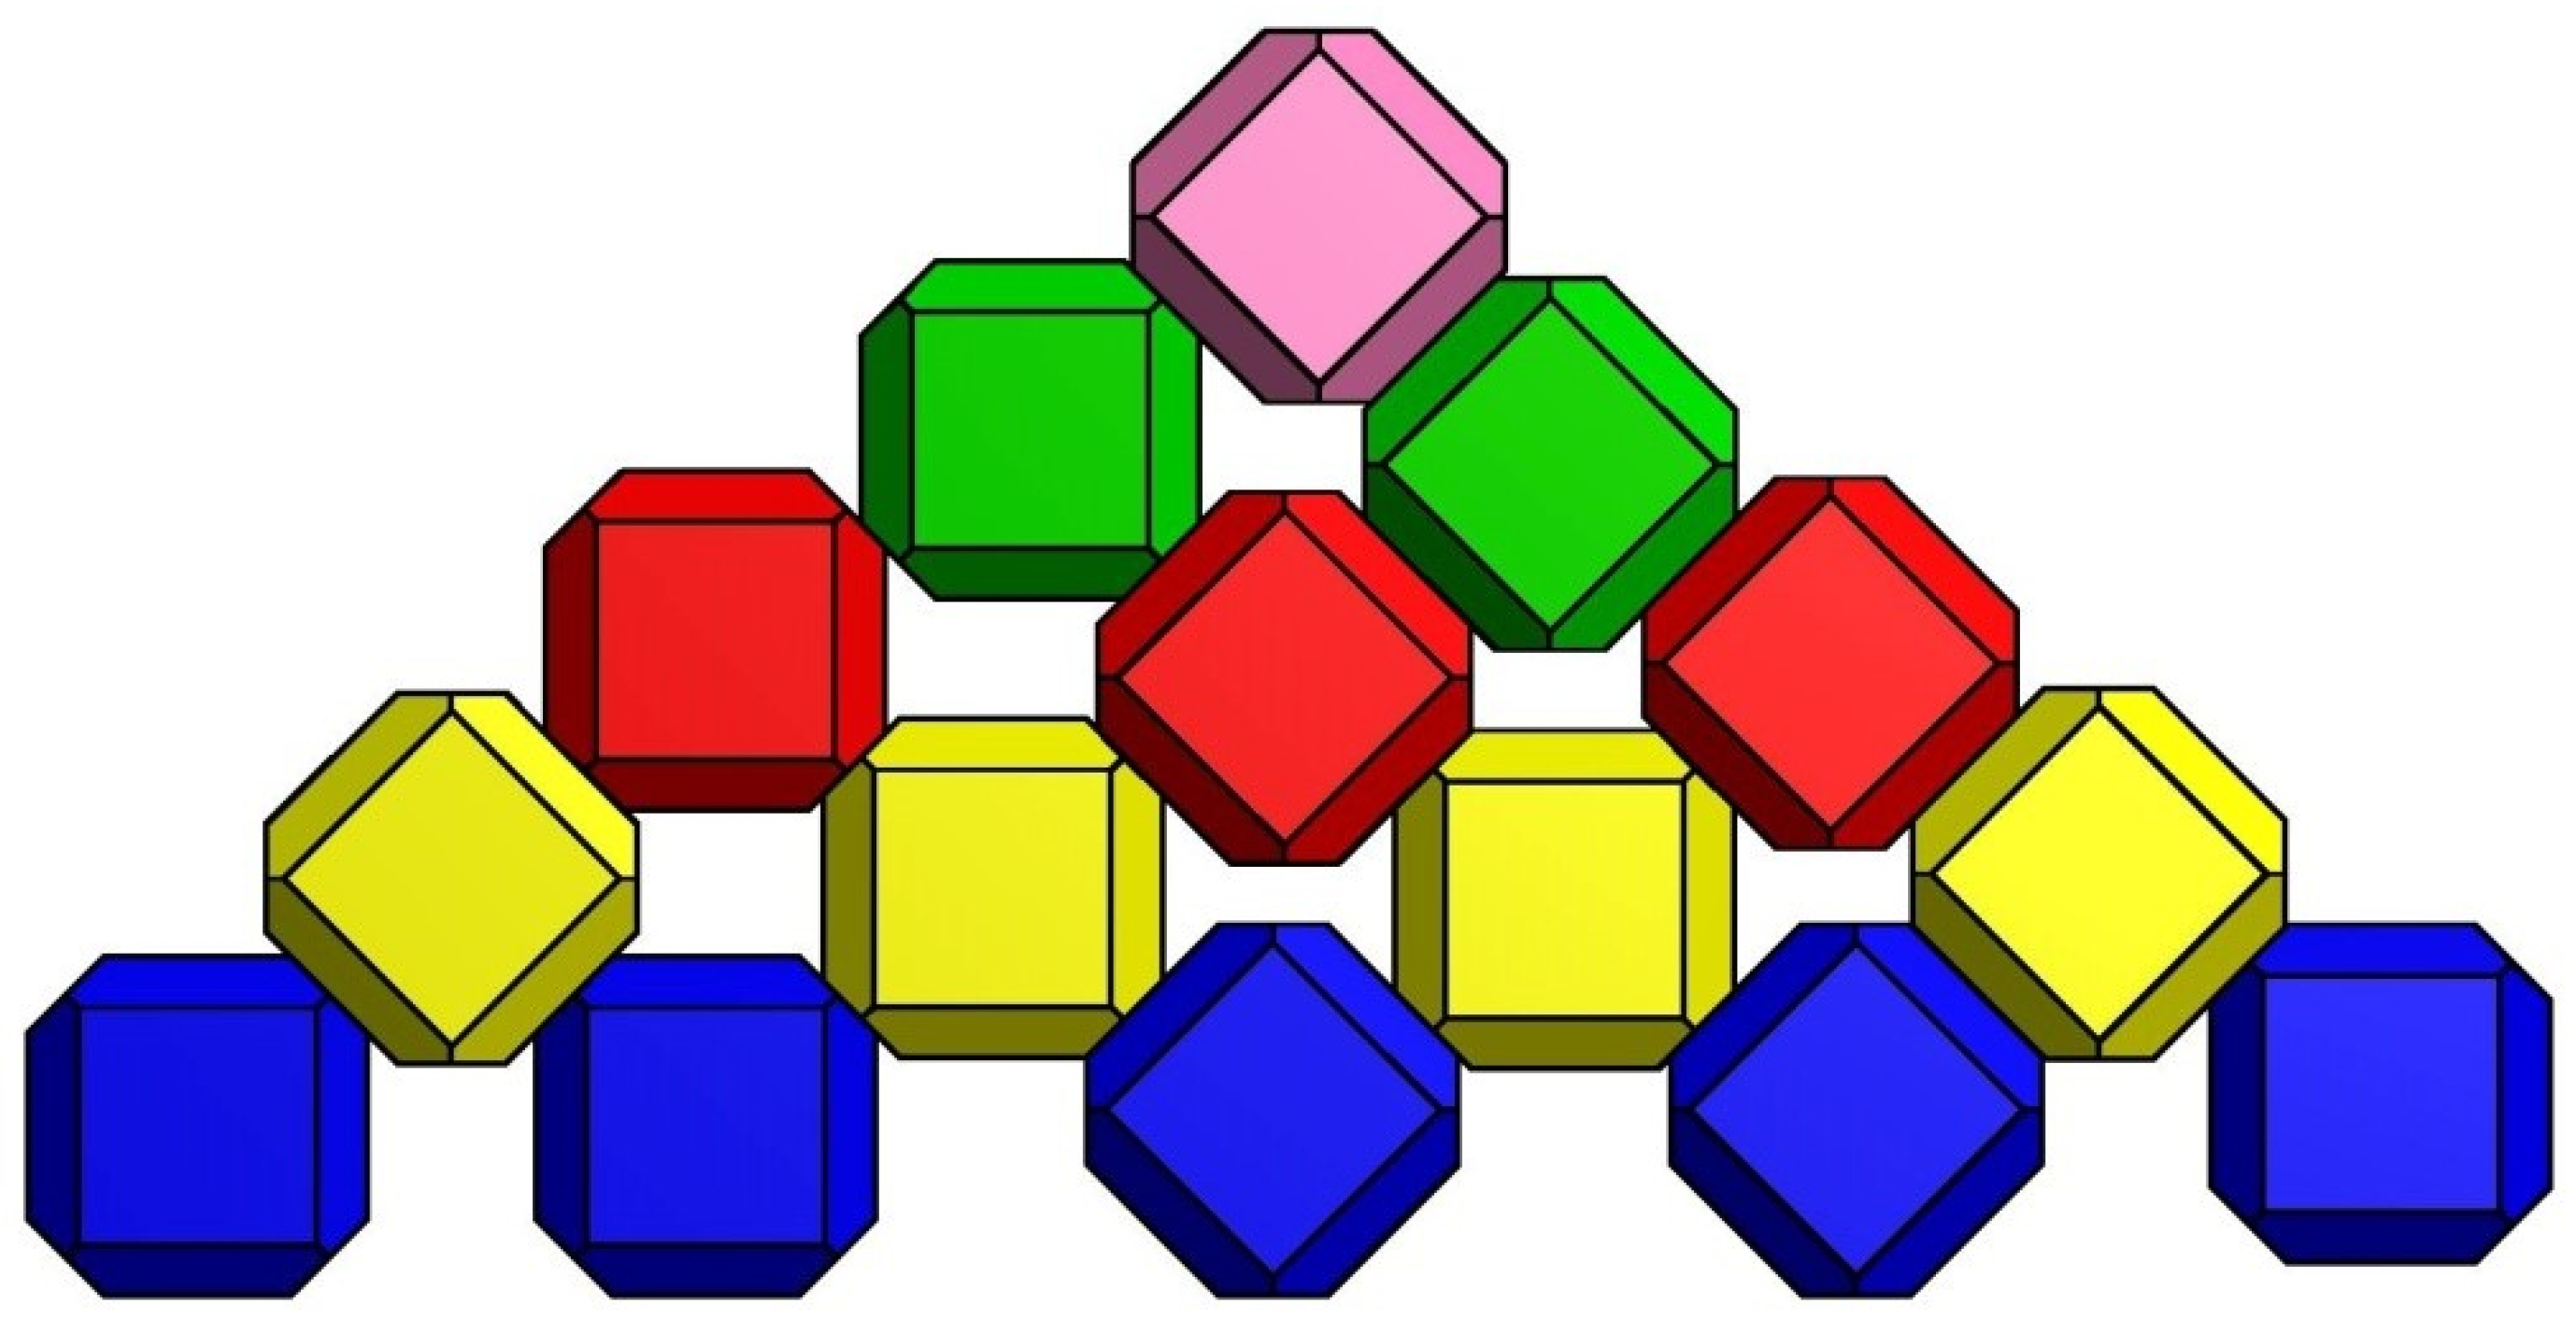
2. Logic of the New Designed Geometry
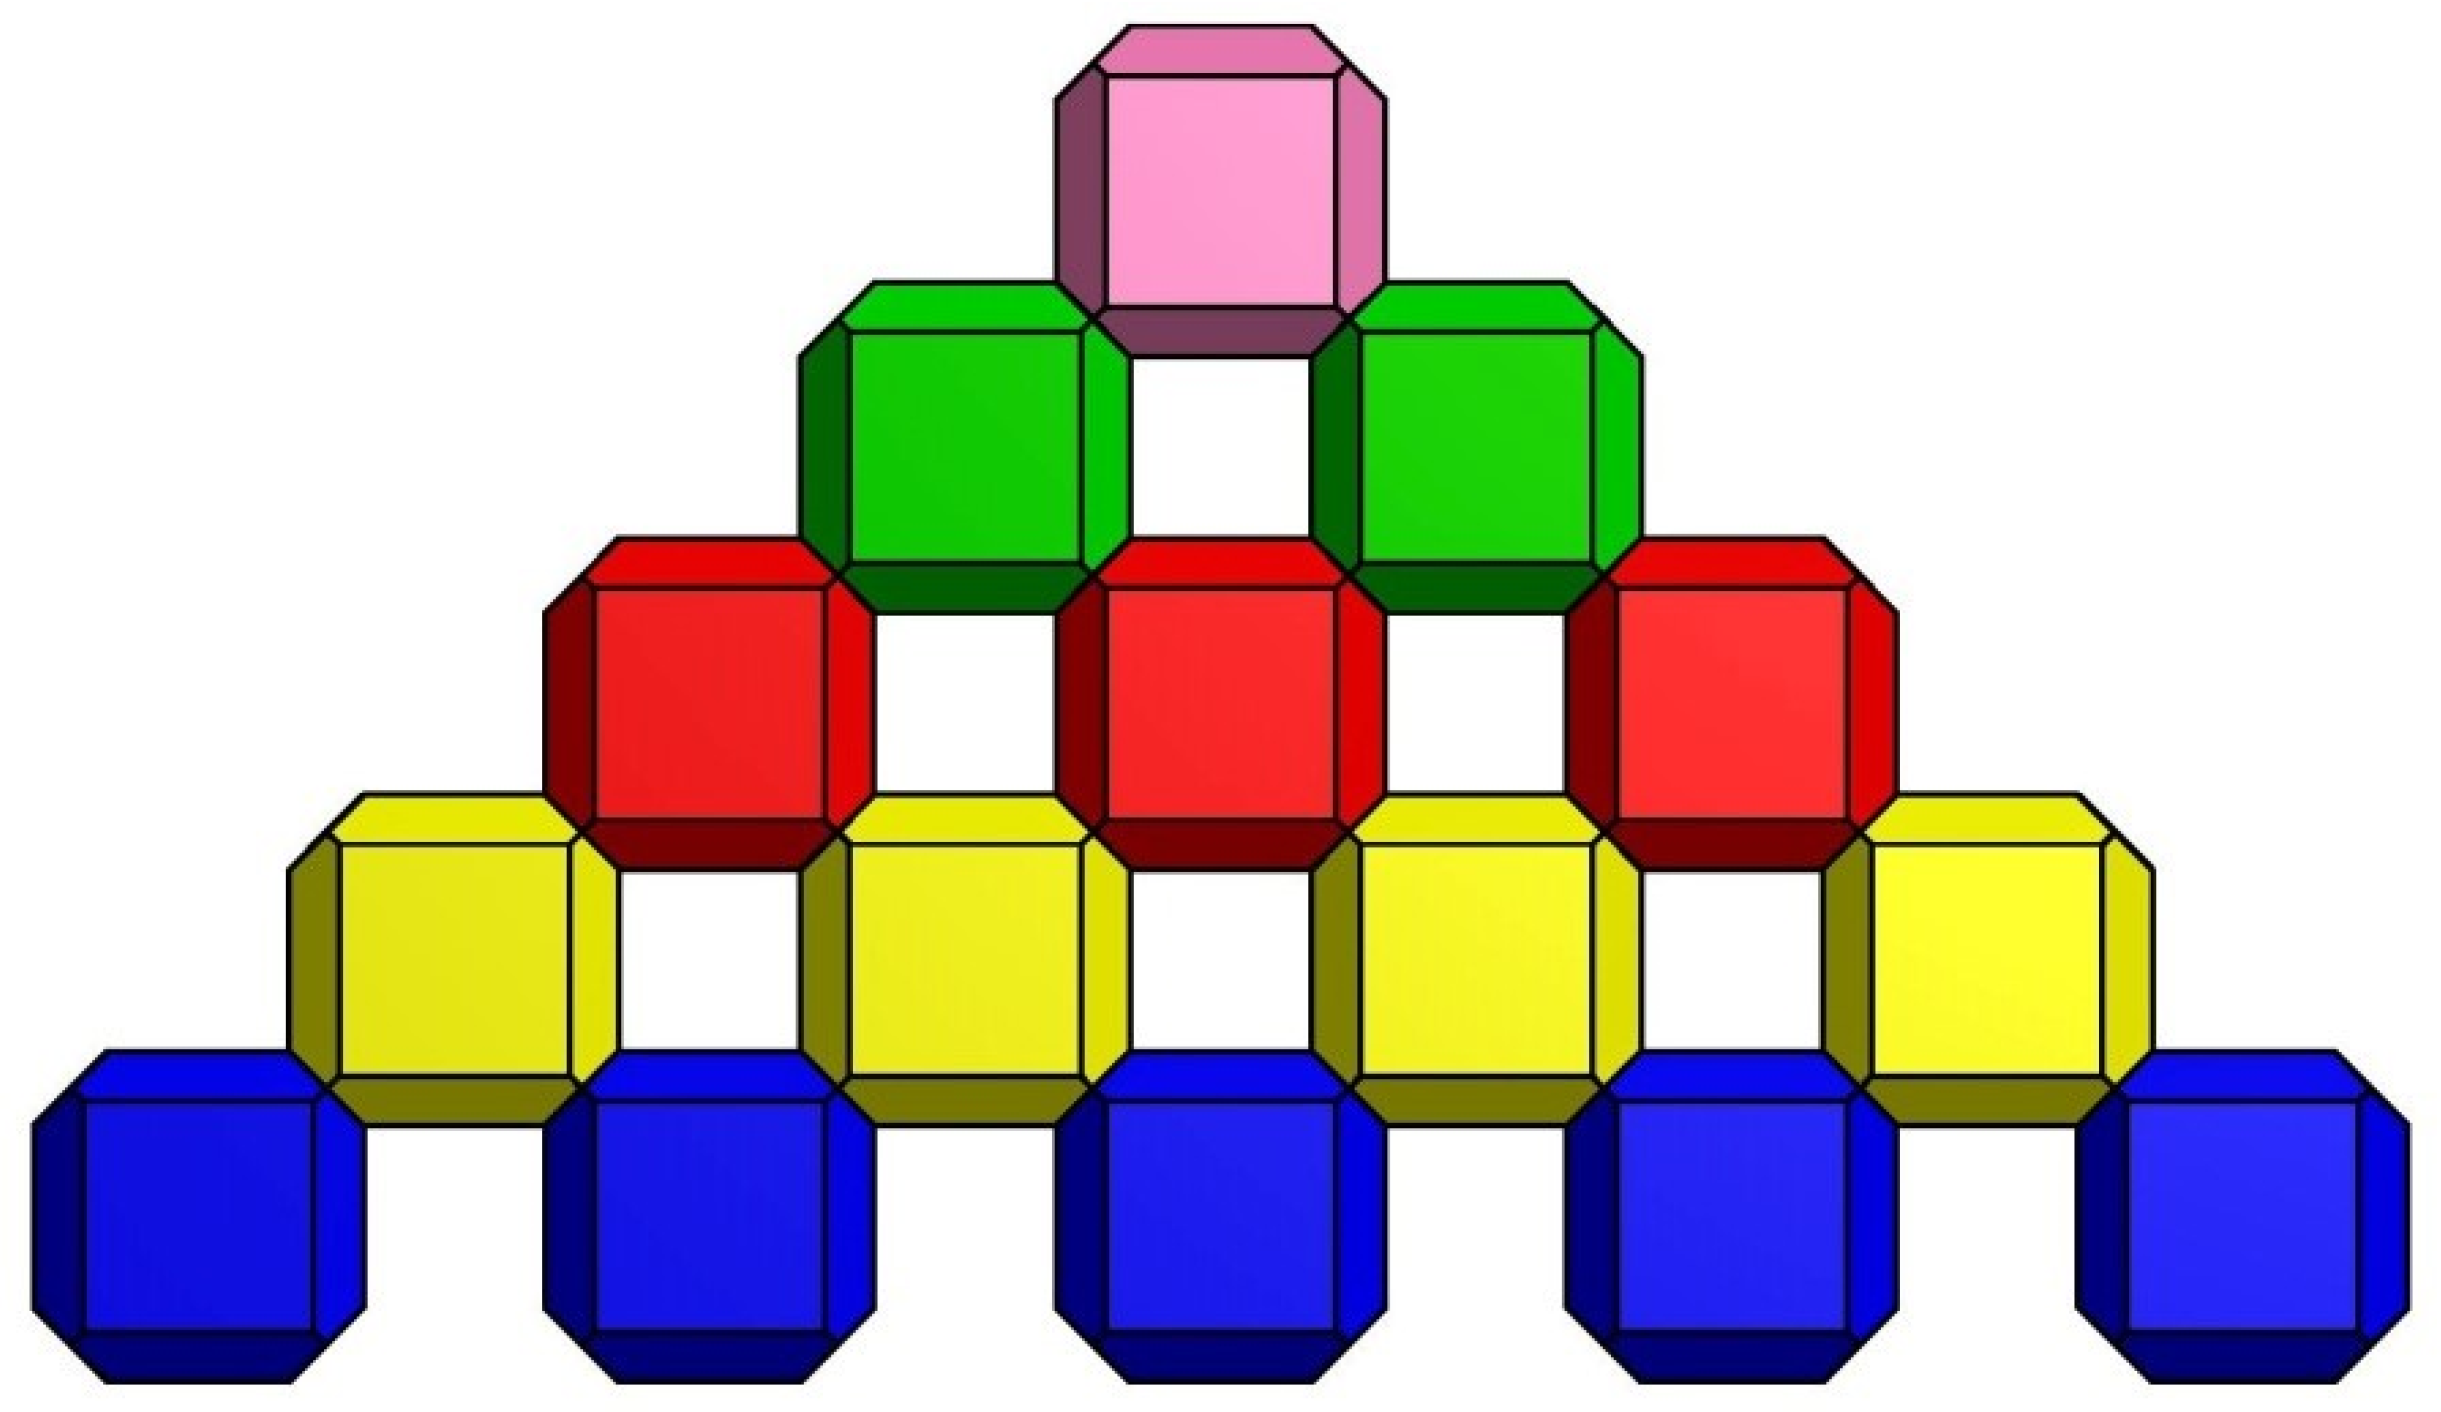
It is well known that the stability of an armor layer increases with increasing packing density and decreases with decreasing porosity (Medina and Gómez-Martín [32]). It has also been proven that a decrease in porosity leads to an unfavorable increase in overtopping (Safari et al. [10]). The DC’s goal is to take advantage of these functions by combining two parts into one unit.
The DC consists of a cubic base with chamfered corners (hexagonal form), topped by a cubic form with a reduced cross-sectional area compared to the base part (Figure 2). The upper part and lower part are connected with a short transition part to reduce the structural tensions.
The rough pattern created by the high porosity of upper part of the block increases the dissipation of wave energy. The upper part, which can be of different shapes such as square or octagonal, creates a rough outer layer that is able to dissipate the energy of the flows close to the armor layer. The upper part also offers a grip for clamps and cranes due to the large gaps around the upper part of units.
The lower part of the new unit contributes the most to the block’s weight as well as frictional forces, therefore ensuring the stability of the block. The unit’s base has been chamfered to ensure a minimum porosity, even with a tight placement or different orientations of the units. The transition zone eliminates the sharp corners that are most exposed to contact. Chamfers also provide better quality supports and contact surfaces for the blocks.
The chamfers also offer the possibility for a number of different regular placements, with a homogeneous porosity over the entire surface and without the risk of uneven settlement of the armor layer (surface porosity).
The dimensions of chamfered DCs were standardized on the following ratios based on the characteristic dimension “D”, the side length of the unit in which the element fits (Figure 3):
The volume of an individual unit, as a function of characteristic dimension, can be given by:
V = 0.698   D 3 = D n 3
where Dn is the nominal diameter of the unit and D is the ‘primary or characteristic’ length of the unit.

3. Placement Method

One of the most important features of each block is the ease of placement, as a difficult or complicated placement method can be time consuming and therefore increase the final cost of the project. A series of 3D virtual models were used to assess the possible placement configurations and their properties.
Different placements were modelled to find the best performing configuration regarding the following criteria:
  • Interlocking of the units, taking into account the blocks’ geometry to avoid loose connections.
  • Optimal porosity of the armor layer, to increase wave dissipation and minimize the run-up as well as the uplift pressure.
In this study, the packing density coefficient (ϕ) and the armor layer porosity (nv) are defined by the following equations (CIRIA [1]):
ϕ = N a A D n 2 = t a 1 n v / D n
n v = 100 [ 1 N a D n 3 A t a ]
where Na is the total number of armor units in the studied area, A is the surface area of the armor layer parallel to the slope, Dn is the nominal diameter of armor unit, ta is the armor layer thickness.
In the following sections, two proposed placements for the DC units, ‘Direct placement’ and ‘Random placement’, will be discussed.

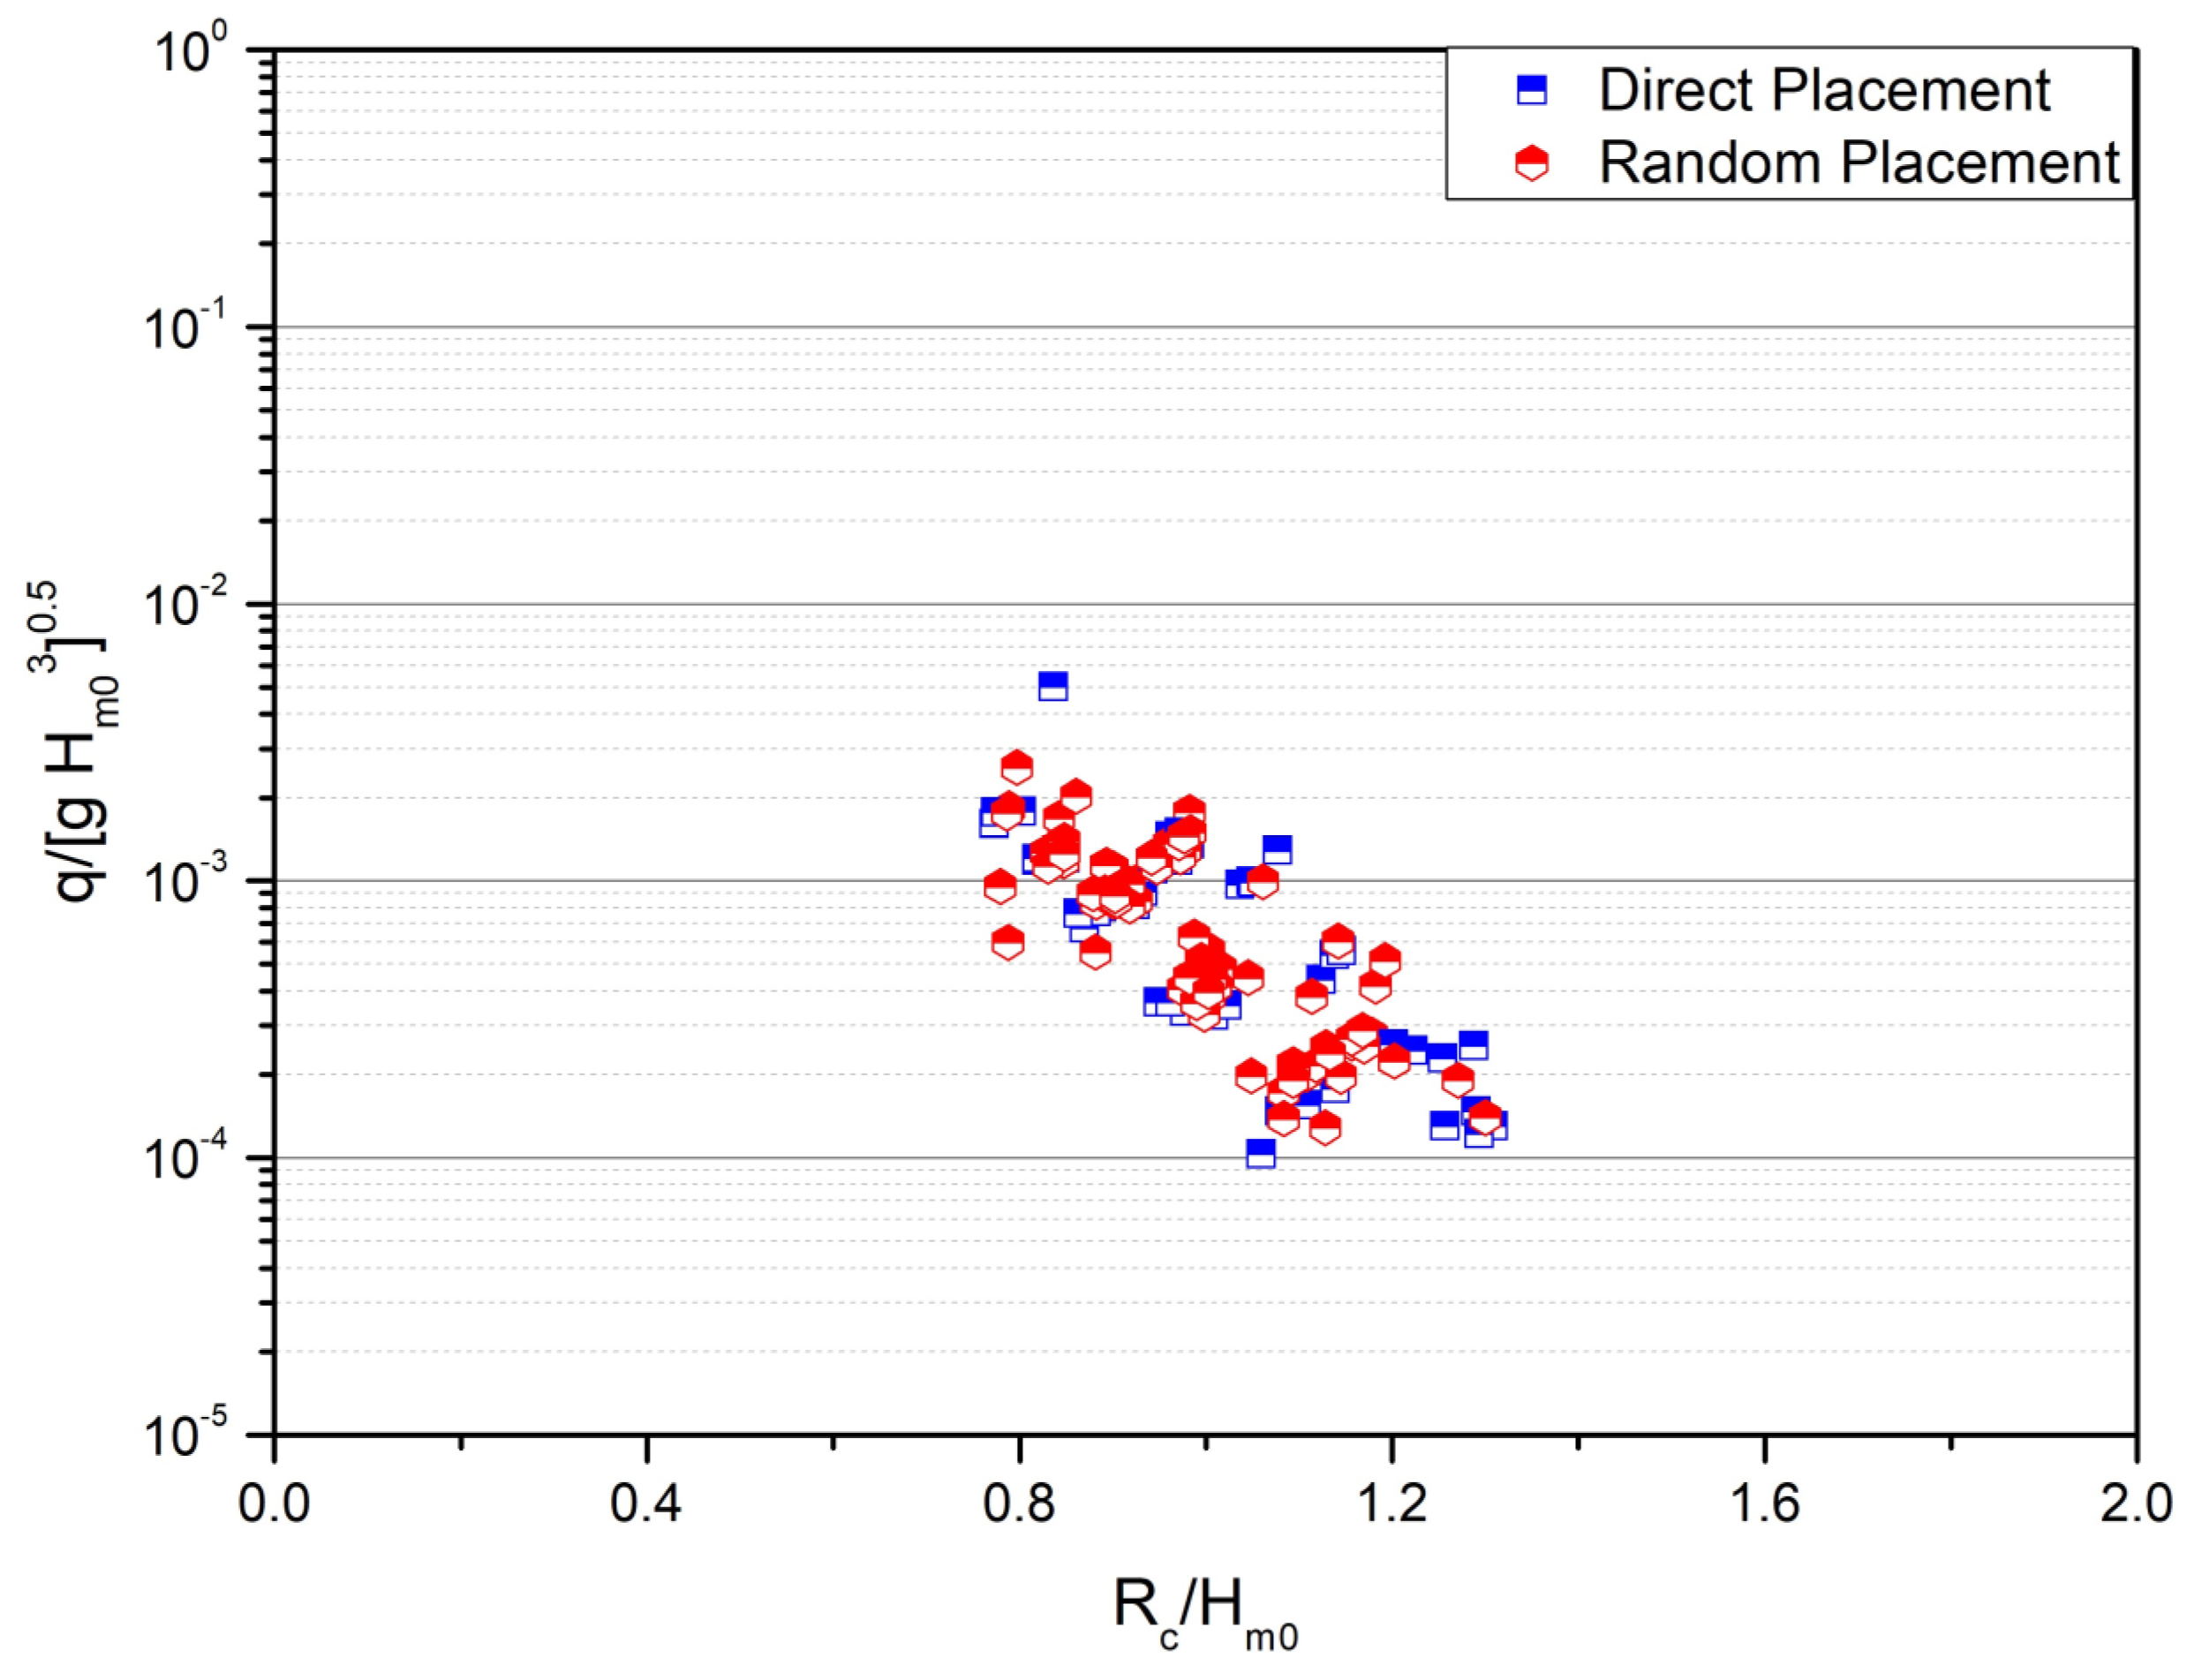
3.1. Direct Placement (DP)

This placement method can be described as a regular placement. All units are placed uniformly in one direction (Figure 4). In the first line, all units are placed with the bases inclined at 0° to the line of the greatest slope of the embankment.
In the second row, the units are secured between two units on the row below, so the chamfers of the unit are in contact with the two chamfered parts of the lower units. The placement of the following lines will be carried out similarly to the two previous lines, up to the crest of the structure. In this pattern, the theoretical horizontal (Dx) and upslope (Dy) distances are 1.550 D and 0.775 D, respectively. Therefore, a theoretical packing density coefficient of (1.550 D × 0.775 D)−1 = 0.832 D−2 (0.655 Dn−2) would be the result.
Similar to other blocks with regular placement, the main disadvantage of such placements is the precision needed and the low tolerance for errors. It was observed during the small-scale modelling of the DC that the correct placement of the first line is very important for the accurate placement of the next lines. Since the units’ positions must be very precise, any inaccuracy will be transmitted and exacerbated in higher lines.

3.2. Random Placement (RP)

In the Random Placement (RP) method, the units are placed randomly line-by-line. The pattern does not follow any strict rules or specific orientations (Figure 5).
For the first line, the units are placed with various orientations. There is no pre-determined orientation for the units and the units are placed in various positions. For the second line, the units are placed between the lower units and their orientations can vary, without any specific rule.
In this configuration, the horizontal distance of the blocks is the only factor that should be controlled. The less horizontal distance, the more upslope distance (the upslope distance decreases as the horizontal distance increases), although the total packing density remains constant.
The horizontal placing distance varies between 1.50 D < Dx < 1.70 D and the upslope spacing varies between 0.625 D < Dy < 0.750 D. As previously stated, the theoretical total packing density coefficient remains constant at around 0.893 D−2 (0.702 Dn−2).
For both placements mentioned above, the blocks have shown a strong interlocking with the surrendering units, and it is difficult to withdraw a unit without dislodging the surrounding units. It is important to note that the interlocking effect for a DC unit is mainly the result of the friction mechanism between adjacent units. Scaravaglione et al. [33] described that the interlocking for some massive units does not come from an entanglement or hooking effect.

4. Hydraulic Model Tests

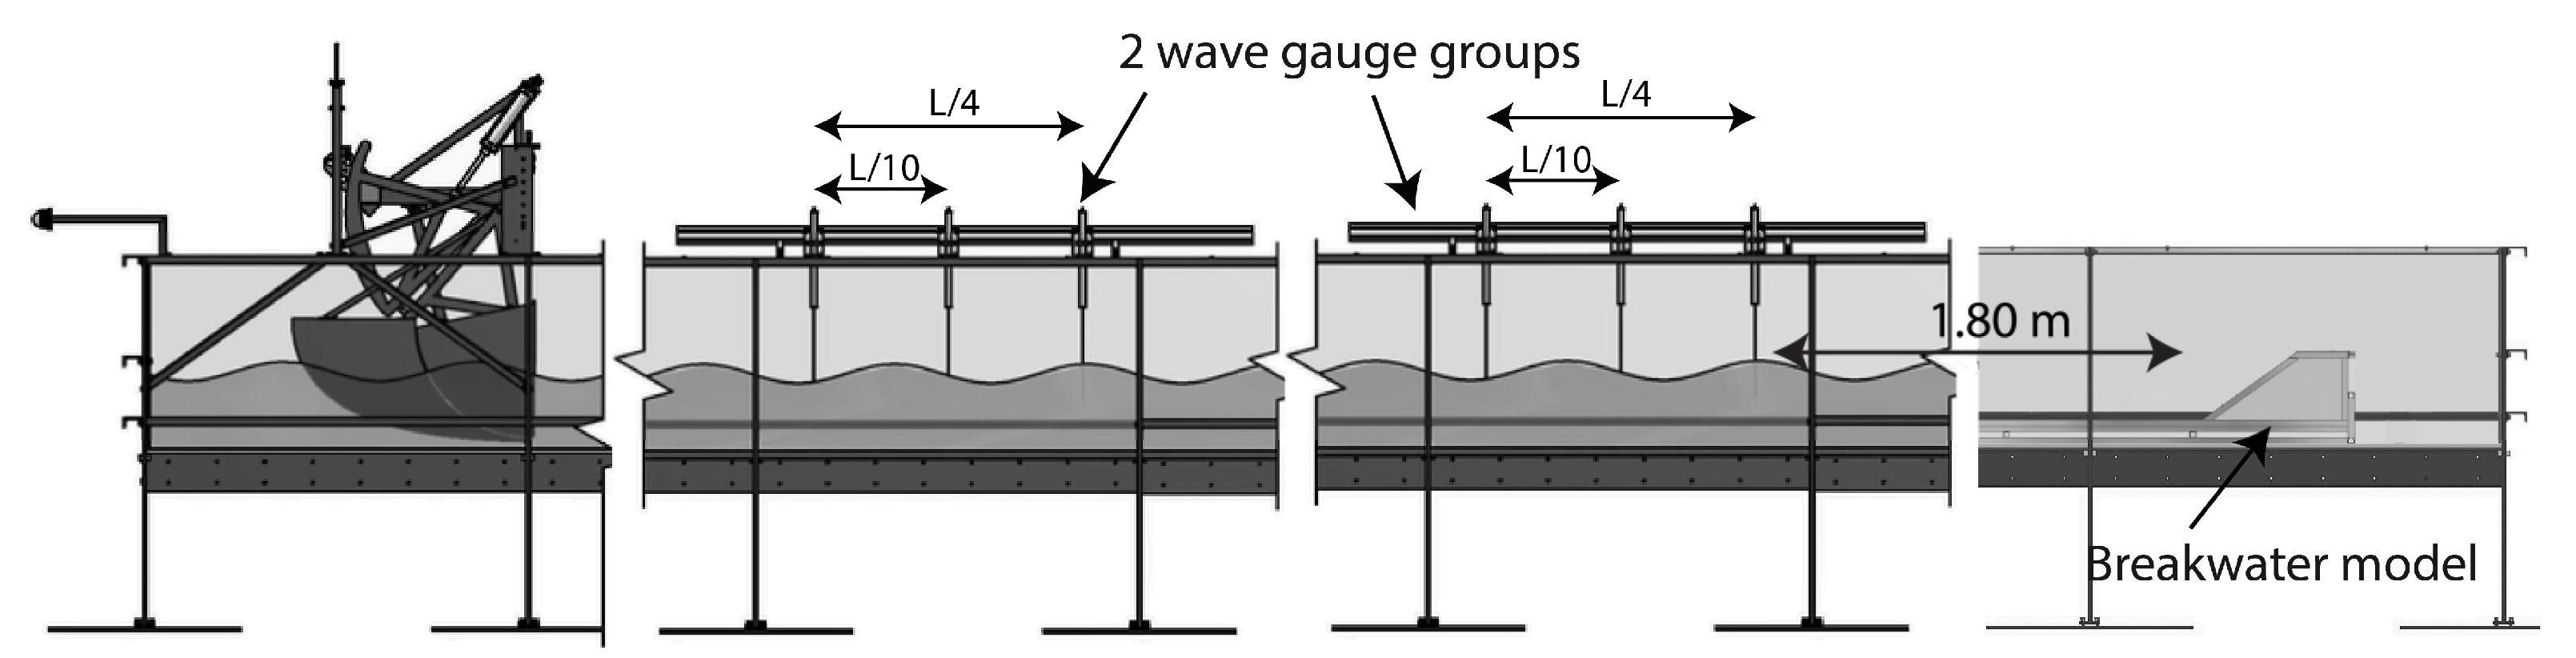
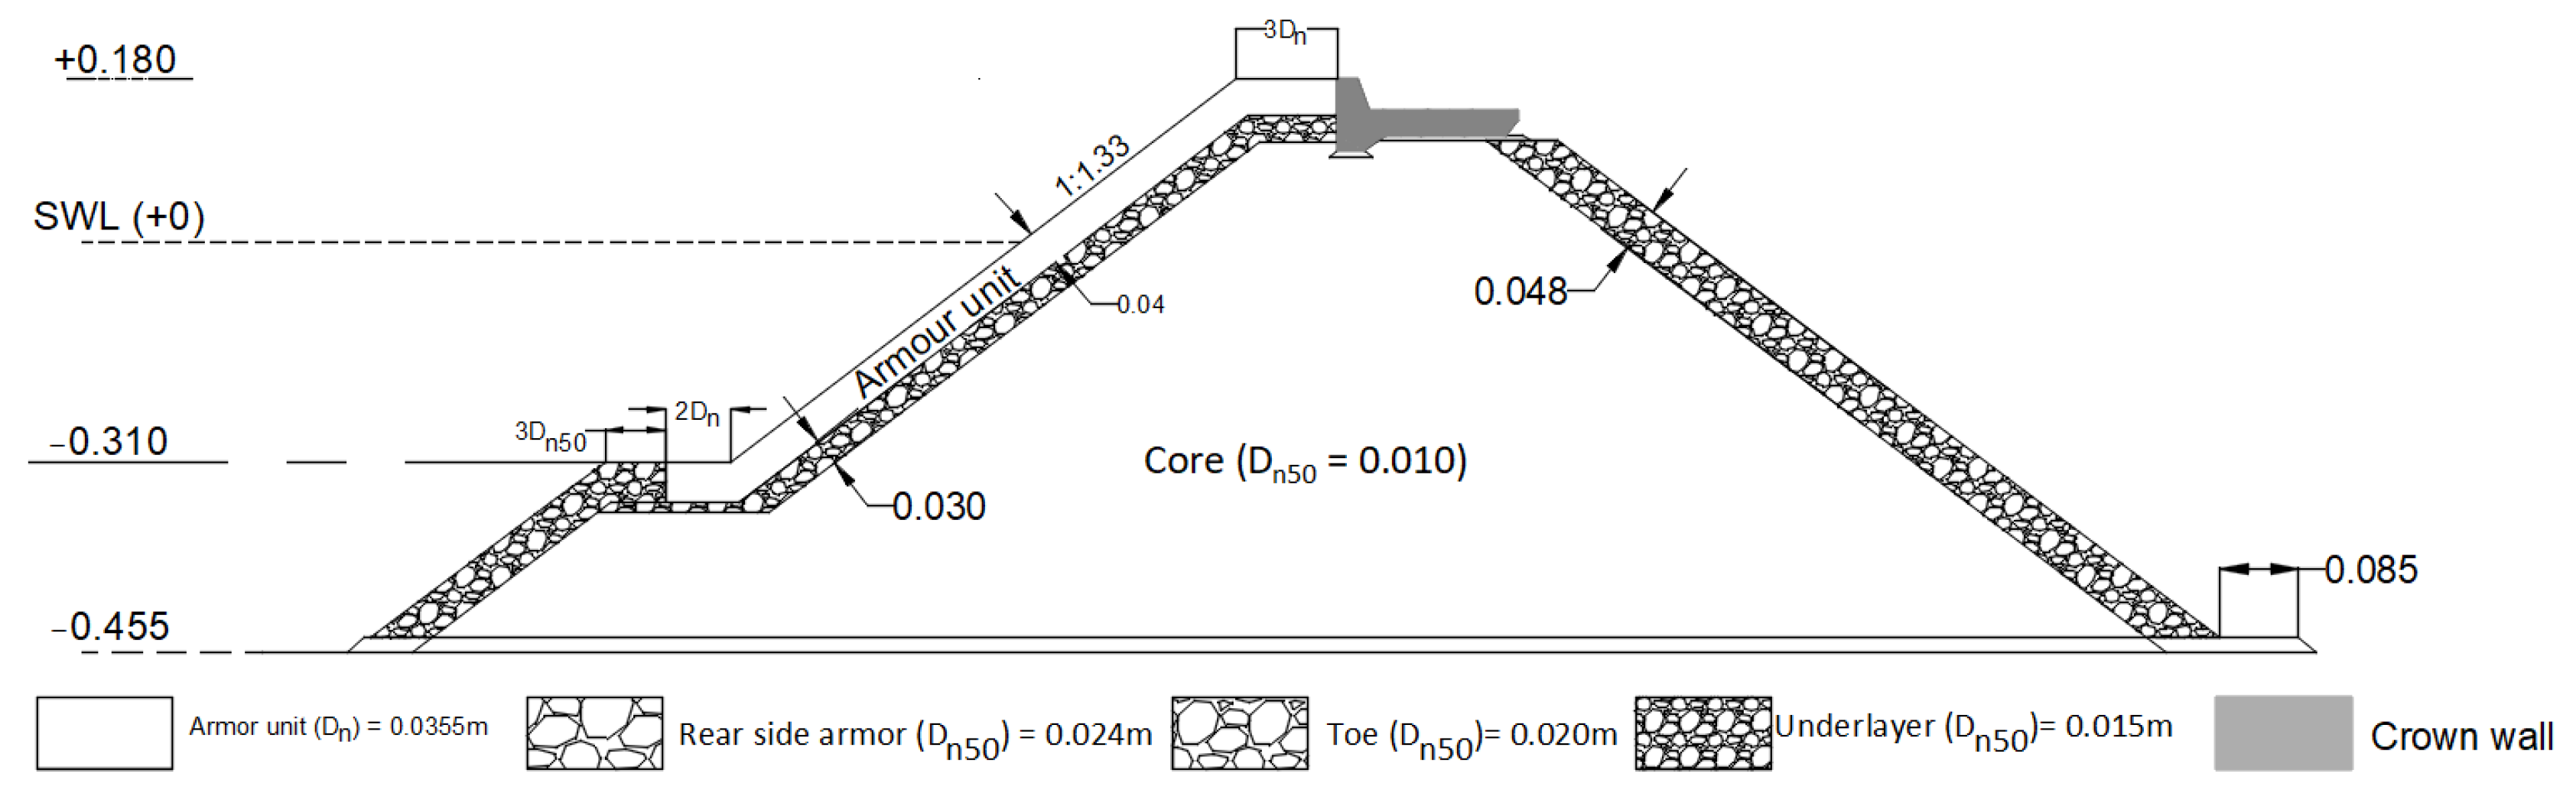
4.1. Experimental Set-Up

The physical mode tests were carried out in the wave flume of the Coastal and Continental Morphodynamics laboratory of the University of Caen.
This wave flume has a length of 22 m, a width of 0.8 m, and a depth of 1.0 m, as shown in Figure 6. The flume has an Edinburgh Designs piston wave generator that enables the generation of regular and irregular waves with an active wave reflection compensation system. The wave-maker can produce a significant wave height of about 0.1 m with a period of 1 to 3 s (Edesign.co.uk. [34]). All tests were conducted on a flat bottom.
The sidewalls of the flume are made of glass, allowing for visual observations and optical measurement of wave–structure interactions (Figure 6).
The sketch of the breakwater cross-section, as well as the material characteristics used in this model, are presented in Figure 7. The 2D model was built with a Froude scaling (model to prototype) of 1:57. As gravity forces are predominant in the physical processes, the Froude number is the recommended scaling factor. Viscous effects are still important, but it is impossible to take them into account in such a small flume.
The armor layer is built using DCs with an average mass of 0.072 kg, and a nominal diameter of 0.0355 m. The model units were cast using a concrete made with cement, perlite concrete, and with a water/cement ratio of 0.5. It must be noted that the mean mass density of each unit is 1620 kgm−3, which is lower than the normal concrete elements (2400 kgm−3). The reason for this was that the dimensions of the model were constrained by the capabilities of the wave generator (significant wave height and period). Nevertheless, the major dominant forces are reproduced in correct proportion (Hughes [35]) at the initiation of damages. This is relevant to estimate the armor stability. The same techniques (using light units) have been validated and used successfully by Gόmez-Martín and Medina [4] to study a highly stable unit (Cubipod) and Safari et al. [11] on the Starbloc unit.
There are methods used to estimate scale effects in core permeability such as those introduced by Burcharth et al. [36], Vanneste and Troch [37], and Wolters et al. [38]. In this study, the dimension of core materials has been determined according to the method proposed by Burcharth et al. [36]. In this method, an empirical model is based on pore pressure calculations, leading to the hydraulic gradient of pore velocity, which is used for Reynolds comparisons. Burcharth et al. [36] proposed using time and space averaged interstitial velocity for the calculation of the Reynolds number. For the evaluation of the interstitial velocity in the core, the extended Forchheimer formulation was used. Finally, the core nominal diameter (Dn50) is equal to 0.010 m.
To calculate the dimension of the filter material, the methods recommended by CERC [14] are used. The filter support consists of a narrow grading of natural rocks with a median nominal diameter and a mass density of 0.015 m and 0.009 kg, respectively. The thickness of the underlayer was about 2Dn50 = 0.030 m.
The properties of the materials used in the breakwater are listed in Table 1. The tests were carried out for varying wave parameters such as the wave height and wave period, as well as properties of the armor layer such as placement, packing density, and freeboard position. The test matrix is summarized in Table 2. The water depth at the toe of the slope was 0.455 m, the crown height Rc was 0.18 m (stability and overtopping tests) or 0.08 m (for additional overtopping tests). The crown width is equal to the length of three rows of units.

4.2. Wave Measurements

Two groups of three resistance-type wave gauges, with a precision of ±2%, are used to measure the water surface elevations in the flume (Figure 6).
The first group was positioned 1.5 m seaward of the structure toe and the second group was placed 10 m away from the wave-maker. Incident and reflected waves were analyzed using the least-squares method proposed by Mansard and Funke [39].
Each test was performed with a target mean peak period and an Iribarren number, ξ, which varied from one test to another:
ξ = t a n α / H s L 0 1 / 2
where Hs is the significant wave height at the toe of the structure, L0 = gTp2/2π, Tp is the peak wave period, and α is the armor slope angle. Here, the significant wave height Hm0 (=Hs) and Tp (peak wave period) are obtained using frequency domain analysis.
Each test starts with a lower wave height than the target wave to induce the initial settlement. Subsequently, the wave height is increased (with a constant wave period) incrementally up to a wave height resulting in damage (failure). Therefore, each test series consisted of five to six steps of increasing wave height. With Tp being fixed and Hs variable during each series, the Iribarren number changes within the same series. This approach is therefore different from the one adopted by Medina et al. [40], where the Iribarren number was kept constant. All tests were conducted in a non-breaking waves condition (Table 2).
All tests were conducted using irregular waves with a JONSWAP spectrum (γ = 3.3). The stability test for each wave height was performed for fixed acquisition duration, from 1024 s to 2048 s. This corresponds to 1000 to 1700 waves, depending on the tested wave period. Wave statistic significance was already achieved for 1000 waves. The measurement data were obtained using a sample frequency of 32 Hz. In order to obtain the accurate generation of waves, all wave conditions were calibrated through a transfer function with the model in place. Before starting each test, the wave gauges were calibrated in still water through three fixed positions.

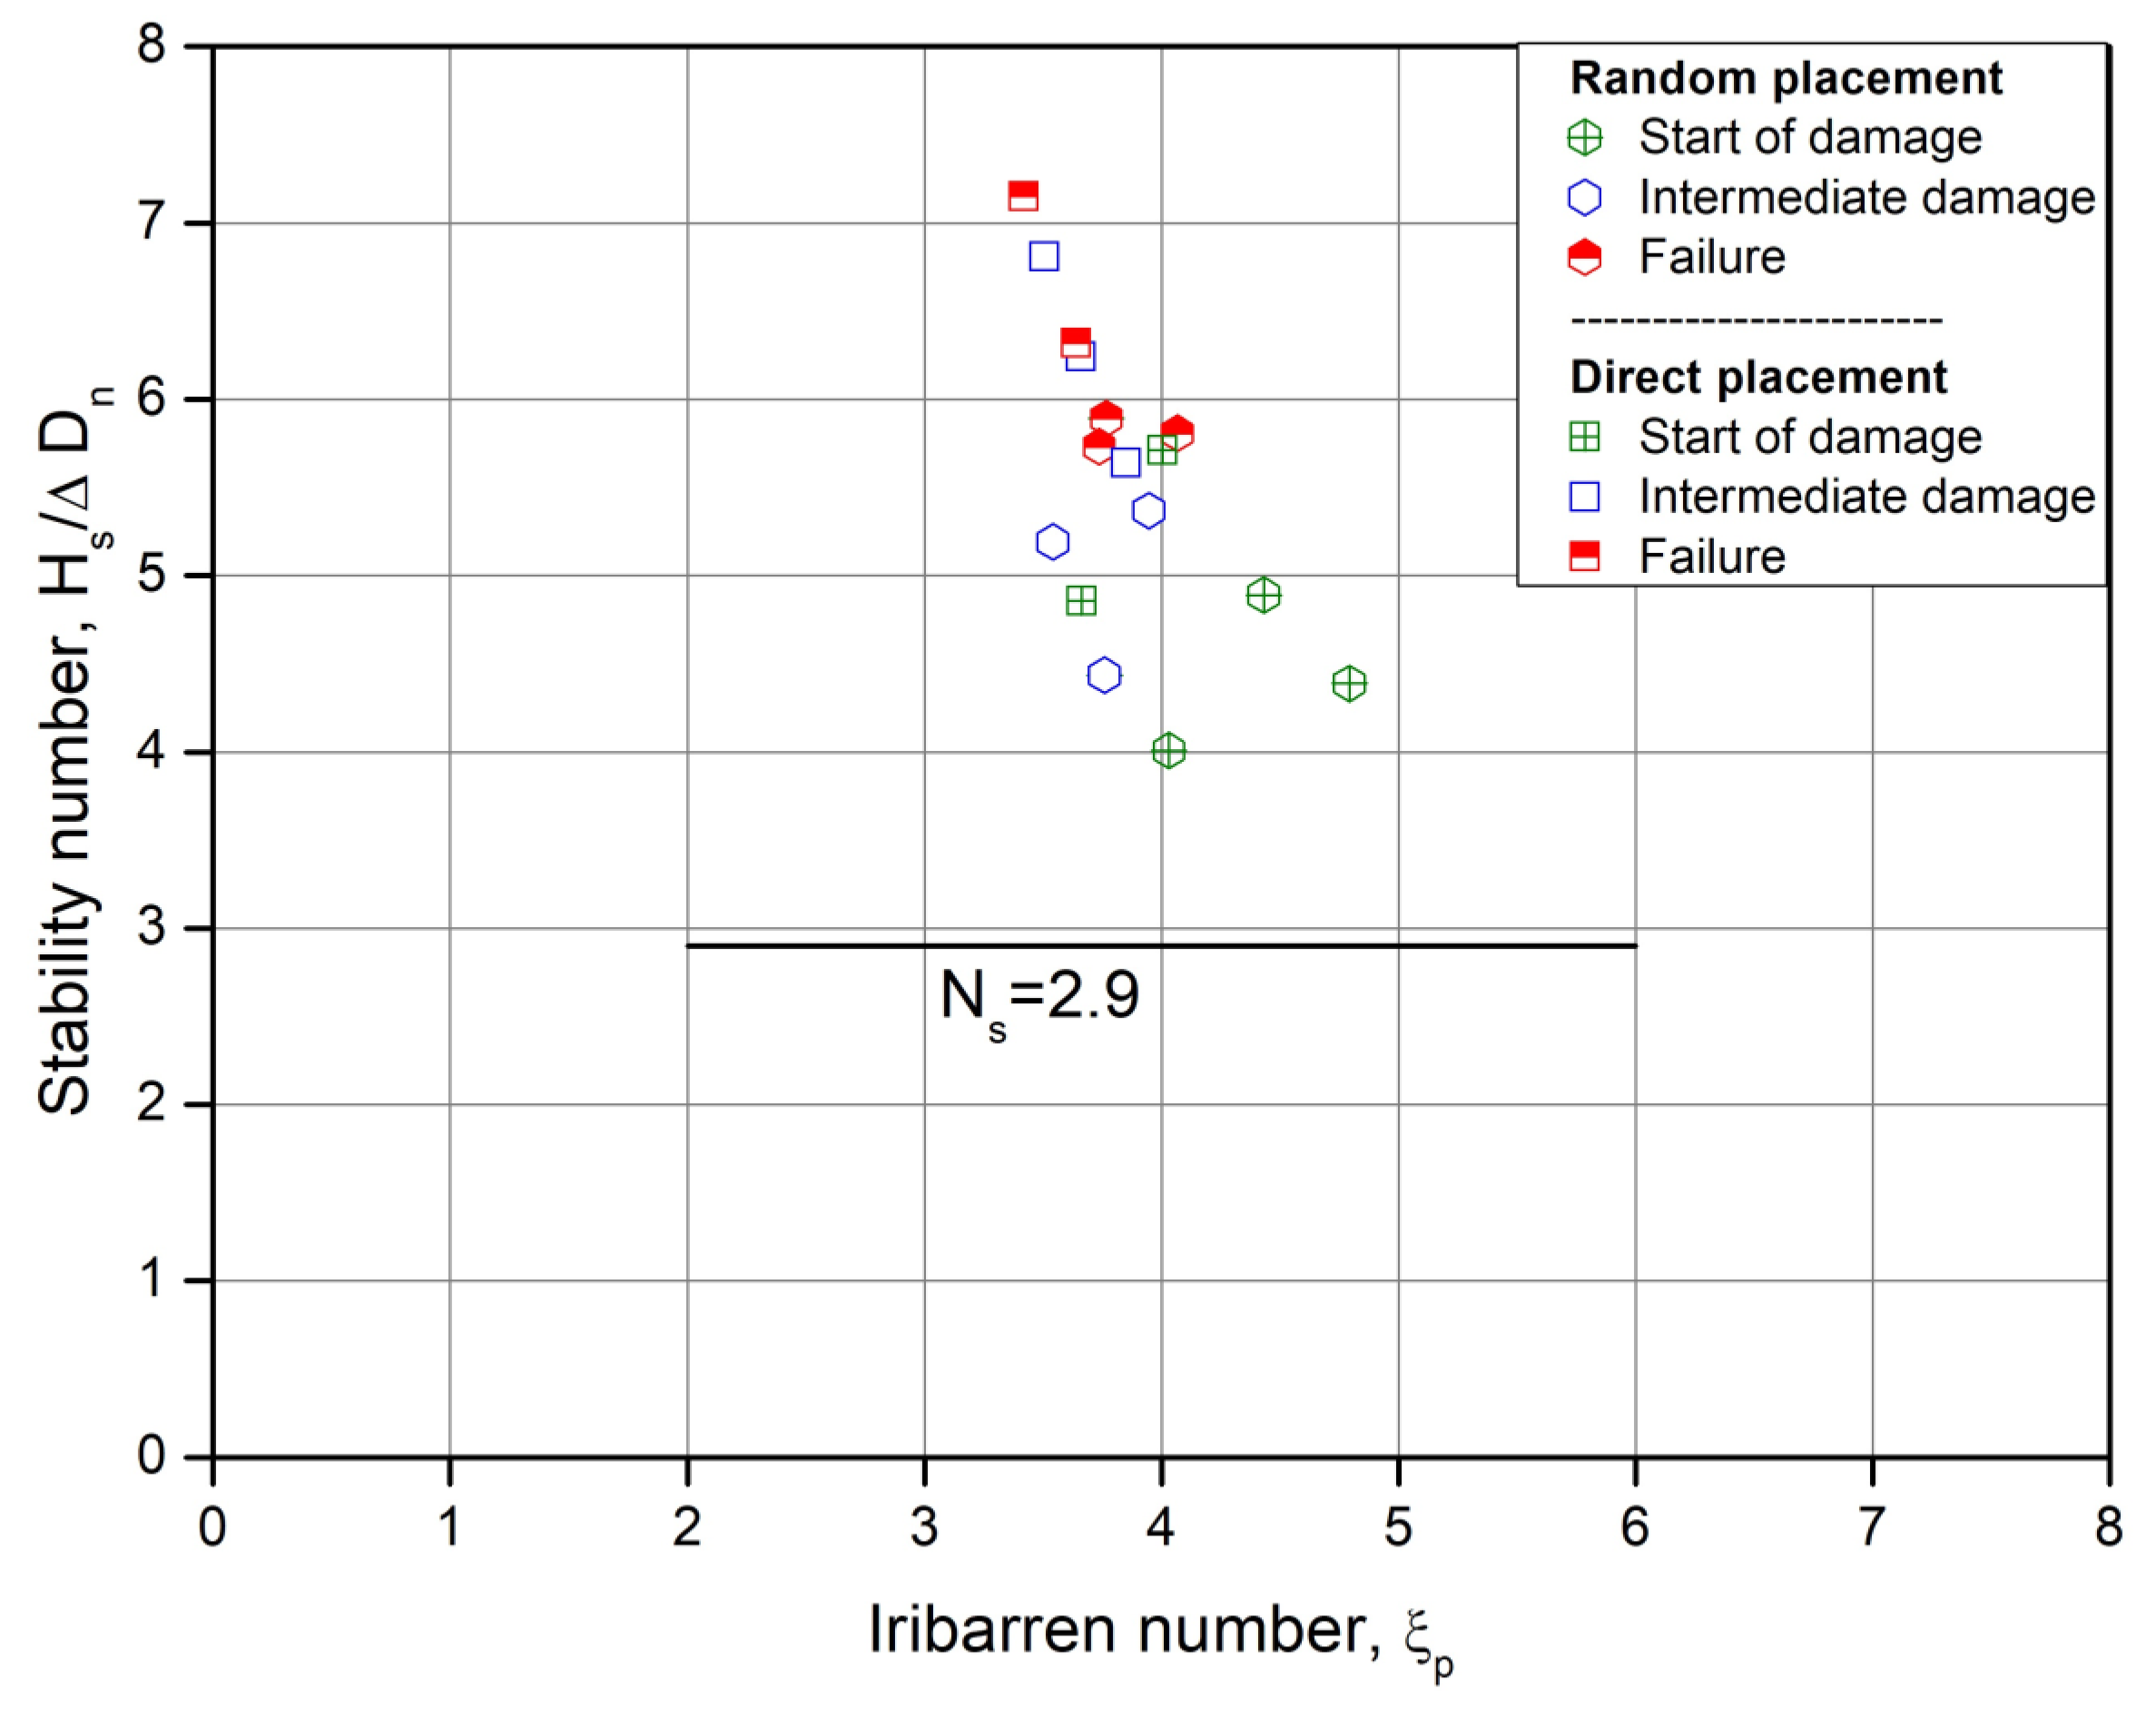
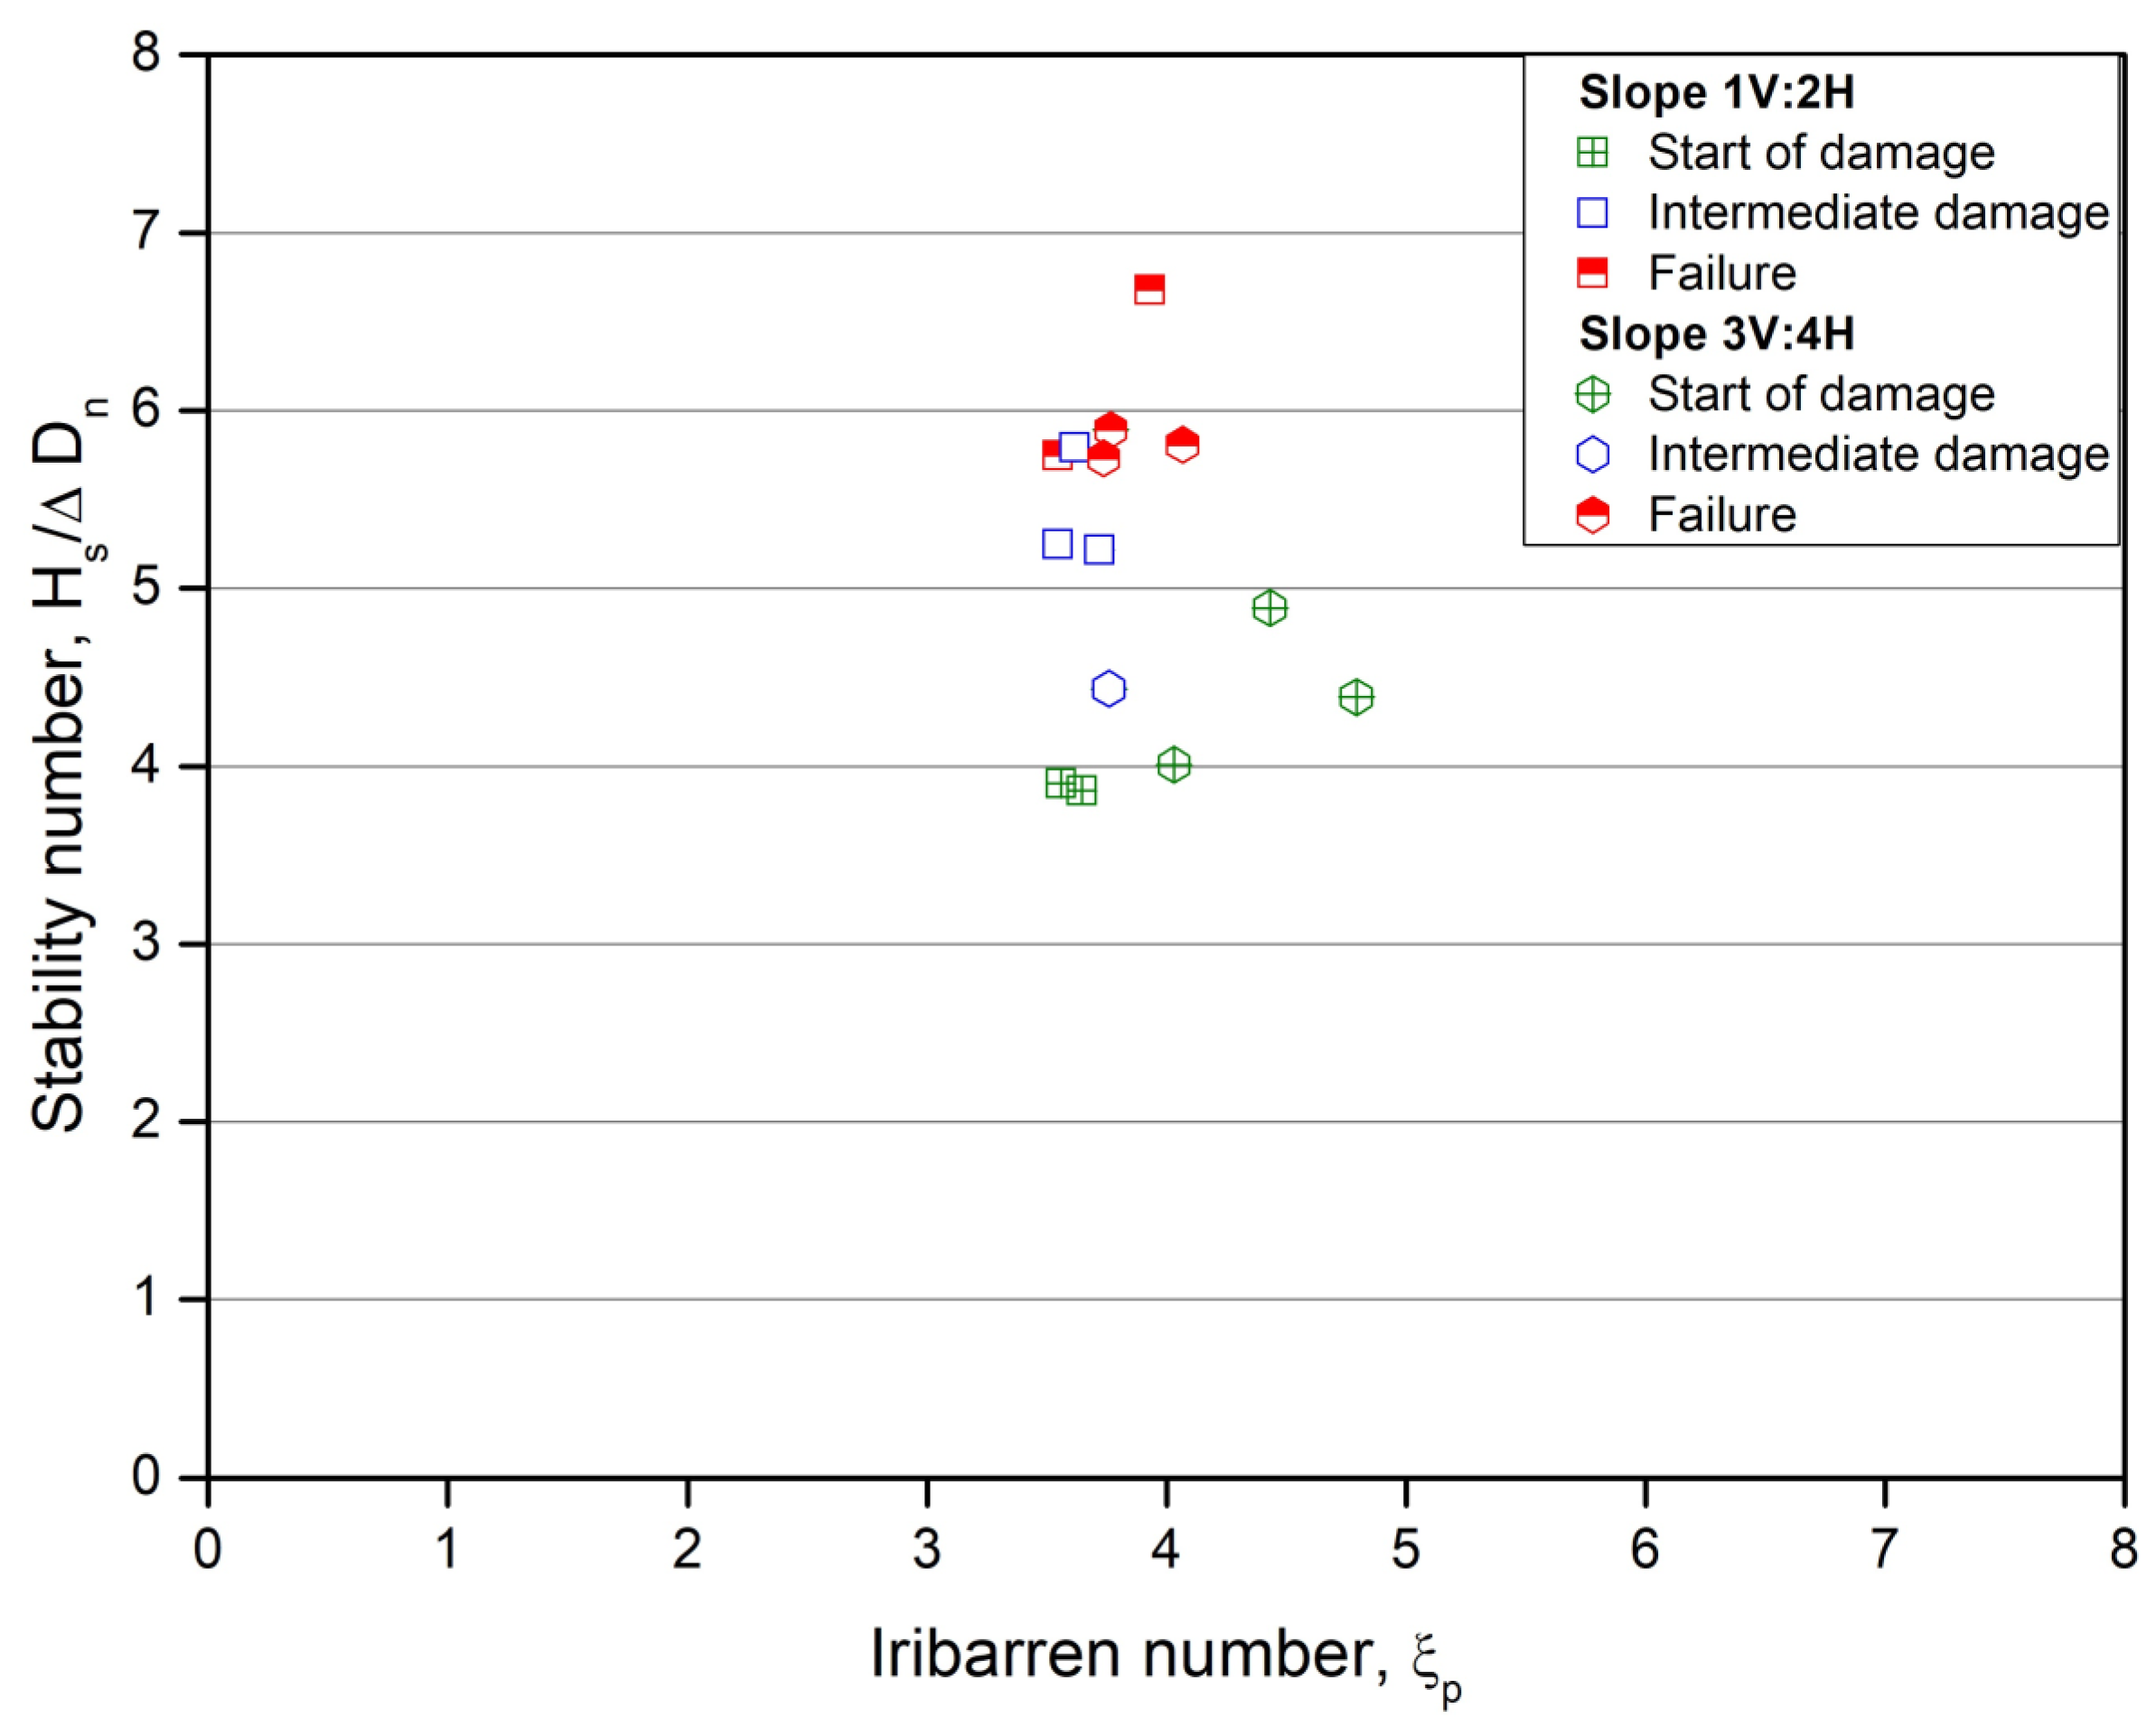
4.3. Damage Analysis

Armor damage measurement in this study was performed by visual observations of the displacements of the units of the armor layer. Photographs of the armor layer were taken after each series of tests to measure the evolution of the damage (before, during, and after the test).
To improve the visualization of displacement and the orientation change of the units during damage, each row was colored differently.
In this study, three different levels of damages were considered (CIRIA [1]):
  • Start of damage.
  • Intermediate damage.
  • Failure.
Start of damage corresponds to no damage or no movement of the units. Intermediate damage corresponds to the first significant movements detected on an armor layer, and finally, with increasing wave height, the failure of the armor layer is reached when the removal of a number of units leads to the exposure of the filter layer or the core. Damages were not repaired during successive test series. In this way, the cumulative damage during the test series was determined. The armor layer was reconstructed, if necessary, only after the completion of each test series.
The damage level corresponds to the value of Nod, which is the number of displaced armor units to a width (along the longitudinal axis of the breakwater) of one nominal diameter Dn. The value of (accepted) Nod is affected by the unit type (massive, interlocking) as well as by the number of layers. For example, the allowed Nod for a single-layer cube armor layer is Nod = 0.0 for the start of damage and Nod = 0.2 for failure. The Nod for the failure level of a Double-layer cube armor layer increases to about Nod = 2 (Van Gent and Luis [17]).
Moreover, the stability of the armor units can be represented using the dimensionless parameters, such as the stability number Ns (Van de Meer [41]), against the Iribarren number (ξp):
N s = H s Δ D n = K D cot α 1 3
where Ns = stability number.
  • KD = stability coefficient (introduced by Hudson [42]).
  • Hm0 = Hs = significant wave height in front of the structure.
  • Δ = (ρaw − 1).
  • ρa = mass density of the armor unit.
  • ρw = mass density of the water.
  • Dn = nominal diameter of the unit = (m/ρa)1/3.
  • m = mass of the armor unit.
  • α = slope angle.

4.4. Overtopping Measurement

The breakwater’s overtopping is affected by different parameters such as the slope geometry, crest level, presence of a crown wall, etc. Overtopping has been investigated in various studies (Bradbury et al. [43], Owen [44], Van der Meer and Stam [45], Aminti and Franco [46], Van Gent et al. [22], Bruce et al. [47,48], Molines and Medina [49], EurOtop [50,51]).
In this study, the mean overtopping rate is measured for all tests using the same standard method described by researchers such as Möller et al. [52]. The overtopping discharge (m3s−1m−1) is measured using a collection container placed behind the breakwater model, as shown in Figure 6. This container is made of 10 mm-thick PVC plates, with dimensions of 0.795 m × 0.785 m × 0.360 m (length × width × height).
The post analysis allows us to calculate the average overtopping rate, i.e., the quantity of collected water in the container during a sequence of N incident waves (a storm or period considered), per unit length of the breakwater’s width.
For this purpose, the discharge, q, is calculated according to the following formula:
q = V t B
where q: mean overtopping discharge.
  • V: accumulated wave overtopping volume.
  • t: test duration.
  • B: width of wave flume.
For tests with high overtopping rates, water is pumped into the leeward part of the wave flume during the test run to maintain a constant level of water in the front of the structure.
The accuracy of overtopping measurement is:
  • A container with an uncertainty of 1.3% (calibration with given input water volumes).
  • A chronometer with an operational accuracy precision of 1 s.
  • A digital scale balance with an accuracy of 5 g (test weights).
  • Wave gauges with a precision of 2% (calibration in still water).

5. Hydraulic Stability Results

Among the great variety of factors affecting the design of a breakwater, hydraulic stability is one of the key design criteria that should be carefully investigated, particularly in a one-layer system. The goal was to find the hydraulic stability of the single armor layer for the two placement methods mentioned earlier.
The ‘Direct placement’ method has a theoretical packing density of about 0.83 D−2 (0.65 Dn−2). However, due to the irregularities of the under-layer, the final packing density was decreased to 0.81 D−2 (0.64 Dn−2). Similarly, for the ‘Random placement’ method, the theoretical packing density of 0.89 D−2 (0.70 Dn−2) decreased to 0.86 D−2 (0.68 Dn−2).
Figure 8 presents the value of stability number Ns versus the Iribarren number (ξp) for the two studied placements.
The resultant packing densities in the experiments were 0.68 for random placement and 0.64 for direct placement. These tests were repeated at least two times in order to assess the reliability of the results.
The square sign represents the stability numbers related to the ‘Direct placement’ method (DP); the diamond sign corresponds to the ‘Random placement’ method (RP). Center-crossed signs correspond to the start of the damage, and full white and half black symbols correspond to the intermediate damage and failure of the armor layer, respectively. As previously mentioned, the start of damage is accordance with the standard practice of ‘no damage’, as defined for randomly placed armor units in a single layer (CIRIA [1]).
In the ‘Random placement’ tests, the start of damage was observed at the Ns close to 4.0 and failure was reached at Ns values between 5.7–5.9.
During the ‘Direct placement’ tests, the start of damage occurred at the Ns close to 5.6–6.2 and failure happened at a stability number in the range of 6.4–7.2.
As can be seen in Figure 8, higher values of Ns were obtained for ‘Direct placement’ than for the random placement in all tests for the three levels of damages.

5.1. Discussion

Figure 9 demonstrates the damage level as a function of the stability number for the two studied placements. It is noticeable that the behavior of this unit is comparable to other single armor units. In general, for a single-layer armor, one can expect to observe failure of the structure after the occurrence of the first damage in the armor layer. In light of this, it is concluded that the criterion of failure and the start of damage are very close (Van der Meer [41]).
According to observations made from both placements, only minor changes in the damage progression process were noted. A more gradual damage progress of the armor layer and a wider gap between ‘no damage’ and ‘failure’ criteria were observed (intermediate damage). Indeed, the gradual extraction of more units from the initial damaged zone leads to failure. Moreover, it was noticed that one unit can be extracted without affecting the stability of the adjacent units. In fact, the armor layer can remain stable after the occurrence of the first damage, and the failure of the armor layer may originate from a different region in the following test. In this case, it can be considered that such a block was initially poorly positioned with its neighbors during placement, and that it suffered, as a result, from increased vulnerability. It can also be assumed that this lack of support can lead to a redistribution of specific forces for the neighboring units by mechanisms similar to the ‘arching effect’. In fact, the placement and specific shape of this unit (base hexagonal) lead to a ‘Keystone’ feature which allows it to keep the stability of the units adjacent to a unit extracted from the armor layer. There is no ‘unravelling’ effect observed on any single-layer interlocking units.
Reedjik et al. [7] also stated that the irregularities in the surface of the underlayer might cause mispositions of some units that leads to lower stability.
Additionally, vertical settlement of the units parallel to the slope, particularly with a direct placement, was observed. Vertical settlement of units can be extended toward the crest. This phenomenon tends to increase the packing density on the lower rows of the armor layer and reduce the packing density in the higher areas (Figure 10).
By analyses of the test results, the following formulas were derived for the start of the damage and failure (CIRIA et al. [1]):
H s D n = 4.0 Start   of   damage ϕ = 0.68
H s Δ D n = 5.7 Failure ϕ = 0.68
These formulas are related to the ‘random placement’ with a packing density of 0.68 and 3.4 < ξp < 4.5.
Medina and Gómez-Martín [32] and Jacobs et al. [53] stated that a safety factor in the case of single armor layer should be considered.
As the above values are close to other single armor units such as Accropode (Ns = 3.7) or Coreloc (Ns = 4.2), it is recommended that a safety factor of 1.5 be used on the (HsDn) (CIRIA [1]). As the design stability criteria refers to the start of damage, the following equation could be proposed as the design rule for the DC unit:
  H s D n = 2.7   K D = 15     F o r   d e s i g n

5.2. Influence of Slope Angle on Stability

A steeper slope provides a more economical solution for breakwater construction (reduced number of armor units and less material). Figure 11 shows the test results for an armor layer with random placement with two different slopes cotα = 3/4 and cotα = 2/3. For the two slopes, the packing densities of the armor layer were ø = 0.68.
It is evident that the stability number Ns for the start of damage for the two slopes was nearly the same. However, the failure level for the 2V:3H slope was slightly higher than the 3V:4H slope. This result is in agreement with those of many others researchers who investigated the effect of slope steepness (Reedijk et al. [7]).

5.3. Comparison Tests with Cubes

In order to investigate the reliability of the previous tests and the influence of the scale effects, similar experimental tests with cubes as a single-layer armor were conducted. The characteristics of the tests were exactly the same as previous tests (number of waves, specific mass of units, etc.).
The cubes had a nominal diameter of 0.0355 m and were placed in an irregular pattern on a 4H:3V slope, as described by Van Gent and Luis [17]. The cubes were placed on an underlayer of quarry stone with a Dn50 = 0.015 m, with a theoretical packing density of 0.70.
Figure 12 shows the results for the stability numbers obtained from tests with DCs in a random placement and tests with cubes in a single top layer placement.
For these single top layers of cubes, the stability results show an Ns 30% higher than the values given in the CIRIA [1], and stability values close to those of Van Gent and Luis [17] and Vieira et al. [28]. The stability numbers Ns obtained from tests with DCs, demonstrate a considerable improvement of 30% for all criteria of damage in comparison to the cubes.
It is well known that porosity plays an important role in armor stability. Considering that packing density and volume porosity were almost the same for both cases, the differences in stability number can be regarded as the effect of unit shape and surface porosity of the armor layer described by Safari et al. [10]. The ratio of porous area in any section is critically compared to the more common global main armor porosity. It is then demonstrated that the minimum section porosity should be the critical retained parameter. The DC shape provides a nonhomogeneous porosity within the armor’s section. This feature can enhance the energy dissipation characteristics of an armor block through pressure differentials (Safari et al. [10]).

5.4. Comparison with Other Types of Armor Units

To compare the Double cube with other single-layer units, the following table demonstrates the data related to the stability, packing density, and concrete consumption (Table 3).
The packing density is optimized through the new design, allowing an effective use of concrete for the breakwater armor unit. The Double cube’s performance is comparable to the units available on the market, and the tests indicate that in terms of concrete consumption, there will be no significant increases in the total concrete volume. Regarding concrete consumption, Xbloc®, Accropode®, and DC (random placement) use less concrete than cube and Cubipod®. It should be noted that the proposed design Ns is as a preliminary result and that it should be confirmed by complementary tests.
To compare and summarize the performance aspects of some the most common single-layer armor blocks with DC, the following table is presented (Table 4).
This assessment has been conducted considering the following points:
  • Easy placement of new unit without strict rules or specific positioning.
  • In comparison to simple units, complex-shaped units typically require a more complicated handling, building, and storage processes.
  • Regarding structural integrity, simple-shaped units (massive units) are more robust than complex-shaped units (slender units).

6. Analysis of Wave Overtopping

Overtopping tests were conducted following the conventional method described by TAW [54] to estimate the unit’s performance in terms of roughness. In the basic proposed equations, it is assumed that the overtopping rate can be estimated based on the relative crest freeboard Rc/Hs, Rc being the crest height of the structure above the still water level.
Van de Meer and Janssen [55] provided an empirical overtopping formula, in case of non-breaking waves (ξm1,0 > ≈ 2):
Q = q g H m 0 3 = 0.2 e x p 2.6 R c H m 0 1 γ f
where q is the average specific overtopping discharge, Rc is the elevation of crest above SWL (m), Hm0 is the spectral wave height at the toe of the structure, ξm−1,0 is the local surf similarity parameter, and γf is the reduction factor for the effect of slope roughness.
In total, more than 100 tests were conducted with a structure armored with DC. The ranges of all of the parameters used in the tests are provided in Table 5.
The water level for all tests was adjusted prior to each test. Depending upon the wave period, the tests had a duration of 1024 s to 2048 s, corresponding to 850–1365 waves, respectively.
Figure 13 shows the results for the dimensionless mean overtopping discharge as a function of crest relative height. The square symbol corresponds to direct placement and the polygon symbol corresponds to random placement. All the tests were conducted using non-breaking wave conditions, which means that the surf-similarity parameter is greater than 2 (ξm−1,0 > ≈ 2). The graph shows an almost identical trend for both placement patterns, a decrease in overtopping with increasing Rc/Hm0.
Furthermore, for the test with Direct placement, the results show a little wider dispersion than the tests with Random placement.

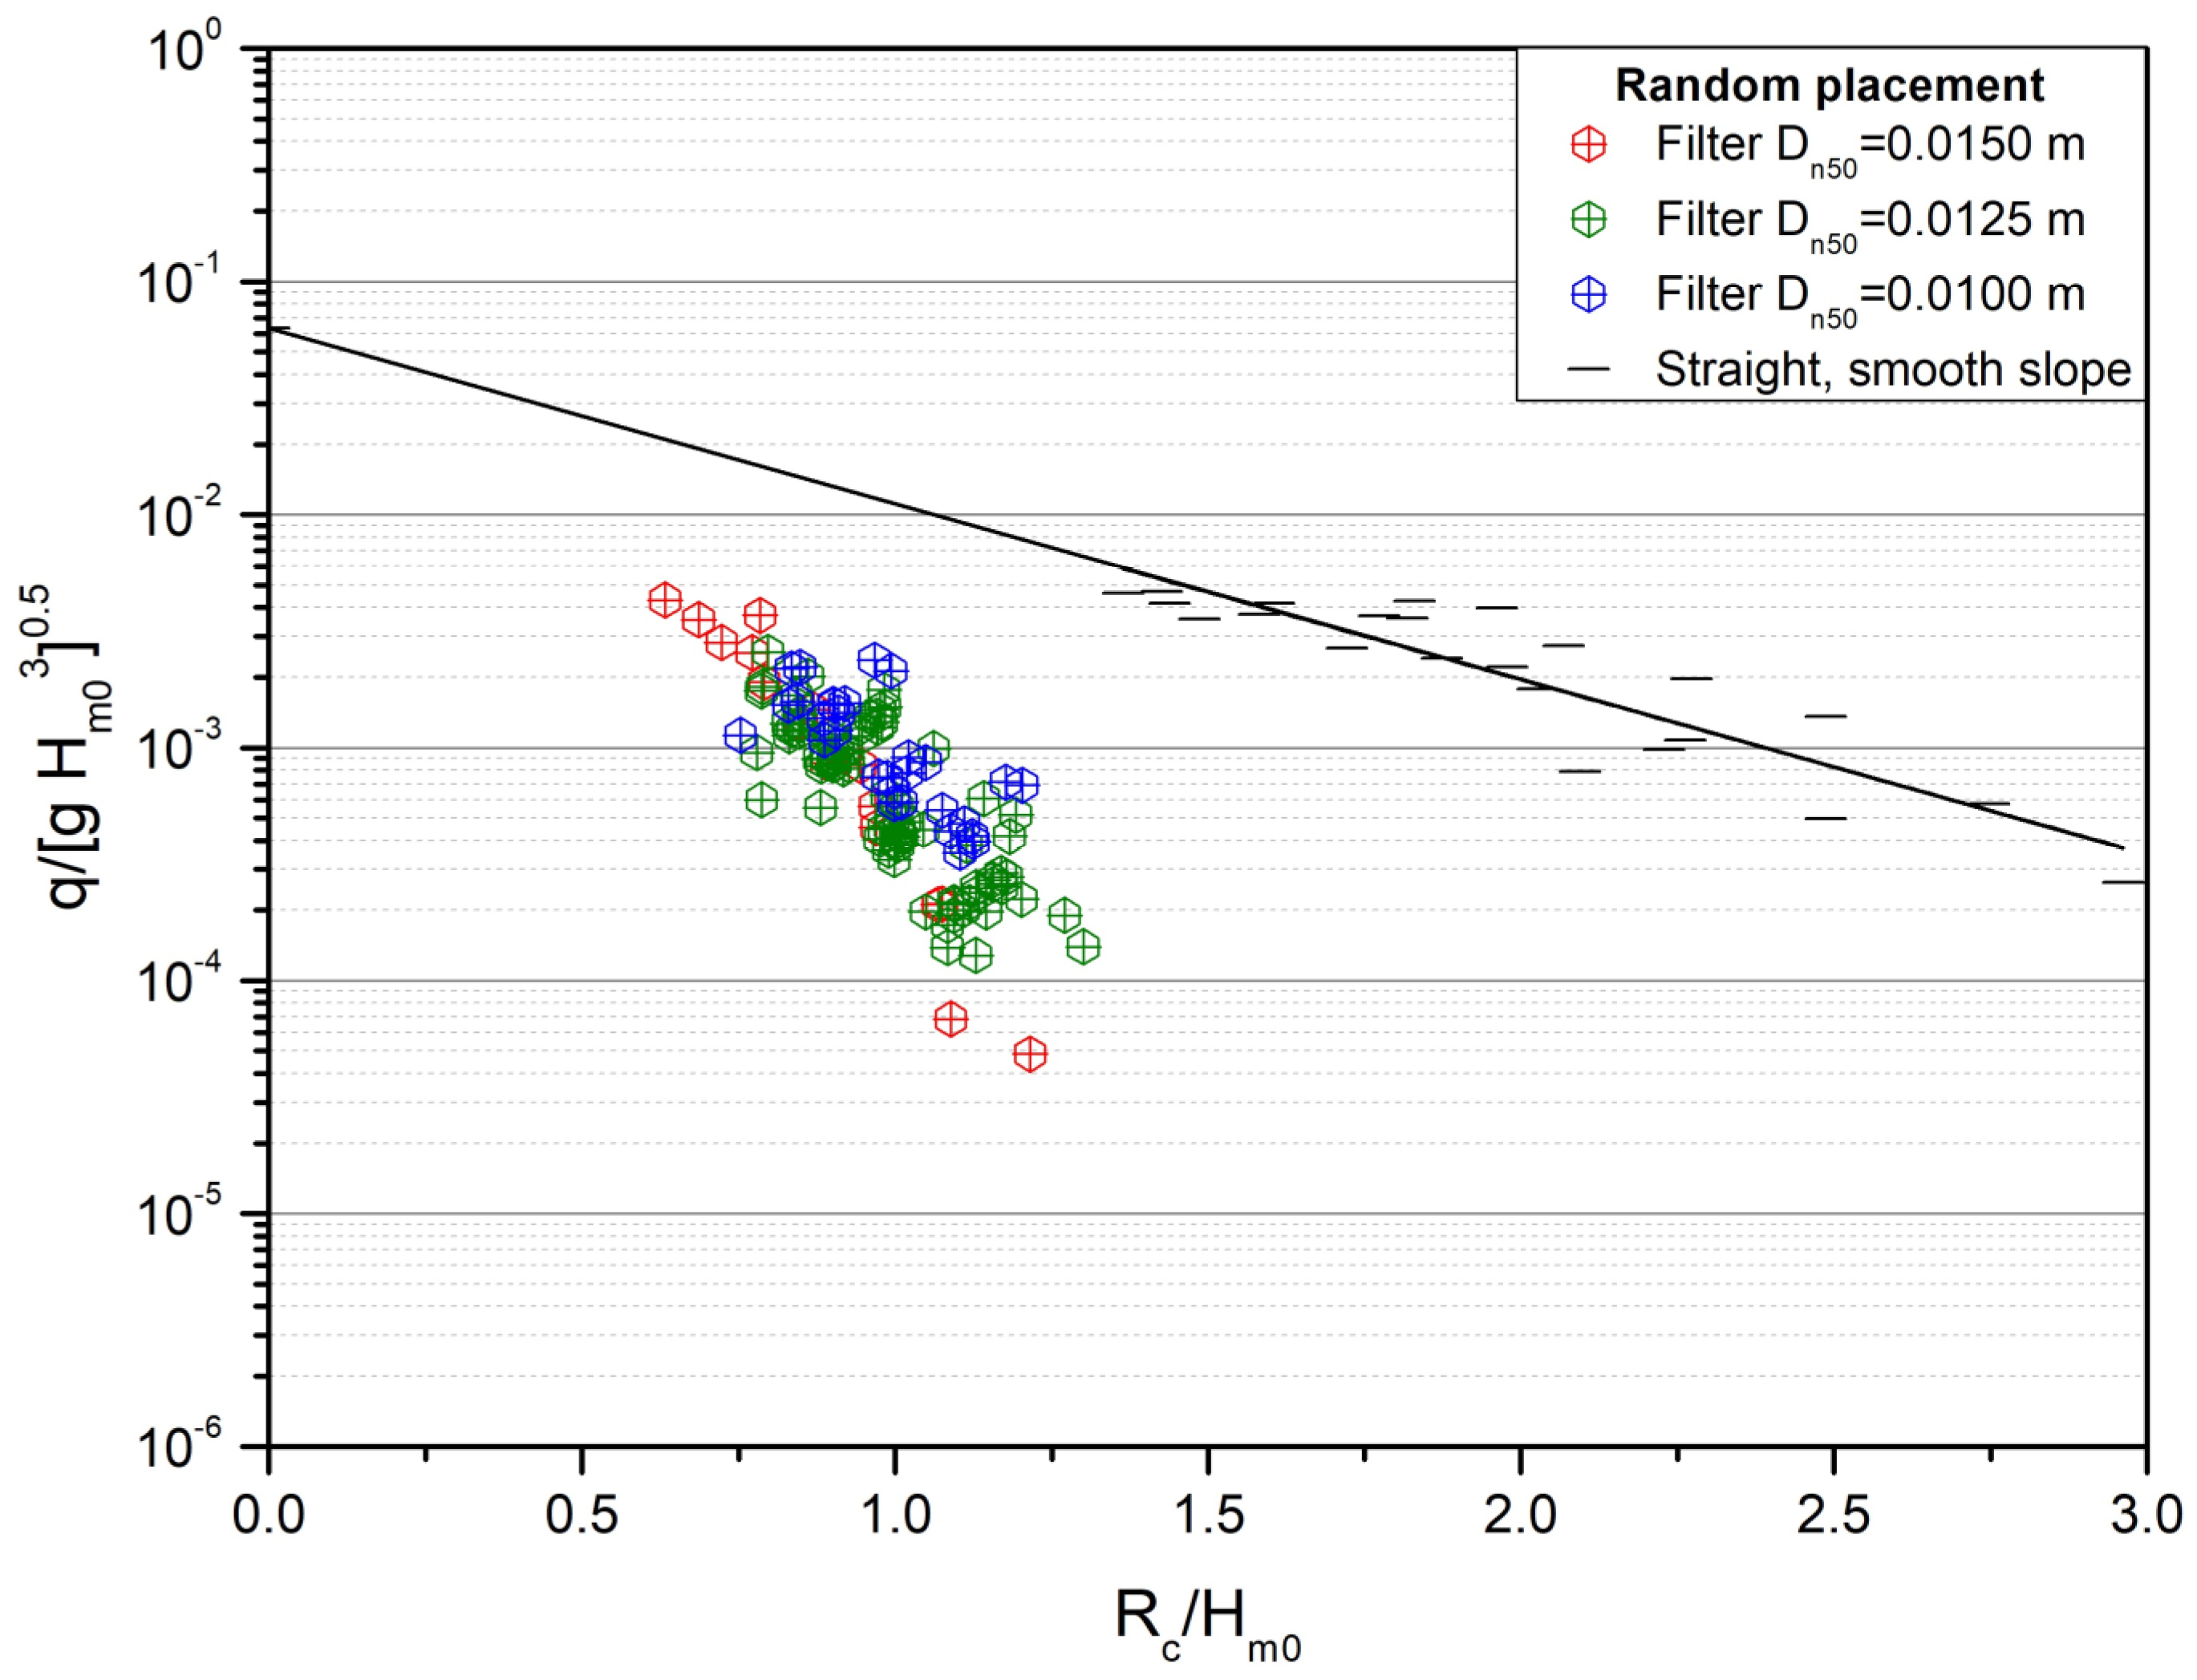
6.1. Effect of Filter Layer on Overtopping

As discussed in a previous section, we studied the effect of different filter layers on the stability of the armor layer. In order to complete these series of tests, we also investigated the effect of filter materials on overtopping.
In Figure 14, all overtopping results from Random placement are illustrated as a relative mean overtopping rate against the relative freeboard Rc/Hm0. In this figure, the results for a smooth slope are also illustrated.
From this figure, the following points are evident:
  • Among the different studied filter layers, the results obtained from the tests with Dn50 = 0.0150 m have a larger scattering compared to those of other sizes.
  • The responses for the two underlayers Dn50 = 0.0150 m and 0.0100 m are similar, but less overtopping was collected for the underlayer Dn50 = 0.0125 m.

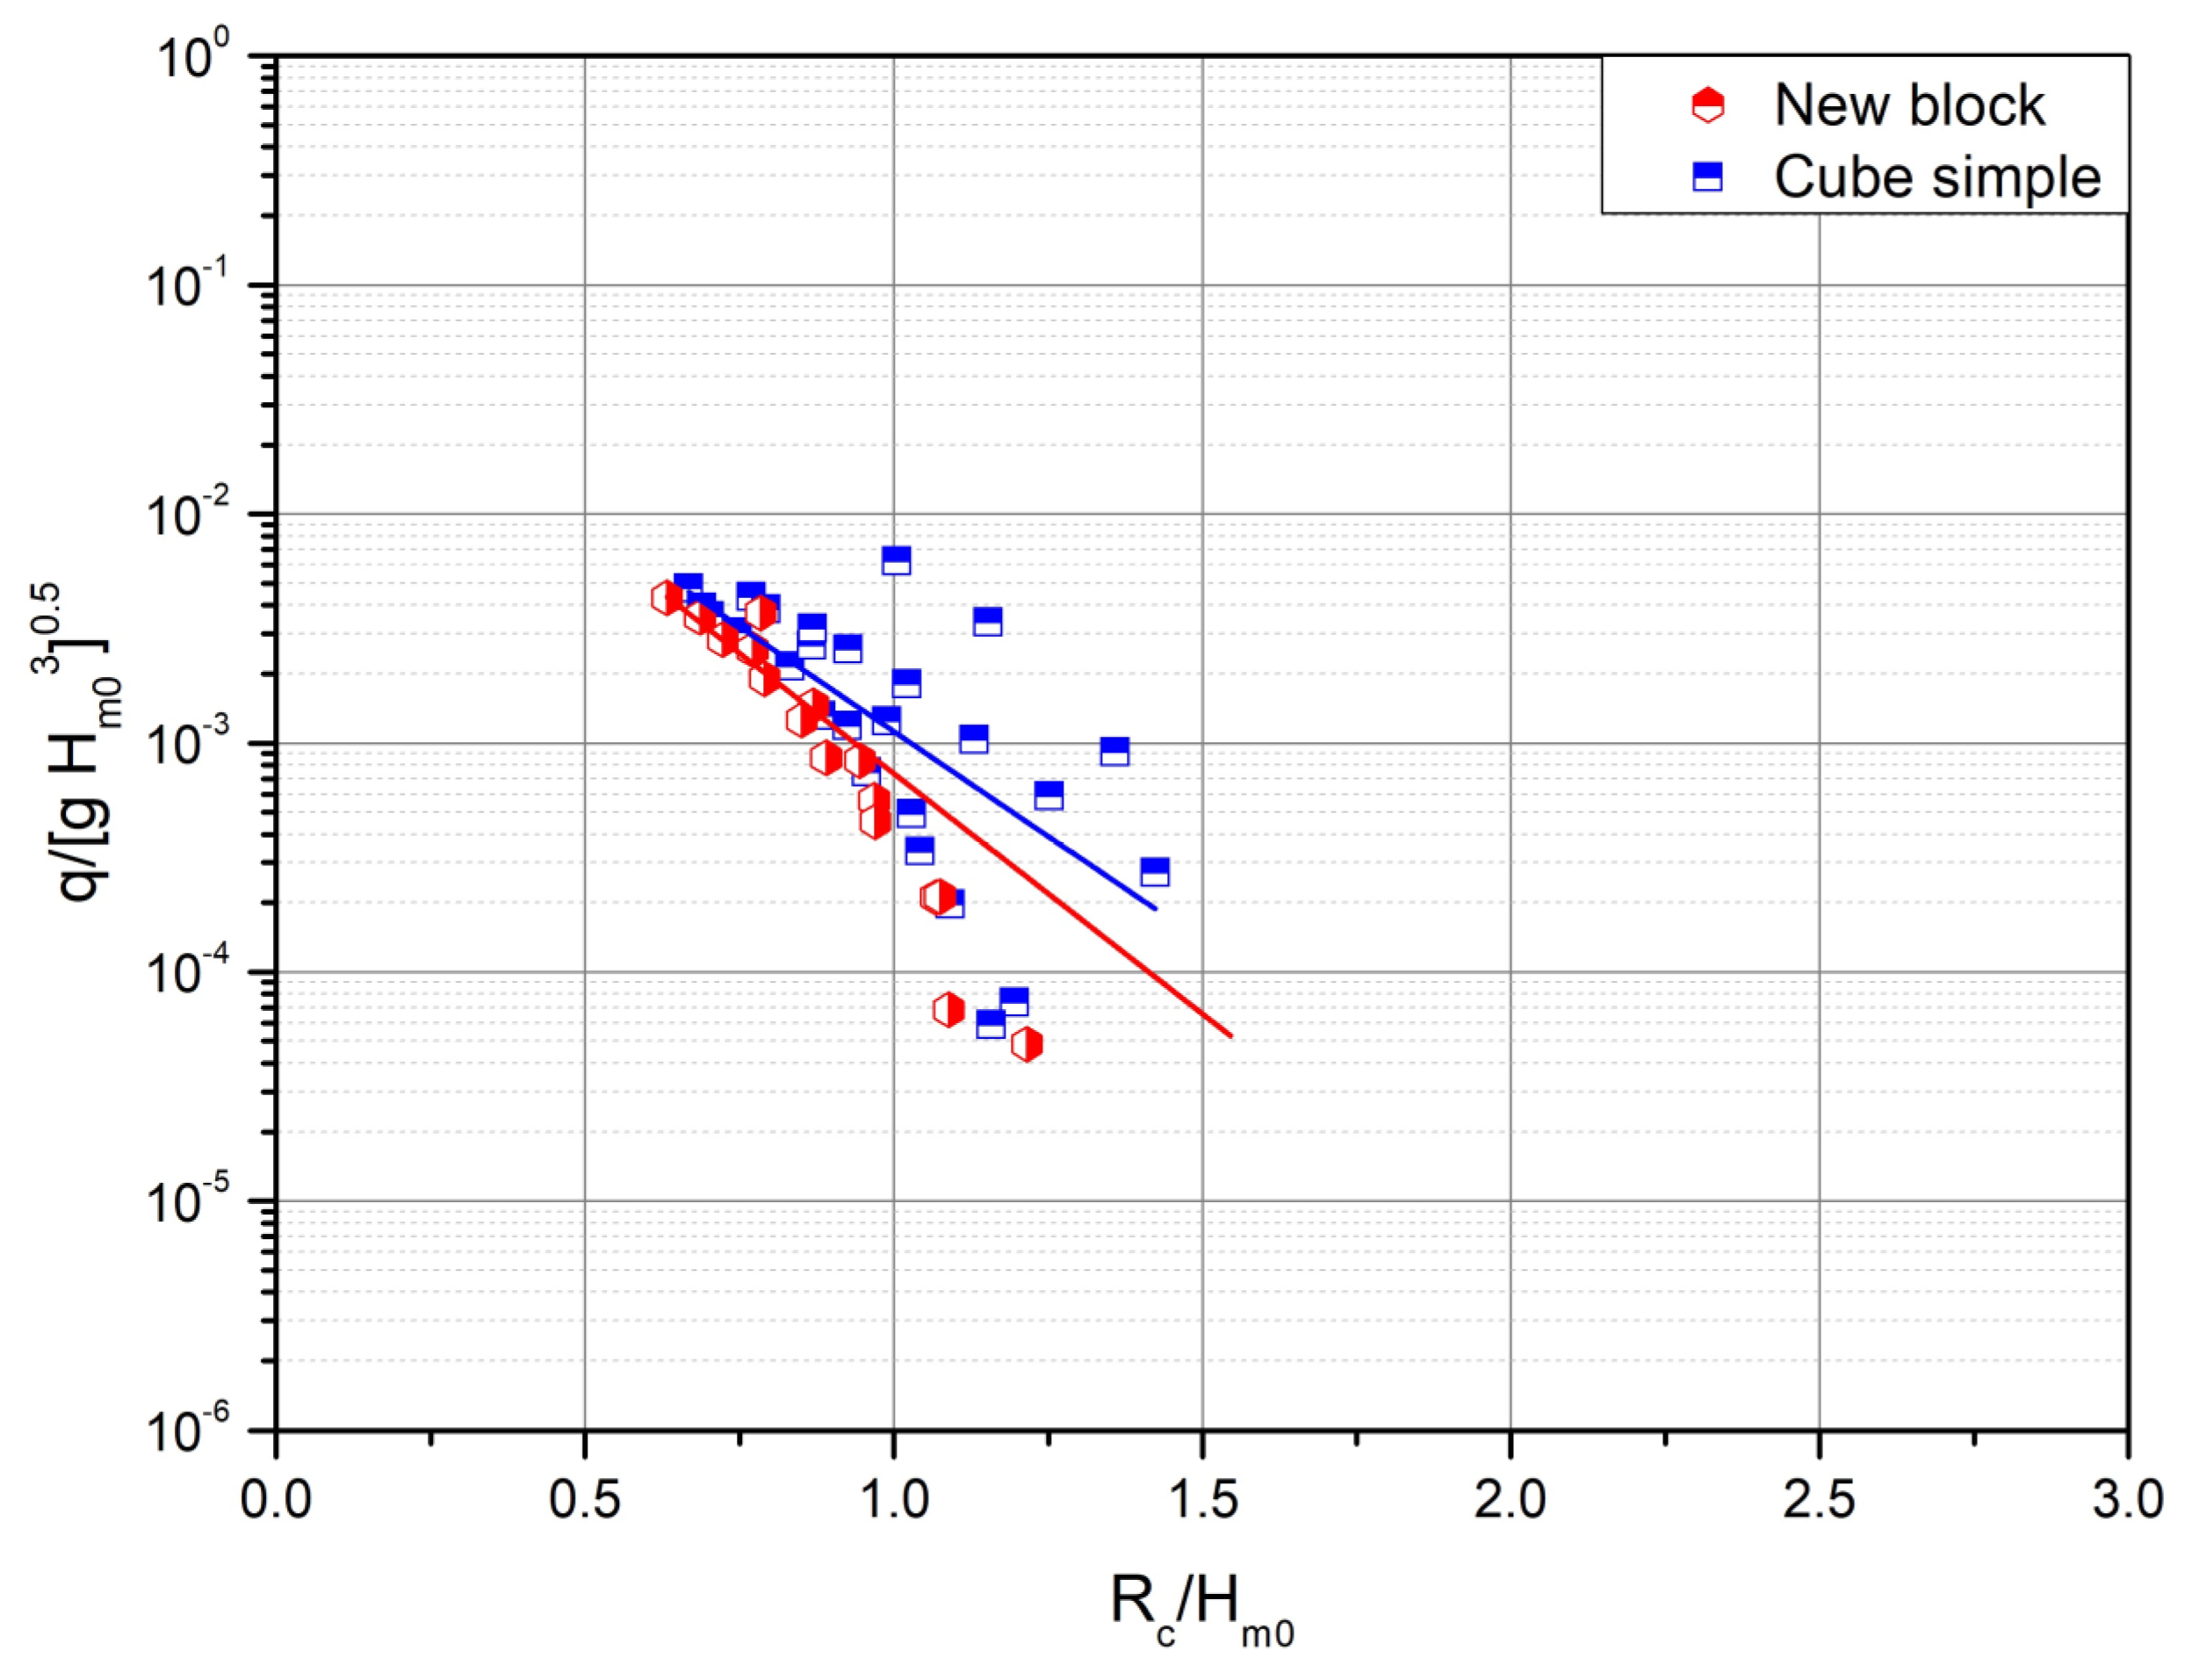
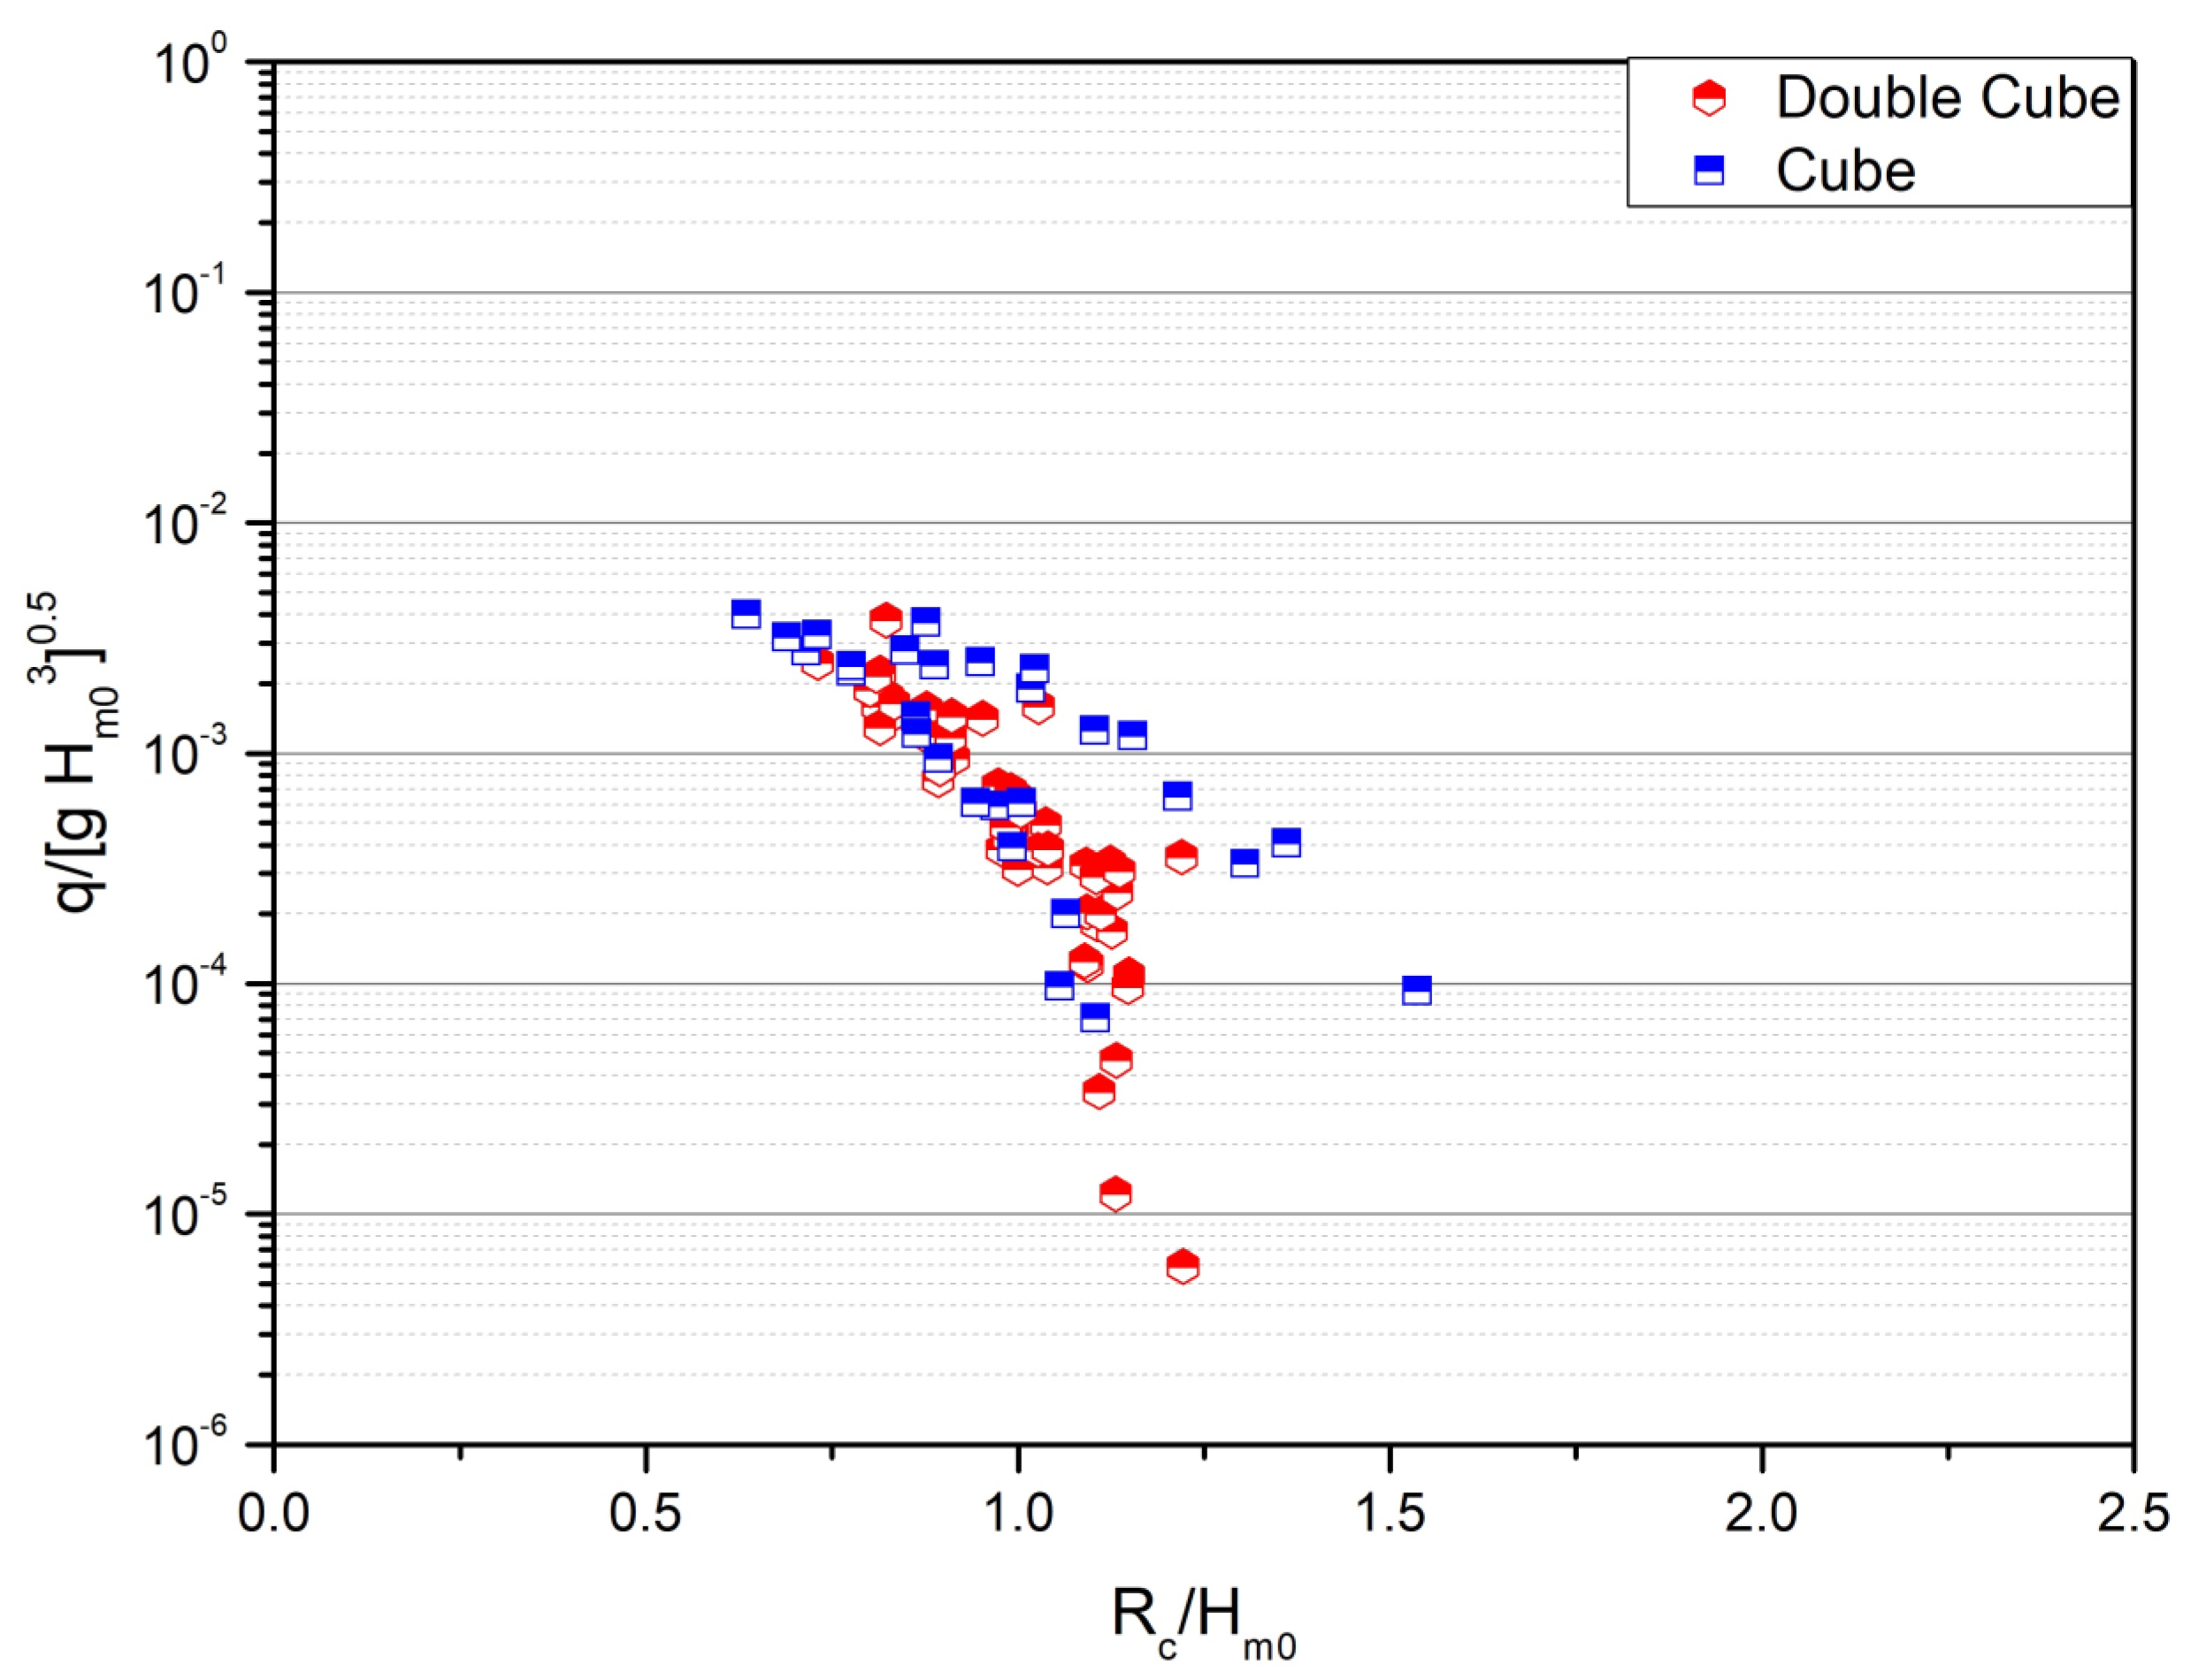
6.2. Comparison with Other Units

The model profile used in this study, particularly the crest of the structure (small freeboard), is similar to the designs that had been used in the CLASH program. The CLASH program intended to provide roughness coefficients for natural stones and various types of artificial units (Bruce et al. [47,48]).
Table 6 provides some recent roughness coefficients for single armor units, extracted from the CLASH program (Bruce et al. [48] data), Reedijk et al. [7] data and Perrin et al. [6] data.
As stated by Bakker et al. [15], it is difficult to compare different results obtained from different laboratories, due to the effect of different parameters such as crest width, packing density of the armor layer, geometric characteristics of the underlayer and the core, and the scale effects (Safari et al. [11]).
Therefore, in order to avoid confronting the same problems as those encountered during the tests by Delft Hydraulics for the Xbloc® (Bakker et al. [15]), it was necessary for our model to perform a new series of tests on a reference unit that had been used during the CLASH program studies. This was the simple cube placed in a monolayer, and it was chosen due to the similarity in its configuration to that of a new unit and also due to the easy casting of such a cube in our laboratory.
The overtopping volume was measured for a single-layer regular cube placed on a slope of 3V:4H, followed by a packing density of 70% (Figure 15). The test resulted in a roughness coefficient of γf = 0.51 instead of the expected 0.50. In this study, the roughness coefficient for the DC unit was determined to be 0.46, a 10% decrease when compared to the single layer regular placed cubes.
Additional tests were performed on a 2V:3H slope for the single-layer regular cube and for the DC (Figure 16). In the tests with a cube armor layer, the results revealed a roughness coefficient of approximately 0.48, a 6% decrease when compared to the slope of 3V:4H.
The roughness coefficient measured for the DC was approximately 0.43, meaning a decrease of about 7% compared to the slope of 3V:4H (Table 4).
The tests conducted with a 2V:3H slope also confirm that the DC provides an approximately 10% lower roughness coefficient compared to a single layer regular placed cube.

7. Conclusions

The Double cube is a new friction-type bulky armor unit designed to protect breakwaters, shorelines, and riverbanks. The DC is composed of two cubic parts joined by a transition section. It is inspired by the simplicity and effectiveness of the cube; however, the new design is aimed to address some of the cube’s performance flaws. The basic design idea consists of placing a roughness element onto a sturdier lower part, enabling an assembly of such elements to constitute a stable armor layer.
The innovative design seeks an optimized shape leading to high structural integrity, high hydraulic stability, and a low concrete consumption, while providing an easy placement method. Here, two placement methods were studied, “Direct” and “Random” placements.
Another goal was to increase the roughness coefficient of the armor layer and subsequently, to reduce the overtopping.
The following conclusions can be drawn from the 2D hydraulic laboratory investigations:
  • The Double cube allows for simple random placement with no special requirements for the toe or the filter layer.
  • The hydraulic stability of the DC is comparable to that of a single armor layer such as Accropode®I or Xbloc®.
  • In terms of hydraulic performance, the DC has a roughness parameter that is roughly 10% lower than the single-layer regular placed cube. The new block’s roughness parameter is comparable to that of Xbloc® or Accropode®I.
  • Regarding concrete consumption, it is comparable to that of the most efficient units, such as the Xbloc® or the Accropode®I.
  • Because of its new innovative form, fewer units can be used in a single layer. This will reduce the time and cost of manufacturing, storing, and placing units.
  • Greater hydraulic stability allows for the use of smaller cranes.
Promising results have been observed from testing of the newly developed block. This can be regarded as a start to further studies and optimizations on the proposed block. Furthermore, these 2D experiments were focused only on one size of armor unit. In the laboratory, it is easy to place units into their assigned positions. However, this may not be the case for placing the blocks in prototype conditions, which can especially be the case for blocks under the water level while undergoing wave agitation. It is therefore necessary to consider placement tolerances and anticipate the influence of the displacement of some blocks on the stability of the armor layer. Further structural integrity tests must be realized at a prototype scale (drop test) or using a numerical model.

Author Contributions

Conceptualization, I.S. and D.M.; methodology, I.S. and D.M.; experiment, I.S.; formal analysis and investigation, I.S. and D.M.; writing—original draft preparation, I.S.; writing—review and editing, D.M. and S.A.; supervision, D.M.; funding acquisition, G.C. and F.R. All authors have read and agreed to the published version of the manuscript.

Funding

This research received no external funding.

Institutional Review Board Statement

Not applicable.

Informed Consent Statement

Not applicable.

Data Availability Statement

Not applicable.

Acknowledgments

The study was carried out as part of the research project of Iman Safari in the framework of a research fellowship program. The authors gratefully acknowledge the laboratory of Continental and Coastal Morphodynamics of the University of Caen, for the use of research facilities. Financial support for this study was granted to the INOUCO Company.

Conflicts of Interest

The authors declare no conflict of interest.

References

  1. CIRIA/CUR/CETMEF. The Rock Manual. The Use of Rock in Hydraulic Engineering, 2nd ed.; CIRIA: London, UK, 2007; 1267p. [Google Scholar]
  2. Salauddin, M.; Broere, A.; Van Der Meer, J.W.; Verhagen, H.J.; Bijl, E. First tests on the symmetrical breakwater armor unit crablock. J. Coast. Eng. 2017, 59, 1–33. [Google Scholar] [CrossRef]
  3. Salauddin, M.; Broere, A.; Van Der Meer, J.W.; Verhagen, H.J.; Bijl, E. A New Symmetrical Unit for Breakwater Armour: First Tests. In Proceedings of the Coastal Structures and Solutions to Coastal Disasters, Boston, MA, USA, 9–11 September 2015; pp. 891–901. Available online: https://ascelibrary.org/doi/abs/10.1061/9780784480304.091 (accessed on 28 June 2023).
  4. Gómez-Martín, M.E.; Medina, J.R. Cubipod Concrete Armour Block and Heterogeneous Packing. In Proceedings of the 5th Coastal Structures International Conference, Venice, Italy, 2–4 July 2007; World Scientific: Venice, Italy; pp. 140–151. [Google Scholar]
  5. Gómez-Martín, M.E.; Medina, J.R. Erosion of cubes and Cubipods armour layers under wave attack. In Proceedings of the 31th International Conference on Coastal Engineering, ASCE, Hambourg, Germany, 31 August–5 September 2008; pp. 3461–3473. [Google Scholar]
  6. Perrin, S.; Giraudel, C.; Collinsworth, S.; Melby, J. Hydraulic response & placement methods for a new single-layer concrete armour unit called C-ROC™. In Proceedings of the Coasts, Marine Structures and Breakwaters Conference, ICE, Liverpool, UK, 5–7 September 2017; pp. 321–330. [Google Scholar]
  7. Reedijk, B.; Eggeling, T.; Bakker, P.; Jacobs, R.; Muttray, M. Hydraulic stability and overtopping performance of a new type of regular placed armor unit. In Proceedings of the 36th International Conference on Coastal Engineering, Baltimore, MD, USA, 30 July–3 August 2018; Volume 1. [Google Scholar]
  8. Park, Y.H.; Oh, Y.-M.; Ahn, S.M.; Han, T.H.; Kim, Y.-T.; Suh, K.-D.; Won, D. Development of a new concrete armor unit for high waves. J. Coast. Res. 2019, 35, 719–728. [Google Scholar] [CrossRef]
  9. Safari, I. Analyse de la Performance Hydraulique d’un Nouveau Type de Bloc Artificiel Utilisé Pour la Protection Côtière. Ph.D. Thesis, University of Caen, Caen, France, 2011. [Google Scholar]
  10. Safari, I.; Mouazé, D.; Ropert, F.; Haquin, S.; Ezersky, A. Influence du plan de pose sur les distributions de porosité au sein d’une carapace de digue à talus. XIIèmes Journée Natl. Génie Côtière-Génie Civ. 2012, 791–798. [Google Scholar]
  11. Safari, I.; Mouazé, D.; Ropert, F.; Haquin, S.; Ezersky, A. Hydraulic stability and wave overtopping of Starbloc® armored mound breakwaters. Ocean. Eng. 2018, 151, 268–275. [Google Scholar] [CrossRef]
  12. Safari, I.; Mouazé, D.; Ropert, F.; Haquin, S.; Ezersky, A. Experimental study to determine forces acting on starbloc armor units and velocities occurring in a single-layer rubble mound breakwater. J. Waterw. Port Coast. Ocean. Eng. 2022, 148, 04022007. [Google Scholar] [CrossRef]
  13. Peng, C.; Wang, H.; Zhang, H.; Chen, H. Parametric design and numerical investigation of hydrodynamic characteristics of a new type of armour block TB-CUBE based on SPH method. J. Mar. Sci. Eng. 2022, 10, 1116. [Google Scholar] [CrossRef]
  14. CERC. Shore Protection Manual [SPM], 4th ed.; Coastal Engineering Research Center, US Army Corps of Engineers: Vicksburg, MS, USA, 1984. [Google Scholar]
  15. Bakker, P.; Klabbers, M.; Muttray, M.; Van den Berge, A. Hydraulic performance of Xbloc Armour units. In Proceedings of the 1st International Conferenec on Coastal Zone Management and Engeering in the Middle East, Dubai, United Arab Emirates, 27–29 November 2005. [Google Scholar]
  16. Bakker, P.; Van den Berge, A.; Hakenberg, R.; Klabbers, M.; Muttray, M.; Reedijk, B.; Rovers, I. Development of concrete breakwater armour blocks. In Proceedings of the 1st Coastal, Estuary and Offshore Engineering Specialty Conference of the Canadian Society for Civil Engineering, Moncton, NB, Canada, 4–7 June 2003. [Google Scholar]
  17. Van Gent, M.R.A.; Luis, L. Application of cubes in a single layer. In Proceedings of the 6th Conference on Applied Coastal Research (SCACR), Lisbon, Portugal, 4–7 June 2013. [Google Scholar]
  18. Jensen, O.J. Safety of Breakwater Armour Layers with Special Focus on Monolayer Armour Units: (Discussion Based Upon Four Decades Experience of Breakwater Damage). In From Sea to Shore–Meeting the Challenges of the Sea: (Coasts, Marine Structures and Breakwaters 2013); ICE Publishing: London, UK, 2014; pp. 33–44. [Google Scholar]
  19. Bhageloe, G.S. Breakwaters with a Single Toplayer (In Dutch: Golfbrekers Met een Enkele Toplaag). Master’s Thesis, Delft University of Technology, Delft, The Netherlands, 1998. [Google Scholar]
  20. D’Angremond, K.; Berendsen, E.; Bhageloe, G.S.; Van Gent, M.R.A.; Van der Meer, J.W. Breakwaters with a Single Armour Layer. In Proceedings of the Conference on Coastal and Port Engineering in Developing Countries, Cape Town, South Africa, 19–23 April 1999; pp. 1441–1449. [Google Scholar]
  21. Van Gent, M.R.A.; d’Angremond, K.; Triemstra, R. Rubble mound breakwaters: Single armour layers and high-density blocks. In Coastlines, Structures and Breakwaters; ICE: London, UK, 2001. [Google Scholar]
  22. Van Gent, M.R.A.; Van den Boogaard, H.F.P.; Pozueta, B.; Medina, J.R. Neural network modelling of wave overtopping at coastal structures. Coast. Eng. 2007, 54, 586–593. [Google Scholar] [CrossRef] [Green Version]
  23. Van Gent, M.R.A.; Spaan, G.B.H.; Plate, S.E.; Berendson, E.; Van der Meer, J.W.; d’Angremond, K. Single-Layer Rubble Mound Breakwaters. In Proceedings of the 3th International Conference on Coastal Structures 1999, Satander, Spain, 7–10 June 1999; Volume 1, pp. 231–239. [Google Scholar]
  24. Van Buchem, R.V. Stability of a Single Top Layer of Cubes. Master’s Thesis, Delft University of Technology, Delft, The Netherlands, 2009. [Google Scholar]
  25. Van der Lem, C.; Stive, R.; Van Gent, M.R.A. Sal Rei breakwaters with single layer cubes. In Proceedings of the PIANC-Copedec, Rio de Janeiro, Brazil, 16–21 October 2016. [Google Scholar]
  26. Van Gent, M.R.A.; Van der Werf, I.M. Single Layer Cubes in a Berm. In Proceedings of the Applied Coastal Research, Santander, Spain, 3 October–6 October 2017. [Google Scholar]
  27. Vieira, F.; Taveira-Pinto, F.; Rosa-Santos, P. Single-layer cube armoured breakwaters: Critical review and technical challenges. Ocean Eng. 2020, 216, 108042. [Google Scholar] [CrossRef]
  28. Vieira, F.; Taveira-Pinto, F.; Rosa-Santos, P. Damage evolution in single-layer cube armoured breakwaters with a regular placement pattern. Coast. Eng. 2021, 169, 103943. [Google Scholar] [CrossRef]
  29. Vieira, F.; Taveira-Pinto, F.; Rosa-Santos, P. New developments in assessment of wave overtopping on single-layer cube armoured breakwaters based on laboratory experiments. Coast. Eng. 2021, 166, 103883. [Google Scholar] [CrossRef]
  30. Medina, J.R.; Gómez-Martín, M.E.; Corredor, A. Influence of armour unit placement on armour porosity and hydraulic stability. In Proceedings of the 32nd International Conference on Coastal Engineering, ASCE, Shanghai, China, 30 June–5 July 2010. [Google Scholar]
  31. Dupray, S.; Roberts, J. Review of the Use of Concrete in the Manufacture of Concrete Armour Units. In Proceedings of the International Conference on Coastal, Marine Structures and Breakwaters, Sochi, Russia, 10–14 November 2009; Volume 1, pp. 245–259. [Google Scholar]
  32. Medina, J.R.; Gómez-Martín, M.E. KD and safety factors of concrete armour blocks. In Proceedings of the 33nd International Conference on Coastal Engineering, ASCE, Santander, Spain, 1–6 July 2012; Volume 1, p. 29. [Google Scholar]
  33. Scaravaglione, G.; Latham, J.-P.; Xiang, J.; Francone, A.; Tomasicchio, G.R. Historical overview of the structural integrity of Concrete Armour Units. Coast. Offshore Sci. Eng. 2022, 1, 68–98. [Google Scholar]
  34. Edesign.co.uk. Piston Coastal Wave Generators | Edinburgh Designs. 2012. Available online: http://www.edesign.co.uk/product/piston-wave-generators (accessed on 16 March 2012).
  35. Hughes, S.A. Physical models and laboratory techniques in coastal engineering. In Advanced Series on Ocean Engineering; Coastal Engineering Research Center: Vicksburg, MS, USA, 1993; Volume 7. [Google Scholar] [CrossRef]
  36. Burcharth, H.F.; Liu, Z.; Troch, P. Scaling of core material in rubble mound breakwater model tests. In Proceedings of the 5th International Conference on Coastal and Port Engineering in Developing Countries (COPEDEC V), Cape Town, South Africa, 19–23 April 1999. [Google Scholar]
  37. Vanneste, D.; Troch, P. An improved calculation model for the wave induced pore pressure distribution in a rubble-mound breakwater core. Coast. Eng. 2012, 66, 8–23. [Google Scholar] [CrossRef]
  38. Wolters, G.; Van Gent, M.R.A.; Hofland, B.; Wellens, P. Wave damping and permeability scaling in rubble mound breakwaters. In Proceedings of the 5th International Conference on the Application of Physical Modelling to Port and Coastal Protection, Varna, Bulgaria, 29 September–2 October 2014. [Google Scholar]
  39. Mansard, E.P.D.; Funke, E.R. The measurement of incident and reflected spectra using a least squares method. In Proceedings of the 17th International Conference on Coastal Engineering, ASCE, Sydney, Australia, 23–28 March 1980; Volume 1, pp. 154–172. [Google Scholar]
  40. Medina, J.R.; Molines, J.; Gómez-Martín, M.E. Influence of armour porosity on the hydraulic stability of cube armour layers. J. Ocean Eng. 2014, 88, 289–297. [Google Scholar] [CrossRef] [Green Version]
  41. Van der Meer, J.W. Design of concrete armour Layers. In Proceedings of the Coastal Structures 99, Santander, Spain, 7–10 June 1999; pp. 213–221. [Google Scholar]
  42. Hudson, R.Y. Laboratory investigations of rubble mound breakwaters. J. Waterw. Harb. Div. 1959, 85, 93–121. [Google Scholar] [CrossRef]
  43. Bradbury, A.P.; Allsop, N.W.H.; Stephens, R.V. Hydraulic Performance of Breakwater Crown Walls; Report SR146; H.R. Wallingford: Oxfordshire, UK, 1988. [Google Scholar]
  44. Owen, M.W. Design of Seawalls Allowing for Wave Overtopping; Report 924; Hydraulic Research Wallingford: Oxfordshire, UK, 1980. [Google Scholar]
  45. Van der Meer, J.W.; Stam, C.J.M. Wave run-up on smooth and rock slopes of coastal structures. J. Waterw. Port Coast. Ocean. Eng. 1992, 118, 534–550. [Google Scholar] [CrossRef]
  46. Aminti, P.; Franco, L. Wave overtopping on rubble mound breakwaters. Coast. Eng. Proc. 1988, 1, 770–781. [Google Scholar] [CrossRef] [Green Version]
  47. Bruce, T.; Van der Meer, J.W.; Franco, L.; Pearson, J.M. A comparison of overtopping performance of different rubble mound breakwater armours. In Proceedings of the 30th Conference on Coastal Engineering, San Diego, CA, USA, 19 November 2006; Volume 5, pp. 4567–4579. [Google Scholar]
  48. Bruce, T.; Van der Meer, J.W.; Franco, L.; Pearson, J.M. Overtopping performance of different armour blocks for rubble mound breakwaters. Coast. Eng. 2009, 56, 166–179. [Google Scholar] [CrossRef]
  49. Molines, J.; Medina, J.R. Calibration of overtopping roughness factors for concrete armor units in non-breaking conditions using the CLASH database. Coast. Eng. 2015, 96, 62–70. [Google Scholar] [CrossRef] [Green Version]
  50. EurOtop. Overtopping Manual, Wave Overtopping of Sea Defences and Related Structures: Assessment Manual; Pullen, T., Allsop, N.W.H., Bruce, T., Kortenhaus, A., Schüttrumpf, H., Van der Meer, J.W., Eds.; EurOtop: Frickenhausen, Germany, 2007; Available online: www.overtopping-manual.com (accessed on 1 August 2007).
  51. EurOtop. Manual on Wave Overtopping of Sea Defences and Related Structures. An Overtopping Manual Largely Based on European Research, but for Worldwide Application; Van der Meer, J.W., Allsop, N.W.H., Bruce, T., De Rouck, J., Kortenhaus, A., Pullen, T., Schüttrumpf, H., Troch, P., Zanuttigh, B., Eds.; EurOtop: Frickenhausen, Germany, 2018; Available online: www.overtopping-manual.com (accessed on 15 March 2019).
  52. Möller, J.; Kortenhaus, A.; Oumeraci, H.; de Rouck, J.; Medina, J.R. Wave run-up and wave overtopping on a rubble mound breakwater-Comparison of prototype and laboratory investigations. Coast. Struct. 2003, 2003, 456–468. [Google Scholar] [CrossRef]
  53. Jacobs, R.; Bakker, P.; Vos-Rovers, I.; Reedijk, B. Xbloc-plus development of a regular placed interlocking armour unit. Coast. Eng. Proc. 2018, 36, 45. [Google Scholar] [CrossRef] [Green Version]
  54. TAW. Technical Report Wave Run-Up and Wave Overtopping at Dikes; Technical Report; Technical Advisory Committee on Flood Defence TAW: Delft, The Netherlands, 2002; Available online: http://resolver.tudelft.nl/uuid:d3cb82f1-8e0b-4d85-ae06-542651472f49 (accessed on 1 May 2002).
  55. Van der Meer, J.W.; Janssen, J.P.F.M. Wave Run-Up and Wave Overtopping at Dikes. In Wave Forces on Inclined and Vertical Wall Structures; Kobayashi, N., Demirbilek, Z., Eds.; ASCE: New York, NY, USA, 1995; pp. 1–27. [Google Scholar]
Figure 1. Disarrangement of cube placement (Safari [9]).
Jmse 11 01382 g001
Figure 2. Plan view of the Double Cube unit.
Jmse 11 01382 g002
Figure 3. DC unit geometry.
Jmse 11 01382 g003
Figure 4. Schematic of Direct placement method (DP).
Jmse 11 01382 g004
Figure 5. Schematic of Random placement method (RP).
Jmse 11 01382 g005
Figure 6. Schematic diagram of wave flume and instrumentation.
Jmse 11 01382 g006
Figure 7. Cross section of the rubble mound breakwater (all dimensions in m).
Jmse 11 01382 g007
Figure 8. Stability test results (Filter Dn50 = 0.015 m).
Jmse 11 01382 g008
Figure 9. Relation between Nod and HsDn.
Jmse 11 01382 g009
Figure 10. Vertical settlement of upper armor layer: (a) before test; (b) after some tests.
Jmse 11 01382 g010
Figure 11. Influence of the slope angle on stability on a ‘Random placement’ with a packing density of 0.68.
Jmse 11 01382 g011
Figure 12. Comparison of stability test results for DC unit with a single-layer cube.
Jmse 11 01382 g012
Figure 13. Dimensionless plot of overtopping tests for two studied placements.
Jmse 11 01382 g013
Figure 14. Comparison of tests results for three under layers.
Jmse 11 01382 g014
Figure 15. Comparison of measured wave overtopping for two units (3V:4H).
Jmse 11 01382 g015
Figure 16. Comparison of measured wave overtopping for cubes and DC (2V:3H).
Jmse 11 01382 g016
Table 1. Properties of unit and model parameters.
ElementsDn–Dn50 (m)ρs (kgm−3)M50 [kg]
Armor layer0.035516200.0725
Underlayer0.015026500.0090
Core0.010026500.0026
Rear-side armor0.024026500.0360
Toe0.020026500.0210
Table 2. Summary of hydraulic stability wave conditions.
Armour LayerPlacement PatternSlope AngleUnder Layer Dn50 (m) Tp (s)No. of TestsRc (m)Packing Density
DCRandom3V:4H0.01001.2160.080.68
1.580.08
60.11
Direct3V:4H0.01251.280.080.64
1.540.08
30.11
Random180.080.68
1.2400.08
160.11
1.5200.08
270.11
Random3V:4H0.0150160.070.68
30.105
1.2110.07
180.105
1.540.09
120.105
Direct110.1050.64
1.250.105
1.540.105
Random2V:3H1100.080.68
1.2420.08
1.560.08
Direct140.070.64
1.2220.07
1.520.07
CubeSimple3V:4H0.01001.2100.080.69
1.580.08
0.0150160.07
1.2110.07
60.105
1.530.09
2V:3H170.07
1.2190.07
60.105
1.530.07
40.105
Table 3. Comparative table for hydraulic stability and consumption of concrete for different units.
Accropode® IX-bloc®Cubipod®Cube
1 Layer
DC
Placement patternRandomRandomRandomRandomRandomDirect
Breakwater slope3V:4H3V:4H2V:3H2V:3H3V:4H3V:4H
Ns no damage3.7 [1]3.3–5.5 [15]332.9–3.0 [1]4.0–5.44.9–5.7
Ns failure4.1 [1]3.7–6.0 [15]3.7 [32]3.5–3.75 [1]5.7–5.96.3–7.2
Ns project2.7 [1]2.8 [1]2.6 [32]2.2 [1]2.93.1
Min Ns/Ns project1.371.181.151.321.381.58
Packing density0.620.580.650.70.670.63
Consumption of concrete unit related to a cubic shape72.265.178.610072.664.9
Table 4. Comparative table for hydraulic stability and consumption of concrete for different units.
Cube 1Cubipod®Accropode® IDCXbloc®Core-loc®
Number of layers++++++++++++
Hydraulic stability+− 2+++++++++
Overtopping+−+++++
Structural Integrity+++−++−+−
Porosity+++++
Ease of placement+−+−−−++−−−
Ease of build+++−−+−−−−
Storage+++++−
Safety++−+−++−+−
Economy++−++−+−
1 Cubes are considered as the basis of the comparison. 2 The +− sign means that we did not make a determination either because of too much variation in the criterion within the group, or because of insufficient available data (economy), or because of the strong dependency on other criteria (safety).
Table 5. Summary of overtopping test conditions.
Armour LayerUnder Layer Dn50 (m)Slope AnglePlacement PatternTp (s)No. of TestsRc (m)Packing Density
DC0.01003V:4HRandom1.2160.080.68
1.580.08
60.11
0.01253V:4HDirect1.280.080.64
1.540.08
30.11
Random180.080.68
1.2400.08
160.11
1.5200.08
270.11
0.01503V:4HRandom160.070.68
30.105
1.2110.07
180.105
1.540.09
120.105
Direct110.1050.64
1.250.105
1.540.105
2V:3HRandom1100.080.68
1.2420.08
1.560.08
Direct140.070.64
1.2220.07
1.520.07
Cube0.01003V:4HSimple1.2100.080.69
1.580.08
0.0150160.07
1.2110.07
60.105
1.530.09
2V:3H170.07
1.2190.07
60.105
1.530.07
40.105
Table 6. Roughness coefficient for single placed armor layer, from synthesis of new data and other comparable tests (Bruce et al. [48] data; Reedijk et al. [7] data; Perrin et al. [6] data; Safari et al. [11] data).
Type of ArmourNo. of LayersSlope Angleγfγfγf
Mean95% CI, Low95% CI, High
Smooth-1.51
Rock (permeable core)11.50.45
Cube11.50.490.460.52
Accropode I11.50.460.430.48
Core-Loc11.50.440.410.47
Xbloc11.50.440.410.46
XblocPLUS11.50.45
Starbloc11.50.450.430.47
C-ROC11.5/1.330.67
DC11.330.460.430.48
1.50.430.400.45
Disclaimer/Publisher’s Note: The statements, opinions and data contained in all publications are solely those of the individual author(s) and contributor(s) and not of MDPI and/or the editor(s). MDPI and/or the editor(s) disclaim responsibility for any injury to people or property resulting from any ideas, methods, instructions or products referred to in the content.

