
Wave Transmission over Rubble-Mound Submerged Breakwaters

Abstract
:1. Introduction
2. Materials and Methods
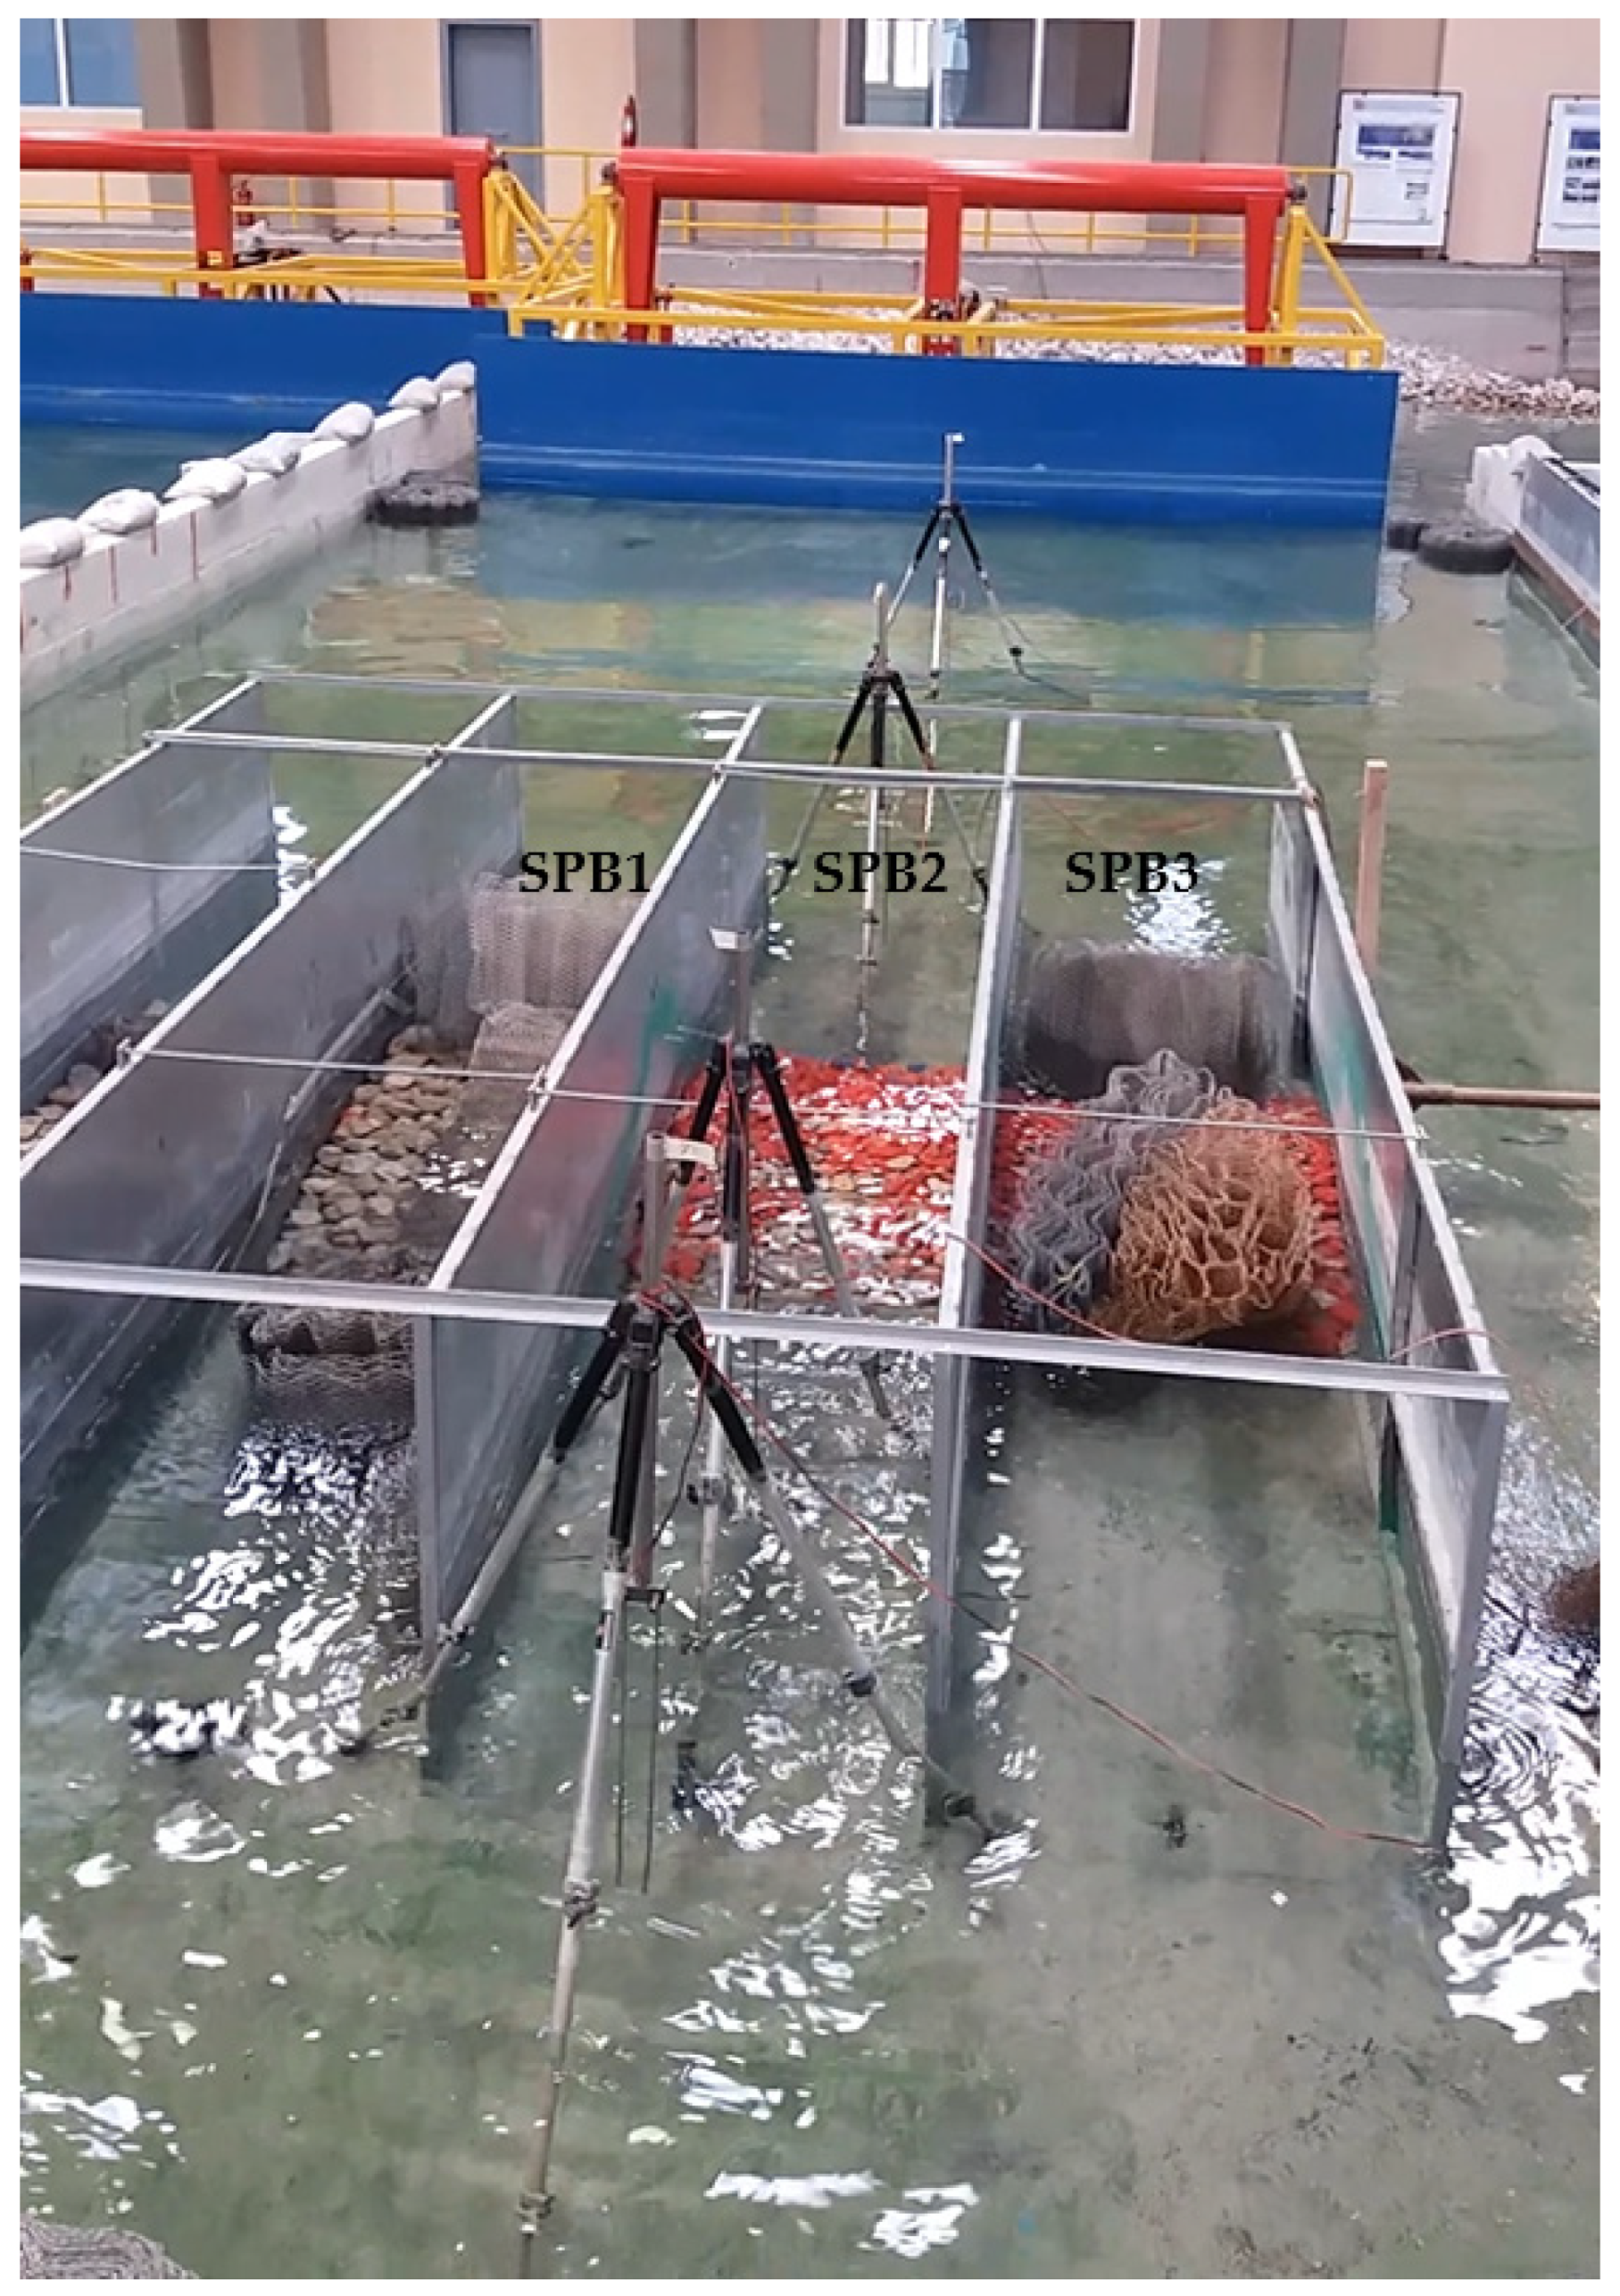
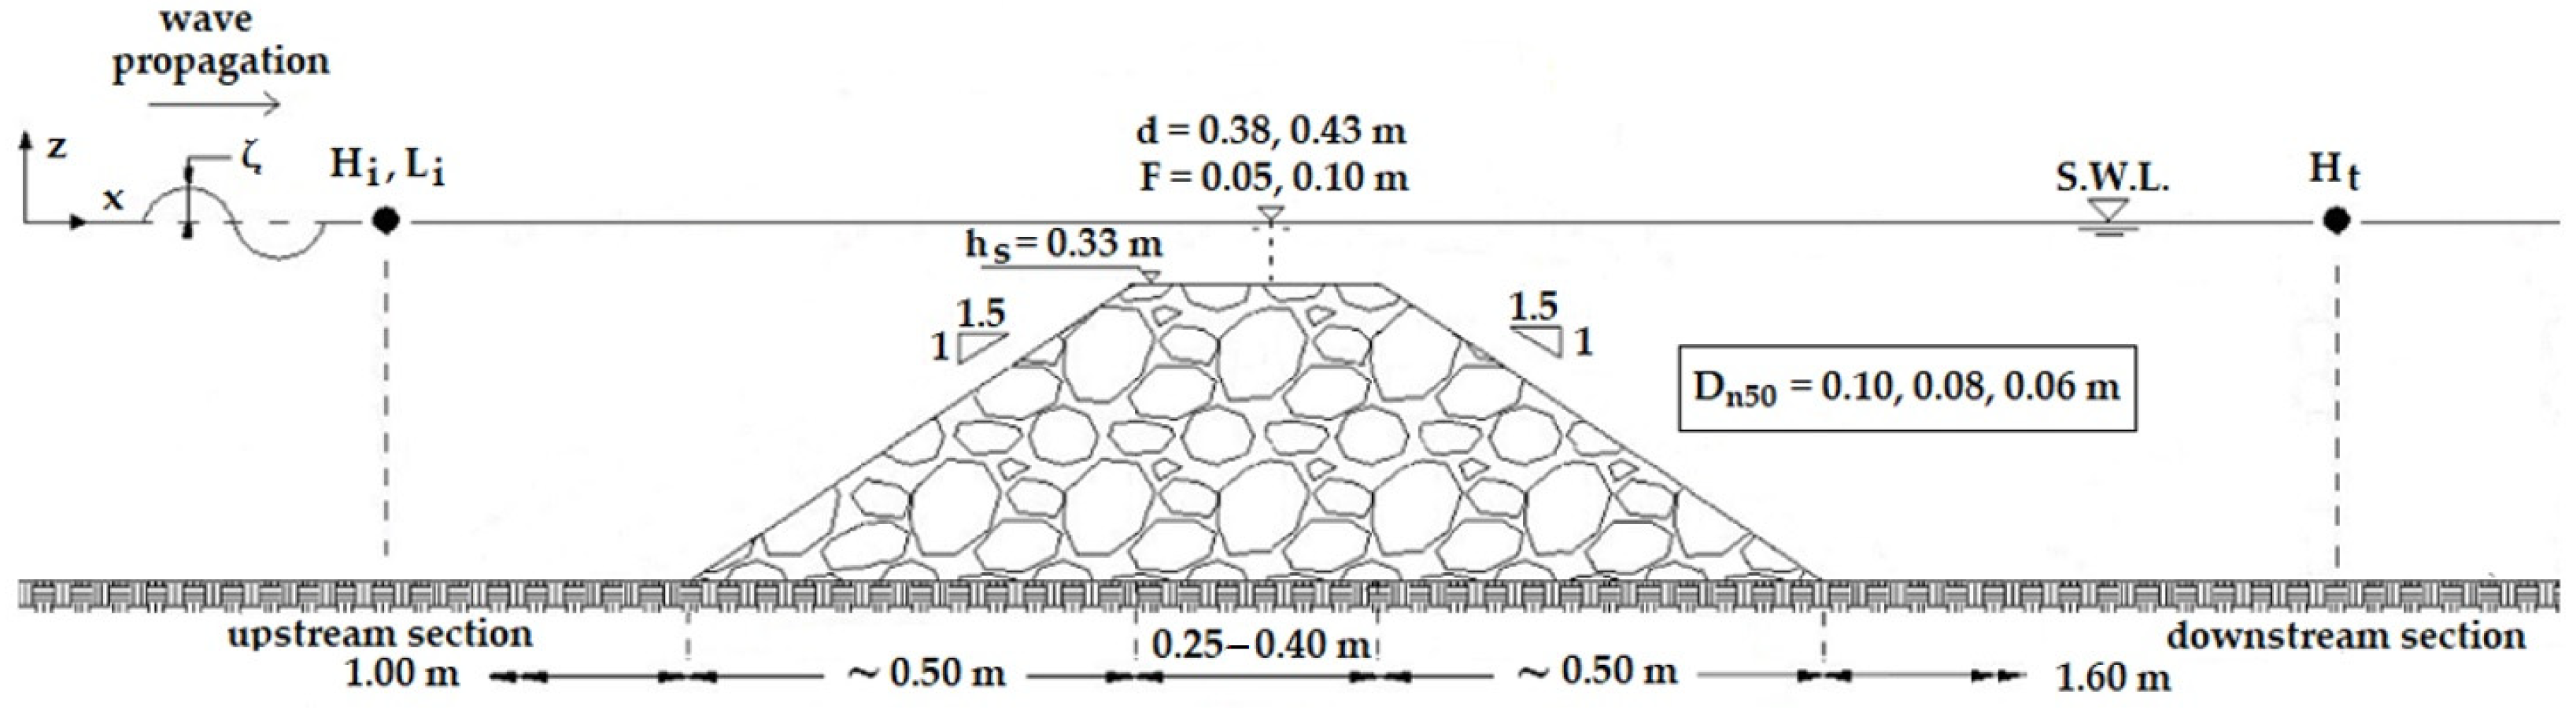
2.1. Experimental Setup
2.2. Numerical Model
2.3. Breaker Type Classification
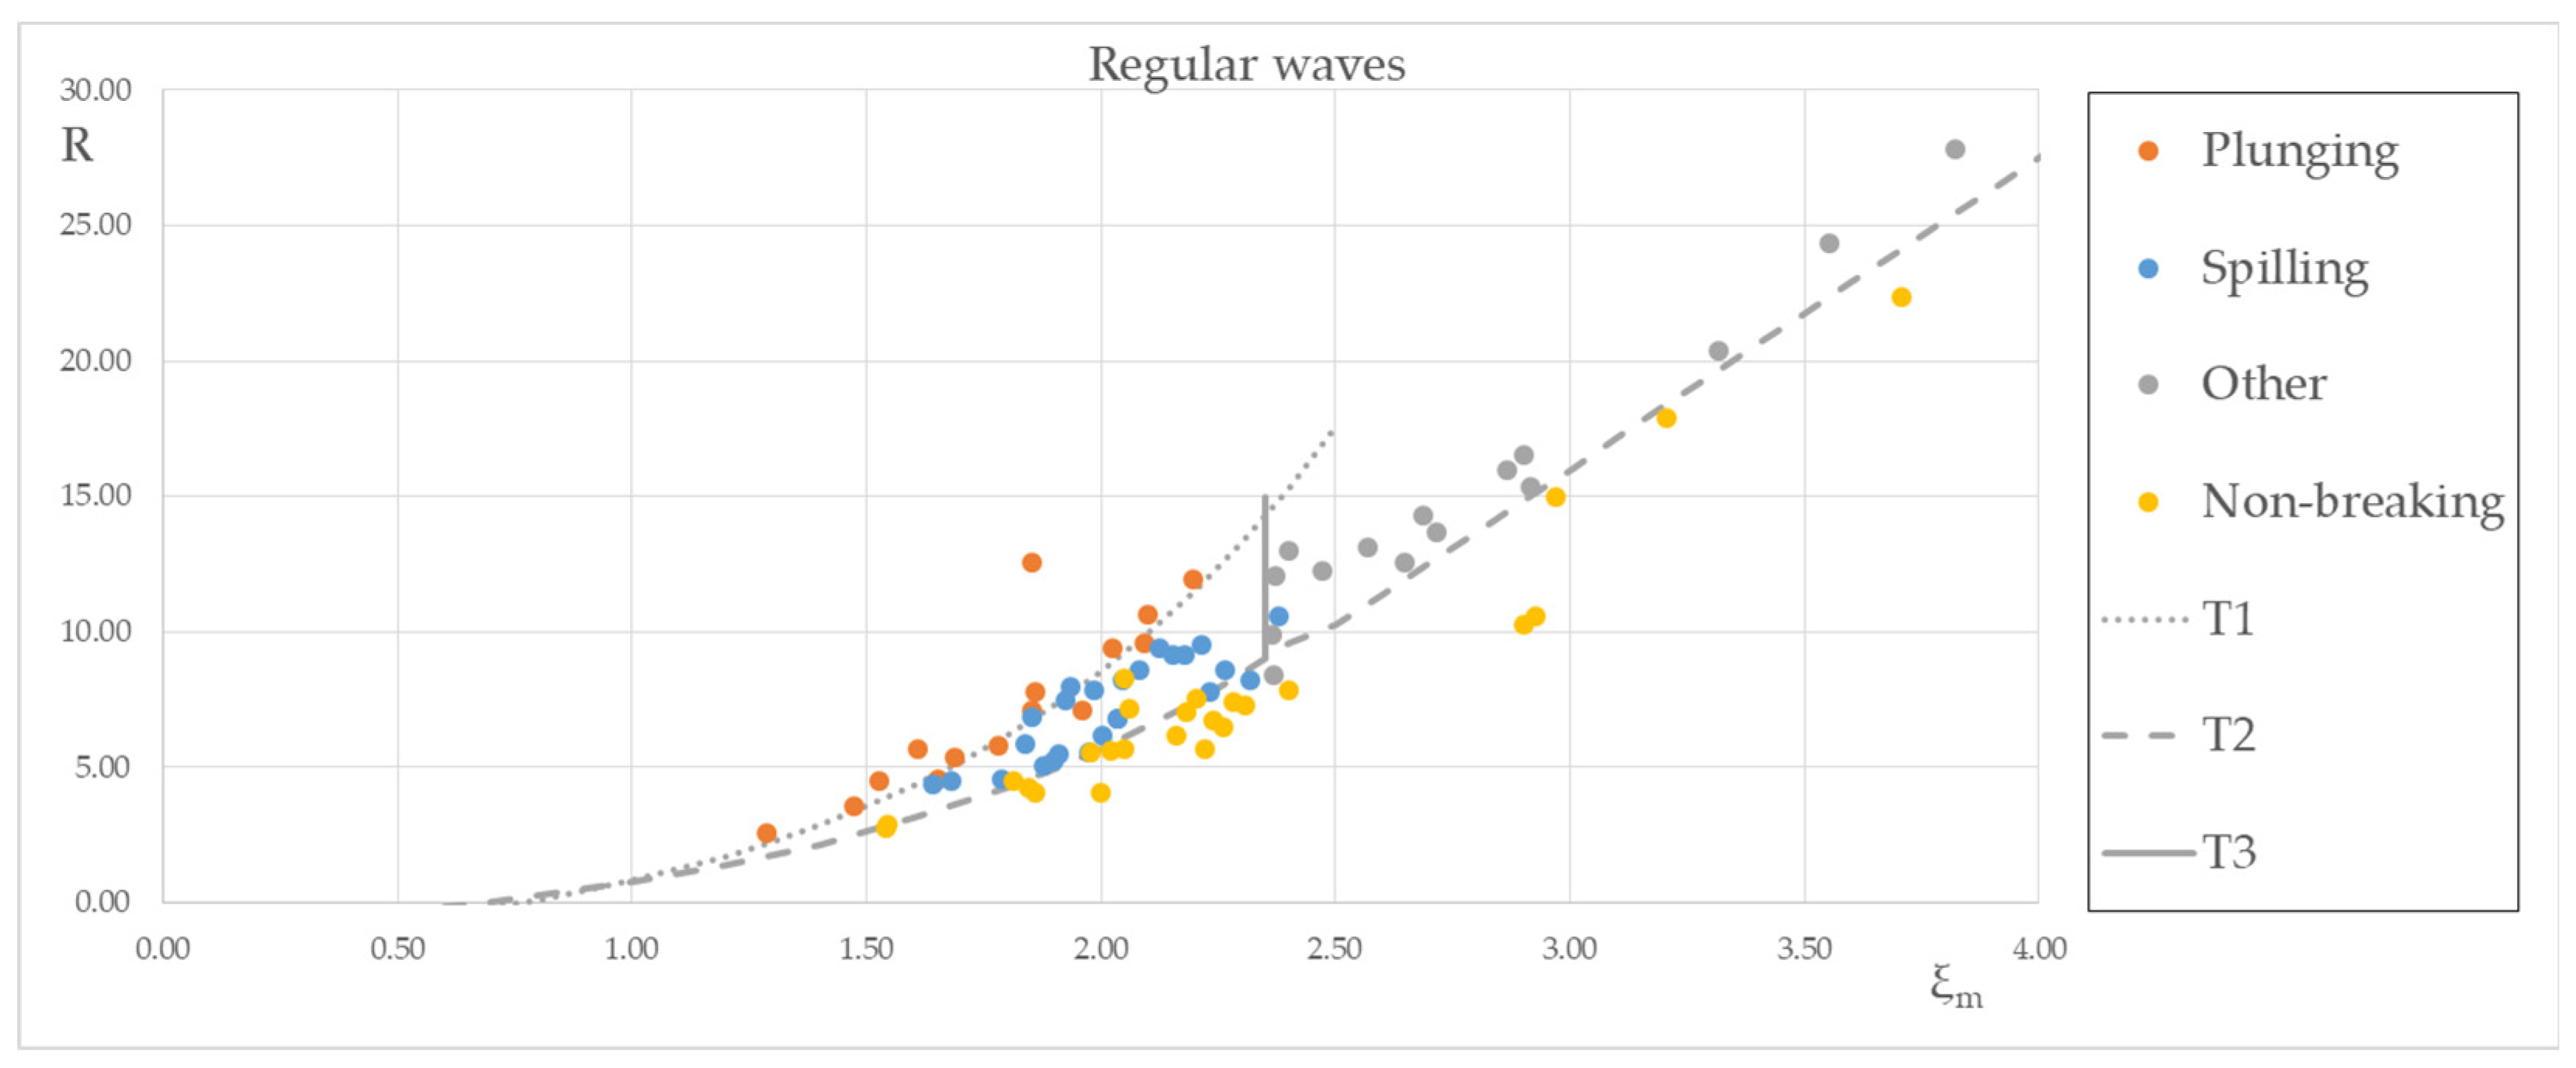
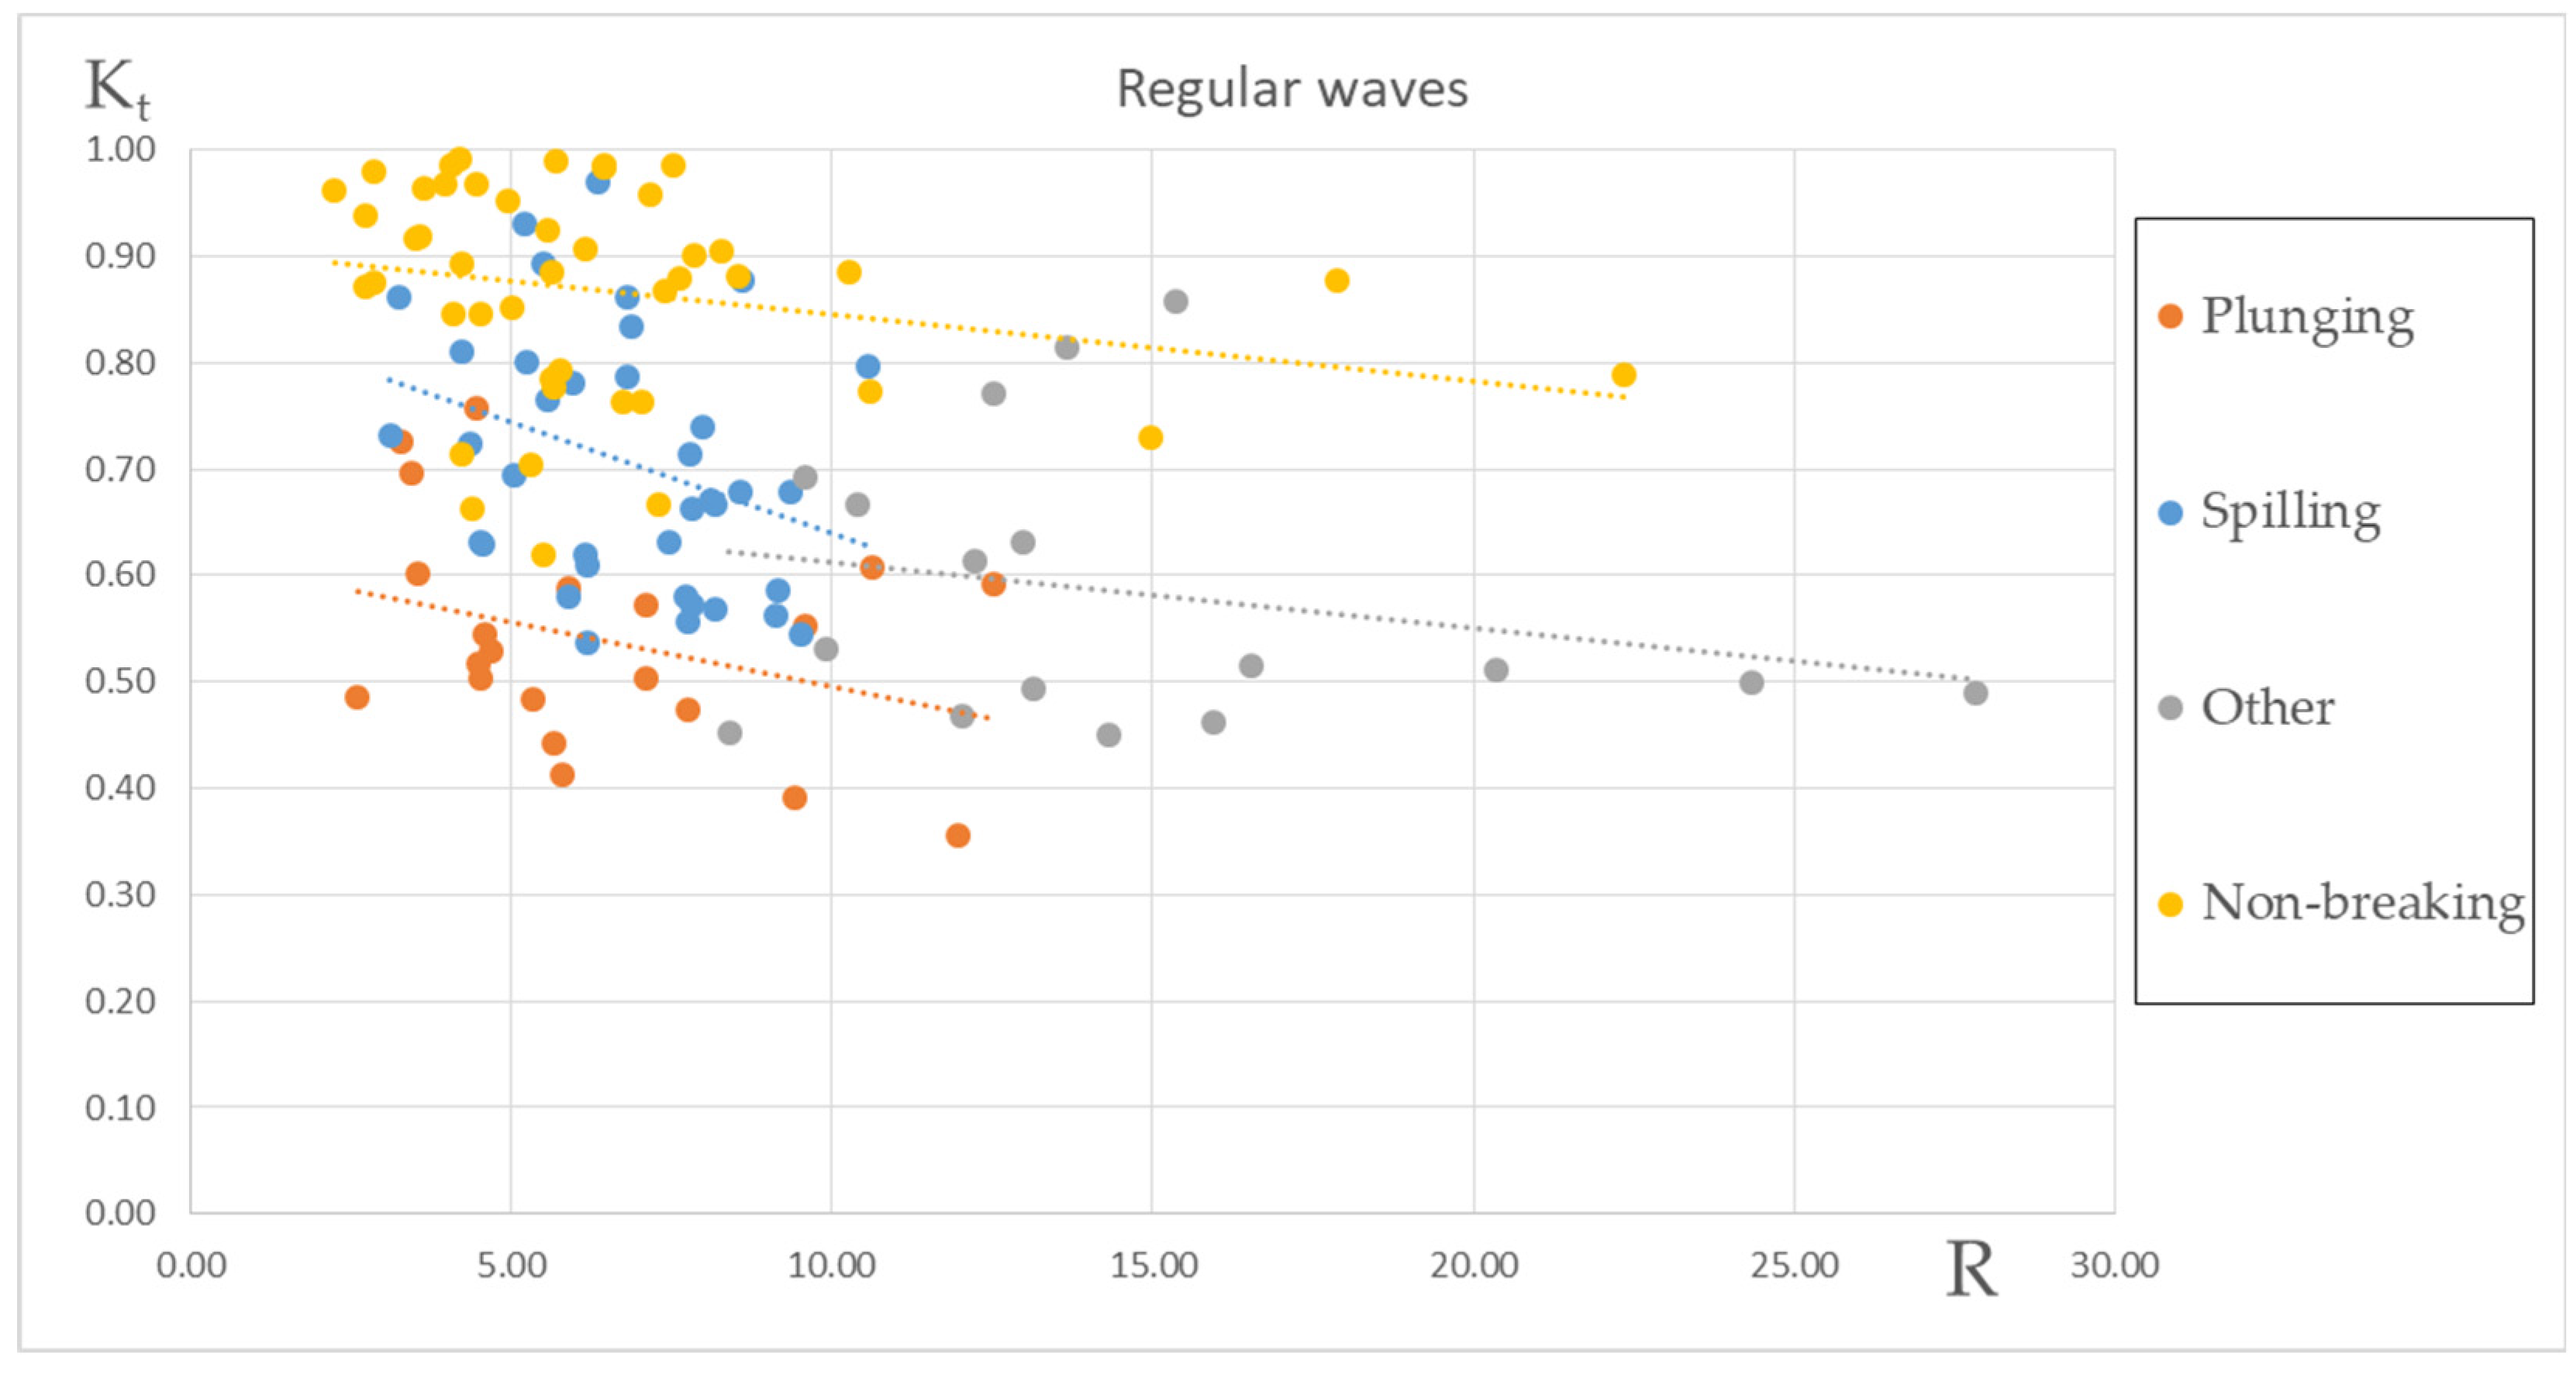
2.3.1. Regular Waves
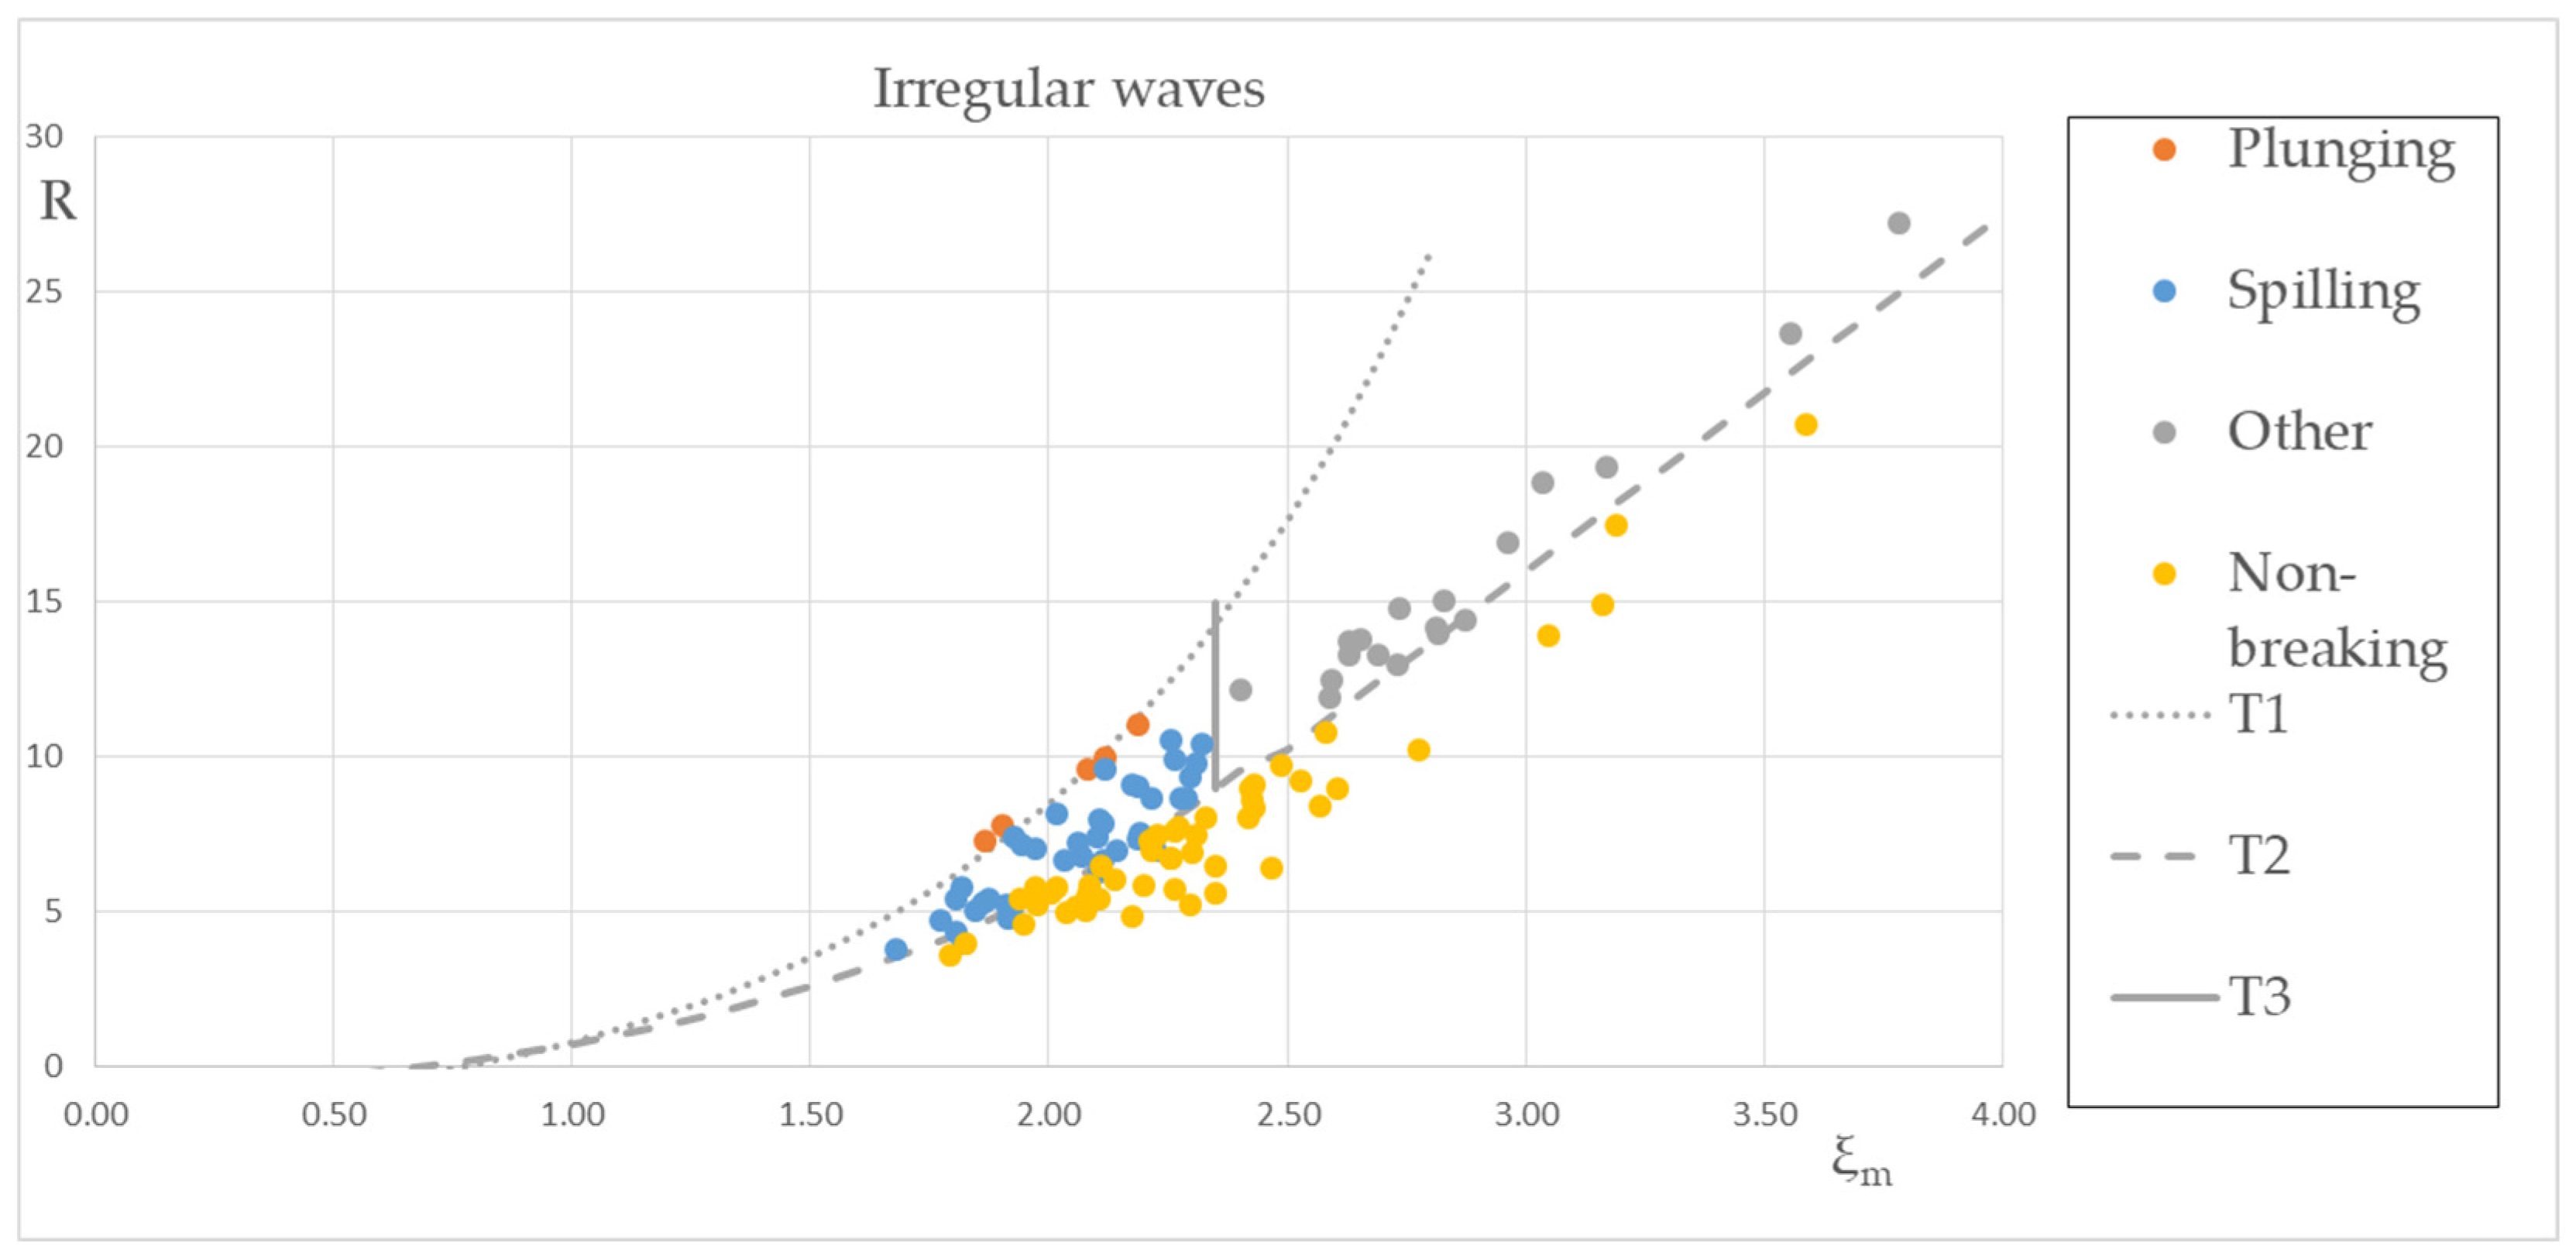
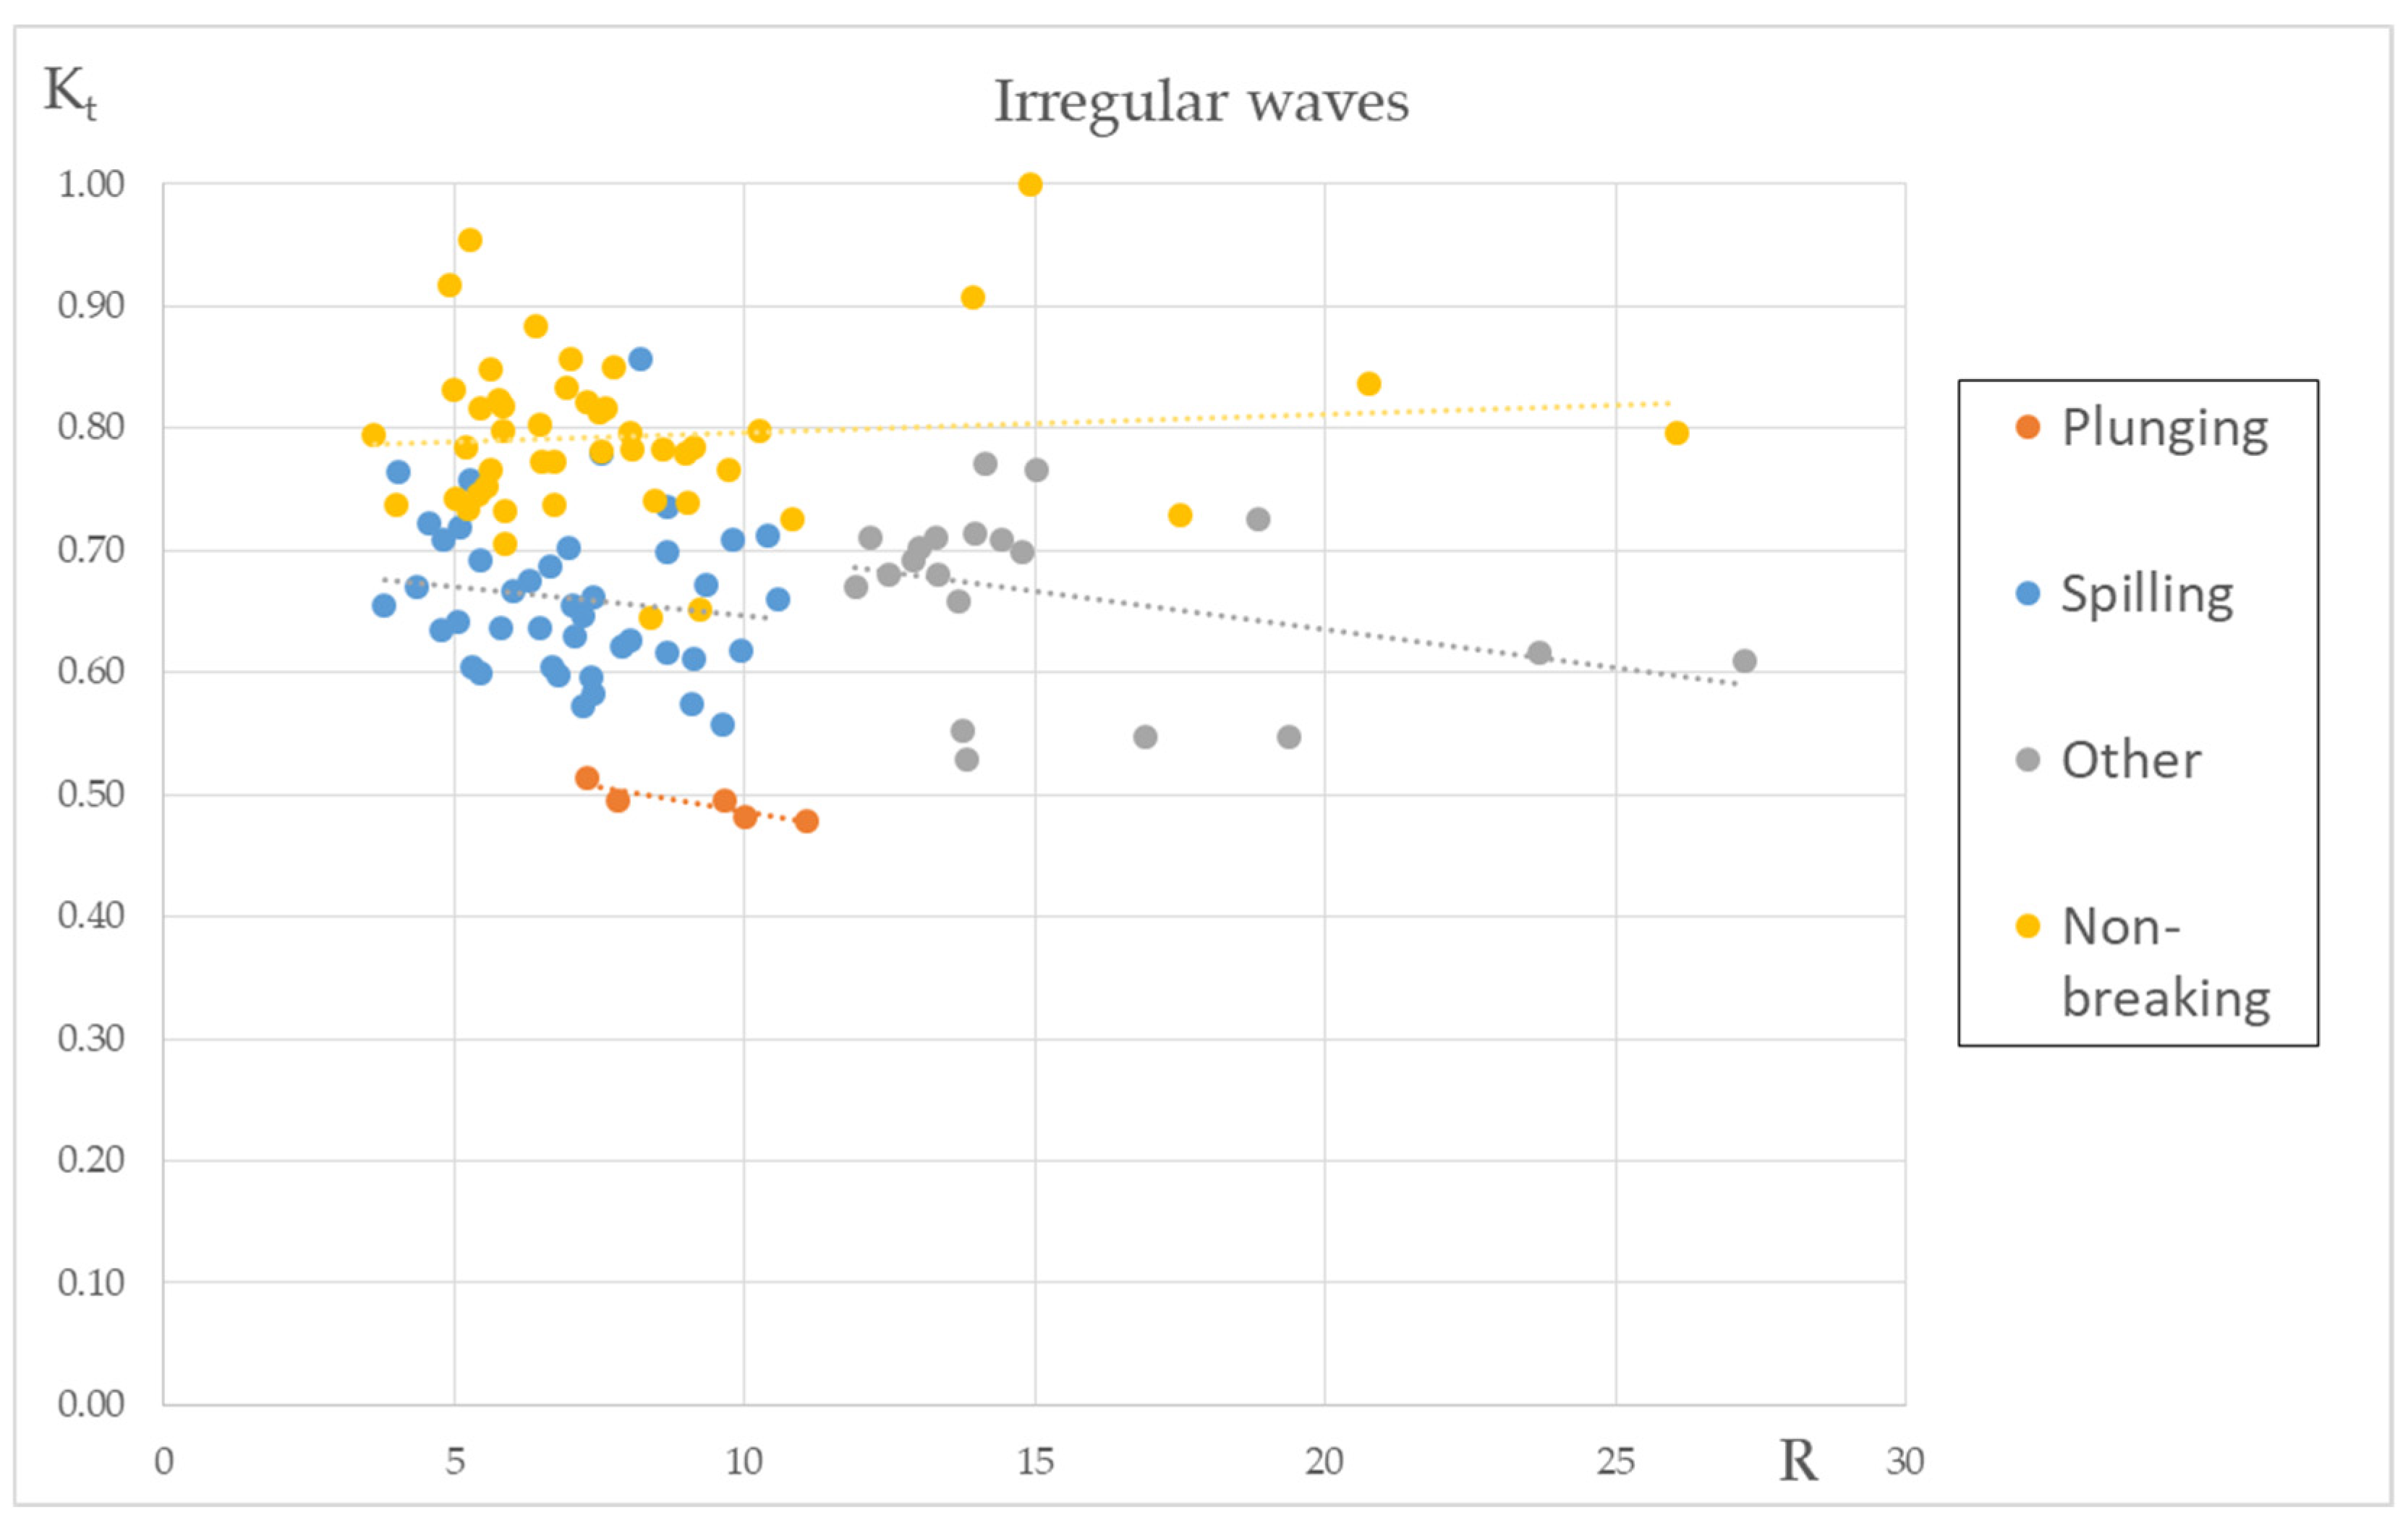
2.3.2. Irregular Waves
3. Results
4. Discussion
5. Conclusions
Author Contributions
Funding
Institutional Review Board Statement
Informed Consent Statement
Data Availability Statement
Acknowledgments
Conflicts of Interest
Appendix A

| # | T (s) | Hi (m) | Kt | Breaker Type | |
|---|---|---|---|---|---|
| SPB1 F = 0.10 m | 1 | 1 | 0.078 | 0.85 | x |
| 2 | 1.15 | 0.066 | 0.98 | x | |
| 3 | 1.3 | 0.08 | 0.76 | x | |
| 4 | 1.45 | 0.122 | 0.89 | S | |
| 5 | 1.85 | 0.145 | 0.79 | S | |
| SPB2a F = 0.05 m | 6 | 1 | 0.098 | 0.72 | S |
| 7 | 1.15 | 0.141 | 0.50 | P | |
| 8 | 1.25 | 0.051 | 0.45 | O | |
| 9 | 1.25 | 0.066 | 0.53 | O | |
| 10 | 1.25 | 0.096 | 0.57 | P | |
| 11 | 1.45 | 0.079 | 0.80 | S | |
| 12 | 1.6 | 0.083 | 0.61 | O | |
| 13 | 1.7 | 0.125 | 0.55 | P | |
| 14 | 1.85 | 0.107 | 0.47 | O | |
| 15 | 2 | 0.045 | 0.49 | O | |
| 16 | 2 | 0.052 | 0.50 | O | |
| 17 | 2 | 0.08 | 0.46 | O | |
| 18 | 2.2 | 0.152 | 0.36 | P | |
| SPB2a F = 0.10 m | 19 | 1 | 0.078 | 0.85 | x |
| 20 | 1 | 0.113 | 0.88 | x | |
| 21 | 1.15 | 0.066 | 0.98 | x | |
| 22 | 1.3 | 0.07 | 0.90 | x | |
| 23 | 1.3 | 0.08 | 0.76 | S | |
| 24 | 1.45 | 0.12 | 0.93 | x | |
| 25 | 1.45 | 0.13 | 0.80 | S | |
| 26 | 2 | 0.14 | 0.57 | S | |
| SPB2b F = 0.05 m | 27 | 1 | 0.093 | 0.60 | P |
| 28 | 1.25 | 0.087 | 0.41 | P | |
| 29 | 1.25 | 0.097 | 0.48 | S | |
| 30 | 1.5 | 0.081 | 0.68 | S | |
| 31 | 1.5 | 0.089 | 0.66 | S | |
| 32 | 1.5 | 0.095 | 0.63 | S | |
| 33 | 1.6 | 0.08 | 0.56 | S | |
| 34 | 1.6 | 0.082 | 0.59 | S | |
| 35 | 1.7 | 0.118 | 0.47 | P | |
| 36 | 1.85 | 0.11 | 0.39 | P | |
| 37 | 2 | 0.045 | 0.51 | O | |
| 38 | 2 | 0.075 | 0.49 | O | |
| 39 | 2.1 | 0.062 | 0.52 | O | |
| SPB2b F = 0.10 m | 40 | 1 | 0.085 | 0.87 | x |
| 41 | 1.25 | 0.173 | 0.49 | P | |
| 42 | 1.3 | 0.065 | 0.91 | x | |
| 43 | 1.5 | 0.094 | 0.77 | S | |
| 44 | 1.6 | 0.075 | 0.67 | O | |
| 45 | 1.6 | 0.141 | 0.63 | S | |
| 46 | 1.8 | 0.115 | 0.61 | S | |
| 47 | 2 | 0.093 | 0.45 | O | |
| 48 | 2.2 | 0.108 | 0.67 | S | |
| SPB3a F = 0.05 m | 49 | 1 | 0.07 | 0.79 | x |
| 50 | 1.15 | 0.105 | 0.58 | S | |
| 51 | 1.25 | 0.094 | 0.96 | x | |
| 52 | 1.3 | 0.082 | 0.88 | S | |
| 53 | 1.45 | 0.141 | 0.50 | P | |
| 54 | 1.6 | 0.112 | 0.54 | S | |
| 55 | 1.7 | 0.131 | 0.68 | S | |
| 56 | 1.85 | 0.074 | 0.73 | x | |
| 57 | 2 | 0.052 | 0.79 | x | |
| 58 | 2 | 0.084 | 0.86 | x | |
| 59 | 2.2 | 0.138 | 0.63 | O | |
| SPB3a F = 0.10 m | 60 | 1 | 0.073 | 0.99 | x |
| 61 | 1.25 | 0.122 | 0.89 | S | |
| 62 | 1.3 | 0.089 | 0.99 | x | |
| 63 | 1.45 | 0.159 | 0.63 | S | |
| 64 | 1.5 | 0.126 | 0.78 | x | |
| 65 | 1.5 | 0.15 | 0.69 | S | |
| 66 | 1.8 | 0.079 | 0.89 | x | |
| 67 | 1.8 | 0.105 | 0.90 | x | |
| 68 | 2 | 0.088 | 0.77 | x | |
| SPB3b F = 0.05 m | 69 | 1 | 0.066 | 0.83 | S |
| 70 | 1.15 | 0.053 | 0.87 | x | |
| 71 | 1.15 | 0.101 | 0.54 | P | |
| 72 | 1.3 | 0.079 | 0.86 | S | |
| 73 | 1.45 | 0.145 | 0.44 | P | |
| 74 | 1.5 | 0.115 | 0.59 | P | |
| 75 | 1.6 | 0.102 | 0.57 | S | |
| 76 | 1.7 | 0.123 | 0.74 | S | |
| 78 | 1.8 | 0.07 | 0.77 | x | |
| 79 | 2 | 0.075 | 0.81 | O | |
| 80 | 2.1 | 0.057 | 0.88 | x |
| # | T (s) | Hs (m) | Kt | |
|---|---|---|---|---|
| SPB1 F = 0.10 m | 1 | 1 | 0.066 | 0.82 |
| 2 | 1.15 | 0.079 | 0.8 | |
| 3 | 1.3 | 0.086 | 0.8 | |
| 4 | 1.3 | 0.102 | 0.75 | |
| 5 | 1.45 | 0.087 | 0.82 | |
| 6 | 1.5 | 0.095 | 0.82 | |
| 7 | 1.6 | 0.102 | 0.81 | |
| 8 | 1.85 | 0.102 | 0.78 | |
| 9 | 2 | 0.107 | 0.77 | |
| SPB2a F = 0.05 m | 10 | 1 | 0.064 | 0.69 |
| 11 | 1.15 | 0.063 | 0.70 | |
| 12 | 1.15 | 0.074 | 0.66 | |
| 13 | 1.25 | 0.04 | 0.73 | |
| 14 | 1.25 | 0.052 | 0.69 | |
| 15 | 1.25 | 0.07 | 0.67 | |
| 16 | 1.25 | 0.083 | 0.63 | |
| 17 | 1.3 | 0.049 | 0.71 | |
| 18 | 1.3 | 0.087 | 0.62 | |
| 19 | 1.45 | 0.062 | 0.71 | |
| 20 | 1.45 | 0.095 | 0.61 | |
| 21 | 1.6 | 0.073 | 0.66 | |
| 22 | 1.6 | 0.113 | 0.56 | |
| 23 | 1.7 | 0.092 | 0.54 | |
| 24 | 1.85 | 0.087 | 0.55 | |
| 25 | 2 | 0.046 | 0.61 | |
| 26 | 2 | 0.075 | 0.55 | |
| 27 | 2.2 | 0.073 | 0.55 | |
| SPB2a F = 0.10 m | 28 | 1 | 0.065 | 0.83 |
| 29 | 1.15 | 0.076 | 0.82 | |
| 30 | 1.3 | 0.093 | 0.75 | |
| 31 | 1.3 | 0.11 | 0.71 | |
| 32 | 1.3 | 0.124 | 0.67 | |
| 33 | 1.45 | 0.092 | 0.77 | |
| 34 | 1.45 | 0.108 | 0.73 | |
| 35 | 1.6 | 0.12 | 0.68 | |
| 36 | 1.7 | 0.116 | 0.66 | |
| 37 | 1.7 | 0.129 | 0.64 | |
| 38 | 1.85 | 0.107 | 0.64 | |
| 39 | 2 | 0.109 | 0.65 | |
| SPB2b F = 0.05 m | 40 | 1 | 0.063 | 0.63 |
| 41 | 1.15 | 0.075 | 0.60 | |
| 42 | 1.25 | 0.037 | 0.70 | |
| 43 | 1.25 | 0.061 | 0.64 | |
| 44 | 1.45 | 0.089 | 0.57 | |
| 45 | 1.6 | 0.109 | 0.51 | |
| 46 | 1.7 | 0.113 | 0.50 | |
| 47 | 1.85 | 0.099 | 0.49 | |
| 48 | 2 | 0.039 | 0.62 | |
| 49 | 2 | 0.07 | 0.53 | |
| 50 | 2 | 0.11 | 0.48 | |
| 51 | 2.2 | 0.115 | 0.48 | |
| SPB2b F = 0.10 m | 52 | 1 | 0.063 | 0.79 |
| 53 | 1.15 | 0.076 | 0.74 | |
| 54 | 1.3 | 0.107 | 0.65 | |
| 55 | 1.45 | 0.09 | 0.73 | |
| 56 | 1.6 | 0.117 | 0.64 | |
| 57 | 1.7 | 0.124 | 0.60 | |
| 58 | 1.85 | 0.106 | 0.60 | |
| 59 | 2 | 0.109 | 0.60 | |
| 60 | 2 | 0.122 | 0.60 | |
| SPB3a F = 0.05 m | 61 | 1 | 0.049 | 0.80 |
| 62 | 1.15 | 0.06 | 0.78 | |
| 63 | 1.15 | 0.077 | 0.70 | |
| 64 | 1.25 | 0.043 | 0.91 | |
| 65 | 1.25 | 0.068 | 0.78 | |
| 66 | 1.3 | 0.099 | 0.65 | |
| 67 | 1.45 | 0.073 | 0.73 | |
| 68 | 1.45 | 0.099 | 0.62 | |
| 69 | 1.6 | 0.115 | 0.57 | |
| 70 | 1.7 | 0.088 | 0.67 | |
| 71 | 1.7 | 0.115 | 0.62 | |
| 72 | 1.85 | 0.079 | 0.71 | |
| 73 | 1.85 | 0.097 | 0.68 | |
| 74 | 2 | 0.044 | 0.80 | |
| 75 | 2 | 0.07 | 0.73 | |
| 76 | 2 | 0.103 | 0.68 | |
| 77 | 2.2 | 0.106 | 0.70 | |
| SPB3a F = 0.10 m | 78 | 1 | 0.053 | 0.85 |
| 79 | 1.15 | 0.06 | 0.88 | |
| 80 | 1.3 | 0.085 | 0.82 | |
| 81 | 1.3 | 0.101 | 0.74 | |
| 82 | 1.3 | 0.115 | 0.72 | |
| 83 | 1.45 | 0.092 | 0.77 | |
| 84 | 1.45 | 0.105 | 0.70 | |
| 85 | 1.6 | 0.126 | 0.67 | |
| 86 | 1.7 | 0.122 | 0.74 | |
| 87 | 1.85 | 0.104 | 0.74 | |
| 88 | 2 | 0.111 | 0.74 | |
| 89 | 2.2 | 0.109 | 0.80 | |
| SPB3b F = 0.05 m | 90 | 1 | 0.042 | 0.83 |
| 91 | 1.15 | 0.056 | 0.86 | |
| 92 | 1.25 | 0.031 | 1.00 | |
| 93 | 1.25 | 0.06 | 0.85 | |
| 94 | 1.3 | 0.068 | 0.78 | |
| 95 | 1.3 | 0.099 | 0.64 | |
| 96 | 1.45 | 0.072 | 0.74 | |
| 97 | 1.45 | 0.097 | 0.63 | |
| 98 | 1.6 | 0.115 | 0.58 | |
| 99 | 1.7 | 0.086 | 0.71 | |
| 100 | 1.7 | 0.113 | 0.65 | |
| 101 | 1.85 | 0.094 | 0.71 | |
| 102 | 2 | 0.043 | 0.84 | |
| 103 | 2 | 0.07 | 0.77 | |
| 104 | 2 | 0.109 | 0.66 | |
| 105 | 2.2 | 0.107 | 0.71 | |
| SPB3b F = 0.10 m | 106 | 1 | 0.043 | 0.95 |
| 107 | 1.15 | 0.06 | 0.92 | |
| 108 | 1.3 | 0.102 | 0.76 | |
| 109 | 1.45 | 0.093 | 0.78 | |
| 110 | 1.6 | 0.121 | 0.72 | |
| 111 | 1.7 | 0.12 | 0.77 | |
| 112 | 1.7 | 0.132 | 0.76 | |
| 113 | 2 | 0.11 | 0.78 | |
| 114 | 2.2 | 0.12 | 0.78 |
| # | T (s) | Hi (m) | Kt | |
|---|---|---|---|---|
| SPB2a F = 0.05 m | 10 | 1 | 0.067 | 0.97 |
| 11 | 1 | 0.099 | 0.76 | |
| 12 | 1.25 | 0.063 | 0.67 | |
| 13 | 1.25 | 0.082 | 0.67 | |
| 14 | 1.25 | 0.119 | 0.59 | |
| SPB2a F = 0.10 m | 28 | 1 | 0.063 | 0.95 |
| 29 | 1 | 0.082 | 0.96 | |
| 30 | 1.25 | 0.059 | 0.88 | |
| 31 | 1.25 | 0.082 | 0.79 | |
| 32 | 1.25 | 0.117 | 0.99 | |
| SPB2b F = 0.05 m | 40 | 1 | 0.058 | 0.93 |
| 41 | 1 | 0.102 | 0.73 | |
| 42 | 1.25 | 0.061 | 0.56 | |
| 43 | 1.25 | 0.08 | 0.54 | |
| 44 | 1.25 | 0.122 | 0.52 | |
| SPB2b F = 0.10 m | 52 | 1 | 0.061 | 0.92 |
| 53 | 1 | 0.08 | 0.94 | |
| 54 | 1.25 | 0.063 | 0.62 | |
| 55 | 1.25 | 0.08 | 0.66 | |
| 56 | 1.25 | 0.123 | 0.73 | |
| SPB3a F = 0.05 m | 61 | 1 | 0.062 | 0.98 |
| 62 | 1 | 0.106 | 0.81 | |
| 63 | 1.25 | 0.065 | 0.69 | |
| 64 | 1.25 | 0.084 | 0.71 | |
| 65 | 1.25 | 0.119 | 0.78 | |
| SPB3a F = 0.10 m | 78 | 1 | 0.062 | 0.97 |
| 79 | 1 | 0.102 | 0.98 | |
| 80 | 1.25 | 0.058 | 0.88 | |
| 81 | 1.25 | 0.079 | 0.89 | |
| 82 | 1.25 | 0.124 | 0.97 | |
| SPB3b F = 0.05 m | 90 | 1 | 0.061 | 0.85 |
| 91 | 1 | 0.102 | 0.70 | |
| 92 | 1.25 | 0.062 | 0.58 | |
| 93 | 1.25 | 0.084 | 0.62 | |
| 94 | 1.25 | 0.123 | 0.53 | |
| SPB3b F = 0.10 m | 106 | 1 | 0.06 | 0.92 |
| 107 | 1 | 0.104 | 0.96 | |
| 108 | 1.25 | 0.064 | 0.70 | |
| 109 | 1.25 | 0.084 | 0.71 | |
| 110 | 1.25 | 0.122 | 0.86 |
References
- Kontaxi, C.; Memos, C.D. Submerged Breakwaters as Artificial Habitats. In Proceedings of the 31st IAHR Congress, Seoul, Republic of Korea, 11–16 September 2005. [Google Scholar]
- Makris, V.C.; Memos, C.D. Wave Transmission over Submerged Breakwaters: Performance of Formulae and Models. In Proceedings of the 16th International Offshore and Polar Engineering Conference, Lisbon, Portugal, 1–6 July 2007. [Google Scholar]
- Brancasi, A.; Leone, E.; Francone, A.; Scaravaglione, G.; Tomasicchio, G.R. On Formulae for Wave Transmission at Submerged and Low-Crested Breakwaters. J. Mar. Sci. Eng. 2022, 10, 1986. [Google Scholar] [CrossRef]
- Hassanpour, N.; Vicinanza, D.; Contestabile, P. Determining Wave Transmission over Rubble-Mound Breakwaters: Assessment of Existing Formulae through Benchmark Testing. Water 2023, 15, 1111. [Google Scholar] [CrossRef]
- Behera, H.; Khan, M.B.M. Numerical Modeling for Wave Attenuation in Double Trapezoidal Porous Structures. J. Ocean Eng. 2019, 184, 91–106. [Google Scholar] [CrossRef]
- Khan, M.B.M.; Behera, H. Analysis of Wave Action through multiple Submerged Porous Structures. J. Offshore Mech. Arctic Eng. 2019, 142, 011101. [Google Scholar] [CrossRef]
- Van der Meer, J.W. Data on Wave Transmission Due to Overtopping; Delft Hydraulics: Delft, The Netherlands, 1990. [Google Scholar]
- Van der Meer, J.W.; Daemen, I.F. Stability and wave transmission at low-crested rubble-mound structures. J. Waterw. Port Coast. Ocean. Eng. 1994, 120, 1–19. [Google Scholar] [CrossRef]
- d’Angremond, K.; van der Meer, J.W.; de Jong, R.J. Wave Transmission at Low-Crested Structures. In Coastal Engineering 1996; American Society of Civil Engineers: New York, NY, USA, 1997; pp. 2418–2427. [Google Scholar]
- Seabrook, S.R.; Hall, K.R. Wave Transmission at Submerged Rubblemound Breakwaters. In Coastal Engineering 1998; American Society of Civil Engineers: Reston, VA, USA, 1999; pp. 2000–2013. [Google Scholar]
- Calabrese, M.; Vicinanza, D.; Buccino, M. Large-Scale Experiments On The Behaviour Of Low Crested And Submerged Breakwaters In Presence Of Broken Waves. In Coastal Engineering 2002; World Scientific Publishing Company: Singapore, 2003; pp. 1900–1912. [Google Scholar]
- Briganti, R.; van der Meer, J.; Buccino, M.; Calabrese, M. Wave Transmission Behind Low-Crested Structures. In Coastal Structures 2003; American Society of Civil Engineers: Reston, VA, USA, 2004; pp. 580–592. [Google Scholar]
- van der Meer, J.W.; Briganti, R.; Zanuttigh, B.; Wang, B. Wave Transmission and Reflection at Low-Crested Structures: Design Formulae, Oblique Wave Attack and Spectral Change. Coast. Eng. 2005, 52, 915–929. [Google Scholar] [CrossRef]
- Buccino, M.; Calabrese, M. Conceptual Approach for Prediction of Wave Transmission at Low-Crested Breakwaters. J. Waterw. Port Coast. Ocean. Eng. 2007, 3, 213–224. [Google Scholar] [CrossRef]
- Goda, Y.; Ahrens, J.P. New Formulation of Wave Transmission Over And Through Low-Crested Structures. In Coastal Engineering 2008; World Scientific Publishing Company: Singapore, 2009; pp. 3530–3541. [Google Scholar]
- Tomasicchio, G.R.; D’Alessandro, F. Wave Energy Transmission through and over Low Crested Breakwaters. J. Coast. Res. 2013, 65, 398–403. [Google Scholar] [CrossRef]
- Zhang, S.X.; Li, X. Design Formulas of Transmission Coefficients for Permeable Breakwaters. Water Sci. Eng. 2014, 7, 457–467. [Google Scholar]
- Sindhu, S.; Shirlal, K.G.; Manu. Prediction of Wave Transmission Characteristics at Submerged Reef Breakwater. Procedia Eng. 2015, 116, 262–268. [Google Scholar] [CrossRef] [Green Version]
- Kurdistani, S.M.; Tomasicchio, G.R.; D′Alessandro, F.; Francone, A. Formula for Wave Transmission at Submerged Homogeneous Porous Breakwaters. Ocean. Eng. 2022, 266, 113053. [Google Scholar] [CrossRef]
- Metallinos, S.A.; Klonaris, T.G.; Memos, C.; Dimas, A.A. Hydrodynamic Conditions in a Submerged Porous Breakwater. J. Ocean Eng. 2019, 172, 712–725. [Google Scholar] [CrossRef]
- Vicinanza, D.; Cáceres, I.; Buccino, M.; Gironella, X.; Calabrese, M. Wave Disturbance behind Low-Crested Structures: Diffraction and Overtopping Effects. Coast. Eng. 2009, 56, 1173–1185. [Google Scholar] [CrossRef]
- Madsen, P.A.; Sørensen, O.R. A New Form of the Boussinesq Equations with Improved Linear Dispersion Characteristics 2: A Slowly Varying Bathymetry. Coast. Eng. 1992, 18, 183–204. [Google Scholar] [CrossRef]
- Avgeris, I.; Karambas, V.T.; Prinos, P. Boussinesq Modeling of Wave Interaction with Porous Submerged Breakwaters. In Coastal Engineering 2004: (In 4 Volumes); World Scientific Publishing Company: Singapore, 2004; pp. 604–616. [Google Scholar]
- Metallinos, S.A.; Memos, C. Wave-induced Kinematics inside Submerged Porous Structures. J. Hydraul. Res. 2012, 50, 388–394. [Google Scholar] [CrossRef]
- Metallinos, S.A.; Emmanouilidou, A.M.; Memos, C. Wave-induced Pore Pressures in Submerged Rubble-mound Breakwaters Simulated by a Compound Boussinesq Model. J. Hydraul. Res. 2014, 52, 24–35. [Google Scholar] [CrossRef]
- Hsiao, S.C.; Hu, K.C.; Hwung, H.H. Extended Boussinesq Equations for Water-Wave Propagation in Porous Media. J. Eng. Mech. 2010, 136, 625–640. [Google Scholar] [CrossRef]
- Chondros, M.K.; Memos, C.D. A 2DH non Linear Boussinesq-type Wave Model of Improved Dispersion, Shoaling and Wave Generation Characteristics. Coast. Eng. 2014, 91, 99–122. [Google Scholar] [CrossRef]
- Metallinos, A.; Repousis, E.; Memos, C. Wave Propagation over a Submerged Porous Breakwater with steep slopes. Ocean Eng. 2016, 111, 424–438. [Google Scholar] [CrossRef]
- Van Gent, M.R.A. The Modelling of Wave Action on and in Coastal Structures. Coast. Eng. 1994, 22, 311–339. [Google Scholar] [CrossRef] [Green Version]
- Bing, R.; Wen, H.; Dong, P.; Wang, Y. Numerical Simulation of Wave Interaction with Porous Structures using an Improved Smoothed Particle Hydrodynamic Method. Coat. Eng. 2014, 88, 88–100. [Google Scholar]
- Magdalena, I.; Rif’atin, H.Q.; Kusuma, M.; Reeve, D.E. A non-Hydrostatic Model for Wave Evolution on a Submerged Trapezoidal Breakwater. Results Appl. Math. 2023, 18, 100374. [Google Scholar] [CrossRef]
- Memos, C.; Malliouri, D.; Kazakidou, E.; Tsoukala, V. Impact of Wavelength on the Stability of Rubble Mound Breakwaters. In Proceedings of the 7th International Conference on the Application of Physical Modelling in Coastal and Port Engineering and Science, Santander, Spain, 22–26 May 2018. [Google Scholar]
- Calabrese, M.; Buccino, M.; Pasanisi, F. Wave Breaking Macrofeatures on a Submerged Rubble Mound Breakwater. J. Hydro-Environ. Res. 2008, 1, 216–225. [Google Scholar] [CrossRef]
- Madsen, P.A.; Schäffer, H.A. Higher-order Boussinesq-type Equations for Surface Gravity Waves: Derivation and Analysis. Philos. Trans. R. Soc. Lond. 1998, 356, 3123–3184. [Google Scholar] [CrossRef]
- Van der Meer, J.W. Rock Slopes and Gravel Beaches under Wave Attack. Ph.D. Thesis, Delft University of Technology, Delft, The Netherlands, 1988. no. 396. [Google Scholar]
- Daemen, I.F.R. Wave Transmission at Low Crested Structures; Delft Hydraulics Report H 462; Delft University of Technology: Delft, The Netherlands, 1991. [Google Scholar]
- CIRIA; CUR; CETMEF. The Rock Manual. The Use of Rock in Hydraulic Engineering; C683; CIRIA: London, UK, 2007. [Google Scholar]
- EurOtop. Manual on Wave Overtopping of Sea Defences and Related Structures. An Overtopping Manual Largely Based on European Research, but for Worldwide Application. 2018. Available online: www.overtopping-manual.com (accessed on 15 May 2023).
- Seeling, W.N. Two-Dimensional Tests of Wave Transmission and Reflection Characteristics of Laboratory Breakwaters; Technical Report No. 80-1; US army, Corps of Engineers, CERC: Fort Belvoir, VA, USA, 1980. [Google Scholar]


| Model | SPB1 | SPB2a | SPB2b | SPB3a | SPB3b |
|---|---|---|---|---|---|
| B (m) | 0.30 | 0.28 | 0.40 | 0.25 | 0.35 |
| Dn50 (m) | 0.10 | 0.08 | 0.08 | 0.06 | 0.06 |
| F (m) | 0.10 | 0.05, 0.10 | 0.05, 0.10 | 0.05, 0.10 | 0.05, 0.10 1 |
| Regular Waves | |||||
| No of tests | 5 | 21 | 22 | 20 | 12 |
| T (s) | 1.0–1.85 | 1.0–2.2 | 1.0–2.2 | 1.0–2.2 | 1.0–2.2 |
| Hi (m) | 0.078–0.145 | 0.045–0.152 | 0.045–0.173 | 0.052–0.15 | 0.053–0.145 |
| Irregular Waves | |||||
| No of tests | 9 | 30 | 21 | 29 | 27 |
| Tp (s) | 1.0–2.0 | 1.0–2.2 | 1.0–2.2 | 1.0–2.2 | 1.0–2.2 |
| Hs (m) | 0.066–0.102 | 0.04–0.124 | 0.039–0.124 | 0.043–0.122 | 0.031–0.132 |
| Sub Area | Breaker Type |
|---|---|
| if ξm < 2.35 and R ≥ T1 | Plunging 1 |
| if ξm < 2.35 and T1 > R > T2 | Spilling 1 |
| if ξm ≥ 2.35 and R > T2 | Other |
| if R ≤ T2 | Non-breaking |
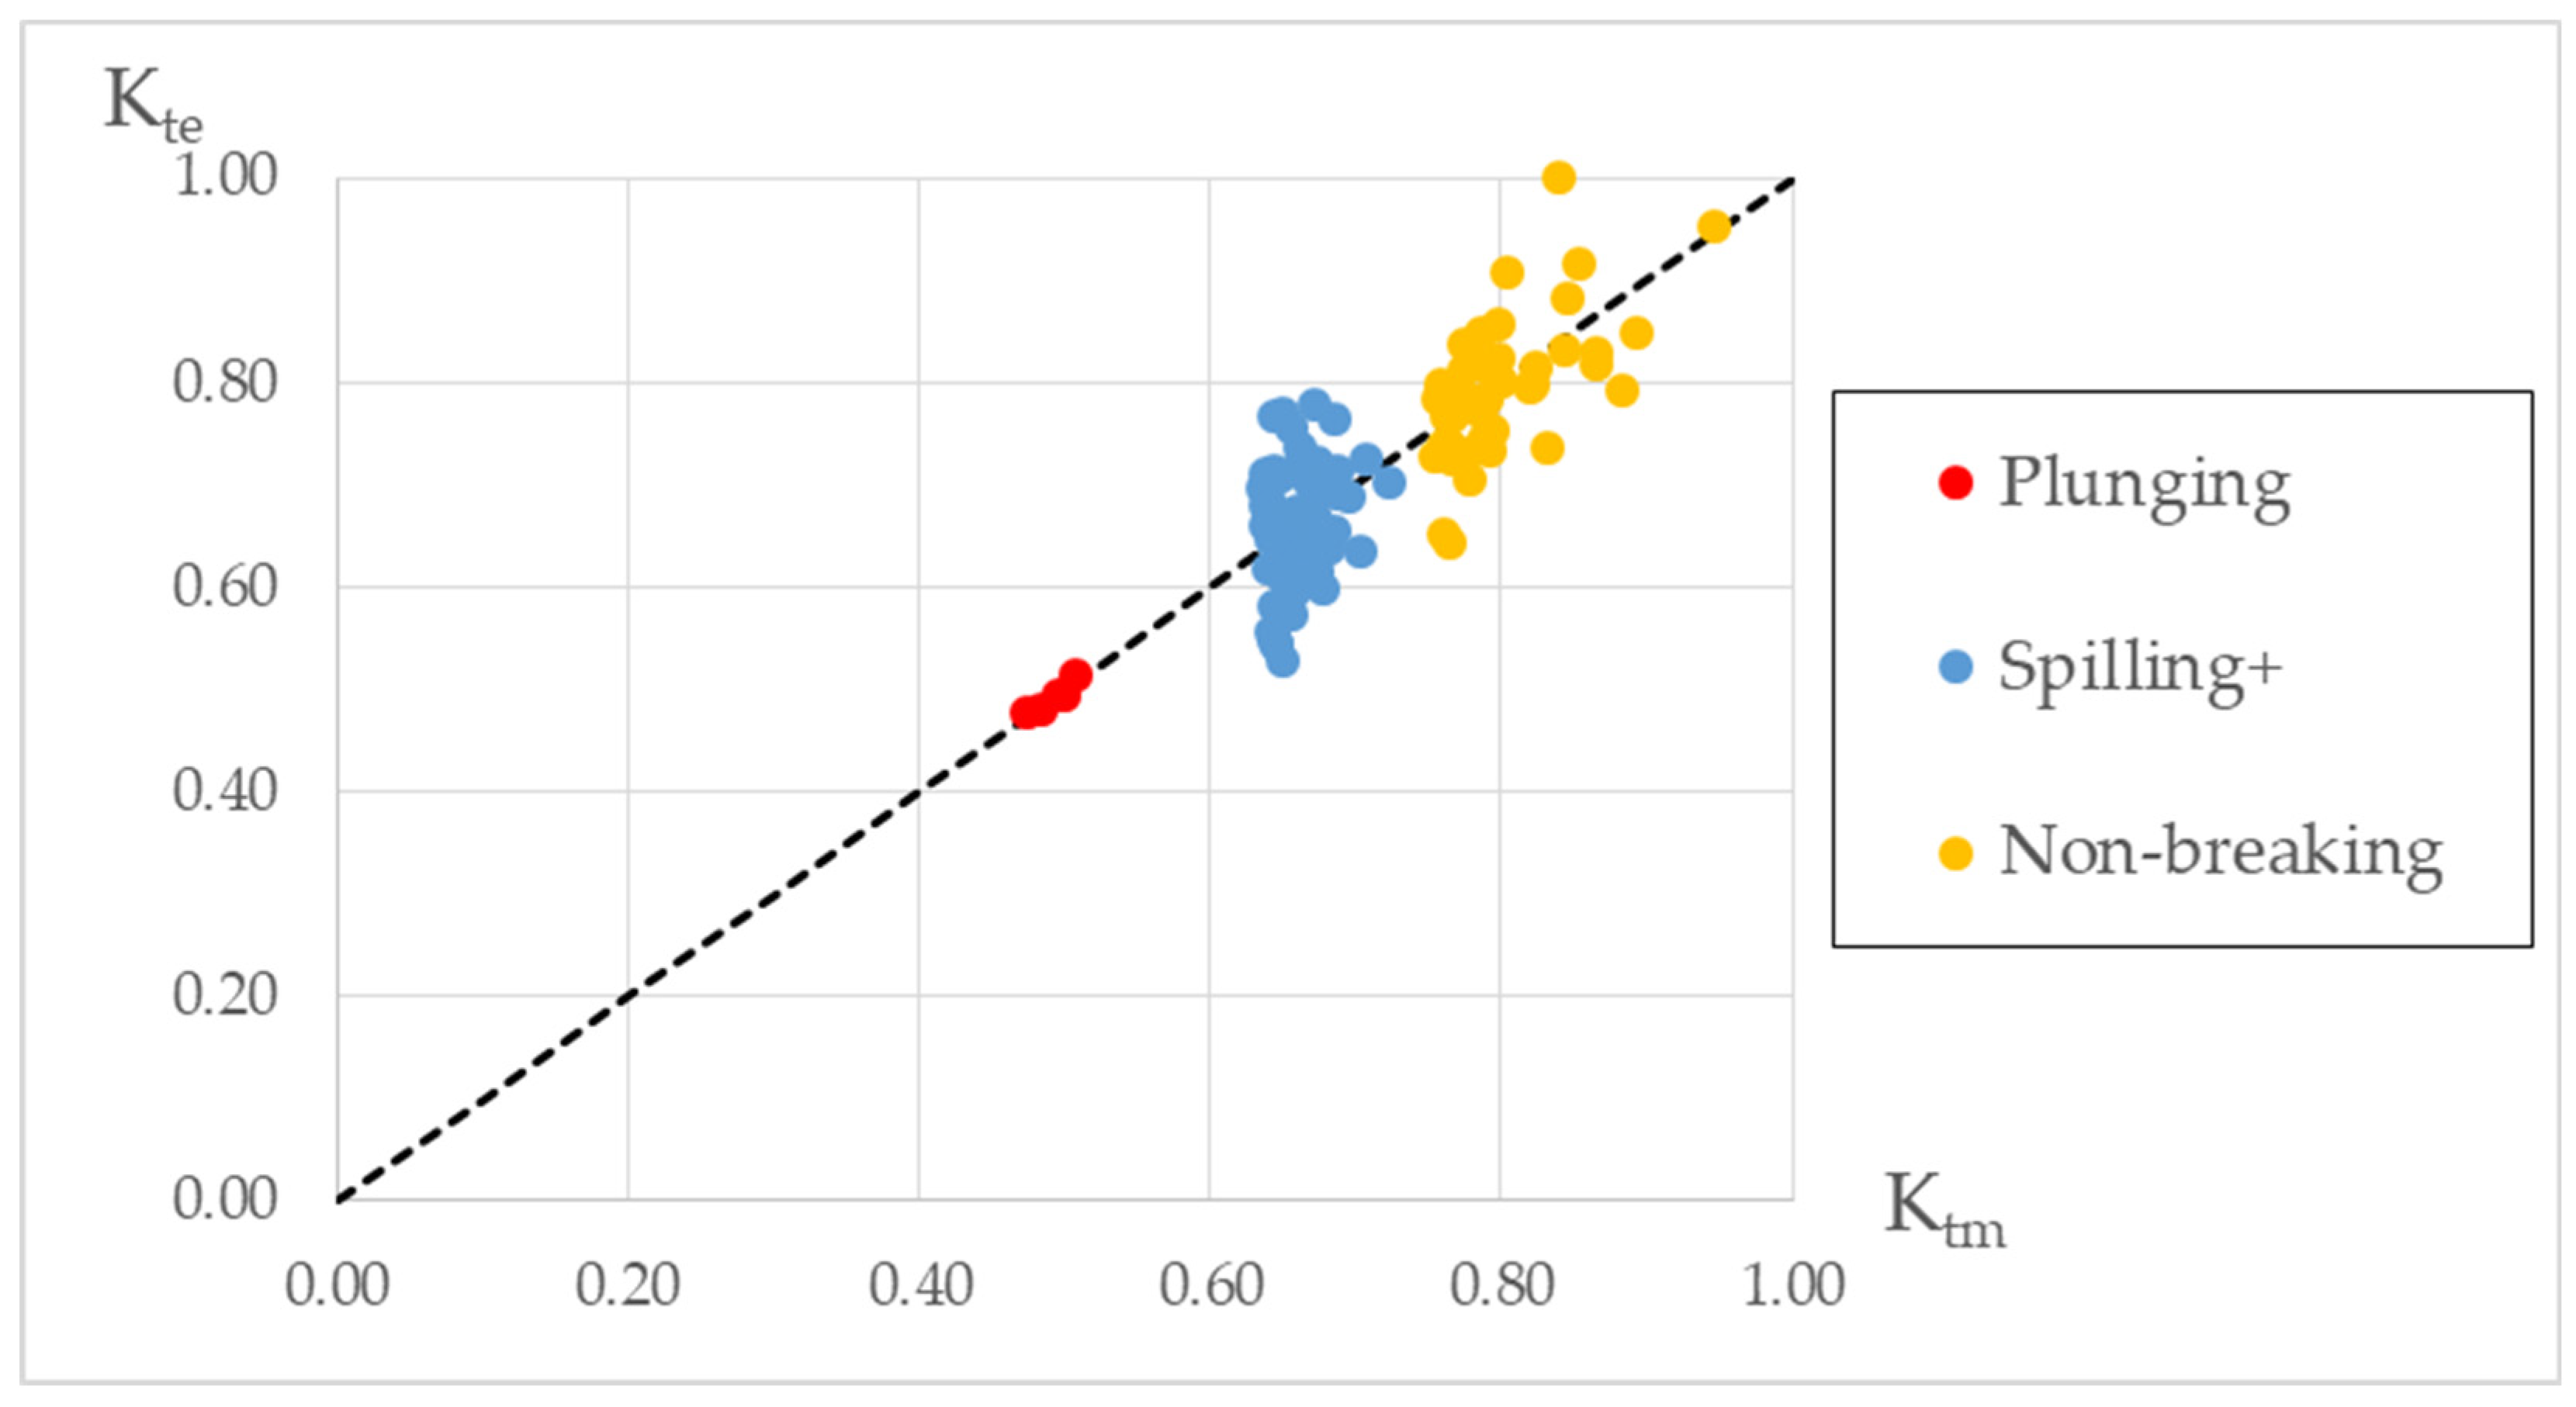
| Sub Area | Breaker Type |
|---|---|
| R ≥ T1 | Plunging |
| T1 > R > T2 | Spilling+ |
| R ≤ T2 | Non-breaking |
Disclaimer/Publisher’s Note: The statements, opinions and data contained in all publications are solely those of the individual author(s) and contributor(s) and not of MDPI and/or the editor(s). MDPI and/or the editor(s) disclaim responsibility for any injury to people or property resulting from any ideas, methods, instructions or products referred to in the content. |
© 2023 by the authors. Licensee MDPI, Basel, Switzerland. This article is an open access article distributed under the terms and conditions of the Creative Commons Attribution (CC BY) license (https://creativecommons.org/licenses/by/4.0/).
Share and Cite
Repousis, E.; Roupas, I.; Memos, C. Wave Transmission over Rubble-Mound Submerged Breakwaters. J. Mar. Sci. Eng. 2023, 11, 1346. https://doi.org/10.3390/jmse11071346
Repousis E, Roupas I, Memos C. Wave Transmission over Rubble-Mound Submerged Breakwaters. Journal of Marine Science and Engineering. 2023; 11(7):1346. https://doi.org/10.3390/jmse11071346
Chicago/Turabian StyleRepousis, Elpidoforos, Ioannis Roupas, and Constantine Memos. 2023. "Wave Transmission over Rubble-Mound Submerged Breakwaters" Journal of Marine Science and Engineering 11, no. 7: 1346. https://doi.org/10.3390/jmse11071346