Article

Experimental Investigation of Wave Loads on U-OWC Breakwater

Natural Ocean Engineering Laboratory NOEL, University “Mediterranea” of Reggio Calabria, Loc. Feo di Vito, 89100 Reggio Calabria, Italy
*
Author to whom correspondence should be addressed.
J. Mar. Sci. Eng. 2023, 11(1), 19; https://doi.org/10.3390/jmse11010019
Submission received: 7 November 2022 / Revised: 11 December 2022 / Accepted: 16 December 2022 / Published: 23 December 2022
(This article belongs to the Special Issue Advanced Studies in Breakwaters and Coastal Protection)

Abstract

:
A small-scale field experiment was conducted on a U-OWC incorporated into a caisson breakwater at the NOEL laboratory of Reggio Calabria (Italy). The U-Oscillating Water Column (U-OWC) or REWEC (REsonant Wave Energy Converter) is a device belonging to the family of OWCs. Such a device is very innovative, being able to absorb a very high percentage of incoming sea waves energy and to produce electrical power via proper PTO. The focus of the paper has been the analysis of the impact wave loads acting on the modified U-OWC structure during extreme wave events. A total of 250 records of pure wind waves were analyzed to verify the behaviors of wave loads acting on a U-OWC breakwater during operating conditions. The occurrence of both “quasi-standing wave” loads due to non-breaking waves and “impulsive wave loads”, exerted by a wave breaking against the U-OWC model, were observed. Then, Goda’s model was applied to predict the wave pressure distribution on the external wall of the U-OWC pneumatic chamber, and the theoretical results were compared to those obtained via small-scale field experiment.

1. Introduction

Breakwaters and upright marine structures are designed and built with the main purpose to define protected basins, and thus they must be realized to resist under the action of extreme sea wave impacts during their lifetime.
Depending on the behavior of the extreme wave pressures, pressure distributions, and total wave forces acting on the vertical structures, two main configurations have been identified: (i) the “quasi-static” loads, associated to irrotational wave motion and “quasi-standing” wave patterns, and (ii) “impulsive” loads, related to the occurrence of breaking waves, for which a dynamic response of the structure is determined.
Many theoretical and numerical approaches have been developed for “quasi-standing” sea waves, based on inviscid, irrotational, and incompressible flow assumptions, which can accurately evaluate wave pressure distributions and related wave forces on an upright coastal structure, in the absence of breaking waves, with both linear and non-linear theories [1,2,3,4,5,6].
Instead, the estimation of impulsive loads due to breaking waves have been the subject of numerous investigations and estimates, but they are still affected by considerable uncertainties. First of all, experimental investigations on impulsive wave loads have been widely pursued [7,8,9,10,11,12]. A summary of all the experimental investigations on vertical coastal structures are given in the following main projects; Monlithic Coastal Structures (MCS) and PRObabilistic design tools for VERtical Breakwaters (PROVERBS), funded by the European Union’s Marine Science and Technology (MAST) program [13].
These experimental investigations have showed as impulsive wave loads can be much more intense than those produced by quasi-standing irrotational sea waves, and their impacts can produce very huge damage and destruction on coastal structures. Starting from evidence, some analytical and numerical models have been developed by Cooker & Peregrine [14], and Wood et al. [15], while some other approaches are based on probabilistic methods [16].
In the last decades, vertical coastal structures had a common evolutionary trend, they have been developed to incorporate wave energy converters. This approach turns out to be consistent, because the same structure, that is traditionally an effective port infrastructure, can become ‘active’ and produce green energy from ocean waves with only a limited increase in costs. In this perspective, the most reliable wave energy converter has been demonstrated to be an Oscillating Water Column (OWC), which can be integrated in a caisson breakwater in reinforce concrete.
In particular, the innovative U-OWC (or REWEC) device, developed in the last decades, is a very promising system for the production of electricity from sea waves. The U-OWC is a modified OWC device with the introduction of a U-shaped duct. Although, this new structural element does not determine any significant structural changes with respect to OWC, it is able to determine substantial modifications in the hydrodynamics of the plant due to the interaction between waves and pneumatic absorption chamber. This allows for the realization of the natural resonance for assigned wave conditions, guaranteeing considerable increases in the energy performance of the U-OWC device, in comparison with traditional OWC. The first full-scale realization of the U-OWC in the prototype of the Port of Civitavecchia, has proven the high capability of the U-OWC to absorb a very high percentage of the incoming wave energy [17].
In the present paper, a modified caisson breakwater with incorporated a U-OWC device has been tested in a relevant environment at the NOEL laboratory of Reggio Calabria (Italy). A small-field experiment (scale 1:8) on U-OWC caisson has been pursued in the NOEL laboratory. During the experimental activity, a large number of sea states with extreme sea conditions have been recorded. In the present work, an intensive investigation on wave loads acting on the modified U-OWC structure has been pursued, based on the PROVERBS approach developed on traditional vertical structures. In particular, “quasi-standing” loads produced by irrotational sea waves and “impulsive” loads, due to breaking waves acting on the U-OWC model, has been identified and the related wave pressure distributions have been obtained from experimental data.
At present, there are no studies concerning the mechanics of wave impacts with the new kind of breakwater modified with U-OWC technology. Some initial studies involve the analyses on wave pressure distributions on classical OWC device integrated into breakwater [18]. For this purpose, the aim of the present study is to investigate the nature of such impacts, even when the pneumatic chambers in the U-OWC breakwater are active for wave energy conversion. Moreover, no models have yet been developed to study the wave loads acting on such U-OWC caissons. Therefore, as a first attempt, Goda’s [1] model was applied to estimate the wave pressure distributions acting on these U-OWC breakwaters. Finally, these theoretical distributions have been compared with those obtained from the measurement during the experiment at NOEL laboratory.

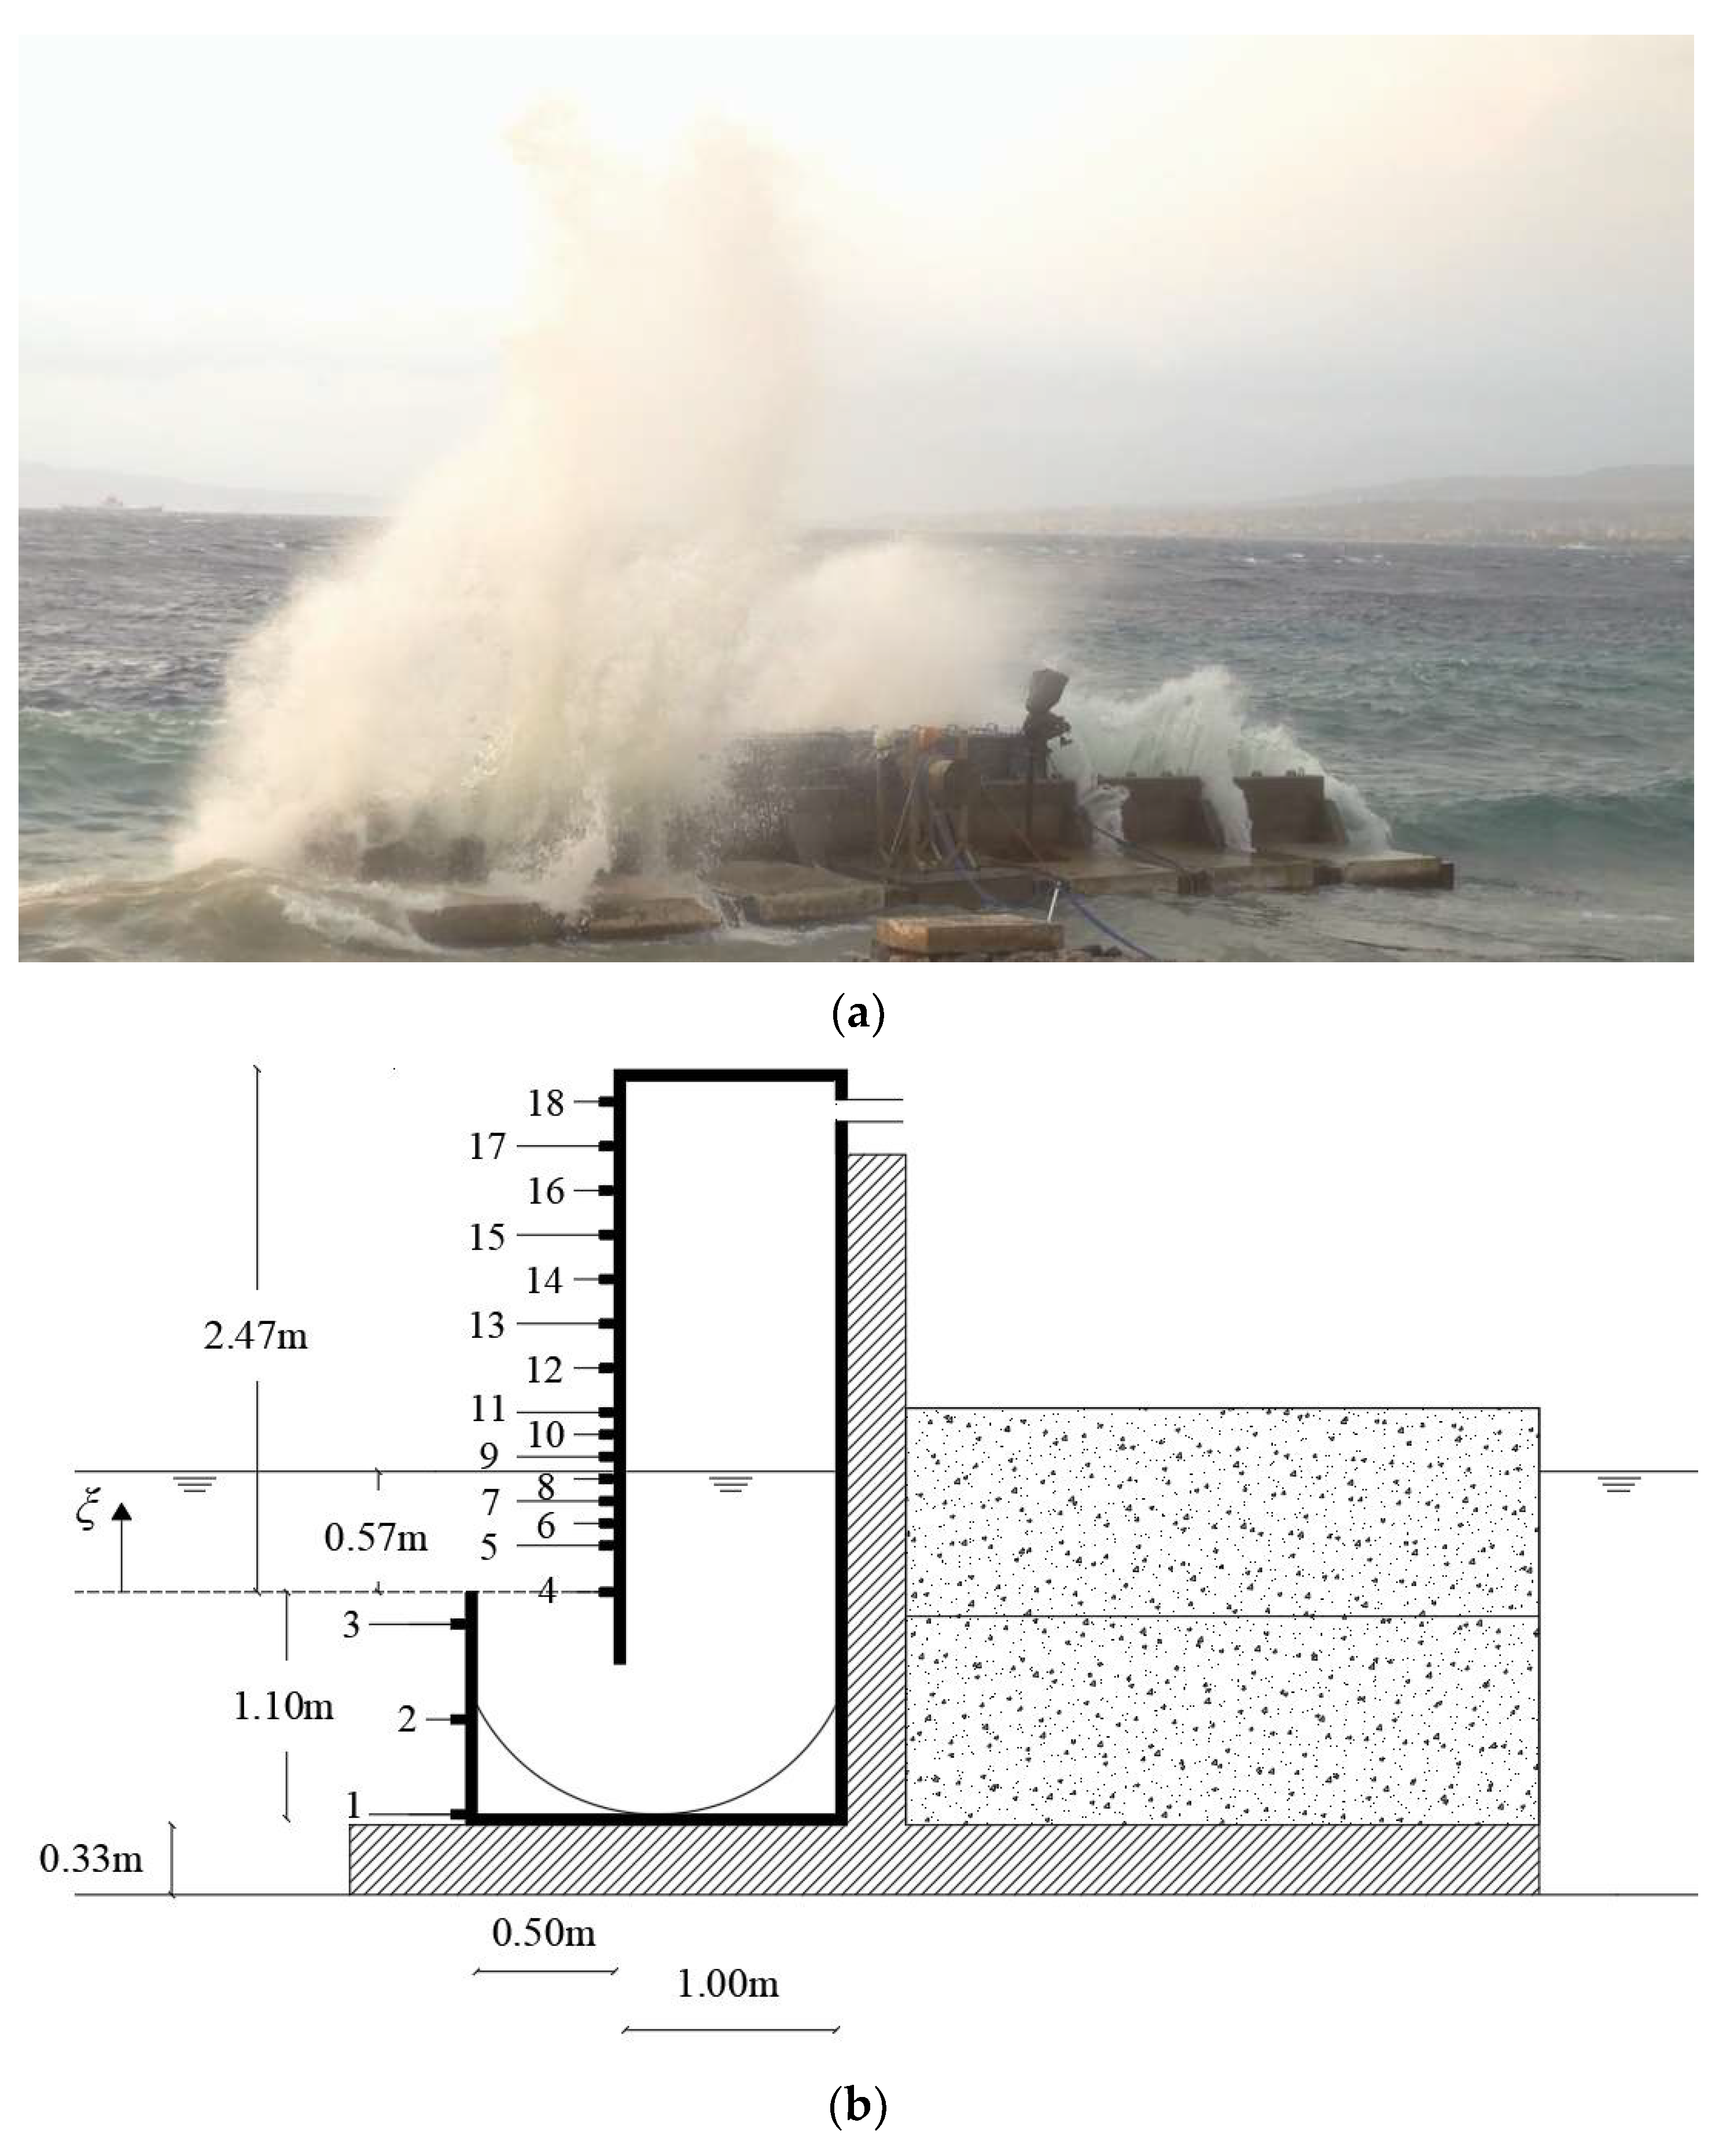
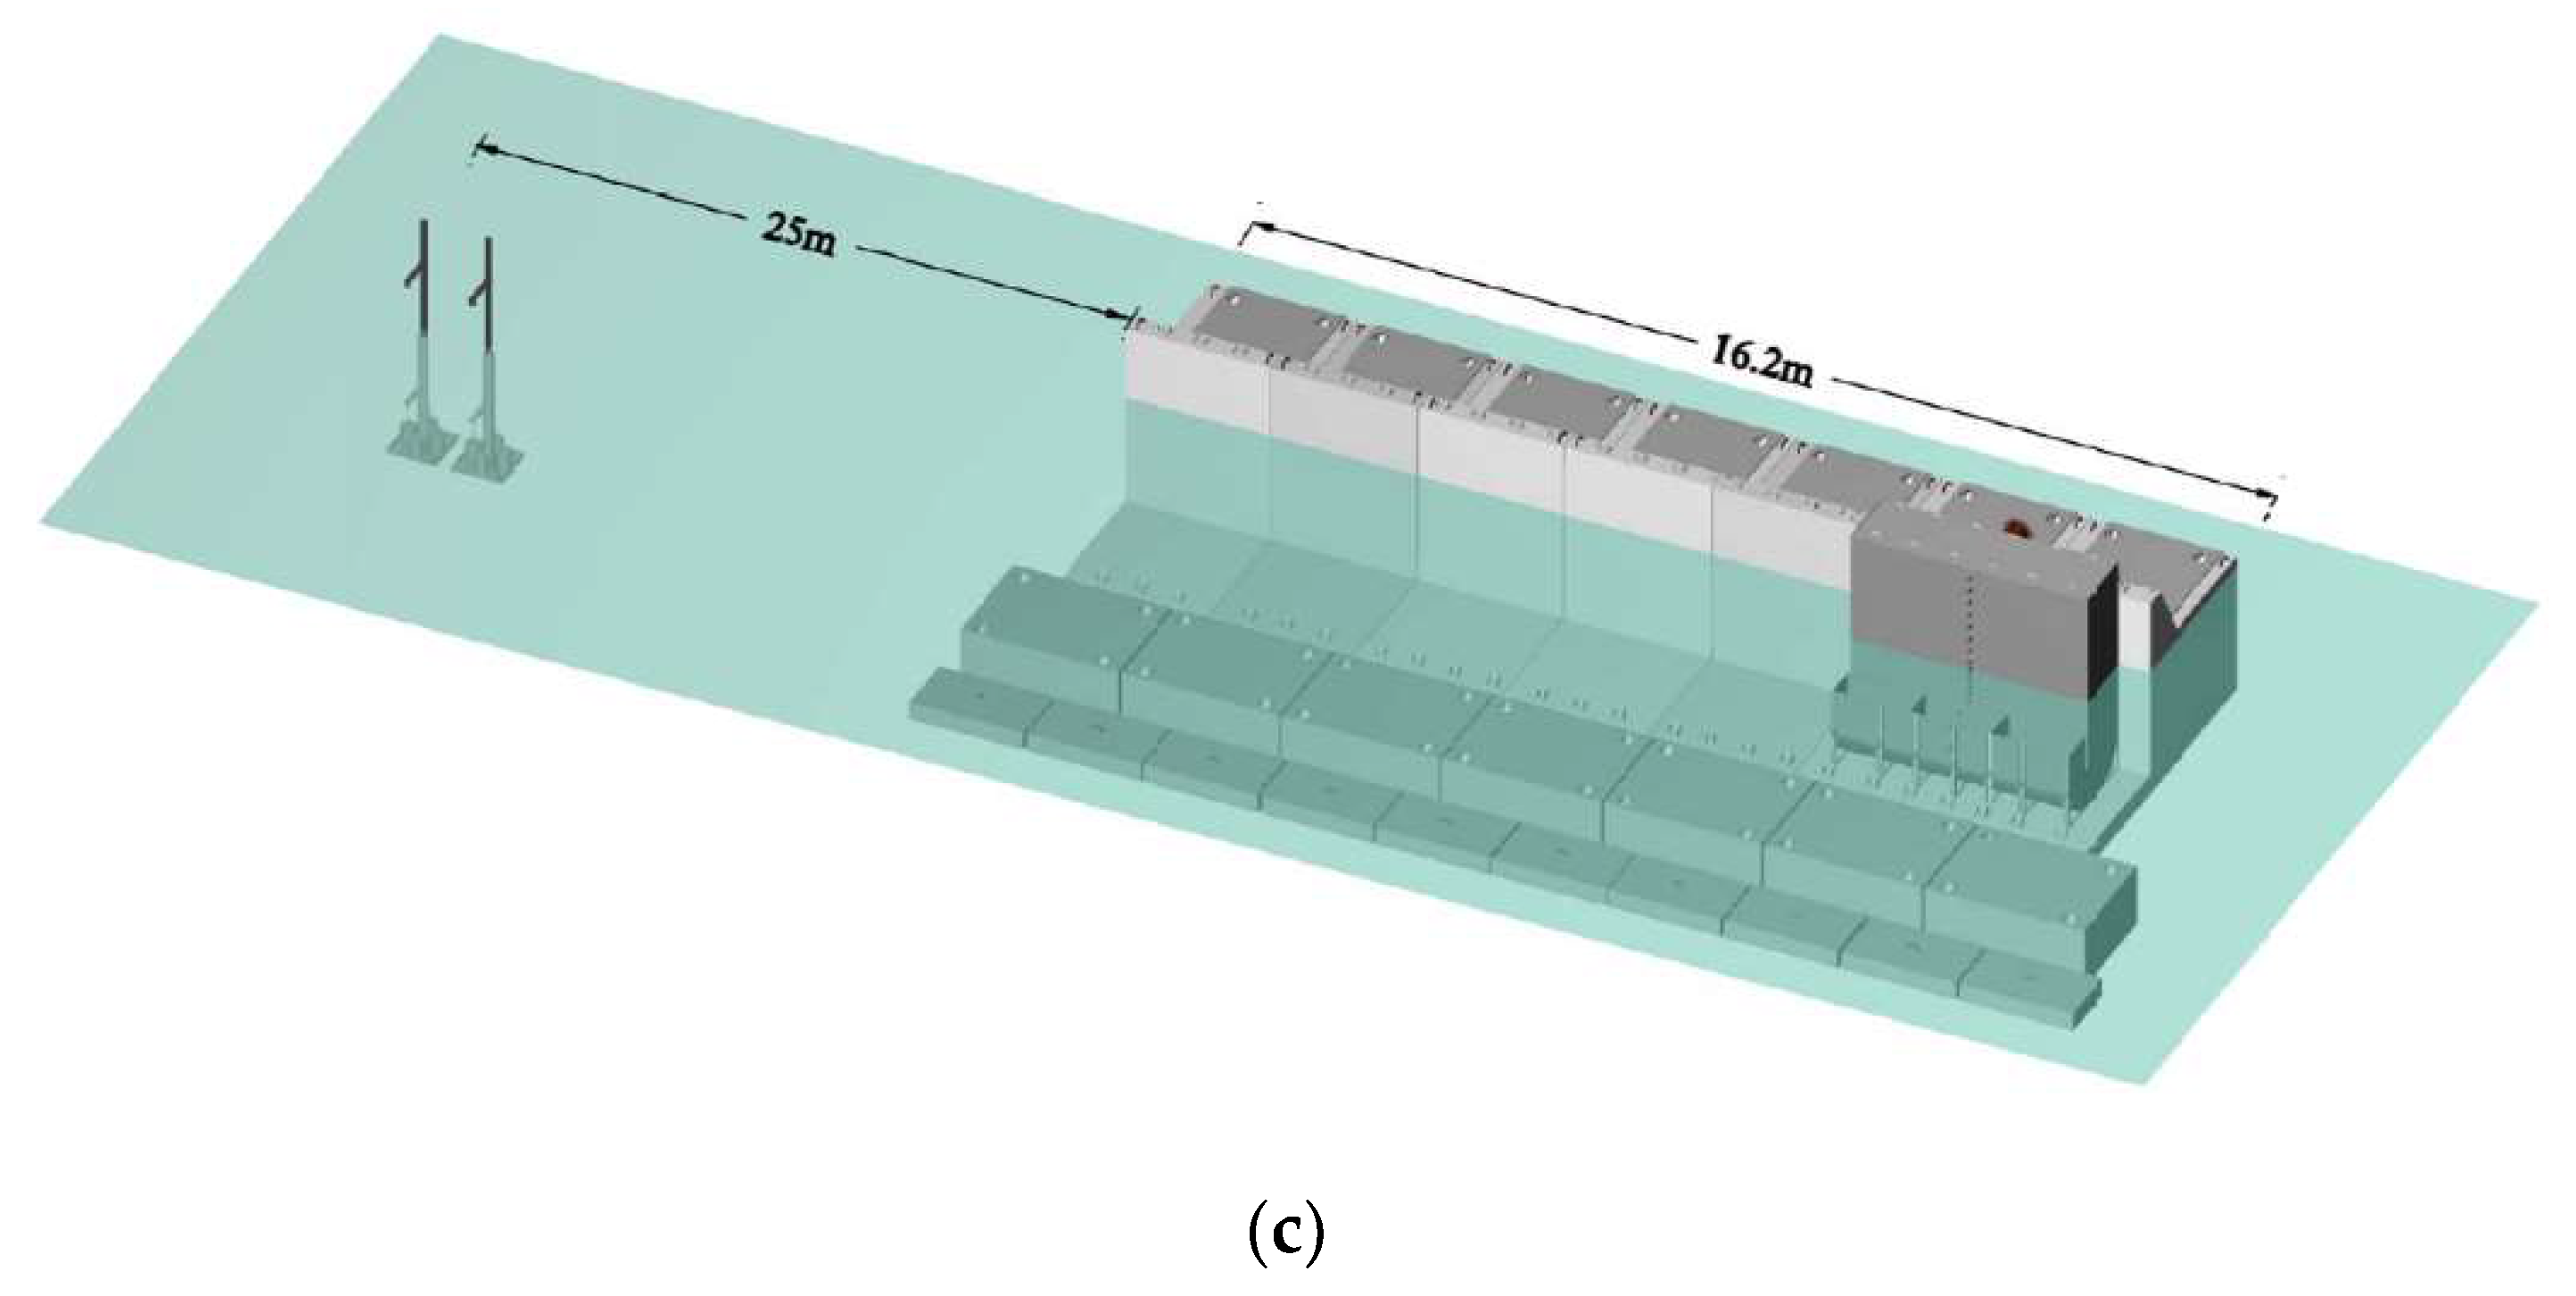
2. The Small-Scale Field Experiment on a U-OWC Breakwater in the NOEL Laboratory

2.1. Set-Up of the Experimental Campaign

The U-OWC, called also REWEC3-Resonant Wave Energy Converter–realization 3, is a modified Oscillating Water Column (OWC) wave energy converter. The device can be incorporated in a classical caisson breakwater for harbor protection. The “active” part of the modified breakwater consists on a pneumatic chamber for absorbing (capturing) the incoming wave energy. In the case of the U-OWC or REWEC3, the pneumatic chamber in connected to the open field via an addition U-duct (see Figure 1). A description of U-OWC working principle for the exploitation of the incident wave energy is provided in the following. The pneumatic chamber contains water in the lower part and air in the upper part. Then, the air pocket is connected to the atmosphere trough a duct, where an air turbine coupled to an electrical generator may convert the absorbed wave energy (pneumatic power) into electricity. Under the action of sea waves, an alternate motion in the water column (and in the air pocket) is induced inside the pneumatic chamber, and, consequently, in the air duct connecting the chamber to atmosphere. As proven at small- and full-scale, the eigenperiod of the U-OWC plant can be tuned to be equal to the period of the most energetic sea state at the considered location, allowing for the improvement of the energetic performances with respect to traditional OWC devices.
A small-scale model (1:8 scale) of a U-OWC caisson breakwater has been installed in 2014 off the beach of Reggio Calabria in the Eastern coast of the Strait of Messina (Southern Italy), at the Natural Ocean Engineering Laboratory (NOEL) and the experimental activities were carried out in 2015 (Figure 1). A peculiarity of the laboratory is that a local wind from NNW often generates sea states consisting of pure wind waves that represent a small-scale model of Mediterranean or Ocean storms, in the Froude dynamic similarity.
The structure, completely made of steel, has been located in front of the reinforced concrete caisson (at the wave-beaten side, see Figure 1b) and structurally connected to the part in reinforce concrete. The “active” part is in steel and it is composed by the vertical U-duct and by the pneumatic chamber, connected to the atmosphere via an orifice. This model has a height of 2.00 m with respect to the mean water level, and the depth of the natural bottom is approximately 2 m. The width of the U-conduit is 0.5 m, while the pneumatic chamber is 1 m wide. The variation of the water depth due to the tide is typically within ±0.15 m. The opening of the vertical duct is located at 0.57 m below the mean water level. On the top of the chamber, there is a tube with a horizontal axis, connecting the chamber to the atmosphere.
For the small-scale field experiment, the cross-section of the central U-OWC caisson was equipped with a vertical row of 18 pressure transducers allowing the measurement of the wave pressure, and thus of the horizontal wave force, acting on the U-OWC breakwater. Pressure transducers were numbered from 4 to 18, from the opening of the vertical duct to the top of the U-OWC (see Figure 1b). Then, three transducers (from 1 to 3) were located along the external wall from the opening to the bottom. The center distance of the pressure transducers is: 0.21 m from 11 to 18, 0.15 m from 4 to 11, while 0.45 m from 1 to 4.

2.2. Characterization of Incident Wave Field during Experiment

The free surface elevation and wave pressures of the incident waves were calculated through a set of instruments, located in the undisturbed wave field, far from the structure. They were placed on two thin vertical piles positioned 25m from the U-OWC breakwater, each equipped with a couple of an ultrasonic probe and a pressure transducer (see Figure 1c). The accuracy of wave pressure transducers is 0.5% SB (scale bottom error).
During the experiment, a set of more than 250 records of pure wind waves were recorded from March to October 2015. The duration of each record was 5 min, with a sampling rate of 10 Hz. As shown by Peregrine [5] and Boccotti et al. [7], 10 Hz is a sufficient sampling rate for the identification and characterization of impact wave loads on vertical seawall, also in the presence of impulsive forces due to breaking sea waves. The significant wave height Hs ranges between 0.2 m and 1.0 m, the peak period varies in the range 1.6–8.0 s. The dominant wave direction θ had a range of [−9°, 15°] and was positive when clockwise with respect to the normal outward from the structure.
In addition, the narrow-bandedness parameter ψ of Boccotti [10] for surface waves, defined as the absolute value of the quotient between the minimum and the maximum of the autocovariance function, ranged, during the experiment, among 0.60 and 0.76 (that are the typical values relative to wind wave spectra).

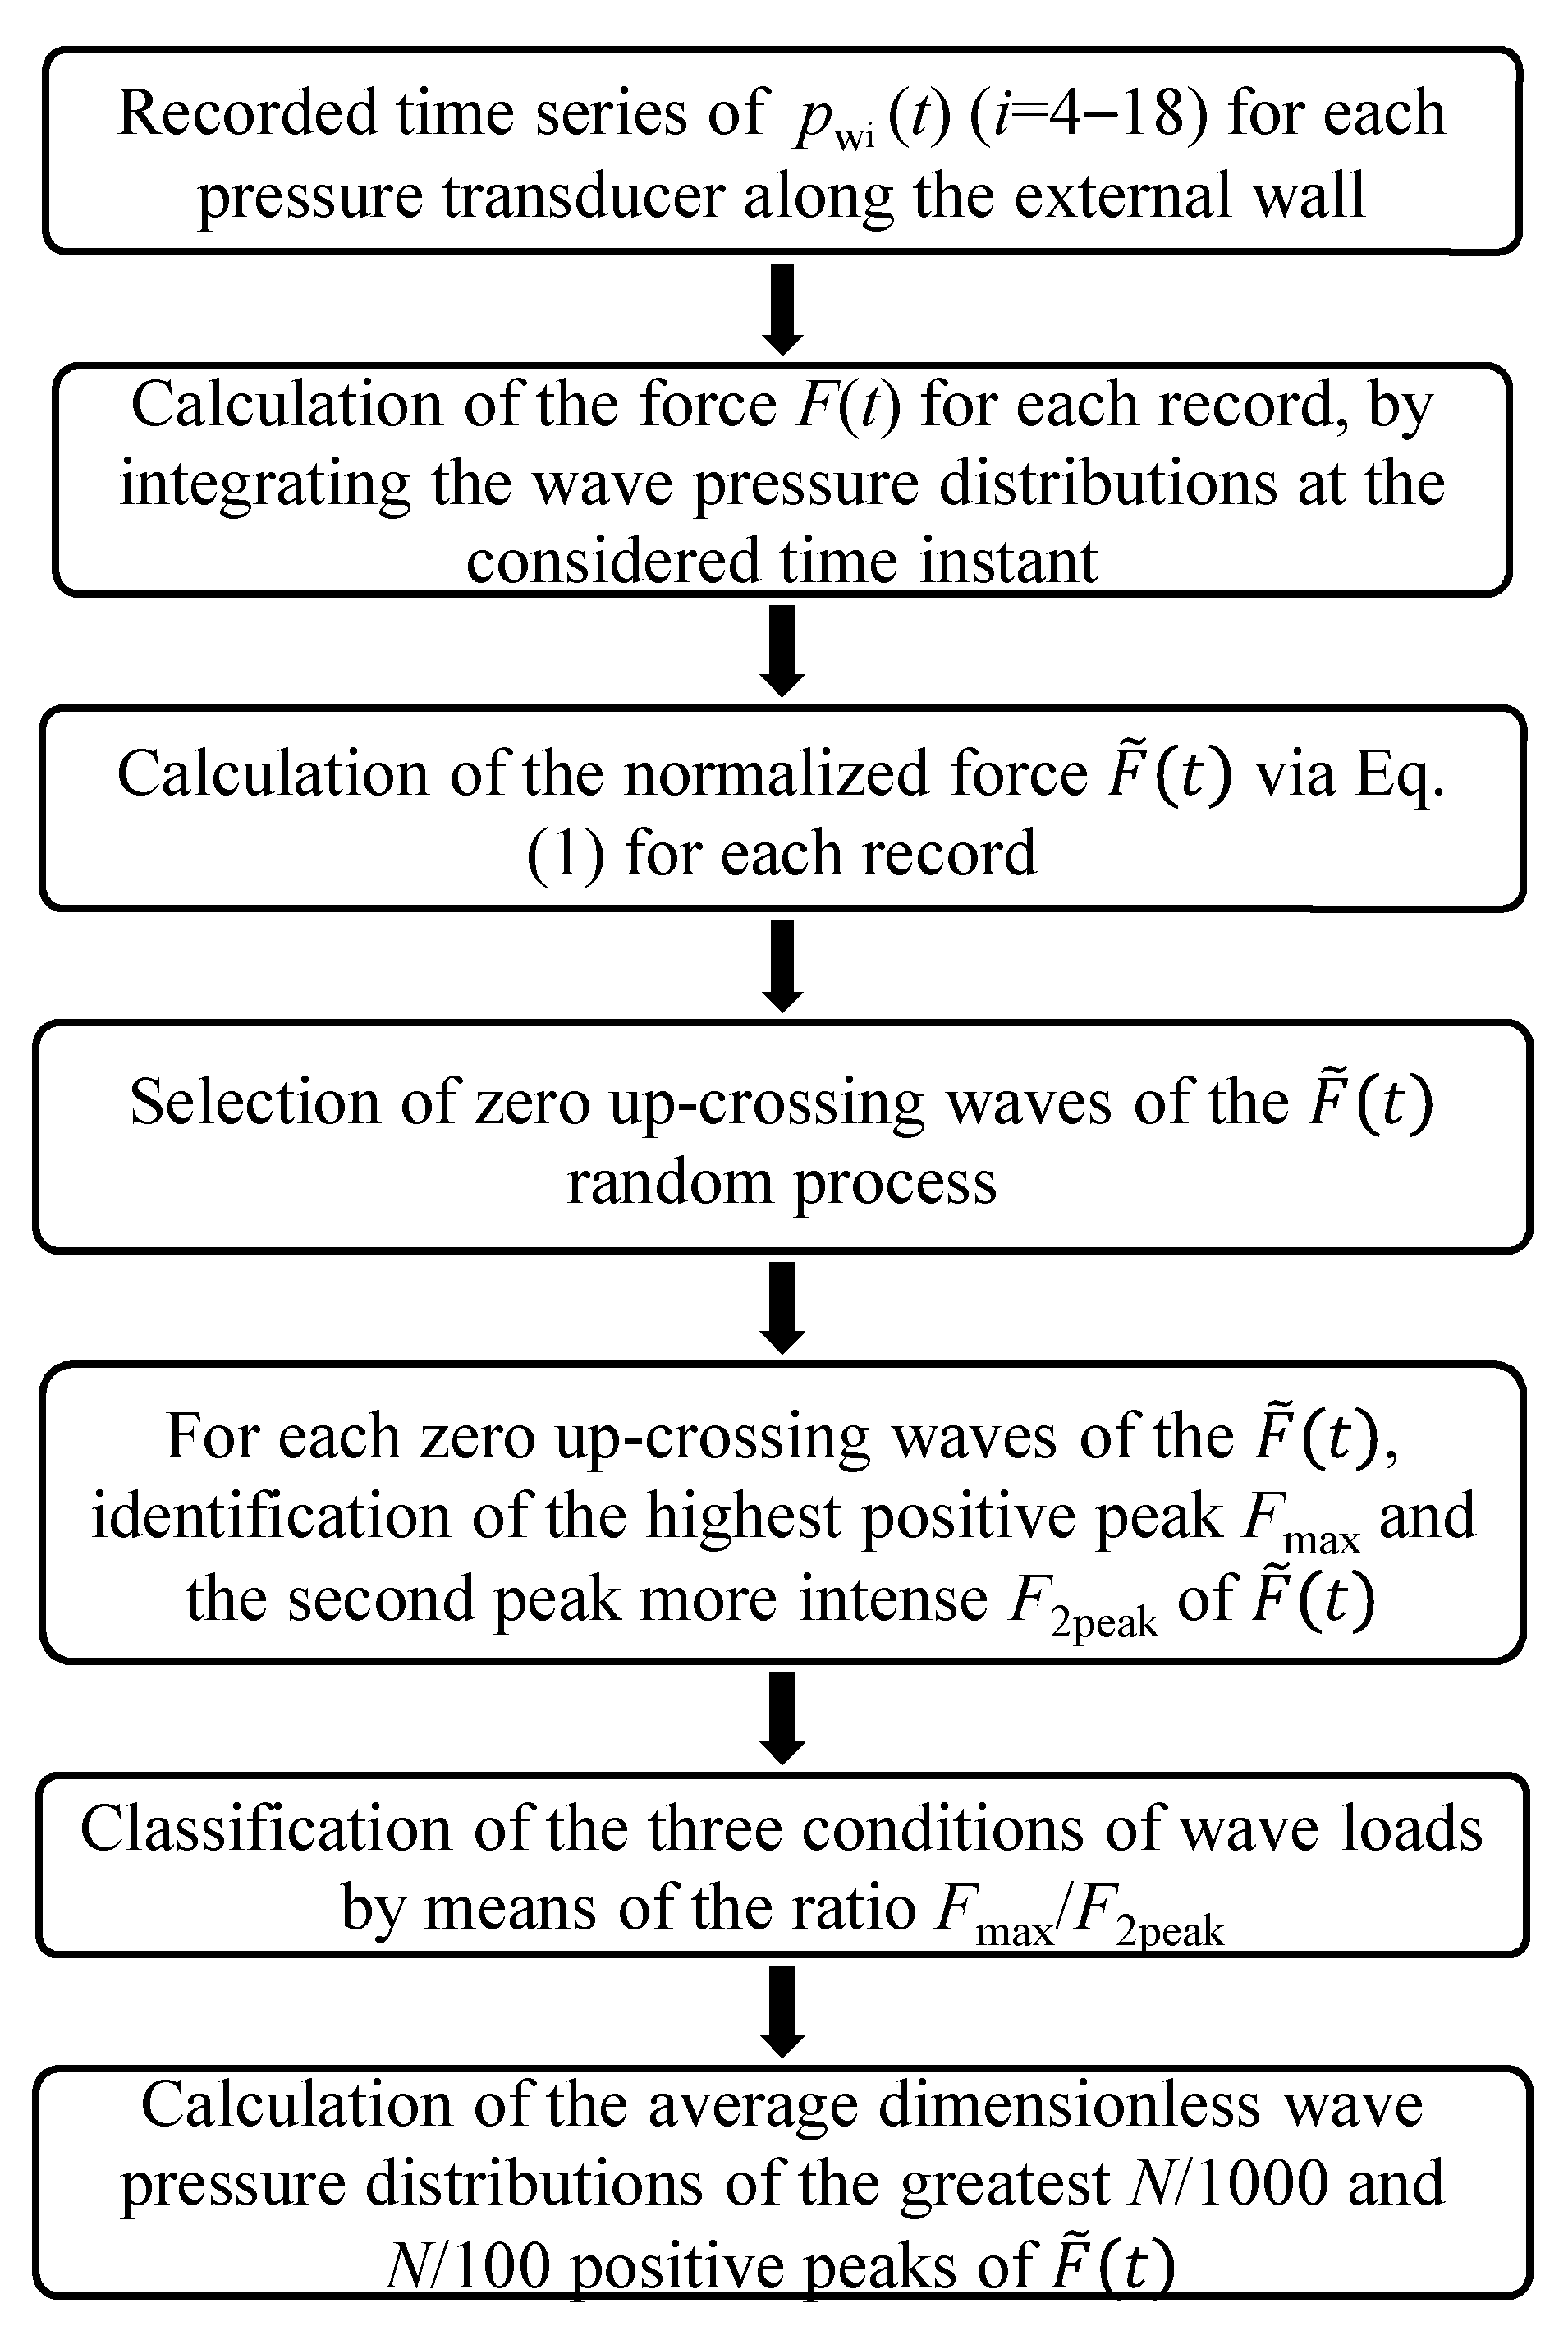
3. Pressure Distributions on the U-OWC Breakwater at NOEL Laboratory

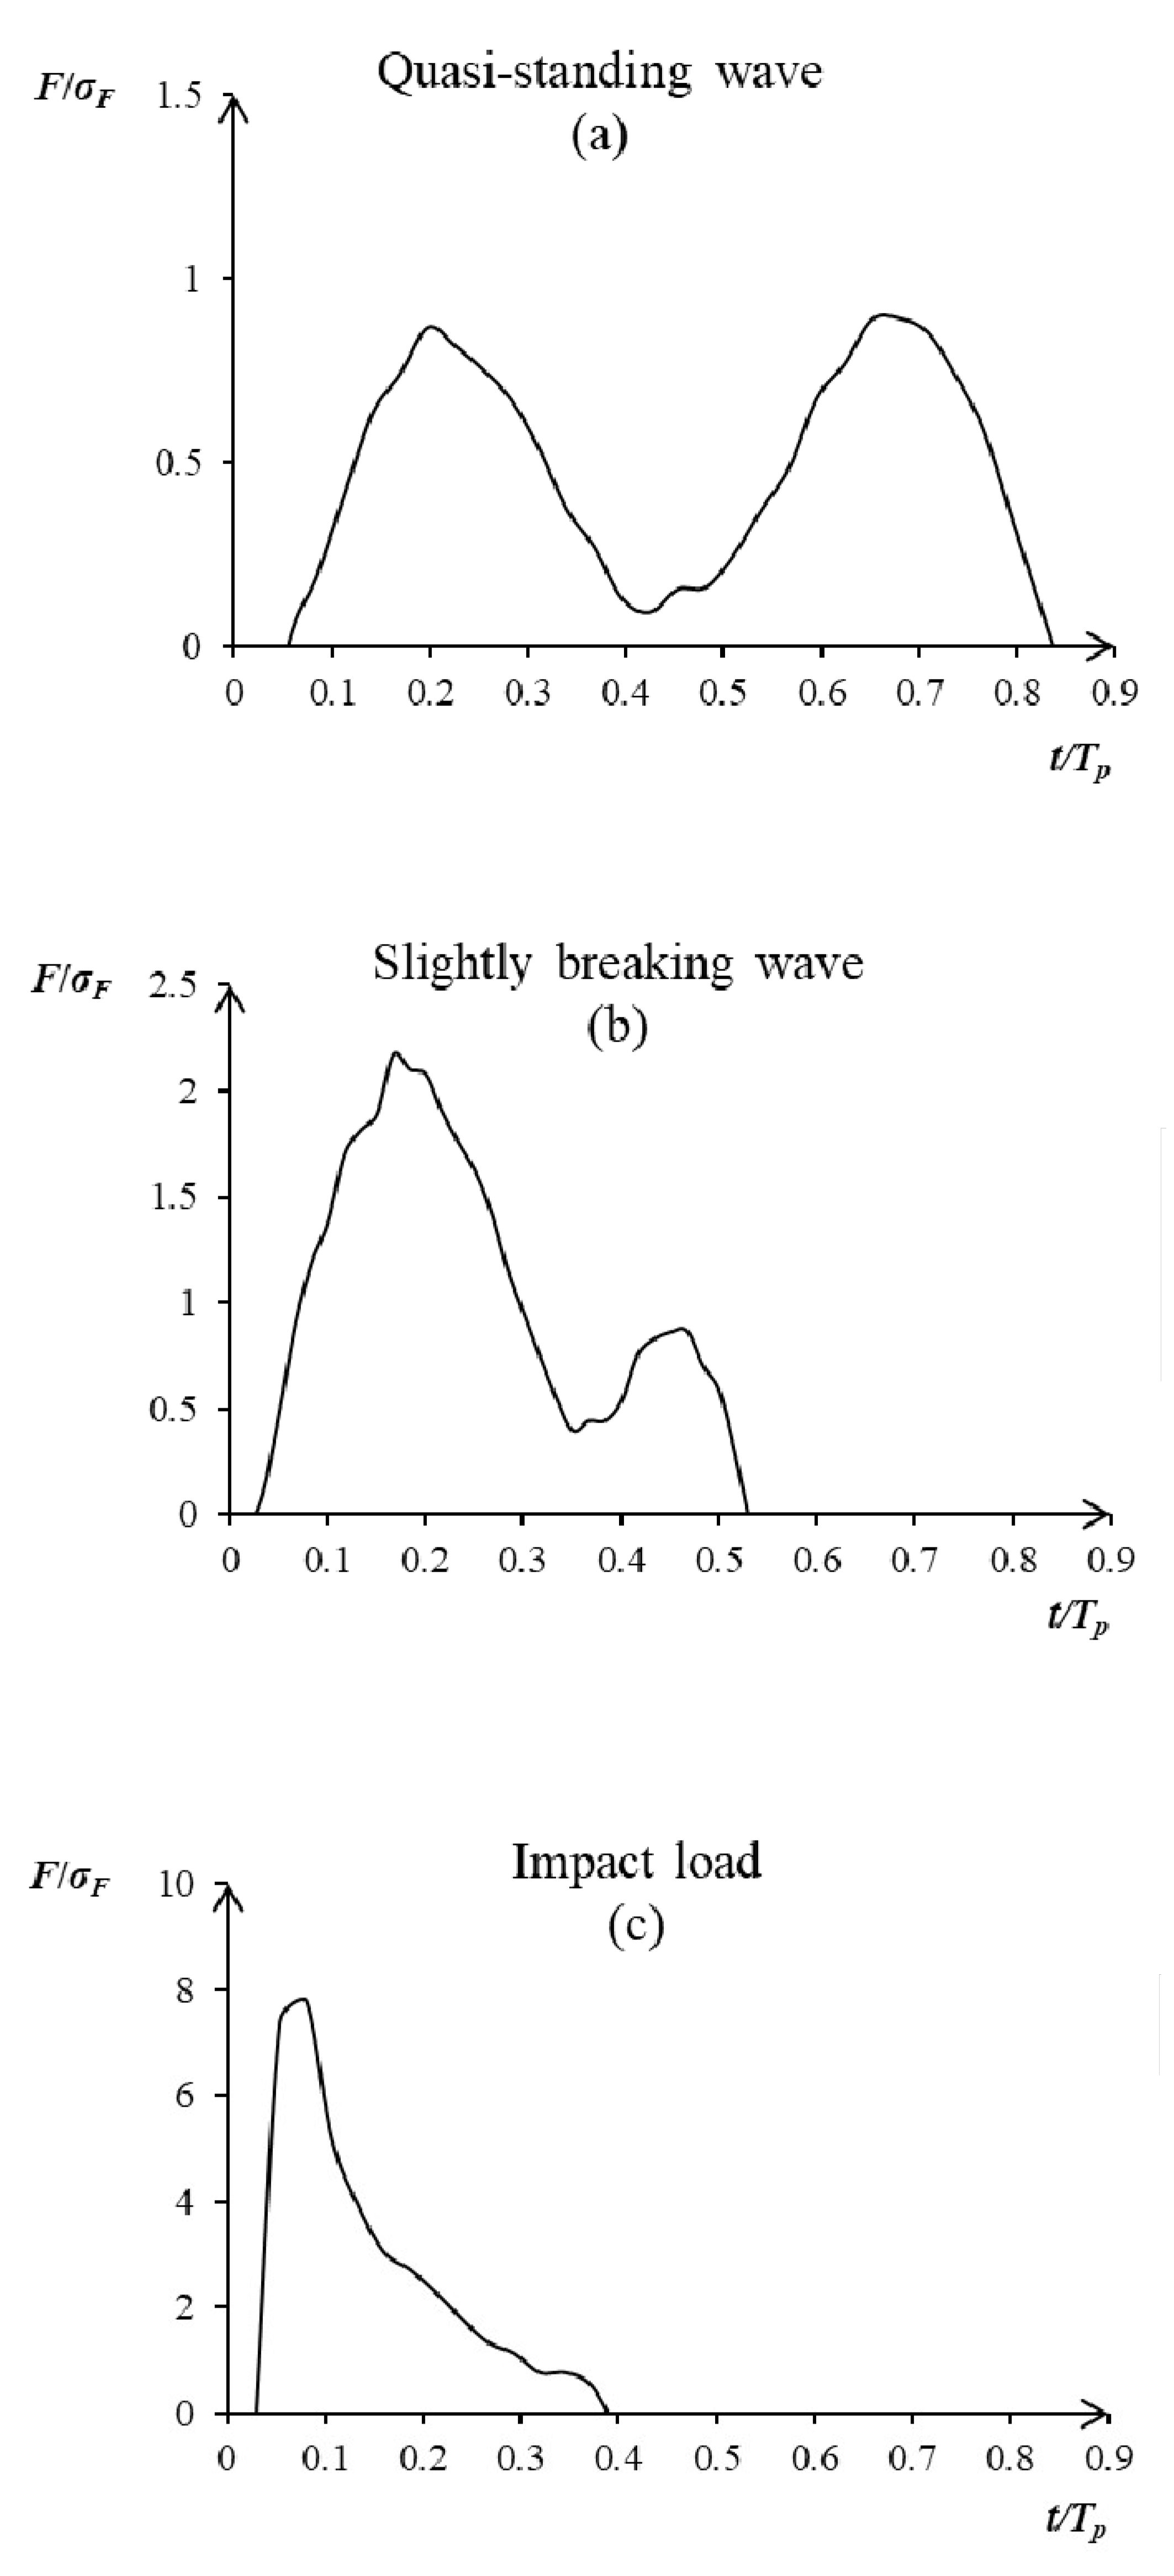
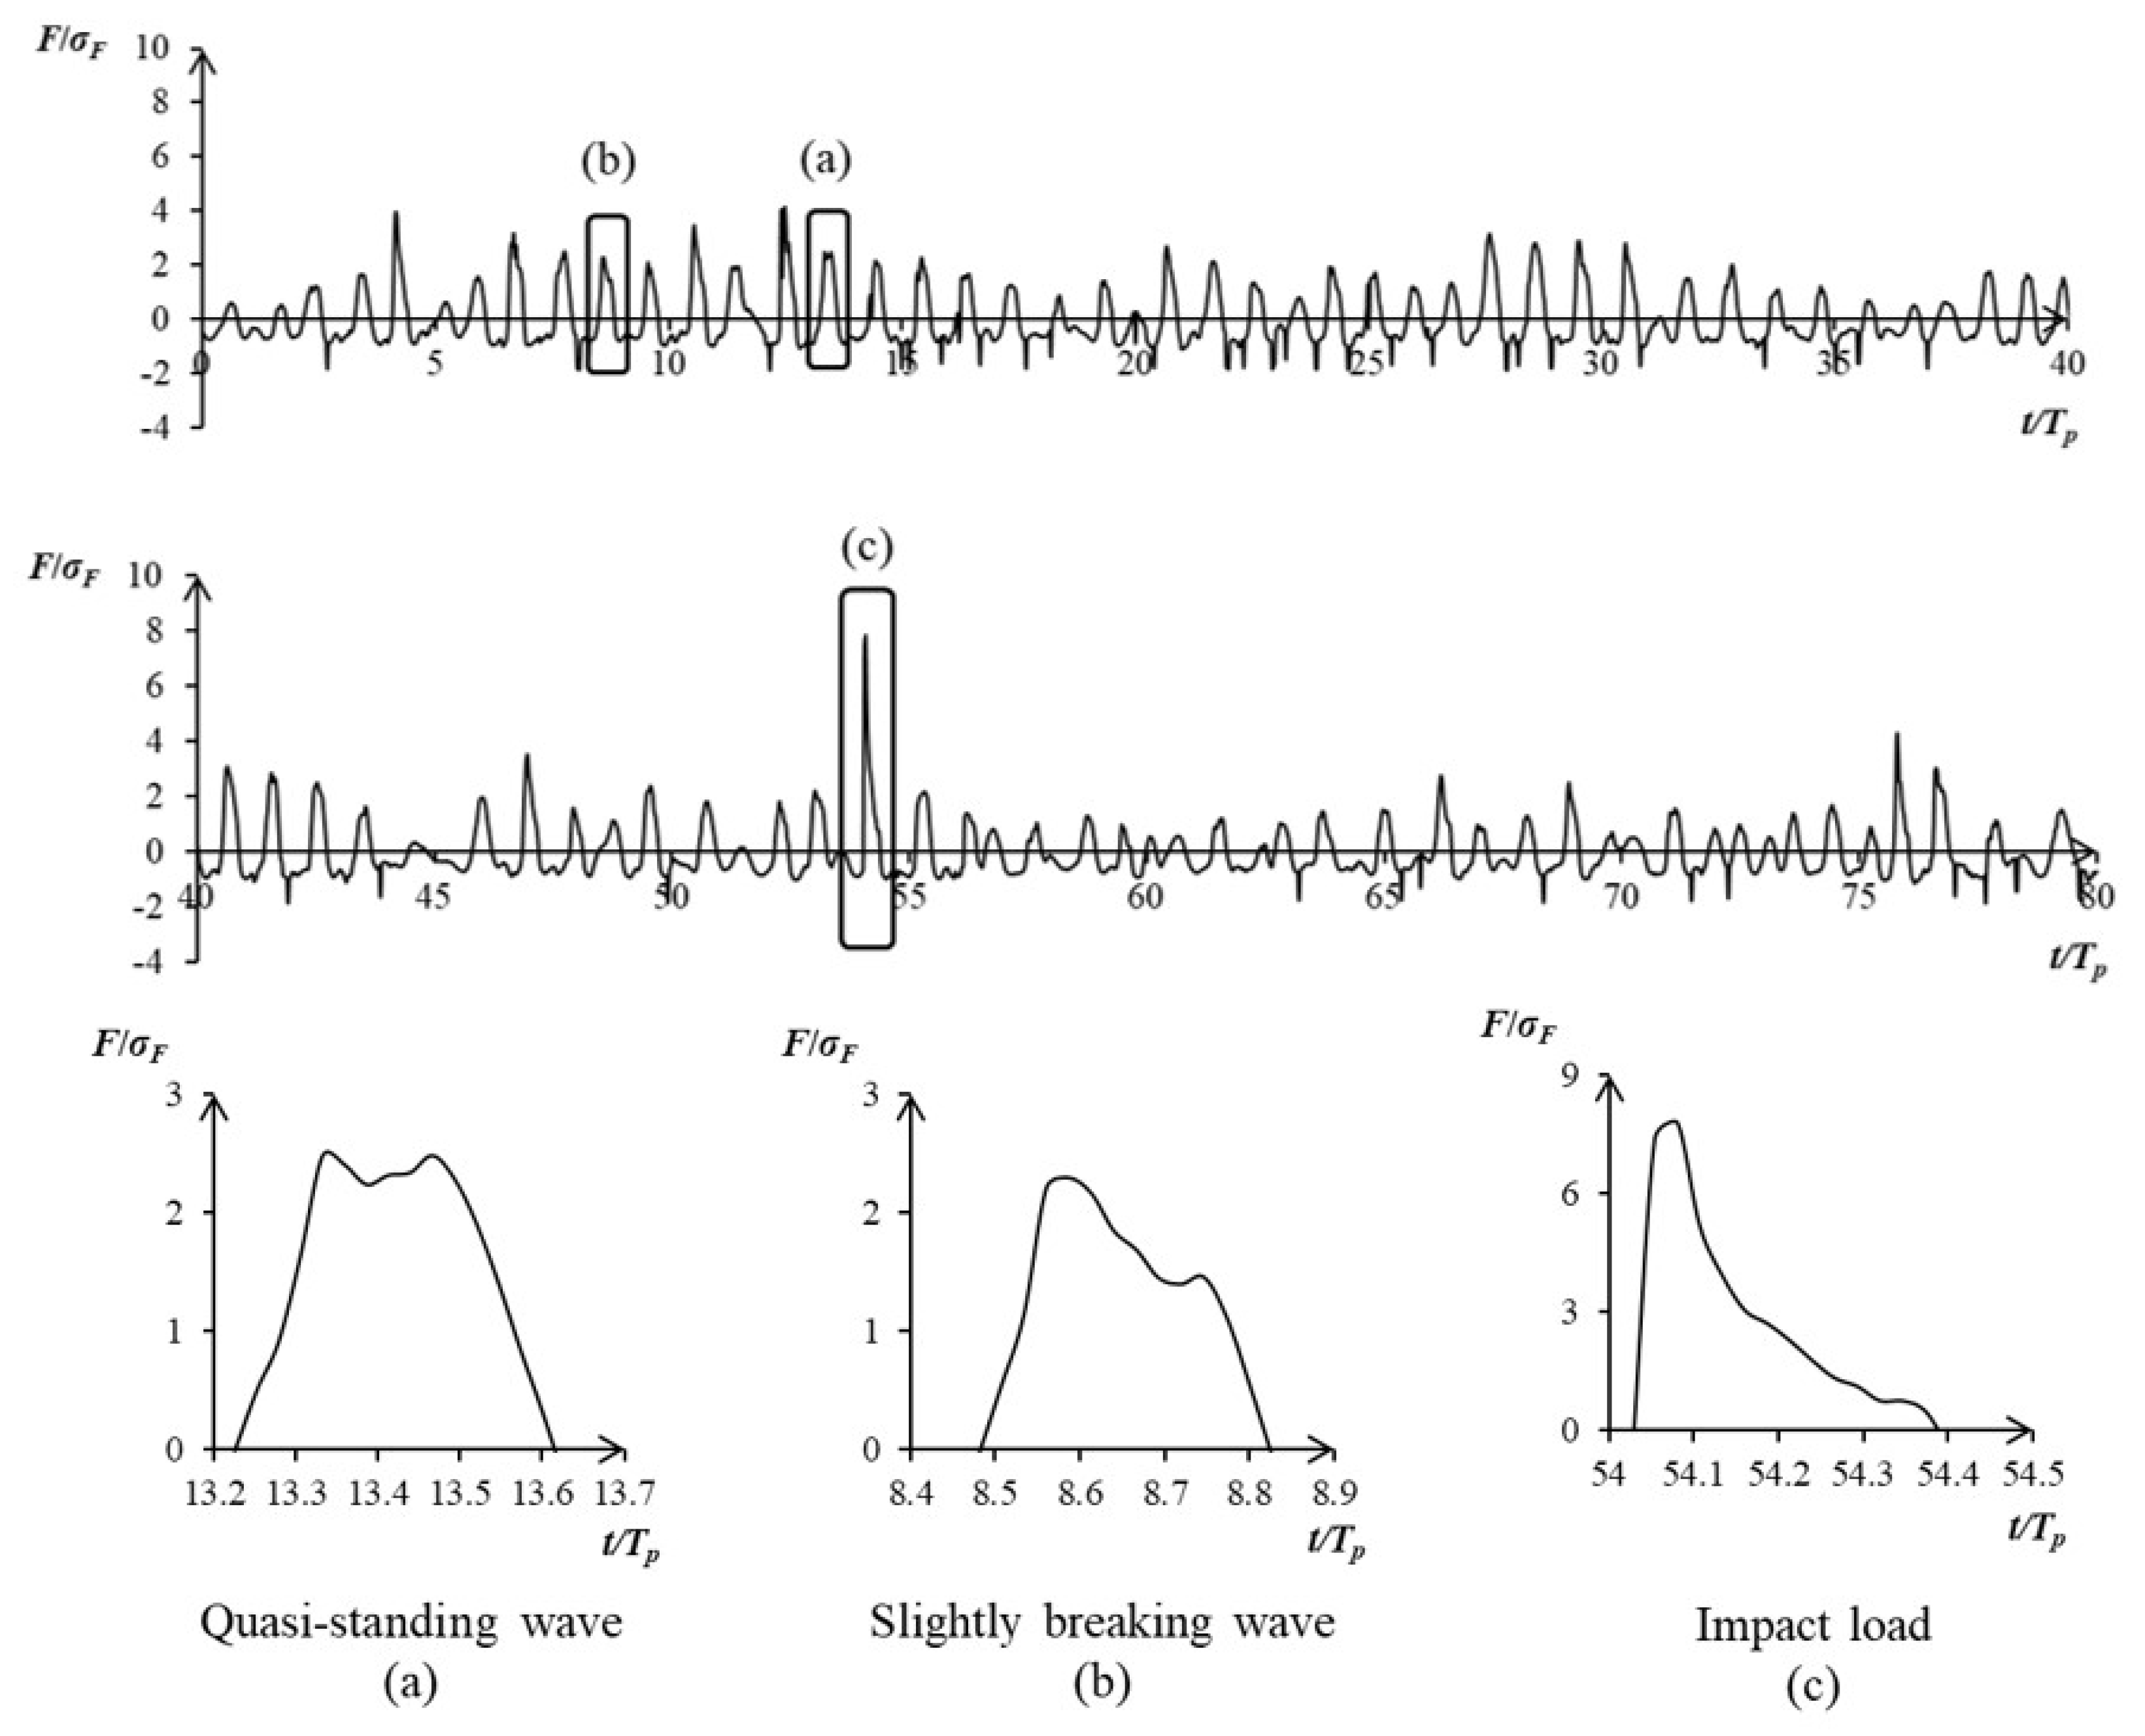
3.1. The PROVERBS Wave Load Classification for a U-OWC Breakwater

Based on the experience gained by the European project PROVERBS on traditional vertical breakwaters, the phenomenon of impulsive forces was investigated on a small-scale field model of U-OWC breakwater. Thus, the aim of this work is to apply the approach already developed by PROVERBS [8] for conventional breakwaters also to this new technology. In this regards, the methodology adopted is reported in the Flow Chart of Figure 2.
When the waves are perfectly reflected, a “Quasi-Standing (QS)” wave pattern results, characterized by two double positive peaks of equal intensity, when a high wave crest impacts to the breakwater. When the breaking phenomena is realizing on the structure or in front of it, the wave pressure in the time domain shows an asymmetrical trend with two peaks with different intensity, with the first one greater than the second [3]. The impulsive wave impacts in these configurations are distinguished in “Slightly Breaking Waves (SBW)”, where the first higher positive load is greater than 1–2.5 times the subsequent second and in “Impact Loads (IL)”, where the highest positive load is greater than 2.5 times the second.
In the present work, PROVERBS methodology has been applied to the investigation of records on the small-scale field model of U-OWC breakwater installed at the NOEL laboratory of the University “Mediterranea” of Reggio Calabria in order to identify the wave load configurations acting on the modified coastal structure.

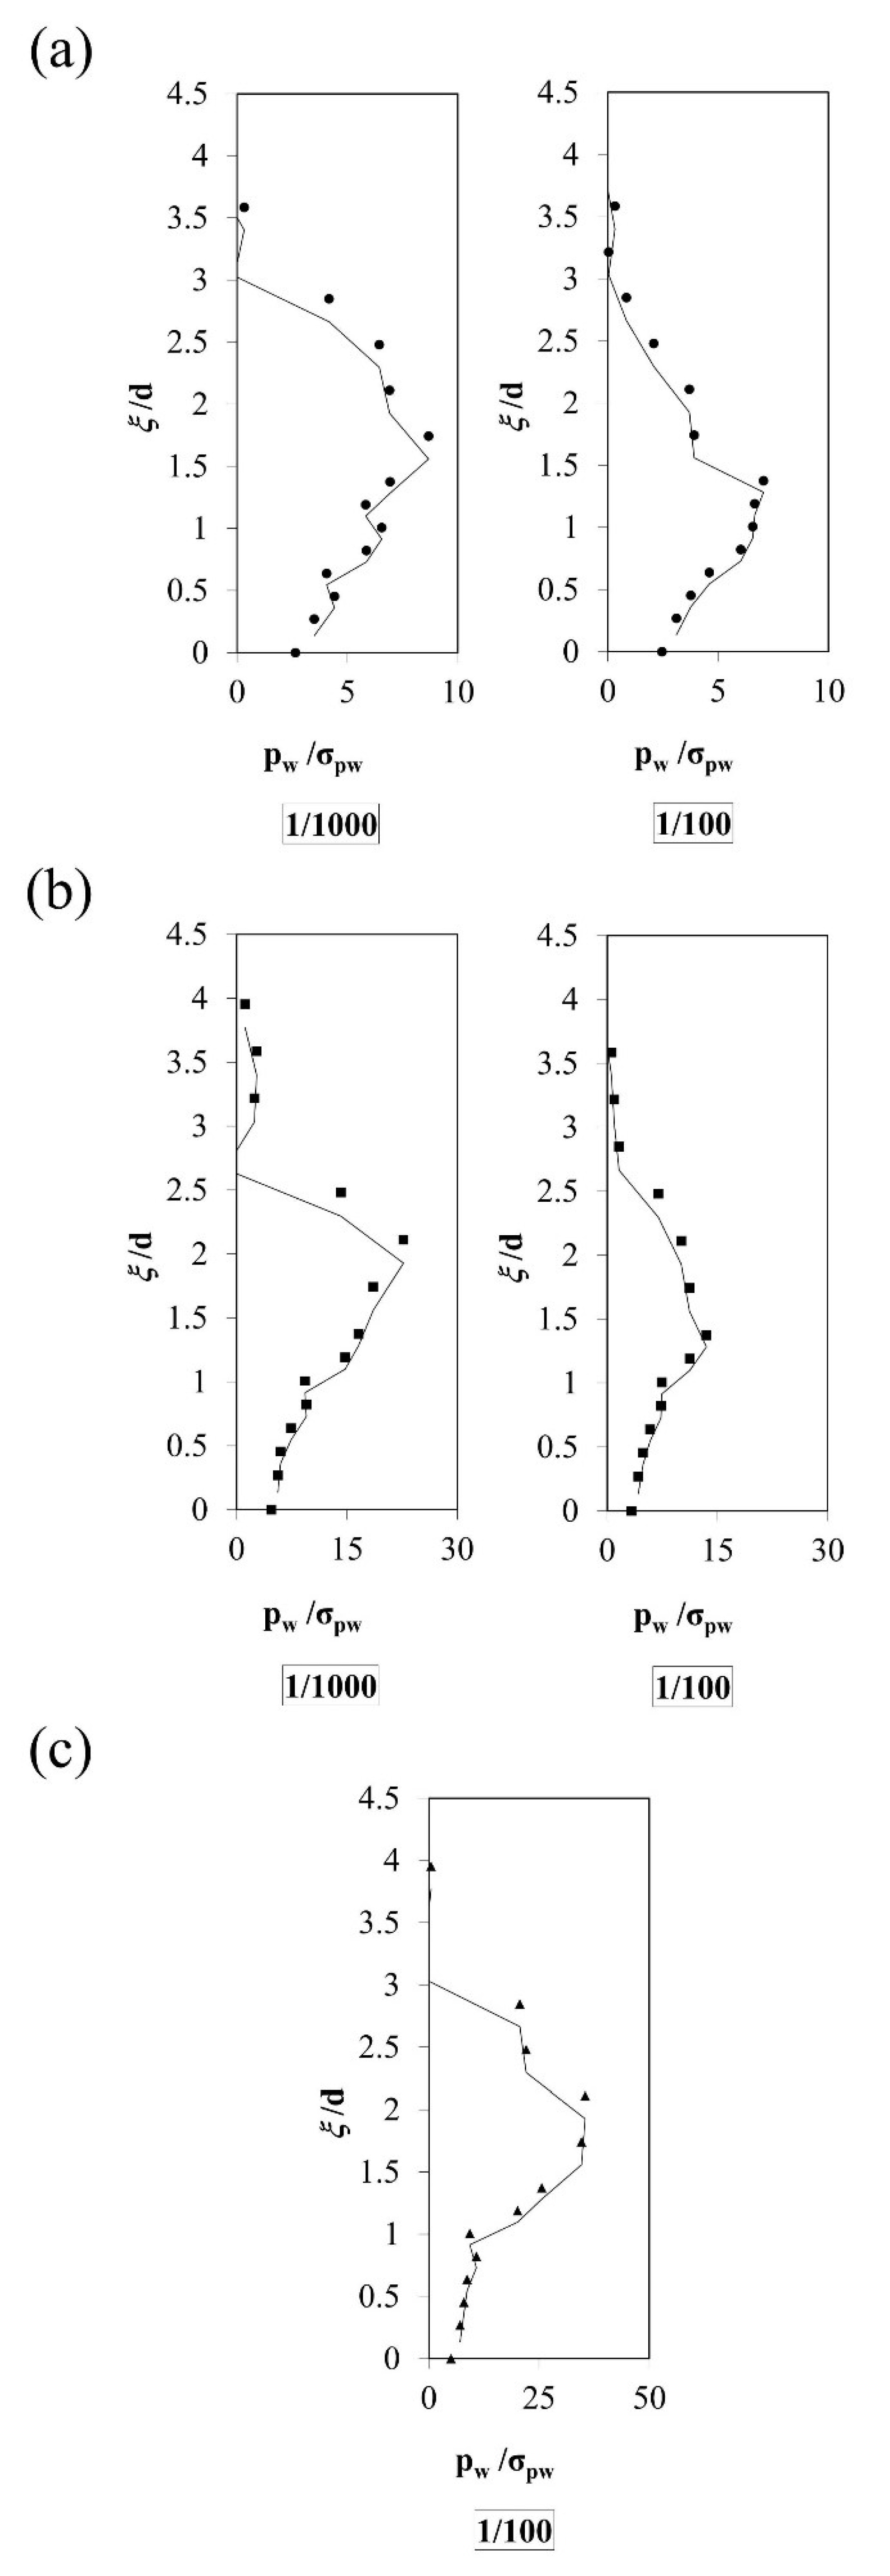
3.2. The Pressure Distribution and the Relative Wave Forces on the U-OWC Breakwater

In this section, the post-processing of data of the small-scale experiment on the model of U-OWC breakwater (1:8 scale) is pursued in order to investigate and classify impact wave loads acting against the modified breakwater.
Firstly, the time series of wave pressure recorded by the array of eighteen pressure transducers, placed as shown in Figure 1c, have been considered. By these measurements, the wave pressure distributions along the U-OWC breakwater have been calculated for each time instants by considering pressure transducers from 4 to 18. Then, the force F(t) per unit of length at the mid-section of the U-OWC breakwater is obtained by integrating the wave pressure distribution recorded. In detail, the wave loads acting on the external wall of the pneumatic U-OWC chamber are calculated by integrating the pressure distributions of
Then, the normalized force F ˜ ( t ) for each record was obtained by dividing the measured force F(t) by its own standard deviation σ F , and it was calculated for each recorded sea state:
F ˜ ( t ) = F ( t ) σ F .
The positive peaks of the F ˜ ( t ) random process was determined for every 5-min records. For each peak of F ˜ ( t ) , the corresponding dimensionless wave pressure distributions were obtained, by dividing the measured wave pressure p w i ( t ) (i = 4–18) by its own standard deviation σ p w .
The average pressure distribution of the greatest N/1000 and N/100 of the positive force peaks (N = total number of waves of the F(t) process) is calculated.
In this paper, the positive force peak refers to the largest positive value of a wave of the F(t) process, and the number of waves refers to the number of zero up-crossing waves of the random wave-force-process, F(t). In addition, it is assumed ξ i / d (i = 4–18) the dimensionless coordinates of the pressure transducers along the external wall, related to the depth (a = 0.57 m) of the upper opening of the U-duct.
Firstly, the zero up-crossing waves of the random wave force process, F ˜ ( t ) , of the whole dataset of the experiment have been considered. These have been 5000 sea waves.
Considering the wave loads classification of the PROVERBS project, the pressures distributions on the external wall of the U-OWC model have been obtained for the three classes of wave loads. In this regards, in the time series of the wave force process F, more than one positive peak can occur (see different behaviors in Figure 3 and Figure 4). Thus, the highest positive peak is denoted by Fmax, while the second peak more intense is indicated by F2peak.
When Fmax is comparable to F2peak, a “Quasi-Standing Wave (QSW)” is realized (Figure 3a); if 1 < Fmax/F2peak < 2.5, a “Slightly Breaking Wave (SBW)” occurs (Figure 3b); for Fmax/F2peak > 2.5, an “Impact Load (IL)” is considered (Figure 3c). Moreover, the peak duration decreases significantly, when the peak intensity increases greatly, as shown in Figure 3.
After, the average dimensionless wave pressure distributions of the greatest N/1000 and N/100 positive peaks of F ˜ ( t ) have been calculated. They have been given for the three classes of wave loads in Figure 4, where dots denote the measured wave pressures on the front wall of the U-OWC model.Comparisons from Figure 5 show that the total wave loads are almost double from “Quasi-Standing Wave (QSW)” to “Slightly Breaking Wave (SBW)”, for both the N/1000 and N/100 maximum dimensionless wave pressures. Then, the N/1000 maximum wave pressures of the “Impact Load (IL)” are approximately three times greater than that of the “Slightly Breaking Wave (SBW)” and five times greater than that of the “Quasi-Standing Wave (QSW)”. An additional behavior is outlined, when a predominance of impulsive component in the total wave forces, due to wave breaking against structure, is realized at the U-OWC. As a matter of fact, the increase in the total force on the modified structure, in the presence of impulsive loads, is essentially due to the increase in wave pressures below the mean-water-level (MWL), while that for “Slightly Breaking Wave (SBW)” and “Impact Load (IL)” is, respectively, approximately 2.5 and 7 times greater than the quasi-static ones. On the other hand, above the mean-water-level, the wave pressures for both the SBW and the IL are approximately 50–60% higher than those that are quasi-static.

4. Goda’s Model Applied to the U-OWC Breakwater

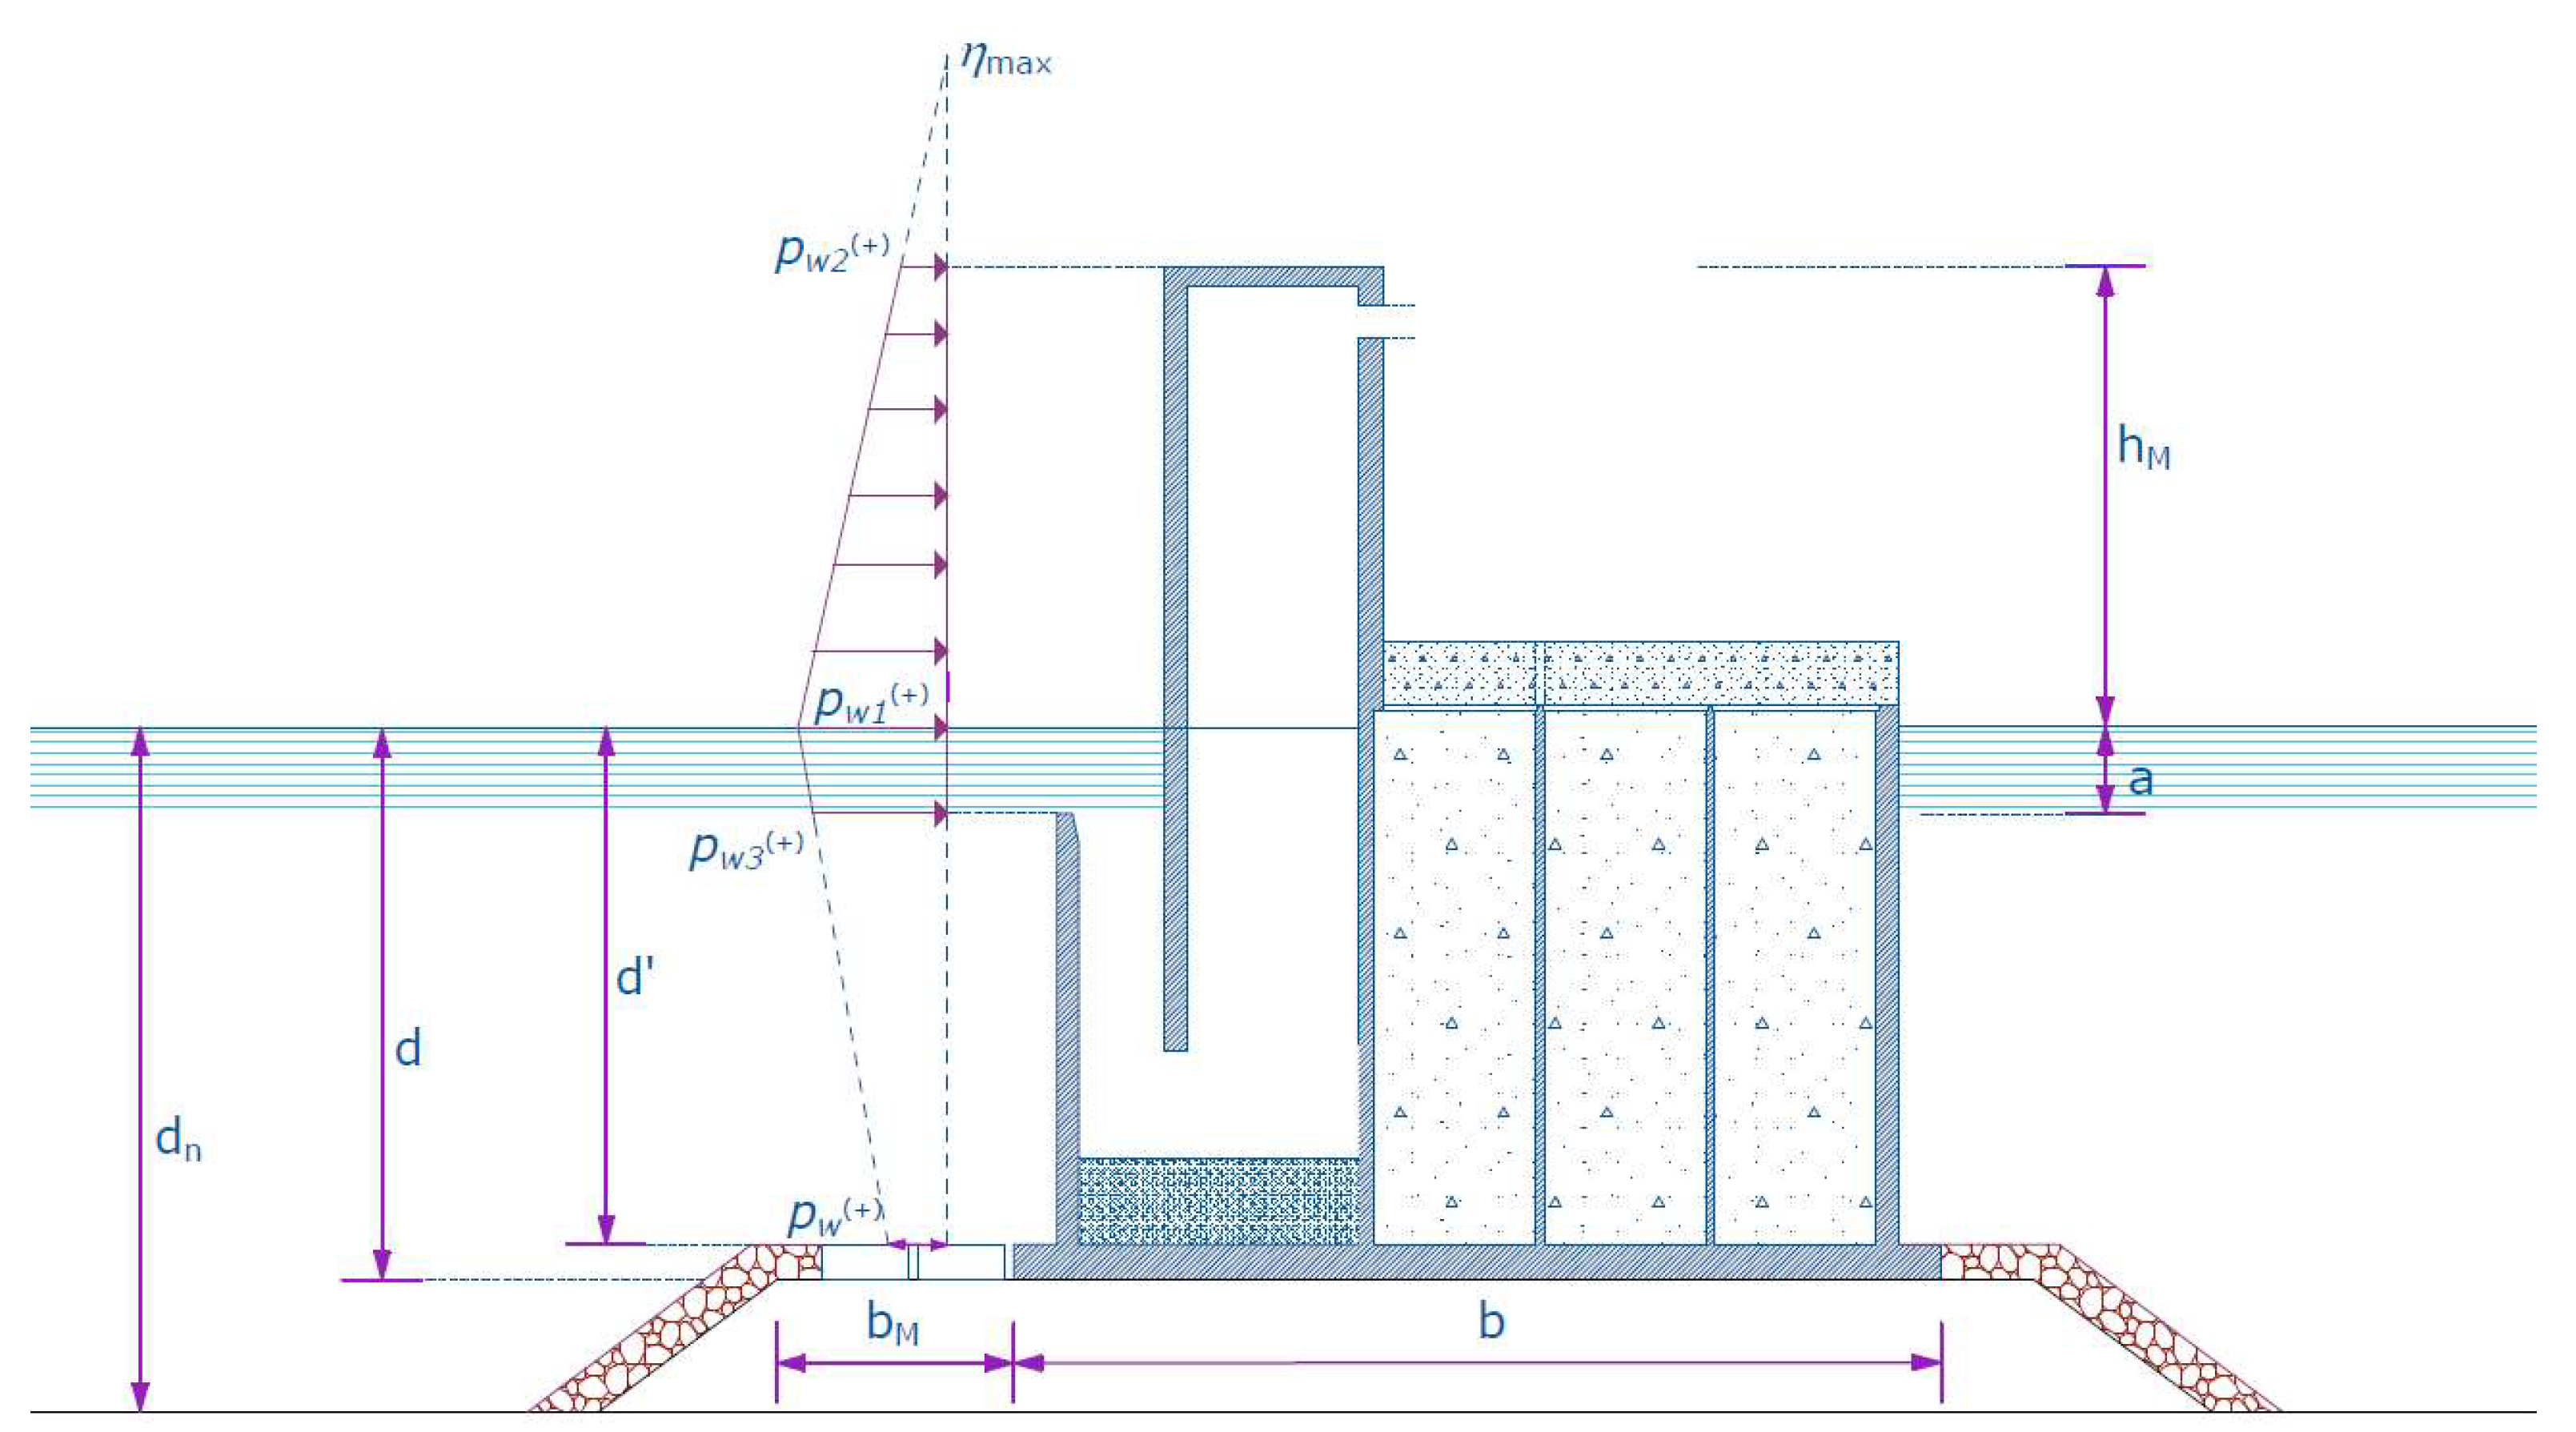
4.1. Goda’s Model Applied for the Small-Scale U-OWC Breakwater Installed at the NOEL Laboratory

Ln the literature, Goda’s model [1] is one of the most effective method, widely adopted [7] to determine the pressure distribution on a seawall or a vertical breakwater, in the case either of breaking or non-breaking incident sea waves.
In particular, Goda’s model is applied with reference to the configuration of the U-OWC breakwater tested during the small-scale field experiment campaign arranged at NOEL laboratory (see Figure 1).
The model for the pressure distribution proposed by Goda is shown in Figure 6 and it provides the maximum elevation of the free surface, η max , which is equal to
η max = 3 4 ( 1 + cos θ ) H
and the maximum (positive) wave pressures under a wave crest, which are given, with reference to the scheme of Figure 6, by
p w 1 ( + ) = 1 2 ( 1 + cos θ ) ( α I + α I I cos 2 θ ) γ   H
p w ( + ) = α I I I p w 1 ( + )
p w 2 ( + ) = ( 1 h M η max ) p w 1 ( + )
p w 3 ( + ) = ( 1 α I V ) p w 1 ( + ) + α I V p w ( + )
where γ is the water density, h M is the quote of the top of U-OWC pneumatic chamber with respect to the mean water level, H is the height of the largest wave in the design sea state and θ is the dominant direction of propagation of incoming waves with respect to the orthogonal to the U-OWC breakwater. In detail, when the irregular sea waves approaches orthogonally to U-OWC caissons, θ is equal to 0.
More specifically, we assumed the design wave height H equal to 1.8 H s , where H s is the significant height of the incident waves. In the present experiment, the value of H s have been calculated on the time series data of the free surface displacement obtained from the two ultrasonic probes in the undisturbed wave field (see Figure 1c). In addition, the wave period T of the design wave is assumed equal to the mean wave period of each recorded sea state.
Moreover, in Equations (3)–(6), the coefficients α I , α I I , α I I I and α I V are empirical are they are defined by Goda’s model [1] as follows
α I = 0.6 + 1 2 [ 2 k d n sinh ( 2 k d n ) ] 2
α I I = M i n [ ( d n d 3 d n ) ( H d ) 2 ,   2 d H ]
α I I I = 1 d d n [ 1 1 cosh ( k d n ) ]
α I V = a d
where k is the wave number relative to the water depth d n and the mean wave period, with the associated wave length L . Then, d , d and d n are the water depths illustrated in Figure 6, while d n is defined as the water depth of the natural bed at a distance of 5 H s from the U-OWC breakwater.
Following Goda’s model [1], the wave pressure p w 1 ( + ) on the mean water level, is expressed by Equation (3) for the case of non-breaking waves, which is identified by conditions that
d n H s 2.4   and   d n L 0.12 .  
If relations (11) are not satisfied, it is necessary to take into account an additional impulsive wave pressure contribution. In this case, the wave pressure p w 1 ( + ) is defined by Goda [1] by the following expression
p w 1 ( + ) = 1 2 ( 1 + cos θ ) ( α I + α cos 2 θ ) γ   H
where
α * = M a x {   α I I , α I   } ,
with α I I expressed by Equation (8) and coefficient α I calculated by relation that
α I = α I H α I B
being
α I H = min { H d ;   2.0 }
α I B = { cos δ 2 cosh δ 1     :   δ 2 0 , 1 cosh δ 1 cosh 1 / 2 δ 2   :   δ 2 > 0 ,
δ 1 = { 20   δ 11   :   δ 11 0 , 1 5   δ 11   :   δ 11 > 0 ,
δ 2 = { 4 . 9   δ 22   :   δ 22 0 , 3 . 0   δ 22   :   δ 22 > 0 ,
δ 11 = 0.93 ( b M L 0.12 ) + 0.36 ( 0.4 d d n ) ,
δ 22 = 0.36 ( b M L 0.12 ) + 0.93 ( 0.4 d d n )
In Equations (19) and (20), bM is the length between the base of the U-OWC breakwater and the head of the foundation berm. L is the wave length at water depth d n .

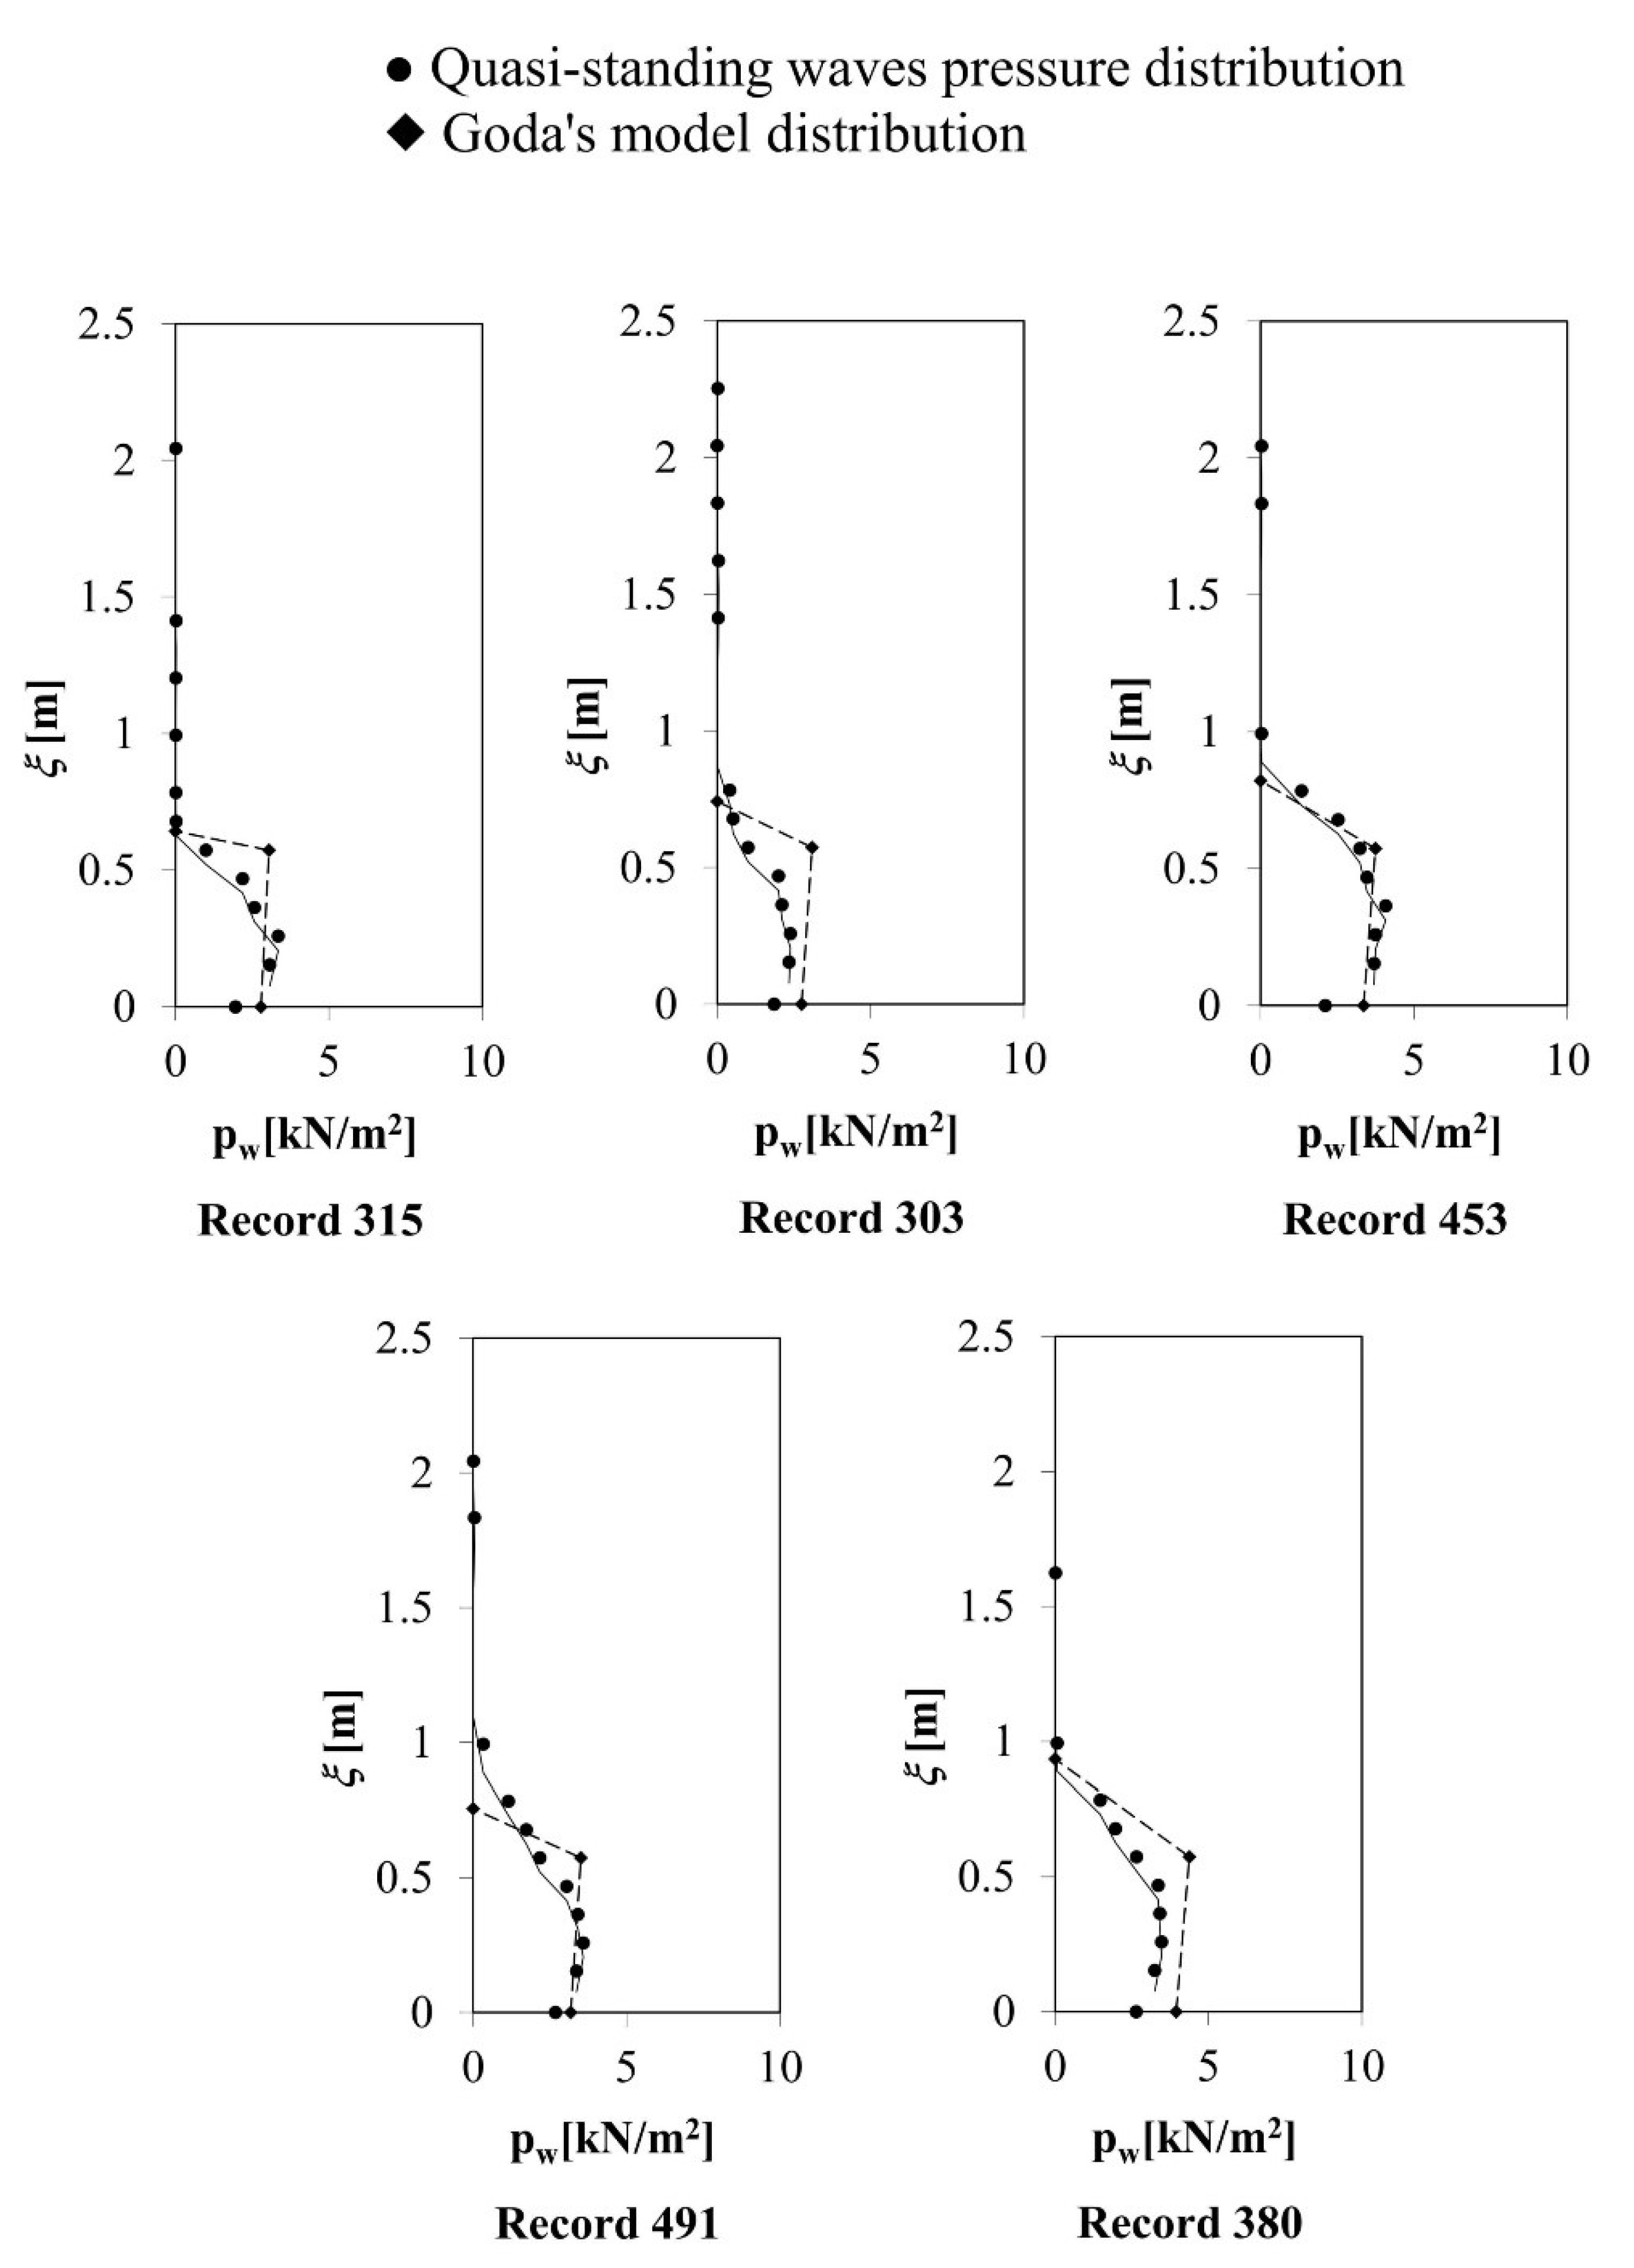
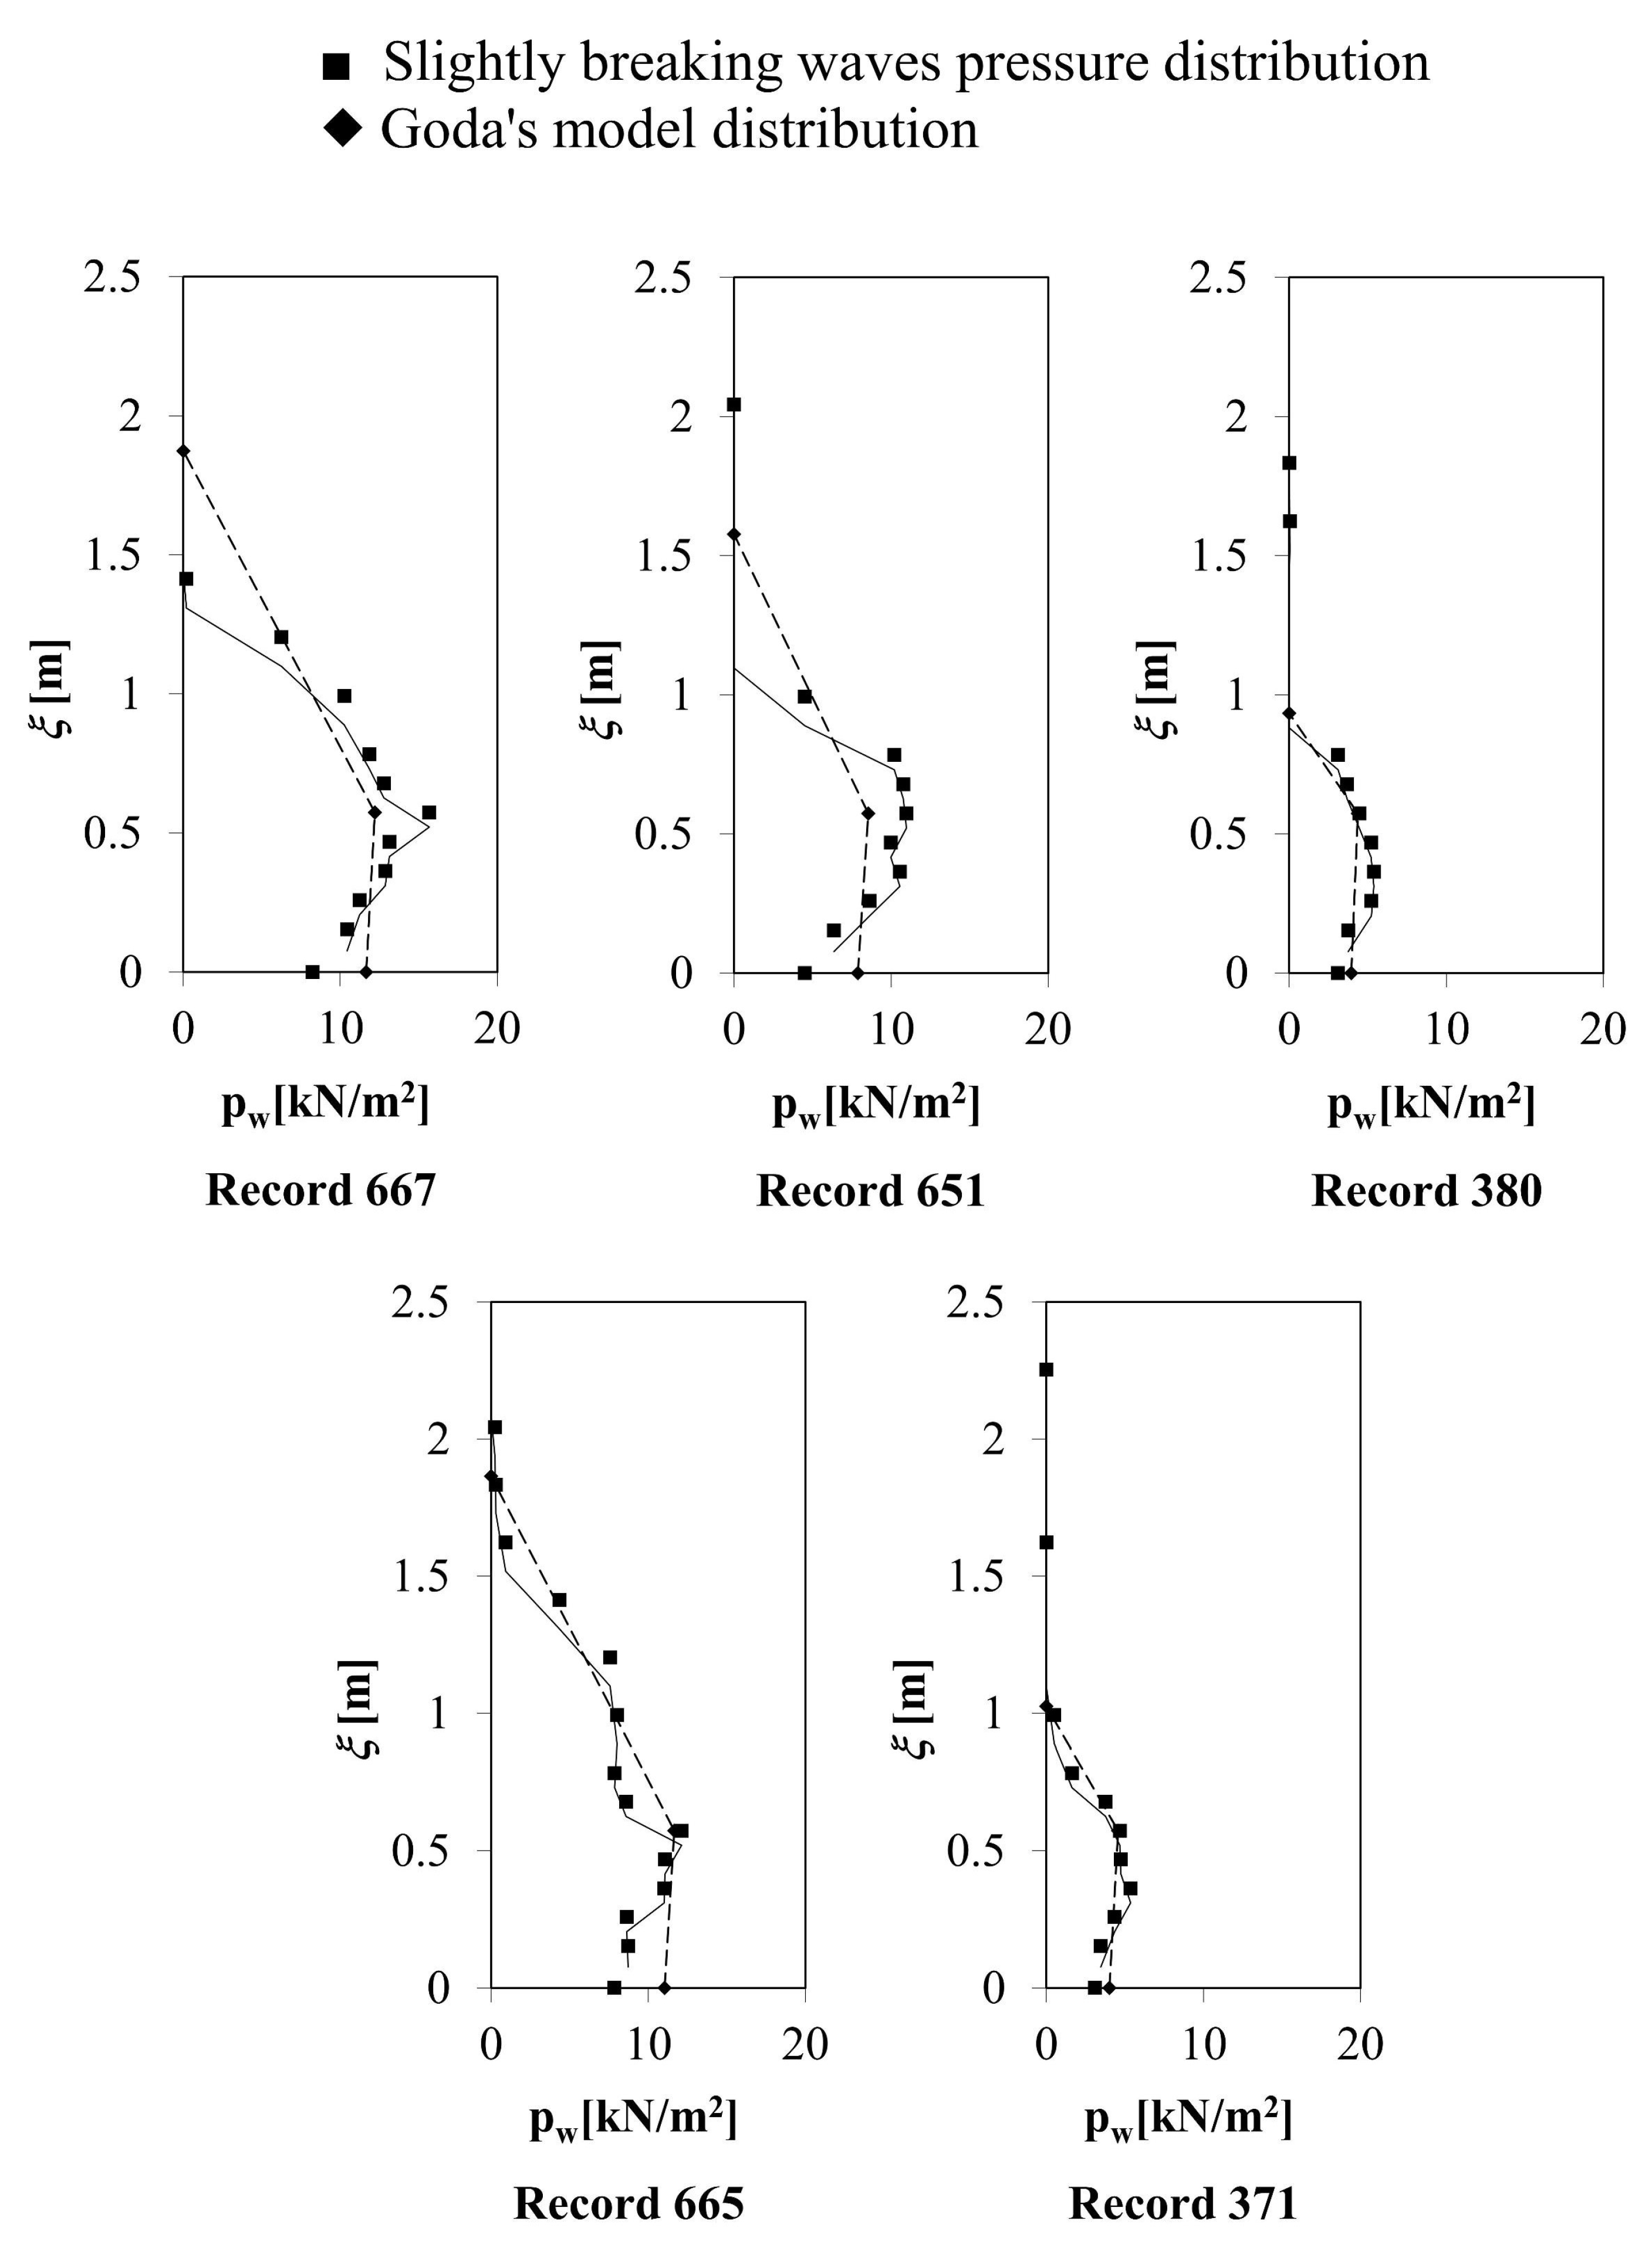
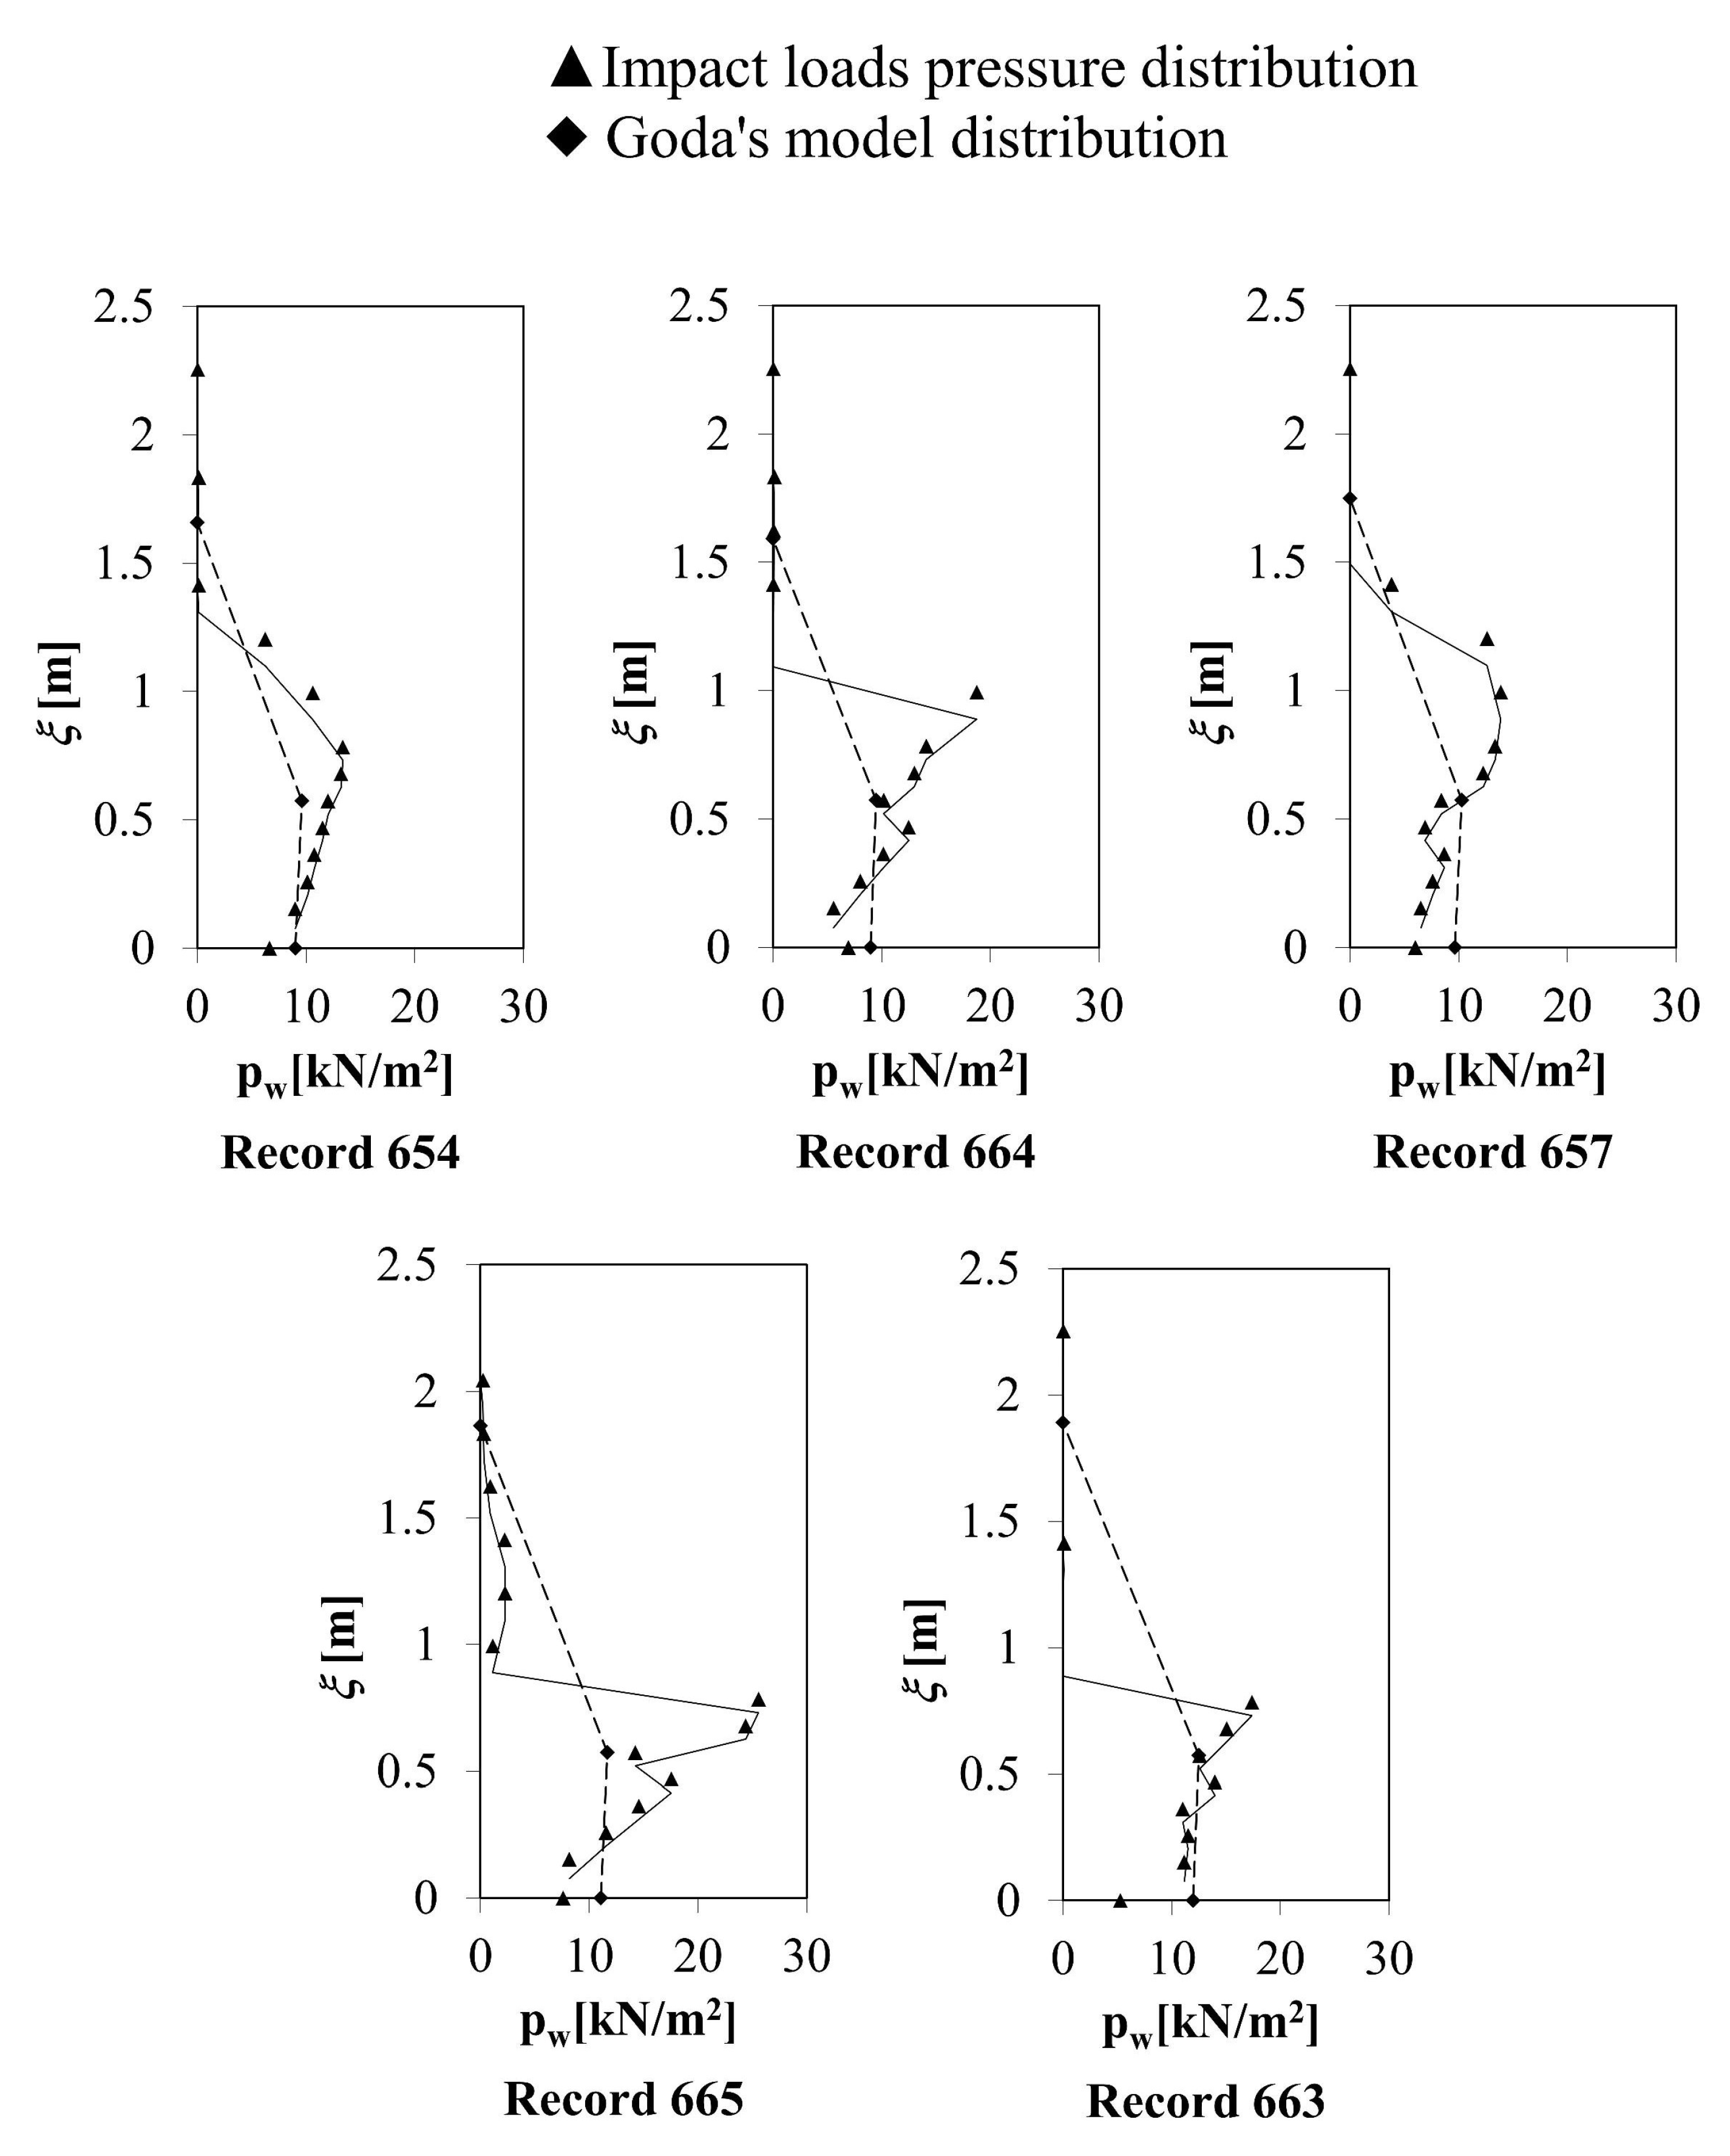
4.2. Comparison between Goda’s Model and Experimental Pressure Distributions

Here, Goda’s formulas have been applied to calculate the pressure distributions on the breakwater modified with the U-OWC technology.
The N/1000 average pressure distributions (N = number of total waves for the three class), for the largest N/1000 positive force peaks F ˜ ( t ) , represent the most intense N/1000 waves of force process recorded during the small-scale experiment for the three classes of quasi-standing waves, slightly breaking waves and impact loads.
In Figure 7, Figure 8 and Figure 9, the comparison between the experimental distributions and the theoretical pressure distributions using Goda’s model is shown.
Figure 7 and Figure 8 shows the comparison between the theoretical and the experimental pressure distributions corresponding, to the five highest quasi-standing and slightly breaking waves, respectively. In these cases, Goda’s model approximates quite well the experimental wave force.
Finally, Figure 9 represents the pressure distributions of the five greatest positive peaks of the force process F ˜ ( t ) for the class of impact loads. In all three records, the theoretical schemes underestimate significantly the impulsive force obtained by the experimental pressure distributions.
Therefore, the pressure distribution for the impact loads shows experimentally an important limitation to predict impulsive pressures on the U-OWC model with the existing Goda’s approach, while this theoretical scheme is in good agreement with experimental results for “quasi-standing” and “slightly breaking” waves.

5. Conclusions

In this paper, the analysis of the impact wave loads acting on the modified U-OWC structure during a field experiment in the NOEL laboratory has been pursued.
Based on the PROVERBS methodology for traditional breakwater, the phenomenon of impact forces was investigated on the small-scale U-OWC model. The occurrence of both “quasi-standing wave” loads due to non-breaking waves and “impulsive wave loads” with different wave impacts exerted by a wave breaking against the U-OWC model, has been observed. The experimental average pressure distributions for the three classes of loads have been calculated. It has been observed that the total force acting on a U-OWC breakwater doubles during “Slightly Breaking Wave (SBW)” impacts compared to quasi-static conditions; for “Impact Loads (IL)” the impulsive loads due to wave breaking are prevalent and remarkable, becoming almost five times greater than static wave loads.
Finally, the applicability of Goda’s model for the prediction of wave pressure distributions on the U-OWC model has been verified, under different wave load conditions, showing that the model can provide efficient estimate in the case of “Quasi-Static Wave” and “Slightly Breaking Wave”, but it is not accurate for the prevision of Impact Loads on U-OWC modified breakwater.

Author Contributions

Conceptualization, A.R., V.L, V.F. and F.A.; methodology, A.R., V.F., B.T., V.L. and F.A.; software, B.T, V.L. and A.R.; validation, A.R., B.T. and V.F.; writing—original draft preparation, A.R. and B.T.; writing—review and editing, A.R., B.T., V.L., V.F. and F.A.; supervision, F.A. and A.R. All authors have read and agreed to the published version of the manuscript.

Funding

This research received no external funding.

Informed Consent Statement

Informed consent was obtained from all subjects involved in the study.

Data Availability Statement

The data presented in this study are available on request from the corresponding author. The data are not publicly available because they were acquired as part of a research project owned by the NOEL laboratory.

Conflicts of Interest

The authors declare no conflict of interest.

References

  1. Goda, Y. Random Seas and Design of Maritime Structures; Advanced Series on Ocean Engineering; World Scientific: Singapore, 2000; pp. 1–433. [Google Scholar]
  2. Boccotti, P. Wave Mechanics for Ocean Engineering; Elsevier Science: Oxford, UK, 2000; pp. 1–485. [Google Scholar]
  3. Boccotti, P. Wave Mechanics and Wave Loads on Marine Structures; Butterworth-Heinemann; Elsevier: Amsterdam, The Netherlands, 2014; pp. 1–311. [Google Scholar]
  4. Romolo, A.; Arena, F. Mechanics of Nonlinear Random Wave Groups interacting with a Vertical Wall. Phys. Fluids 2008, 20, 036604. [Google Scholar] [CrossRef]
  5. Romolo, A.; Arena, F. Three-dimensional non-linear standing wave groups: Formal derivation and experimental verification. Int. J. Non-Linear Mech. 2013, 57, 220–239. [Google Scholar] [CrossRef]
  6. Romolo, A.; Arena, F.; Laface, V. A generalized approach to the mechanics of three-dimensional nonlinear ocean waves. Probabilistic Eng. Mech. 2014, 35, 96–107. [Google Scholar] [CrossRef]
  7. Bagnold, R.A. Interim Report on Wave-Pressure Research. Technical Report; Institution of Civil Engineers: London, UK, 1939. [Google Scholar]
  8. Kirkgoz, M.S. Shock pressure of breaking waves on vertical walls. J. Waterw. Port Coast. Ocean. Div. 1982, 108, 81–95, WW1, ASCE New York. [Google Scholar] [CrossRef]
  9. Oumeraci, H.; Klammer, P.; Partenscky, H. Classification of breaking wave loads on vertical structures. J. Waterw. Port Coast. Ocean Eng. 1993, 119, 381–397. [Google Scholar] [CrossRef]
  10. Peregrine, D.H. Water-wave impact on walls. Annu. Rev. Fluid Mech. 2003, 35, 23–43. [Google Scholar] [CrossRef]
  11. Cuomo, G.; Allsop, W.; Bruce, T.; Pearson, J. Breaking wave loads at vertical seawalls and breakwaters. Coast. Eng. 2010, 57, 424–439. [Google Scholar] [CrossRef] [Green Version]
  12. Boccotti, P.; Arena, F.; Fiamma, V.; Romolo, A.; Barbaro, G. A small scale field experiment on wave forces on upright breakwaters. J. Waterw. Port Coast. Ocean. Eng. 2012, 138, 97–114, ASCE. [Google Scholar] [CrossRef]
  13. Oumeraci, H.; Kortenhaus, A.; Allsop, W.; de Groot, M.; Crouch, M.; Vrijling, H.; Voortman, H. Probabilistic Design Tools for Vertical Breakwaters; Balkema: Lisse, The Netherlands, 2001; pp. 1–373. [Google Scholar]
  14. Cooker, M.J.; Peregrine, D.H. Pressure impulse theory for liquid impact problems. J. Fluid Mech. 1995, 297, 193–214. [Google Scholar] [CrossRef]
  15. Wood, D.J.; Peregrine, D.H.; Bruce, T. Wave impact on a wall using pressure impulse theory. I: Trapped air. J. Waterw. Port Coast. Ocean Eng. 2000, 126, 182–190. [Google Scholar] [CrossRef]
  16. Chena, X.; Hofland, B.; Molenaar, W.; Capel, A.; Van Gent, M.R.A. Use of impulses to determine the reaction force of a hydraulic structure with an overhang due to wave impact. Coast. Eng. 2019, 147, 75–88. [Google Scholar] [CrossRef]
  17. Arena, F.; Romolo, A.; Malara, G.; Fiamma, V.; Laface, V. Response of the U-OWC Prototype Installed in the Civitavecchia Harbour. In Proceedings of the 37th International Conference of Offshore, Mechanics and Arctic Engineering, Madrid, Spain, 17–22 June 2018. OMAE2018-78762. [Google Scholar]
  18. Pawitan, K.A.; Dimakopoulos, A.S.; Vicinanza, D.; Allsop, W.; Bruce, T. A loading model for an OWC caisson based upon large-scale measurements. Coast. Eng. 2019, 145, 1–20. [Google Scholar] [CrossRef]
Figure 1. (a) The small-scale U-OWC breakwater at NOEL laboratory (off the beach at Reggio Calabria, eastern coast of the Strait of Messina) during a sea storm with the realization of an impact load on the structure; (b) Cross- of the U-OWC caisson equipped with pressure transducers (1–18); (c) Three-dimensional overview of the small-scale experiment at NOEL laboratory.
Jmse 11 00019 g001aJmse 11 00019 g001b
Figure 2. Flow chart of the methodology applied for the analysis of data on small-field experiment.
Jmse 11 00019 g002
Figure 3. Example of the three conditions of wave loads F on the U-OWC breakwater versus time instant t (related to the peak period T p ): (a) a quasi-standing wave; (b) a slightly breaking wave F max / F 2 p e a k = 2.48 and (c) an impact load F max / F 2 p e a k = 10.18 , recorded at NOEL.
Jmse 11 00019 g003
Figure 4. Example of complete time series of the wave force, with the occurrence of the three cases of wave loads: (a) Quasi-Standing: (b) Slightly Breaking; (c) Impact Load.
Jmse 11 00019 g004
Figure 5. Average wave pressure distribution of the greatest N/1.000 and N/100 positive force peaks F ˜ ( t ) of “Quasi-Standing waves” (a), of “Slightly Breaking waves” (b) and of “Impact Loads” (c).
Jmse 11 00019 g005
Figure 6. Scheme of Goda’s model applied to U-OWC breakwater.
Jmse 11 00019 g006
Figure 7. Pressure distributions of each of the greatest N/1.000 positive force peaks F ˜ ( t ) for “Quasi-Standing waves” versus Goda’s model.
Jmse 11 00019 g007
Figure 8. Pressure distributions of each of the greatest N/1.000 positive force peaks F ˜ ( t ) for “Slightly Breaking waves” versus Goda’s model.
Jmse 11 00019 g008
Figure 9. Pressure distributions of each of the greatest N/1.000 positive force peaks F ˜ ( t ) for “Impact Load waves” versus Goda’s model.
Jmse 11 00019 g009
Disclaimer/Publisher’s Note: The statements, opinions and data contained in all publications are solely those of the individual author(s) and contributor(s) and not of MDPI and/or the editor(s). MDPI and/or the editor(s) disclaim responsibility for any injury to people or property resulting from any ideas, methods, instructions or products referred to in the content.

