1. Introduction
The understanding of wave overtopping phenomena of new, damaged and upgraded harbor breakwaters is fundamental to assess their hydraulic performances and the resulting port operability and safety conditions, even more if the effects of climate change on coastal areas (e.g., sea level rise, intensification of extreme marine events) are considered.
Mean wave overtopping discharge and maximum wave overtopping volume are usually employed to evaluate the acceptability of the breakwater performances. Additionally, state-of-art prediction formulas of the mean wave overtopping discharge are widely used to design the crest level of the structure. However, such traditional formulas are affected by several intrinsic uncertainties, mainly due to their empirical nature. Moreover, experimental measurements in laboratory tests refer only to newly built structures, and do not consider low overtopping discharge values [
1].
For instance, Stagnitti et al. [
2] demonstrated that traditional formulas for the prediction of mean wave overtopping discharge may fail in representing the hydraulic response of non-conventional damaged and upgraded rubble-mound structures, with estimates up to 300 times higher and 0.9 times lower than the observed values for low and high-energy sea states, respectively. As a consequence, the use of traditional formulations for the probabilistic assessment of the performances of damaged and upgraded rubble-mound breakwaters may cause under or over-estimation of the failure probability of the structure due to excessive mean wave overtopping discharge by up to 70% [
3].
Therefore, the importance of performing specific laboratory tests to investigate wave overtopping of harbor breakwaters arises clearly, above all when dealing with non conventional damaged and upgraded structures [
4]. However, technical and economic limits make the implementation of extensive experimental campaigns difficult. In this context, numerical models represent a valid tool to extend experimental datasets, because after an initial calibration they allow the simulation of a huge number of forcing conditions and structure geometries with limited costs and times [
5,
6,
7]. For example, starting from one or a few physical model tests used to validate the numerical model, the latter might be used to much more easily test different combinations of structure geometries, forcing conditions and seabed topography [
8,
9].
Reliable numerical wave overtopping results can be obtained only if properly calibrated numerical models are employed. In this regard, the setup of rubble-mound breakwaters numerical models is particularly challenging. Indeed, such a kind of structure is made up by several different porous layers, which are necessary to ensure the proper dissipation of wave energy while concurrently preventing wave transmission and reflection. The physical features of such layers have a relevant influence on the response of the breakwater to wave attack, which makes it necessary to use a modeling approach that adequately represents them [
10].
Flow through porous media is often modeled using a macroscopic approach, which considers each porous layer as a single volume homogeneously defined by its macroscopic features. This approach is relatively fast and does not require a complex geometrical description of the structure, in contrast with the more accurate and much slower microscopic approach, which needs detailed information about element size distribution inside the layers [
11,
12]. However, the macroscopic approach can only solve the volume averaged interaction between flow and porous media, and it requires a complex procedure to evaluate some key parameters of the porous layers, such as the friction parameters [
13].
The Volume-Averaged Reynolds-Averaged Navier-Stokes equations (VARANS) are a set of equations that can be efficiently used to apply the macroscopic approach [
11]. The terms of the extended Forchheimer equation appear in the VARANS, where they represent the loss of energy by friction occurring inside the porous layers. A few methods have been proposed to evaluate the Forchheimer parameters, but the most extensively used in coastal engineering are the van Gent equations [
13,
14]. In turn, these equations contain friction parameters that, to this day, because of the lack of a more efficient method, are still calculated with a long trial and error approach based on the comparison with physical model tests results [
15].
The lack of a relationship to calculate the friction parameters prevents from estimating the errors that their miscalculation could cause, and until now the relevance of their correct estimate has not been investigated yet [
13]. Nonetheless, the inaccurate parameter evaluation might significantly affect the prediction of the overtopping discharge made by macroscopic numerical modeling. For example, an increase in the friction inside the armour layer could reduce the ability of the wave to penetrate inside the layer, thus enhancing run-up and overtopping.
In the present work, a damaged cross-section of the Catania harbor breakwater (Sicily, Italy) was analysed using a bidimensional macroscopic VARANS numerical model. The model was implemented in the software OpenFOAM (v1806), where the solver ihFoamV1 was used, and it was validated by comparison with the results of physical model tests carried out by Stagnitti et al. [
16,
17]. Nine simulations were carried out, each one with a different value of the turbulent friction parameter
assigned to the armor layer of the structure, and the overtopping discharge was calculated in each simulation.
The objective was to assess the sensitivity of VARANS numerically estimated rubble-mound breakwater overtopping discharge to the armor layer value of van Gent parameter .
In the following paragraphs the numerical model is first described in terms of governing equations, grid resolution and modeled breakwater (
Section 2). Then, the features of the carried out simulations are illustrated (
Section 3). The results of the simulations are then presented (
Section 4) and discussed (
Section 5), and, finally, some conclusive remarks are drawn (
Section 6).
2. Numerical Model
The solver ihFoamV1, implemented by Higuera et al. [
11] for the software OpenFOAM (v1806), was used to solve the coupling between the RANS and the VARANS equations, with the Re-Normalisation Group (RNG)
k-
turbulence model [
18,
19]. The VARANS are obtained by adding the extended Forchheimer equation to the RANS, and then by averaging them over the volume of the porous layer [
11].
The extended Forchheimer equation reads as follows:
where
I is the hydraulic gradient,
t is the time,
u is the water velocity, and
a,
b and
c are coefficients that need to be calculated. Coefficients
a and
b are calculated as suggested by van Gent [
20]:
where
and
are the friction parameters,
is the water density,
n is the layer porosity,
is the dynamic viscosity of water,
is the mean nominal diameter of the layer elements,
is the Keulegan-Carpenter number,
is the period of oscillation and
is the maximum oscillatory velocity.
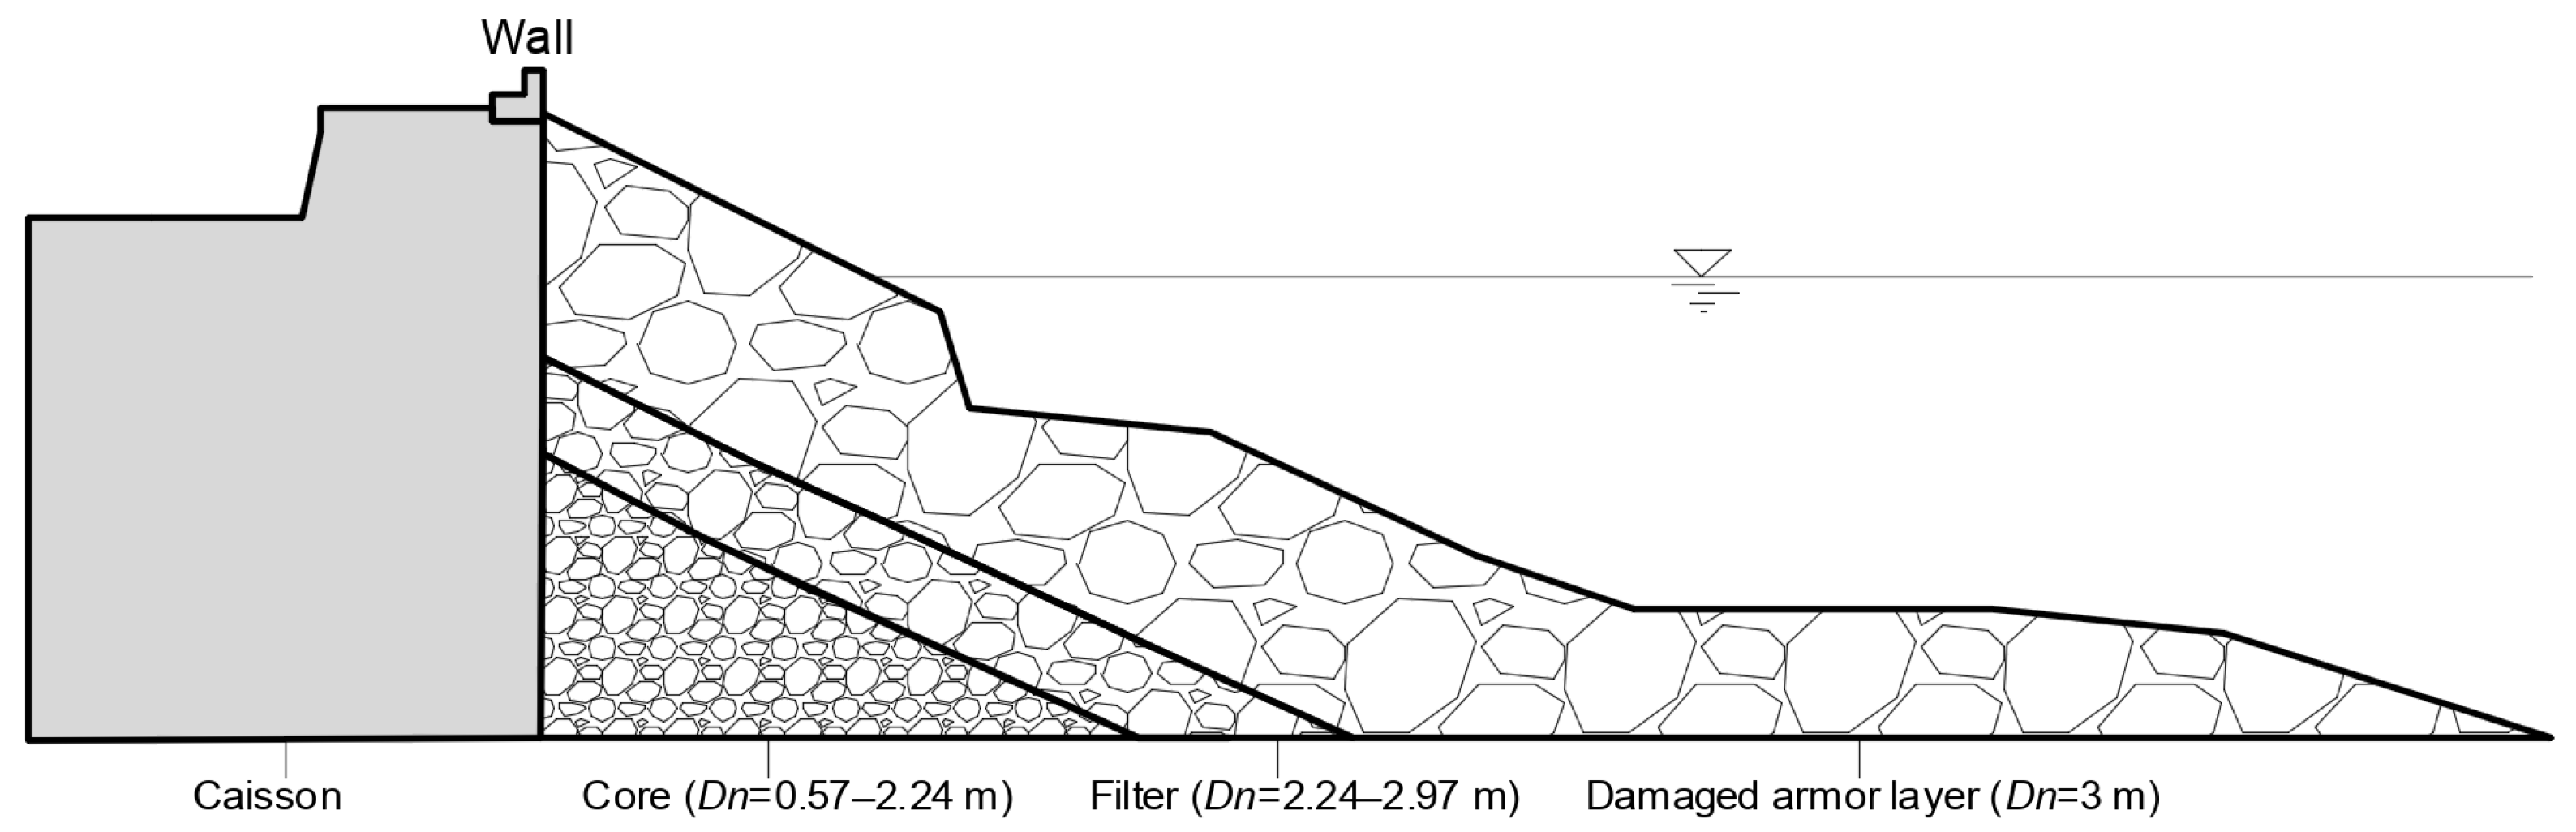
The model was set up to study the most exposed cross-section of the Catania harbor breakwater, whose armor layer is severely damaged.
Figure 1 shows a sketch of the cross-section of the breakwater, where the sign of past damage is represented by the irregularities of the armour layer. The structure is composed of the following porous layers: a core made up by quarry rocks with a nominal diameter (
) in the range 0.57–2.24 m; a filter made up by natural rocks with
in the range 2.24–2.97 m; and an armour layer made up by 62 t cube-shaped concrete blocks (
m). The height of the top wall is 8.50 m above Still Water Level (SWL), and the water depth at the toe of the structure is 19.00 m [
17].
The computational domain was 310 m long and 40 m high, whereas the computational grid was made up by about 185,000 vertexes and about 95,000 cells. The dimension of each cell in the x-direction and z-direction was kept uniform, equal to 50 cm and 26 cm respectively. The solver ran in parallel on 6 Intel® Xeon® Silver 4241 2.20 GHz processors, and the ratio between the computing time and the simulated time was about 40.
The incident waves on the structure had a significant height of 6.65 m, a peak period of 11.37 s, and an average offshore wave length of about 200 m, which correspond to the 100 years return period wave climate affecting the Catania harbor breakwater [
17]. Active wave absorption was used to avoid contamination of the wave signal that would otherwise be caused by the reflection of the waves at the paddle [
21].
Given the long computational time, the duration of the simulations was optimized so as to balance the computational time with the accuracy of the measurement of the mean overtopping discharge. To this aim, the influence of the simulation duration on the non-dimensional mean overtopping discharge
was investigated. The latter is defined by the following formula:
with
q being the mean overtopping discharge per unit width of structure,
g the gravitational acceleration, and
the significant height of the incident wave.
Moreover, the percentage variation of
was also considered:
where
and
are two consecutive simulation lengths evaluated, with
s.
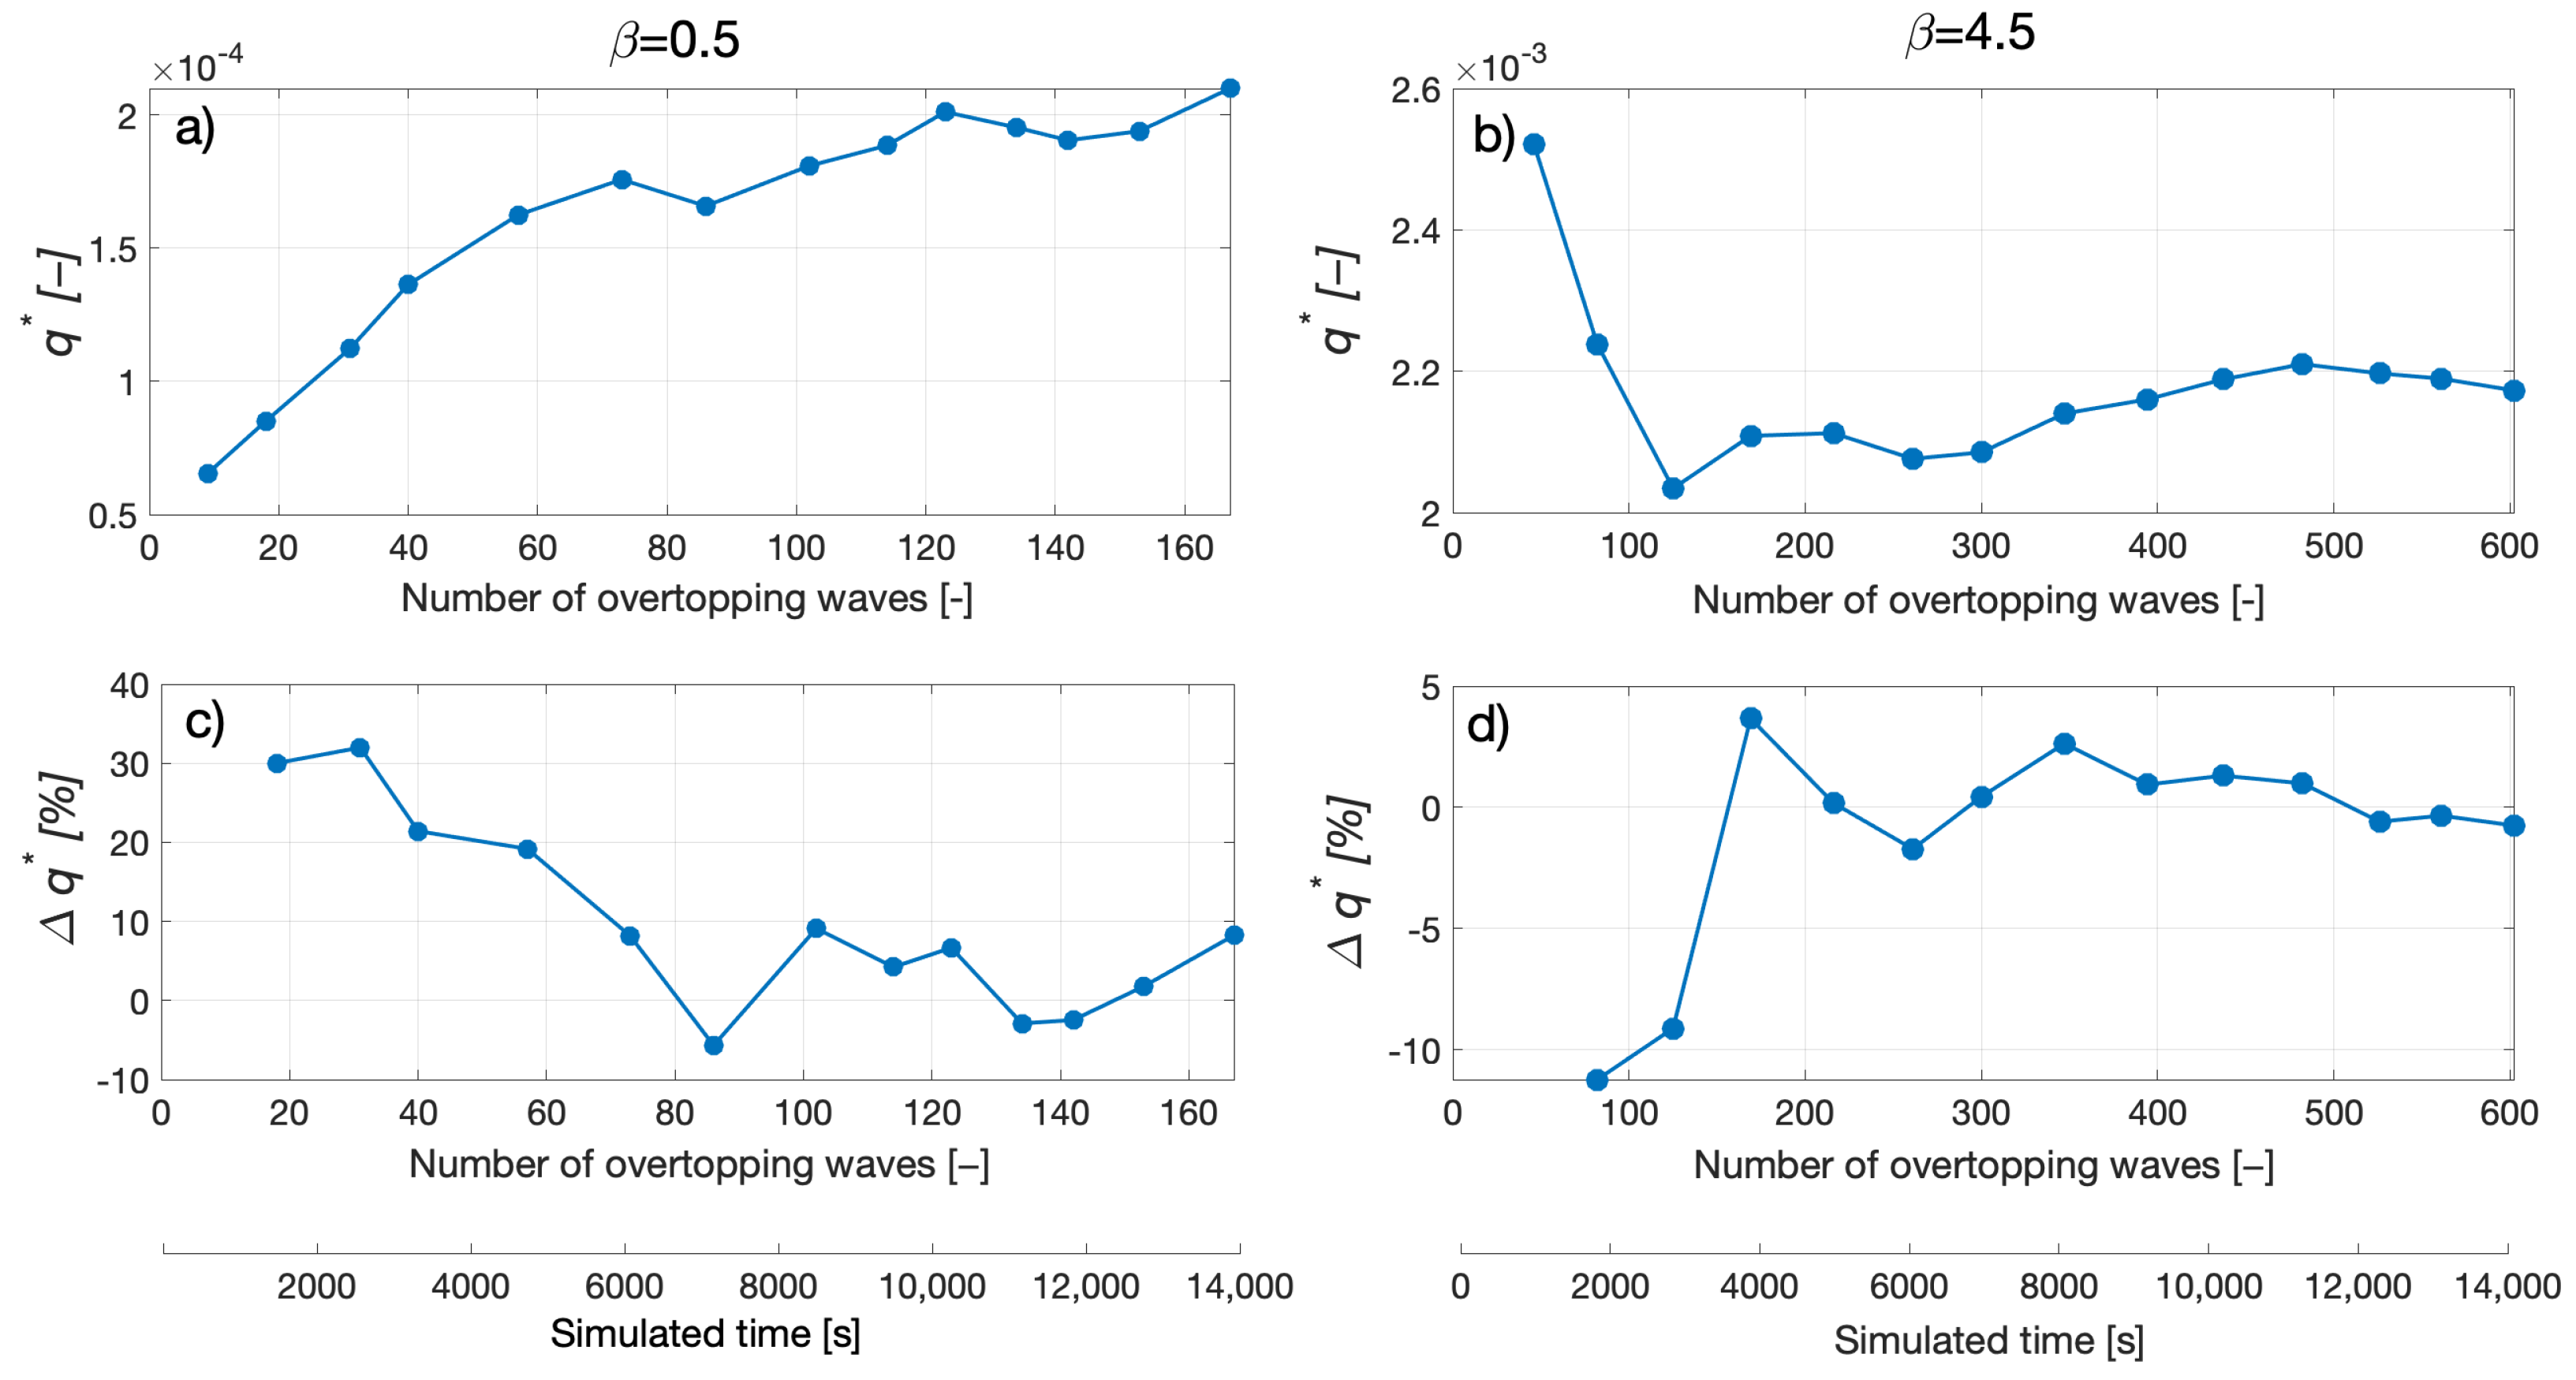
Figure 2 shows the variation of the estimated mean overtopping discharge against the simulation length and against the number of overtopping waves when the value of
is 0.5 (a) and when the value of
is 4.5 (b). The corresponding percentage variations
are also shown when
(c) and when
(d).
It can be noticed that when
there is a much larger number of overtopping waves compared to when
. An estimate of the sensitivity of the overtopping discharge to the value of
is the purpose of the present work, and it will be discussed in detail in
Section 4. However, this phenomenon also affects the computational time. Indeed, when
the value of
is easily contained between ±5%, so that the simulation of about 4000 s, corresponding to about 150 overtopped waves, can be considered enough to get a stable value of
. Differently, when
, it is necessary to simulate about 13,000 s to cause the overtopping of 150 waves and to keep the value of
between ±10%.
For the reasons described above, the simulation of 150 overtopping waves was considered enough to get a stable value of . Therefore, for different values of , the number of overtopping waves used to calculate was always the same, but the simulations duration was different, leading to different values of the non-dimensional mean overtopping discharge .
3. Simulations
The use of the extended Forchheimer equation (Equation (
1)) and the van Gent equations (Equations (
2) and (
3)) implies the need to evaluate the parameters
,
and
c.
Parameter
takes into account linear friction effects, being more relevant in laminar flows, whereas parameter
takes into account non-linear friction effects, being more important in the presence of turbulent flows [
14]. In harbor defense structures, the armour layer is the most relevant porous layer of the structure, since it has the greatest influence on the overtopping discharge. At the same time, due to the blocks dimension, the wave-induced flow inside the armour layer can be assumed to be fully turbulent. This allows to neglect the influence that a variation in
might have on the overtopping discharge [
13].
Parameter
c takes into account the inertial effects due to the dynamic nature of the phenomenon, and in typical coastal engineering applications a value of 0.34 can be assumed to be adequate for all the layers [
22].
For the above-mentioned reasons, the present work focused on the effect of a variation in the value of the parameter
of the armour layer on the mean overtopping discharge. Therefore, for such a layer the value of
was varied between 0.5 and 4.5 with steps of 0.5, in order to explore the range of values found in literature for similar types of structures [
13]. The value of
of the remaining internal layers was instead fixed equal to 0, whereas in all the layers the values of
c and
were fixed equal to 0.34 and 5000, respectively, the latter being consistent with what is used in literature for similar types of structures [
13].
4. Results
The performance of the breakwater is represented by the value of the mean non-dimensional overtopping discharge, defined as in Equation (
4), and it was tested for different values of the parameter
of the armour layer.
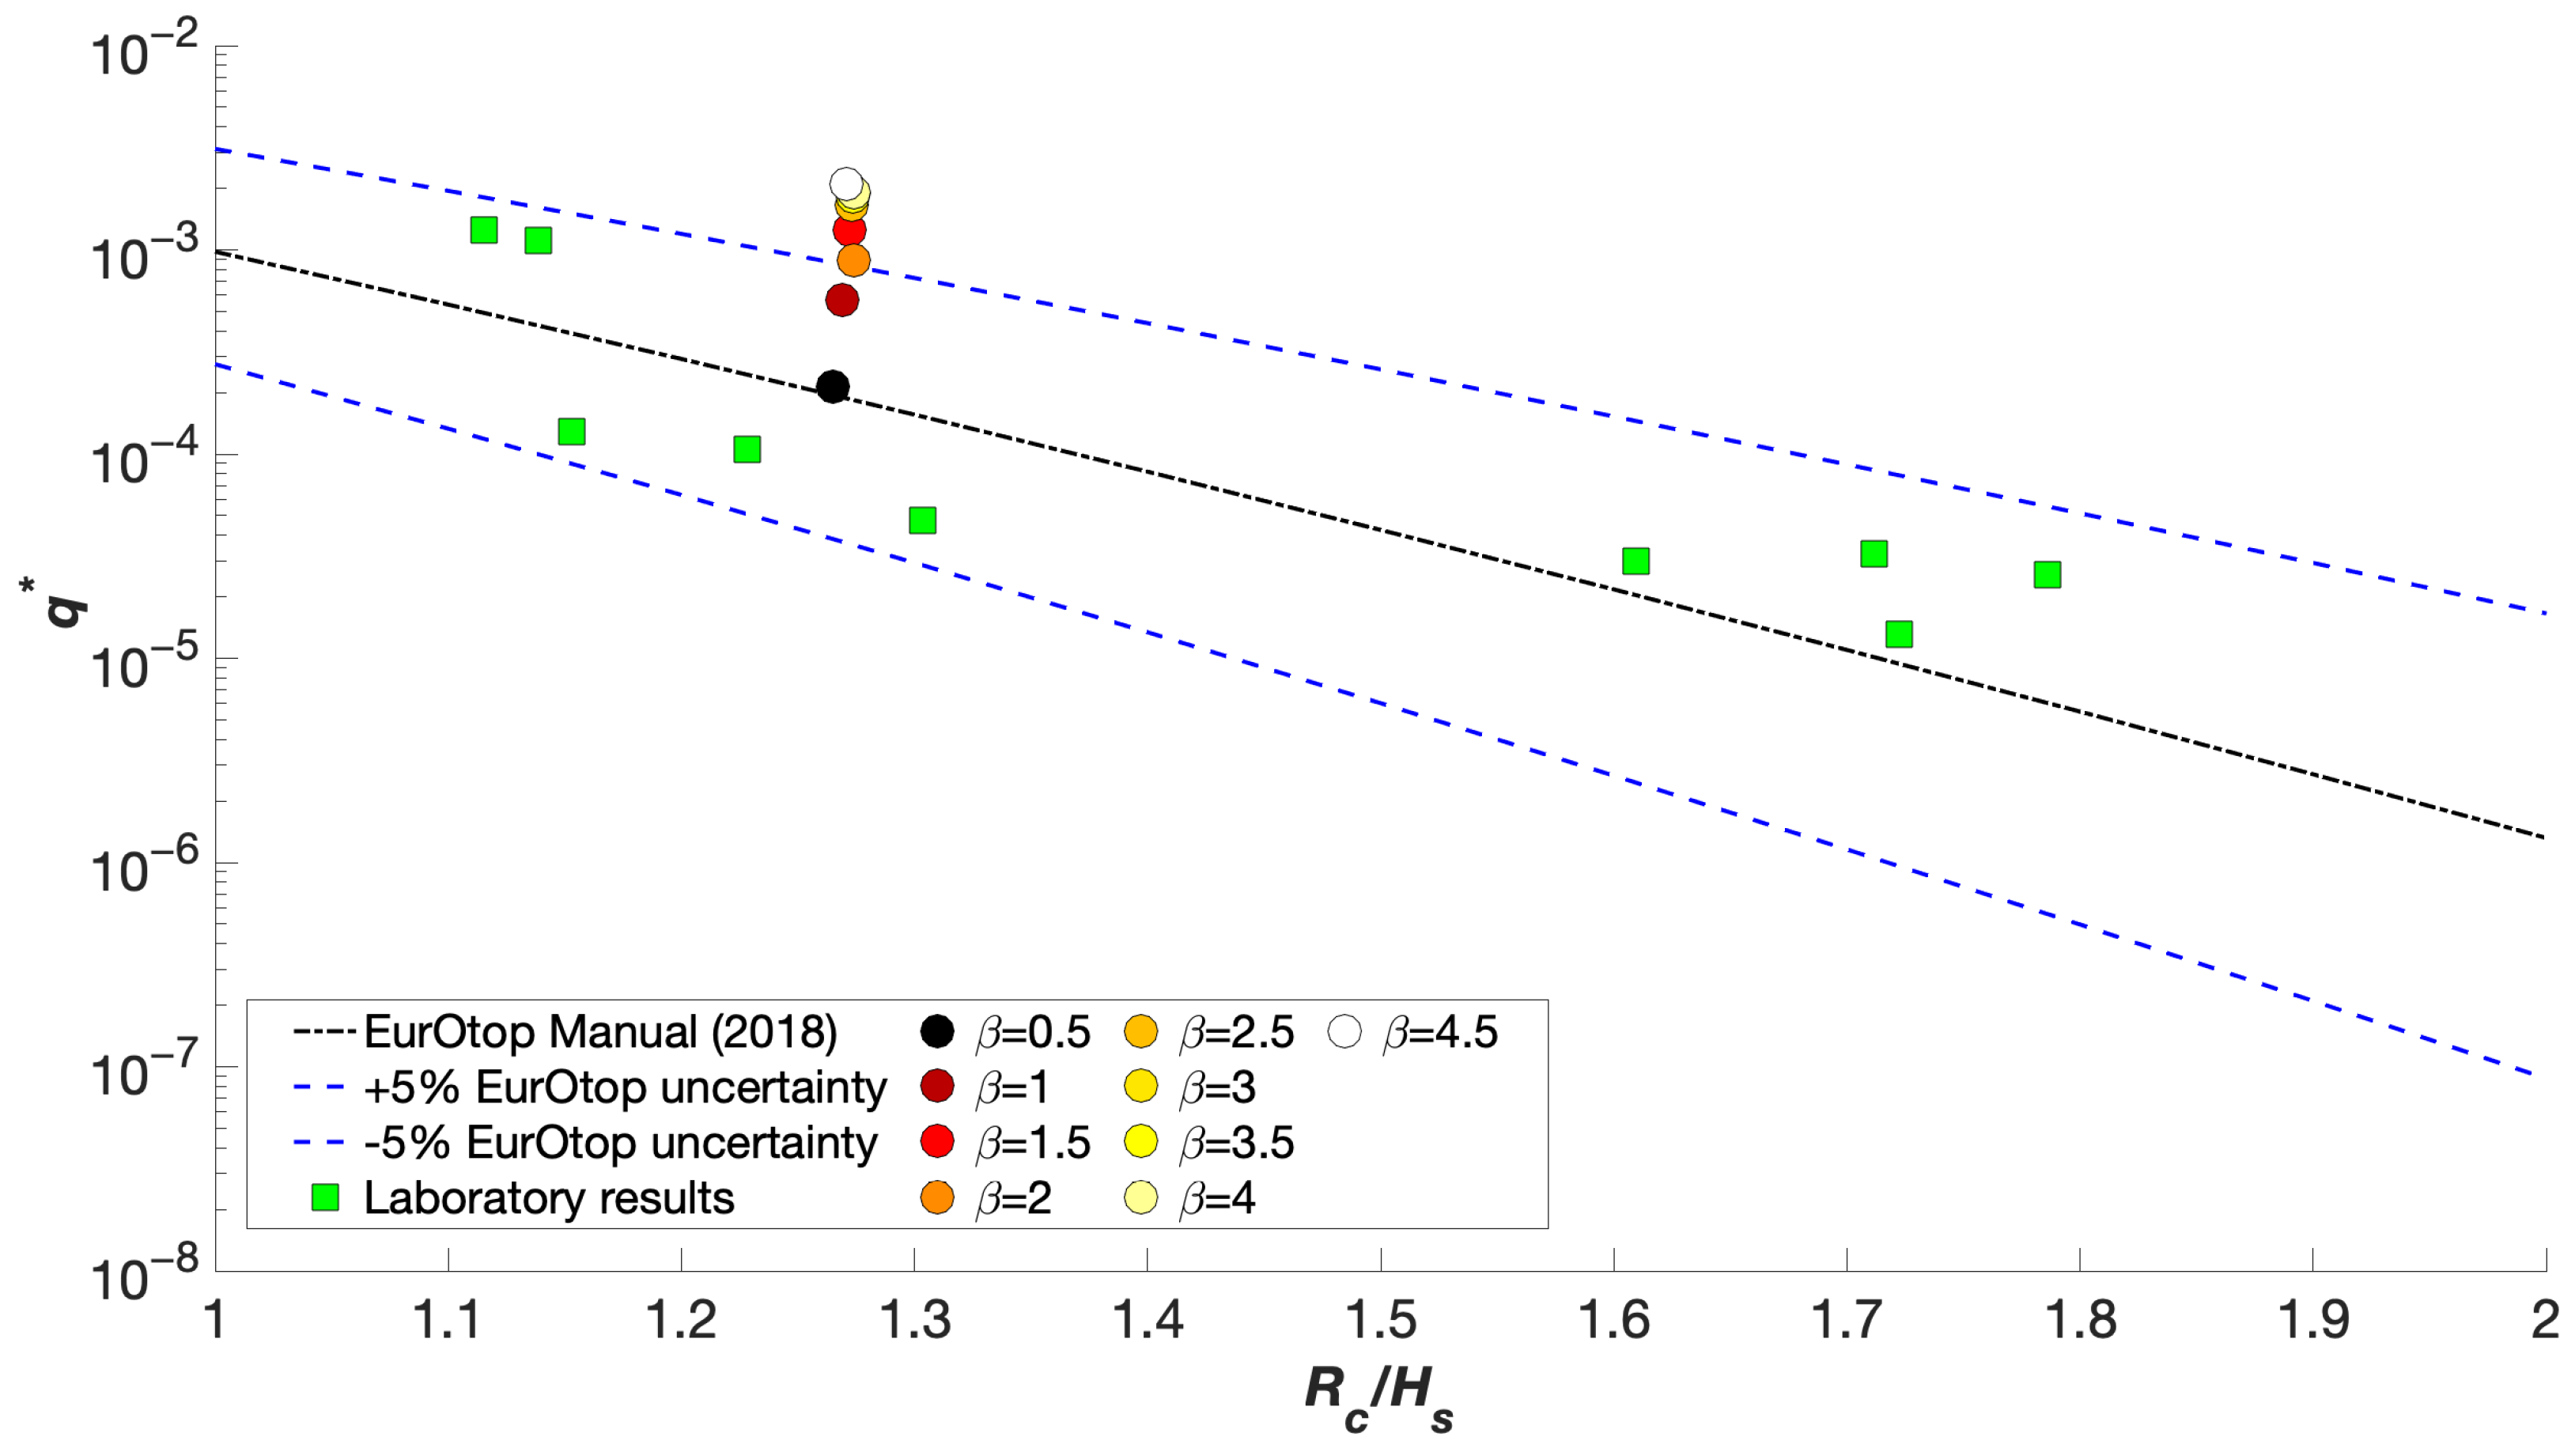
Figure 3 shows the value of
against the ratio between the height of the structure above the mean water level (
) and the significant wave height (
). The non-dimensional mean overtopping discharge is shown for all the values of
considered in the numerical model and for all the physical model tests carried out by Stagnitti et al. [
16]. The physical model tests considered 5 different wave conditions, including the 100 years return period used in the numerical model, and each wave condition was tested three times [
16].
The value of
predicted by the EurOtop Manual [
1] and the relative confidence interval are also shown.
The physical model results are dispersed over a wide range of , and that is because of the different wave conditions tested, and also because in laboratory tests it is not possible to perfectly replicate the same conditions multiple times, so that even the three-tests groups that have the same wave conditions show some dispersion. On the contrary, numerical models allow a very stable wave conditions generation, which results in the numerical values being very well aligned along a single value of .
The comparison in
Figure 3 shows the validation of the physical and numerical model (for different values of
), and their overall consistency with the EurOtop formula. It is possible to notice a relevant influence of the value of
on the results of the numerical model. In order to clarify such an influence,
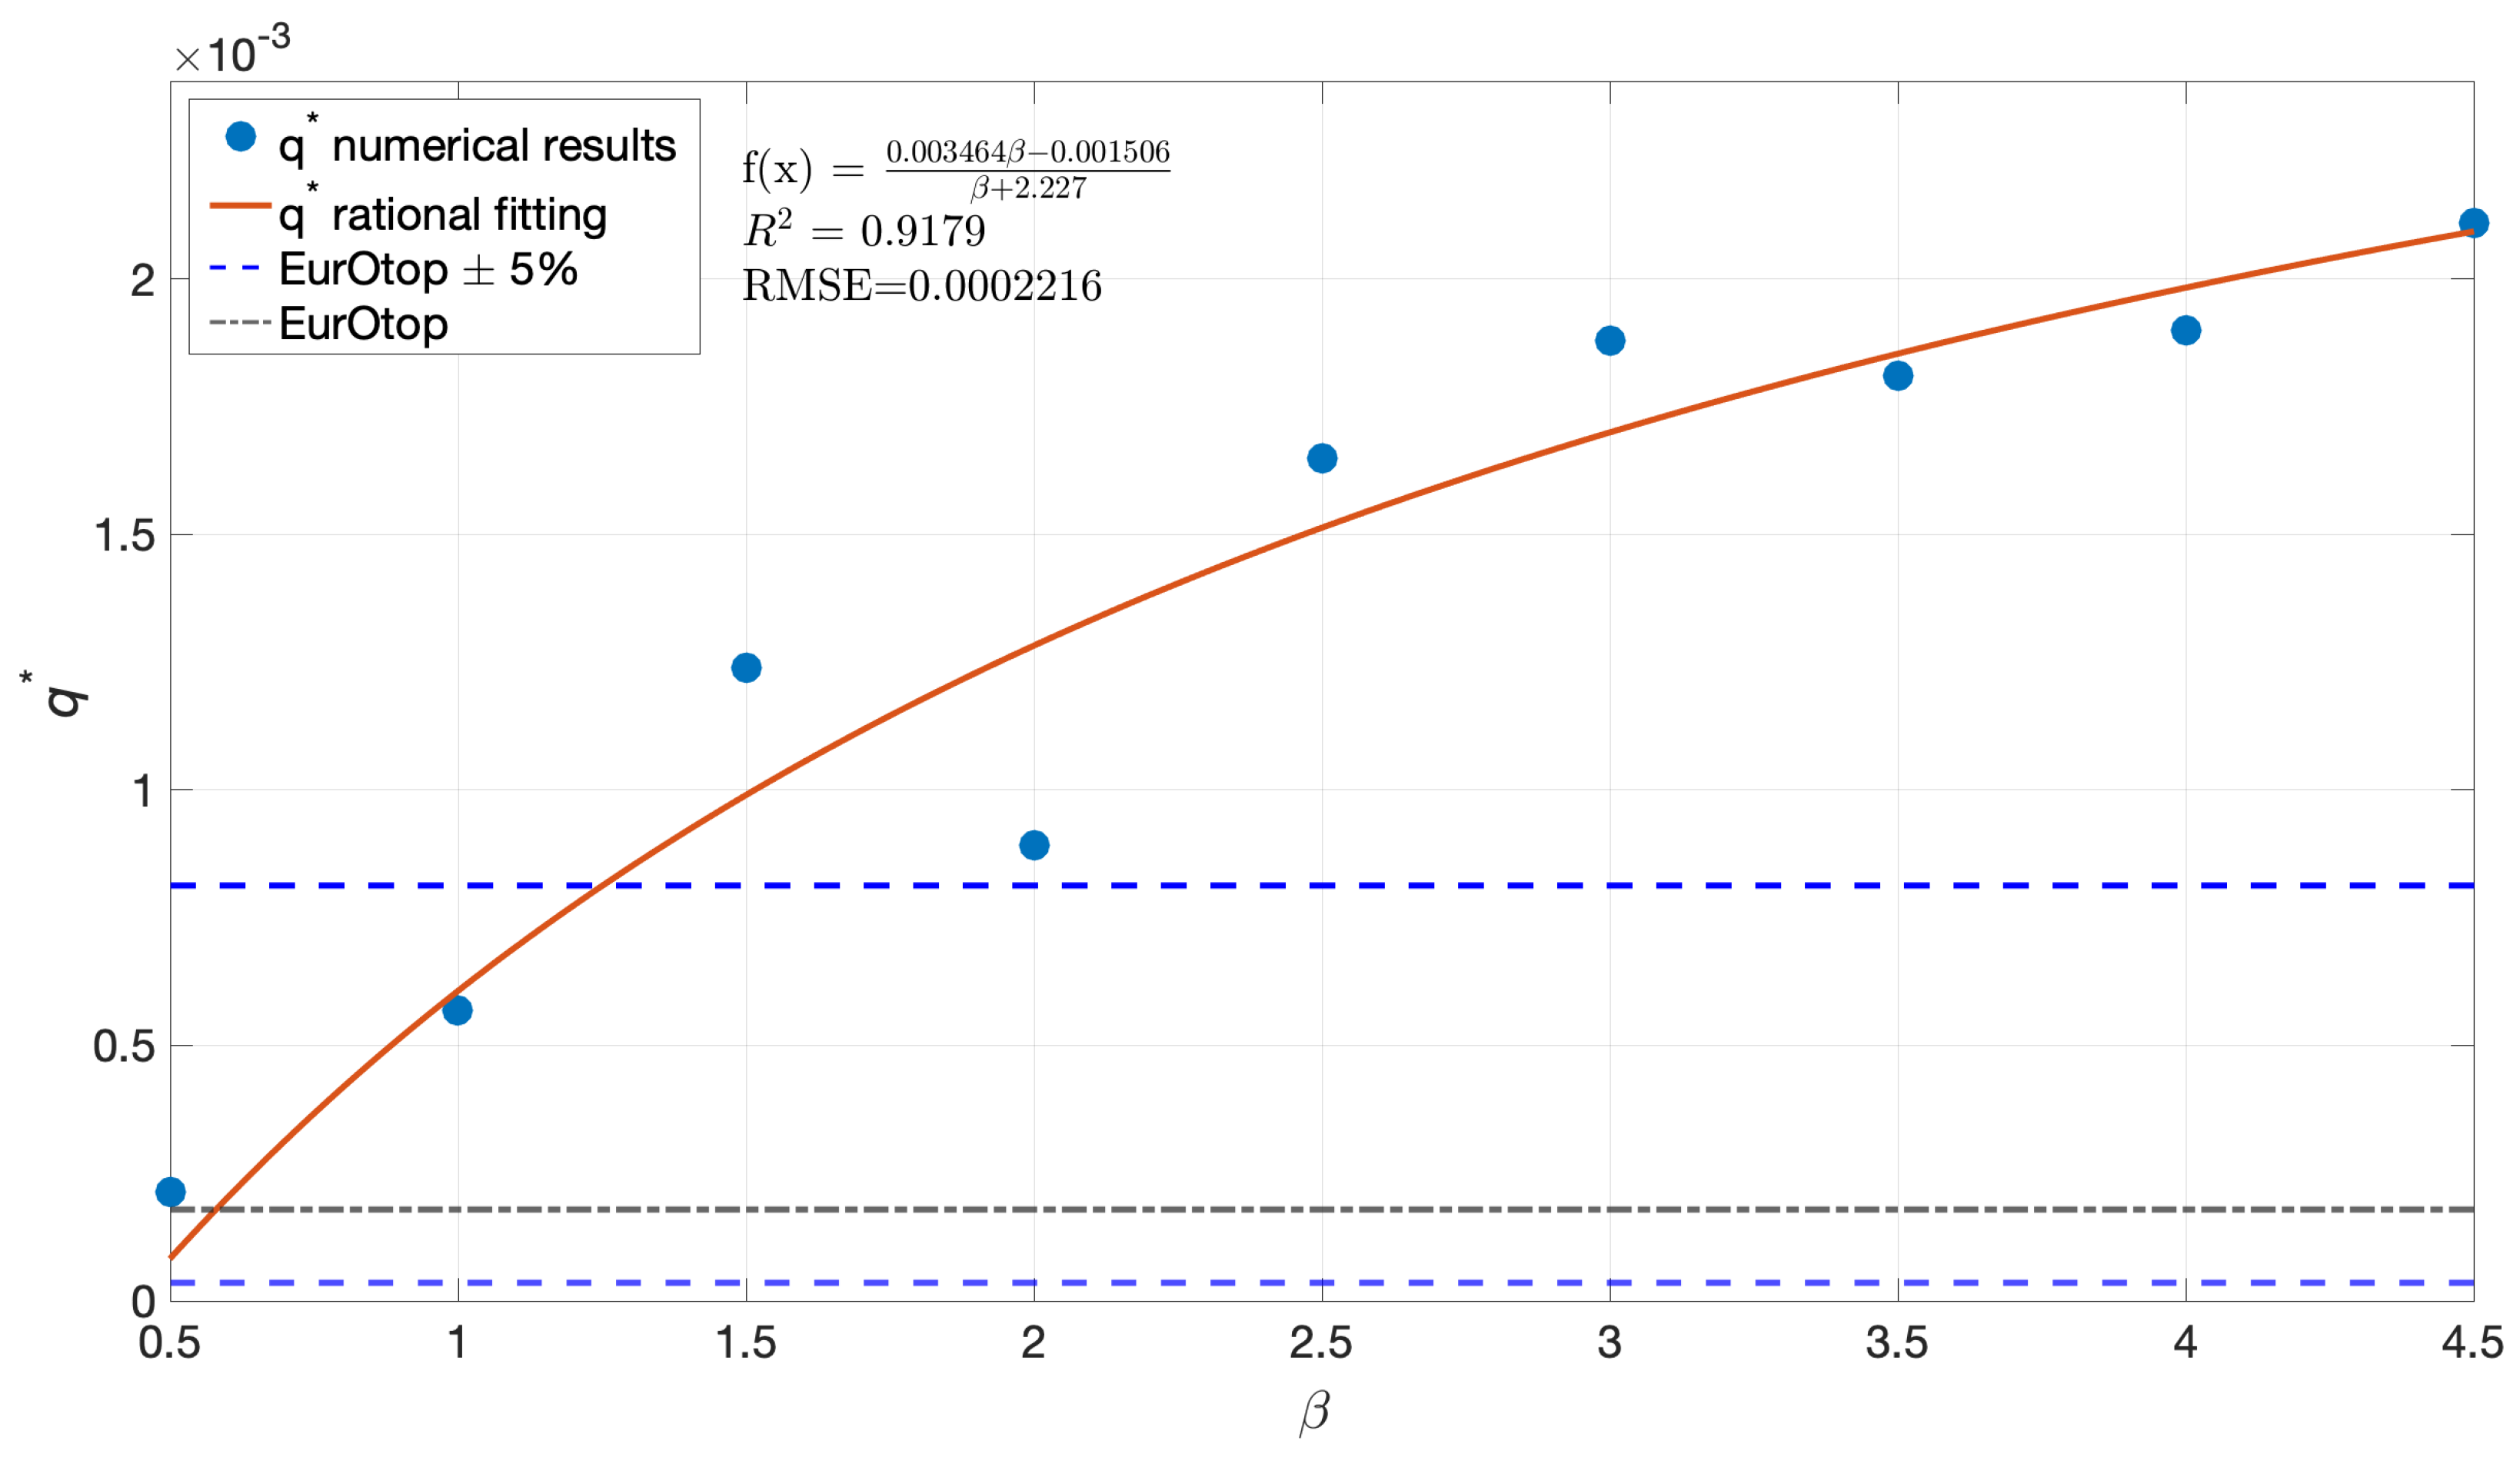
Figure 4 shows the numerical
against the corresponding
.
The results reveal that the estimate of increases with parameter , and that the mean overtopping discharge is consistent with the one predicted by the EurOtop formula only for low values of (0.5–1).
The fitting of a rational law to the data is shown to help visualize the trend, and it is consistent with the expected asymptotic behaviour for increasing values of
. Indeed, the increase in the overtopping discharge when
increases is physically understandable: if
increases, the friction inside the porous layer also increases, which means that the wave finds it more difficult to permeate the layer, and, as a consequence, the run-up behavior is intensified. Theoretically, if
were infinite, the armour layer could be expected to behave like a wall, since the resistance offered to permeation would be infinite (i.e., the water would not be able to enter the layer). As mentioned in
Section 1, even if this qualitative result could be expected, its magnitude had not been investigated before.
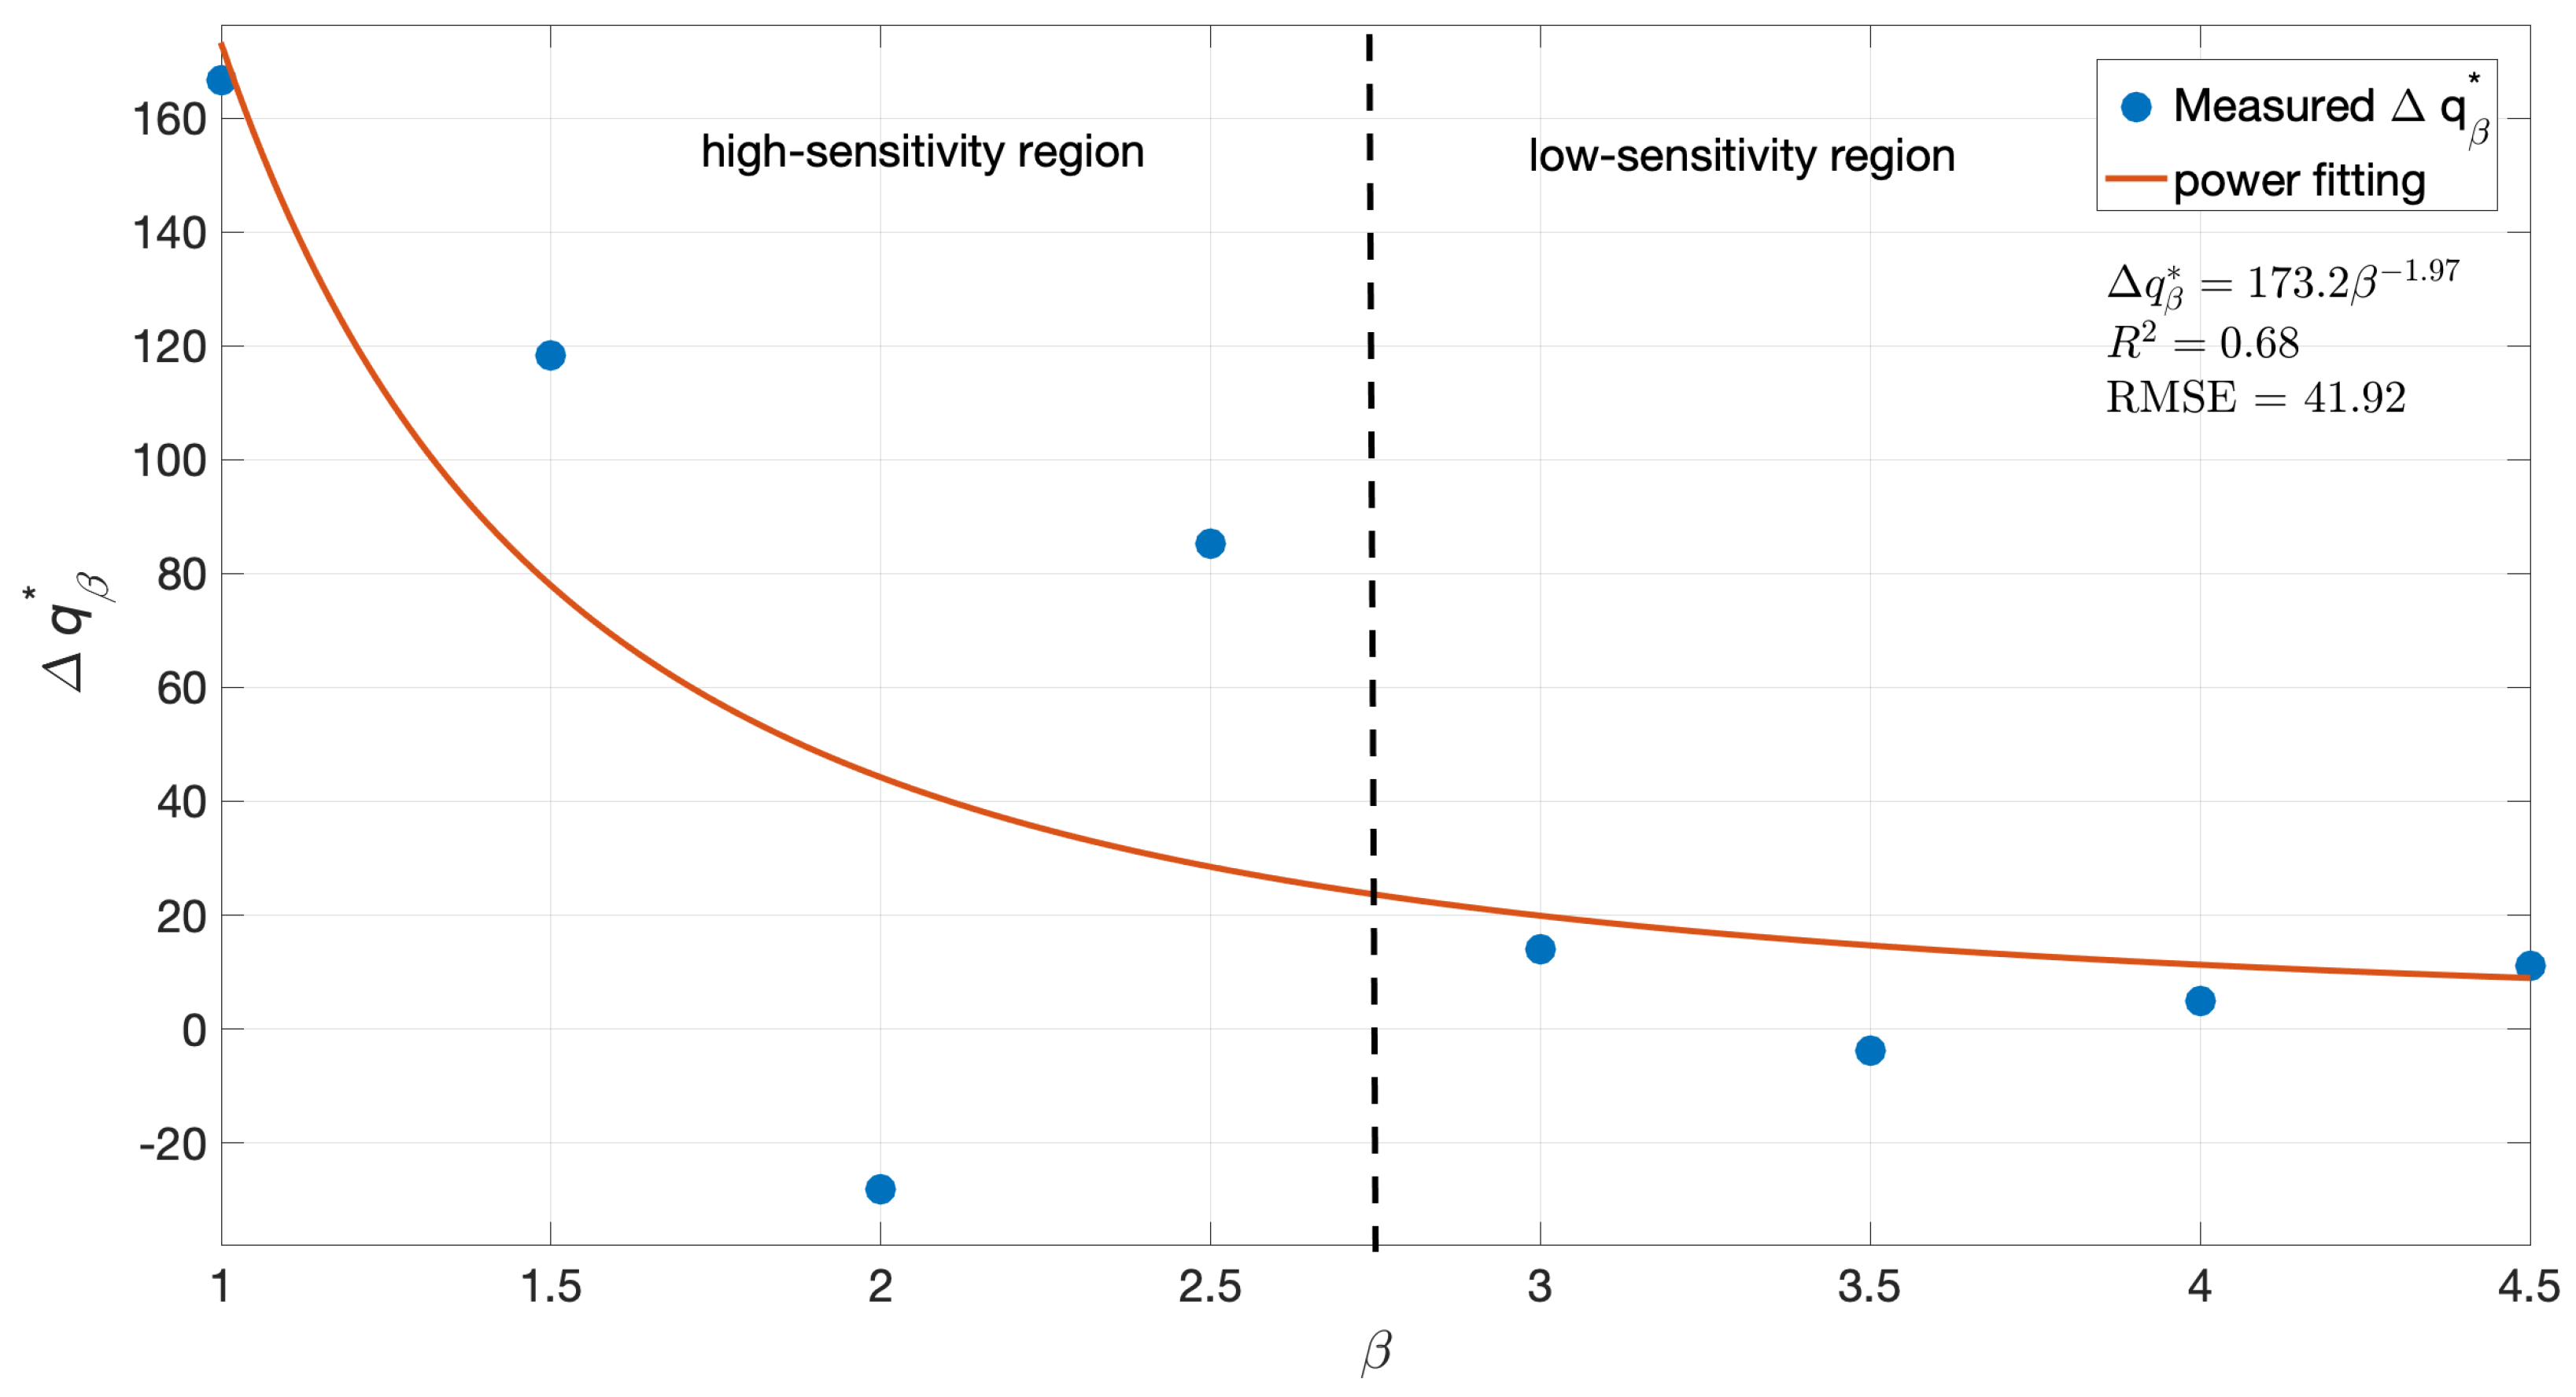
To better quantify the relevance of the overtopping discharge increase, it is useful to consider the relative change of
as
increases. To this end, the percentage change
is defined as:
where
is the value of
obtained with a generic value of
, whereas
is the value of
obtained with a value of
.
Figure 5 shows the value
against the value of
. Just like in the previous figure, a parametric curve was fitted to the data to help visualize the trend. In this case a power law was used for the fitting, consistent with the x-axis being an horizontal asymptote. Indeed, for increasing values of
its effect on the overtopping discharge should decrease, and the percentage change should then become closer and closer to zero.
A very relevant change in
is observed for the lower values of
(1–2.5). For
the results become more stable. The high sensitivity region of
includes the values of
that are more consistent with the EurOtop formula (see
Figure 3). This proves that an inaccurate estimate of
can have a significant impact on the results. The fitting line is sometimes very far from the data, which show a sort of undulating behavior. The reason of such a behaviour is believed to be the relatively short simulation duration, which was chosen in order to have a tolerable computational time. Indeed,
Figure 2 showed that variations in the overtopping discharge up to
are still observed for the chosen number of overtopped waves (i.e., 150). Such random variations of
add to the deterministic ones caused by the changing value of
, but they are not relevant enough to prevent from drawing conclusion about the sensitivity analysis. The effect described above emerges more clearly in
Figure 5, but it is also present in
Figure 4, where it is less evident due to the use of an absolute scale.
The results shown above prove that, for the case study under exam, the calibration of the armour layer’s friction parameter
required a comparison with empirical formulas or physical model results. In particular, considering the uncertainties discussed in
Section 1 about empirical formulas when dealing with damaged structures or with low overtopping discharge values, the comparison with physical model results was actually necessary. Therefore, the slow trial and error approach currently used to calibrate the friction parameters seems to be justified and necessary, considering that an estimate of their values based only on literature consultation could very easily lead to a large miscalculation of the overtopping discharge.
5. Discussion
The results of the present study greatly encourage the effort to find a faster and more efficient method to calibrate the friction parameters. Indeed, considering the growing reduction in computational times and the good results obtained when the parameters are properly calibrated, the great opportunities offered by numerical modeling lead to more and more applications [
23]. A growing focus on parameter calibration can be observed in recent research works, concerning for example: uniform caisson structures and simple breakwater layouts [
24], rubble-mound breakwaters [
15], composite caissons having an internal rubble mound [
25], and perforated breakwaters [
23]. The present work contributes by quantitatively assessing the influence of the turbulent friction parameter on the modeling of the overtopping performance of a damaged rubble-mound breakwater.
Previous contributions can work as helpful guides when dealing with similar cases study, reducing the time and computational effort. However, the calibration procedure still depends on trial and errors and on the comparison with physical model results, which make the overall process very burdensome, even if methods involving machine learning are used (e.g., [
15,
23]), because they require a large number of validated numerical simulations with long computational times. Furthermore, the great variety of port and coastal porous structures limits the usefulness of site specific applications, and calls for a more general approach. Indeed, there is still a large uncertainty concerning the physical factors affecting the friction parameters. Lara et al. [
26] suggested they depend both on flow and structure characteristics, such as Reynolds number, porosity, wave conditions, shape of the components of the structure, etc. Furthermore, the friction parameters might have a different relevance when different structure performances are considered (e.g., run-up, overtopping, reflection, pressures) [
24,
27]. For example, in the present work we have demonstrated that values of
larger than 2.75 have only a minor influence on the mean wave overtopping discharge. Therefore, an effort parallel to the analysis of specific cases study should be addressed toward a better physical understanding of the friction phenomenon. This is necessary to develop a more general calibration approach (e.g., physical laws tying the friction parameters to the feature of the porous structure/layers).
In this context, the results obtained in the present work suggest a future research direction to explore. Indeed, given the observed high sensitivity of the overtopping discharge to the friction parameter of the armour layer, the mean overtopping discharge could act as guide to choose the value of . For example, by extending the present work to a large variety of cases study, it might be possible to define a robust law expressing the non-dimensional overtopping discharge as a function of the sea state, of some key structure features, and of the friction parameters. Then, it would be possibile to choose the values of the friction parameters that allow to obtain the real overtopping discharge, calculated using empirical formulas or physical model tests. This procedure could avoid the long computational time required by the many numerical simulations necessary to calibrate the parameters’ value or to train machine learning models.
6. Conclusions
Numerical modeling of port and coastal defence structures has undergone many improvements in the latest years, and it already offers many opportunities and advantages in research and design activities. Nevertheless, there are still many challenges to overcome, in particular when dealing with the modeling of wave-induced flows through porous media. Rubble mound breakwaters, being composed of many porous layers with different properties, are affected by such limitations. An approach often used in modeling is the VARANS macroscopic approach. One specific challenge of this approach is the need to calibrate the value of some parameters responsible for the energy dissipation occurring inside the porous layers due to friction phenomena. The estimate of these parameters is currently done by means of a slow procedure based on the comparison with the results of physical model tests, but their actual influence on the numerical performance of the structures had not been investigated yet.
In the present work, a bidimensional VARANS numerical model based on the solver IhFoamV1 of the software OpenFOAM (v1806) was used to study the performance of a damaged cross-section of the Catania harbor rubble-mound breakwater. The breakwater had previously been investigated also by means of physical model tests, which were here used for the numerical model validation.
Given that the most relevant friction parameter in coastal engineering is often the van Gent parameter , in the present study the numerical model was used to estimate the overtopping discharge of the breakwater when using different values of the parameter assigned to the armour layer. The purpose was to assess the influence of such parameter on the accurate estimate of the overtopping discharge made by macroscopic numerical modeling, as well as to verify the need to use the slow trial and error approach currently used for its validation.
It was observed, for ranging between 0.5 and 2.75, that a variation of of 0.5 can be enough to cause a change in the estimated value of the overtopping discharge of about 150%. Hence, a small inaccuracy (smaller than –) in the estimate of can significantly affect the output of the model. However, values of larger than 2.75 have only a minor influence on the assessment of the mean wave overtopping discharge.
The results of the present study highlight the need for a faster and more efficient method to calibrate the friction parameters. In particular, despite the growing interest in new approaches to parameter calibration, more research should be dedicated toward building a better physical knowledge of the friction phenomenon, so as to develop calibration approaches that can more easily be adapted to the great variety of existing port and coastal porous structures, by taking into account their specific structural features and wave conditions. Specifically, given the high sensitivity of the overtopping discharge to the friction parameter of the armour layer, it could be useful to extend the present analysis to a large variety of cases study, in order to build a relationship between the non-dimensional overtopping discharge, the sea state, the structure features and the friction parameters. Such a relationship could allow to use a single known overtopping discharge to predict the proper values of the friction parameters without the need to carry out long calibration procedures.


