Article

Effects of the Carbon Intensity Index Rating System on the Development of the Northeast Passage

1
Department of Shipping Technology, National Kaohsiung University of Science and Technology, Kaohsiung 805, Taiwan
2
Department of Marine Engineering, National Taiwan Ocean University, Keelung 202, Taiwan
*
Author to whom correspondence should be addressed.
J. Mar. Sci. Eng. 2023, 11(7), 1341; https://doi.org/10.3390/jmse11071341
Submission received: 7 June 2023 / Revised: 29 June 2023 / Accepted: 29 June 2023 / Published: 30 June 2023
(This article belongs to the Special Issue Marine Renewable Energy and the Transition to a Low Carbon Future)

Abstract

:
For many years, the Suez Canal (also known as the Suez Route) has been the main route connecting Europe and Asia. However, compared with the Suez Route, the Northeast Passage could save up to 41% of the journey. The ship carbon intensity index (CII) rating system of the International Maritime Organization (IMO) came into effect in 2023. This study took an existing bulk carrier on the Europe–Asia route as an example to calculate the attained CII values at different sailing speeds. It was found that, regardless of external factors, when the ship speed dropped from 14.4 knots (85% maximum continuous rating (MCR)) to 12.6 knots (55% MCR), the corresponding attained CII value decreased from 6.48 g/ton·nm to 5.19 g/ton·nm. Therefore, sailing speed was the key factor influencing the attained CII value, and it was independent of the shipping distance. In addition, when the ship’s sailing output power was between 85% MCR and 75% MCR, for every 5% decrease in MCR, its attained CII value would decrease by 0.13 g/ton·nm, and the fuel consumption amount would decrease by 1 ton/day. However, when the ship sailed at an output power of 75% MCR to 55% MCR, for every 5% decrease in MCR, the attained CII value would decrease even more, up to 0.26 g/ton·nm. In addition, the attained CII value would be reduced by up to 100% and fuel consumption amount would be reduced by up to 1.5 ton/day, resulting in a 50% fuel saving effect. Therefore, to obtain a better CII rating, the optimal ship speed should be set between 75% MCR and 55% MCR according to the wave and wind strengths. However, although slow-speed sailing is the most efficient factor, the number of sailing days would also be extended. Through the ratio created by dividing the distance of the Northeast Passage by the Suez Route, whether the Northeast Passage has the benefit of balancing shipping schedules could be judged. The outcome indicated that a ratio lower than 1 would result in a more balanced shipping schedule. Compared with 2019, the number of ships sailing through the Northeast Passage in 2021 increased significantly by 132%, and the average dead weight tonnage of the ships also rose from 18,846 tons to 23,736 tons. This study found that, with the implementation of the carbon reduction policy of the CII rating, ships sailing through the Northeast Passage could continue to develop toward the trend of large-sized vessels and steady increase in ship number.

1. Introduction

Carbon dioxide (CO2), methane (CH4), nitrous oxide (N2O), sulfur hexafluoride (SF6), and chlorofluorocarbons (CFCs) are the main compounds of greenhouse gases (GHGs1‘) [1,2]. It is generally accepted that CO2 can affect the climate for at least a hundred years. Some even considers that the burning of fossil fuels is the main source of CO2 emissions in the atmosphere [1], and that its effects on the climate can last for hundreds or thousands of years [3,4]. Therefore, reducing CO2 emissions is currently the most direct and feasible way to mitigate future climate change [5]. About 20% of total CO2 emissions come from transport [2]. According to the estimate of the International Maritime Organization (IMO), the GHG produced by shipping accounts for about 2.5% of the total global GHG, of which CO2 is the main component. CO2 emissions account for about 96% [6,7] of the total GHG emissions from shipping and are equivalent to 3% of total CO2 emissions worldwide [8]. The CO2 produced by international merchant ships accounts for about 85% of the total CO2 emissions from shipping [9]. Therefore, how to effectively reduce the carbon emissions of ships has become an important task for the International Maritime Organization (IMO). In 2018, the Marine Environment Protection Committee (MEPC) of the IMO adopted the Initial IMO Strategy on the Reduction of GHG Emissions from Ships, thereby formally committing the shipping industry to the global climate plan and pushing to reduce greenhouse gas emissions from international shipping as soon as possible. Its specific objectives [10] include the following:
  • reducing the carbon intensity of shipping by at least 40% from 2008 levels by 2030;
  • cutting greenhouse gas emissions to 50% of 2008 levels and cutting the carbon intensity by at least 70% of 2008 levels by 2050.
This initial strategy established the vision for the reduction in greenhouse gas emissions from ships and has become the guiding principle and framework for such reductions [11]. In order to effectively achieve the emission reduction target, the IMO has actively researched feasible near-term (2018–2023), medium-term (2023–2030) and long-term (after 2030) carbon reduction plans. The carbon intensity indicator (CII) of the rating system for the energy efficiency existing ship index (EEXI), which was adopted in 2021, came into effect in 2023. It focuses on the following items [12,13,14,15]:
  • CII refers to the weight of CO2 emitted per ton of cargo per nautical mile transported by a ship during the year of operation. It is expressed in g/ton·nm, with “nm” standing for nautical mile.
  • It is applicable to ships with a gross tonnage of 5000 tons or more.
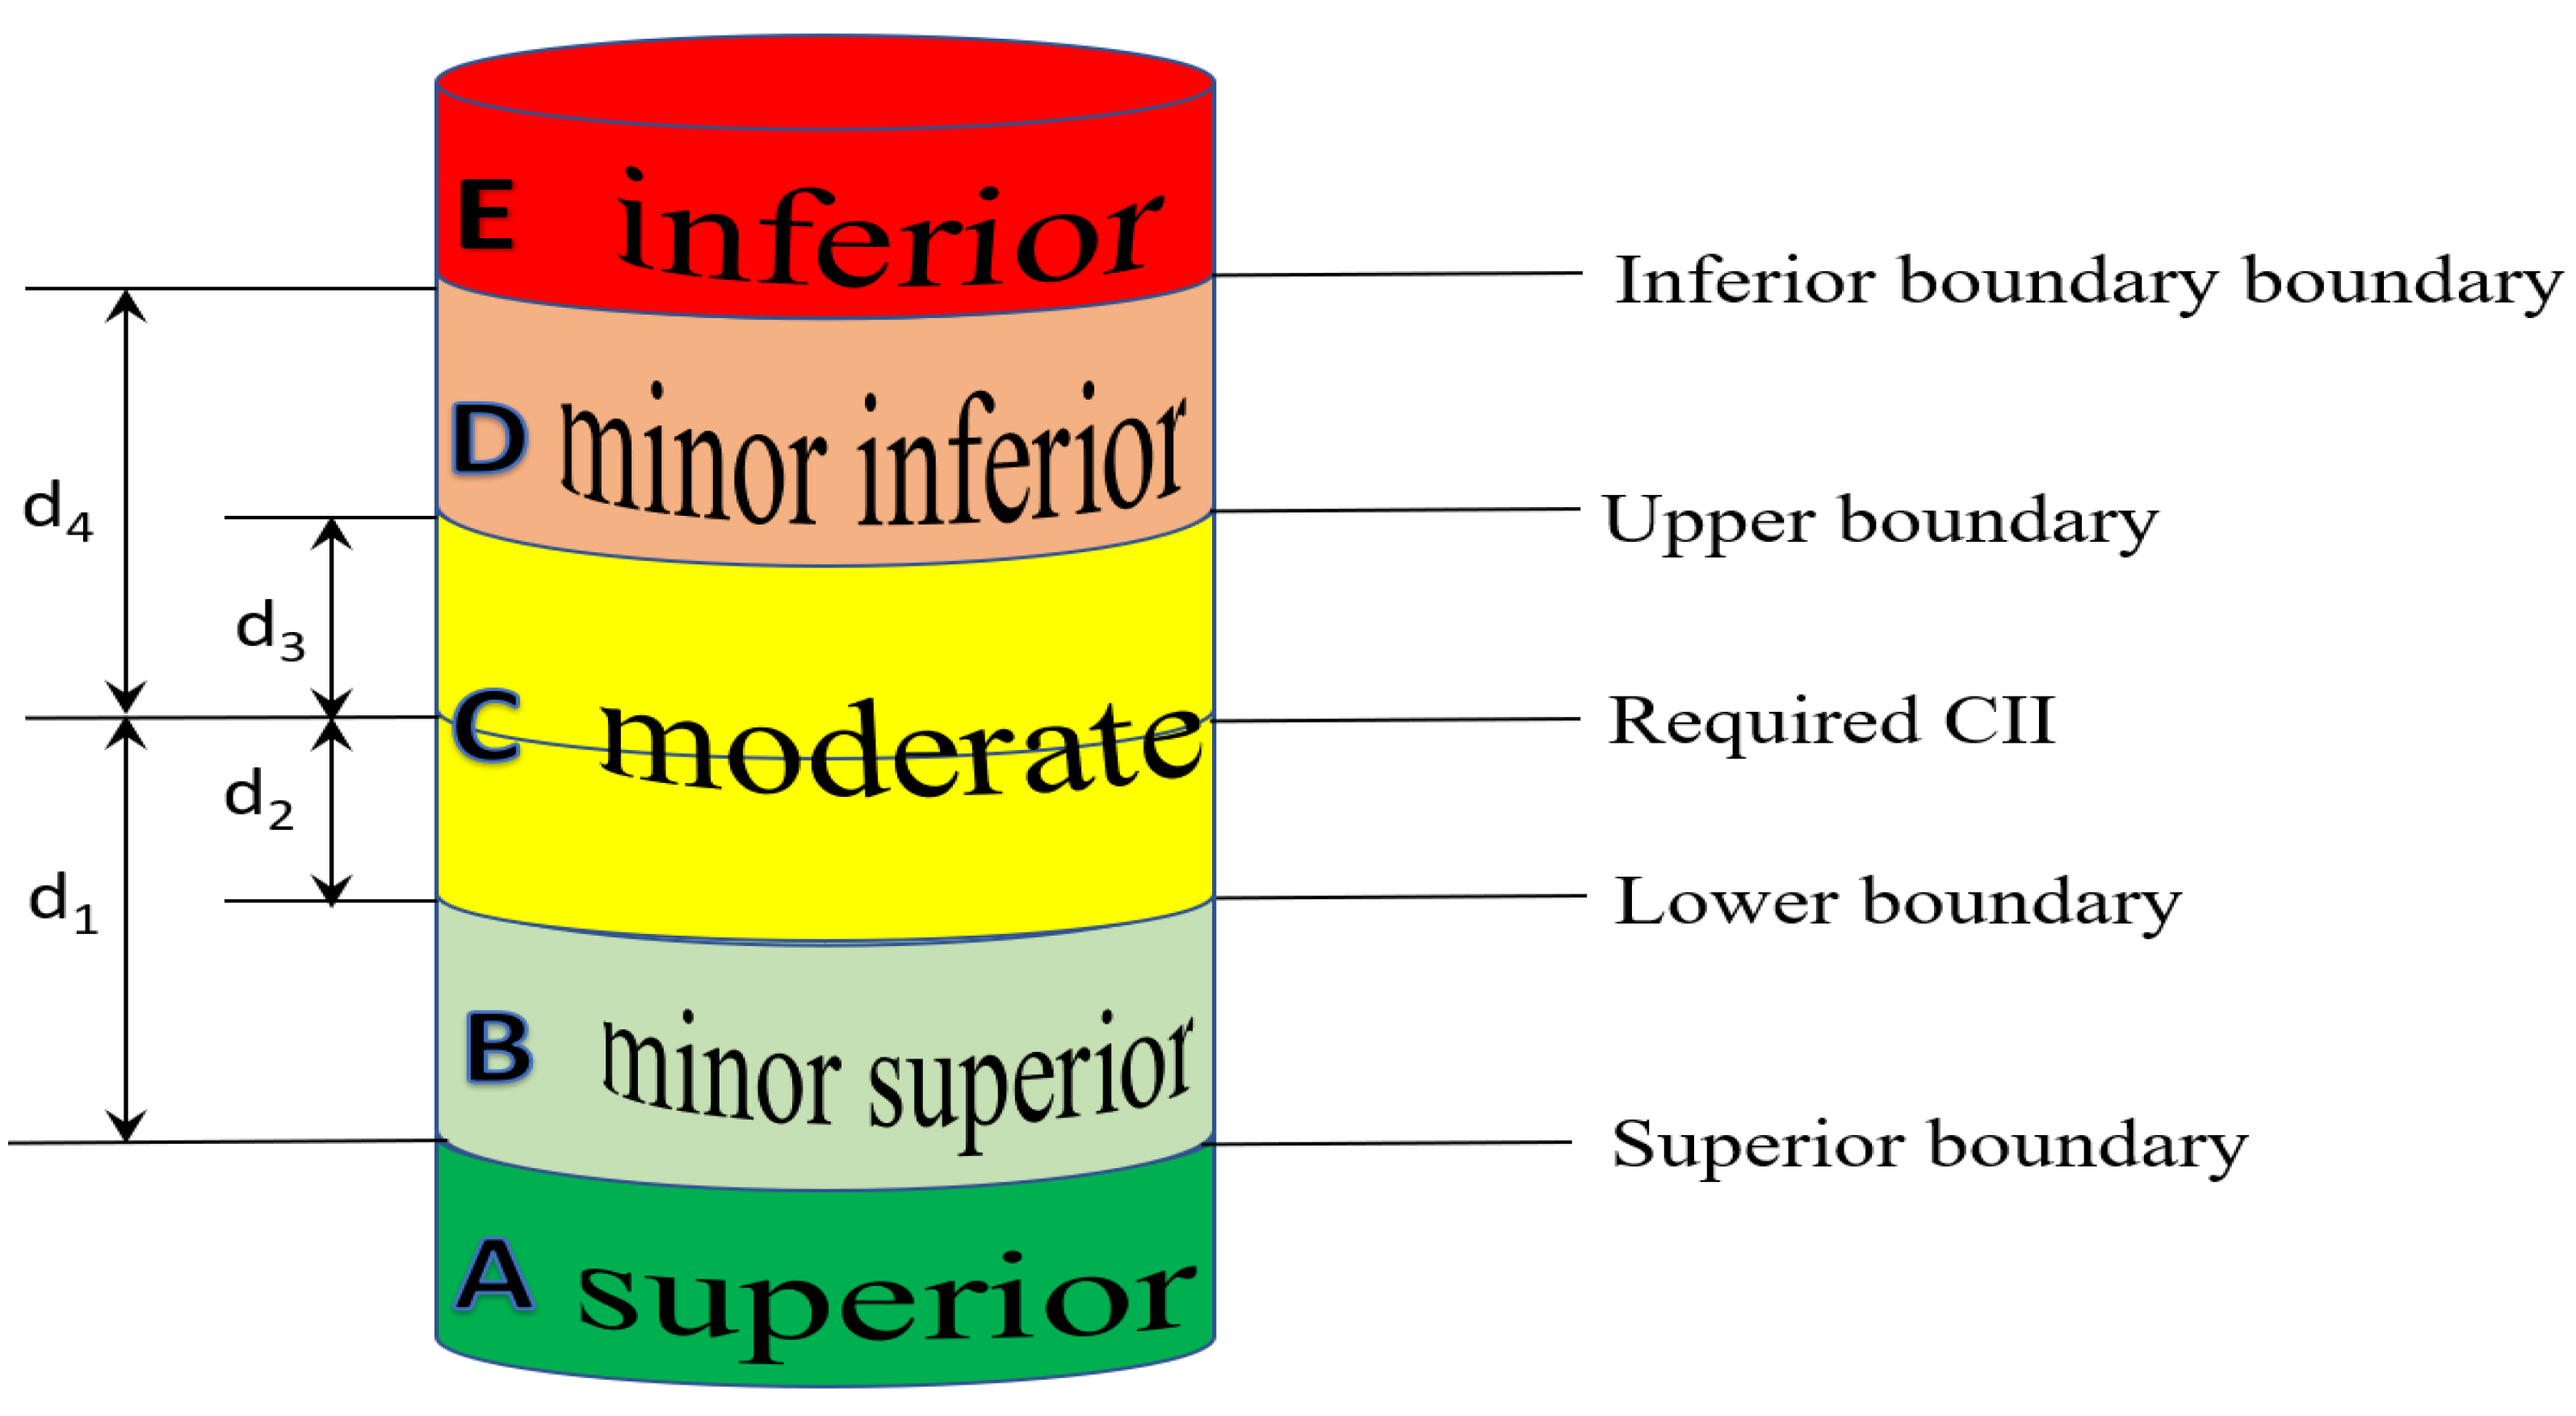
  • It rates ships from A to E in terms of the effectiveness and efficiency of their annual fuel consumption. A is superior, B is minor superior, C is moderate, D is minor inferior, and E is inferior.
  • To obtain the CII rating of a ship, its required CII value in 2019 must be calculated first in accordance with the IMO formula and used as the CII reference line for defining each rating scale [15].
  • In accordance with the IMO formula, the annual attained CII value can be calculated according to the fuel consumption of the ship. The actual rating of the ship can be known according to the rating range in which the attained CII is calculated.
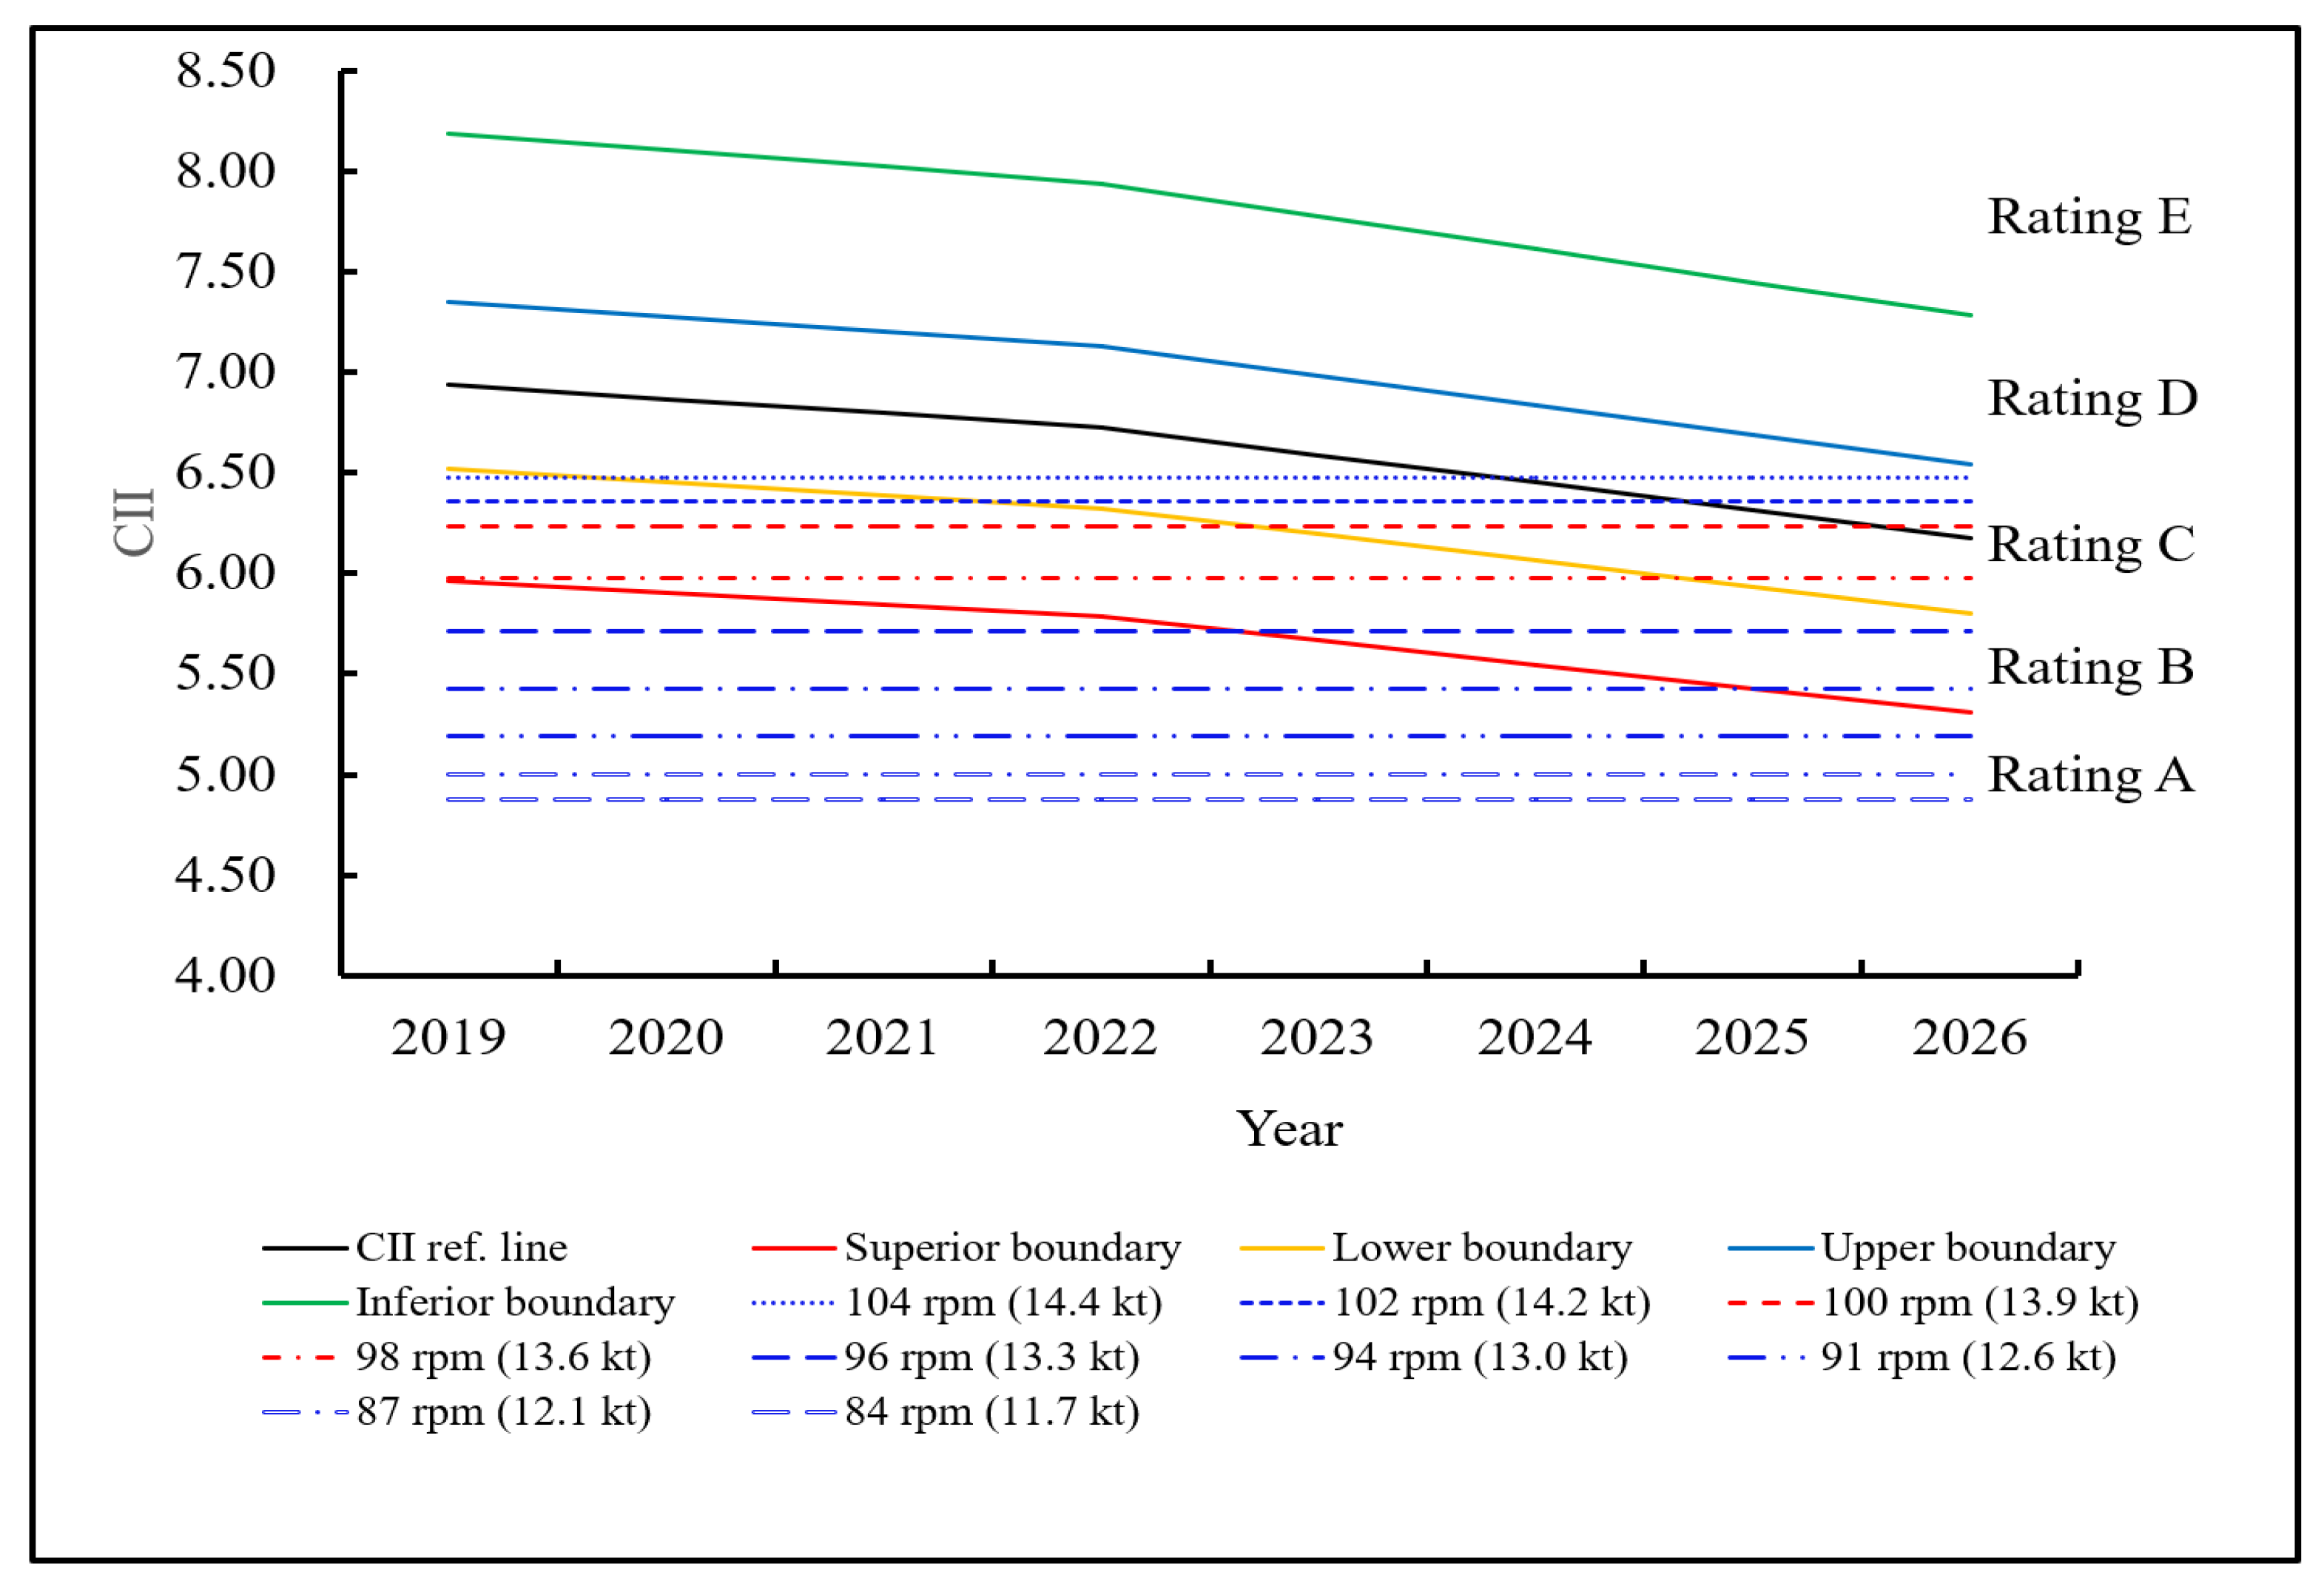
  • However, the above CII reference lines are not fixed and must decrease year by year in accordance with IMO rules [15]; that is to say, the boundaries of each rating will also decrease year by year. As a result, even under the same fuel consumption, a ship may get a lower rating in future years.
Under IMO’s energy efficiency existing ship index (EEXI) and CII systems, ships must use energy-saving technologies throughout their service lives [16]. For ships using traditional marine diesel, how to improve fuel burning efficiency and reduce carbon emissions is a major challenge. However, many studies have found that engine power saving can have a significant effect on emission reduction [17,18]. The IMO’s energy-saving framework is expected to have a significant impact on shipping patterns [16]. Therefore, the shipping industry is developing innovative energy-saving technologies such as organic Rankine cycle (ORC) [19,20], steam turbines, heat pumps, and heat recovery [20,21], where ORC and dual-pressure steam systems have been proven to be the most beneficial technologies for improving energy efficiency [19,20]. It has also been observed that some wind rotors and sails are installed on the deck to generate additional thrust to achieve energy-saving purposes [22]. In order to obtain a better CII rating, ship owners must try to improve their operational efficiency and reduce carbon emissions of their ships as much as possible. According to the estimates by the United Nations Conference on Trade and Development (UNCTAD), the global capacity of dry bulkers in 2022 was estimated to be 946,135 kilotons. About 36% of these ships were given a rating D or E [23]. For ships that have been rated D for three consecutive years or E for a single year, the owners must draw up corrective action plans and make improvements [15]. If they fail to improve, they may be subjected to a corresponding record of deficiency, or be detained during port state control inspections. The CII rating may also affect a ship’s insurance coverage. In addition, it is also related to the responsibility scope of the charterer, as ships with poor CII ratings may not be favored by charterers. As a result, it may lead to the low operating efficiency of ships and a gradual loss of competitiveness [24]. In order to effectively reduce the carbon emissions of existing ships and improve the CII rating, shipping companies may use all possible methods to obtain the best fuel consumption efficiency, including using alternative low-carbon or zero-carbon fuels [23,24,25], slow steaming, and optimizing the operation mode [21], e.g., using alternative routes or the great circle route to shorten the voyage, so as to reduce the attained CII value and achieve a better CII rating.
According to the regulations of MARPOL, the ship energy efficiency management plan (SEEMP) is a specific system used to supervise the fuel efficiency of ships [26], which has been incorporated into the ship’s international safety management system. Although the effect of EEXI on energy saving is not satisfactory [27,28], ships often use the following practices to improve ship fuel efficiency:
  • Changing ship operation details: cleaning the hull to reduce resistance, installing low-energy bulbs, installing solar/wind auxiliary power supplies to provide electricity for cabins, and using shore power for ships in ports, etc. [10,20].
  • Replacing ships: when shipping companies compete to build large ships in order to reduce transportation unit costs [29], they also consider how to improve fuel efficiency, especially the optimization of hull design, propeller pitch, and engine speed, as well as the application of energy-saving equipment to improve performance [26,30,31,32].
  • Using alternative fuels: when the provisions of the MARPOL Convention on the sulfur content of fuel oil came into force, more and more ships used alternative fuels [33] such as LNG and methanol [28,34,35,36].
  • Limiting engine power: according to IMO’s guidelines for the development of a ship energy efficiency management plan [37], speed optimization is a promising method to improve ship energy efficiency. Therefore, many existing ships adopt the engine power limitation (EPL) strategy to reduce the actual operating speed of the ships [17,18].
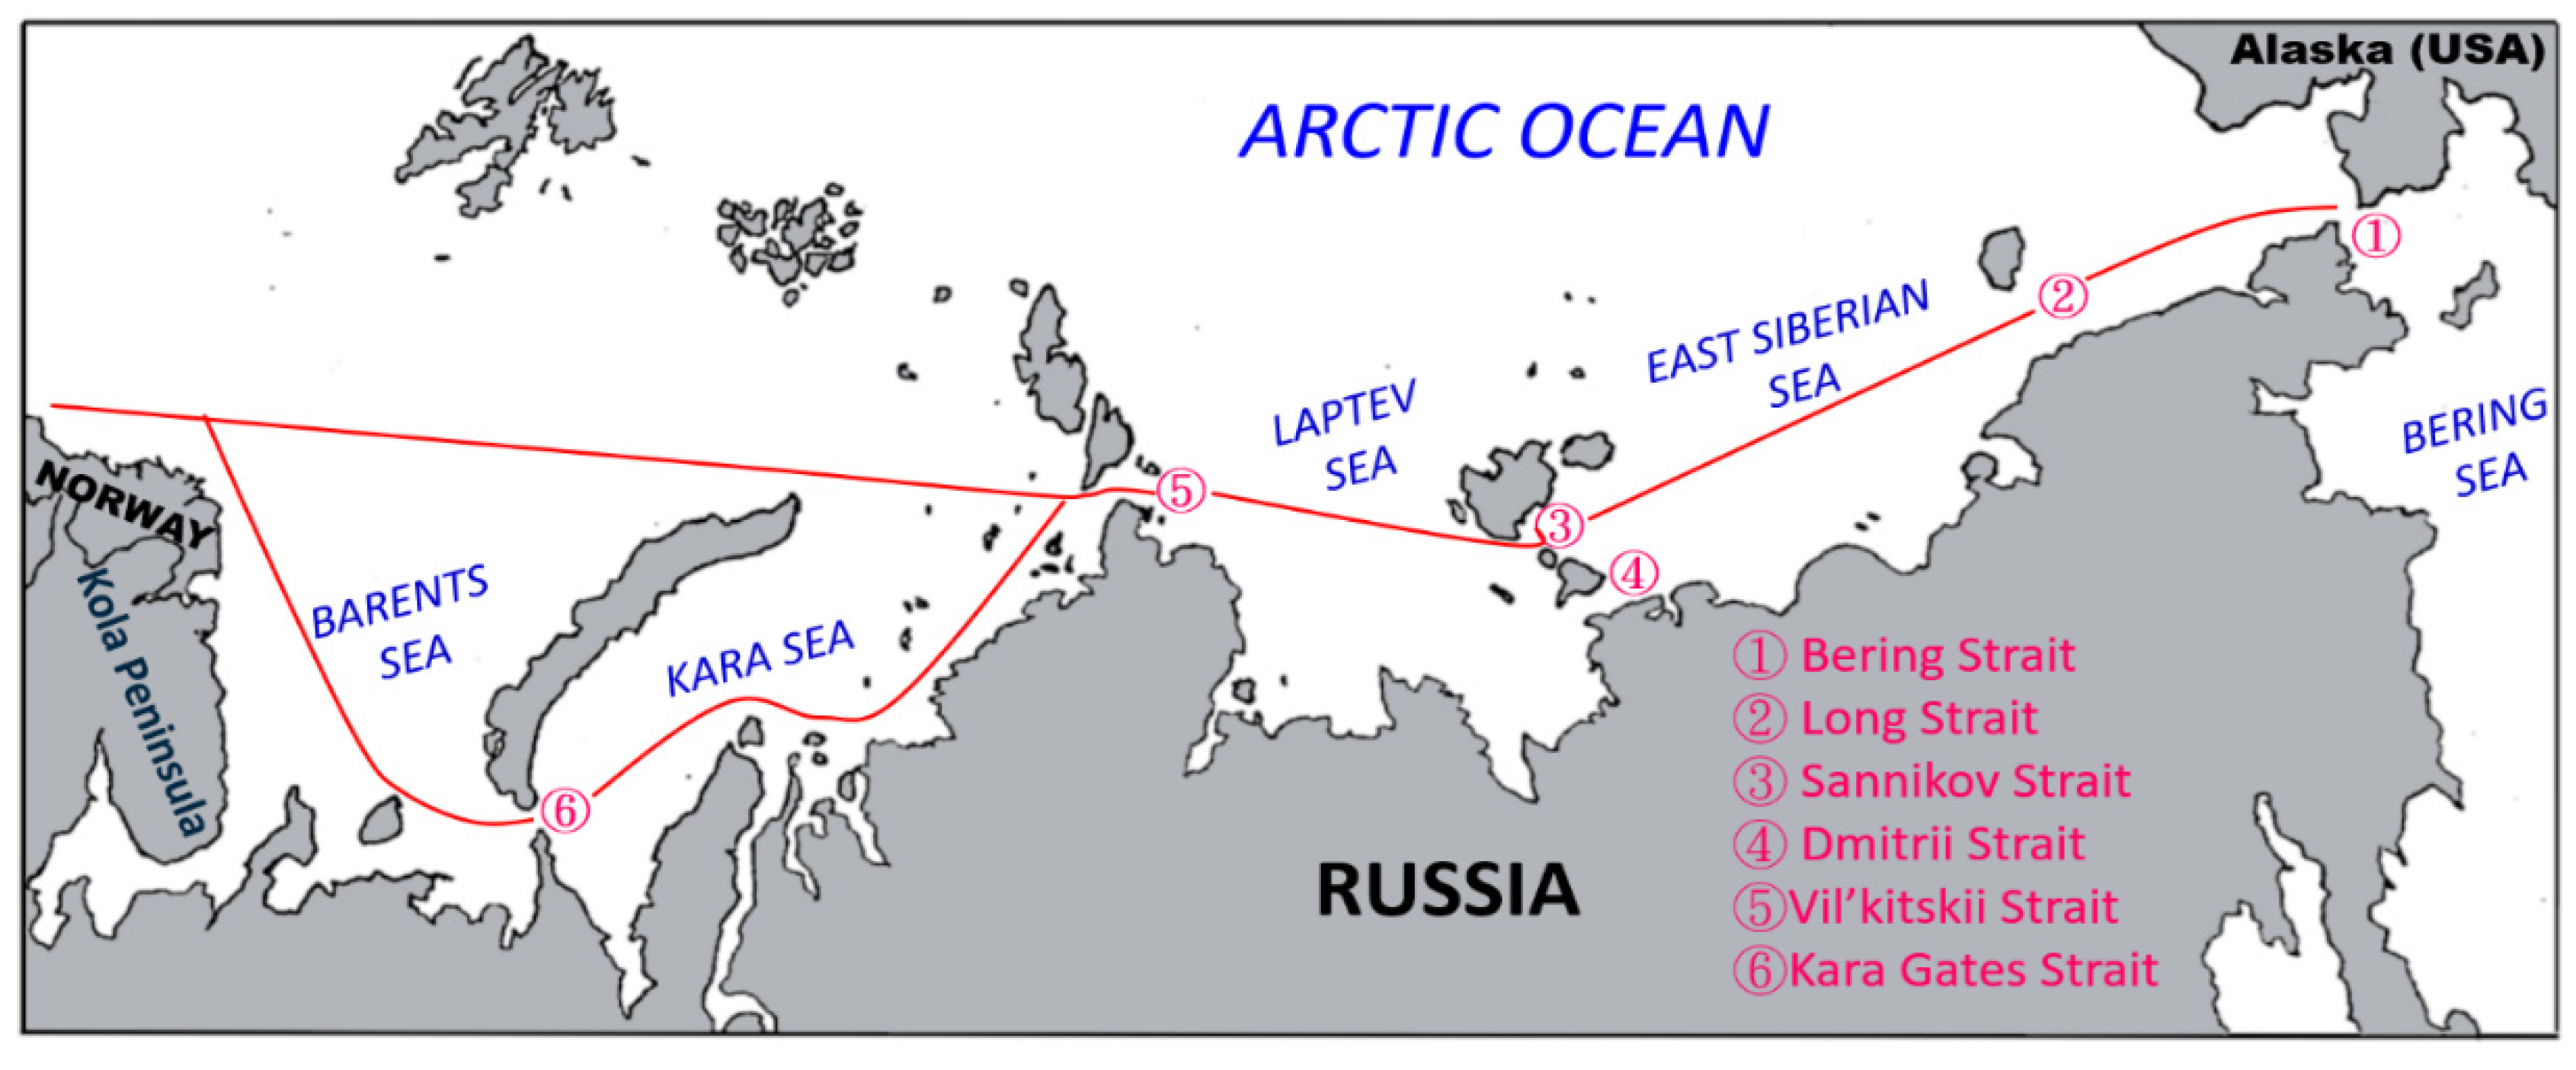
If slow steaming is adopted, although it can effectively save fuel consumption, it may increase the number of sailing days, which could have a significant negative impact on overall operating costs and capacity benefits. The Northeast Passage is a route connecting northeast Asia with northern Europe, starting with the Bering Strait in the east and ending with the Kola Peninsula in the west [38,39], as shown in Figure 1. In recent years, ships have used two main routes. Taking westward sailing as an example, after passing through the Vilkitskil Strait, ships can go directly west through the northern part of the Kara Sea and the central part of the Barents Sea. Alternatively, they can sail through the Kara Gates Strait and then to the western part of the Barents Sea. The reverse is also true for ships heading east. Historically, Russia has claimed sovereignty over the Northeast Passage and used it as a national transportation artery [40]. In recent years, because of its shorter distance, it has even been deliberately positioned as an alternative to the Suez Canal (also known as the Suez Route) [
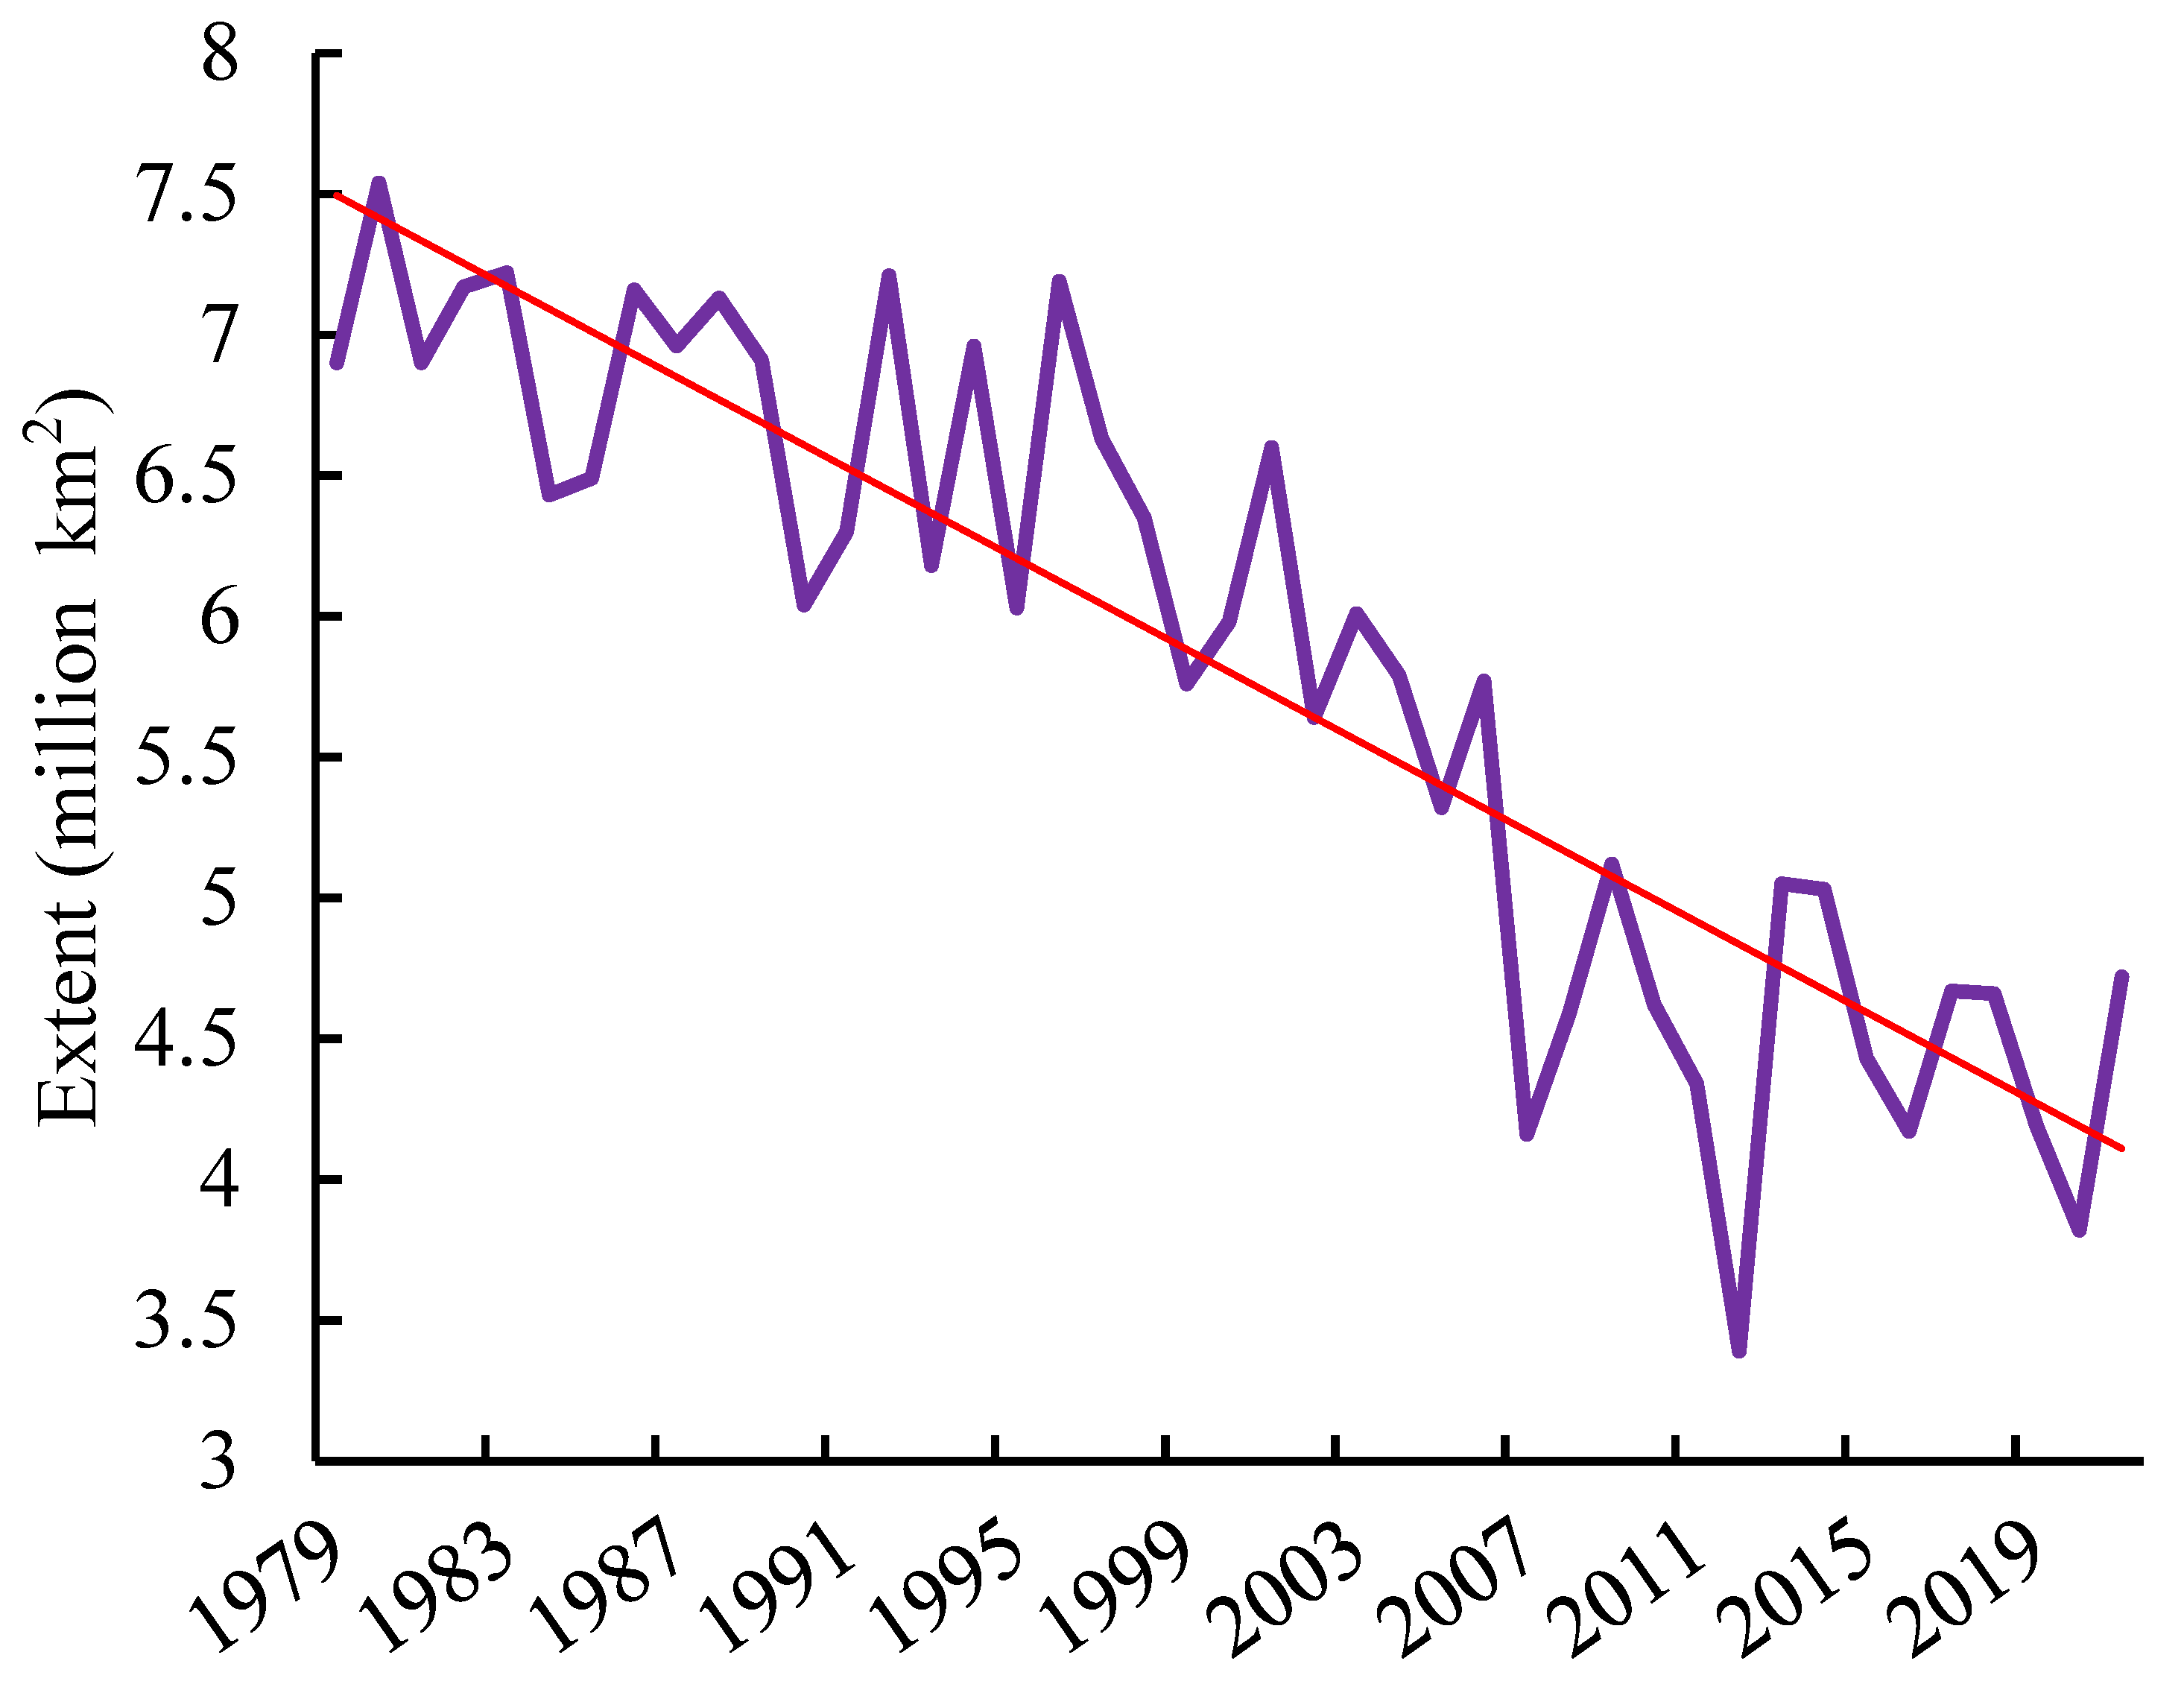
41]. However, the Northeast Passage is covered by sea ice all year round. This situation has attracted considerable concern from shipping companies, as sea ice can hamper navigation in the Northeast Passage. Since 1979, the ice sheet in September has decreased by about 13% every decade [42,43], as shown in Figure 2. The emissions of nitrogen oxides, sulfur oxides, carbides, etc. from ships are direct or indirect greenhouse gases, which would exacerbate global warming and even lead to the melting of ice in the Arctic. There are relevant mandatory regulations in MARPOL [44] to limit the emissions from vessels. The black carbon emitted by ships powered by fossil fuels is insoluble in water and has a strong capability to absorb solar radiation [45]. It would accelerate global warming extent and speed up ice melting in the Arctic [46,47]. In addition, low-sulfur heavy fuel oil used by ships, which contains a large amount of aromatic compounds, would increase the black carbon emissions and, thus, expedite melting of the Arctic ice [48]. The Dutch Bureau for Economic Policy Analysis predicted in 2015 that the Northeast Passage will be ice-free by 2030 [49]. Observations over the past decade have shown that the Barents Sea is the westernmost point of the Northeast Passage. In recent years, its ice sheet has greatly decreased, and it has come up obviously with “Atlantification”, with almost no ice even in winter [50]. In addition, according to records of Russia’s Northern Sea Route Administration, ships sail through the Northeast Passage each day from early January to mid-November. At its peak, there are 109 ships a day [51]. At the very least, such melting ice suggests that the Northeast Passage has become the Europe–Asia route of choice. For many years, ships sailing between Europe and Asia have taken the Suez Route. However, in recent years, melting ice has allowed the Northeast Passage to become an alternative route for ships. Compared with the Suez Route, the Northeast Passage could save up to 40% of the journey [52,53,54]. Under the CII rating system, it may be possible to use this advantage to balance the negative impact of increased sailing days as a result of ships sailing at reduced speeds. Therefore, the Northeast Passage may attract high interest from shipping companies. In other words, the IMO’s CII rating system may indirectly drive the future development of the Northeast Passage.
In this paper, Vessel Y, a dry bulk carrier belonging to Shipping Company C, was taken as the research object. According to the fuel consumption data corresponding to the maximum continuous rating (MCR), the revolutions per minute (RPM) of the main engine, and the ship speed, the formula prescribed by the IMO was adopted in this paper to calculate the required CII, attained CII, and CII ratings, for further analysis:
  • Through analyzing the attained CII values of Vessel Y at different sailing speeds, the factors affecting the CII rating of the ship could be clarified.
  • This paper analyzed the adverse effects of sailing at reduced speeds to achieve better CII ratings on the Eurasian route.
  • The benefits of the Northeast Passage to Eurasian routes under the CII rating framework were also analyzed.
  • In addition, the likely development of the Northeast Passage under the CII rating framework was forecasted.
On the basis of the analysis results, the impact of the IMO’s CII rating system on the future development of the Northeast Passage was evaluated.

2. Research Methods

This study explored the changes in the development of the Northeast Passage after implementation of the CII rating system. When ships sailing between Europe and Asia change their routes to the Northeast Passage, their CII ratings could be significantly improved, causing other ships to follow them and driving the rapid development of the Northeast Passage. In other words, the contribution of the Northeast Passage to the CII ratings of ships is an important factor influencing its development. Therefore, in order to effectively explore the impact of the Northeast Passage on CII ratings, the fuel consumption data of Vessel Y, a bulk carrier provided by Shipping Company C, were used in this study for calculation and analysis in accordance with relevant formulas of the IMO concerning the CII rating of ships.

2.1. Basic Ship Data

2.1.1. Ship Particulars

The ship particulars and fuel consumption of Vessel Y, a bulk carrier belonging to Shipping Company C, are shown in Table 1 and Table 2. This ship had a maximum continuous rating (MCR) of 6400 kW and a gross tonnage of 21,508. At 85% MCR and 104 rpm, the fuel consumption of the main engine was 26 tons/day, and that of the auxiliary engine was 0.8 ton/day.

2.1.2. Voyage Data

A ship’s fuel consumption is proportional to its voyage. In order to clearly calculate the CII rating performance of different voyages via the Northeast Passage and the Suez Route, voyages from Tokyo and Hong Kong to Hamburg and Barcelona were designed via the Northeast Passage and Suez Route, respectively. The CII ratings were calculated according to the ship speed and fuel consumption of Vessel Y, as shown in Table 2, and then further analysis was conducted. Nautical charts were used to measure the voyage distances between ports, as shown in Table 3.

2.2. Methods for Calculating Ship CII

According to the CII policy of the IMO, the carbon intensity of ships can be divided into five ratings denoted as A–E. In order to calculate the CII rating of Vessel Y, the following steps were taken:
  • Obtain the CII reference line first and use it as the basis for calculating the required CII of each year.
  • Obtain the required CII value of Vessel Y in each year and use it as the basis to define the boundaries of ratings A–E.
  • Obtain the boundaries of ratings A–E.
  • Obtain the attained CII values of Vessel Y in each year.
  • Analyze the range of the attained CII value of Vessel Y so as to determine its CII rating.

2.2.1. Calculation Method of the CII Reference Line Value

The CII rating of a ship depends on the relationship between its required CII value and its attained CII value. Therefore, the required CII value and the attained CII value of a ship must be calculated before its rating can be further determined. According to the provisions of IMO MEPC.338 (76) [14], if the required CII value of a ship in each year is to be calculated, its CII reference line in 2019 must be calculated first as the basis for calculating the required CII value of each year [14]. According to the provisions of MEPC.337 (76), the formula for calculating the CII reference line and the rules of relevant parameters [12,13] is as follows:
CIIref = a (capacity)c,
where CIIref refers to the CII reference line in 2019, capacity refers to the dead weight tonnage (DWT) of the ship, parameter a is 4745 (only applicable to calculation of the CII reference lines for bulk carriers), and parameter c is 0.622 (only applicable to calculations of the CII reference lines for bulk carriers).

2.2.2. Calculation Method for the Required CII Values

According to IMO MEPC.338 (76), the required CII values must be reduced year by year from 2020 to 2026. The formula and reduction factor [14] are as follows:
Annual required CII = (1 − Z%) × CIIref,
where Z is the annual reduction factor. The annual reduction value is quoted in Table 4.
By substituting Equation (1) into Equation (2), the annual required CII value of Vessel Y could be calculated as follows:
Annual required CII = (1 − Z%) × 4745 × (36,155)0.622.

2.2.3. Calculation Method of CII rating A–E Boundaries

According to IMO MEPC.339 (76) [15], the annual attained CII of a ship must be rated, as shown in Figure 3. It gives explicit ratings in a quantitative way. In order to clearly understand the rating results of the attained CII produced by Vessel Y at different speeds, the upper and lower boundaries of each rating needed to be calculated first. The formulas are shown below.
Superior boundary = exp (d1) × required CII.
Lower boundary = exp (d2) × required CII.
Upper boundary = exp (d3) × required CII.
Inferior boundary = exp (d4) × required CII.
Since Vessel Y is a bulk carrier, according to MEPC.339 (76) [15], d1, d2, d3, and d4 in Equations (4)–(7) were as shown in Table 5, after exponential transformation.

2.2.4. Calculation Method for the Attained CII Values

According to IMO MEPC.336 (76), ships must collect fuel consumption data to facilitate the calculation of their annual attained CII values. The calculation formulas [12] are as follows:
Attained CII = M/W,
M = FC × CF,
W = C × Dt,
where M is the total CO2 emissions of ships for yearly fuel consumption in grams/year, W is the product of the ship’s annual transport capacity and transport distance, FC is the total annual fuel consumption of the ship; CF is the carbon conversion coefficient (MEPC.308 (73) [55]; because Vessel Y uses diesel, CF = 3.206), C is the capacity of dead weight tonnage (DWT) of the ship, and Dt is the total nautical distance in nautical miles.
By substituting Equations (9) and (10) into Equation (8), the simplified formula for calculating the attained CII of Vessel Y can be obtained:
Attained CII = 3.206 FC/(C × Dt).

3. Results and Discussion

3.1. Annual Required CII of Vessel Y

According to Equation (1), the CII reference line value (CIIref) of Vessel Y can be obtained as follows:
CIIref = a (capacity)c = 4745 × (36,155)−0.622 = 6.94
This value was also the required CII value of Vessel Y in 2019. By substituting the required CII value of 2019 into Equation (3), the required CII values of each year could be obtained. The results are shown in Table 6. It can be seen from Table 6 that existing ships have faced increasingly severe CII rating standards since 2023. This has resulted in a decrease in the required CII value year by year. As a result, ships have needed to adopt more effective energy conservation and carbon reduction practices over the years to meet the declining required CII values.

3.2. Annual CII Rating Boundaries of Vessel Y

According to the data in Table 5 and Table 6, Vessel Y’s rating boundaries in each year could be calculated using Equations (1)–(7) and could be used as the basis for verifying the annual CII ratings of Vessel Y. The results are shown in Table 7.
Rating boundaries can be calculated using the required CII values (i.e., the annual CII reference lines). With the reduction in the required CII value each year, the rating boundaries would also decline. In other words, if a ship fails to improve its carbon reduction efficiency year by year, the rating boundary will drop to a lower level, causing its CII rating to likely fall from the original high rating of A or B to a low rating of C, D, or even E.

3.3. Attained CII of Vessel Y

Since the CII rating is determined by the relationship between the attained CII and the required CII, in order to understand the CII rating obtained by Vessel Y on the Eurasia path via the Suez Route and the Northeast Passage, respectively, it was necessary to calculate its attained CII according to Equation (11) to further realize the CII rating obtained by the two routes. Since C in Equation (11) was a fixed value (capacity = 36,155; see Table 1), the attained CII values varied with the FC (total annual fuel consumption) and Dt (annual total voyage distance). Among these values, FC included the fuel consumption of the main engine and auxiliary engine, which was calculated by referring to the fuel consumption of the main engine and auxiliary engine of Vessel Y at different speeds, as shown in Table 2. Dt (annual total voyage distance) was calculated as the distance from the port of departure via the Suez Route or the Northeast Passage to the port of arrival. Taking the voyage from Tokyo in northeast Asia to Hamburg in northwest Europe as an example, without considering the influence of wind flow intensity, the attained CII at various fixed ship speeds was calculated, and the results were as shown in Table 8. Then, Figure 4 was drawn according to the data in Table 7 and Table 8 to represent the CII ratings obtained by Vessel Y sailing at various fixed speeds in each year from 2021 to 2026.

3.4. Key Factors Influencing the CII Rating

It cam be seen from the previous section that the CII rating obtained by a ship entirely depends on the relationship between its attained CII and the required CII. Among them, the attained CII is affected by the FC (annual total fuel consumption), shown in the numerator of Equation (11), and the Dt (annual total voyage distance), shown in the denominator of Equation (11). However, Table 8 shows that, when ships sail at the same speed, no matter if they take the Suez Route or the Northeast Passage, the attained CII values will be the same. Therefore, the voyage distance does not affect the results of the attained CII, since fuel consumption is proportional to the voyage distance in Equation (11). That is to say, when Dt (total sailing distance) in the denominator of Equation (11) increases, FC (total fuel consumption) in the numerator will also increase proportionally. By further researching Table 8, it can be found that the attained CII value may vary with a ship’s speed. The lower the ship speed and corresponding MCR of the main engine are, the lower the attained CII value will be. This phenomenon is in line with the aforementioned argument that fuel consumption is a cubic function of ship speed. This undoubtedly indicates that sailing at reduced speed is a basic principle for ships to reduce the attained CII value.
The shorter voyage is an advantage for the Northeast Passage. In practice, before the CII rating system was implemented, fuel cost savings and operational efficiency improvements were the main considerations of shipping companies when deciding to take a route through the Northeast Passage, especially when oil prices were relatively expensive. However, after the implementation of the CII rating system, shipping companies must also consider both the attained CII value and the CII rating. However, it has been shown above, according to Equation (11), that the attained CII value of a ship has nothing to do with Dt (total voyage distance). Taking the Northeast Passage does not seem to help ships reduce the attained CII value. However, when shipping companies comprehensively consider the fuel consumption cost, operating efficiency, CII rating, and other relevant factors, the total voyage distance becomes extremely important. The sailing time is a function of the total voyage distance, and it is related to the use efficiency of the vessel by the charterer during the contract term for the time charter party and the bareboat charter party. The longer the sailing time is, the fewer voyages the charterer can operate during the contract term. Therefore, although the attained CII can be effectively reduced through sailing at a reduced speed, the voyage distance remains a key factor in maintaining operation efficiency.

3.5. Impact of the CII Rating System on Eurasian Routes

In addition to the route around the Cape of Good Hope in Africa, the Suez Route is currently the main route between Europe and Asia. Although the total voyage distance does not affect the attained CII value and CII rating of the ship, ship speed is still the key factor for the attained CII value. Therefore, on the premise of obtaining a better CII rating, it is inevitable for ships to slow their sailing speed. However, this increases the number of sailing days, thereby greatly affecting the operating benefits of the shipping companies. Taking the CII rating of Vessel Y shown in Figure 4 as an example, although its CII rating could be maintained above a rating of C until 2026, from 2025, when its sailing speed was above 13.9 knots (i.e., 75% MCR), its attained CII would be higher than the required CII. The charterer could expect that this vessel would have to slow down, thus directly affecting the overall operational efficiency of the vessel and, in turn, weakening its competitiveness in the chartering market. Even if the attained CII was lower than the required CII, if it could only get rating C, the charterer could still have doubts about whether it would fall to a rating D due to the required CII becoming more strict year by year. Therefore, if it wants to maintain a certain level of competitiveness, maintaining a rating B would be a basic objective. From 2025, its ship speeds would need to be limited to 13.3 knots or less (65% MCR). In order to maintain a rating A, the speed limit would need to be below 12.6 knots (i.e., 55% MCR). This would be equivalent to forcing a new vessel to sail at a speed 35% to 45% lower than its original rated maximum MCR. The 85% MCR listed in Table 2 was the highest speed actually adopted by Vessel Y. Taking the voyage from Tokyo to Hamburg via the Suez Route as an example, the total voyage distance was 11,445 nm. When Vessel Y sails at the speed limit of 12.6 knots (55% MCR), the required sailing time would be 37.85 days. In comparison, it would only need 33.12 sailing days at a speed of 14.4 knots (85% MCR). This implies that that it would add 4.73 days and reduce the overall operating efficiency by 14.3%.
According to IMO regulations, the required CII would be reduced by 2% year by year from 2023 to 2026, as shown in Table 6. However, the regulations do not further stipulate the required CII values thereafter. According to the CII Reduction Factors Guidelines [15] of Resolution MEPC.338 (76), on the basis of the total supply of ships and with respect to the required CII of 2019, the reduction factor (i.e., factor Z in Equation (3)) of the required CII in 2030 should be at least 0.215 to achieve the IMO carbon reduction target [14]. The required CII and rating boundaries from 2027 were calculated on this based, as shown in points K and R in Figure 5. When Vessel Y sails at the speed limit of 12.6 knots (55% MCR), it would only achieve a rating B (point K) after 2027. By 2030, It would only achieve a rating C (point R). In order to maintain a rating B, it would need to reduce its speed to 12.1 knots (50% MCR). However, this would inevitably increase the number of shipping days. Taking the voyage from Tokyo to Hamburg via the Suez Route as an example, the sailing time would be increased to 39.41 days. Compared with the 33.12 days required to sail at 14.4 knots (85% MCR), the sailing time of the voyage would increase by 6.29 days, and the overall operating efficiency would decrease by 19%. Therefore, the CII rating system has a great impact on Eurasian routes.

3.6. Substantive Benefits of the Northeast Passage to Eurasia Routes under the CII Rating System

From the above discussion, it is clear that ship speed is the key factor influencing the attained CII value, while the voyage distance affects the operational efficiency. In practice, shipping companies must consider both factors. After the implementation of the CII rating system, it still remains to be further discussed what substantive contribution the Northeast Passage has made to the operating benefits of the Eurasia Route compared with the Suez Route. Table 9 shows the voyage distance differences from Tokyo and Hong Kong to Hamburg and Barcelona via the Northeast Passage and the Suez Route, respectively. Tokyo is located in northeast Asia, Hong Kong is located in southeast Asia, Hamburg is located in northwest Europe, and Barcelona is located in southern Europe. Among them, to the highest extent, the voyage distance between Tokyo and Hamburg could save 4671 nm via the Northeast Passage, reducing the distance by 40% compared with traveling via the Suez Route, which is quite significant. However, if changing the destination port to Barcelona in southern Europe, only 712 nm could be saved, which would have little effect on the operating efficiency. Moreover, for Hong Kong to Barcelona, choosing the Suez Route could reduce the voyage by 2245 nm. According to this, it can be found that not all Eurasian routes would balance the negative impact of increased shipping times caused by taking the Northeast Passage after the implementation of the CII rating system. More specifically, in terms of improving the operating efficiency of the Eurasian routes by the Northeast Passage, the routes from northwest Europe to northeast Asia had the most substantive benefits, but the routes from southern Europe to southeast Asia had almost no substantive benefits. In order to judge the substantive benefits of the Northeast Passage for Eurasian routes, the parameter Df was used:
Df = (voyage distance via the Northeast Passage)/(voyage distance via the Suez Route).
when Df ≥ 1, the Northeast Passage has no benefits at all; when Df < 1, the Northeast Passage has benefits. A smaller Df value denotes higher possible benefits provided by the Northeast Passage.
Table 9. Port distance difference via the Northeast Passage and the Suez Route (in nautical miles).
DepartureHamburgBarcelona
Suez RouteNE PassageDiff.Suez RouteNE PassageDiff.
Tokyo11,445 6774 4671 9506 8794 712
Hong Kong10,001 8335 1666 8062 10,307 −2245
Source: measured by the authors according to nautical charts.
Therefore, a ship which travels from northeast Asia to northwest Europe to obtain a superior attained CII value can take advantage of the shorter voyage of the Northeast Passage to balance the increased days due to low steaming. However, a ship which sails from Southeast Asia to southern Europe can only transit via Suez Route to achieve the predetermined frequency of port calls. The number of operating ships will, thus, inevitably increase, resulting in a negative effect on the carbon reduction goal of the overall shipping.

3.7. Possible Development of the Northeast Passage under the CII Rating System

Compared with other IMO policies on shipping carbon reduction, the CII rating system is in essence a certification mechanism for ships’ carbon reduction performance. It certainly has a degree of impact on ship route planning. The distance advantage of the Northeast Passage could indeed balance the negative impact of the CII system on the operational effectiveness of shipping. In addition, in practice, it has triggered a great deal of interest in the Northeast Passage from the shipping industry. For ships on Eurasian routes, the Northeast Passage is a function of ship transit utilization. In recent years, the number of ships and cargo volume [56] going through the Northeast Passage have shown a substantial increase year by year (Table 10). Compared with 2019, the number of ships and the cargo volume transiting via the Northeast Passage increased 132% and 193%, respectively, in 2021. The average dead weight tonnage (DWT) of ships transiting via the Northeast Passage increased 26% to 23,736 tons, up from 18,846 tons, symbolizing the rapid upsizing of ships sailing via the Northeast Passage. The carbon reduction policy has clearly led to a tendency for shipping companies to try to develop routes via the Northeast Passage.
As a result, shipping companies are more likely to use the Northeast Passage to counter the CII rating system. On the premise of reducing the attained CII value via low steaming to obtain a better CII rating, it is estimated that the Northeast Passage will gradually replace the Suez Route for existing ships moving between Northeast Asia and Northwest Europe. In terms of container liners, according to the successful test run via the Northeast Passage by Venta Maersk [57], it is estimated that the current Eurasian pendulum route via the Suez Route is highly likely to be adjusted to a circum-Europe–Asia route connecting the Northeast Passage (or Suez Route) via the Suez Route (or Northeast Passage).

4. Conclusions

The attained and required CII values of an existing bulk carrier via the Suez Channel and the Northeast Passage from Tokyo to Hamburg at various speeds were calculated in this study. The Northeast Passage development trend, on the basis of the number of ships and cargo volumes that transited via the Northeast Passage from 2015 to 2021, was further analyzed to evaluate its shipping development potential of Northeast Passage. Through the above research and discussion, the main results of this study could be summarized as shown below.
  • Taking a ship sailing from Tokyo to Hamburg for example, compared with the Suez Route, the Northeast Passage could save approximately 41% of the voyage distance, equivalent to 4671 nm. However, if ships sail at the same fixed speed, regardless of external environmental factors, both routes may get the same attained CII value. It can be seen that the voyage distance would not affect the CII rating performance of the ship.
  • Whether via the Suez Route or via the Northeast Passage, when a ship’s speed is gradually reduced from 14.4 knots (85% MCR) to 11.6 knots (45% MCR), the attained CII value would decrease from 6.48 g/ton·nm to 4.88 g/ton·nm in a non-proportional ratio. Ship speed is the key factor influencing the attained CII value and CII rating.
  • When a ship sails at an output power from 85% MCR to 75% MCR, every 5% reduction in MCR would result in an average reduction in the attained CII value of 0.13 g/ton-nm and a reduction in fuel consumption of 1 ton/day. However, when a ship sails at an output power from 75% MCR to 55% MCR, a 5% decrease in MCR would result in an average reduction in the attained CII value of 0.26 g/ton·nm, and the degree of reduction would increase by 100%. In addition, the fuel consumption would be reduced by 1.5 ton/day, and the energy-saving effect would be increased by 50%. The optimal ship speed was between 75% MCR and 55% MCR according to the CII rating system.
  • As IMO’s requirements on the required CII value become stricter year by year, the degree of the ship speed reductions will also increase. It is estimated that, in order to get a B rating in 2025, a sailing speed limit of 13.3 knots (65% MCR) would be required. By 2030, the speed limit will be 12.1 knots (50% MCR). At that time, if a ship were to sail from Tokyo to Hamburg via the Suez Route t this speed, the required shipping time would be 39.41 days. Compared with 33.12 days under the sailing speed of 14.4 knots (85% MCR), the sailing time would increase by 6.29 days and the overall shipping capacity would decrease by 19%, having a great impact.
  • Taking advantage of the shorter voyage via the Northeast Passage could balance the negative impact of the increased number of sailing days caused by reduced sailing speeds. Its substantive benefit depends on the distance ratio between the Northeast Passage and the Suez Route. If the ratio is less than 1, the Northeast Passage will have substantial benefits. Moreover, a smaller ratio denotes a more substantial benefit.
  • Compared with 2019, in 2021, the number of ships transiting via the Northeast Passage increased by 132%, and the volume of cargo transiting via the Northeast Passage increased by 193%. In addition, the average dead weight tonnage of the ships transiting via the Northeast Passage increased by 26% from 18,846 tons to 23,736 tons. Therefore, under the global shipping carbon reduction policy, including the CII rating system, it is estimated that the number and size of ships using the Northeast Passage will increase year by year.

Author Contributions

Conceptualization, C.-Y.L.; funding acquisition, C.-Y.L.; formal analysis, Y.-M.T.; corresponding, C.-Y.L.; investigation, Y.-M.T.; methodology, C.-Y.L.; validation, Y.-M.T.; writing and editing, C.-Y.L. All authors have read and agreed to the published version of the manuscript.

Funding

This research was funded by the National Council of Science and Technology of Taiwan, ROC, under contract No. NCST 109-2221-E-019-024.

Institutional Review Board Statement

Not applicable.

Informed Consent Statement

Not applicable.

Data Availability Statement

The data presented in this study are contained within this article.

Conflicts of Interest

The authors declare no conflict of interest.

References

  1. Yoro, K.O.; Daramola, M.O. CO2 emission sources, greenhouse gases, and the global warming effect. Advances in Carbon Capture; Woodhead Publishing: Sawston, UK, 2020; pp. 3–28. Available online: https://www.researchgate.net/profile/Kelvin-Yoro/publication/343508726_CO2_emission_sources_greenhouse_gases_and_the_global_warming_effect/links/5f44aa2692851cd30227cffd/CO2-emission-sources-greenhouse-gases-and-the-global-warming-effect.pdf (accessed on 27 March 2023).
  2. Kumar, A.; Singh, P.; Raizada, P.; Hussain, C.M. Impact of COVID-19 on greenhouse gases emissions: A critical review. Sci. Total Environ. 2022, 806, 150349. [Google Scholar] [CrossRef] [PubMed]
  3. Archer, D.; Eby, M.; Brovkin, V.; Ridgwell, A.; Cao, L.; Mikolajewicz, U.; Caldeira, K.; Matsumoto, K.; Munhoven, G.; Montenegro, A.; et al. Atmospheric lifetime of fossil fuel carbon dioxide. Annu. Rev. Earth Planet. Sci. 2009, 37, 117–134. Available online: https://orbi.uliege.be/bitstream/2268/12933/1/Archer-etal-Preprint.pdf (accessed on 27 May 2023). [CrossRef] [Green Version]
  4. Pagani, M.; Caldeira, K.; Archer, D.; Zachos, J.C. An ancient carbon mystery. Science 2006, 314, 1556–1557. Available online: https://climate.fas.harvard.edu/files/climate/files/pagani_etal_2006.pdf (accessed on 27 May 2023). [CrossRef] [Green Version]
  5. Montzka, S.A.; Dlugokencky, E.J.; Butler, J.H. Non-CO2 greenhouse gases and climate change. Nature 2011, 476, 43–50. Available online: https://www.nature.com/articles/nature10322 (accessed on 27 May 2023). [CrossRef]
  6. Uyanık, T.; Karatuğ, Ç.; Arslanoğlu, Y. Machine learning approach to ship fuel consumption: A case of container vessel. Transp. Res. D Transp. Environ. 2020, 84, 102389. [Google Scholar] [CrossRef]
  7. Sui, C.; Vos, P.d.; Stapersma, D.; Visser, K.; Ding, Y. Fuel consumption and emissions of ocean-going cargo ship with hybrid propulsion and different fuels over voyage. J. Mar. Sci. Eng. 2020, 8, 588. Available online: https://www.mdpi.com/2077-1312/8/8/588/pdf (accessed on 27 May 2023).
  8. Abnett, K. EU Strikes Deal to Include Shipping in Its Carbon Market. gCaptain. Available online: https://gcaptain.com/eu-strikes-deal-to-include-shipping-in-its-carbon-market/ (accessed on 6 March 2023).
  9. Sekimizu, K. Third IMO GHG Study 2014 Executive Summary and Final Report: Foreword by the Secretary-General; International Maritime Organization (IMO): London, UK, 2015. [Google Scholar]
  10. International Maritime Organization (IMO). IMO’s Work to Cut GHG Emissions from Ships: 2018 Initial IMO GHG Strategy. Available online: https://www.imo.org/en/MediaCentre/HotTopics/Pages/Cutting-GHG-emissions.aspx (accessed on 15 March 2023).
  11. International Maritime Organization (IMO). Initial IMO Strategy on the Reduction of GHG Emissions from Ships; IMO Resolution MEPC.304(72); International Maritime Organization (IMO): London, UK, 2018. [Google Scholar]
  12. International Maritime Organization (IMO). 2021 Guidelines on the Operational Carbon Intensity Indicators and the Calculation Methods (CII Guidelines, G1); MEPC.336(76); Adopted on 17 June 2021; International Maritime Organization (IMO): London, UK, 2021. [Google Scholar]
  13. International Maritime Organization (IMO). 2021 Guidelines on the Reference Lines for Use with Operational Carbon Intensity Indicators (CII Reference Lines Guidelines, G2); MEPC.337(76); Adopted on 17 June 2021; International Maritime Organization (IMO): London, UK, 2021. [Google Scholar]
  14. International Maritime Organization (IMO). 2021 Guidelines on the Operational Carbon Intensity Reduction Factors Relative to Reference Lines (CII Reduction Factors Guidelines, G3); MEPC.338(76); Adopted on 17 June 2021; International Maritime Organization (IMO): London, UK, 2021. [Google Scholar]
  15. International Maritime Organization (IMO). 2021 Guidelines on the Operational Carbon Intensity Rating of Ships (CII Rating Guidelines, G4); MEPC.339(76); Adopted on 17 June 2021; International Maritime Organization (IMO): London, UK, 2021. [Google Scholar]
  16. Bayraktar, M.; Yuksel, O. A scenario-based assessment of the energy efficiency existing ship index (EEXI) and carbon intensity indicator (CII) regulations. Ocean Eng. 2023, 278, 114295. [Google Scholar] [CrossRef]
  17. Rigos, N. The Effect of Engine Power Limitation on the Energy Efficiency Existing Ship Index (EEXI). National Technical University of Athens School of Naval Architecture and Marine Engineering. 2022. Available online: https://dspace.lib.ntua.gr/xmlui/bitstream/handle/123456789/55252/The%20effect%20of%20EPL%20on%20the%20EEXI.pdf?sequence=1 (accessed on 2 April 2023).
  18. Ng, C.; Tam, I.C.; Wetenhall, B. Waste Heat Source Profiles for Marine Application of Organic Rankine Cycle. J. Mar. Sci. Eng. 2022, 10, 1122. [Google Scholar] [CrossRef]
  19. Gianni, M.; Pietra, A.; Coraddu, A.; Taccani, R. Impact of SOFC Power Generation Plant on Carbon Intensity Index (CII) Calculation for Cruise Ships. J. Mar. Sci. Eng. 2022, 10, 1478. [Google Scholar] [CrossRef]
  20. Liu, J.; Qu, J.; Feng, Y.; Zhu, Y.; Wu, Y. Improving the Overall Efficiency of Marine Power Systems through Co-Optimization of Top-Bottom Combined Cycle by Means of Exhaust-Gas Bypass: A Semi Empirical Function Analysis Method. J. Mar. Sci. Eng. 2023, 11, 1215. [Google Scholar] [CrossRef]
  21. Sun, W.; Tang, S.; Liu, X.; Zhou, S.; Wei, J. An Improved Ship Weather Routing Framework for CII Reduction Accounting for Wind-Assisted Rotors. J. Mar. Sci. Eng. 2022, 10, 1979. [Google Scholar] [CrossRef]
  22. United Nations Conference on Trade and Development (UNCTAD). Overview: Navigating Through Supply Chain Disruptions. Rev. Marit. Transp. 2022, 2022, xxvii. [Google Scholar]
  23. United Nations Conference on Trade and Development (UNCTAD). Maritime Transport Services: Fleet owners face tighter environmental regulations. Rev. Marit. Transp. 2022, 2022, 36–38. [Google Scholar]
  24. Ramalho, M.M.; Santos, T.A. Numerical modeling of air pollutants and greenhouse gases emissions in intermodal transport chains. J. Mar. Sci. Eng. 2021, 9, 679. [Google Scholar] [CrossRef]
  25. Johnson, H.; Johansson, M.; Andersson, K.; Södahl, B. Will the ship energy efficiency management plan reduce CO2 emissions? A comparison with ISO 50001 and the ISM code. Marit. Policy Manag. 2013, 40, 177–190. [Google Scholar] [CrossRef]
  26. Kang, J.G.; Kim, M.C.; Shin, Y.J. Study on compact pre-swirl duct for slender aft-body crude oil carrier. J. Mar. Sci. Eng. 2022, 10, 396. [Google Scholar] [CrossRef]
  27. Rutherford, D.; Mao, X.; Comer, B. Potential CO2 reductions under the energy efficiency existing ship index. ICCT. 2020, Working paper, 27. Available online: https://theicct.org/sites/default/files/publications/Marine-EEXI-nov2020.pdf (accessed on 16 March 2023).
  28. Halff, A.; Younes, L.; Boersma, T. The likely implications of the new IMO standards on the shipping industry. Energy Policy 2019, 126, 277–286. [Google Scholar] [CrossRef]
  29. Omboga, H.K. Era of decarbonization, energy efficiency on existing ships (EEXI) and carbon intensity indicators (CII) implication on charter parties. World Marit. Univ. Diss. 2022, 2074. Available online: https://commons.wmu.se/all_dissertations/2074 (accessed on 8 March 2023).
  30. Insel, M.; Gokcay, S.; Saydam, A.Z. A Decision Support System for Energy Efficient Ship Propulsion. In Trends and Challenges in Maritime Energy Management; Springer International Publishing AG: Cham, Switzerland, 2018; pp. 143–155. [Google Scholar] [CrossRef]
  31. Kalajdžić, M.; Vasilev, M.; Momčilović, N. Exploring an Effect of Novel IMO Policies on Energy Efficiency of Existing Ships. In Book of Abstracts-1st Kotor International Maritime Conference (KIMC 2021), Kotor, Montenegro, 2021; Faculty of Maritime Studies in Kotor, University of Montenegro, Podgorica, Montenegro. Available online: https://machinery.mas.bg.ac.rs/handle/123456789/6729 (accessed on 27 May 2023).
  32. Lehtoranta, K.; Aakko-Saksa, P.; Murtonen, T.; Vesala, H.; Ntziachristos, L.; Rönkkö, T.; Karjalainen, P.; Kuittinen, N.; Timonen, H. Particulate mass and nonvolatile particle number emissions from marine engines using low-sulfur fuels, natural gas, or scrubbers. EST 2019, 53, 3315–3322. [Google Scholar] [CrossRef] [PubMed]
  33. Burel, F.; Taccani, R.; Zuliani, N. Improving sustainability of maritime transport through utilization of Liquefied Natural Gas (LNG) for propulsion. Energy 2013, 57, 412–420. [Google Scholar] [CrossRef]
  34. The Maritime Executive. Video: First Maersk Methanol-Fueled Containership Floated Out in Korea. Marit. Exec. 2023. Available online: https://maritime-executive.com/article/video-first-methanol-fueled-containership-floated-out-in-korea (accessed on 25 April 2023).
  35. Schuler, M. CMA CGM Orders 16 Large Containerships at China State Shipbuilding -Reports. gCaptain 2023. Available online: https://gcaptain.com/cma-cgm-orders-16-large-containerships-at-china-state-shipbuilding-reports/ (accessed on 18 March 2023).
  36. International Maritime Organization (IMO). MEPC.282(70)-2016 Guidelines for the Development of a Ship Energy Efficiency Management Plan (SEEMP). IMO 2016. Available online: https://edocs.imo.org/FinalDocuments/English/MEPC70-18-ADD.1(E).docx (accessed on 12 March 2023).
  37. Schøyen, H.; Bråthen, S. The Northern Sea Route versus the Suez Canal: Cases from bulk shipping. J. Transp. Geogr. 2011, 19, 977–983. [Google Scholar] [CrossRef]
  38. Blunden, M. Geopolitics and the northern sea route. Int. Aff. 2012, 88, 115–129. [Google Scholar] [CrossRef]
  39. Vuković, N.A.; Mekhrentsev, A.V.; Vuković, D.B. Transnational transport corridor of the northern sea route based on Sabetta seaport: Challenges of regional development for Russia. J. Geogr. Inst. Jovan Cvijic SASA 2018, 68, 405–414. Available online: https://elar.usfeu.ru/bitstream/123456789/9169/1/WOS-000453877200008.pdf (accessed on 27 May 2023). [CrossRef]
  40. Brubaker, R.D.; Ragner, C.L. A review of the International Northern Sea Route Program (INSROP)–10 years on. Polar Geogr. 2010, 33, 15–38. Available online: https://citeseerx.ist.psu.edu/document?repid=rep1&type=pdf&doi=c67c2f44f5641a20a091c0f45164e58b0f4c9a85 (accessed on 10 March 2023). [CrossRef]
  41. National Snow and Ice Data Center (NSIDC). Sea Ice 2022. Available online: https://nsidc.org/learn/parts-cryosphere/sea-ice (accessed on 13 February 2023).
  42. National Snow and Ice Data Center (NSIDC). Arctic Sea Ice News & Analysis: September 2022 Compared to Previous Years. 2022. Available online: https://nsidc.org/arcticseaicenews/2022/10/ (accessed on 13 February 2023).
  43. International Maritime Organization (IMO). Amendments to the Annex of the Protocol of 1997 to Amend the International Convention for the Prevention of Pollution from Ships, 1973, as Modified by the Protocol of 1978 Relating There to; International Maritime Organization (IMO): London, UK, 1997. [Google Scholar]
  44. Ji, C.; El-Halwagi, M.M. A data-driven study of IMO compliant fuel emissions with consideration of black carbon aerosols. Ocean Eng. 2020, 218, 108241. [Google Scholar] [CrossRef]
  45. Evangeliou, N.; Platt, S.M.; Eckhardt, S.; Myhre, C.L.; Laj, P.; Arboledas, L.A.; Backman, J.; Brem, B.T.; Fiebig, M.; Flentje, H.; et al. Changes in black carbon emissions over Europe due to COVID-19 lockdowns. Atmospheric Chem. Phys. 2021, 21, 2675–2692. [Google Scholar] [CrossRef]
  46. Kang, S.; Zhang, Y.; Qian, Y.; Wang, H. A review of black carbon in snow and ice and its impact on the cryosphere. Earth Sci. Rev. 2020, 210, 103346. [Google Scholar] [CrossRef]
  47. International Maritime Organization (IMO). Reduction of the Impact on the Arctic of Black Carbon Emissions fron International Shipping, Initial Results of a Black Carbon Measurement Campaign with Emphasis on the Impact of the Fuel Oil Quality on Black Carbon Emissions, Sub-Committee on Pollution Prevention and Response 7th Session Agenda Item 8; International Maritime Organization (IMO): London, UK, 2019. [Google Scholar]
  48. Dams, T.; Schaik, L.v.; Stoetman, A. Presence before power: Why China became a near-Arctic state. Clingendael Report, Netherlands Institute of International Relations, Wassenaar, Netherlands. Available online: https://www.clingendael.org/sites/default/files/2020-06/presence-before-power.pdf (accessed on 12 March 2023).
  49. National Snow and Ice Data Center (NSIDC). Arctic Sea Ice News & Analysis: The “Atlantification” of the Barents Sea, 2022. Boulder, CO, USA. 2022. Available online: https://nsidc.org/arcticseaicenews/2018/12/ (accessed on 13 February 2023).
  50. Humpert, M. Shipping Traffic on Northern Sea Route Grows by 30 Percent (2017), High North News 23. Available online: https://www.highnorthnews.com/en/shipping-traffic-northern-sea-route-grows-40-percent (accessed on 2 March 2023).
  51. Liu, M.; Kronbak, J. The potential economic viability of using the Northern Sea Route (NSR) as an alternative route between Asia and Europe. J. Transp. Geogr. 2010, 18, 434–444. [Google Scholar] [CrossRef]
  52. Northern Sea Route Public Council. The Northern Sea Route Is—The Shortest Sea Route between Europe and APAC Countries. 2021. Available online: http://arcticway.info/en/northern-sea-route (accessed on 10 March 2023).
  53. Citra, R.; Ait, M.L. Containerized shipping via the northern sea route. Department of Mechanics and Maritime Sciences, Chalmers University of Technology, Gothenburg, Sweden 2021. Available online: https://odr.chalmers.se/server/api/core/bitstreams/dbde21e2-38a9-41a0-ba50-7e59279673e2/content (accessed on 2 March 2023).
  54. International Maritime Organization (IMO). 2018 Guidelines on the Method of Calculation of the Attained Energy Efficiency Design Index (EEDI) for New Ships; Resolution MEPC.308(73); Adopted on 26 October 2018; International Maritime Organization (IMO): London, UK, 2018. [Google Scholar]
  55. Center for High North Logistics (CHNL) Information Office, NSR Transit Statistics. 2022. Available online: https://arctic-lio.com/category/statistics/ (accessed on 7 February 2023).
  56. Makarova, I.; Gubacheva, L.; Makarov, D.; Buyvol, P. Economic and environmental aspects of the development possibilities for the northern sea route. Transp. Res. Procedia 2021, 57, 347–355. [Google Scholar] [CrossRef]
  57. Zhu, S.; Ng, A.K.; Afenyo, M.; Panahi, R.; Bell, M.G. Socio-economic impacts of shipping along the Northwest Passage: The cost to locals. Mar. Policy 2023, 153, 105647. [Google Scholar] [CrossRef]
Figure 1. Schematic diagram of the Northeast Passage. Source: plotted by the authors.
Jmse 11 01341 g001
Figure 2. Average arctic sea ice extent during September 1979–2022. Source: plotted by the authors based on the data of [43].
Jmse 11 01341 g002
Figure 3. Schematic diagram of the CII ratings and boundaries.
Jmse 11 01341 g003
Figure 4. CII rating of Vessel Y at various speeds from 2019 to 2026. Source: plotted by the authors.
Jmse 11 01341 g004
Figure 5. CII rating of Vessel Y at various speeds from 2027 to 2030. Source: plotted by the authors.
Jmse 11 01341 g005
Table 1. Particulars of Vessel Y of Shipping Company C.
Ship TypeBulk Carrier
Gross tonnage21,508
Summer DWT (tons)36,155
MCR (kW)6400
Propeller pitch (m)4.517
Ship slip (%)5.2
Source: compiled by the authors from data provided by Shipping Company C.
Table 2. Fuel consumption of Vessel Y at various speeds.
% of MCRRPMSpeed (knot)Main Engine Fuel Consumption (tons/day)
8510414.426
8010214.225
7510013.924
709813.622.5
659613.321
609413.019.5
559112.618
508712.116.5
458411.715.5
Auxiliary engine fuel consumption 0.8 ton/day
Source: compiled by the authors from data provided by Shipping Company C.
Table 3. Port distances via the Northeast (NE) Passage and Suez Route (in nautical miles).
DepartureHamburgBarcelona
Suez RouteNE PassageSuez RouteNE Passage
Tokyo11,445677495068794
Hong Kong10,0018335806210,307
Source: measured by the authors according to nautical charts.
Table 4. Reduction factor Z (%) for the CII relative to the 2019 reference line.
YearZ (%) Relative to 2019
20201
20212
20223
20235
20247
20259
202611
Source: compiled by the authors from [14].
Table 5. Different factors for the rating boundaries of bulk carriers.
exp (d1)0.86
exp (d2)0.94
exp (d3)1.06
exp (d4)1.18
Source: compiled by the authors from [15].
Table 6. Annual required CII values of Vessel Y.
YearRequired CII
20196.94
20206.87
20216.80
20226.73
20236.59
20246.45
20256.31
20266.17
Source: calculated by the authors.
Table 7. Annual required CII and rating boundaries of Vessel Y.
YearCII Ref. LineSuperior BoundaryLower BoundaryUpper
Boundary
Inferior Boundary
20196.945.966.527.358.18
20206.875.906.457.288.10
20216.805.846.397.208.02
20226.735.796.327.137.94
20236.595.676.196.987.77
20246.455.556.066.847.61
20256.315.435.936.697.45
20266.175.315.806.547.28
Source: calculated by the authors.
Table 8. Attained CII of Vessel Y.
% of MCRRPMSpeed (knots)Attained CII
via Suez Route
Attained CII
via Northeast Passage
8510414.46.486.48
8010214.26.366.36
7510013.96.236.23
709813.65.985.98
659613.35.715.71
609413.05.435.43
559112.65.195.19
508712.15.005.00
458411.74.884.88
Source: calculated and prepared by the authors.
Table 10. Annual growth rate of ships and cargos transiting via the Northeast Passage.
YearCargo Traffic
(in 1000 tons)
Annual Growth Rate (%) of Cargo TransitingNumber of Ships Transiting Annual Growth Rate (%) of Ships Transiting
201539.6--18--
2016214.5441195
2017194.4−92742
2018491.3152270
2019697.3423737
20201281.0836165
20212041.3598641
Source: compiled by the authors from [56].
Disclaimer/Publisher’s Note: The statements, opinions and data contained in all publications are solely those of the individual author(s) and contributor(s) and not of MDPI and/or the editor(s). MDPI and/or the editor(s) disclaim responsibility for any injury to people or property resulting from any ideas, methods, instructions or products referred to in the content.

