1. Introduction
The use of autonomous systems for collecting environmental data from the world’s oceans has evolved tremendously in the last decade. Maritime autonomous systems are widely used in the military domain (such as in port defense, terrorist suppression, targeting, mine warfare, unmanned safety patrolling, as well as in security and battlefield reconnaissance). MUS are mainly developed and experimented with in civilian applications, such as renewable energy [
1], as well as in hydrographic and oceanographic surveys in challenging areas where legacy systems normally have limitations [
2]. Recent advances in the use of unmanned systems are opening new opportunities for the environmental assessment of and the monitoring at finer scales for both military and civilian industries [
3]. MUS are being used in multi-domains activities, such as in oil and gas [
4], the oceanographic monitoring of the water column [
5], search and rescue [
6], and in autonomous hydrographic surveys [
7]. An autonomous hydrographic survey can be performed underwater by using autonomous underwater vehicles, unmanned underwater vehicles, or USVs for surface water surveys. Underwater vehicles are normally used in confined shallow waters, such as lakes or ports, due to their endurance limitation and due to using mathematical algorithms for positioning underwater—such as dead reckoning [
8]—whereas USVs are employed in larger area survey tasks, even in open oceans, due to their advantages: vessel shape and the ease of being remotely monitored and controlled.
The North Atlantic Treaty Organization (NATO) forces operate in multi-domain and cross-domain environments. In addition, it relies on accurate, timely, relevant, consistent, and reliable knowledge of the currents and forecasts the geospatial, meteorological, and oceanographic (Geometoc) conditions in order to enhance the effectiveness of military operations and missions. Geometoc knowledge is critical to optimize the employment of sensors, weapons, targeting, logistics, equipment, and personnel. Furthermore, it is a key decision in terms of superiority by which to enable safe, effective, and successful operations. Operating in unfamiliar areas may require a dedicated mission to assess the environmental conditions of the theater of operations and to provide NATO commanders with the opportunity to better plan, execute, support, and sustain their operations. When these tasks are to be conducted in non-permissive theaters, or to complement conventional military capabilities, the use of MUS becomes a game changer.
From a military perspective, hydrographic surveying can be divided into the following categories (as is seen in
Table 1):
The use of unmanned surface vehicles for hydrographic surveys in shallow waters has garnered an increased acceptance among hydrographic practitioners. This is primarily due to their distinctive attributes—particularly in restricted regions, enclosed waters, and coastal or port surveys—as evidenced by previous studies [
9]. Nonetheless, depending on the specific objectives of the survey, distinct benefits and drawbacks may be discerned concerning the utilization of USVs or in the use of conventional vessel surveys [
10] for environmental assessments.
This research is based upon the experimentation events from the annual Portuguese multinational exercise—Robotic Experimentation and Prototyping augmented by Maritime Unmanned Systems in September 2022. This activity is an experimentation exercise that is conducted annually, whereby large-scale experimentations are proposed in which operational communities work together with academia and industry in order to advance and test innovative operational concepts and requirements, interoperability, interchangeability, technological developments, as well as encourage new progress in platforms, sensors, payloads, and processing capabilities with unmanned systems that are used in maritime operations.
The main scope of the experimentation performed was to develop a rapid environmental assessment (REA) of the ocean bottom, littoral topography, and over the very shallow water domains in order to prepare for an amphibious assault. MUS were employed together with legacy systems to run a high-resolution hydrographic survey and photogrammetric remote sensing. Rapid environmental assessment is described in military doctrine as a systematic and comprehensive process that provides just enough information and knowledge for the understanding of the effects of the environment on military operations. For this study, the surveyed areas were chosen for an expeditionary amphibious landing operation. The main aim of REA is to shape the battlespace and to have a tactical advantage through the exploitation of the environment.
The development of USVs in the last decade is faster than ever, and they are already proving their efficiency in military and civil domains, with a big focus on hydrographic surveys and reconnaissance missions [
11].
The present study commences with a portrayal of the survey region and data collection procedures that are executed by a prototype of unmanned vehicles, which are equipped with an advanced multibeam echosounder, thus accentuating the advantages over a conventional legacy system survey. The primary focus of this manuscript is devoted to the techniques employed for processing the data, primarily utilizing a recognized rapid and automated processing approach, with a particular emphasis on the workflow methodology, processing time, accuracy of the final products, and on error identification. In the final section of this paper, the analysis centers on the practicality of the resulting products and their comparison with the outputs of a traditional multibeam survey that was conducted via a manned vessel.
Further research is required to investigate the efficacy of established processing techniques for conducting hydrographic surveys by using small unmanned vehicles across a range of survey environments, from shallow to deep waters. This study endeavors to evaluate the practicality of utilizing the Combined Uncertainty and Bathymetry Estimator (CUBE) algorithm for the purposes of conducting hydrographic surveys with a small, unmanned vessel. The proposed solution serves as a proof of concept that can be employed by diverse stakeholder groups for environmental assessment purposes.
2. Materials and Methods
2.1. Target Area
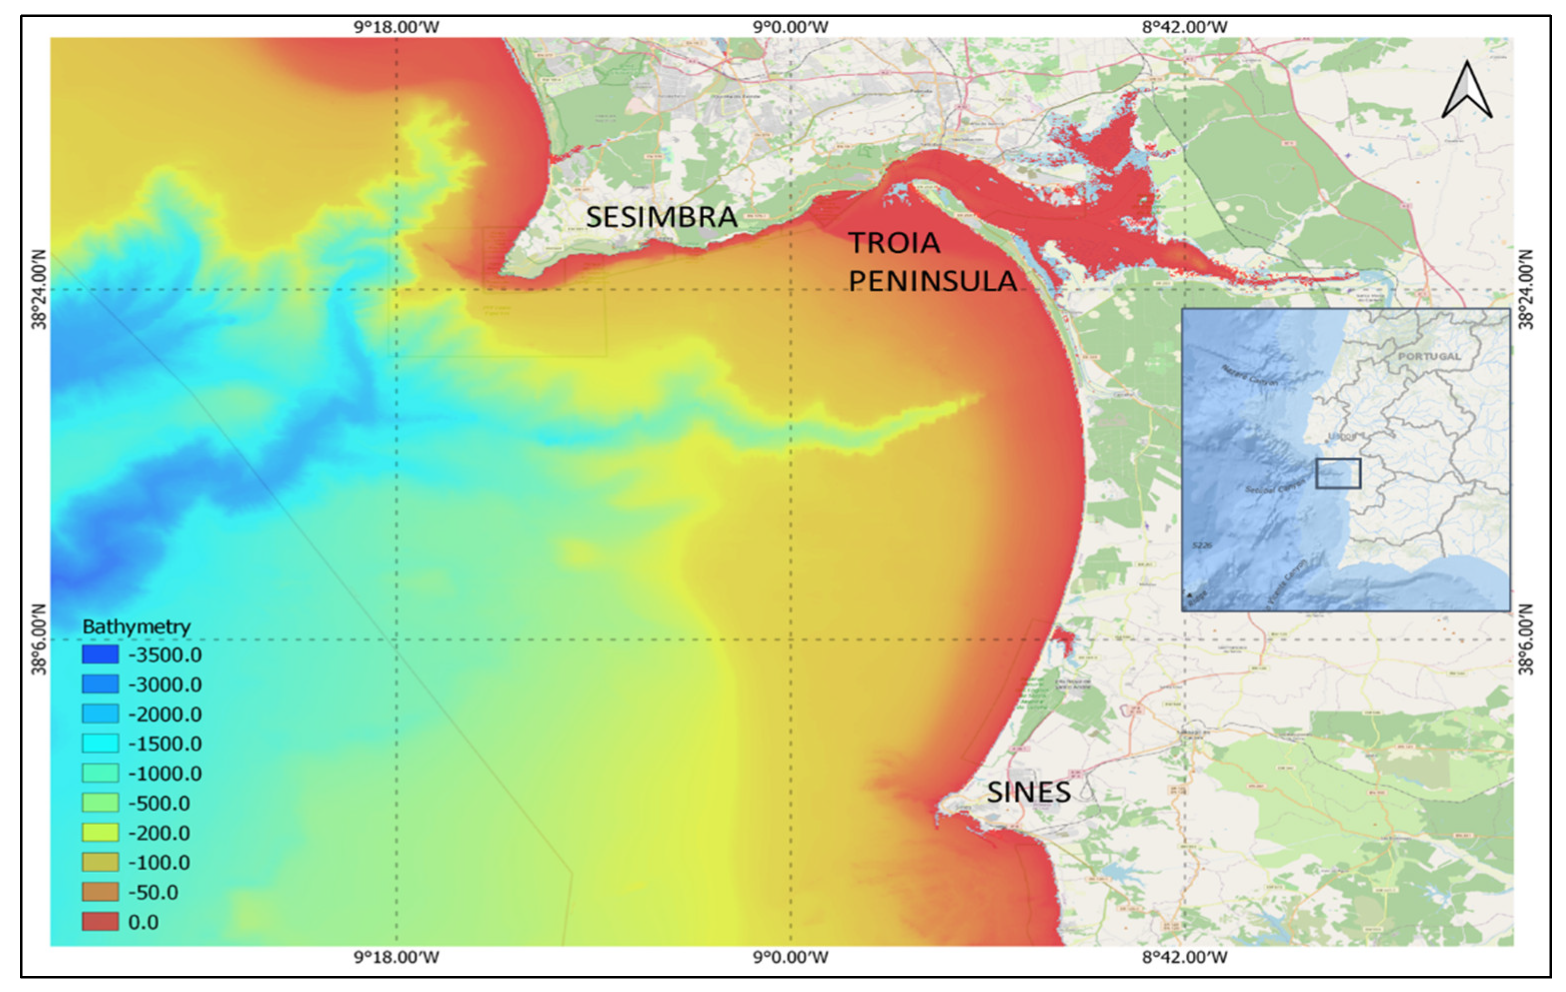
The experimentation area is situated in a coastal region along the Portuguese continental shelf and inside the Sado river estuary, which is limited by the Sesimbra to the Sines harbors, as is seen in
Figure 1. The main research activities were performed around the Troia peninsula, from deep ocean domains into very shallow coastal waters and inshore river areas.
This region presents important challenges to the use of MUS in an operational context, with a diversified battlespace and wide testing areas. The complex bathymetry is shaped by two important submarine canyons (Lisboa and Setubal), extended sandbanks around the Sado river mouth, and a narrow channel, which connects the Setubal harbor to the open ocean.
2.2. Meteorological and Oceanographic Conditions during the Exercise Period
This coastal domain is generally protected from the northwestern winds and wave swells, which are usually predominant from September to May. The local oceanographic parameters are strongly influenced by the interaction of the water masses with the two canyons, the semi-diurnal tide regime, and the outflow of the Sado river turbid waters. During the two-week exercise, the numerical models and observation networks from the Portuguese Hydrographic Institute recorded the following meteorological and oceanographic (METOC) conditions:
Wind conditions for the first two days of the exercise were light with varying directions. Wind speeds averaged under 10 knots. In the first week of the exercise, the wind direction shifted to the southern quadrant and increased to 15/20 knots before light wind conditions from the north set in again until the afternoon of 16 September. After that, and up to the end of the exercise, a northerly wind system set in over the area, fueled by the temperature gradient between the land and ocean. The mean wind speed was 10/15 knots when closer to land, and blew up to 30 knots offshore of Cabo Espichel. The wind direction varied between the NW and NE during this period.
The REPMUS22 was held in an exercise area that was mostly affected by very particular conditions of W and NW swells with very long period waves. These refract around Cabo Espichel or in the southerly swells, which are not common over the Portuguese continental coast during that time of the year. The wave conditions in the area remained very calm during the full length of the exercise with significant wave heights that averaged around 0.5 m, as well as with wave directions coming from the W.
The air temperature remained mostly stable during the full period, with the first two days being warmer due to a local high-pressure system that brought, during the day, the temperature up to 28/30 °C inland and 18/20 °C over the sea. During the rest of the period, the maximum air temperature inland averaged 24 °C and 20 °C over the sea. The minimum air temperature averaged 16 °C over land and 18 °C over the ocean.
The surface current velocity and direction in the REPMUS area were mostly dependent on the tidal current, with a semi-diurnal periodicity of 6 h. The current velocity was at its maximum at the entrance of the Sado estuary, due to the physical constraint of the flow, where it reached up to 0.45 m/s. Offshore and surface currents mostly followed the coastal drift, travelling from north to south and driven by the prevailing northern winds, thereby reaching speeds of up to 0.8 m/s near Cabo da Roca in the North, and Cabo de Sines in the South.
In the maritime battlespace, the ocean surface becomes the interface between the underwater and above-water domains. This frontier is used by many manned and unmanned systems to remotely observe the previous domains. During the REPMUS22 exercise, different USVs were tested in order to conduct REA operations by surveying the ocean bathymetry, as well as the surface wave and current dynamics.
To test the USV assets under different METOC conditions, two different areas were chosen inside the exercise area based on the idea of inserting additional challenges for unmanned systems operation (which is summarized in
Table 2):
The inshore area. Small USVs were used to perform harbor bathymetric surveys.
The offshore area. A medium size USV was used to perform a bathymetric survey along an amphibious landing beach, which is the experimentation described in this study.
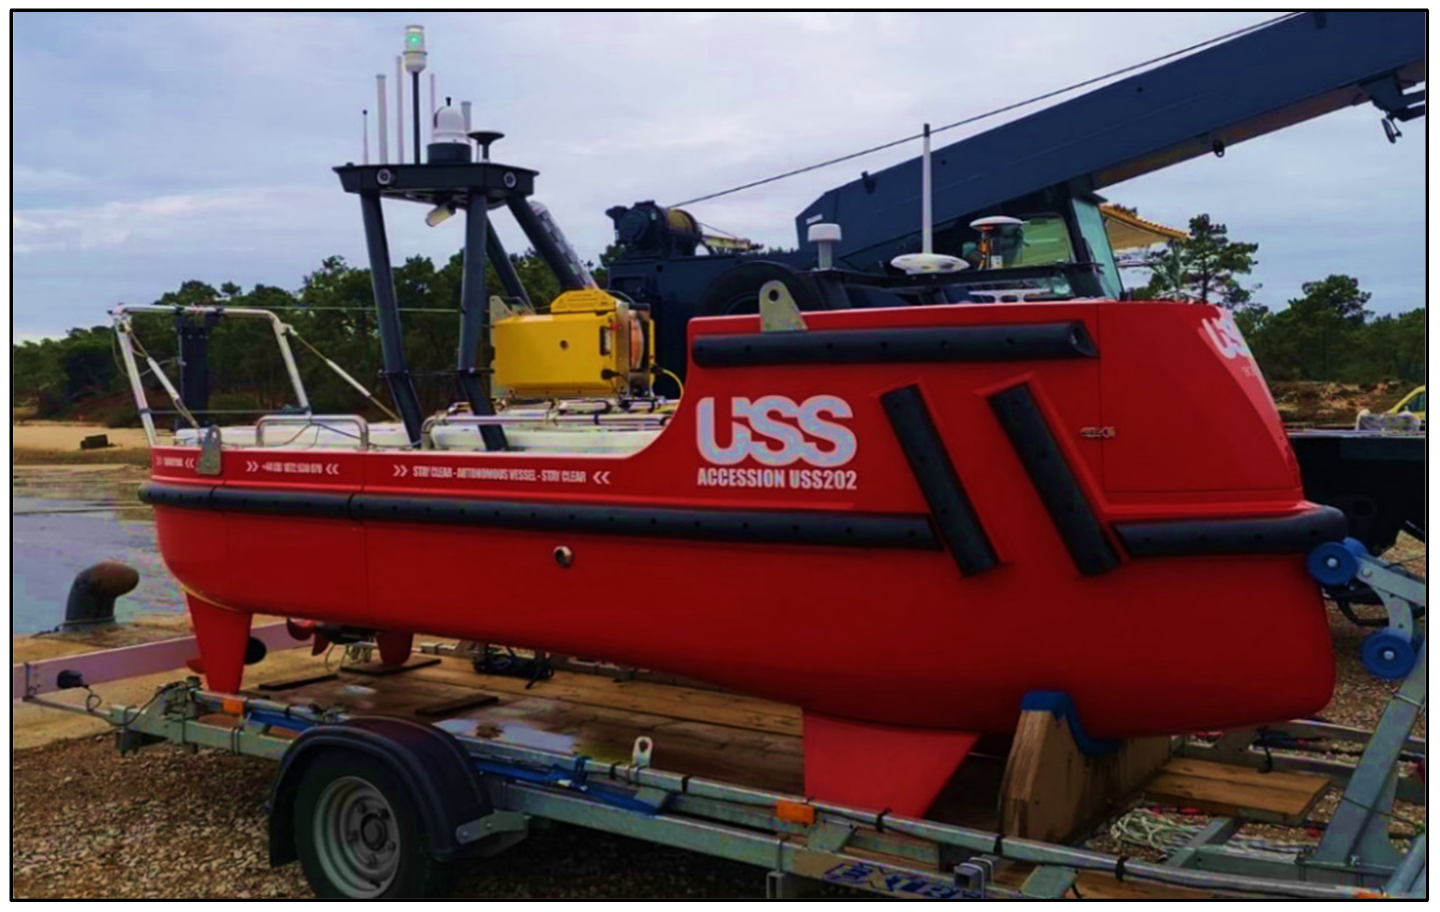
This evaluation is founded on a comparative analysis of the hydrographic surveys that were conducted via two distinct survey systems: one was implemented through conventional methods utilizing a survey vessel—namely the Romanian Navy hydrographic vessel ’Cpt. cdor. Alexandru Cătuneanu’—and the other was accomplished by an innovative unmanned surface vehicle prototype that was developed by the British company Unmanned Survey Solutions (with a sponsorship from the Royal Navy (
Figure 2)). The Romanian hydrographic vessel was equipped with a cutting-edge Kongsberg 712 multibeam sonar and featured a medium-depth range (up to 3600 m depth in ideal sound propagation conditions), thereby offering various beam widths and transmission modes. The multibeam sonar was integrated with the ship’s positioning and attitude systems together with a Seapath 380 Differential Global Navigation satellite system (DGNSS) receiver that contained the most recent Kongsberg MRU 5+ motion reference unit.
2.3. Unmanned Survey Solutions Accession USV Prototype Platform and Data Collection Process
The USS Accession class USV [
13] is a medium-sized modular vehicle that offers three variable boat lengths depending on the desired configuration and additional hull sections (from 3.5 m to 5 m) with a small 0.5 m draft. It incorporates a reverse bow design and stabilization fins for the purposes of operating in challenging offshore environments. For proximity works or as an emergency backup it has a standard remote control (RC) capability with a user-friendly interface for the remote.
The USV uses long-range Wi-Fi or 4G networks for operating the USV. In addition, the survey operation is run through a remote terminal access to the onboard computers. Regarding the propulsion system, it has direct current powered thrusters as standard, or diesel pods, as required, with a survey speed of 4–5 knots and an 8 knot maximum speed. The endurance is dependent on the module used, varying from 12 h on the small version to up to 8 days for the 5 m version of the USV.
The Accession USV is designed to be modular and is thus fitted to mission purposes. For this exercise, the USV used the R2Sonic 2024 Multibeam sonar, as well as a Hemisphere Vector V200 GNSS and SBG MRU as the motion sensor. A sound velocity probe was mounted at the stern with an automatic electric winch for the purposes of deployment and recovery.
The survey area has several unique particularities, one of them being the estuarine environment, which is where the fresh river water is constantly mixing with the salty ocean waters and tide currents, thus impacting the sound propagation through the different water vertical layers. The collection of sound velocity (SV) measurements across the survey area provides the spatial distribution of the SV regime. Once this spatial variation is established, the dynamics of the SV regime (temporal variations) are required to be determined. The temporal variation of the Sv regime is to be revealed by regular observations throughout the whole day of the survey, as this variation is strongly influenced by the tidal currents and the river’s freshwater outflow. Usually, the first day of a hydrographic survey serves for the purposes of tests and error calculations that also include determining the SV spatial and temporal variations across the target area. The SV is of great importance in terms of gathering ocean depth information with a single beam echosounder (SBES), but it is of paramount importance when using a multibeam echosounder (MBES) since the knowledge of refraction is critical and provides a very large input into the final sounding error budget of the survey task. The SV increases with the increase in temperature, salinity, and pressure (depth) to the following approximate values: 3½ m/s/°C, 1.3 m/s/‰ & 1 m/s/60 m.
To overcome this environmental challenge, several sound velocity probes were executed daily or twice per day to properly calibrate the multibeam echosounder transmission. As seen in
Figure 3, although the survey area has very shallow depths that normally keep the SV constant, the sound velocity is rapidly changing from 1524 m/s to less than 1521 m/s, causing a 3 m change in the SV. This error could propagate throughout the survey if it is not corrected in real time operations or in post-processing.
The present study details the survey design, which involved the development of both primary and cross-check lines that accommodated the survey specifications. The overarching objective was to perform a full seafloor survey, necessitating the overlap of the multibeam sonar swath width between the track lines to achieve full seafloor coverage. The spacing between lines, which was dependent upon the water depth, was established and implemented at a distance of 25 m. To validate the multibeam data in the field, multiple cross-check lines were executed. Notably, as demonstrated in
Figure 4, the onboard MRU and navigation sensors facilitated exceptional line heading accuracy in the autonomous vehicle, which is a distinct advantage over traditional vessel survey systems where the helmsman manually steers the survey line.
The USV can acquire environmental data autonomously and communicate in real time to a ground control hub. For the purposes of operating the vehicle, a minimum of two persons is necessary: one for monitoring the navigation and safety of the platform and the other to control and monitor the hydrographic survey data collection. The surveyor has real-time access via an Internet connection to the hydrographic acquisition computer that is onboard, such that they can follow the survey parameters and can perform manual interventions, if needed. The navigation is monitored on another computer using commercial drone navigation software. The hydrographic data can be downloaded in near real time from the vehicle using a remote Internet connection. This process reduces the timing from the collection of the data to the final product, as the surveyor can start processing the data without having to recover the platform.
As it can be seen in
Table 3, both multibeam echosounders are state-of-the-art equipment offering a great density of collected points and with roll stabilized beams. The main difference between the multibeam systems is in the frequency range, due to their distinct maximum sounding depths—the system onboard the NMH Cătuneanu is designed for medium depths while the other system is for shallow water surveys. The main proportion of acoustic power reaching the seabed from the transmitting transducer of the multibeam echosounder is reflected on the surface. A percentage of the transmitted pulse penetrates the seabed and, if the pulse is of sufficient power, echoes will be received from firm sub-bottom boundaries, such as sediment or bedrock. Low frequencies give the greatest penetration hence 1–15 kHz systems are used for geological work. A 40 kHz system, such as the Kongsberg EM 712 might penetrate silt sediments; meanwhile, a 300 kHz, such as a R2Sonic 2024 system would record reflections from the silt alone. Depths derived from systems of different frequencies may therefore differ depending on the composition of the seabed. However, high frequencies are attenuated more easily than low frequencies; low frequencies require a larger transducer to provide a shaped beam that is not too wide. High frequencies provide more accurate depths, and this is the reason for installing them on USVs; therefore, deep echo sounders have lower frequencies than those designed for continental shelf work. The multibeam sonars used for this experimentation were operated on a range of frequencies to produce the best compromise between range, beam width, and accuracy.
2.4. CUBE Algorithm
In recent years, multibeam echo sounders are the most widely used due to their wide swath and constantly improved resolution and accuracy of bathymetry [
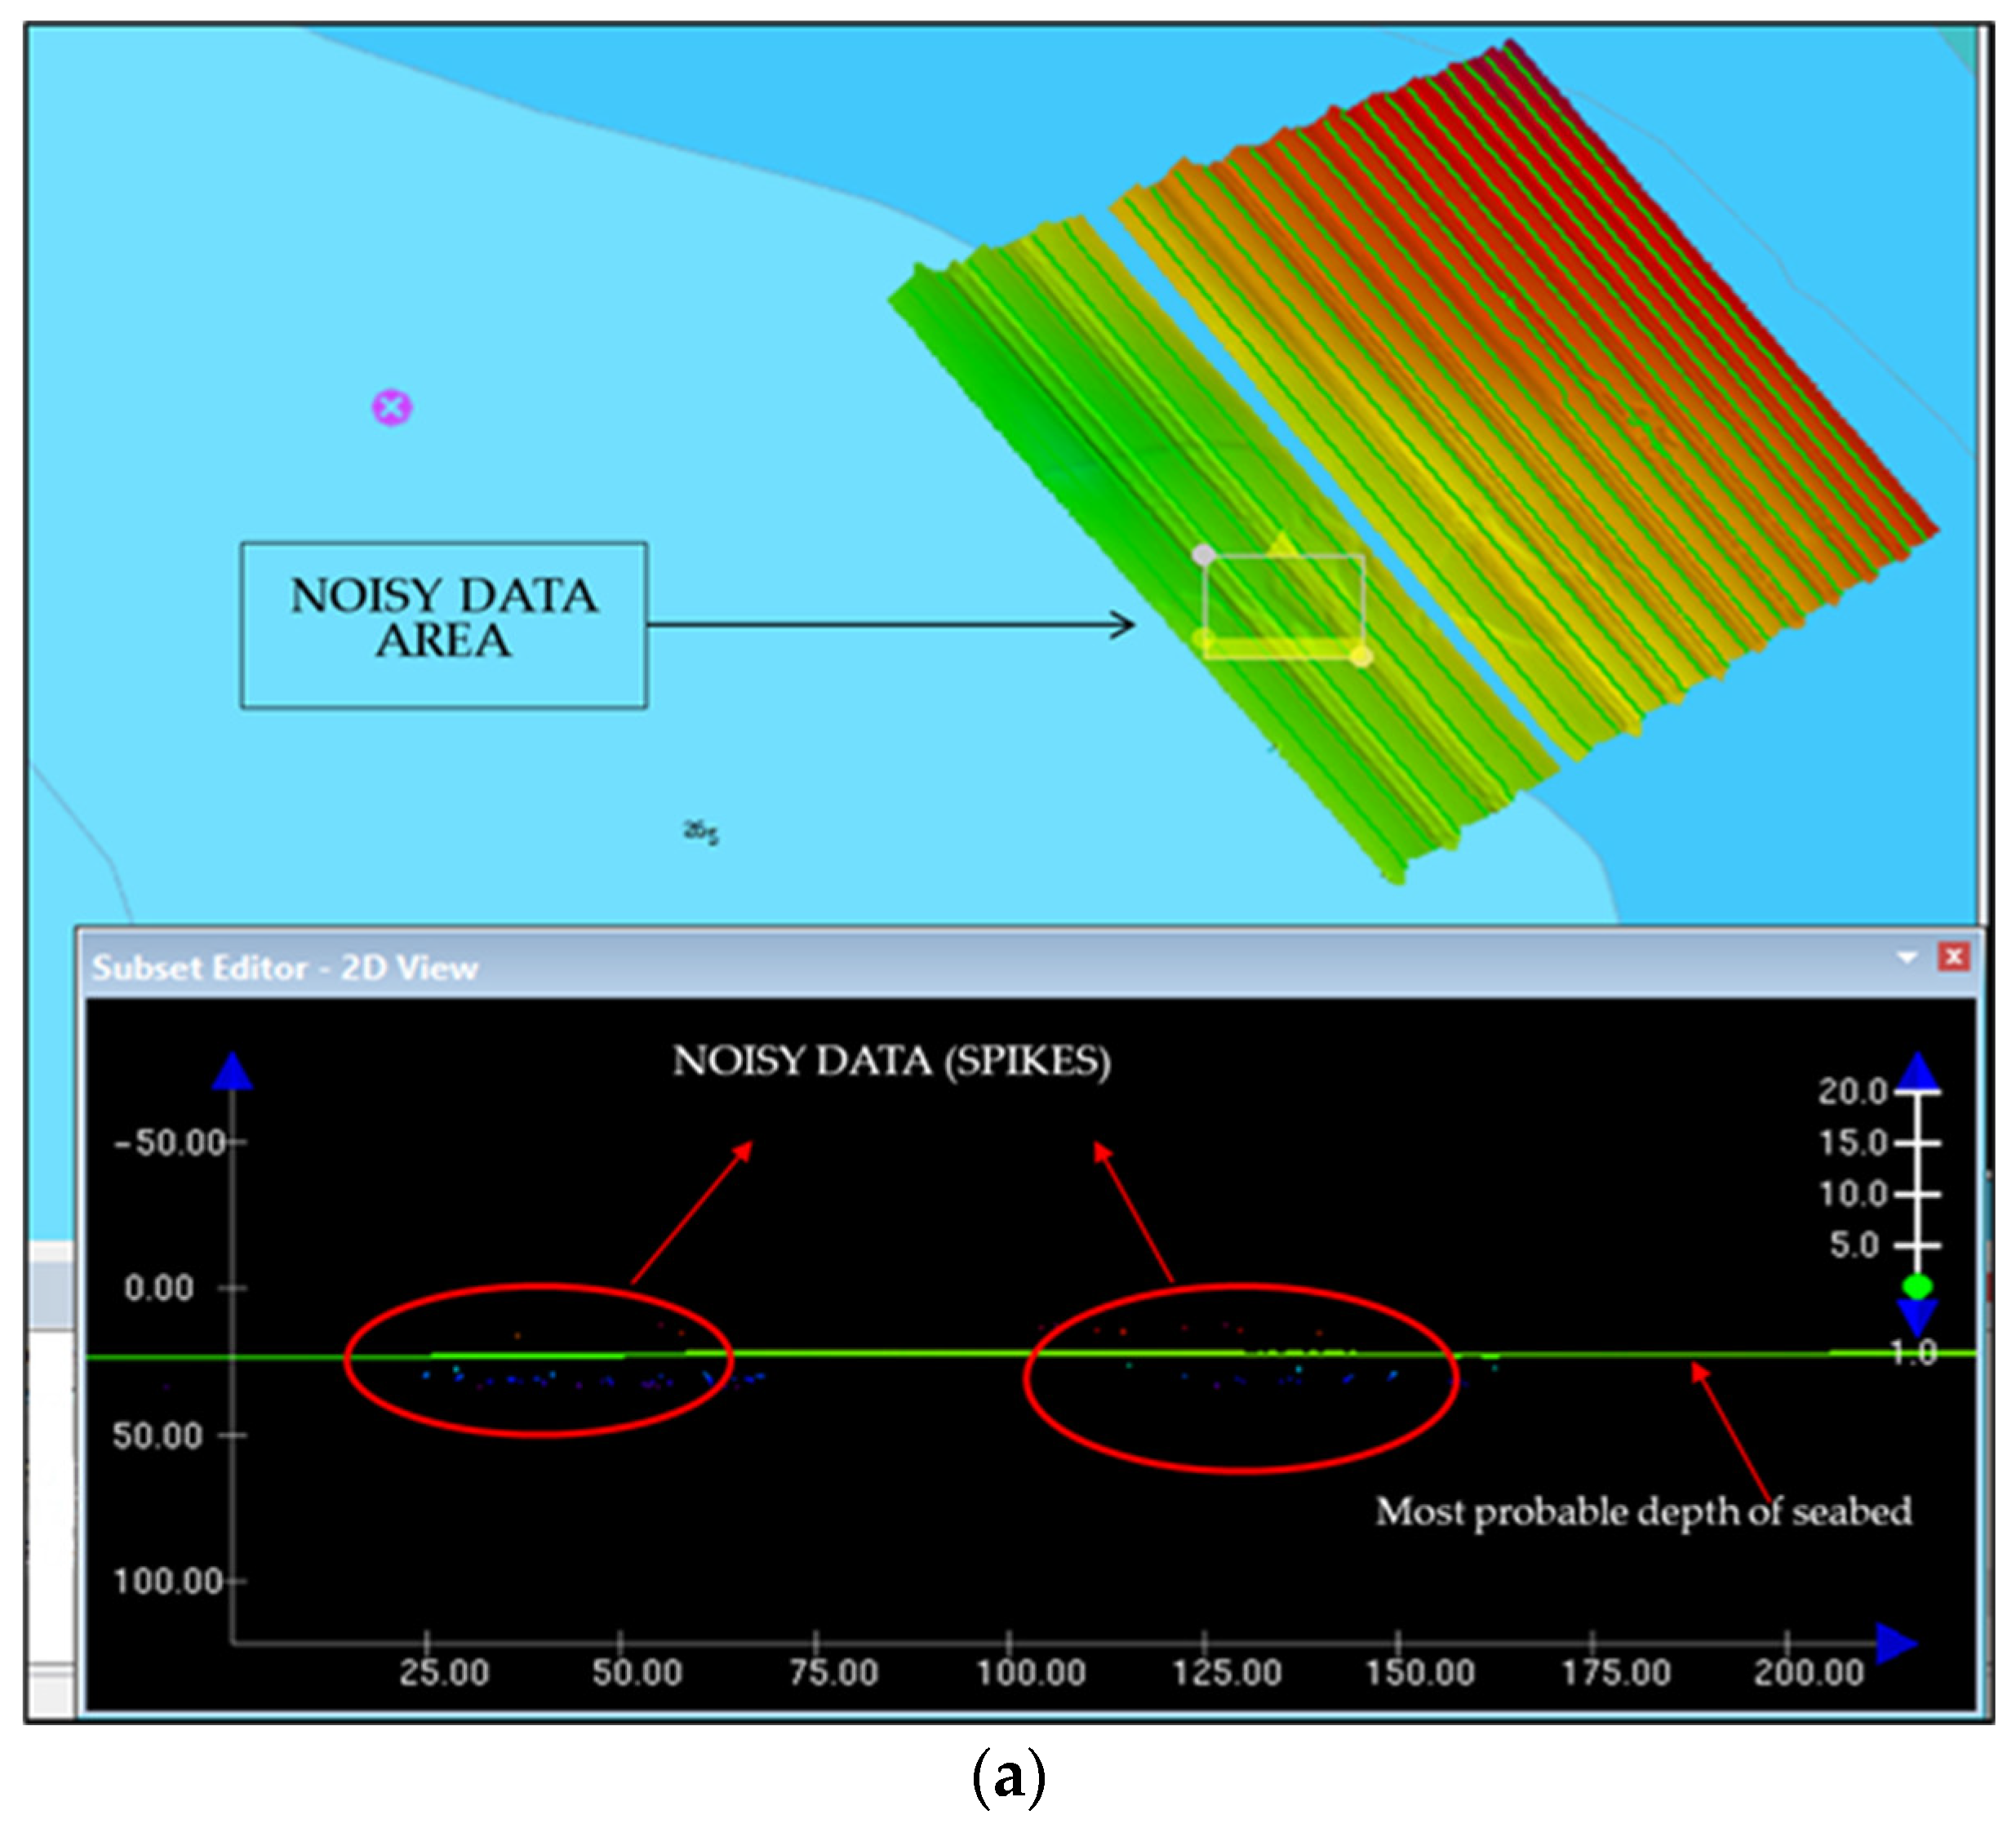
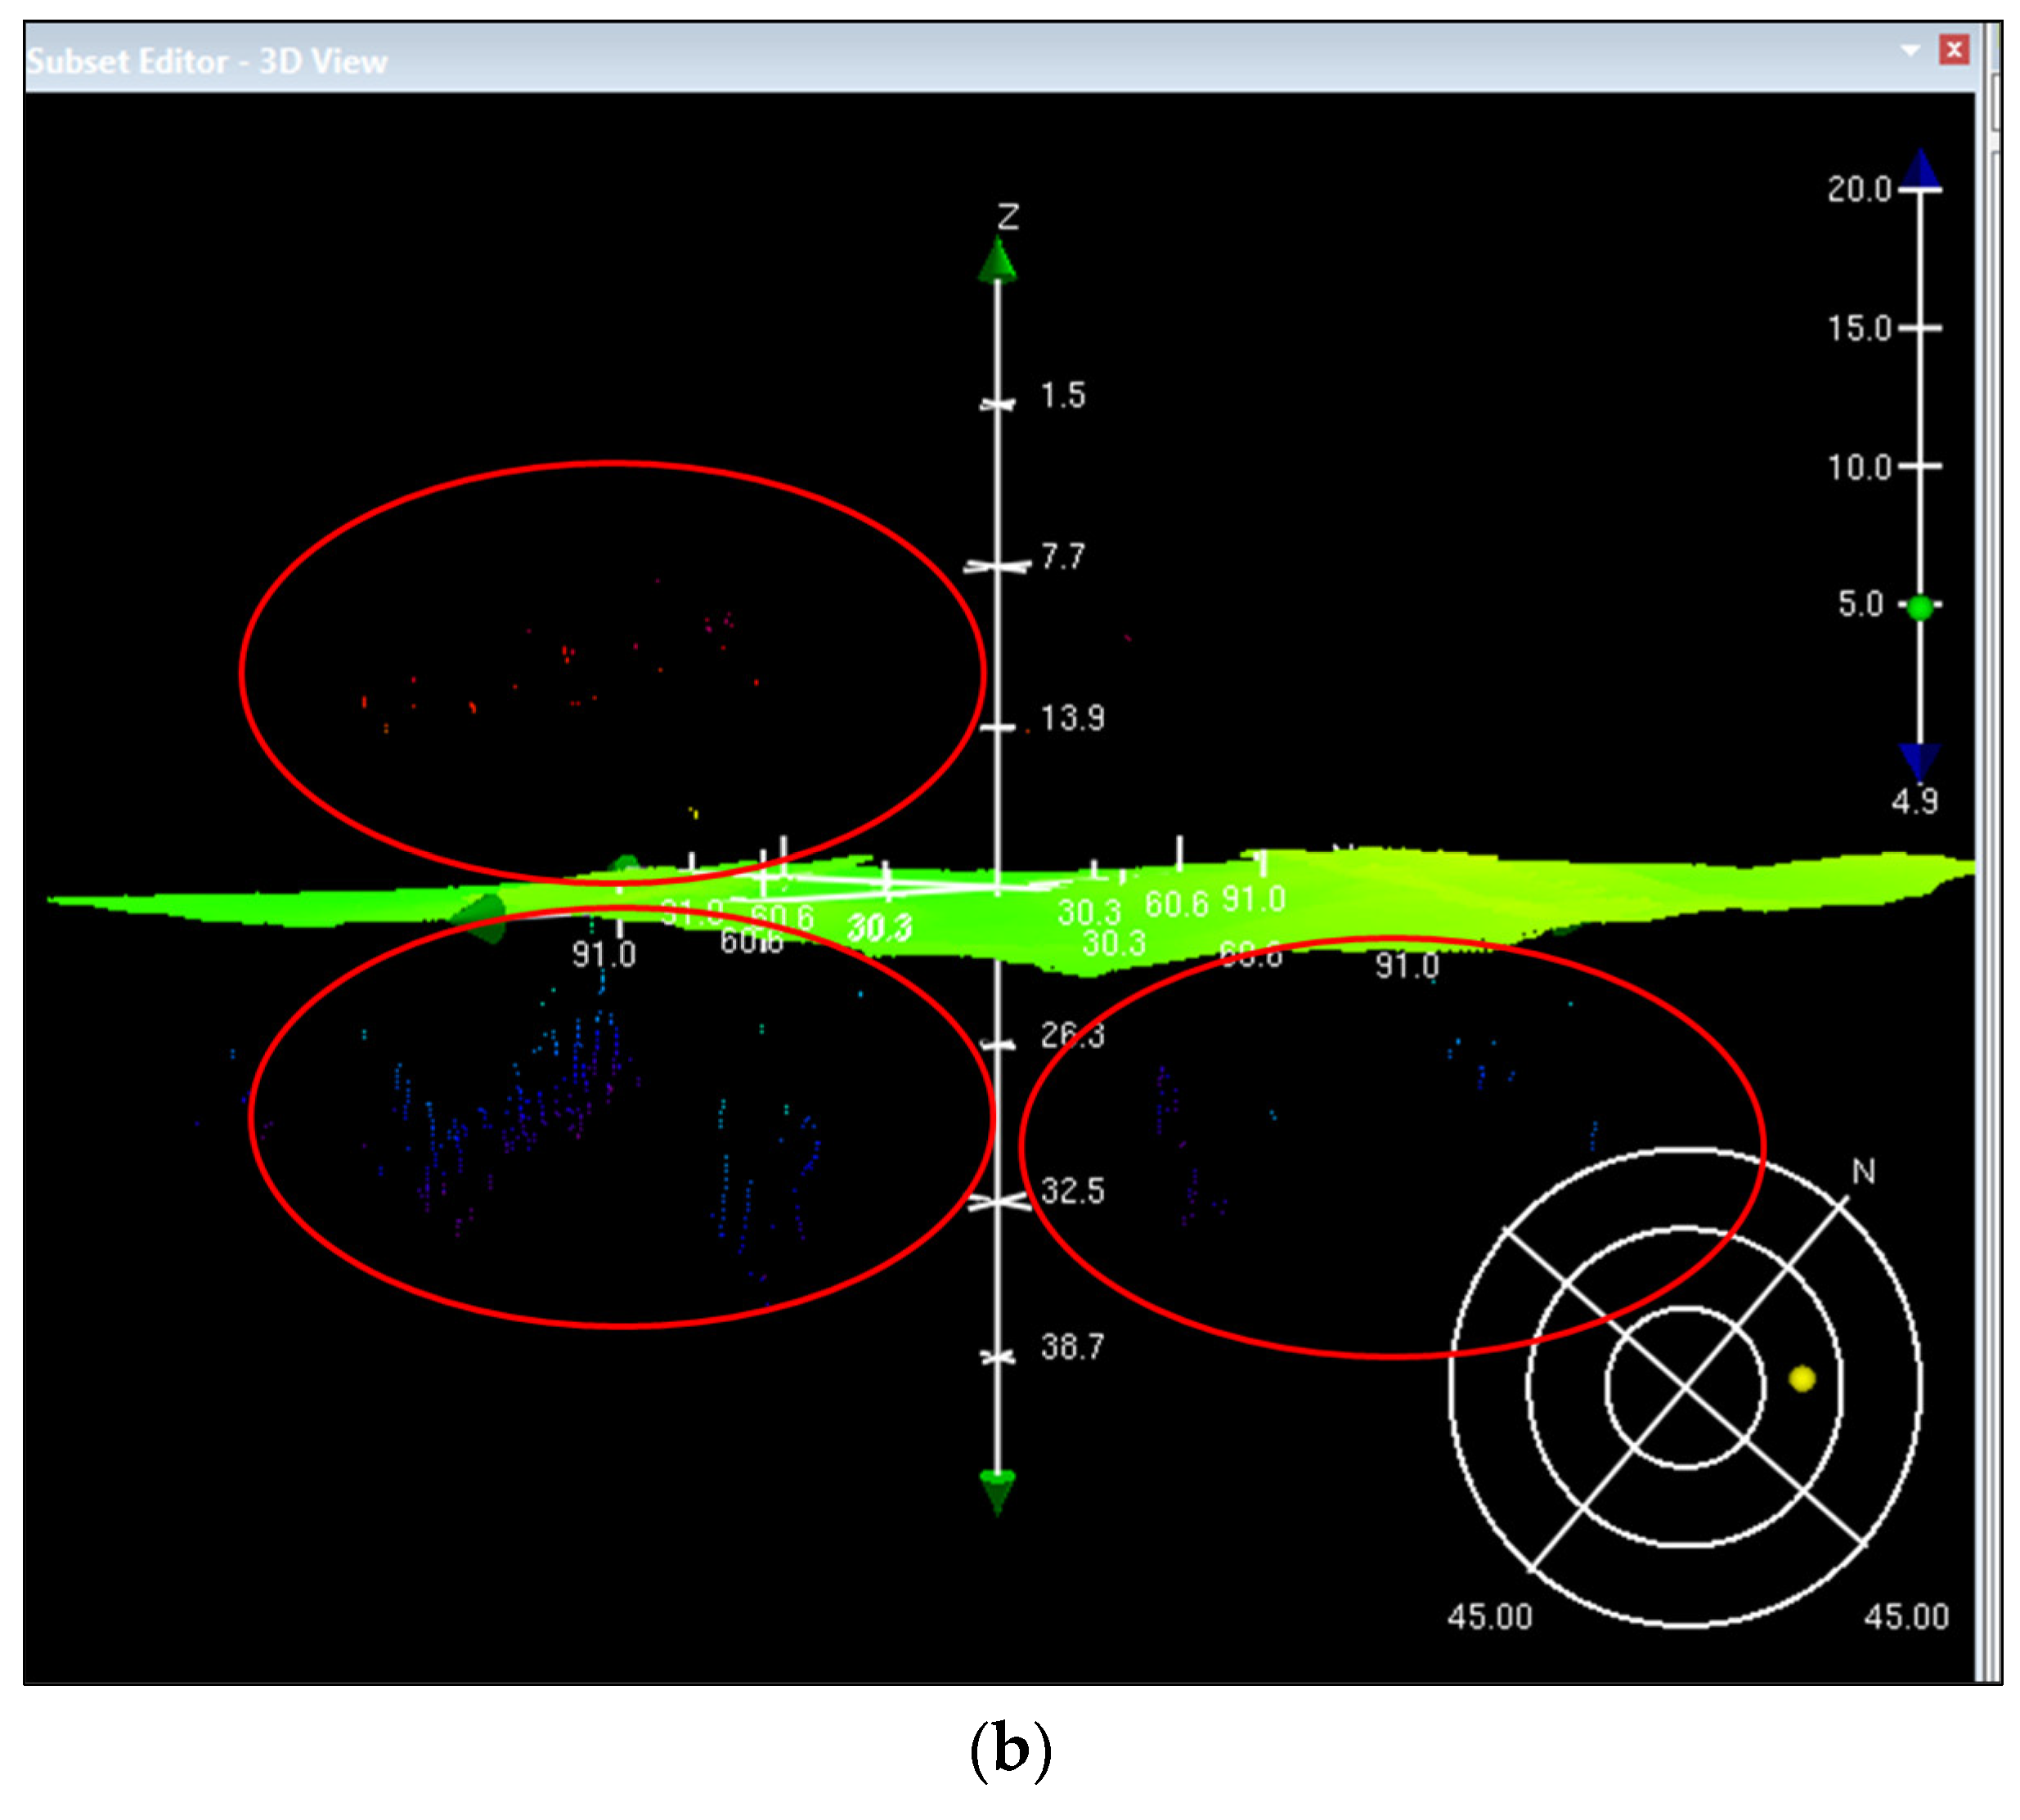
16]. Generally, conventional data processing is more time-consuming than the survey itself. The essential steps in the processing of the multibeam are the detection, analysis, and elimination of conflicting data (known as spikes), as is seen in
Figure 5 [
17,
18,
19,
20].
In a hydrographic survey, the atypical values are mainly produced by the poor performance of the bottom detection algorithms that are utilized by the multibeam echo sounder (phase, amplitude, etc.) and from the different errors that are produced by the sound travel in the marine environment: side lobe detections, reflections, air bubbles near the sonar transducers, oceanographic effects, or interferences with other systems operating in the same frequency and proximity with the multibeam echosounder [
21,
22]. Several algorithms were developed in order to facilitate the time-consuming work of the hydrographic surveyor, as well as for the algorithms for accurate bottom detection and spike detection, such as in [
18,
19,
23,
24,
25,
26,
27,
28]. For this specific survey, the CUBE algorithm proved to be able to estimate, with a high accuracy, the bottom depths.
Accordingly, for achieving REA products, one of the most well-known hydrographic software was used—Teledyne Geospatial’s Caris Hips and Sips [
29]. The raw data derived from the data collection activity were reprocessed with the real tide observations that were coming from the tide gauge installed in the Sesimbra area and with the in situ SV measurements in order to properly calibrate the travel of the echosonder beams through the water column. The resulting raw surfaces were then inspected, and a rapid point cloud cleaning was performed to remove the most prominent ambiguous or noisy data (spikes). Finally, the surfaces were again processed using the CUBE algorithm, and thus new CUBE surfaces were generated.
The CUBE algorithm starts with a quantitative estimate of the errors associated with each sounding [
30]. This process is platform and system specific; as such, for this experimentation, the estimate of the error values that were defined for the R2Sonic multibeam system from the Royal Navy hydrographic office was used. The algorithm generates distinct nodes, which denote point locations arranged in a network over the survey area. The depth uncertainty estimation is linked to each input sounding after it has been transferred from its original location to a nodal location. This procedure is contingent upon the depth and horizontal uncertainty attributes associated with the sounding measurement itself, as well as its distance from the nodal point. Therefore, when a sounding is not located on a node, its vertical uncertainty progressively increases (propagates) with the distance it must travel to contribute to a node in the network. The distance or depth exponent is the parameter utilized to regulate the exponential growth of a sounding’s vertical uncertainty, as a function of its distance from the node. As a consequence, the larger the depth exponent, the quicker a sounding will be disregarded for the use of a depth estimation at a given node. In regard to this, the surveyed area, which has as a characteristic a small slope and a relatively flat bottom, took advantage of a larger depth exponent value. Therefore, the process was easier and faster to run as fewer soundings were contributing to the CUBE surface. Where the seabed was changing dramatically, the value would be set smaller, such that the sounding being addressed would only affect the nearest nodes. The main equation that the CUBE algorithm is based upon is described by Calder et al. [
31]:
where
σp = propagated uncertainty (standard deviation) in depth only, after translation of a sounding to a nodal point;
σv and σh are the vertical and horizontal uncertainty attributes that are associated with the input sounding (at its original location);
dist = distance from the sounding location to the node;
node_spacing = is the distance between the nodes;
hes = is the horizontal error scalar (operator variable);
de = is the distance exponent (operator variable).
The horizontal error scalar (hes) is the value used to scale the horizontal error of each sounding when used in the radius of influence computation. The value range was {0.0 and 10.00}, and the default = 2.95 (99% CI). By including the horizontal error scalar, the algorithm neatly converted the horizontal error in the sounding position into a vertical uncertainty at the node. The distance exponent (de) is used to control the exponential growth of a sounding’s vertical uncertainty as a function of the distance from the node. The value range was {1.0 to 10.0}, and the default = 2.0.
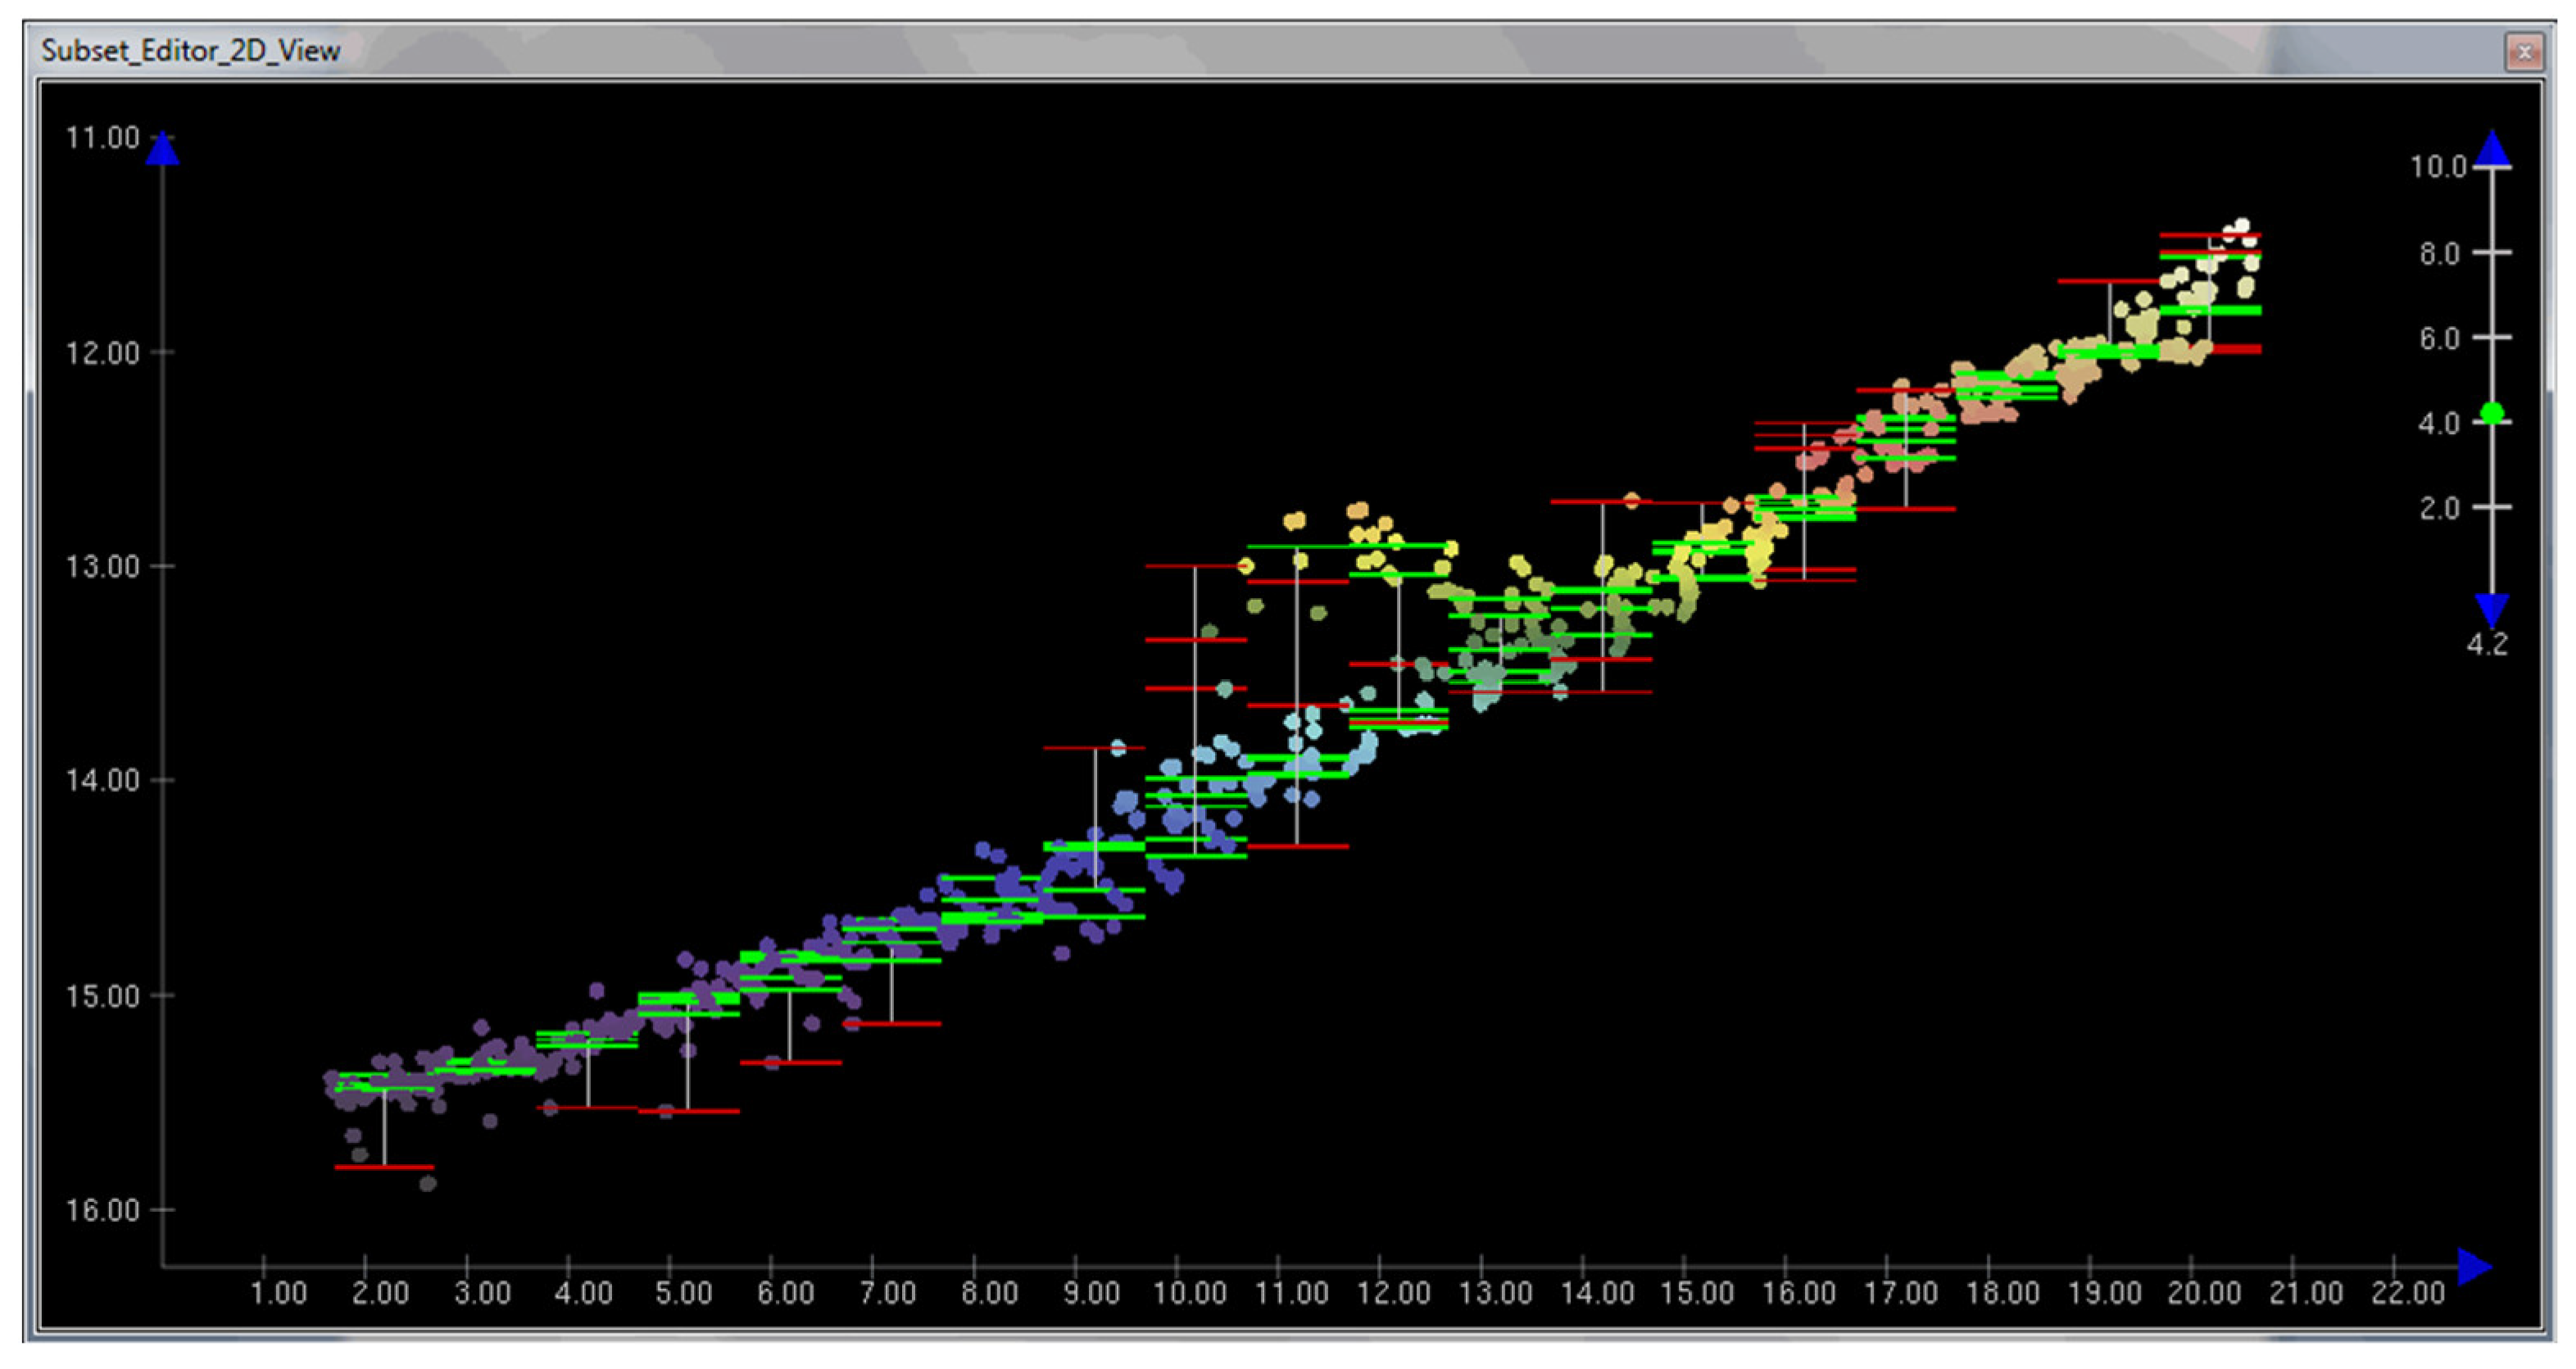
The CUBE algorithm estimates the depth at the central point of the grid by utilizing soundings within a specific distance from the center, as defined during the surface creation. The soundings are weighted based on their distance from the center and their associated uncertainty. The first sounding that is processed from the input queue structure is taken as the initial hypothesis regarding the depth at the central point. The second sounding is then compared to this hypothesis, and if they agree within their respective uncertainty limits then the second sounding is assimilated with the initial hypothesis. If they do not agree, the second sounding forms the basis of a new hypothesis. Subsequent soundings are processed similarly but are compared to all existing hypotheses at the node in order to determine the closest match. If the new sounding is found to be closest to an existing hypothesis, it is compared with that hypothesis for a potential assimilation or intervention. The operator may control the limits for intervention.
In the final steps of the CUBE process, disambiguation is the process by which CUBE attempts to choose one of the potential depth reconstructions (‘hypotheses’) at a node in order to represent its best estimate of the depth there. To allow the user to make decisions on which is the correct hypothesis, the CUBE algorithm is built to store and maintain all hypotheses, such that the rules by which the ‘best’ is chosen can be changed by the user at run time. For this experimentation, the ‘Density and Locale’ disambiguation method was used. The CUBE algorithm takes advantage of statistical redundancy in dense multibeam sonar data while tracking the uncertainty associated with the estimates of the true depth [
32]. The technique constitutes a point estimator that incorporates uncertainties on all three axes, striving to derive the “most probable depth” at any given location within the survey region. The algorithm can accommodate situations where the data provides evidence for various possible reconstructions of depth and can maintain the corroborating evidence for each possible reconstruction separately. Upon resolving all ambiguity surrounding potential reconstructions, the outcome from the CUBE algorithm consists of a set of point estimates of depth and their associated uncertainties, which is dispersed throughout the survey area (as shown in
Figure 6).
The indication of multiple hypotheses, or low hypothesis strength, is normally taken as an area that requires a supervisor to check that the disambiguation has chosen the correct surface. For example, a small object/wreck may be enough to create an alternative hypothesis, but when all the soundings from the surrounding seabed are used in the CUBE algorithm then the disambiguation process may ignore the wreck. High-density soundings and a small node interval (i.e., grid size) will help to define the correct surface.
The CUBE surface was regularly checked for blunders or systematic errors after computing real tide information and by inspecting the errors in the navigation of the USV. The CUBE algorithm attributes each sounding with an estimation of horizontal and vertical uncertainty and then defines specific nodes—point locations arranged in a grid over the survey area, which are called the CUBE estimation node [
31]. The only unknown in the equation of this estimation node was the height, which will be defined by MBES soundings around that node. Closer soundings with a smaller uncertainty will have a greater weight than soundings with a higher uncertainty (i.e., those which are far away) in determining the estimation of the elevation in that specific node.
Hence, the operator needs to relate only with that small subset of data for which there is some ambiguity rather than going through the current and very time-consuming process of subjectively analyzing all the data points from the point cloud. According to Calder et al. [
31], 41% of the total time to produce a processed bathymetric surface is allocated to data cleaning, but while using the CUBE algorithm this time is reduced to 6%. However, when using the CUBE method more time is allotted to troubleshooting and data processing than in traditional manual cleaning.
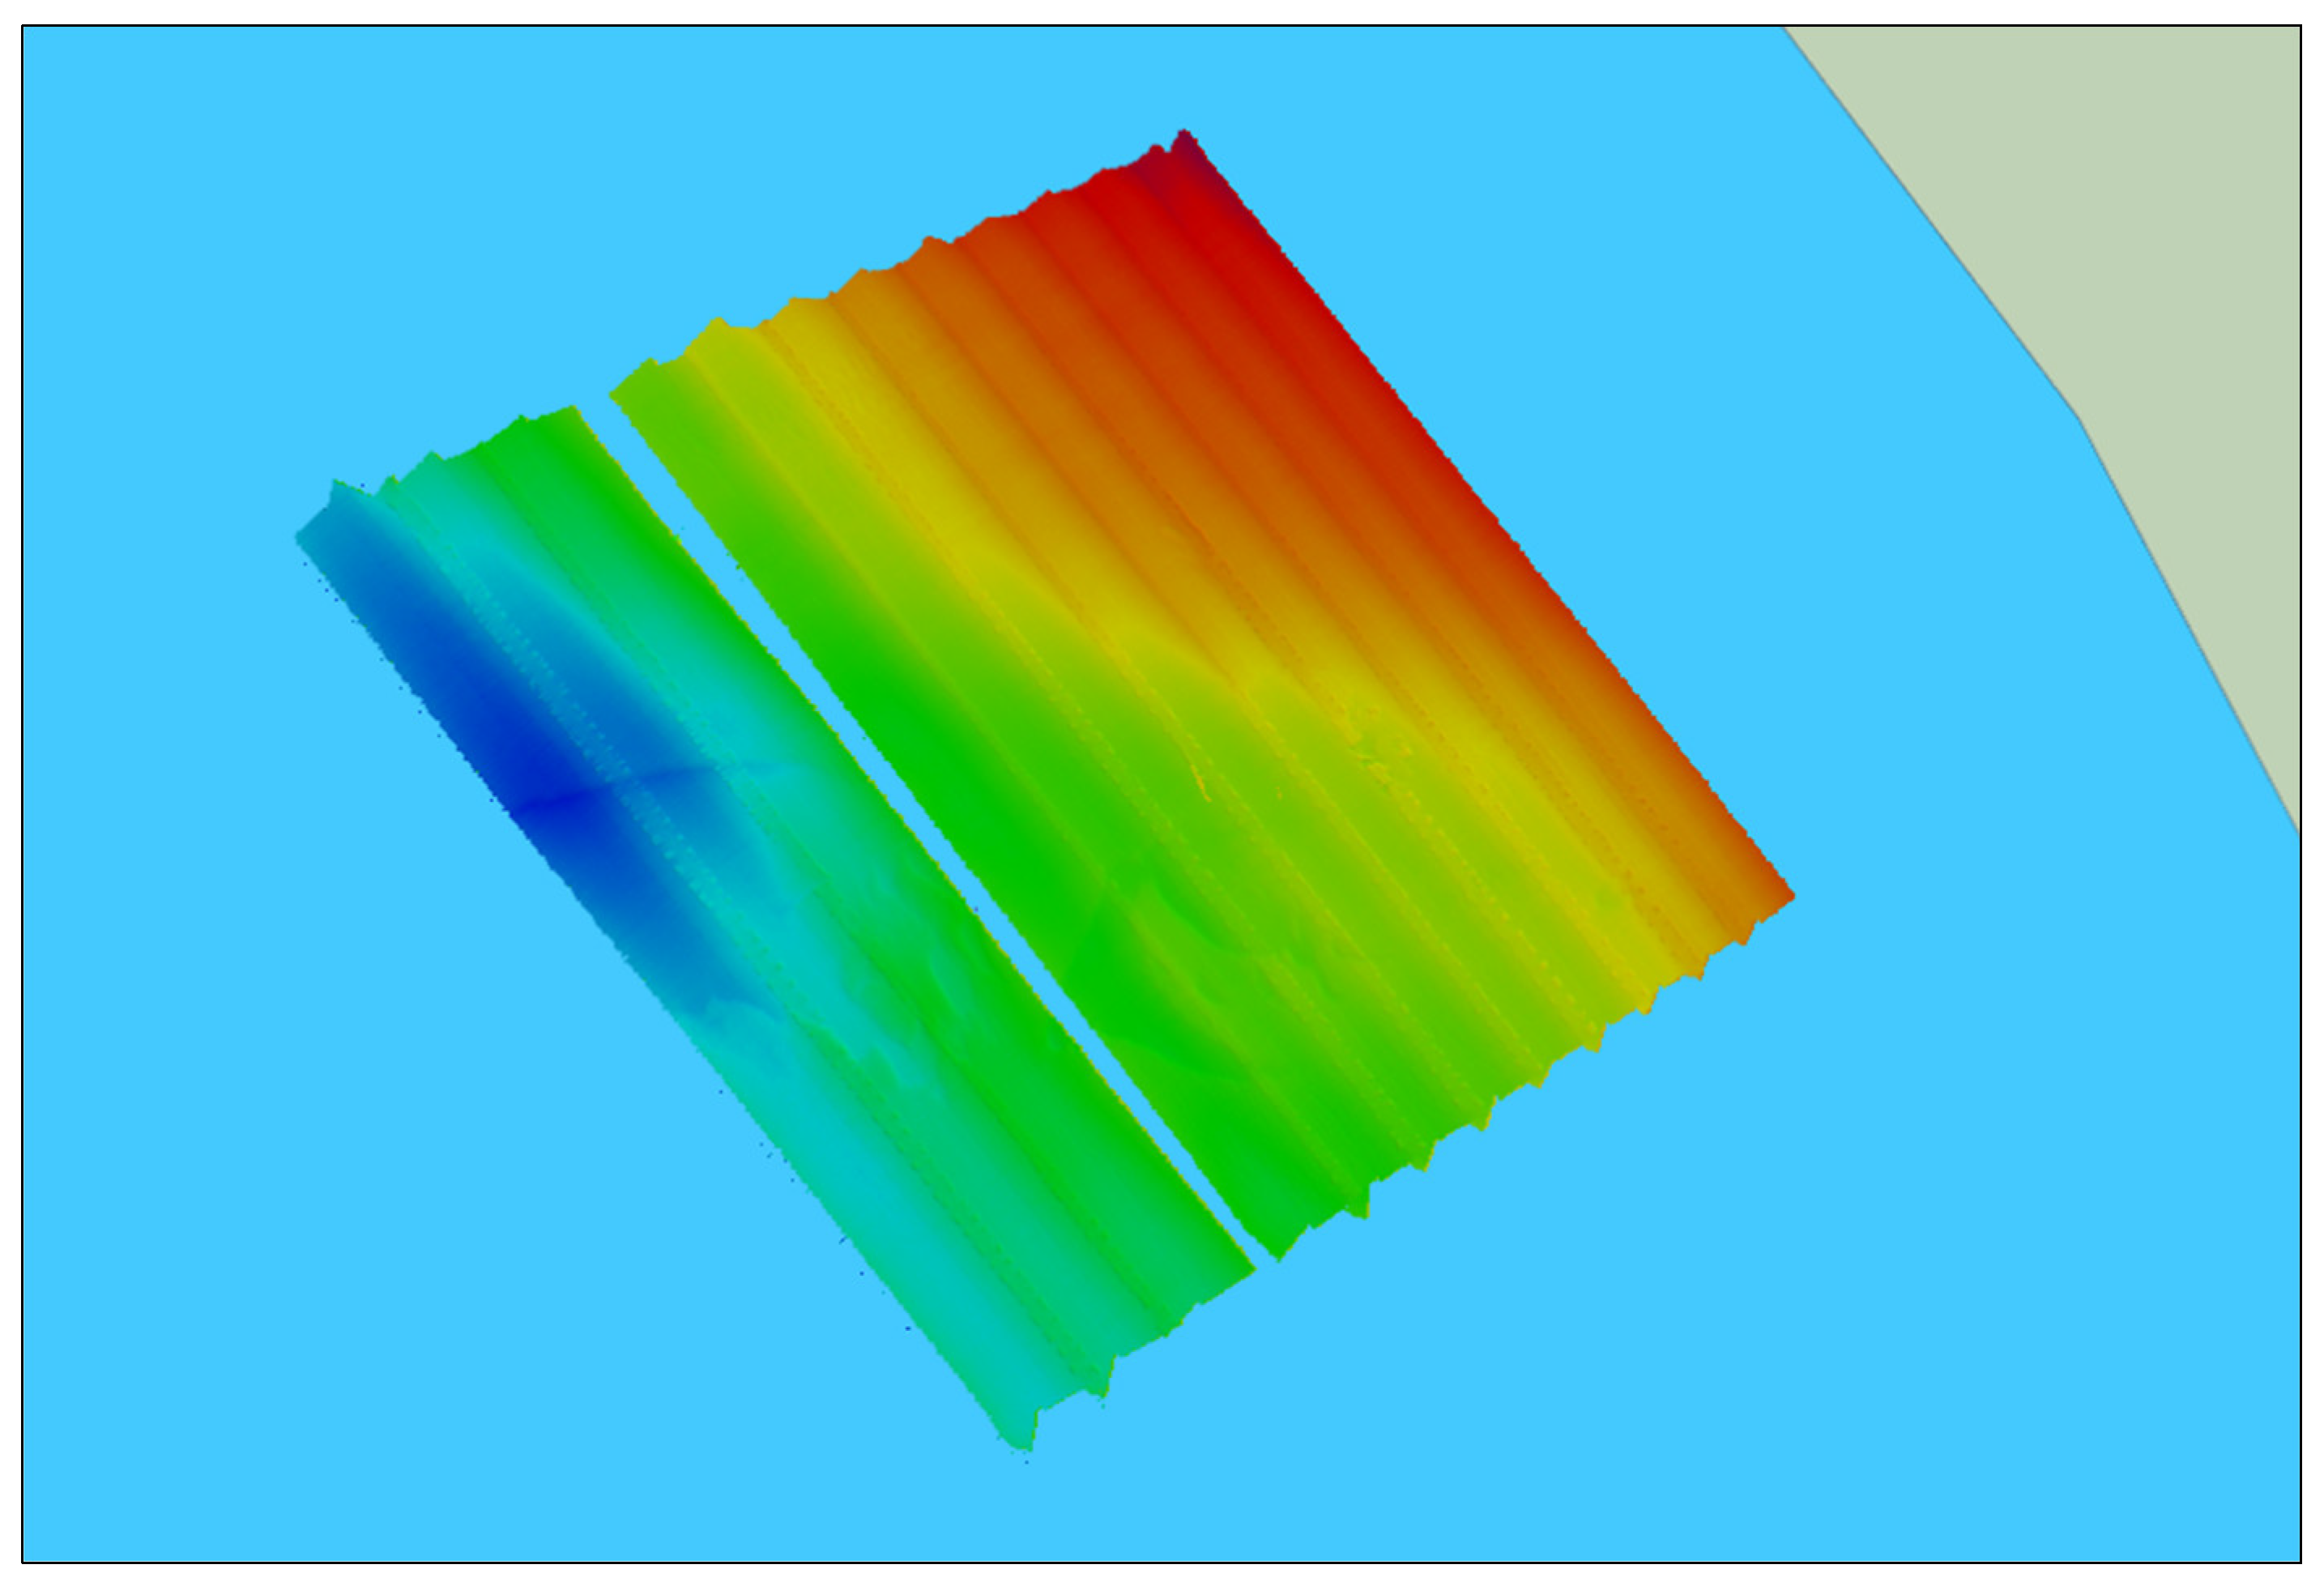
As seen in
Figure 7, the algorithm provides a rapid bathymetric surface to be further examined by the hydrographer. The CUBE surface should be inspected with great attention, especially where rapid changes in a slope exist. The CUBE algorithm provides a good estimate of depth on plain surfaces and produces a big number of depth estimates on slopes—estimates that should be carefully examined.
3. Results
To optimize the size-to-detail ratio of the data, multiple bathymetric model surfaces were generated after visually examining the data and performing a rapid point cloud cleaning to remove noisy or inconsistent data. Due to time constraints, the GNSS post-processing was not conducted. In traditional multibeam surveys, a GNSS post-processed solution significantly enhances vessel navigation and improves the accuracy and precision of re-positioning multibeam echoes on the seafloor. Particular attention was paid to areas where noisy data sets were identified, particularly on the slope area and where adjacent multibeam survey lines overlap. Several surfaces with different horizontal resolutions were generated in order to find the most computationally efficient final surface that retained the desired level of detail. Ultimately, the CUBE surface with a 2 m horizontal resolution was found to satisfy these requirements while remaining under the 15 Mb size constraint, which is for disseminating purposes.
3.1. CUBE Surfaces
The primary objective of the hydrographic surveys was to establish a safe waters corridor that was devoid of obstructions or hazardous objects on the seafloor in order to facilitate amphibious landing operations [
33]. Accurate hydrographic and oceanographic assessments of the landing area are critical for efficient planning with minimum risks. The Romanian hydrographic vessel was tasked with surveying the deeper area of the corridor over a period of approximately four days. Onboard, three hydrographic surveyors processed the hydrographic data using the CUBE algorithm and manual examination to produce the final surfaces. The processing, which lasted about three days, was time-consuming due to the large area surveyed and due to the canyon area’s complexity (
Figure 8), which required special attention when using the CUBE algorithm. The surveyors discovered that the CUBE algorithm had limitations in resolving depth uncertainties in the steep slopes, requiring a longer time to manually inspect the depth estimates. At the end of the survey, the hydrographic team disseminated the final surface to the other warfare areas and individual clients interested, demonstrating the effectiveness of the team and the mathematical processing approach.
3.2. Soundings and Contours Selection
In support of an amphibious landing operation, the desired outcome is a standard operational graphic, which integrates a range of geographical data, such as special interest objectives, hinterland details, and the road networks along with hydrographic data, such as depth contours and soundings, as well as oceanographic information, such as tidal and current data.
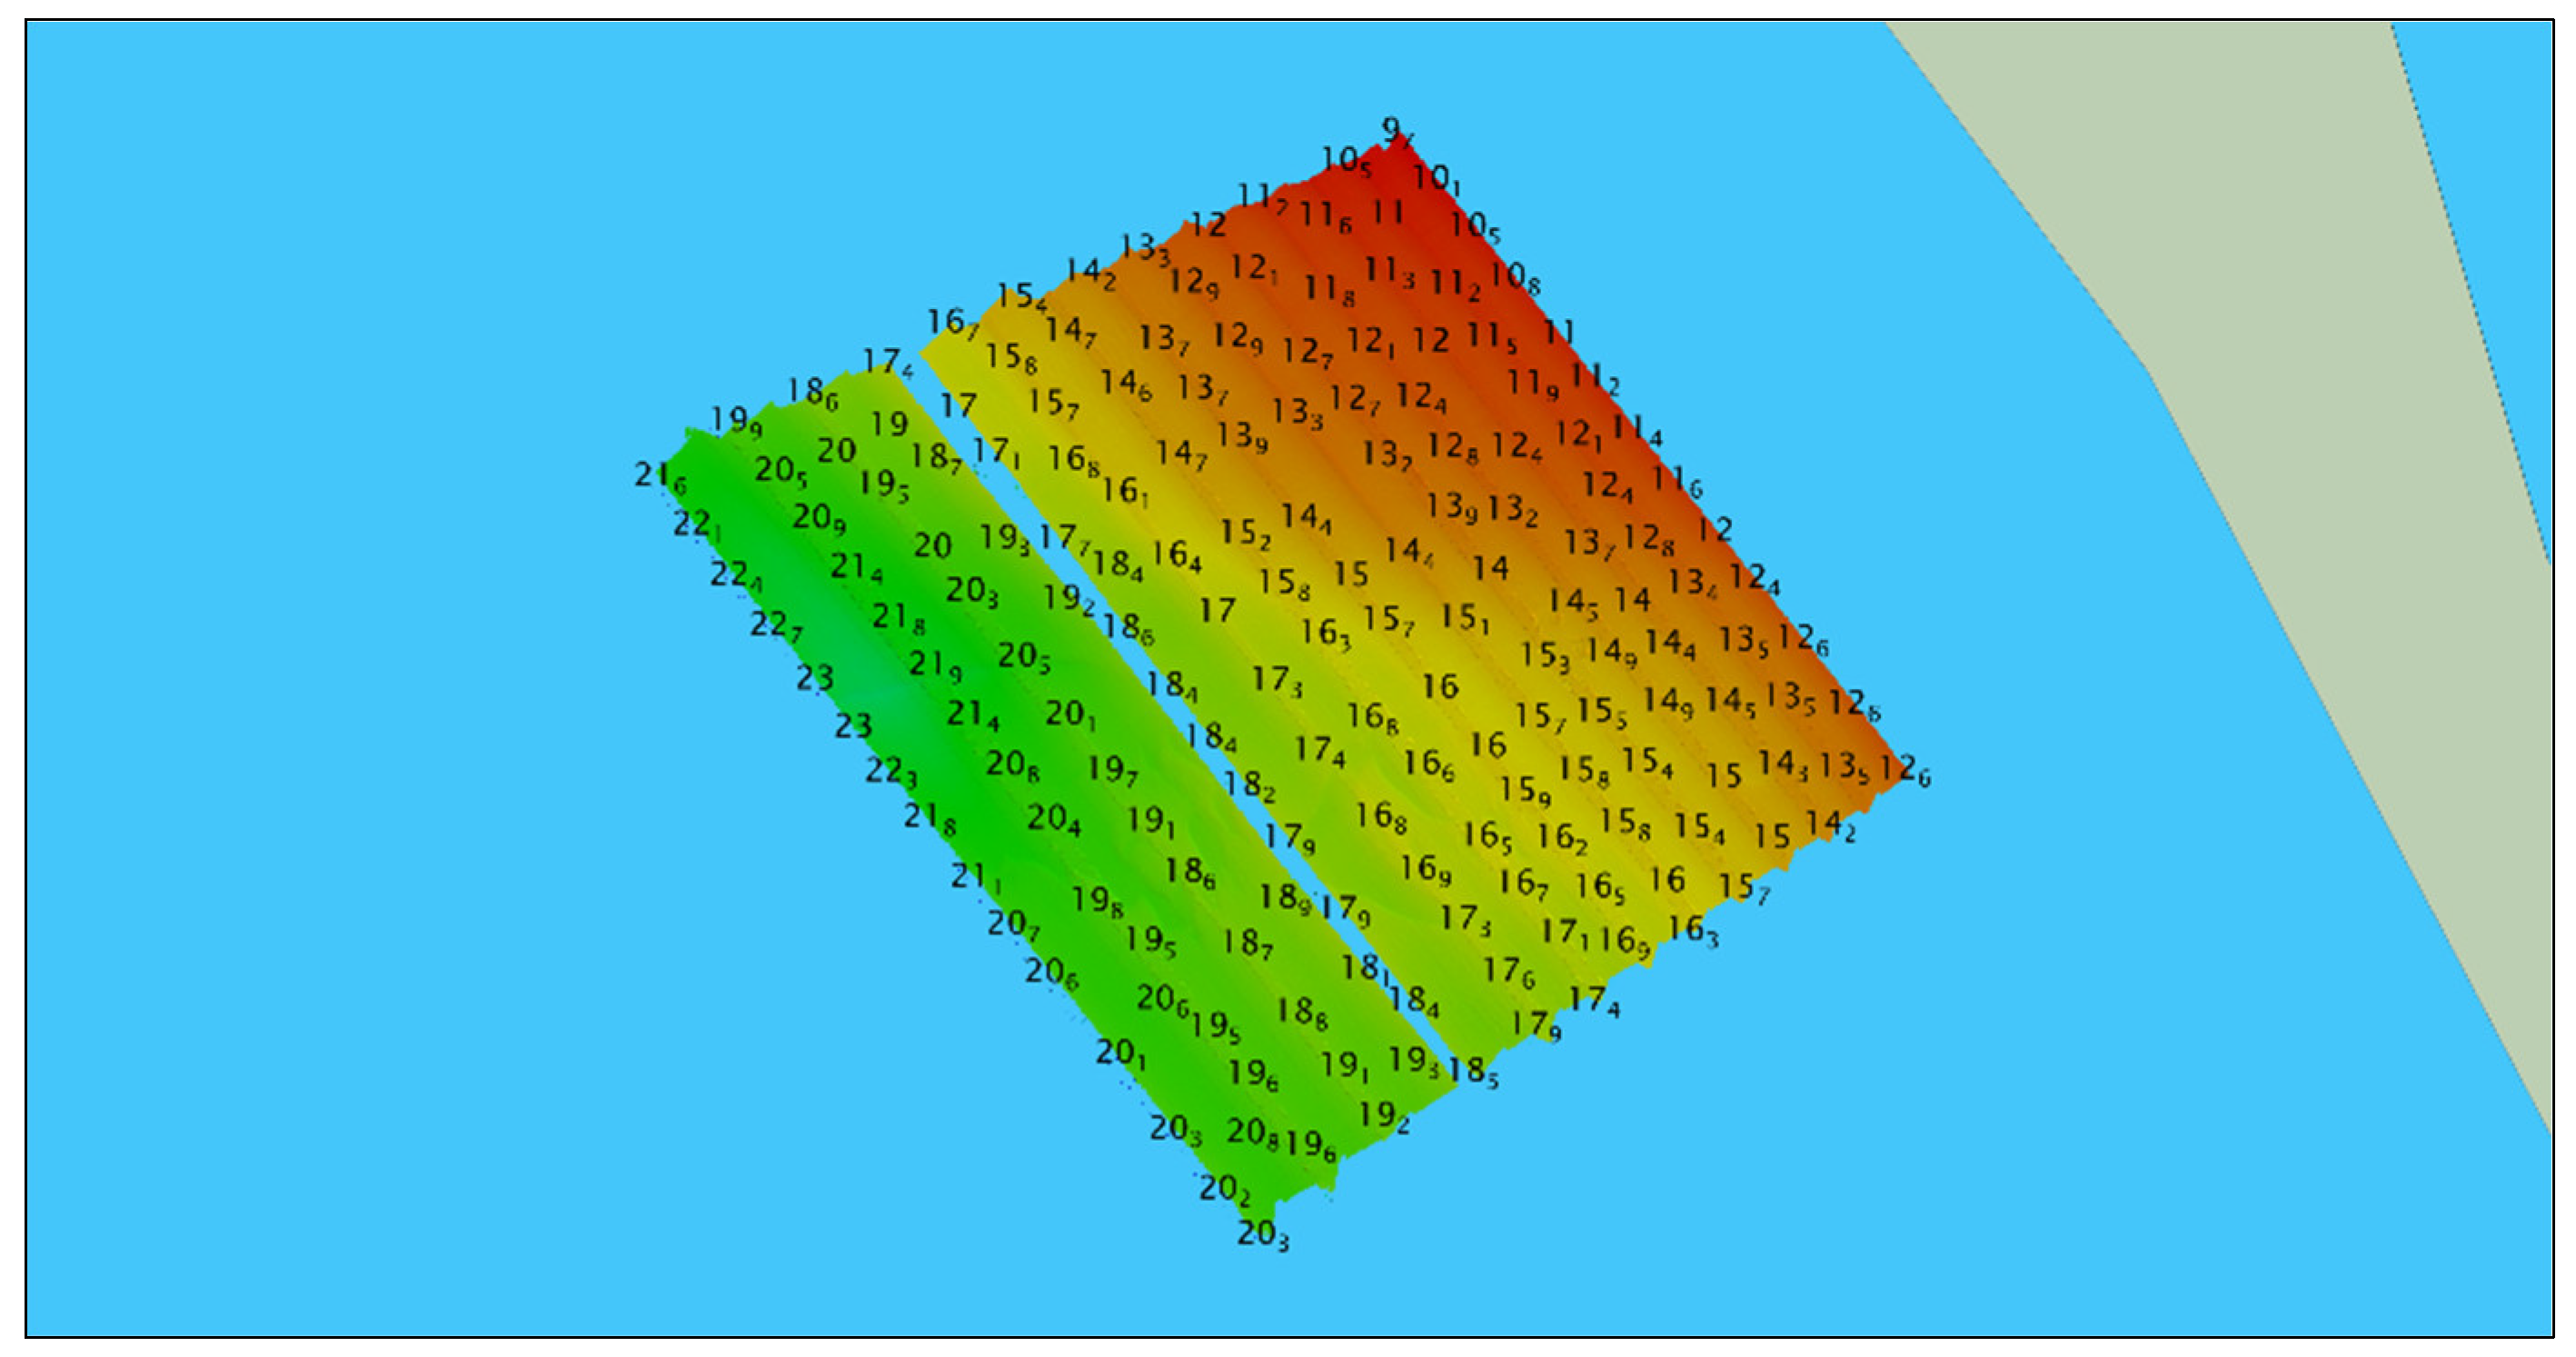
Based on the final CUBE surface produced, a selection of soundings was generated to meet the level of detail required for the final amphibious graphic product (
Figure 9). The selection of soundings was determined by the scale of the desired cartographic product, ensuring that the soundings were visible while still providing sufficient information to the end user. For operations such as special forces or amphibious landings, it is important that the environmental information presented in the cartographic product is clear, comprehensible, and provides the necessary knowledge to safely plan the operation.
3.3. Data Quality Control
The hydrographic data underwent continuous monitoring for quality control (QC) throughout both the survey and post-processing phases. Prior to the survey, a patch test was executed to calibrate the reference frames. Platform calibration was performed by measuring the offset values of “x, y, z” and angular offsets of the motion reference unit (MRU) and transducer with respect to the vessel’s reference frame. These values were input into the motion sensor and multibeam processor, and all auxiliary systems were calibrated. The sound velocity profile (SVP) was measured and in the system, followed by a patch test to measure and correct for latency, pitch, roll, and yaw offsets. While a patch test can measure the misalignment of roll and pitch axes of the motion sensor and sonar, it cannot measure the ship’s coordinate system. The compiled QC included GNSS, multibeam, draft, and navigation control.
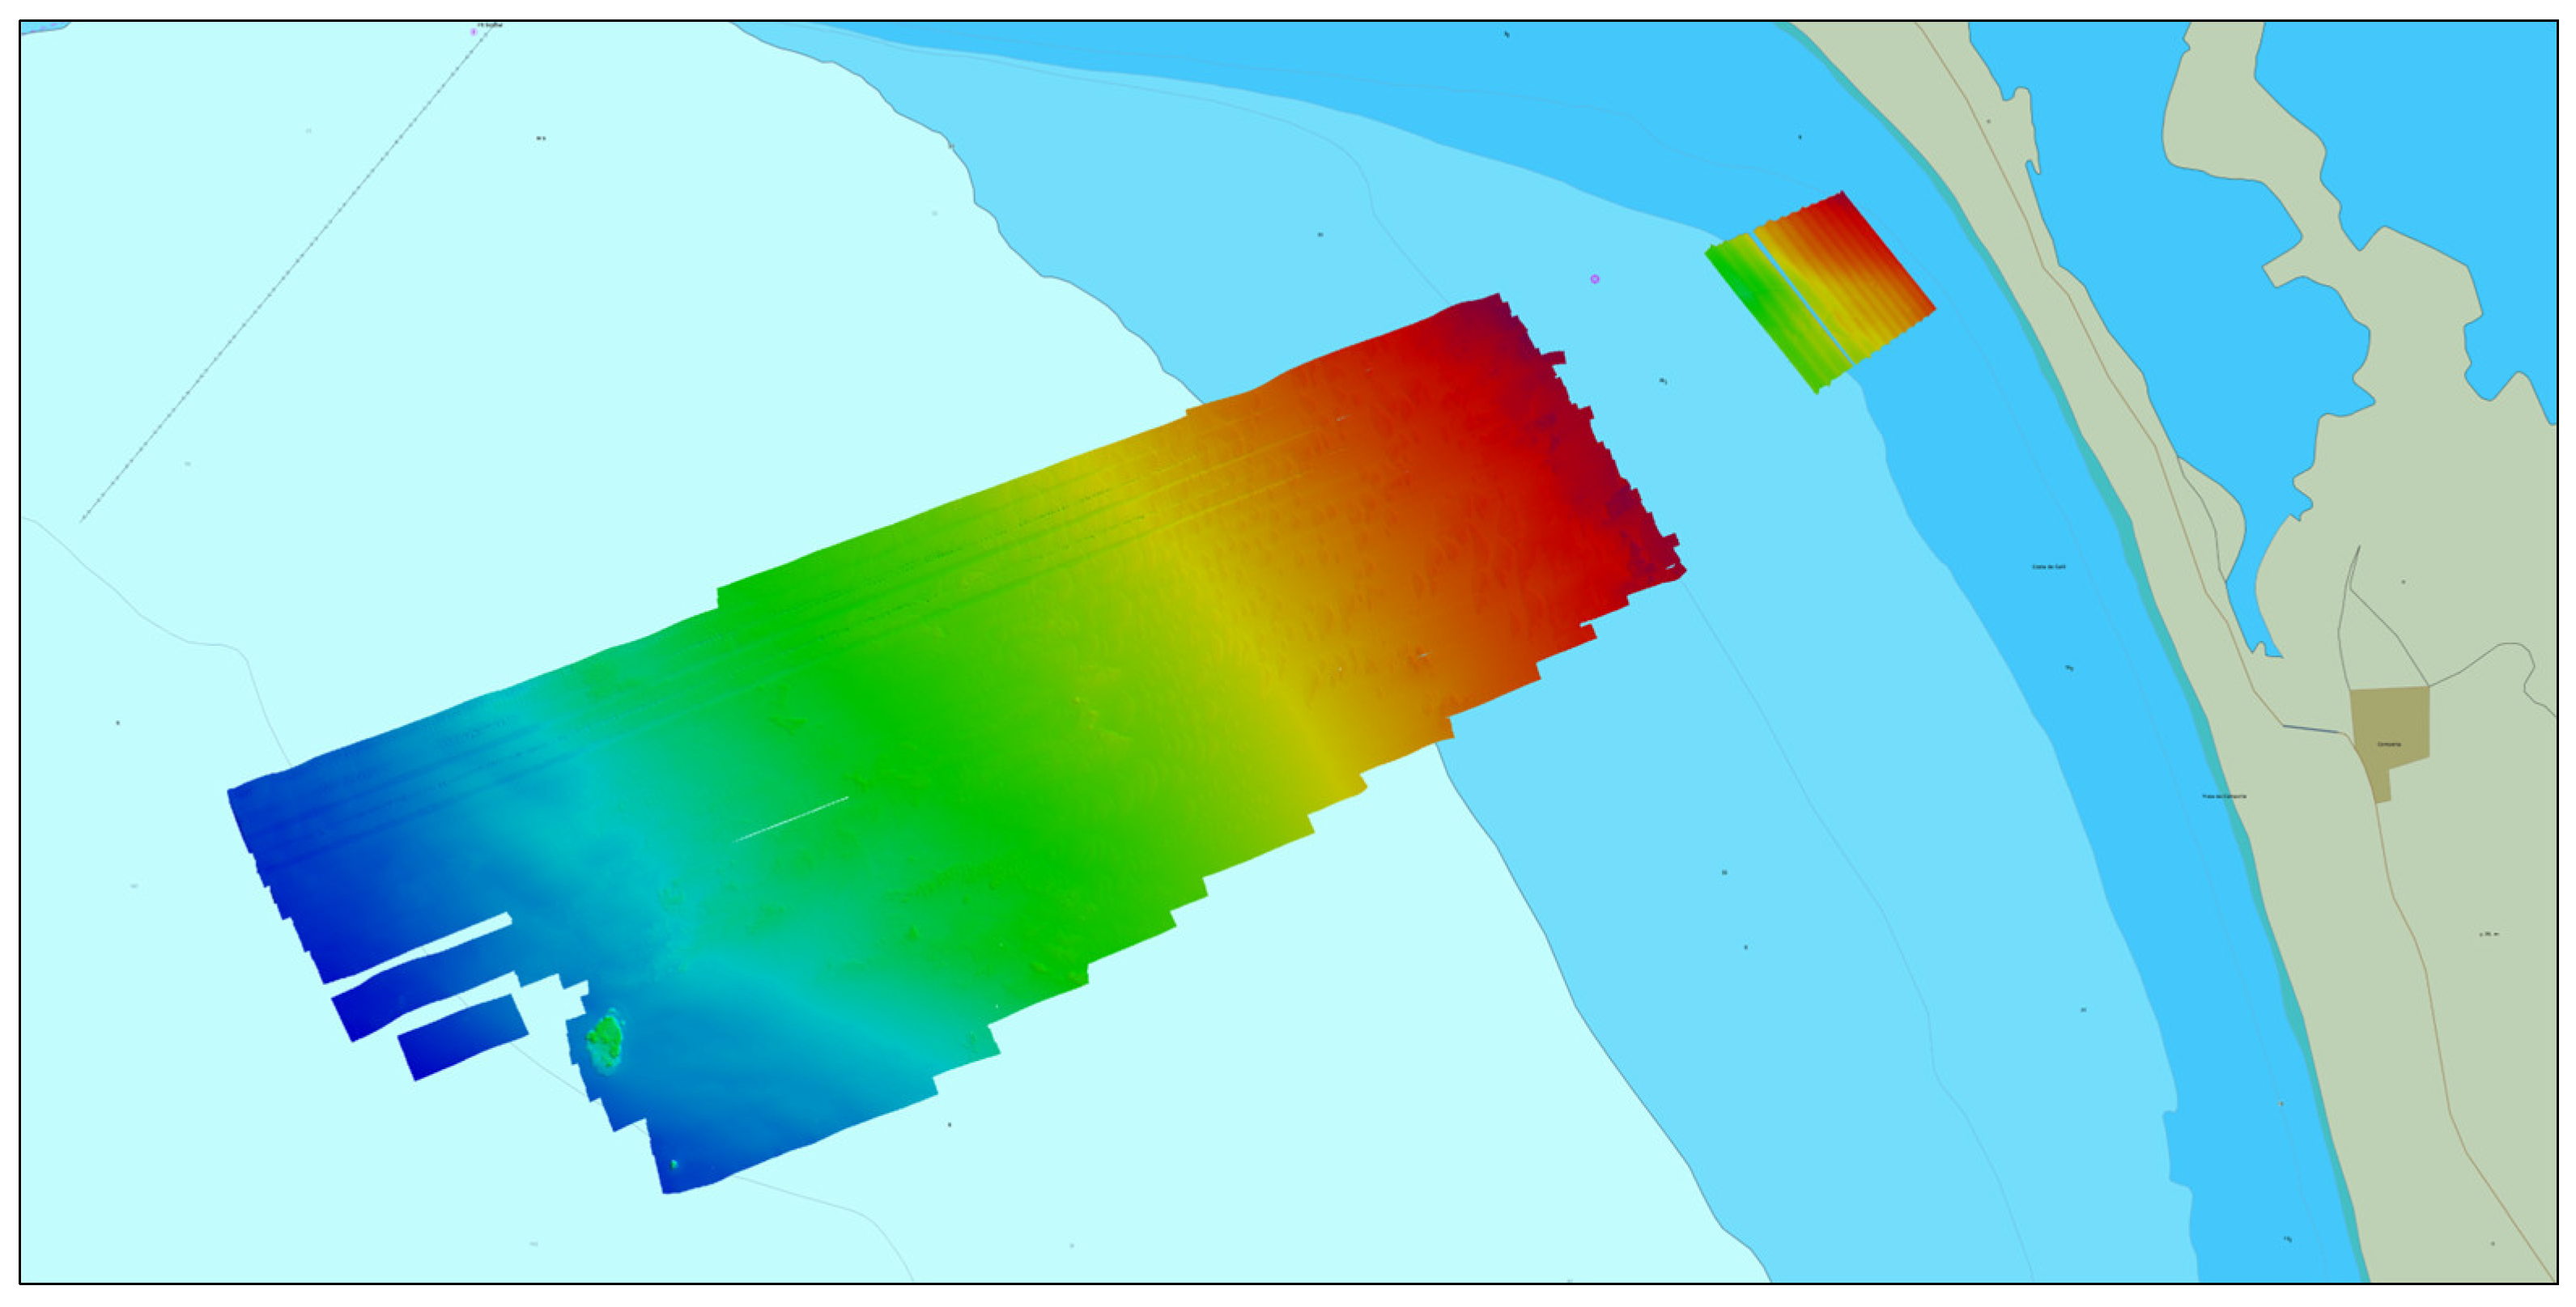
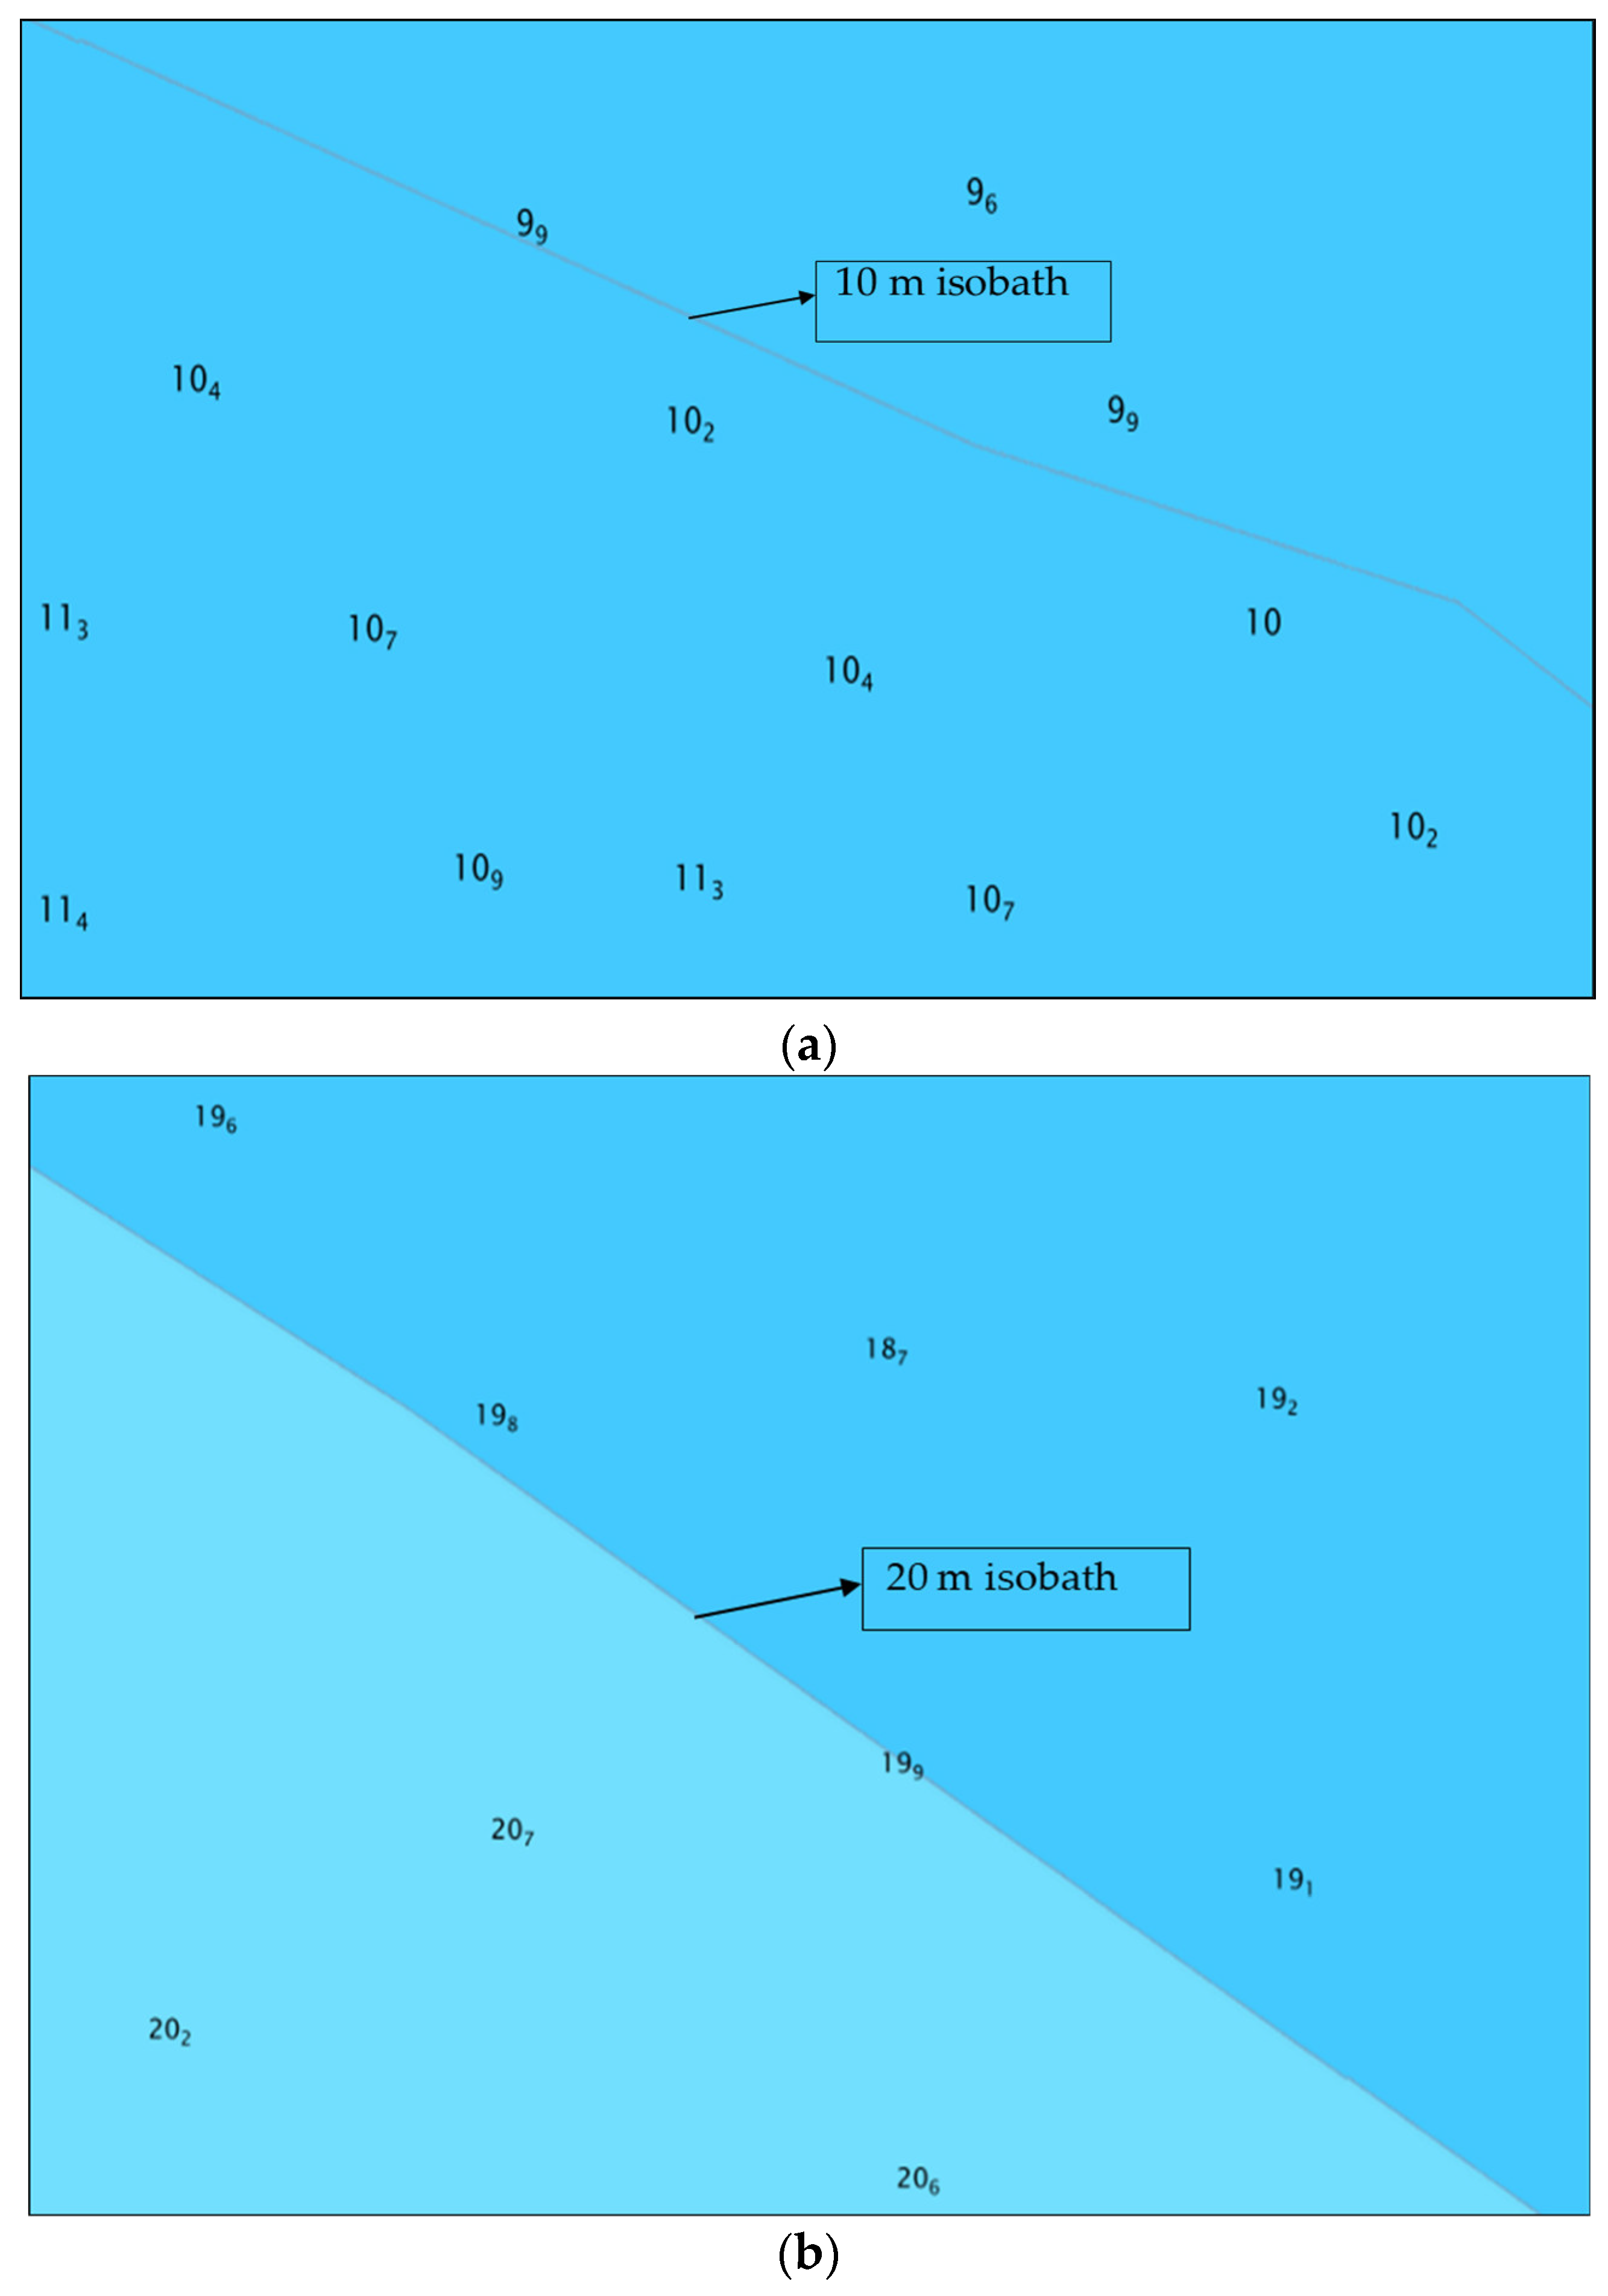
During a post-processing of the CUBE surfaces, contour lines and soundings were created to provide a data quality check against an electronic chart.
Figure 10 illustrates that the depths recorded by the USS Accession USV near the 10 m and 20 m isobaths match the depths indicated on the electronic nautical chart that was used as a base layer. This method of data quality check, also known as field quality control [
34], is utilized during data collection to monitor the quality of online surveys or in near-real-time processed data in order to identify any systematic, random errors, or blunders [
35].
In addition, a shoal depth true position (SDTP) surface was generated through post-processing techniques using the CARIS software suite, with a meticulous removal of erroneous data, which is a process that consumed almost 6 h of manual data cleaning (
Figure 11). This bathymetric surface is typically employed as a benchmark by hydrographic offices globally. Recently, the employment of CUBE surfaces as a customary deliverable has been progressively adopted by national hydrographic offices.
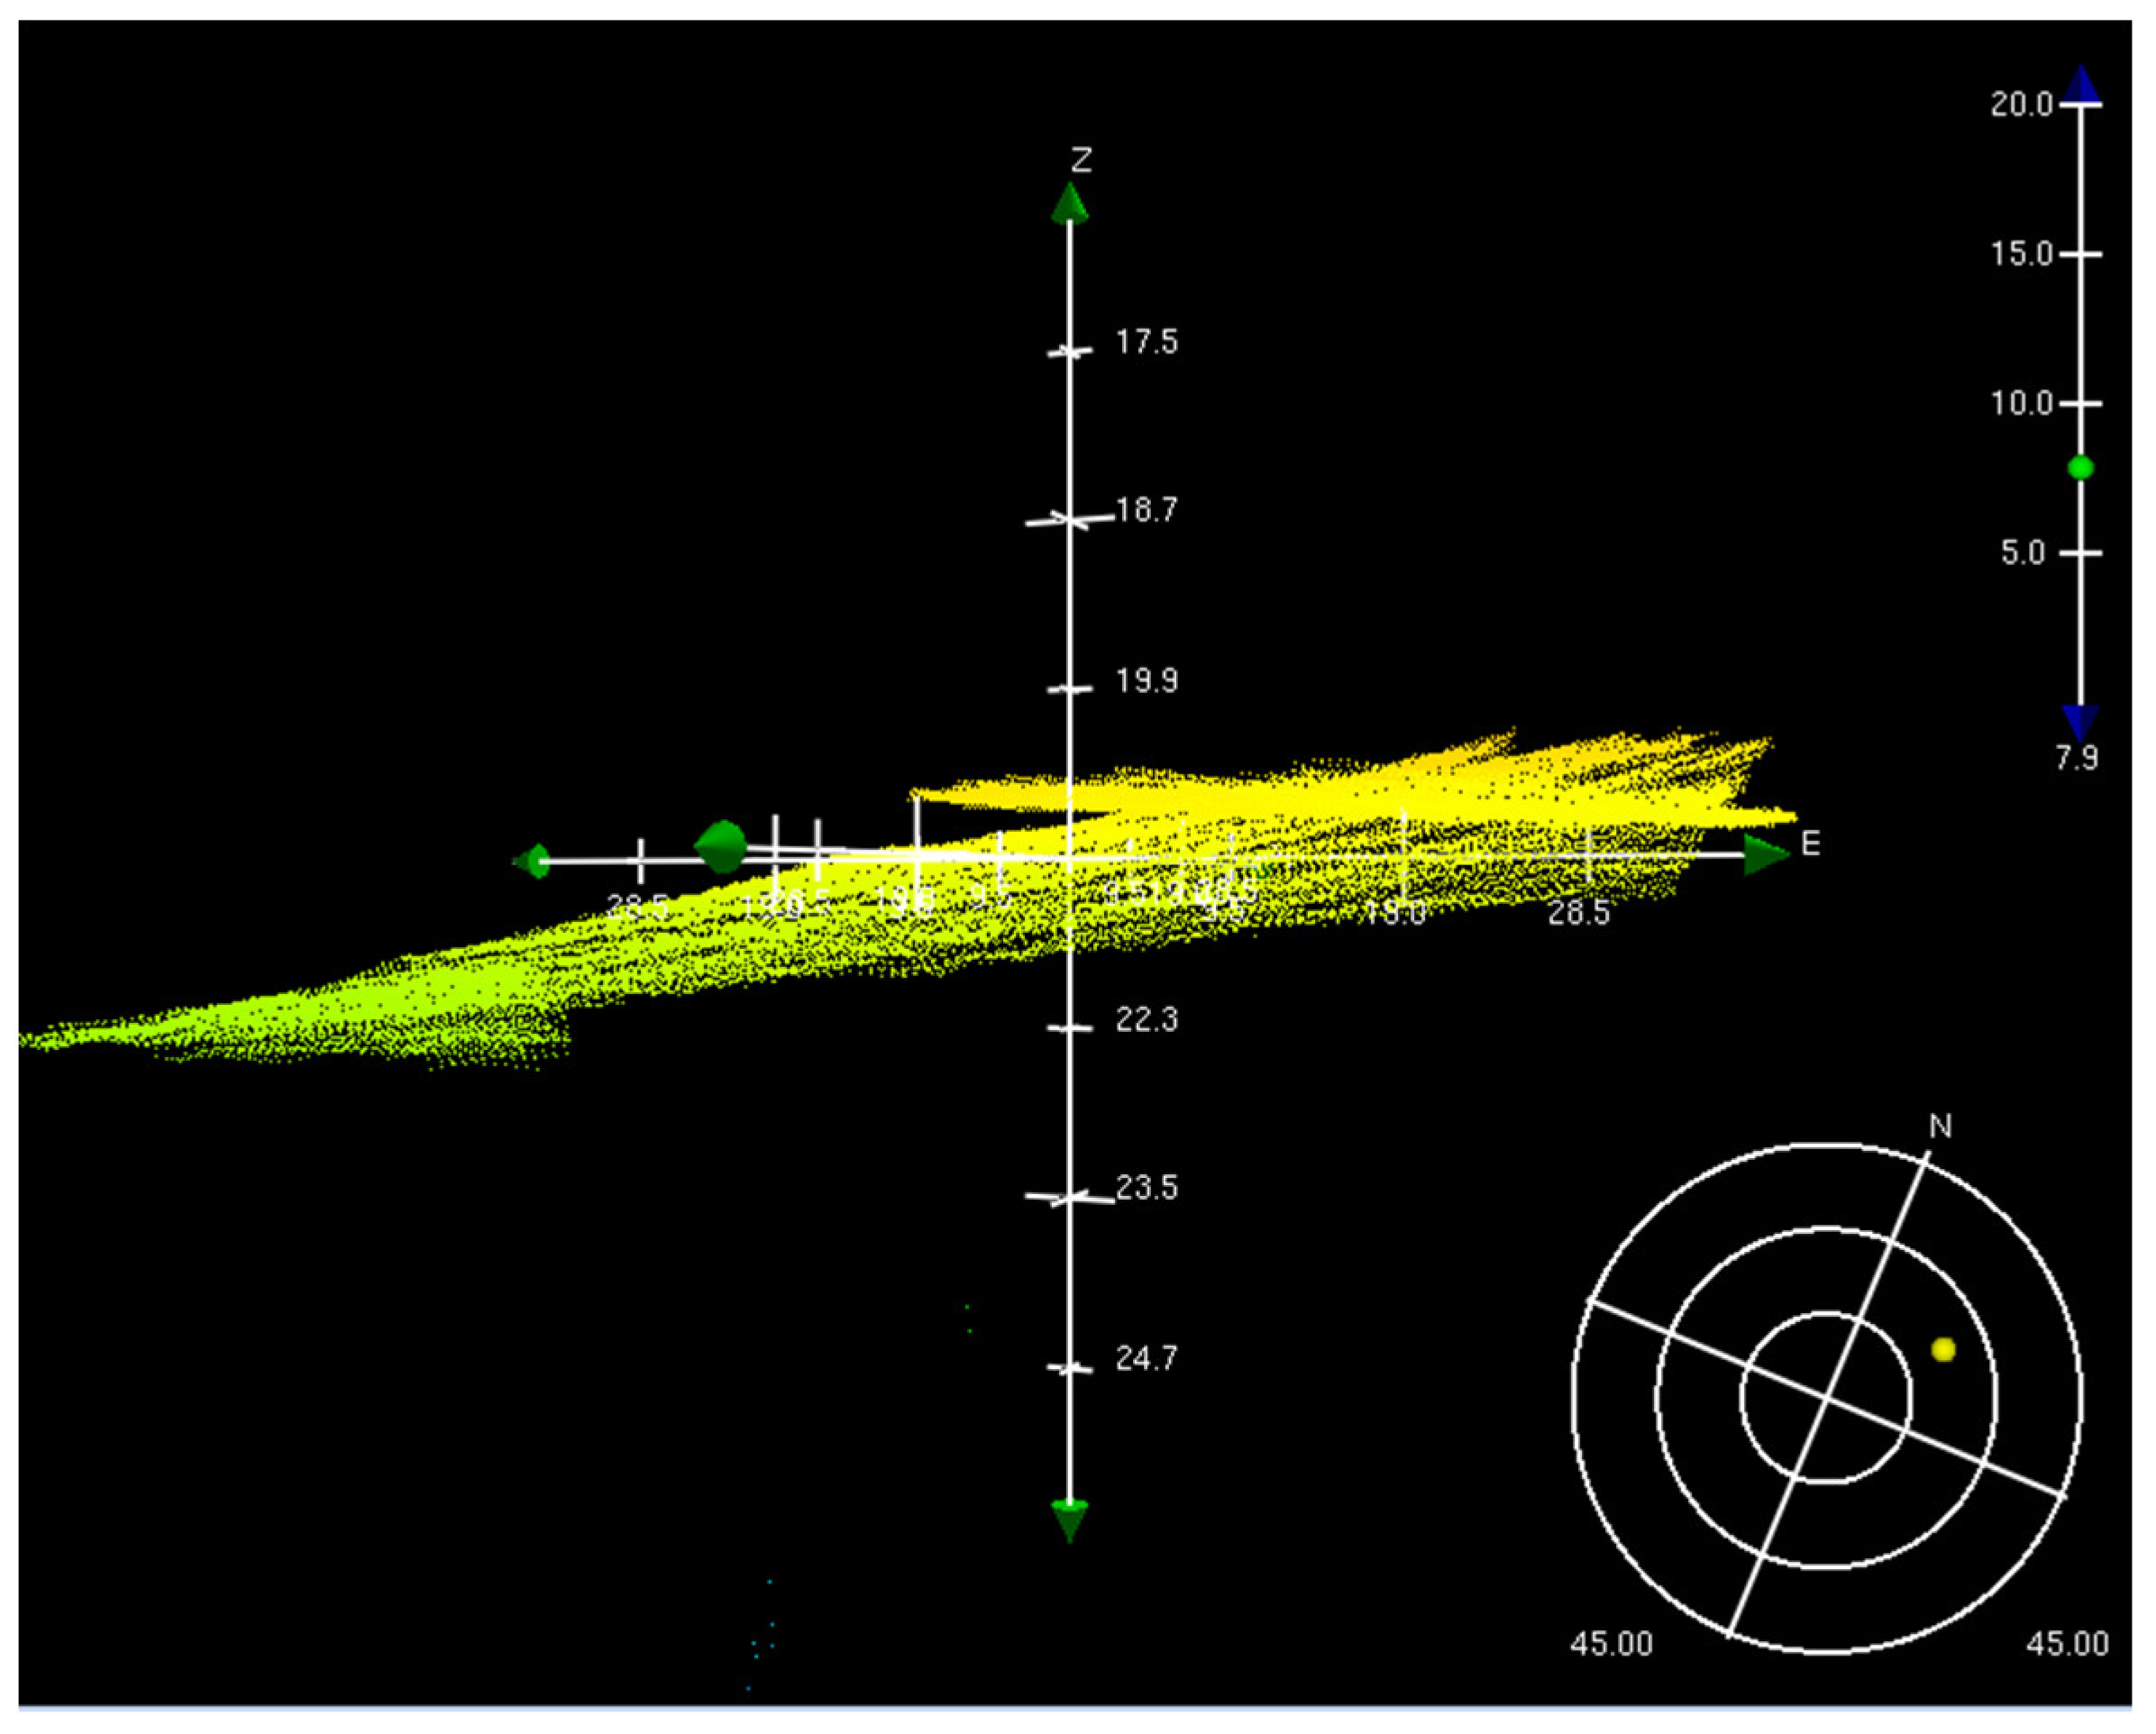
Undoubtedly, the hydrographic data are susceptible to errors. As evidenced in
Figure 12 the motion of the USV primarily contributes to the most noticeable errors, particularly in terms of roll and pitch. Given the small footprint of the vehicle, it is more susceptible to greater movements in longitudinal and transverse planes, which can subsequently lead to motion errors.
Despite the meteorological and oceanographic conditions during the survey being deemed suitable for a hydrographic survey, with waves being approximately 0.6 m and the wind being less than 5 m per second, the presence of the spilling and plunging phenomena in the surf zone is where the USV conducted the survey and where it resulted in several roll errors in the data, as indicated in [
36].
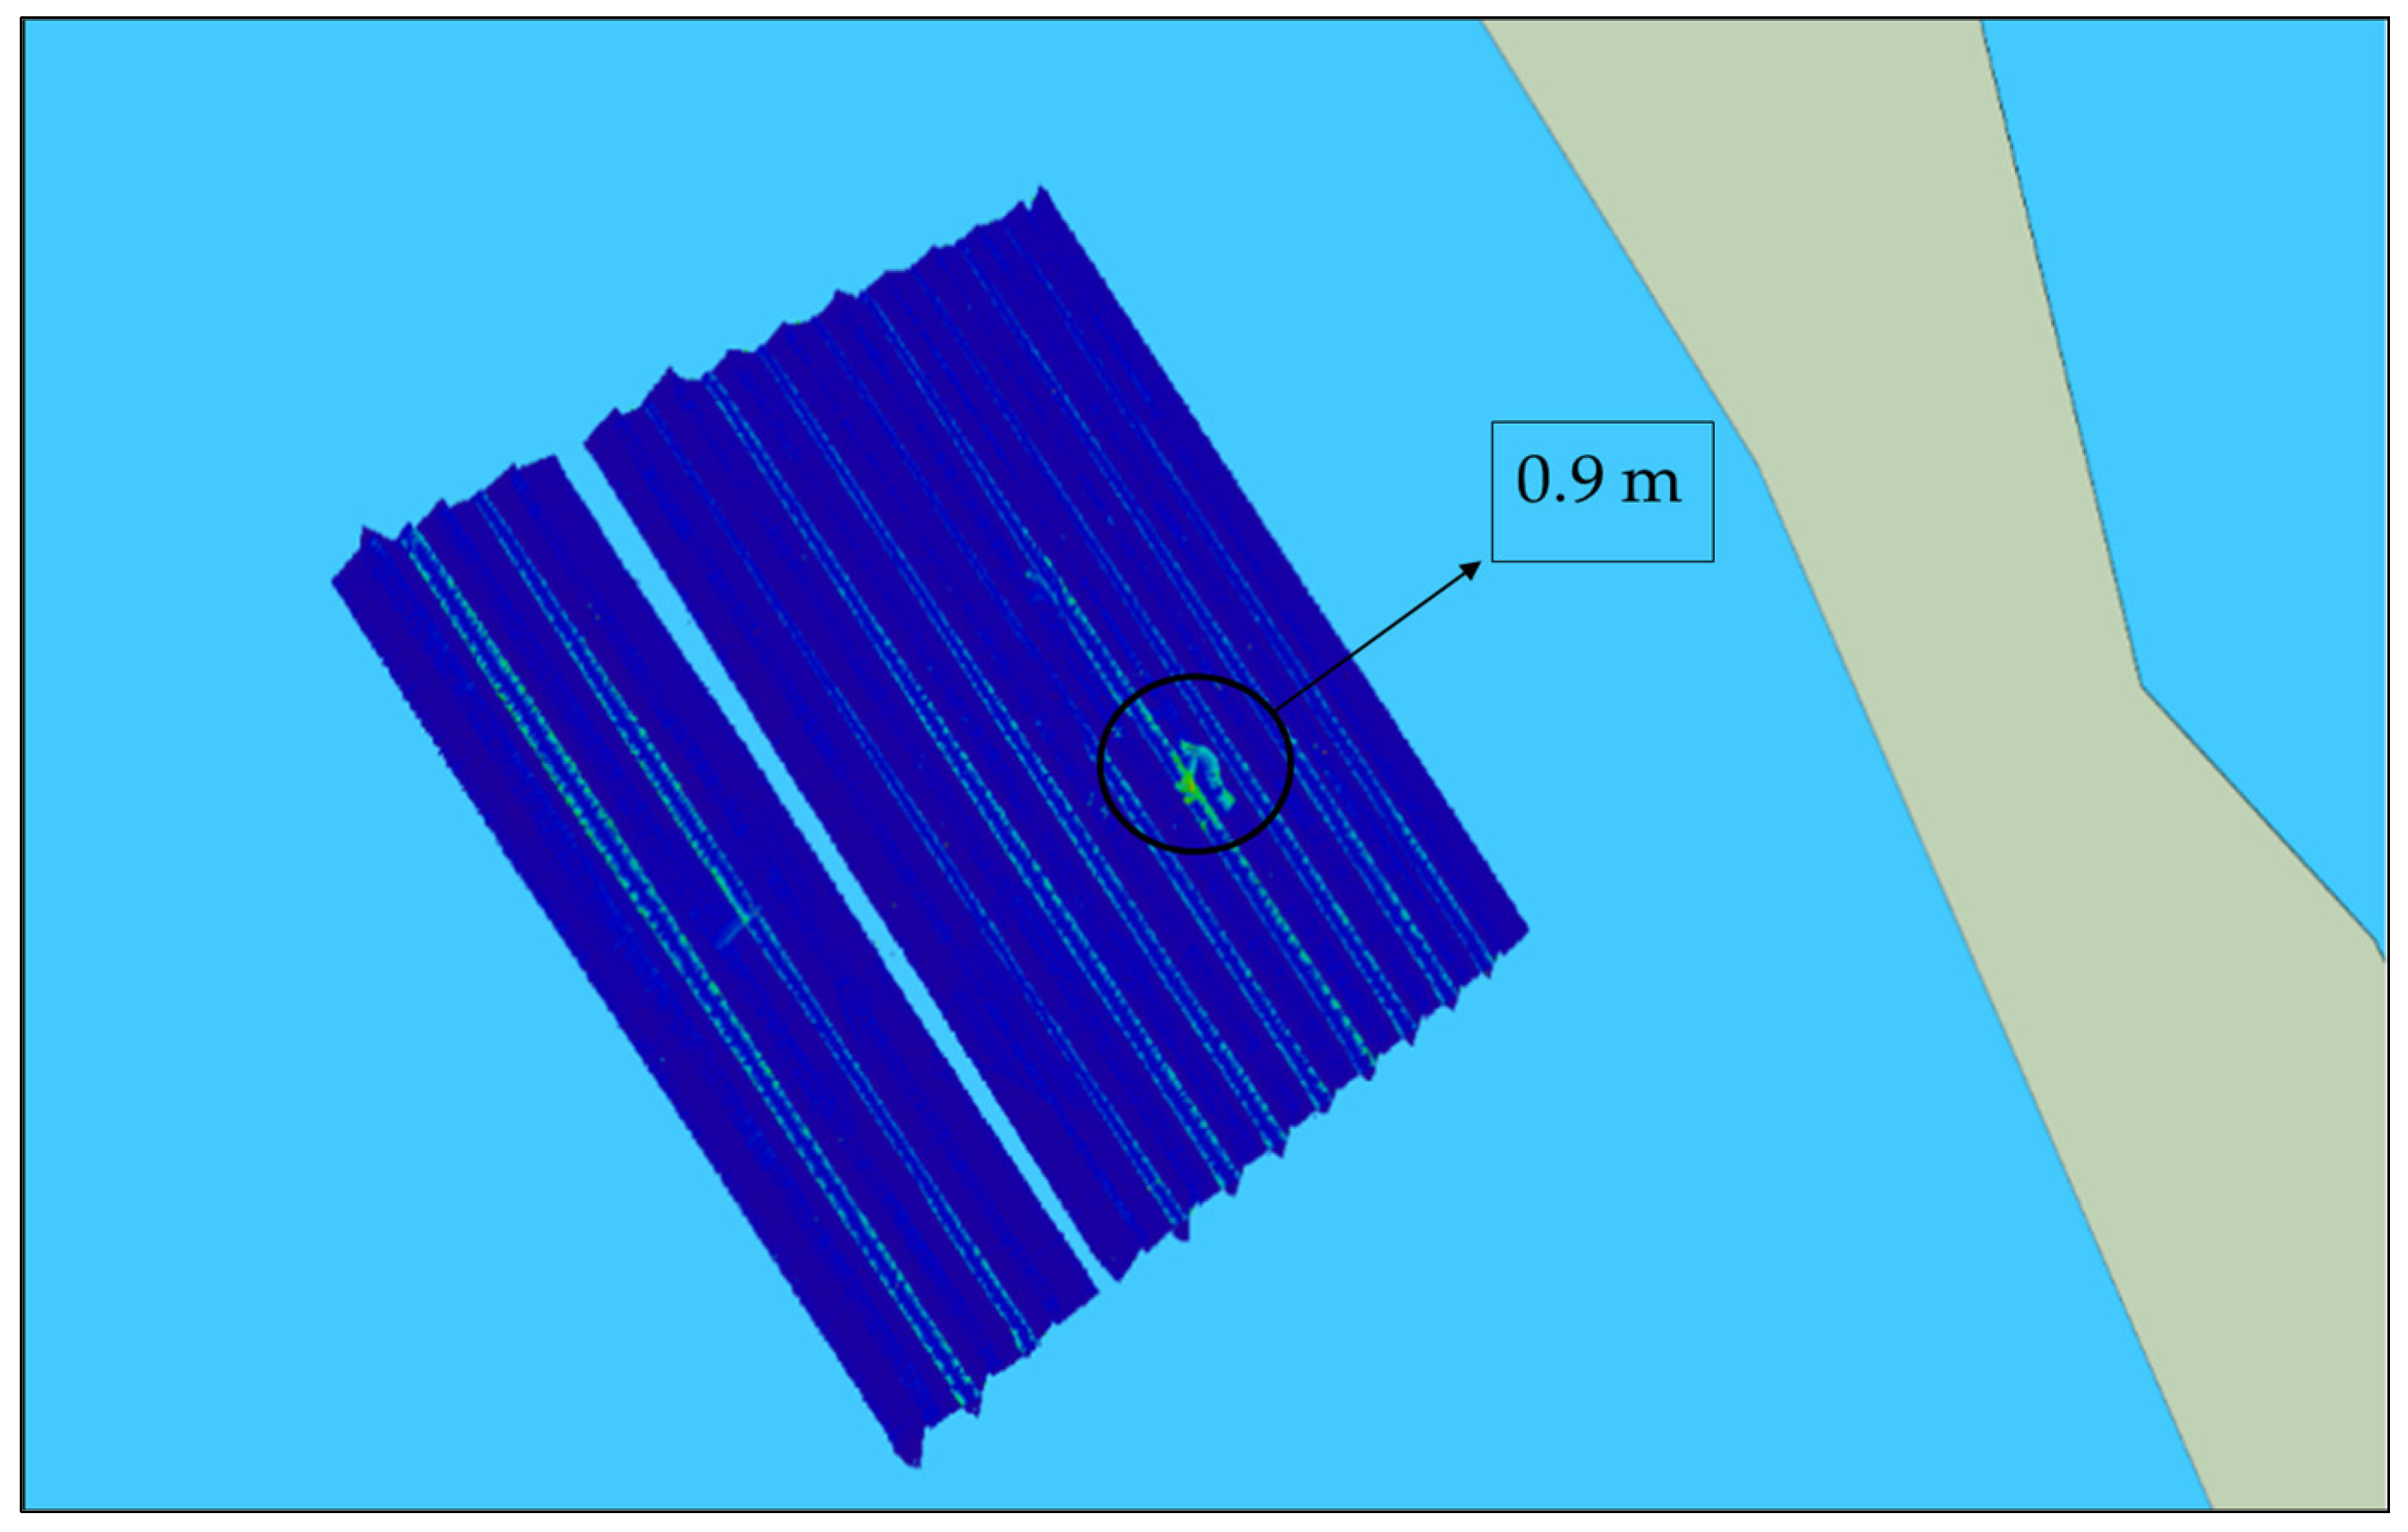
The reliability of the CUBE surface over a smooth shallow sea bottom surface is evidenced by the main depth differences between the SDTP surface and the CUBE surface itself, which are based solely on the roll errors present, with a maximum difference of 0.9 m, as depicted in
Figure 13. However, errors are more perceptible at steep slopes and along track lines due to the error in motion of the vehicle when running adjacent lines.
4. Discussion
This study aimed to identify a simple and robust method of USV hydrographic data processing using known techniques to develop an easy product to be used for military or civilian purposes, mainly for non-professional hydrographic surveyors. This study is not intended for developing cartographic products to be used in navigation or in official products that impact safety or security.
A high-resolution CUBE bathymetric grid forms the basis of the seafloor model, with each node on the grid assigned an uncertainty value. The model is optimized to maintain the least depth over significant features and computes an uncertainty value for every node, which is then integrated into the model. An overall uncertainty model is formed by combining the distribution of points around the mean with the predicted uncertainty of each measurement. This model should be carefully checked by a specialized hydrographic surveyor. The error budget should be treated with special attention to monitor and quantify the real errors. The error budget process should have an ´a priori´ version to estimate the errors that will occur during the survey and an ´a posteriori´ version in post-processing. Moreover, it is important to highlight to the military commanders, or to future clients, the errors and uncertainty ranges that are based on the data collected and if the requirements were met.
As a potential avenue for future research, it would be prudent to undertake a comparative analysis of the hydrographic products and to collect data with conventional survey outputs that overlap. The main objective is to comprehensively discern the potential inaccuracies and ambiguities inherent in the CUBE algorithm across diverse survey terrains, ranging from the flat shallow seabed to intricate underwater landscapes, such as steep gradients or underwater canyons.
Contemporary advancements in hydrographic processing underscore the incorporation of artificial intelligence and machine learning methodologies, with a particular emphasis on the data procured through unmanned systems. This approach engenders the rapid generation of products that can be promptly disseminated to the military commanders or the client, while necessitating human verifications and an examination of the information, along with a comprehensive suite of security measures.
5. Conclusions
The objective of this study was to introduce efficient and dependable techniques for generating a resilient hydrographic and cartographic product that is suitable for military operations or for swift environmental evaluations. Specifically, the study emphasizes the use of the CUBE algorithm for producing prompt and dependable hydrographic surfaces for beach surveys. Although the use of autonomous unmanned systems for hydrographic surveys is not a new topic, there are limited studies on utilizing USVs for conducting rapid environmental assessments of beaches in support of amphibious landing operations.
Furthermore, the study highlighted the benefits of utilizing a USV for shallow water surveys, notably the swift survey execution, where the capacity to accurately determine critical shallow depths and to operate in crisis scenarios, as well as the ability to conduct a completely autonomous hydrographic survey without exposing humans to risk, was observed. However, the study also observed certain drawbacks during the survey, such as the vulnerability of the small USV platform to raw data errors that were related to the attitude sensor and to the likelihood of equipment shortages necessitating frequent survey interruptions for minor repairs or adjustments. The study made a brief comparison between a hydrographic vessel’s legacy survey and a USV survey, thereby highlighting the USV’s cost-effective and speedy deployment benefits.
Although CUBE can handle many of the typical problems that arise during MBES survey processing, it is incapable of resolving every issue. Human intervention is required to knowledgeably resolve situations in which the data are incomplete or unreliable with the hydrographer’s insight of the seafloor, and when the algorithm cannot accurately determine the reported depth estimate. In these cases, it is the hydrographer’s responsibility to manually select a new hypothesis and to correct the algorithm’s perspective on the data. The technique outlined in this article has broad applications, including in non-hydrographic communities with personnel having limited hydrographic training, as it is an almost entirely automated process. Additionally, through the use of specialized hydrographic software, it is feasible to establish a model builder that can streamline all processes, from data import to CUBE surface development, soundings, and contour creation. The potential of autonomous systems to replace traditional legacy survey methods in the field of hydrography is a subject of ongoing debate. While legacy survey systems are still preferred in deep oceans and in long-endurance survey campaigns, MUS can serve as a supplementary asset to legacy systems, particularly in conducting autonomous surveys of challenging areas, such as shallow waters, ports, and inland waters. Thus, it is crucial to view MUS as a complementary tool to traditional survey methods on a global scale.
Emerging technology provides us with the opportunity to address the challenges that are being presented by new methods for high-resolution hydrography. Nonetheless, we cannot overlook or disregard the inherent uncertainties in our survey data if we intend to leverage the abundance of data that we collect. These techniques enable us to estimate and utilize data uncertainty, thus creating new products and services while also fulfilling the crucial mandate of hydrography: to uphold navigation safety.


