Review

The Practice and Development of T-Bar Penetrometer Tests in Offshore Engineering Investigation: A Comprehensive Review

1
Institute of Geotechnical Engineering, School of Transportation, Southeast University, Nanjing 211189, China
2
School of Engineering, University of Warwick, Coventry CV4 7AL, UK
3
State Key Laboratory for Geomechanics and Deep Underground Engineering, China University of Mining and Technology, Xuzhou 221116, China
4
School of Mechanics and Civil Engineering, China University of Mining and Technology, Xuzhou 221116, China
5
School of Civil Engineering and Transportation, Shenzhen University, Shenzhen 518060, China
*
Author to whom correspondence should be addressed.
J. Mar. Sci. Eng. 2023, 11(6), 1160; https://doi.org/10.3390/jmse11061160
Submission received: 9 May 2023 / Revised: 28 May 2023 / Accepted: 29 May 2023 / Published: 1 June 2023
(This article belongs to the Special Issue Geological Environment and Engineering in Coastal Region)

Abstract

:
In recent years, the development of marine hydrocarbon resources has led to an increased demand for research on the marine soil bearing capacity and cyclic loading effect in marine engineering design. Because of the difficulties and high costs involved in obtaining high-quality soil samples from offshore sites, in situ testing techniques have become the preferred method of determining design parameters in offshore geotechnical engineering projects. This paper provides a review of the current state of marine penetrometer deployment technology used in offshore engineering investigations and presents a summary of the T-bar penetrometer test for measuring marine soft clay. The existing literature research on penetration mechanisms, numerical simulations, laboratory experiments, and field tests of the T-bar penetrometer in the field of marine geotechnical engineering are analyzed. Finally, the potential difficulties, challenges, and prospects of the T-bar penetrometer tests are discussed.

1. Introduction

The development and expansion of coastal cities worldwide have promoted the continuous development of marine geotechnical engineering techniques and theories [1,2,3]. Marine engineering traditionally concentrated on near and shallow seas, including coastal protection, land enclosure, and port engineering. Nowadays, it has extended to distant and deep seas, which includes cross-sea bridges, offshore oil and gas drilling platforms, offshore wind energy, tidal energy power generation, submarine tunnels, submarine mineral extraction, and land enclosure [4,5]. The increasing scale and difficulty of marine engineering put forward higher requirements on the sensitivity, safety, and durability of marine engineering, especially on the evaluation of the performance of marine engineering under dynamic and cyclic loading effects and related design parameters [6,7,8].
The design and construction of marine engineering, including the main structure and appurtenant facilities such as submarine cables and pipelines, require a large amount of survey-accurate data [9,10]. Soft soils with a high water content, large porosity, low shear strength, high sensitivity, and low surface strength are common conditions encountered in marine engineering projects [11,12,13,14,15]. These characteristics make it highly difficult and costly to obtain low-disturbed subsea soil samples through traditional drilling methods and conduct laboratory geotechnical tests during marine engineering investigation [9,13,16]. Therefore, in situ testing is becoming one of the main methods of determining design parameters. The vane shear test, as a commonly used in situ testing method in soft soils on land, is more prone to be disturbed in subsea super-soft soils, which significantly affects the reliability of the test; on the other hand, in marine engineering surveys, the piezocone penetration test (CPTU) is adopted more often [12].
The piezocone penetration test (CPTU) is a popular in situ testing technique that emerged internationally in the 1980s. It has a solid theoretical foundation, comprehensive functions, precise parameters, high accuracy, and good stability [17,18]. These characteristics make the CPTU suitable for civil engineering design applications worldwide. The CPTU can accurately classify soil layers and identify soil types. Moreover, it can estimate various mechanical and deformation properties of soil, such as undrained shear strength, overconsolidation ratio, sensitivity, compression modulus, Young’s modulus, initial shear modulus, consolidation coefficient, and permeability coefficient. Therefore, the CPTU is suitable for testing soft soil in a convenient, economical, and reliable way [16]. Recently, with the processive development of new directions and demands in geotechnical engineering, especially marine geotechnical engineering, many international research institutions (e.g., University of British Columbia, Georgia Institute of Technology, Delft University, and Southeast University) and professional in situ test instrument development companies (e.g., Hogentogler, Vertek, ConeTec, and Furgo Corporation) have developed new sensors for CPTU. These new CPTU sensors promote the CPTU test method to develop in the direction of multi-functionality [10,19,20,21,22,23,24], which further broadens the application field of the CPTU. Figure 1 shows a schematic diagram of the internal structure of a common CPTU.
However, there are also some disadvantages to the CPTU method. For example, when applying the conventional cone penetration test (CPT) in the subsea soft soil, Randolph found that the accuracy of the measured data decreases with the increase in the seawater depth. Further, in 1994, Randolph proposed a novel full-flow theory based on the full-flow penetrometers (including T-bar, ball, and plate) to test soft soils, the apparatus of which is shown in Figure 2 [25]. The full-flow penetrometers are now commonly used in offshore site investigations where the extremely soft soils encountered necessitate an increased measurement resolution and accuracy, and the flow mechanism of soil around the probe can be modeled as plane strain and axisymmetric in the case of the T-bar and ball, respectively. This is suitable for the structures supported on these deposits, including anchors and caissons for offshore oil platforms; nearshore piers, wind turbines, and liquid natural gas platforms; and piles in soft sediments onshore [26,27,28,29,30,31]. As a new in situ testing technology for testing marine soft soil, the T-bar penetrometer has the advantages of high accuracy, good reliability, a large amount of data collection, a convenient testing process, and low cost. However, this testing technique is mainly adopted in onshore engineering, and less application has been performed in offshore engineering, and it especially lacks practice in marine engineering [21]. Therefore, the study of the mechanism of the T-bar penetrometer and its application in marine engineering is of great theoretical significance and engineering value to the development of in situ testing technology in the field of marine engineering in the world. These previous studies on the failure mechanism and penetration resistance of full-flow penetrometer penetration behaviors mainly include analytical solutions, numerical simulations, laboratory experiments, and field tests [31]. In this paper, the development of marine penetrometer deployment technology is reviewed, and the penetration mechanism, numerical simulations, laboratory experiments, and field tests of the T-bar penetrometer in the field of marine geotechnical engineering are analyzed and summarized. Meanwhile, the potential difficulties, challenges, and prospects of the T-bar penetrometer tests are also discussed.

2. Development of Marine Penetrometer Deployment Technology and T-Bar Penetrometer

The CPT devices used in offshore engineering first appeared in the 1960s. After nearly 60 years of development, various CPT devices were developed for marine environments, including small jack-up platforms, cased platforms, seabed, and downhole modes, and submersible chambers, especially the earliest development and widest applications of CTP in the Netherlands [32]. The history of the development of foreign offshore CPT devices, summarized by Lunne (2010), is shown in Table 1 [32].
When adopting the CPT in marine engineering, the CPT equipment should be pushed into the sea bottom to test the soil on the seabed. There are two ways of pushing a cone penetrometer into the sea bottom; the first one is the seabed mode, which pushes the CPT or a predetermined penetration into the sea floor until it encounters a resistance. The second one is the down-hole mode, which drills a borehole and pushes the penetrometer into the soil at the bottom of the borehole, as shown in Figure 3 [21].
The seabed mode systems are mainly used in deepwater areas, and the penetration tests are driven by wheeling to generate a continuous thrust. Differently, in the down-hole technique, the test equipment free falls along the drill pipe to the seabed, where it is hydrostatically pressed into the soft subsea soil layer by the negative pressure created by the seawater. This system can perform CPT and vane shear tests, as well as the sampling after the test. The advanced deepwater CPT tests in the world are listed in Table 2.
Here, the development and application of the CPT technique are summarized. In 1965, the Netherlands and France successively used small jack-up platforms to carry out offshore CPT, but due to technical constraints, the maximum depth of touch was around 5 m.
In 1966, the Dutch company Fugro independently developed the “Seaball” and “Wison I” rope-type CPT equipment.
From 1972 to 1974, the Dutch company Fugro further ameliorated the “Seaball” offshore CPT by adding a subsea disc to provide a support reaction force, which was named “Seacalf”. At the same time, Pfeiffer upgraded the “Wison I” rope-in-well CPT and developed the “Wison” MK II rope-in-well CPT with a total working water depth of 400 m.
In 1973, the Institute of Oceanography of the Chinese Academy of Sciences developed a seabed-mode underwater CPT, which reached a depth of 7 m, with a maximum test bearing capacity of 33 t/m2 and a test water depth of 50 m [33].
In 1977, the Netherlands developed a cased platform CPT designed for a working depth of 50 m and a maximum penetration force of 20 t. In the same year, Norway cooperated with the UK and developed the “Strigraz” subsea sinking drilling CPT, with a working depth of approximately 30 m and a maximum penetration depth of 20 m.
In 1982, a new type of CPT machine was developed in Canada and successfully applied to test the shallow continental shelf. This equipment is advantageous for measuring both the tip resistance and pore water pressure. The first was the use of a cable-free system, using a digitally encoded ultrasonic system to transmit data from the probe directly to a recording device at the surface; secondly, the penetration depth was significantly increased by injecting mud behind the cone, reducing the friction between the rod and the soil, allowing it to penetrate 71 m into the soil with a reaction force of only 5 t.
Since the 1970s, applied research in the United States on offshore CPT has progressed relatively rapidly, with the development of a CPT system for marine exploration that has been successfully tested in the sediments of the San Diego Trench at water depths of over 1200 m [34].
By combining the MJ-II top-pressure penetrometer and CPT platform, the China Shipbuilding Industry Institute of The Engineering Investigation and Design Co., Ltd. developed a CPT platform in 2003 [33]. In 2005, the Institute of Engineering and Technology of Jilin University developed the “shallow seabed mode CPT system” with a maximum work depth of 55 m and a maximum test depth of 15 m [35].
From 2001 to 2005, the Marine Geological Survey of Guangzhou, China, relying on the national project “In situ static and dynamic penetration test technology of submarine soil”, developed an improved technology of offshore CPT equipment with the hydraulic propulsion system in the tube, with a work water depth of 100 m and a penetration depth of 120 m [36]. The above-developed equipment has a shallow test water depth and a small penetration depth and is less utilized in practical engineering, and the theoretical research lacks sufficient test data.
Numerous piezocone penetration tests demonstrated that as the depth increases, the accuracy of the test results obtained in soft soil from the conventional CPTU declines. In the case of the piezocone, this correction can be significant, particularly offshore, where the ambient pressures can be high. According to Chung and Randolph’s (2004) research, the correction required for the piezocone varied between 20 and 40% in the estuarine clay layer [37]. As shown by R. Kelly (2014), the cone correction for tests at the National Field Testing Facility (NFTF), Ballina approaches 40% at depth [38]. According to the studies, the main reasons for this include the following [12]:
  • The high pore water pressure during penetration testing in a high-pressure environment on the seabed and the low strength of the soft soils on the seabed compared to the soft soils on the seabed has a greater impact on the sensitivity of the penetration resistance during testing.
  • There is a significant correction for unequal area effect and uncertainty in the overburden stress correction on penetration resistance.
Randolph et al. (1998) developed a full-flow penetrometer in 1994 to solve the above problem by increasing the coverage area of the penetrometer based on the full-flow theory [39]. The undrained shear strength of soft soils is determined by the frictional resistance generated by a viscous fluid-like soil flow around the penetrometer as it passes through the soft soil, as shown in Figure 3. The newly proposed full-flow penetrometer has a more rigorous theoretical solution between the penetration resistance measured by the penetrometer and the strength of the soft soil, and it can be applied using cyclic penetration tests to estimate the remodeling strength of the soft soil and further estimate its sensitivity. The T-bar, ball, and plate penetrometers are shown in Figure 4 [40]. The T-bar penetrometer was first used in marine engineering practice in 1998, and it is currently utilized in a variety of nations and areas for marine surveys. The correction applied to the full-flow penetrometer resistance is much smaller due to the near equal pressure above and below the probe. The correction required for the piezocone varied between 20 and 40% at depth, while the piezoball and T-bar correction remained below 10% [37,38].
Currently, the international standard NORSOK G-001 (Standards Norway 2004) incorporates a T-bar penetrometer. The standard defines a 40 mm diameter, 250 mm long, and 10,000 mm2 projected area steel T-bar penetrometer (10 times the size of a standard CPT). The cross-sectional area of the connecting rods should not exceed 15% of the projected area of the T-bar penetrometer, nor should the diameter exceed the diameter of the T-bar penetrometer. Additionally, the surface of the T-bar penetrometer should be lightly sandblasted.
Naturally, the T-bar penetrometer is more susceptible to bending moments, which has an impact on the induced load cell in the system. These may lead to spurious changes in the load cell measurements, as it is difficult to achieve the results when the load cells are completely independent of bending effects. However, the T-bar penetrometer can be used as a pipeline component model to provide direct information for the design of pipelines and risers. For super soft clay sites in deep water, it can be very useful to obtain T-bar or ball penetrometer test data in addition to CPTU.

3. Analysis of T-Bar Full-Flow Penetration Test Results

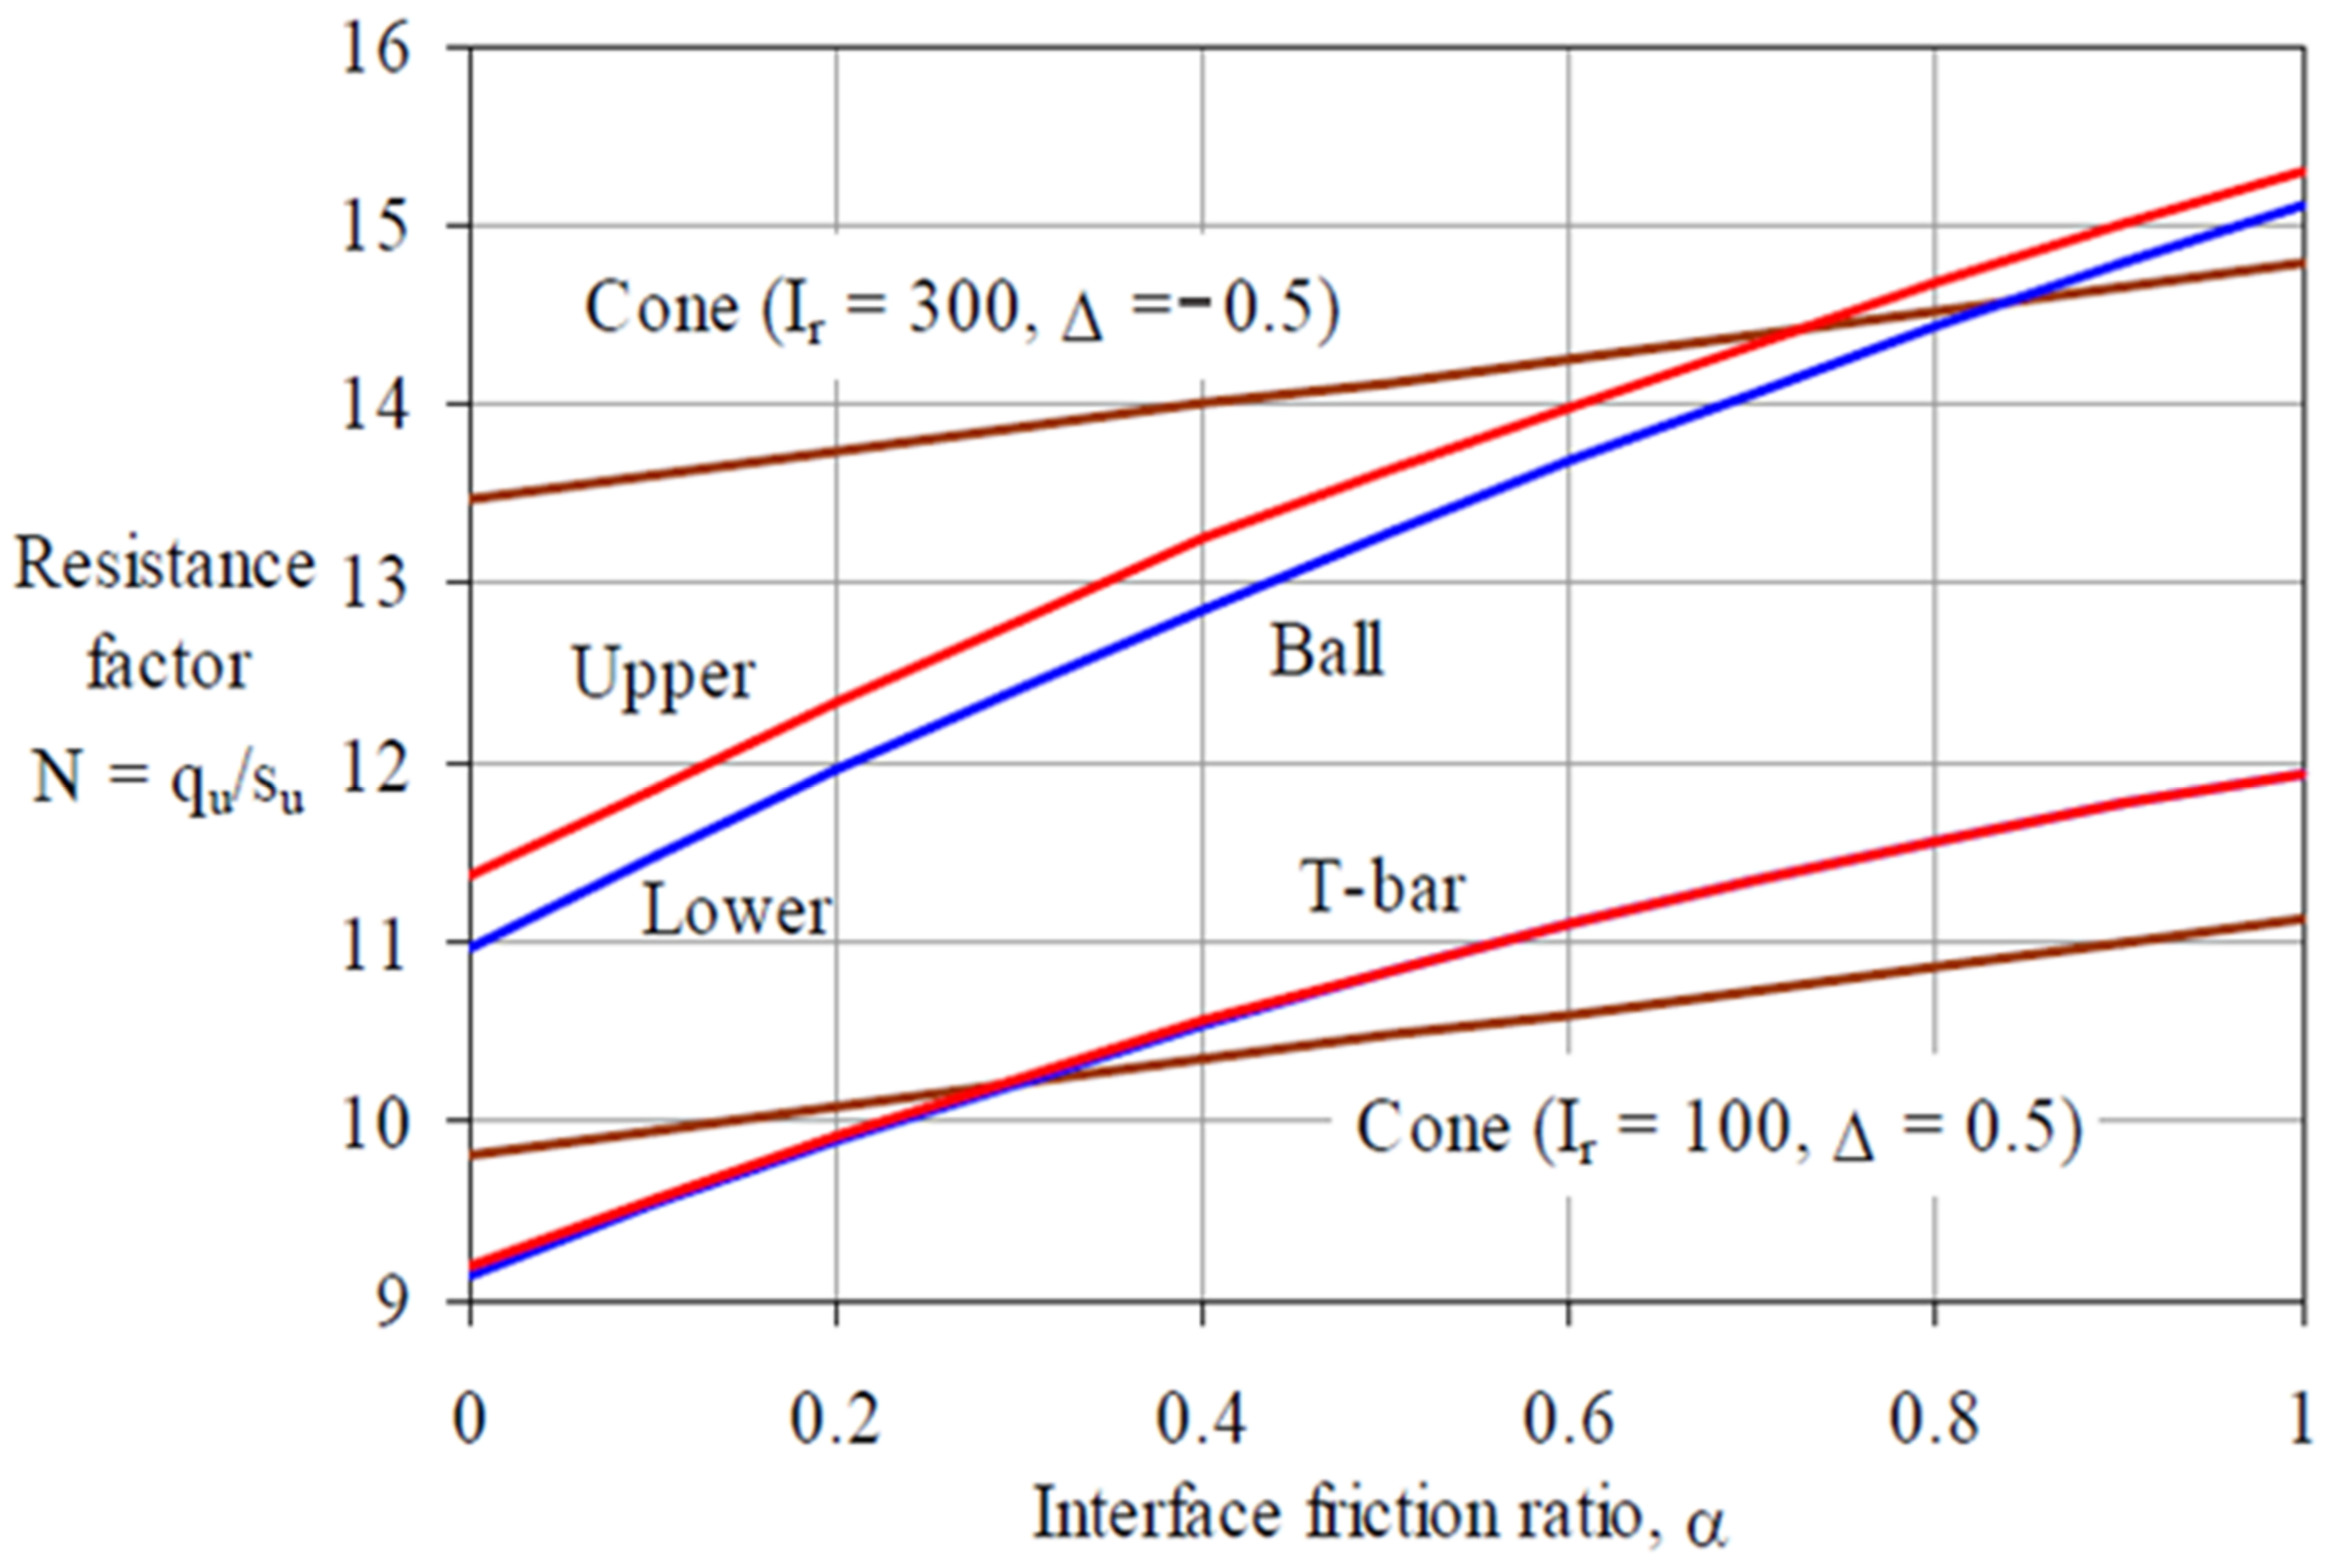
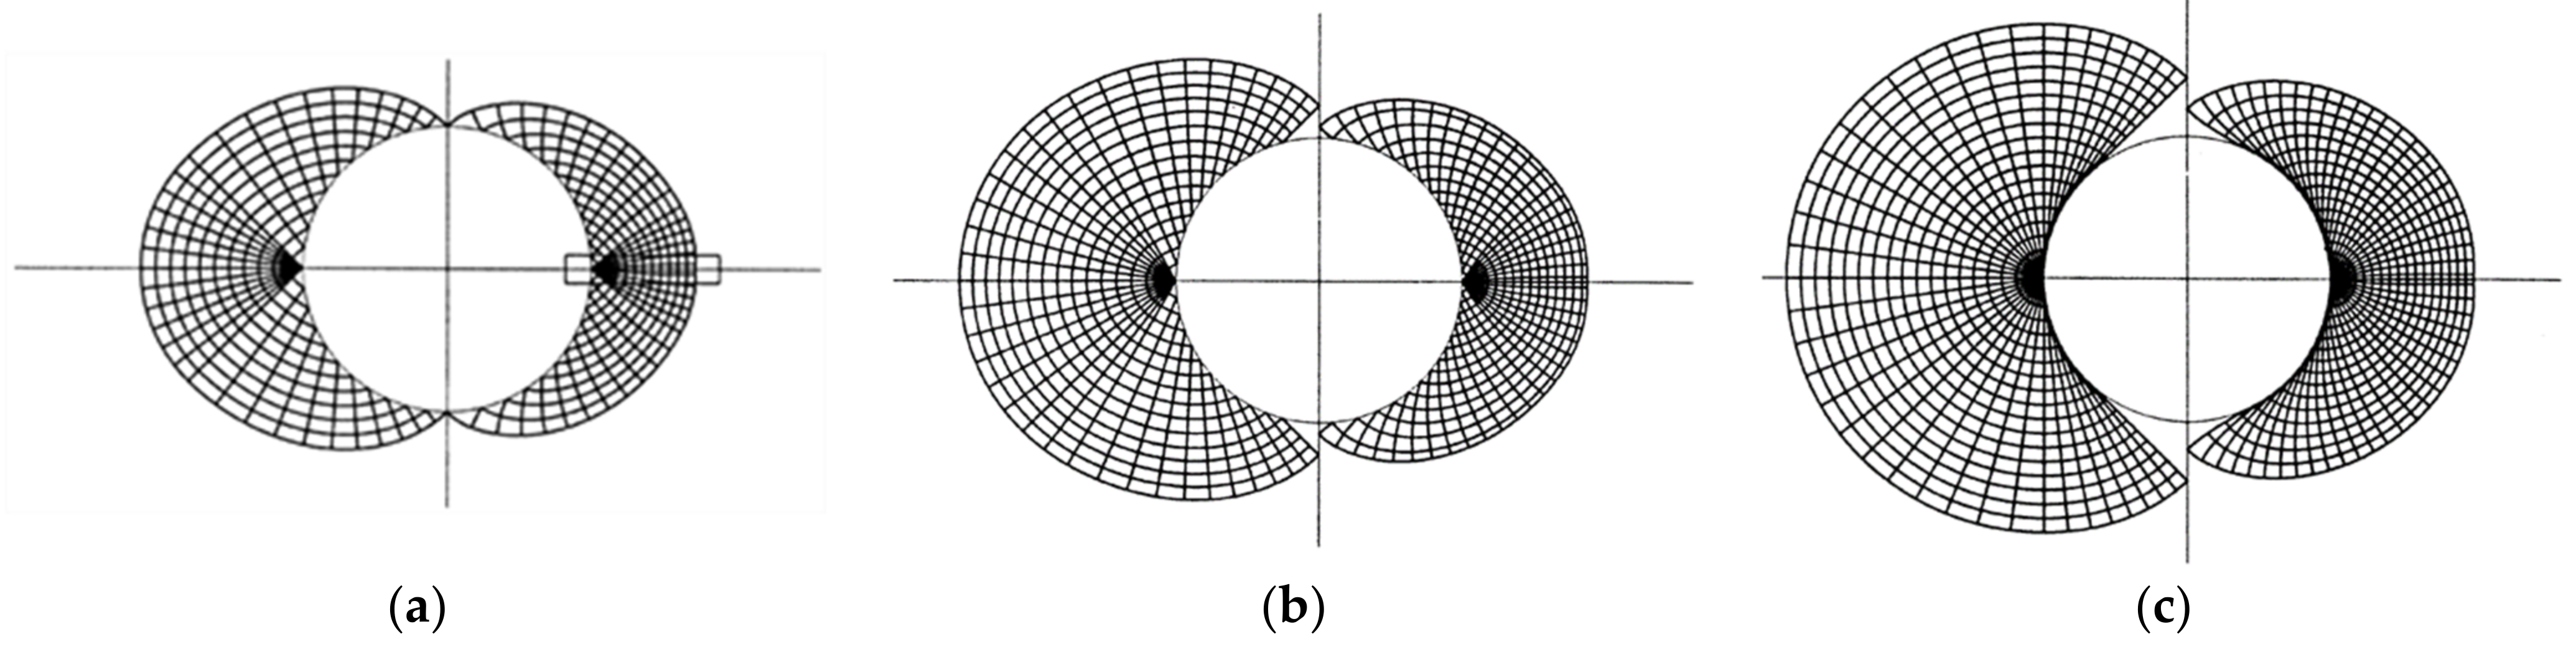
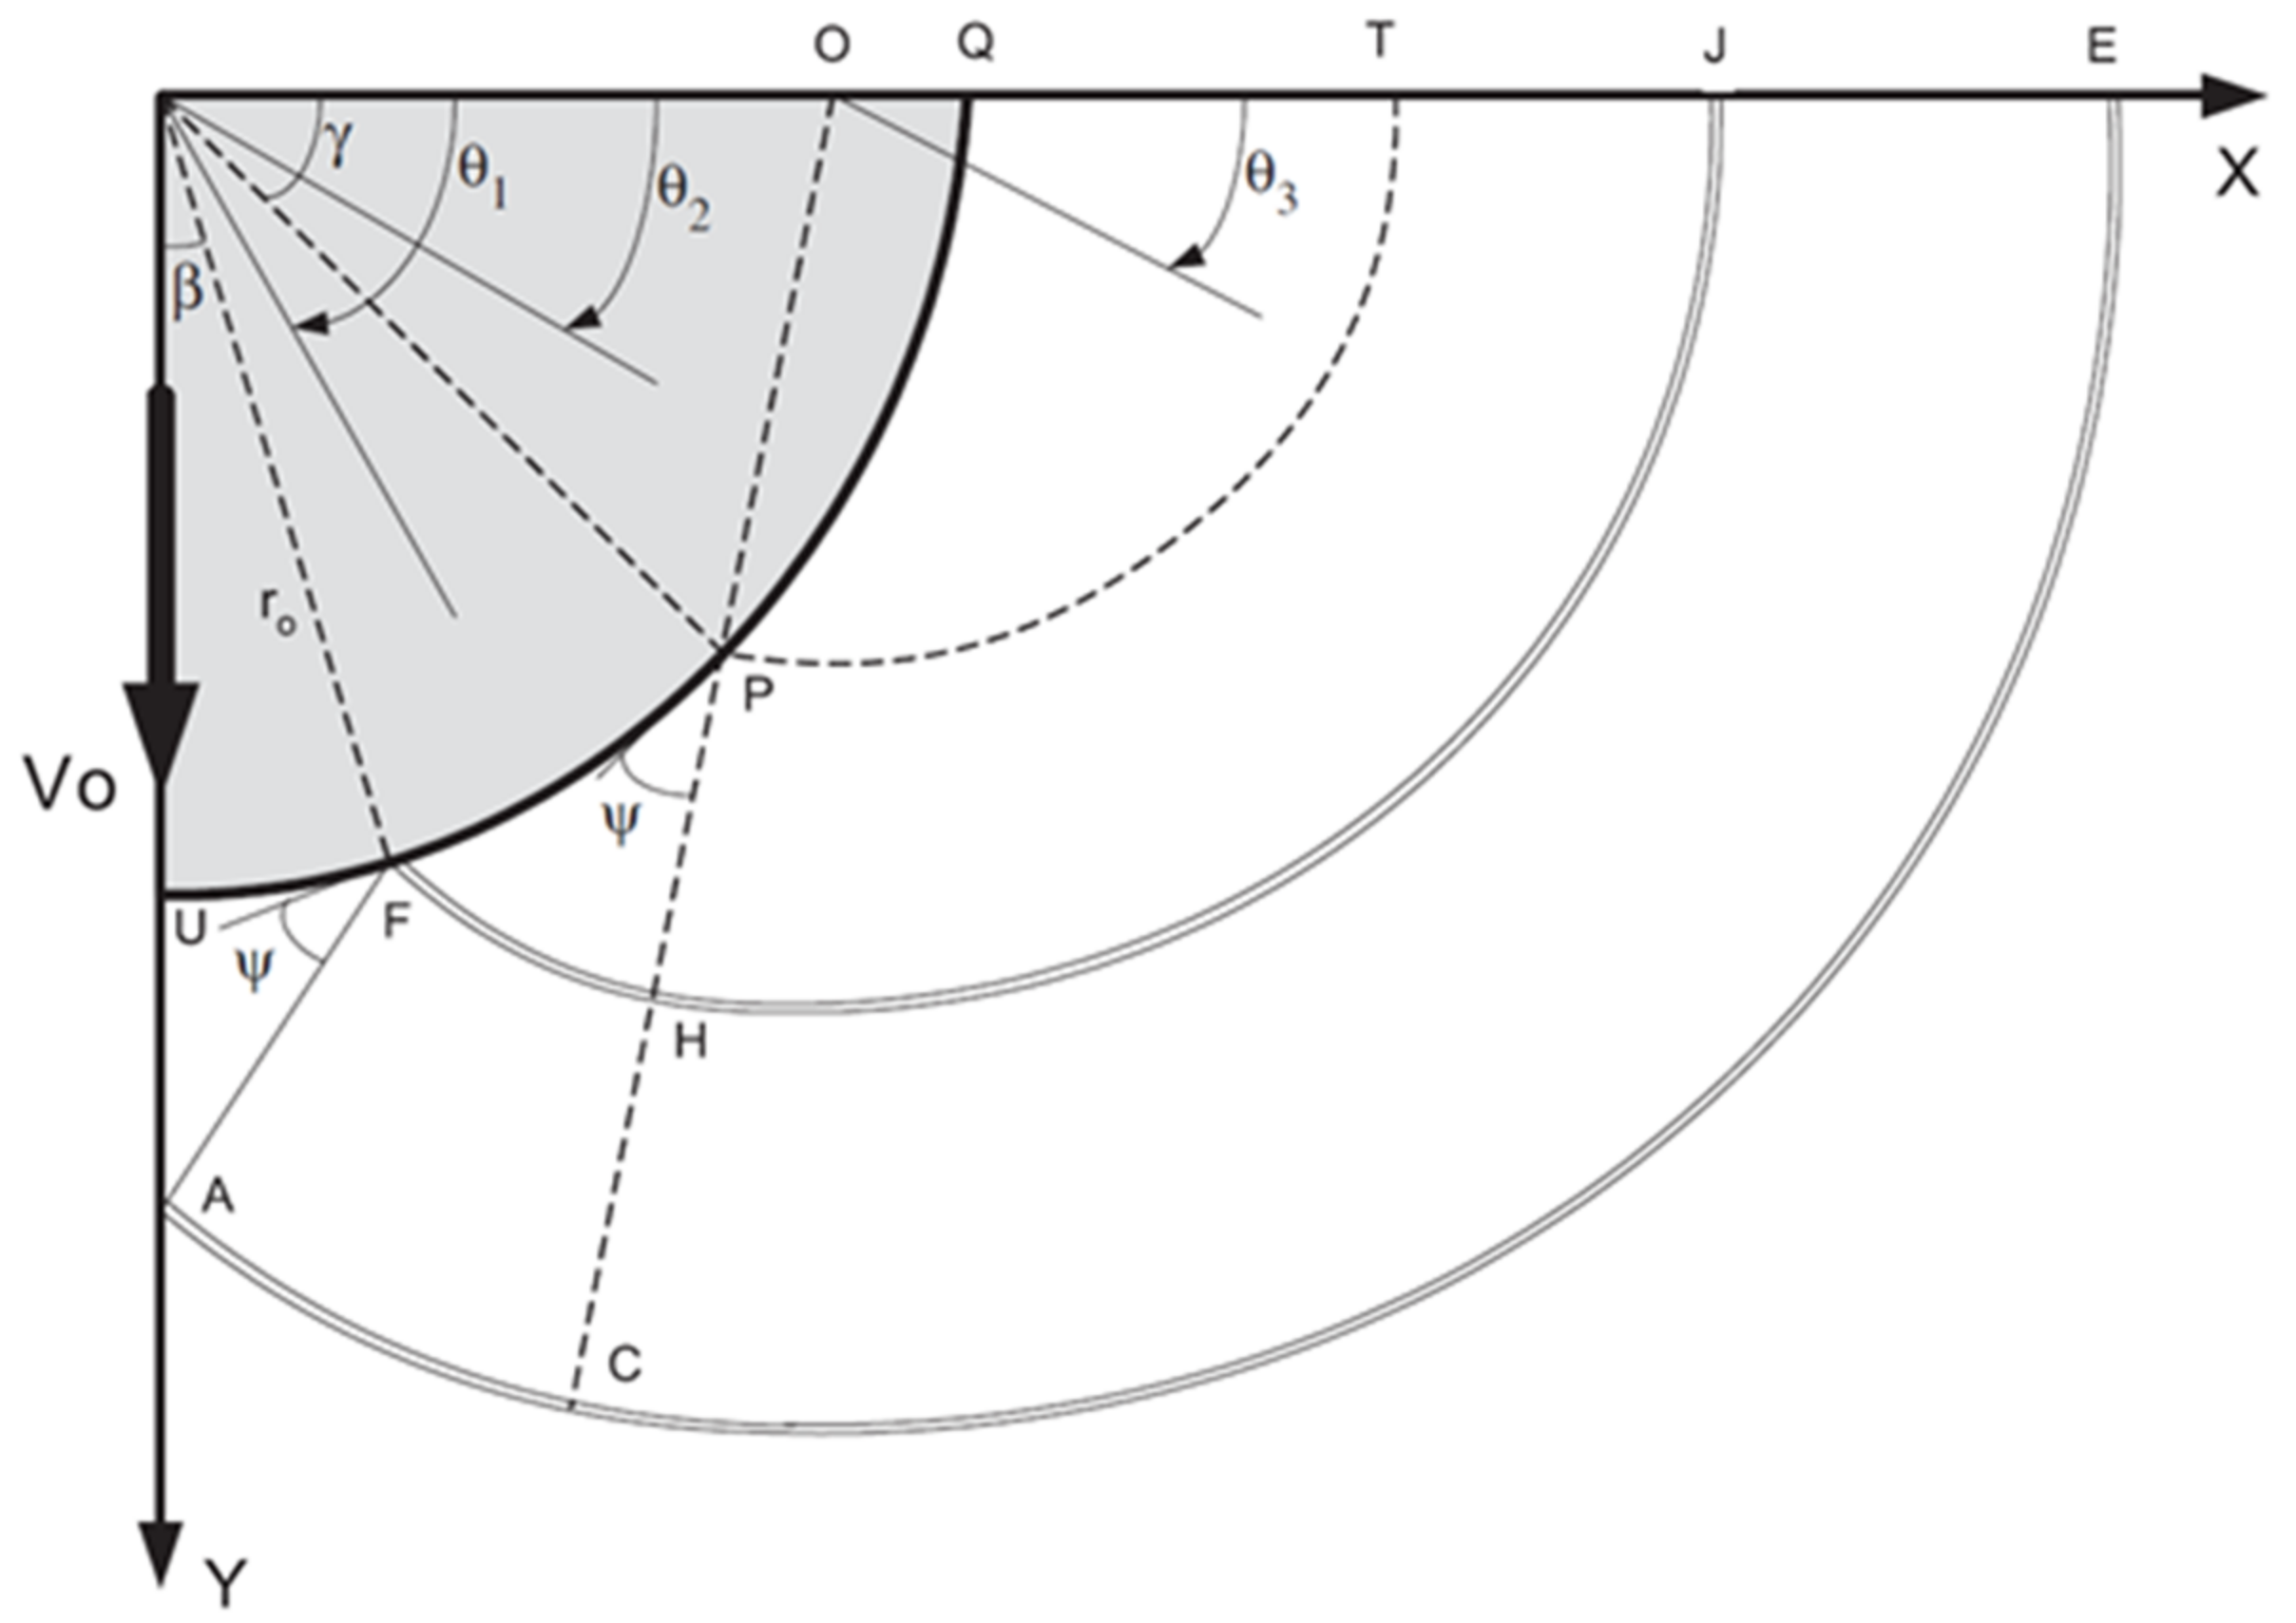
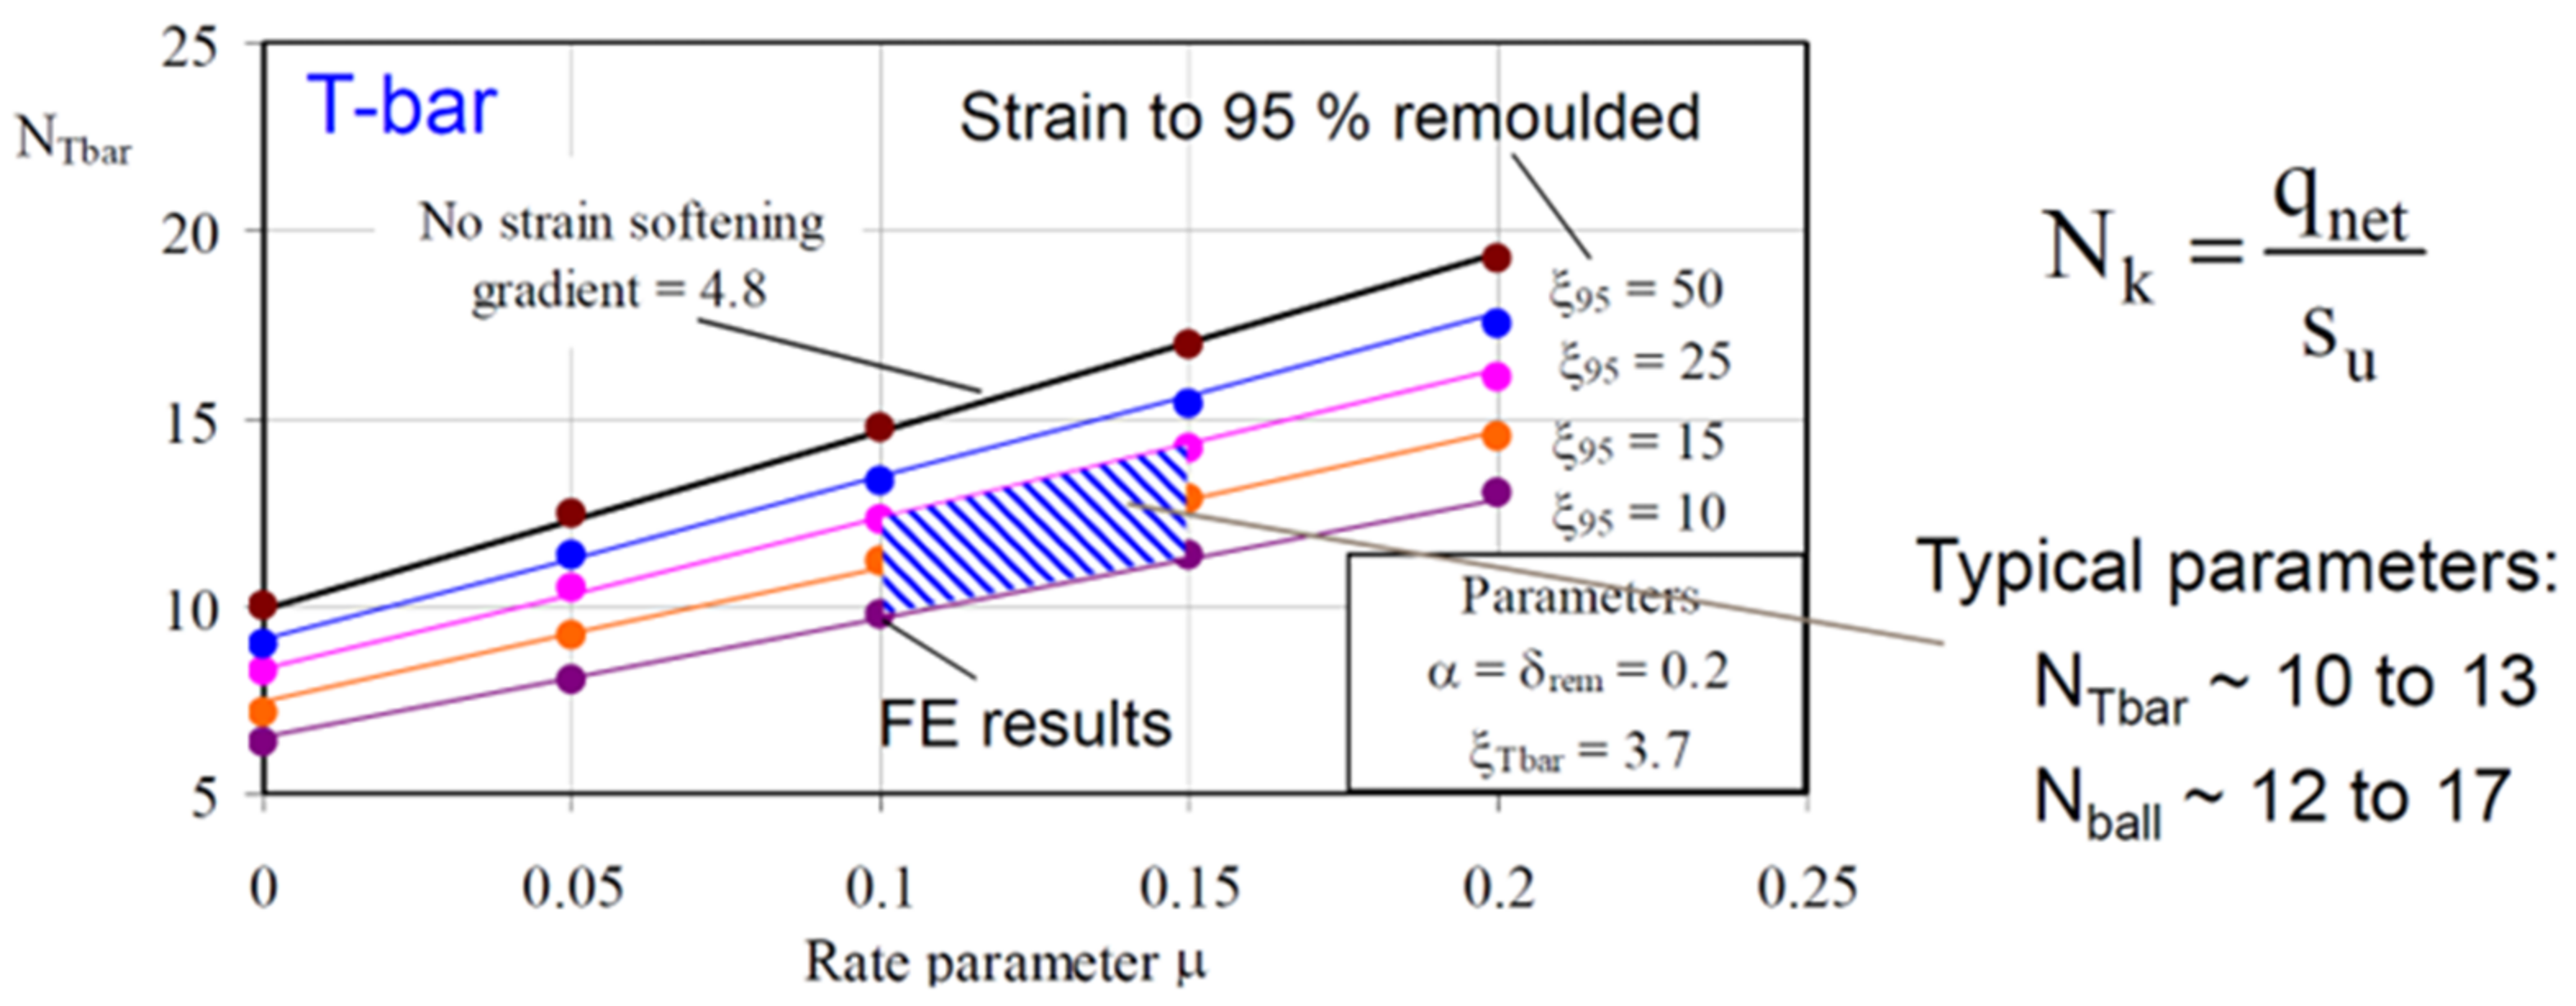
3.1. Analytical Solution of the Resistance Factor

The undrained shear strength of soft soils (su) is one of the most crucial indicators for analyzing the strength properties and stability of the soils, as well as one of the most important parameters for marine soft soil engineering. Haneng et al. (2014) demonstrated that the shape of the T-bar penetrometer resembles a cylindrical pipe, and that the undrained shear strength derived from the penetration test was more accurate for use as a strength parameter in the design of subsea pipelines and risers in practical marine engineering [34,41]. The results of the model tests and field tests by Weemees et al. (2006) and Yafrate et al. (2007) showed that the L/D ratio (length–diameter ratio) of the T-bar penetrometer should be 4–10 (i.e., the projected area of the T-bar penetrometer is 6.4–15 times the area of the standard cone), which does not affect the dimensional resistance to penetration, and recommended that the L/D ratio of the T-bar penetrometer should generally be greater than 4 [42,43]. Low and Randolph et al. (2010) analyzed the results of the undrained shear strength tests conducted at several soft soil sites in Australia and concluded that the T-bar penetrometer has a good reliability in measuring the undrained shear strength of in situ and remodeled soft soils on the seabed [44]. The experimental studies by Yafrate et al. (2009) showed that the T-bar penetrometer can estimate the remodeled soil su and Sensitivity St, and proposed a series of equations to estimate the relevant design parameters for soft soils [45]. Lunne et al. (2010) analyzed the test results from multiple subsea soft soil sites around the world and discovered that the strength measured using full-flow penetrometer was influenced by strength anisotropy, and that the relationship between the resistance factors of the soft soil remodeling and in situ soils varied primarily with St, independent of the properties such as the mechanical strength of the soft soil [32].
The resistance factor NT-bar of the T-bar penetrometer can be estimated by using the plasticity theoretical solution of the full-flow theory and the modified penetration resistance qT-bar obtained from the test to estimate su as follows:
s u = q T - bar N T - bar
In this case, considering the pore pressure and overburden stress for the penetration resistance of the T-bar penetrometer, the penetration resistance can be corrected by the following equation:
q T - bar = q m σ v 0 u 0 1 α A s A p
where qm is the measured penetration resistance, u0 is the static pore water pressure, and α is the static area ratio; As is the cross-sectional area of the connection axis; and Ap is the projected area of the horizontal axial direction of the tactile penetrometer. Randolph made some small modifications to the above equation, which did not result in significant changes to the calculations and eliminated the necessity for the accurate measurement of u2 for the T-bar penetrometer [6].
Martin and Randolph et al. (2006) investigated NT-bar based on the plasticity theory and derived their upper limit solution for the friction coefficient α on the surface of the penetrometer and their linear fit [6,46].
N T - bar ,   ideal ~ 9.14 + 4.14 α 1.34 α 2
N T - bar , ideal ~ 9 + 3 α
This method yields a range of NT-bar from 9.14 (α = 0) to 11.86 (α = 1), and it is generally accepted that a light sandblasting of the penetrometer surface would result in an α of 0.4, with Low suggesting the NT-bar value of 10.5. Randolph et al. give the variation of the resistance factor with the friction coefficient α for the T-bar, ball, and cone penetrometers, as shown in Figure 5 [6].
Randolph et al. (2005) found that the actual measured NT-bar values were larger when comparing the experimental solution to the theoretical analytical solution for the NT-bar values measured in the vane shear tests and laboratory tests [6]. Randolph analyzed this phenomenon and suggested that the main factors influencing the difference between the theoretical and experimental solutions for NT-bar were sensitivity, strain softening, and strain rate.
Randolph and Hloulsby et al. (1984) and Martin and Randolph et al. (2006) derived analytical solutions for the T-bar resistance factors using the ideal elastoplastic intrinsic model based on the Tresca and Mises yield criteria, respectively, according to the limit analysis method [46,47], and Figure 6 shows the assumed stress characteristic lines for the T-bar and ball full-flow penetrometer stresses in the lower limit method, respectively [48].
For the T-bar, the resistance factor NT-bar was based on the theoretical lower and upper bound solutions for a cylindrical plane strain object moving through a rigid plastic medium [47]. Figure 7 demonstrates the upper bound mechanism for both the cylinder and sphere [49]. Figure 8 illustrates the resistance factor NT-bar values for the strain rate correlation and strain softening effects of the T-bar penetrometer [41].

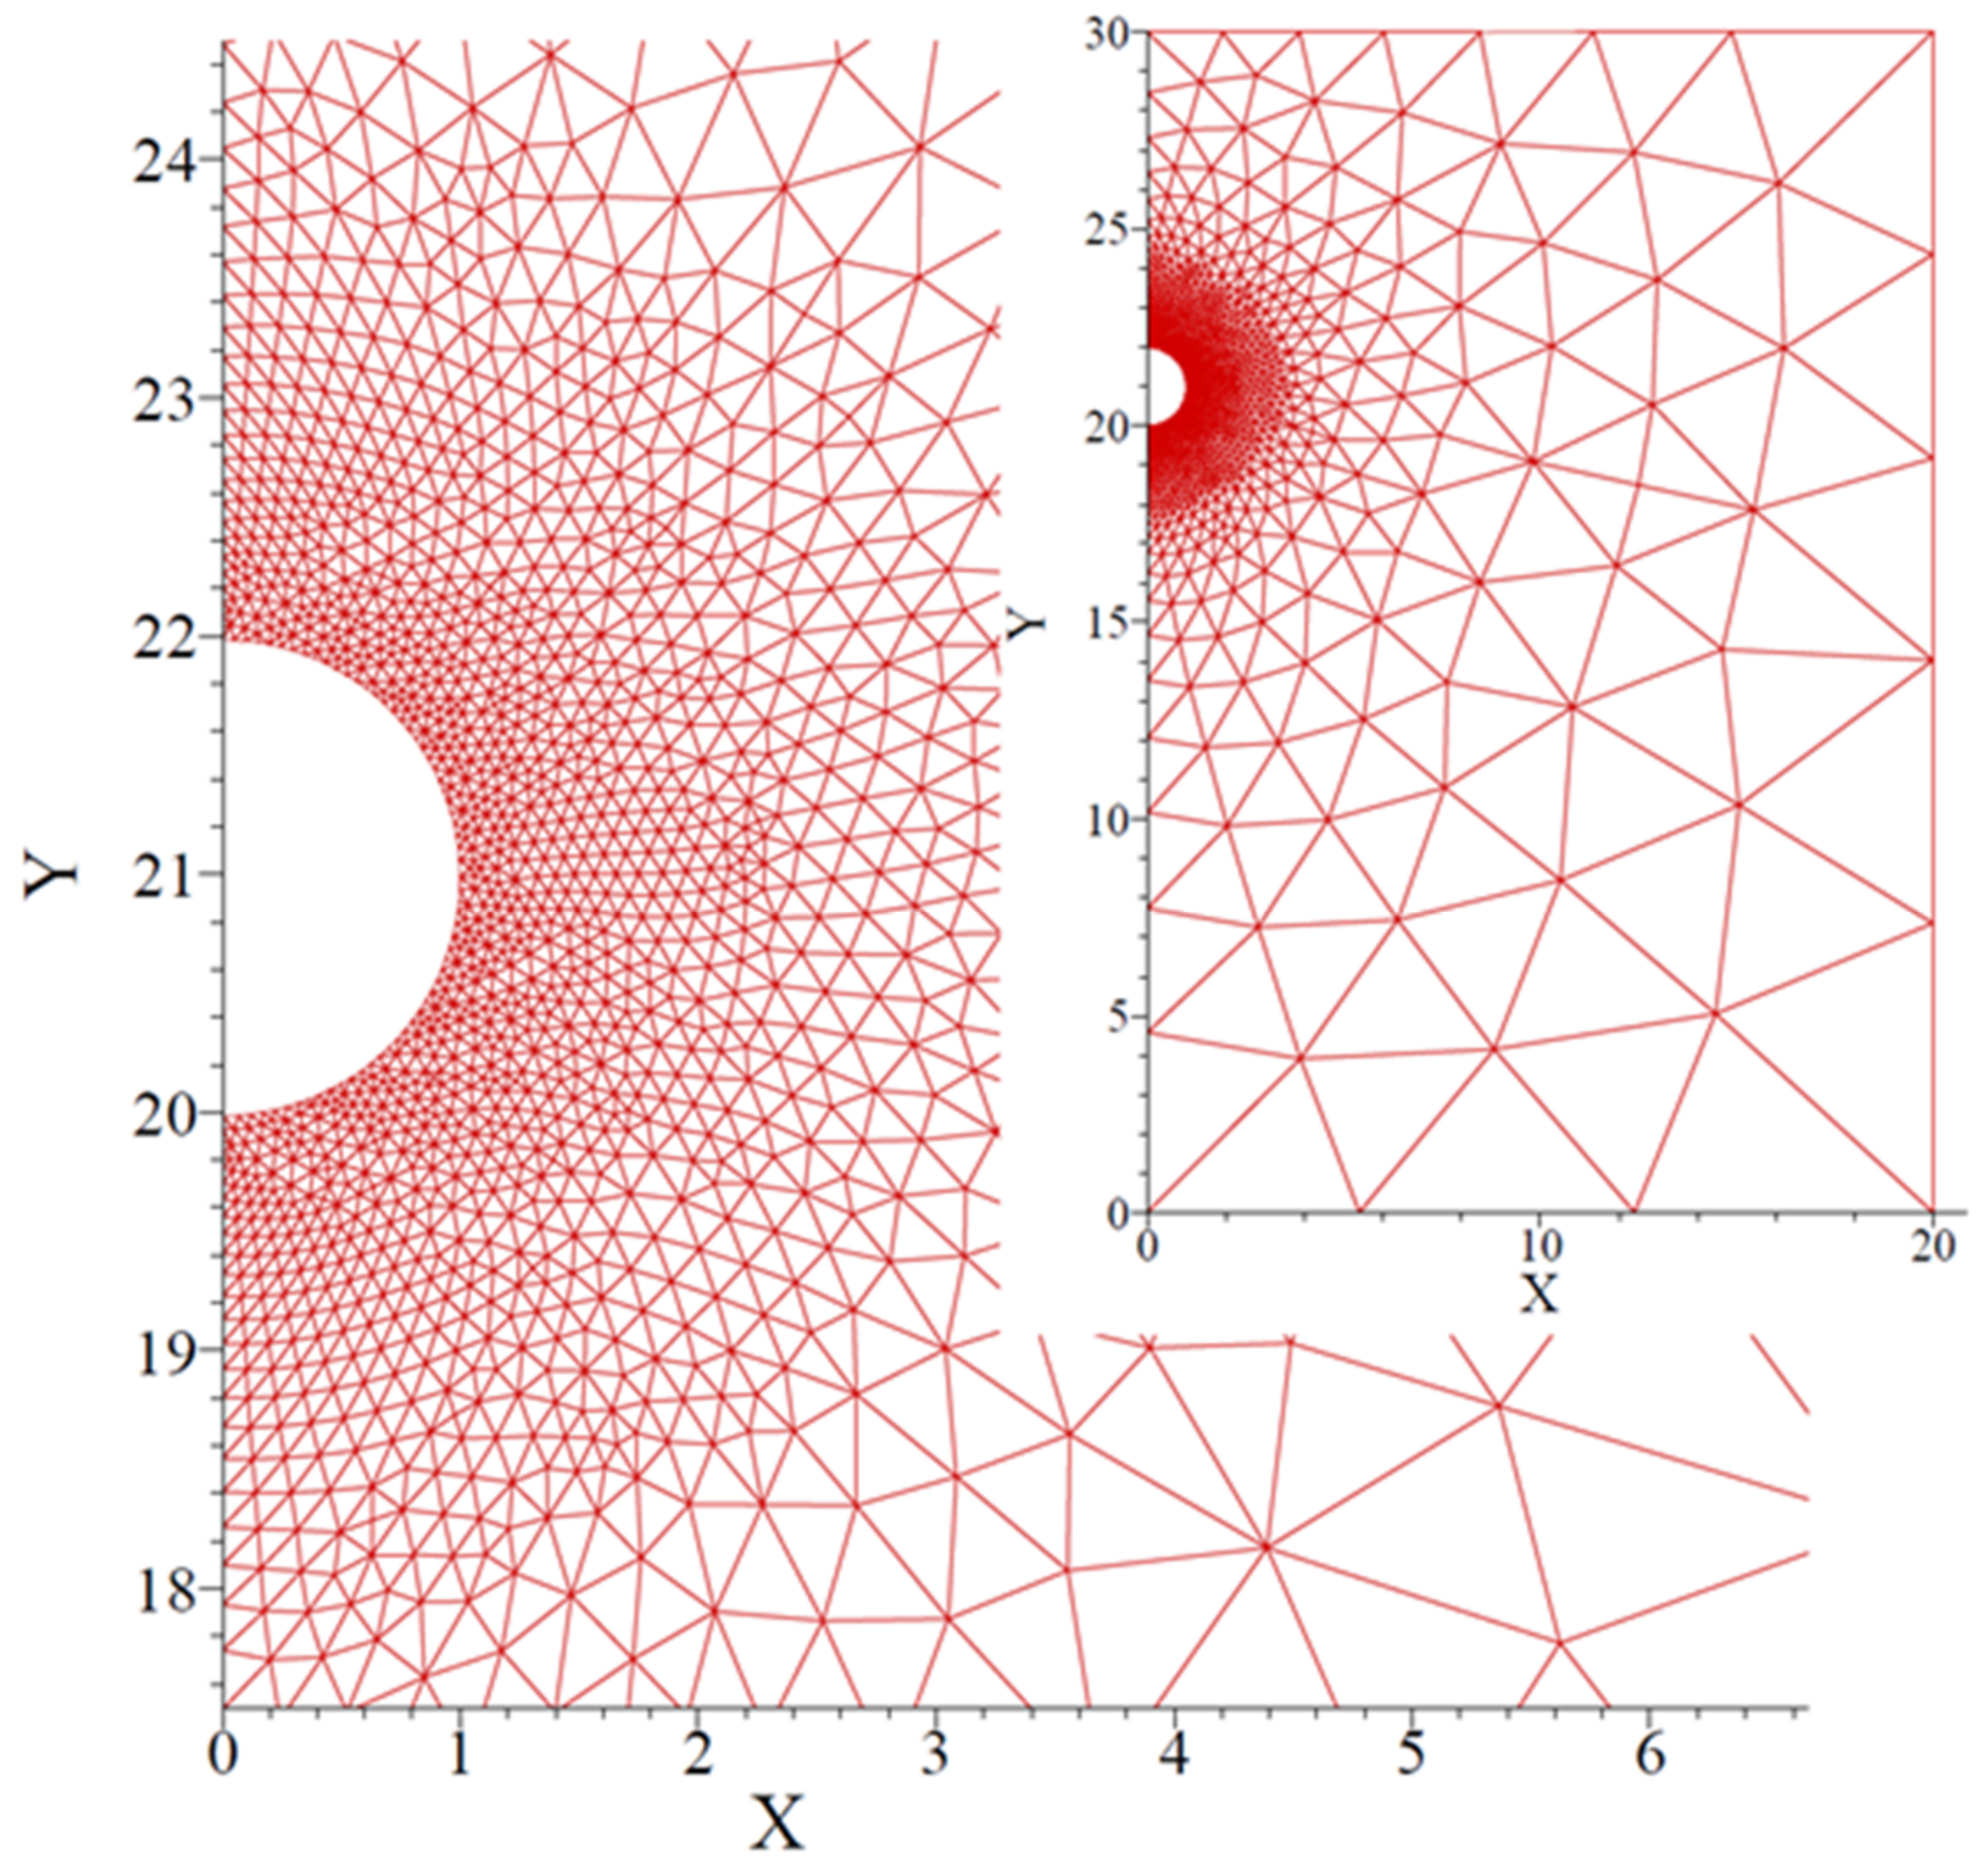
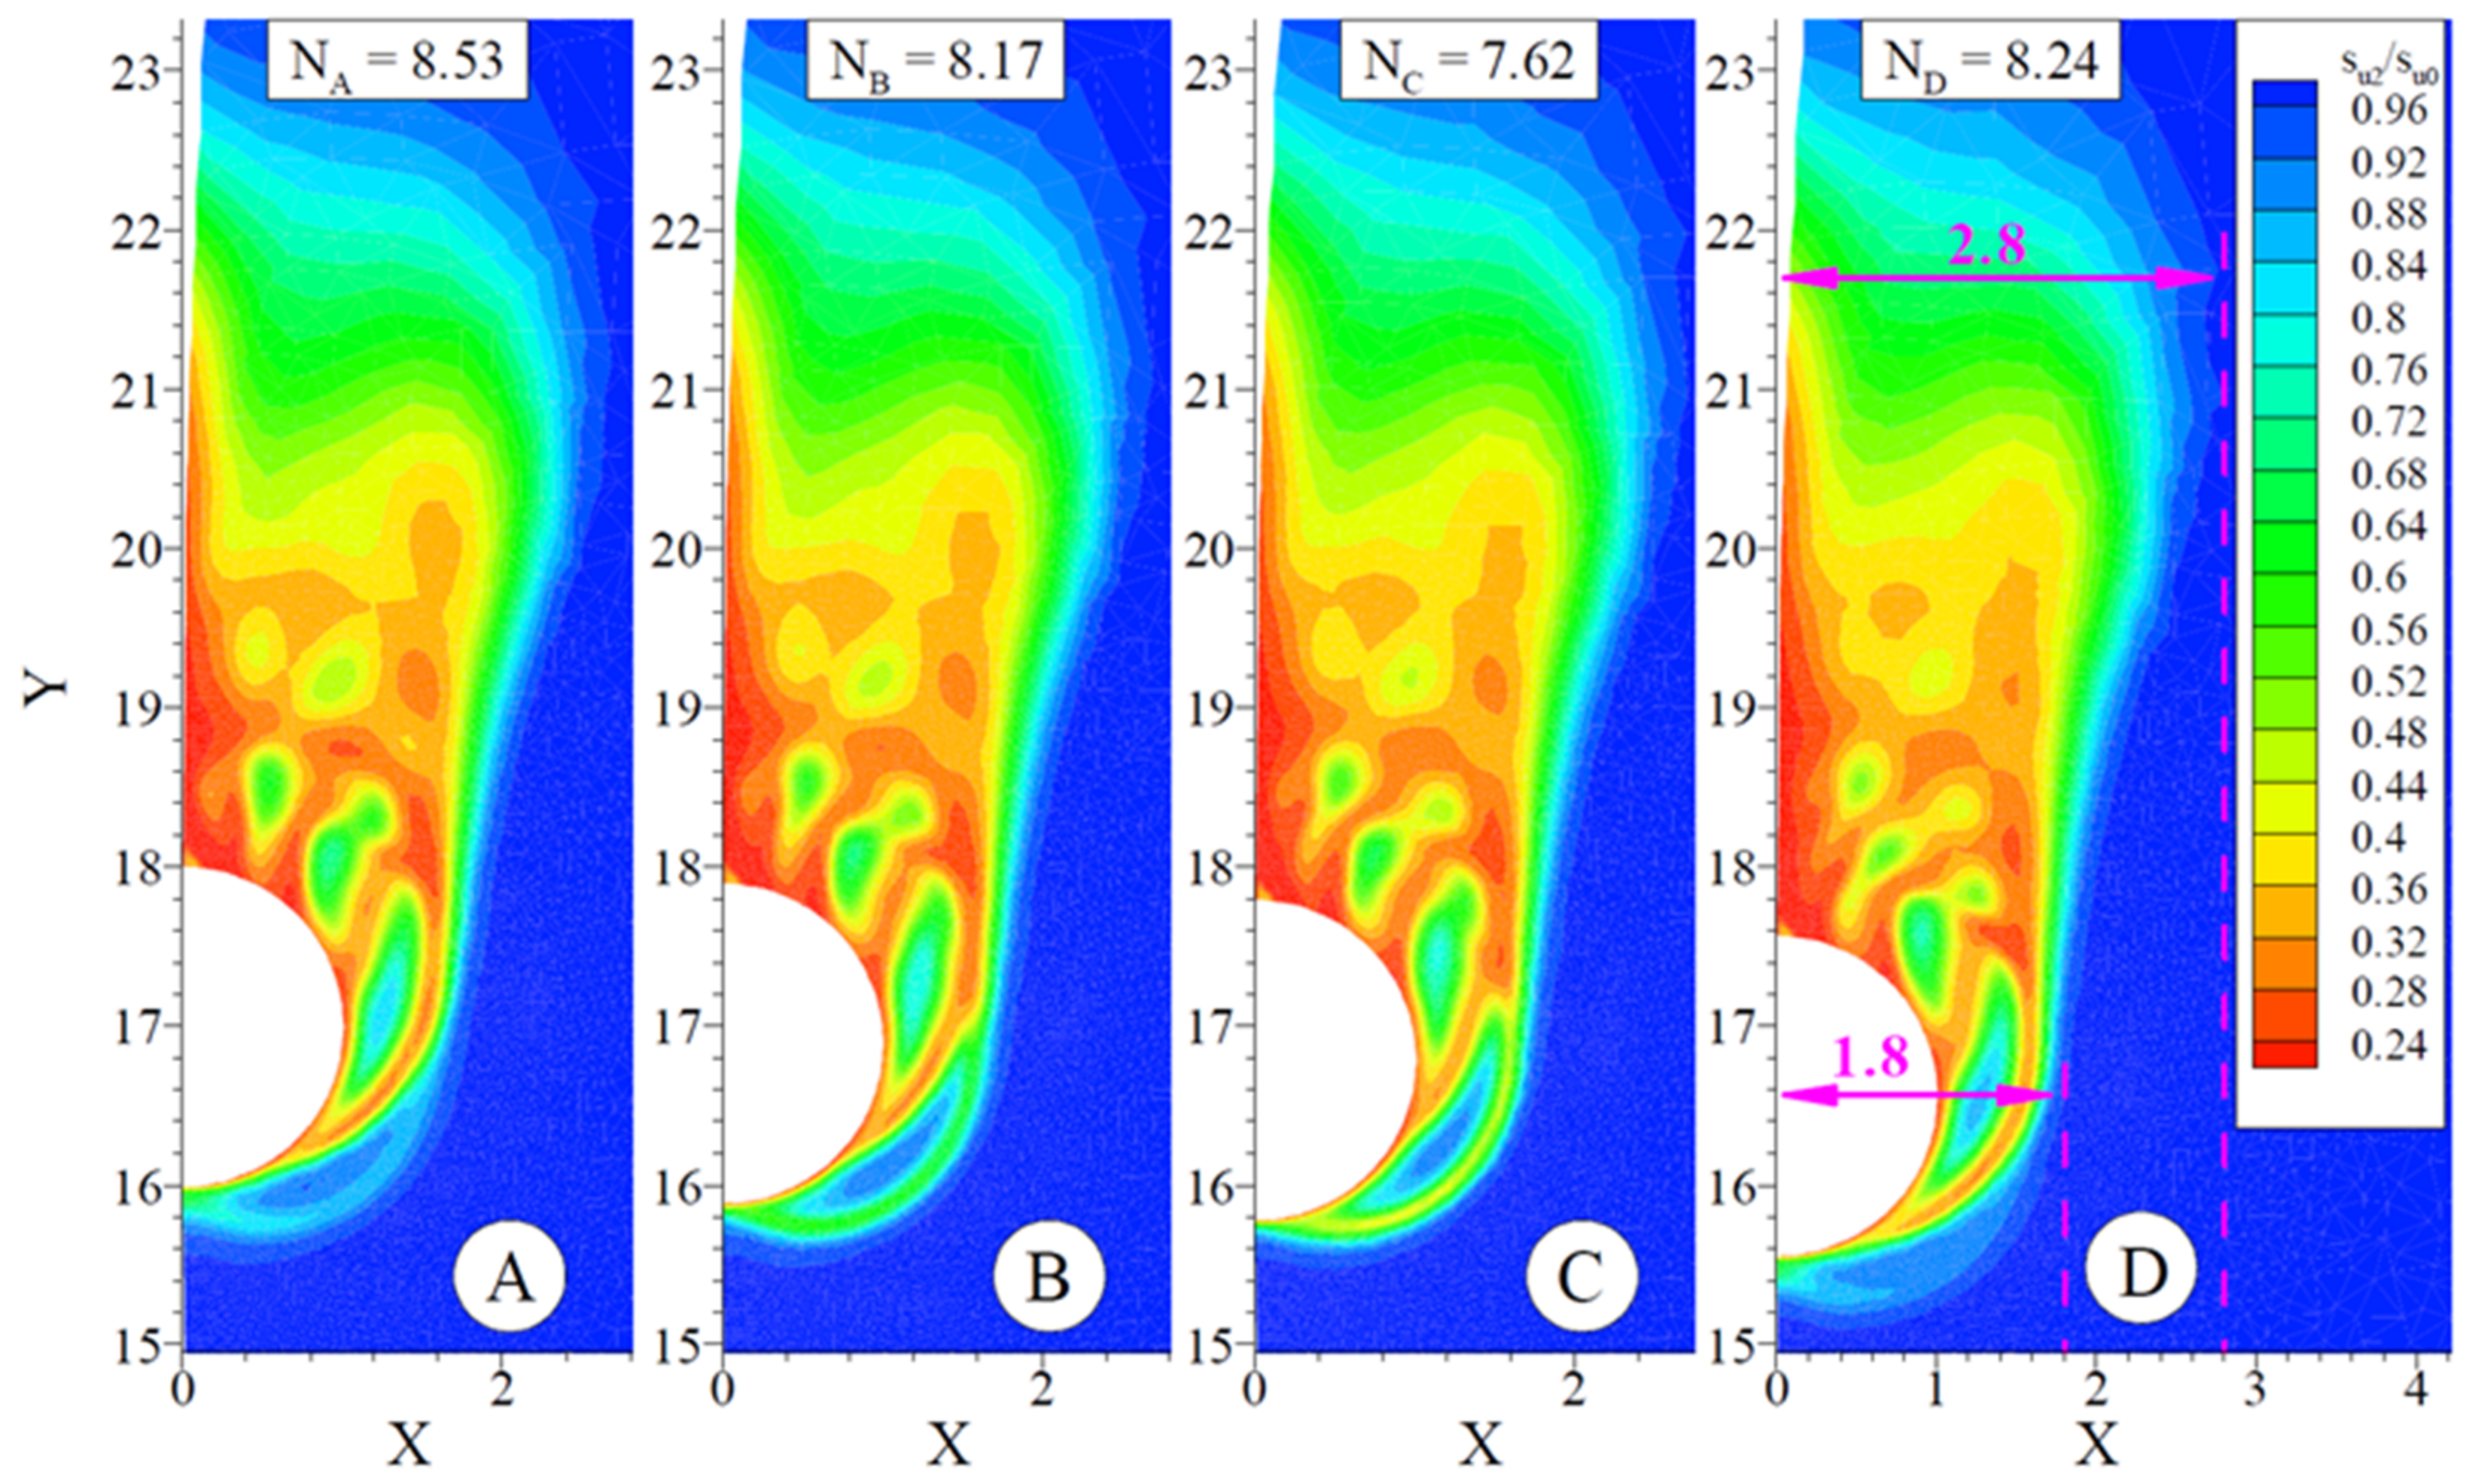
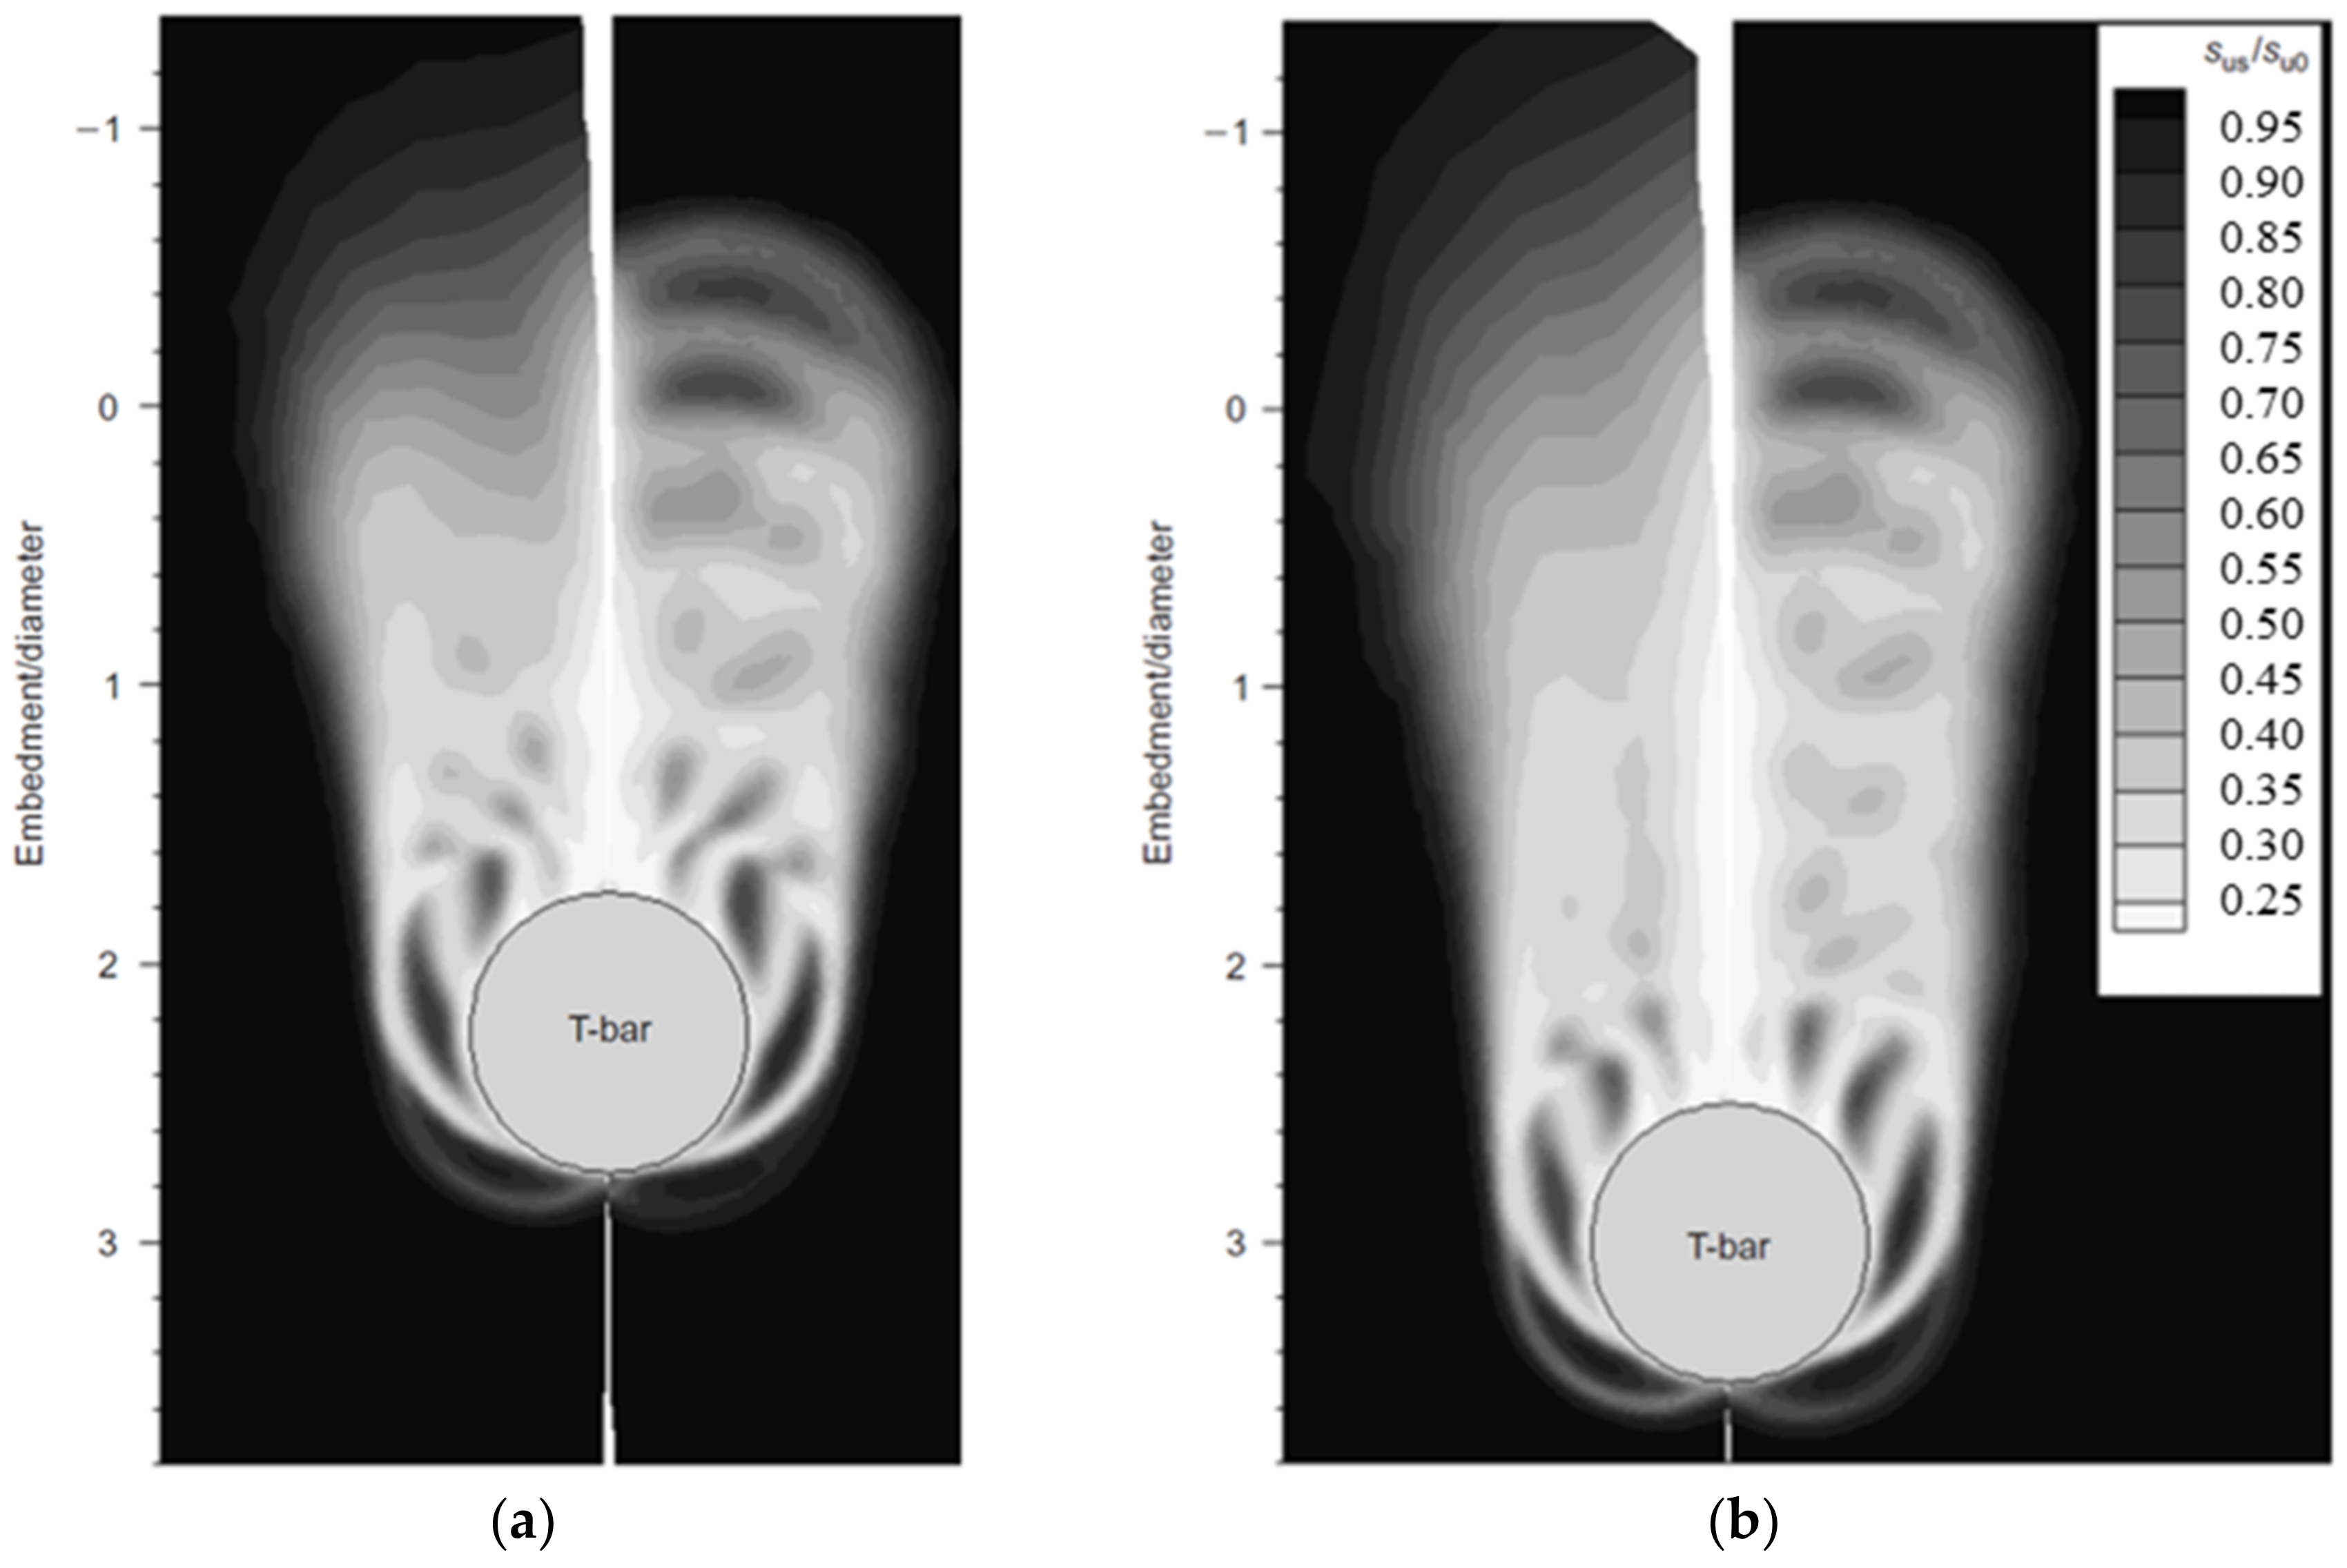
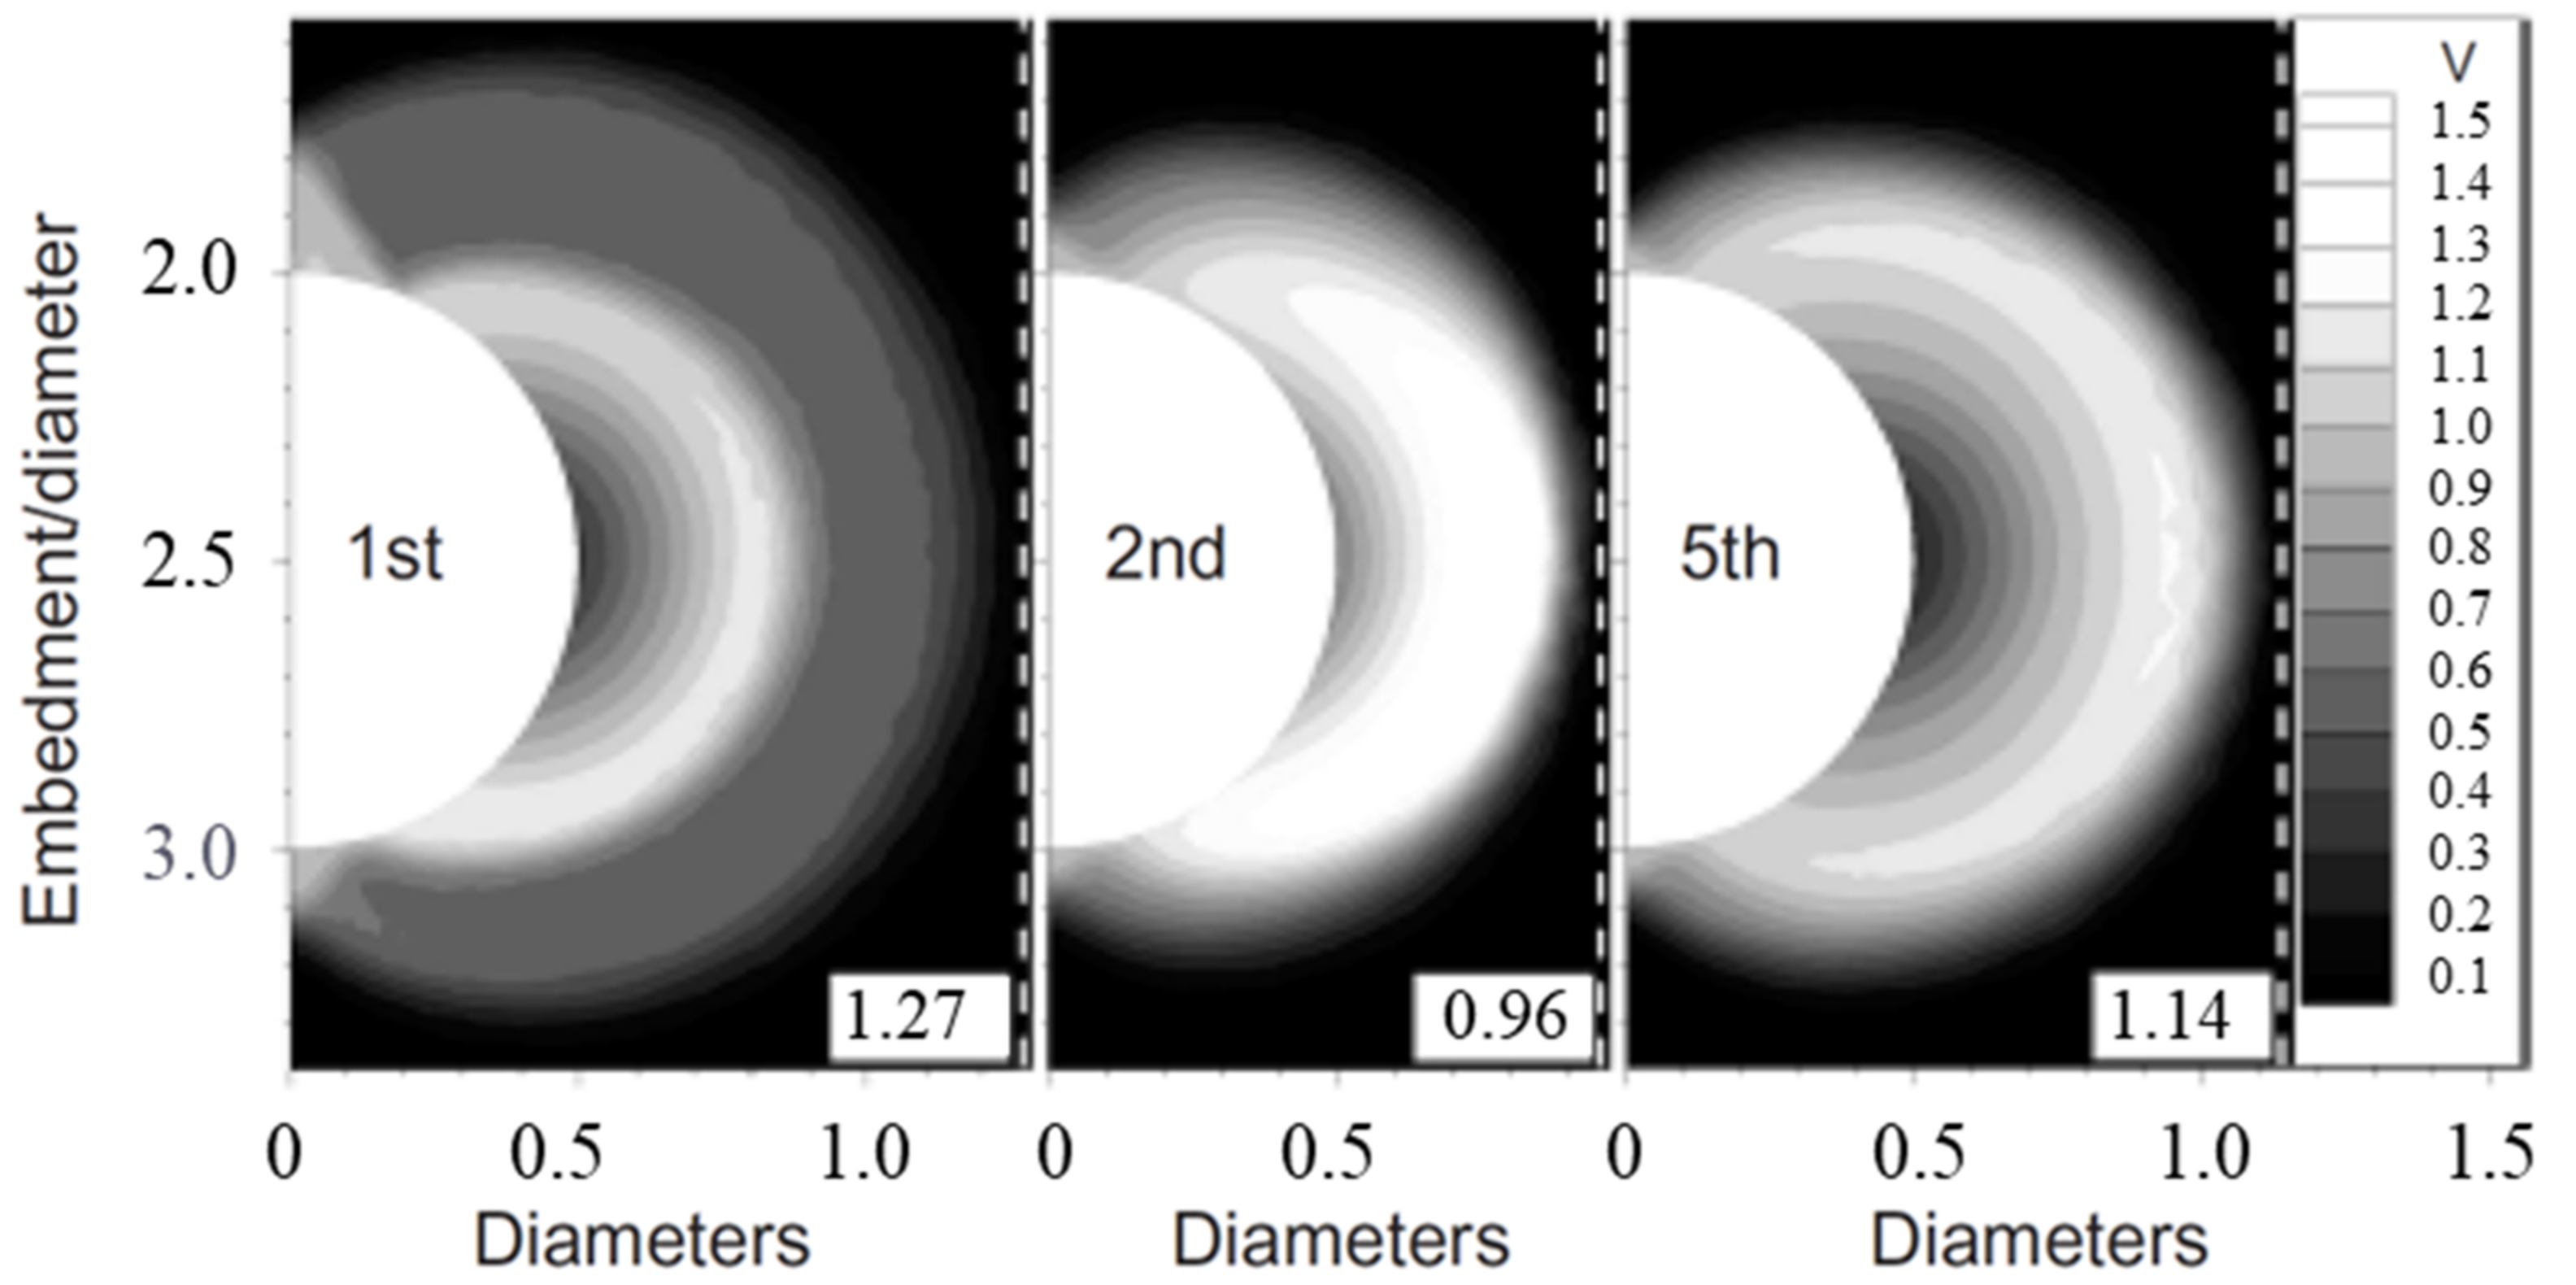
3.2. Numerical Simulation

Zhou and Randolph (2009) concluded that natural soft soils are not ideal plastic soils, that relatively high strains are generated in soft soils during penetration, and that strain softening occurs as the soft soil flows through the surface of the T-bar penetrometer [50]. Therefore, in practice, the effect of both the strain rate correlation and strain softening on the penetration resistance factor should be considered in the full-flow penetrometer, and it is necessary to make corrections to the penetration resistance factor.
The association between the shear strain rate and resistance factor was investigated using a variety of numerical methods, with Einav and Randolph (2005) using a combination of an upper limit solution and a strain path method (UBSPM) [49], Klar and Pinkert (2010) using the steady state finite difference method (SSFD) [51], and Zhou and Randolph (2009) using large deformation finite element analysis (LDFE) [50]. All three methods employ a similar logarithmic law to describe the association between the shear strain rate and resistance factor.
Einav and Randolph (2005) combined the upper limit solution of the plasticity theory with the strain path method by using the full-flow mechanism and considering strain softening to derive a resistance factor related to the shear strain rate γ and the total plastic shear strain value ξ [49].
N u = N u , ref 1 + μ log γ γ ref
where Nu,ref is the value of the resistance factor at the strain rate γref = 1%/h.
The damage factor δ describes the relationship between the shear strength value and the ideal state strength during the gradual softening of soft soils.
δ ξ = s us s ui = δ rem + 1 δ rem e 3 ζ / ζ 95
where sus and sui are the softened strength and initial strength, respectively; δrem is the damage factor value for soft soils at full remodeling and is the ratio of the shear strength of fully remodeled soils to the shear strength of de-primed soils, which is the reciprocal of the sensitivity St; and ξ95 is the cumulative plastic shear strain corresponding to the remodeled soils when the remodeling damage reaches 95%.
Zhou and Randolph (2009) provide a correction equation for the resistance factor based on the LDFE method considering the effect of strain softening concerning the strain rate dependence [25,50].
N T - bar 1 + 4.8 μ δ rem + 1 δ rem e 1.5 ζ T - bar / ζ 95 N Tbar - ideal
where μ is the rate of increase in strength corresponding to a ten-fold increase in strain rate, typically 0.1.
By comparing the findings of these three methods, it can be seen that the LDFE analysis yields the most comparable resistance factor values due to its ability to represent the softened shear zone corresponding to the cyclic variation of the cyclic penetration resistance.
The penetration mechanism of the T-bar penetrometer was analyzed by Zhou and Randolph (2009b, 2011) using a large deformation finite element analysis software, as depicted in Figure 9, Figure 10, Figure 11, Figure 12 and Figure 13 [50,52]. The effects of the penetration rate and strain softening on the resistance factor of the T-bar penetrometer and the range of action effects were analyzed, respectively.
Based on the ABAQUS software, Yang (2018) analyzed the stress change of the soil around the full-flow penetrometer before and after its penetration (Figure 14 and Figure 15), and pointed out that the penetrometer based on the full-flow mechanism would still produce large compressive stress at the lower part of the penetration direction, while a small gap was formed at the connection between the penetrometer and the rod due to the incomplete flow of soil, resulting in small stress [8].
In addition, Randolph and Andersen (2006) used the PLAXIS software to conduct finite element simulations of the penetration test of a T-bar full-flow penetrometer without considering the effect of the penetration rate [53]. The effect of the penetration rate, strength anisotropy, and strain softening on the resistance factor of a T-bar full-flow penetrometer was investigated using the ABAQUS finite element software by Fan et al. (2009) [54].

3.3. Laboratory Model Test

In situ testing is a technique used for testing geotechnical properties in the natural environment that has the characteristics of no sampling, simplicity, and speed, and is an effective method for accurately obtaining soil property parameters. Therefore, it is particularly crucial to study the theory and technology of in situ testing based on the field for the investigation of marine soft soil engineering [21].
The in situ testing techniques for evaluating the in situ condition of soils require the accumulation of a large amount of test data, as well as the application of corresponding theoretical derivations and empirical corrections to obtain reliable methods for evaluating soil properties. In situ tests are more time-consuming and cannot determine the variation of a single soil parameter.
1.
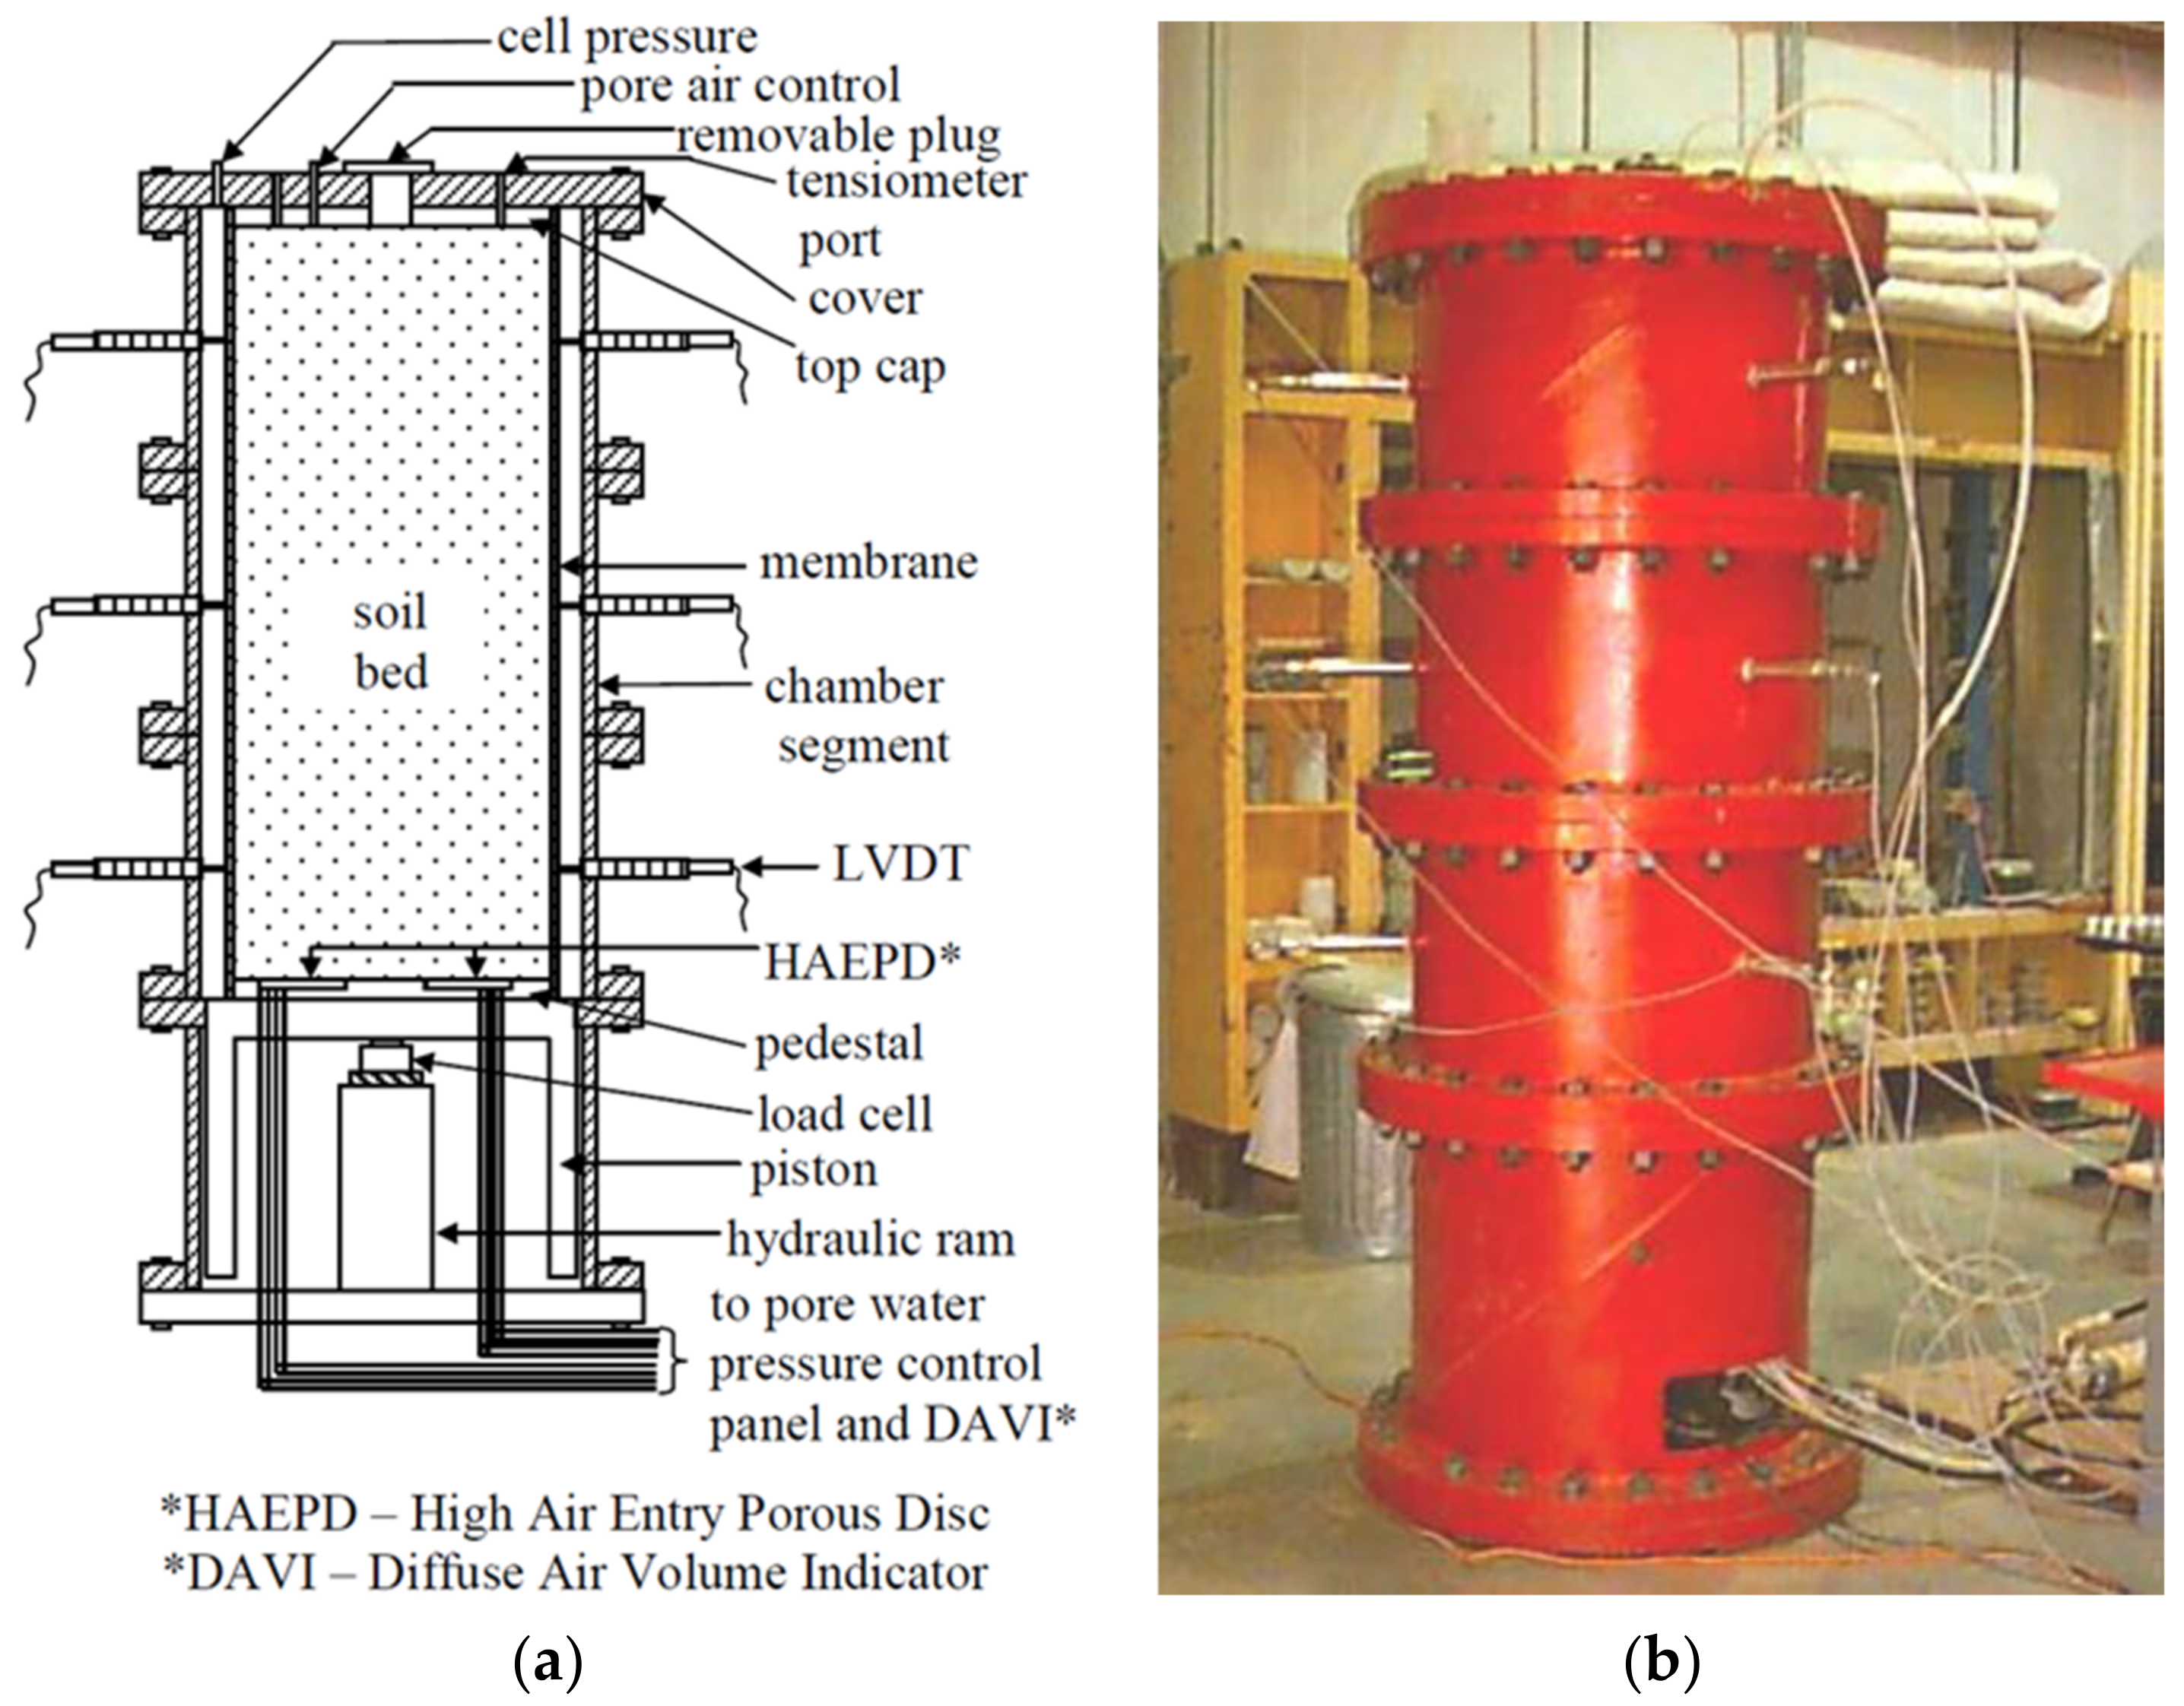
Development of the calibration laboratory model tank test
In the 1960s, laboratory calibration tanks were first introduced as a common method of laboratory calibration testing. Common calibration canisters include the CRB calibration canister system, the flexible single wall system, and the clay soil calibration canister system. A summary of information and detailed statistics on current calibration tank systems is provided in Table 3 [55].
Ghionna and Jamiolkowski (1991) carried out a laboratory calibration test of an in situ penetration device using the rigid wall test pit method [56]. In this method, a test pit of the required size is dug into the ground, and a test soil sample is inserted for the CPT penetration test. This test was less effective due to the test pit boundary effect.
The flexible wall calibration tank system was developed in Australia in the 1960s to investigate in situ standard penetration tests through laboratory calibration tank tests. Holden (1976) collaborated with the Victorian Roads Board Materials Research Institute (CRB) in Melbourne to propose the CRB calibration system (flexible double-walled), and in 1969, designed and built a flexible double-walled model calibration tank, as illustrated in Figure 16 [57,58]. The design theory of this calibration tank system was more mature, and many later improvements based on this type of tank appeared, collectively referred to as CRB calibration tanks. In addition, there is a calibration tank of the University of Oklahoma Calibration, as shown in Figure 17.
The CRB flexible double-walled calibration tank has the disadvantage of being complex to operate and to produce soil samples; thus, Villet and Mitchell (1981) designed a flexible single-walled calibration tank that is simple to equip and easy to operate [59]. In 2010, a new flexible single-walled calibration tank device was designed for unsaturated soils at the University of New South Wales, Australia (shown in Figure 16b) [60]. By connecting the soil sample hoop plate inside the single wall to the outer steel wall, this design simplifies both the preparation of soil samples and the control of several boundary conditions.
Figure 17. The University of Oklahoma calibration chamber. (a) Schematic diagram of the University of Oklahoma calibration chamber; (b) picture of University of Oklahoma calibration chamber [61].
Jmse 11 01160 g017
2.
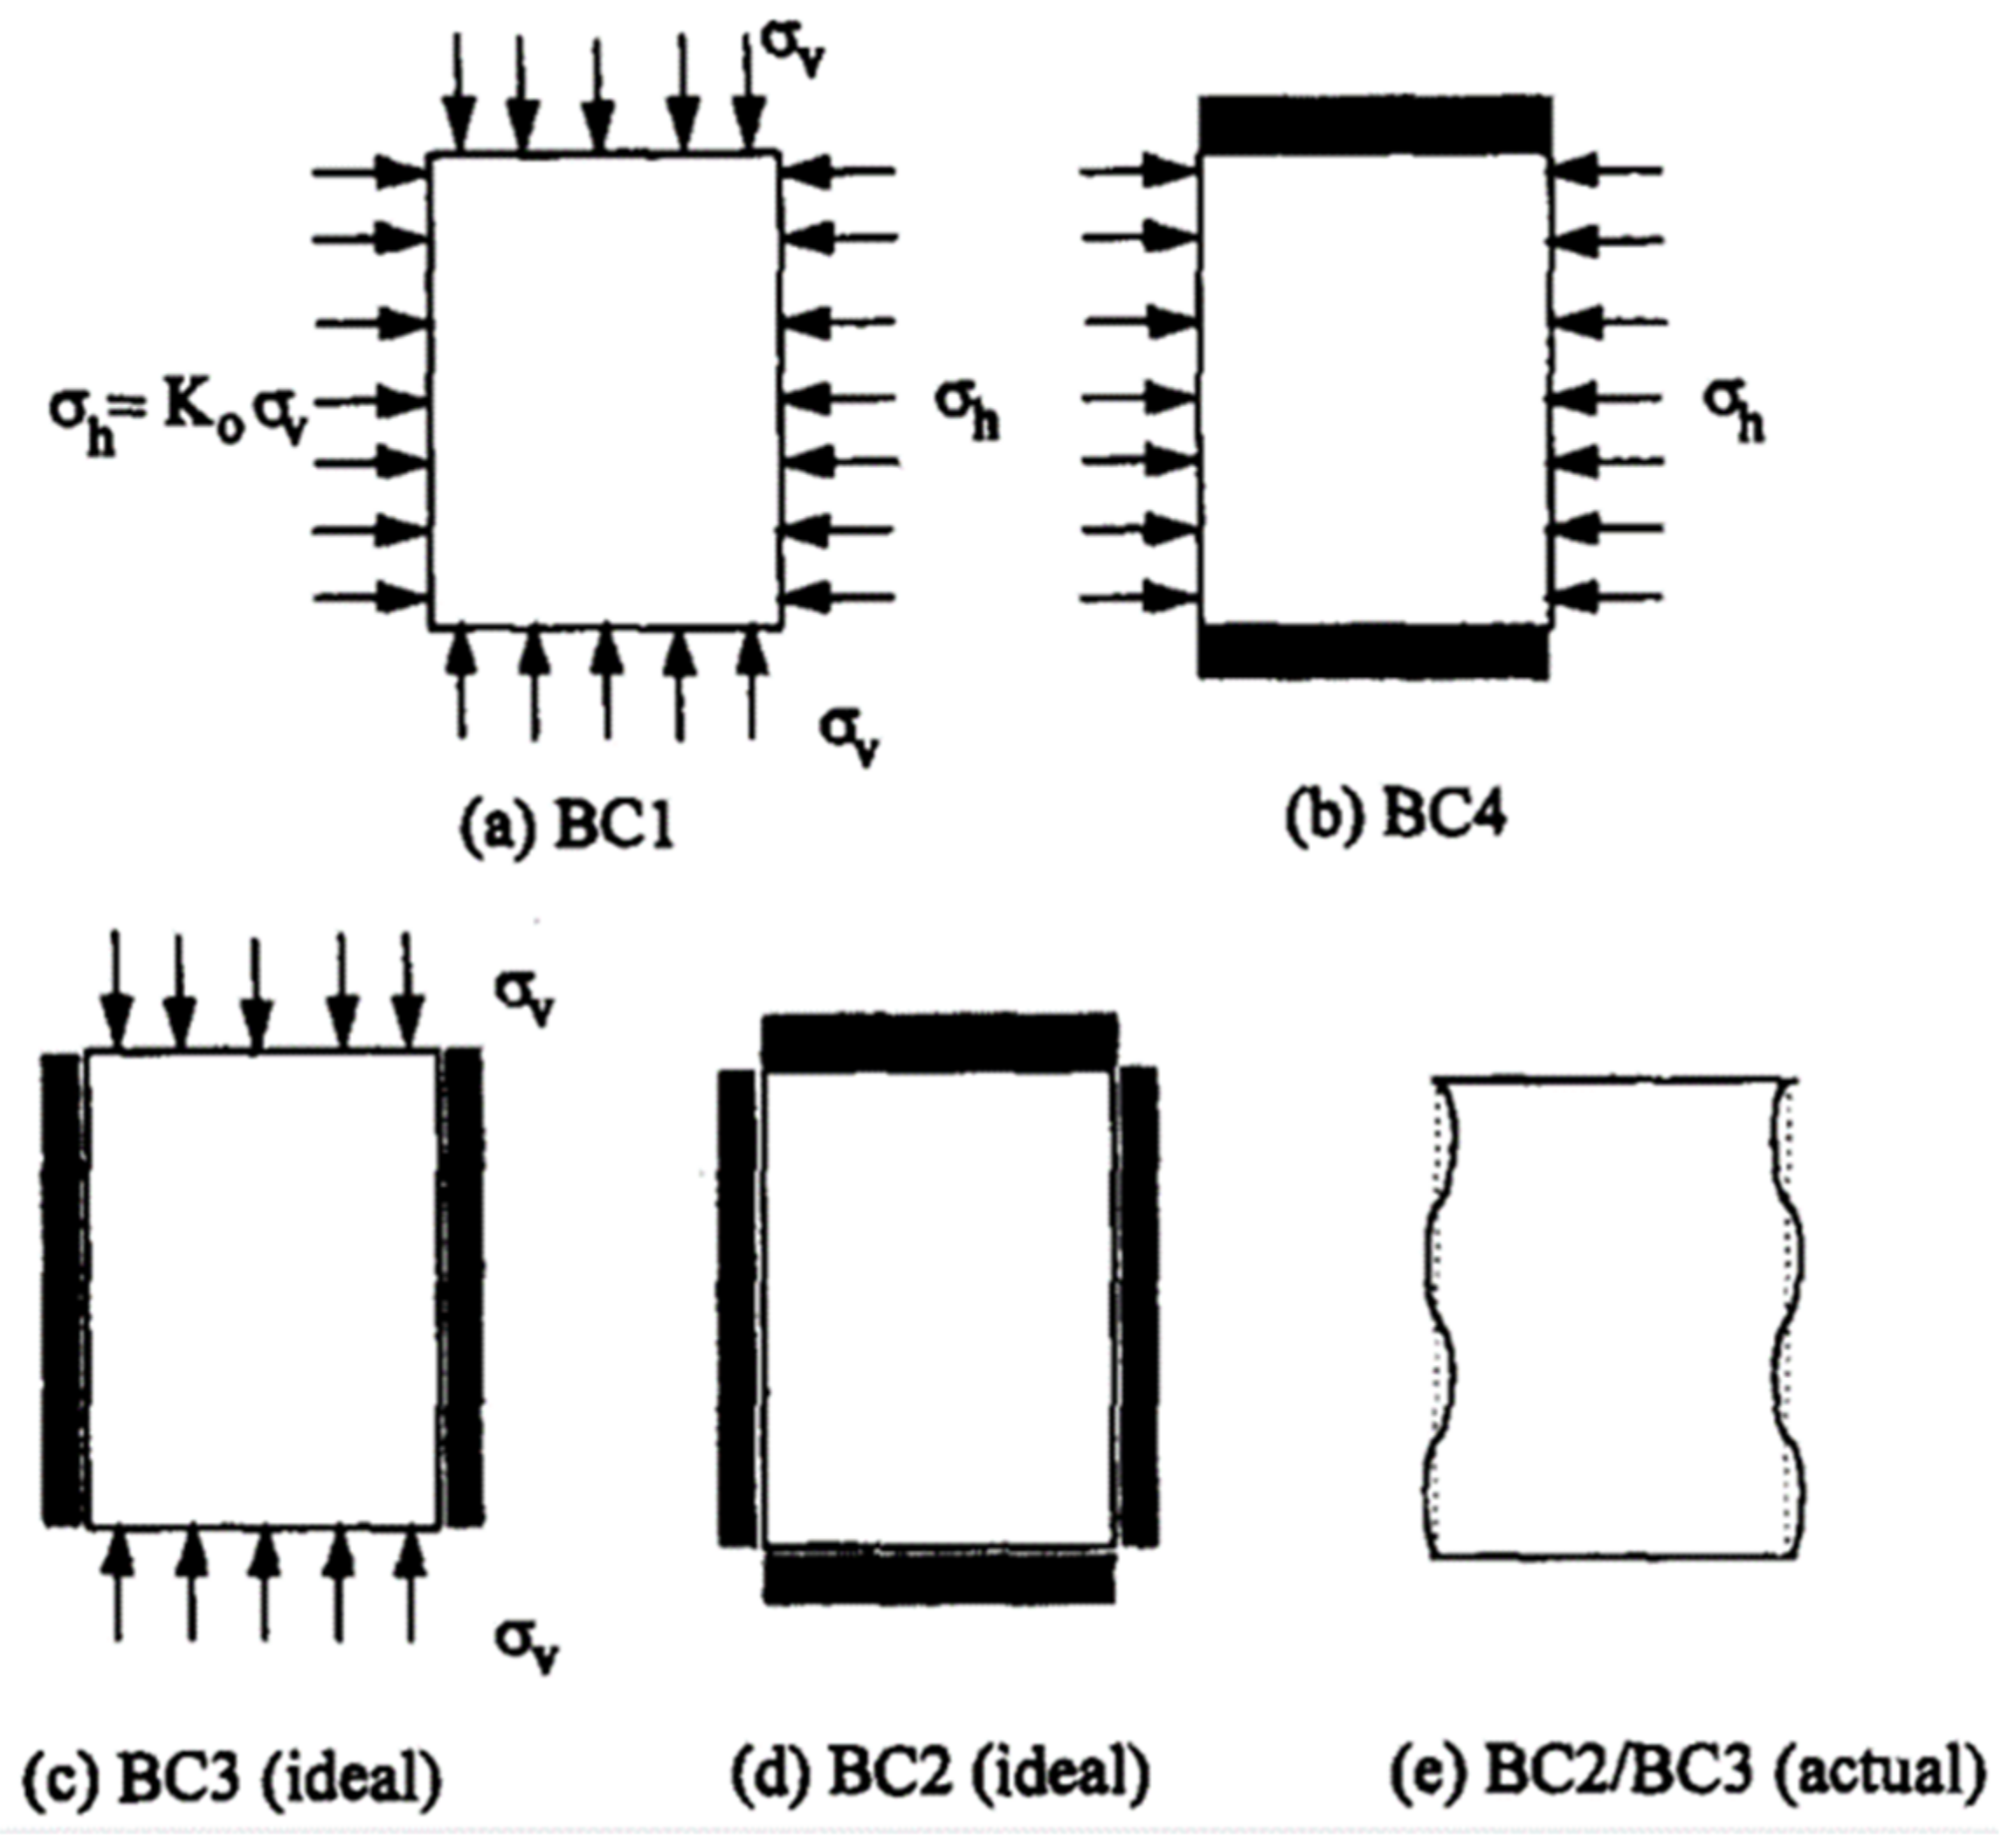
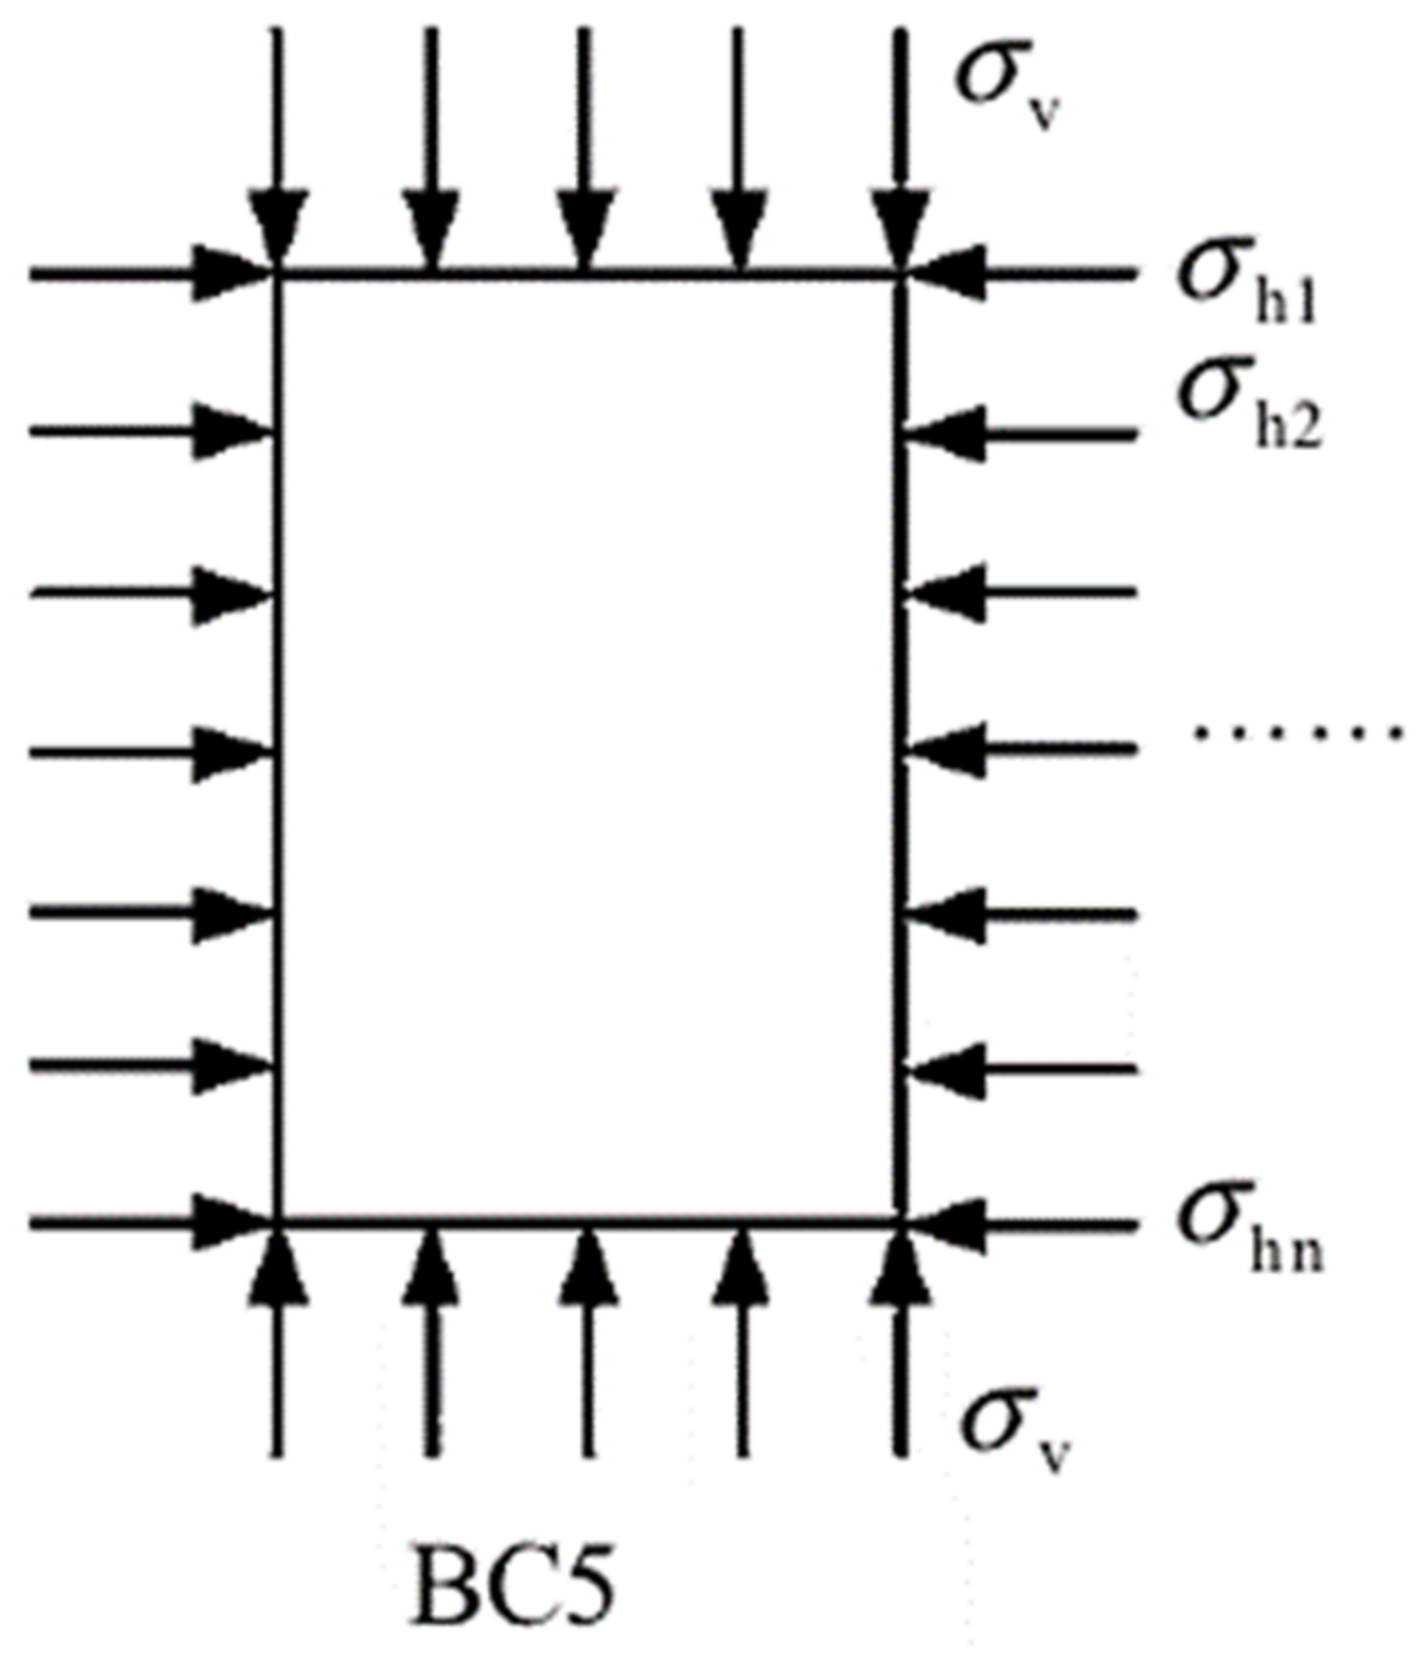
Boundary state control for calibration tank tests
The flexible wall calibration tank calibration test can be controlled separately for horizontal and vertical boundary conditions, including stress control and strain control. Holden (1976) defined four different boundary control states (shown in Table 4 and Figure 18) [57]. The four states correspond to, respectively, state BC1: horizontal vertical with stress control; state BC2: horizontal vertical with strain control; state BC3: horizontal direction stress control, vertical direction strain control; and state BC4: horizontal direction strain control, vertical direction stress control. Figure 18 depicts a flexible double-wall calibration tank that uses water pressure for stress control in the horizontal direction of the soil sample. Huang (2005) defines a new type of boundary state, called the BC5 state. A schematic diagram of the boundary state and a diagram of the calibration tank setup are illustrated in Figure 19 [62]. In the diagram, σv is the axial stress, and σh1~σhn are the transverse stresses, i.e., the force states in the horizontal direction at different locations of the soil sample, which can be controlled.
3.
Factors influencing the calibration tank test
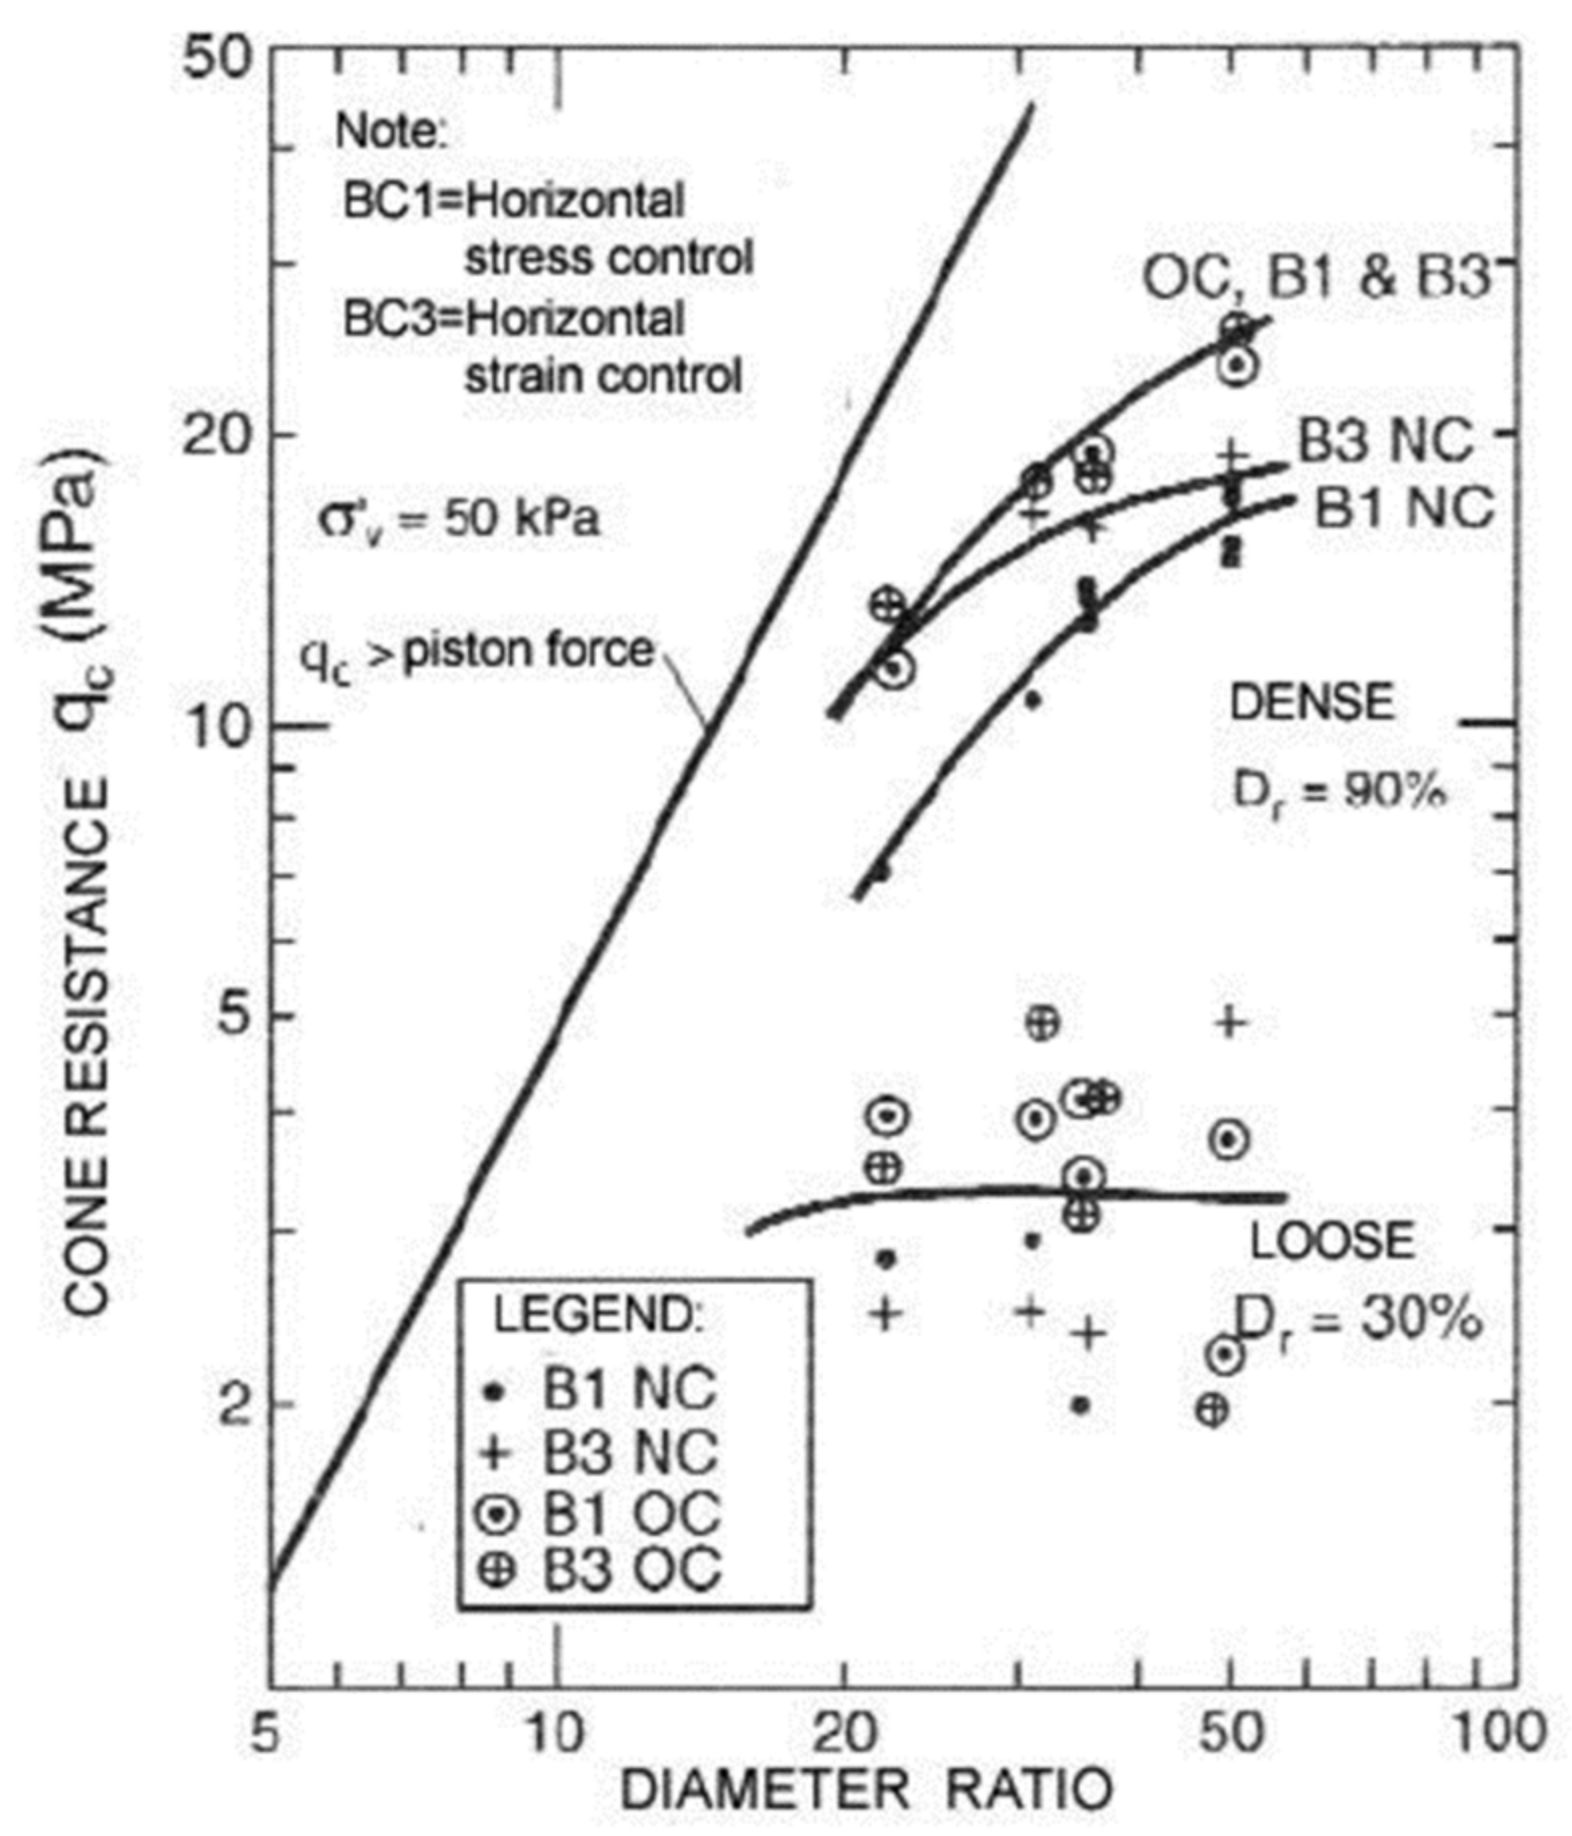
The calibration tank penetration test is an in situ simulation of the in situ site conducted laboratory. Due to the constraints of the soil sample size and the stress state, it does not fully replicate the in situ site conditions, and the data are somewhat different from the in situ test. According to the studies, the influence of the laboratory calibration tank tests is mainly due to boundary conditions and dimensional effects.
  • Boundary effects
Parkin and Lunne (1982) investigated the effect of the boundary conditions on the calibrated tank tests at the BC1 and BC3 boundary states [63]. By conducting calibrated tank tests with two different sizes of cones, the effect of the varying boundary conditions and different diameter ratios on the measured cone tip resistance was investigated. The effects of the boundary conditions and size on the resistance of the cone tip is shown in Figure 20.
The diameter ratios were investigated by Salgado and Mitchell (1997) using the theory of penetration resistance and controlling the corresponding boundary conditions, soil sample density, and stress state [64]. The study indicates that the measured cone tip resistance is less than the in situ measured value for the BC1 and BC4 boundary conditions. This is due to the attenuated nature of the gain in peritectic pressure compared to the in situ boundary states BC1 and BC4.
  • Size effect
Calibrated tank tests on the effect of diameter ratios were carried out by related scholars to derive the effect of diameter ratios on sandy soils [64].
Schnaid and Houlsby (1991) investigated the effect of soil properties on the cone tip resistance by conducting calibration tank tests utilizing three different sizes of cone pressuremeter (corresponding to diameter ratios of 38, 27, and 22) [65]. For dense and medium dense sand, the measured speciated ultimate stresses increased dramatically with the increasing diameter ratios; however, for loose sand, there was no significant effect on the size of the calibration tank.
The theoretical analyses of the causes of dimensional effects on calibration tank tests were focused on two statements. The first statement is by Salgado et al. (1997), who analyzed and explained the dimensional effects of the calibrated tank test using the theory of pore wall expansion [64]. As the penetration pressure gradually grew, the isotropic pressure withstood also gradually increased, and a plastic zone appeared around the pore with a non-linear elastic zone and a linear elastic zone at the periphery (as shown in Figure 19). The second statement, by Wesley (2002), proposes that the change in the vertical stress with cone penetration in the CPT may lead to a decrease in the cone tip resistance as the size of the calibrated tank can decrease [66].

3.4. In Situ Test

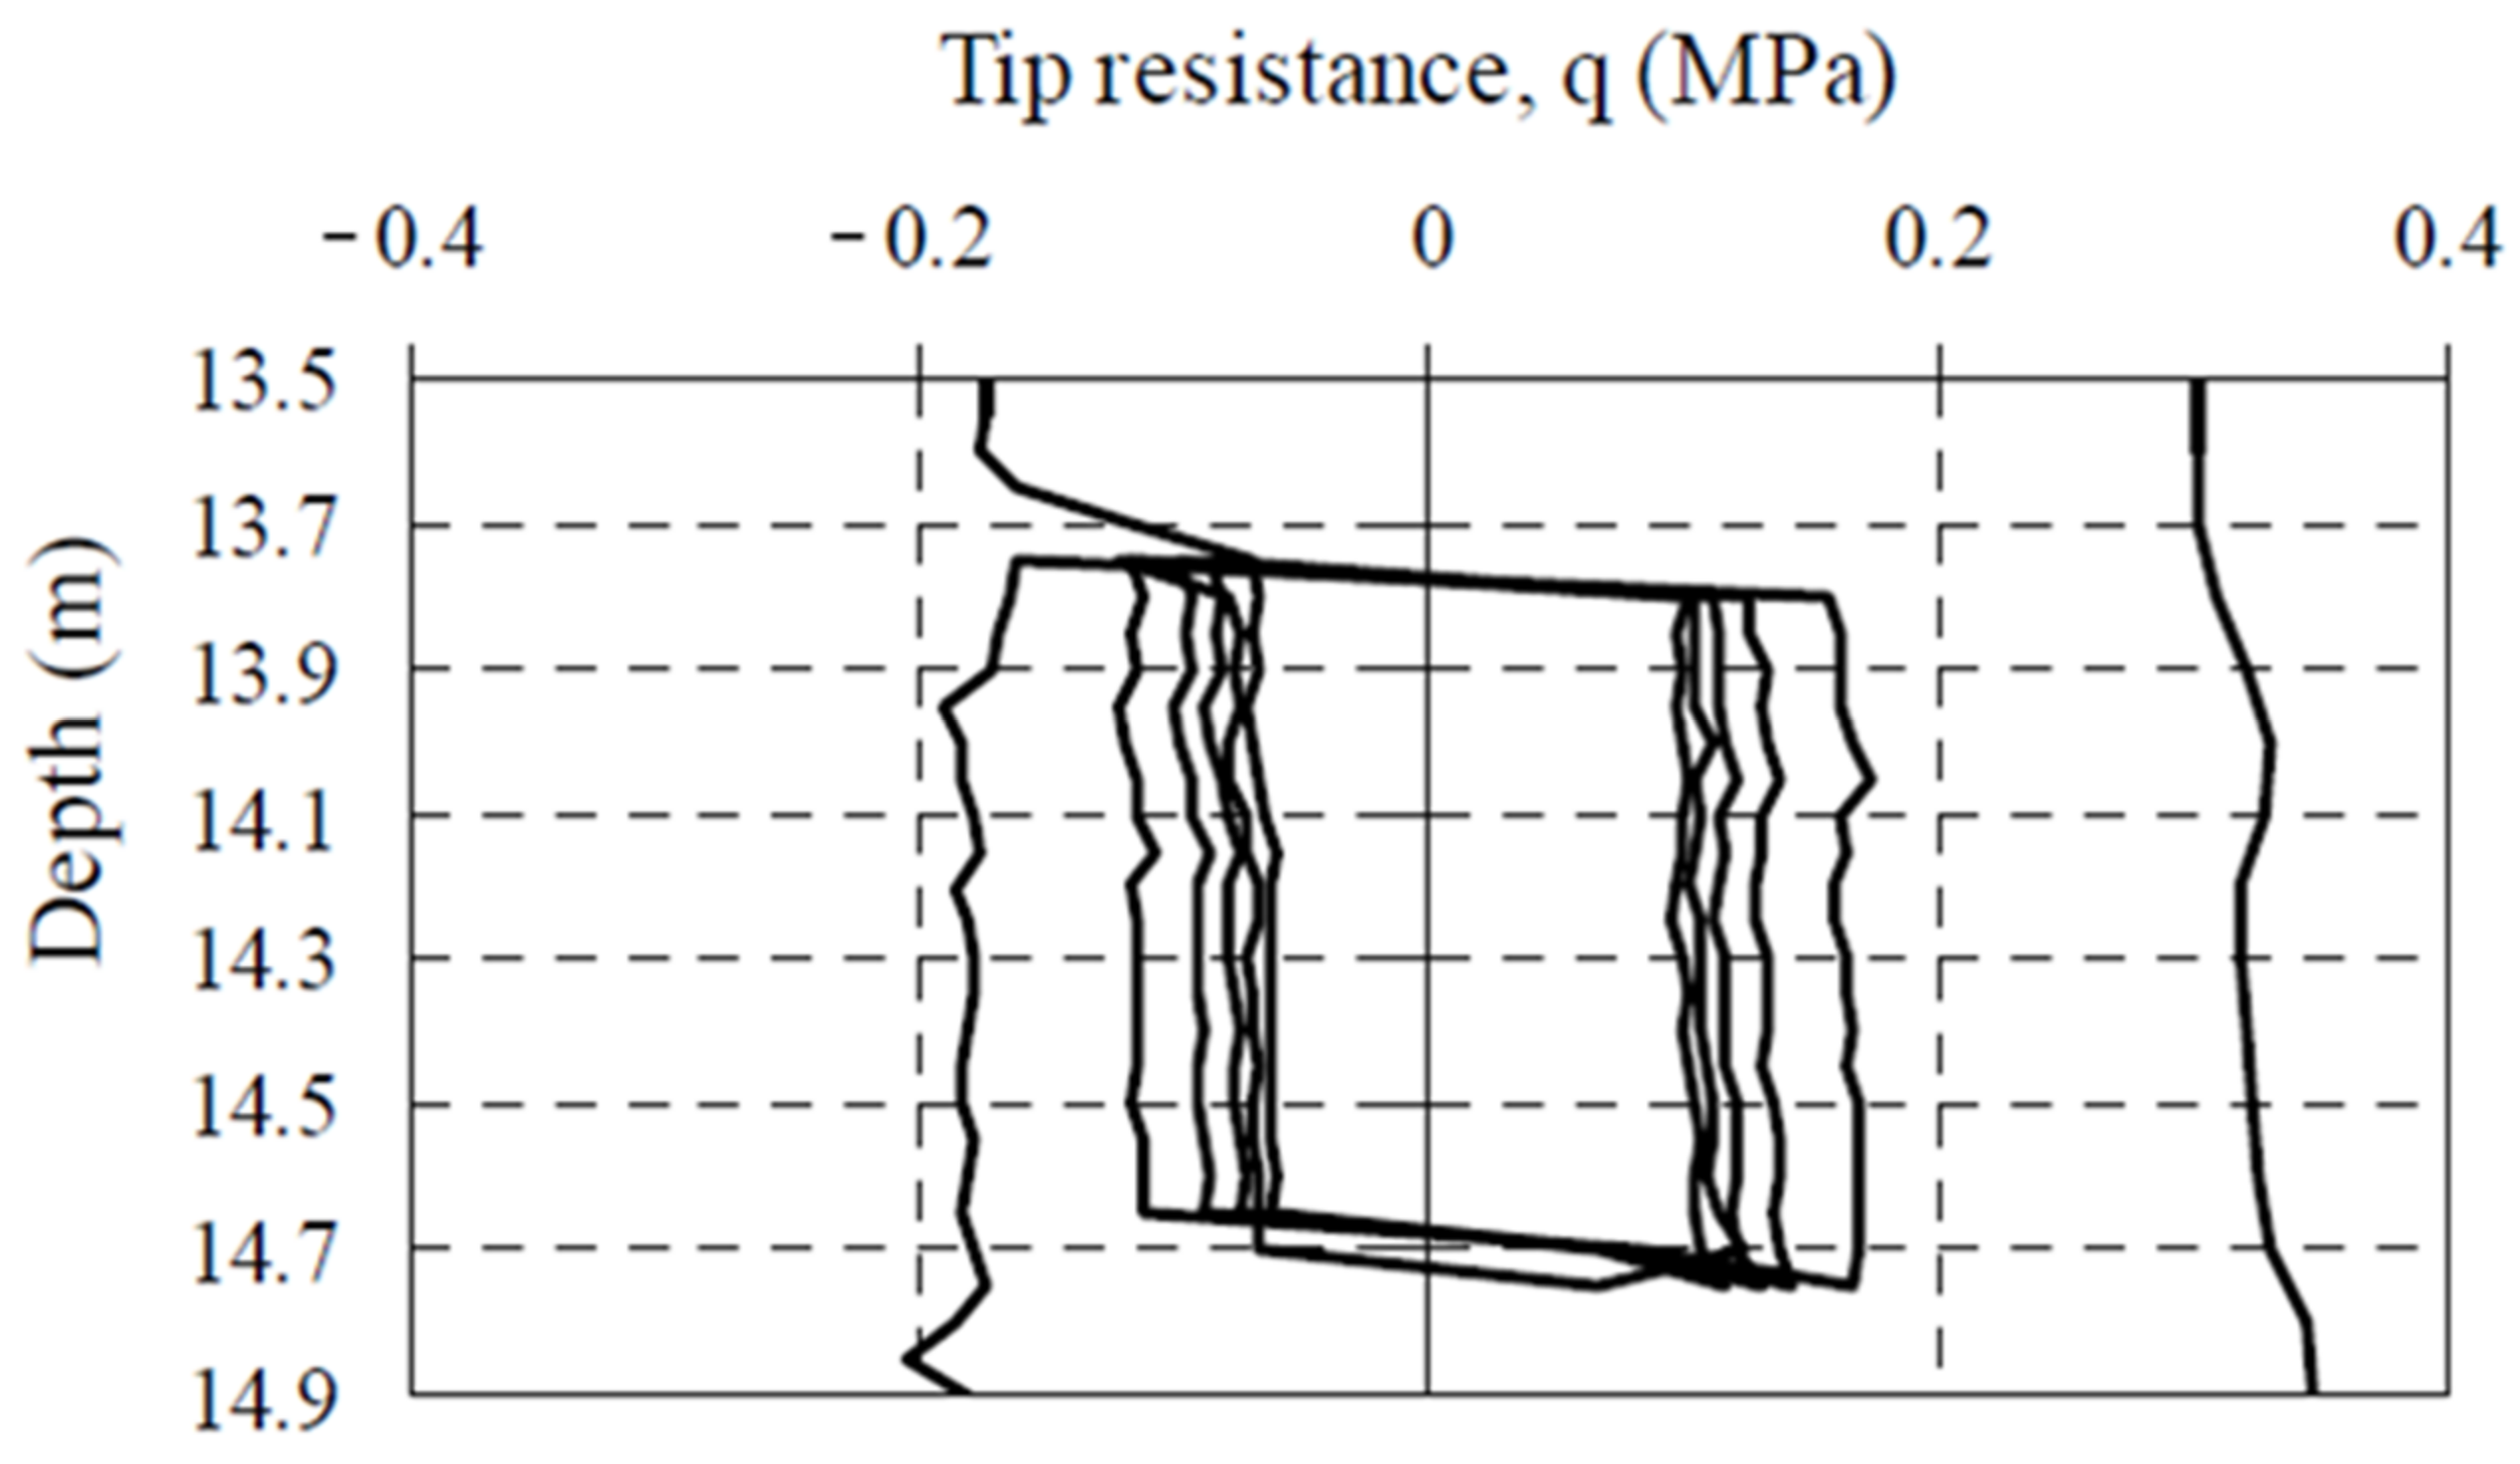
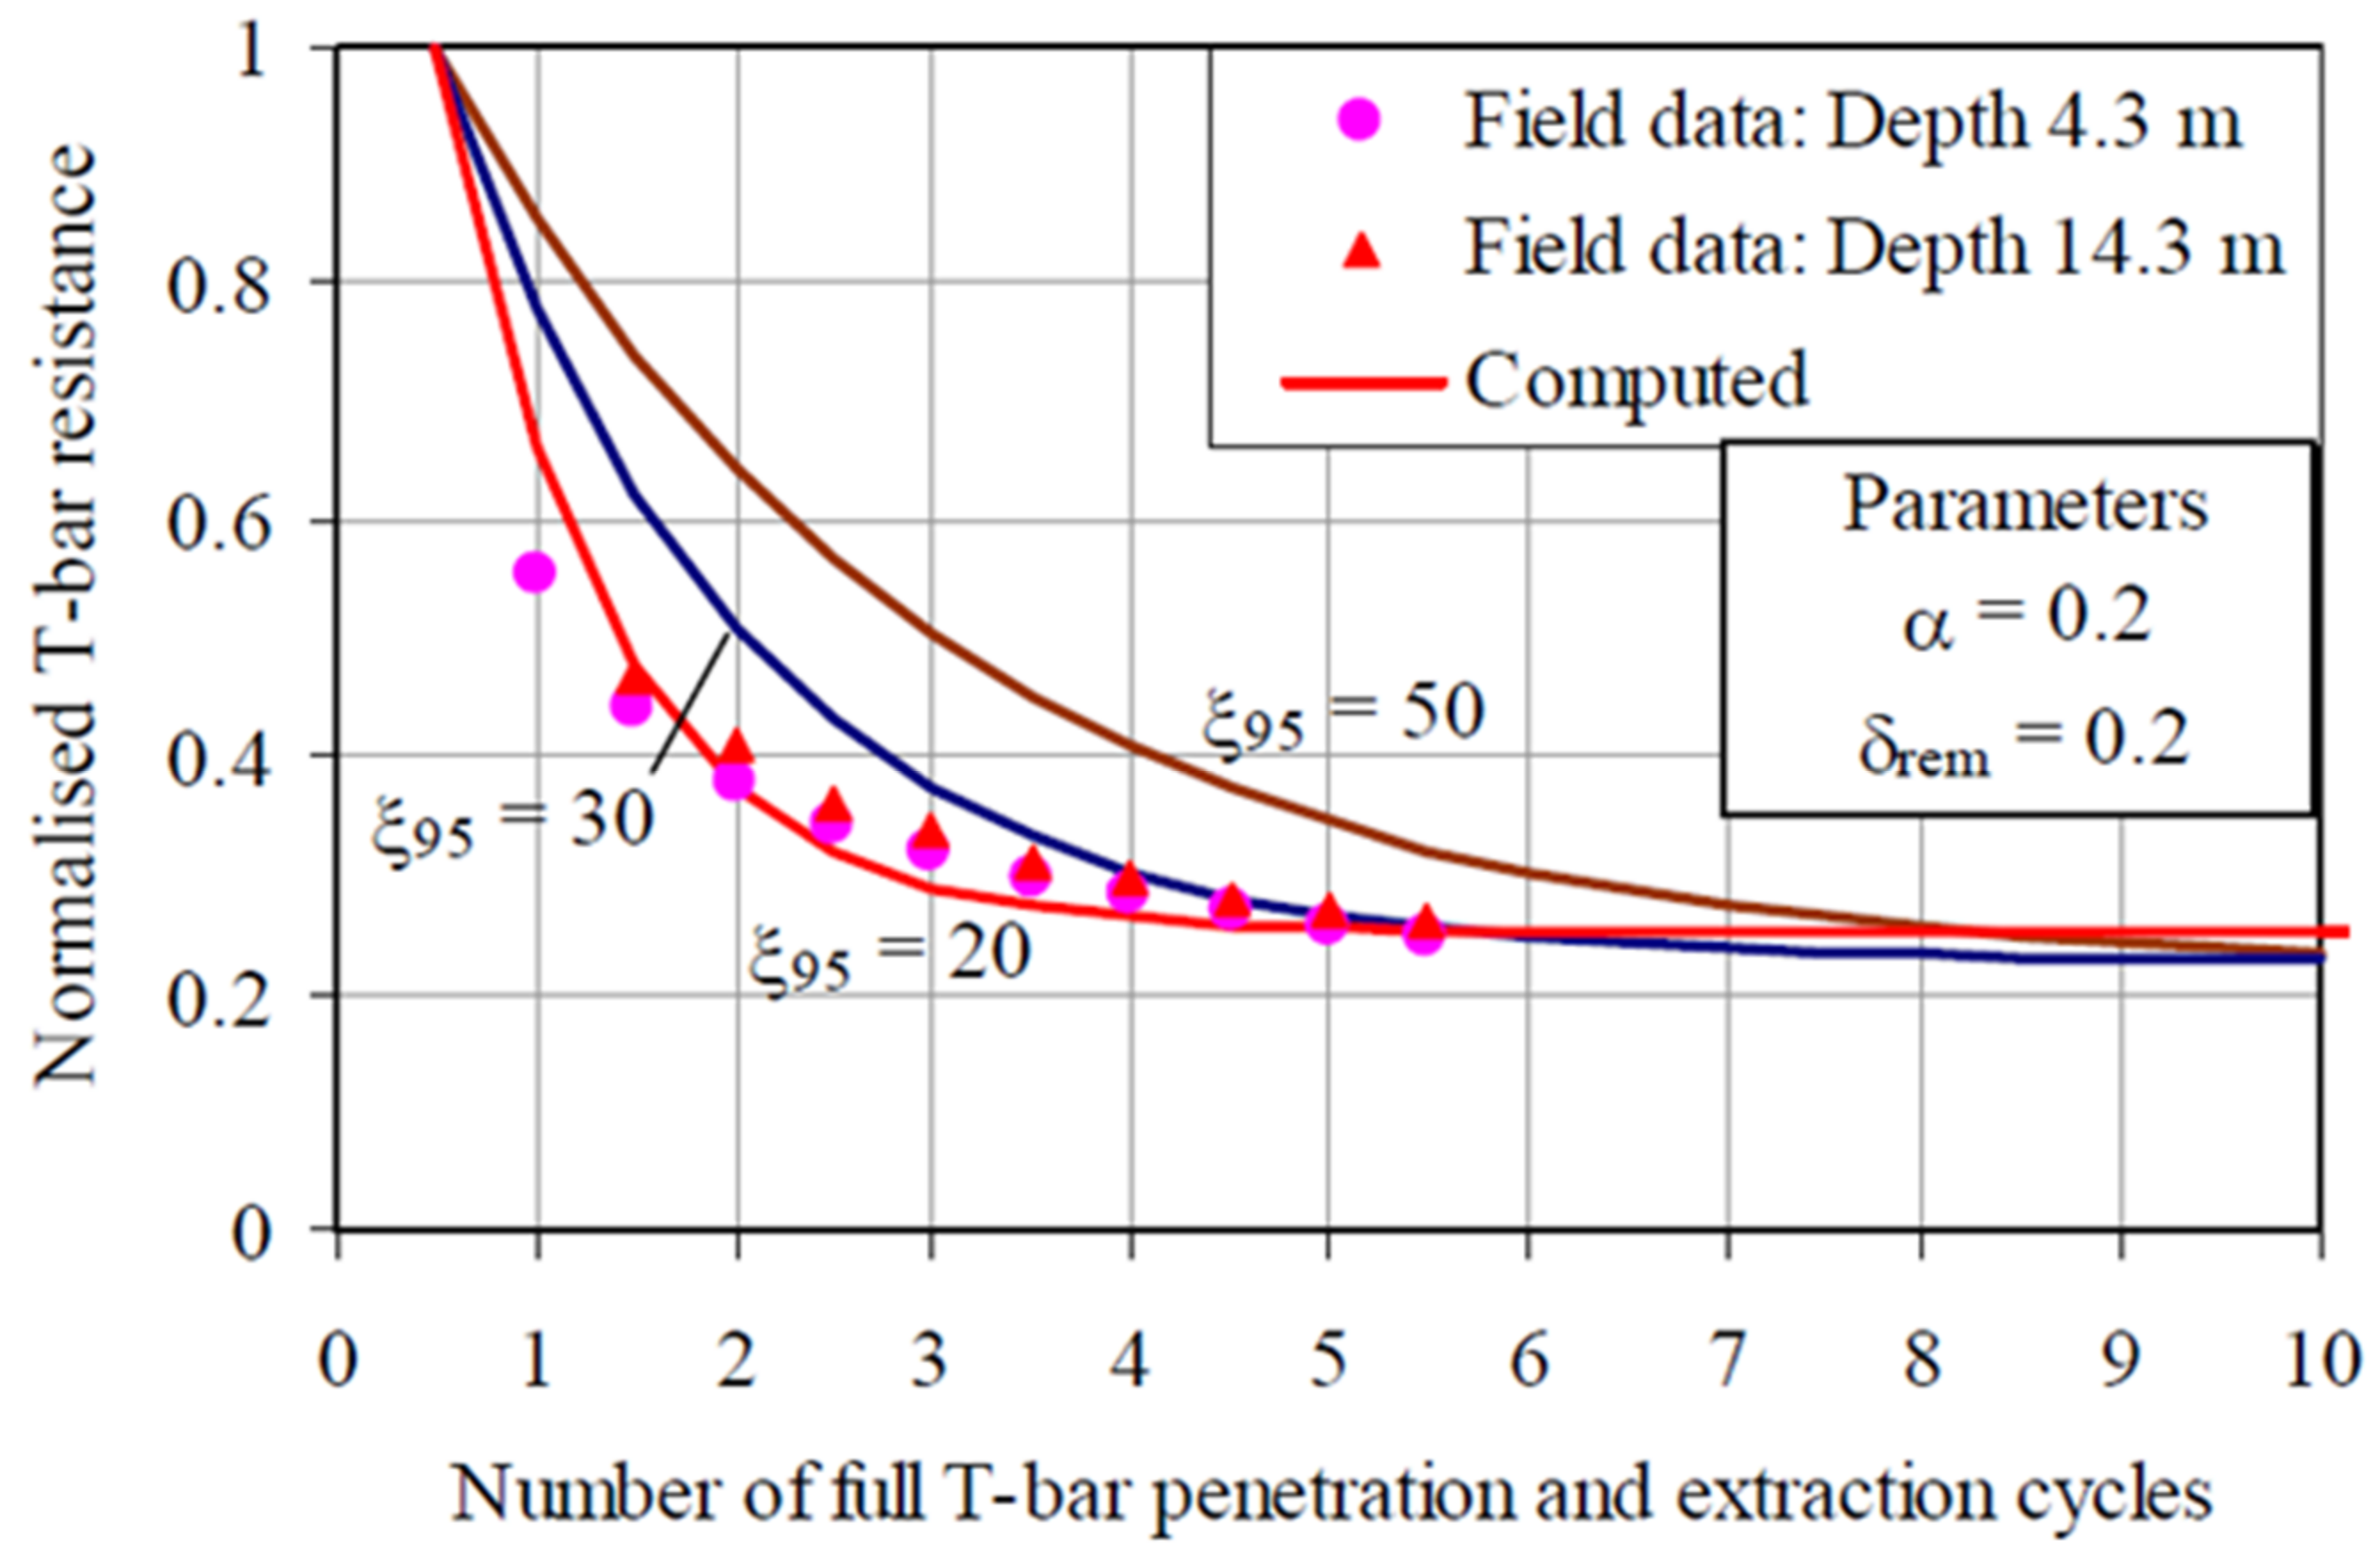
3.4.1. Cyclic Penetration Tests

The T-bar penetrometer tests also measure the resistance during extraction as well as during penetration. The penetration and extraction processes are repeated over a range of depths, and the resistance values are recorded. As the cycle testing continues, the soft soil becomes progressively more disturbed, and its strength gradually diminishes and stabilizes at a certain value after approximately 10 cycles. At this point, the soft soil is considered completely remodeled, and the experiment is completed. Einav and Randolph (2005) employed the cyclic penetration test method to obtain the strength decay curve for the cyclic penetration test data obtained from the T-bar penetrometer, as shown in Figure 21 [49].
As the cycle progresses, the su of the soft soil gradually decreases; as reflected in the result, the penetration resistance gradually drops and stabilizes. A graph of the decay of the penetration resistance with the increasing number of penetrations can be made as depicted in Figure 22; the calculated curve and the measured data are compared and analyzed, and on this basis, the parameters δrem and ξ95 are used to calibrate [49]. After one lifting cycle, the undrained shear strength of the soft soil produces a decrease of approximately 10%, and generally, after a process of 10 cycles, the soft soil reaches a fully remodeled state, and the undrained shear strength is stabilized. In the derivation of the cyclic resistance, the penetration resistance is normalized by the initial resistance for each cycle. As the soil begins to soften during the first penetration, the final normalized resistance is typically greater than the true value of δrem.
The findings of the cyclic tests can be utilized to calculate the in situ undrained shear strength and the remolded undrained shear strength of soft soils under the initial and final penetration, as well as to assess the sensitivity of the soft soil.

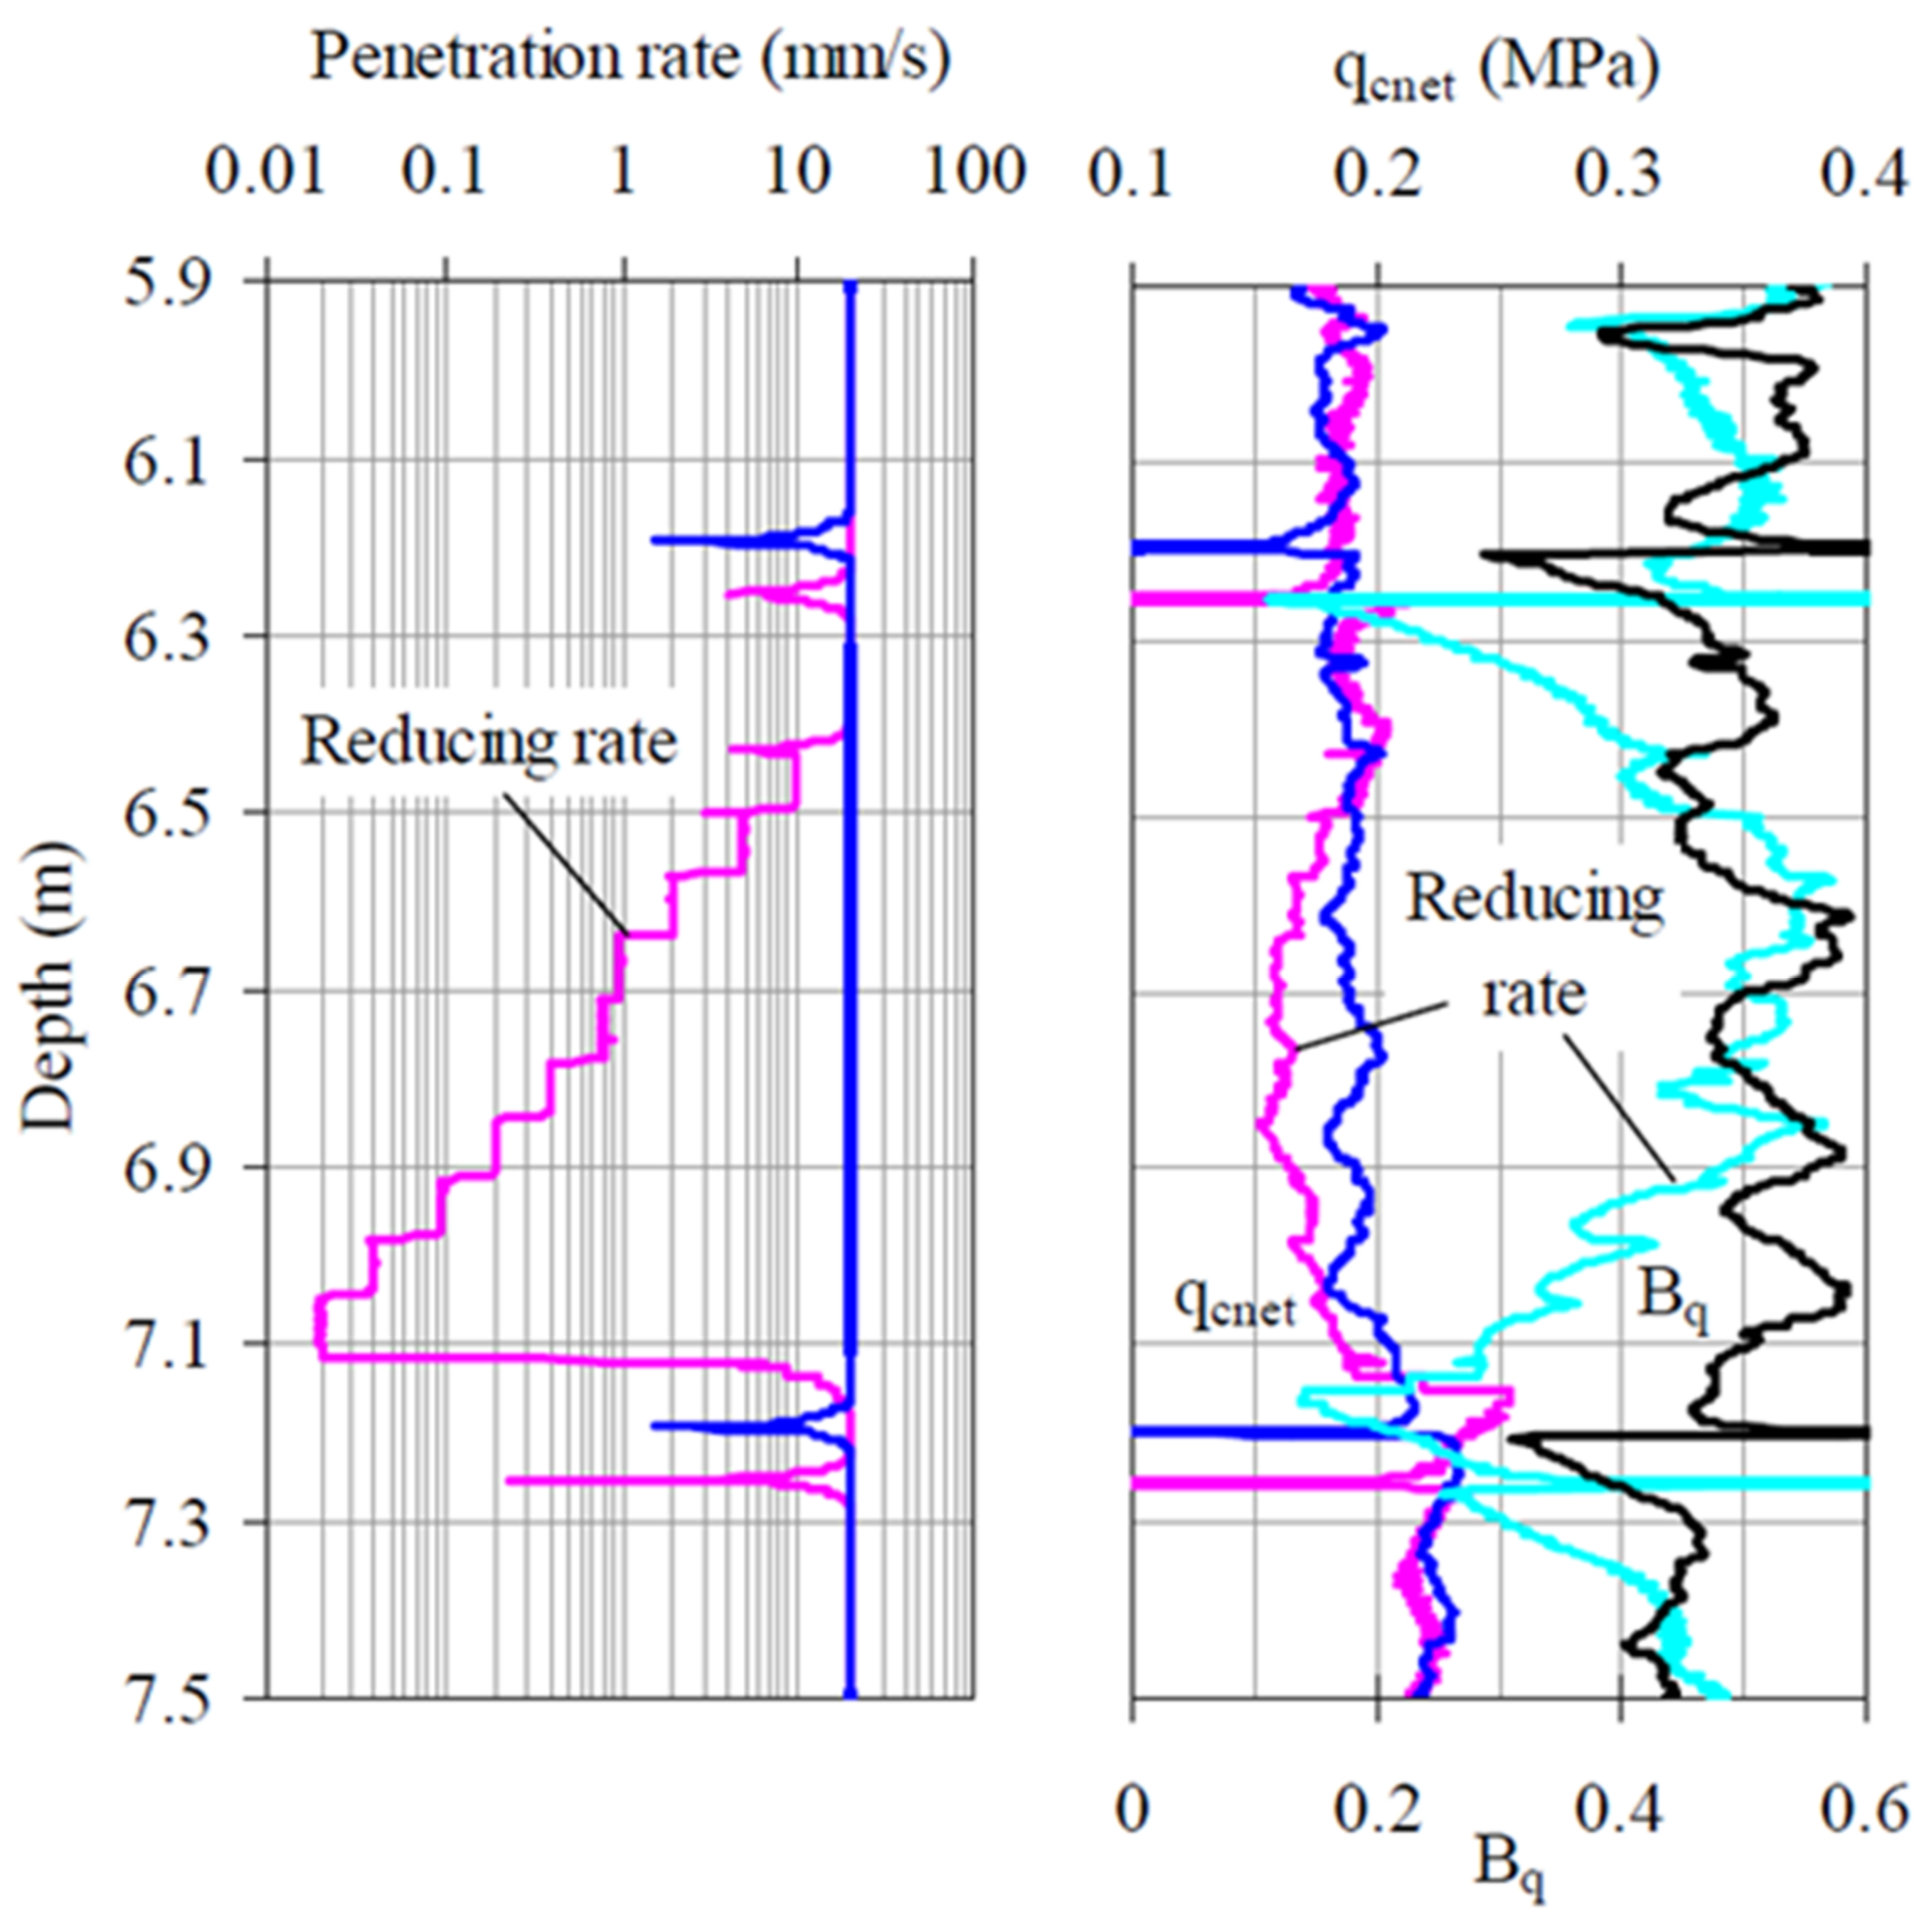
3.4.2. Variable Rate Penetration Experiments

Chung et al. (2006) studied shear strength under both drained and undrained loading paths, and the concerning penetration rate noted that the drainage conditions at which the penetration rate affects the shear deformation have a substantial effect on the penetration test result [37]. House et al. (2006) and Randolph (2004) studied the exact relationship between the two loading paths through variable rate penetration tests, as shown in Figure 23 [18,67]. The tests were carried out at a discontinuous logarithmic decrease in the penetration rate, with an initial rate of 20 mm/s.
At the beginning of the penetration test, the penetration rate is high, and the soft soil is in undrained conditions. As the penetration rate is gradually reduced, the penetration resistance decreases at the beginning as the cohesive effect diminishes, and as the penetration rate is reduced significantly, the penetration resistance increases significantly with the consolidation effect, until the surrounding soil reaches a state of complete consolidation. During this process, the penetration rate varies in the range of 2–3 orders of magnitude. The data satisfy Equation (8).
q q ref = a + b 1 + c V d 1 + μ ln ( 10 ) sinh 1 ( V / V 0 )
The normalized penetration rate V in the equation is defined as follows:
V = v d c v s u - cyc s u - mono
where v is the penetration rate, d is the diameter of the full-flow penetrometer, and cv is the vertical coefficient of consolidation for soft soils.
House proposes that the consolidation coefficient of the soil can be calculated using the normalized variable rate penetration test described above (House et al., 2001) [67]. As the normalized penetration rate reaches a final value (2–4) in 50% of the time required for a pore pressure dissipation test in the CPTU, this method can be used to minimize the test duration compared to the conventional CPTU method.
In the case of the T-bar, the flow mechanism of the soil around the penetrometer can be simulated as plane strain during penetration, and the T-bar is assumed to be an infinitely long cylinder. The simple geometries of the T-bar mean that the existing theoretical frameworks can account for the strain rate and strain softening. The numerical models of the soil flow during the T-bar penetration provide insight into the soil behavior and interpretation; however, experience with using theoretical solutions for the T-bar penetrometer remains limited. Therefore, it is necessary to combine the numerical models with specific experimental data.

4. Application of the T-Bar Penetrometer for Marine Soft Soil Engineering

In recent years, the development of marine engineering has accelerated, placing higher demands on the bearing capacity of soils for the design of marine geotechnical engineering, especially the effects of cyclic loading effects, and assessing the physical and mechanical properties of marine sediments has become a major challenge for the development of marine engineering. For marine soft soil engineering, in situ testing techniques using a full-flow penetrometer can effectively provide the required design parameters.
Dejong et al. (2011) concluded that during the penetration process of a full-flow penetrometer, the measured penetration resistance is the result of compressive and shearing forces acting on the penetrometer as the soil is forced to flow around the probe as it is advanced [68]. In comparison to a standard cone penetrometer, the influence of the overburden stress correction on the penetration resistance correction can be significantly reduced, hence, effectively reducing the influence of the correction process on the test reliability.

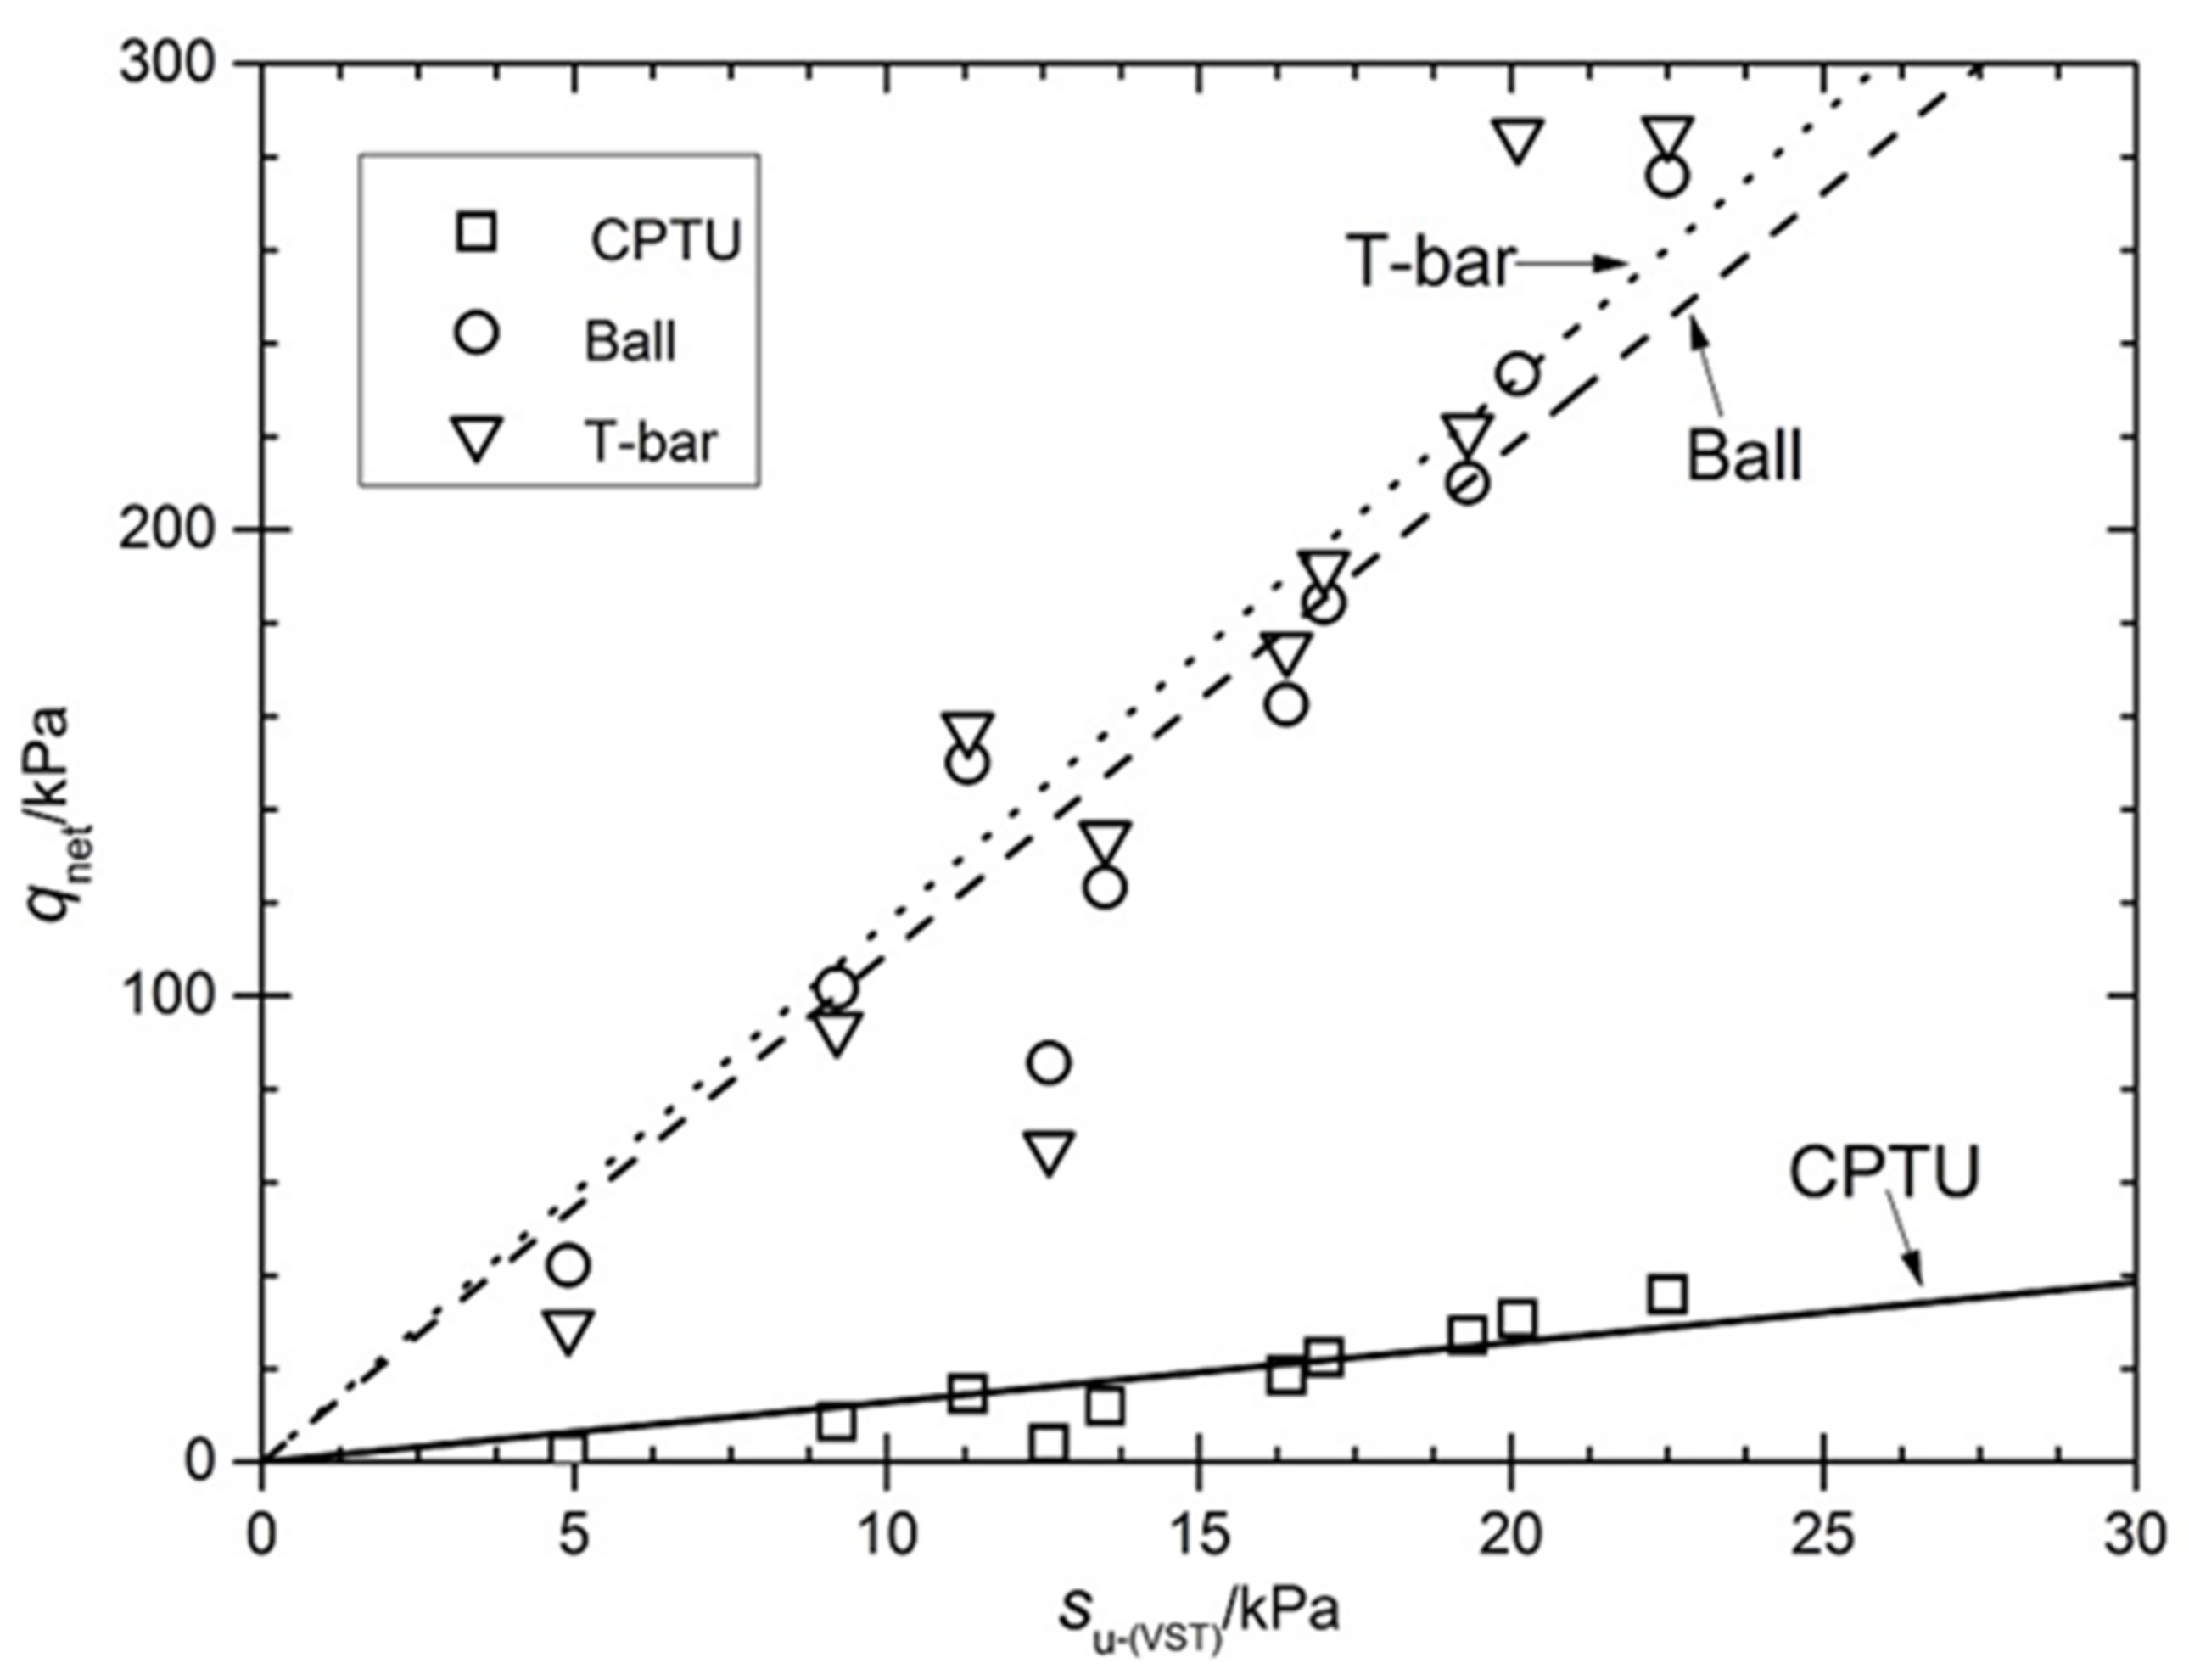
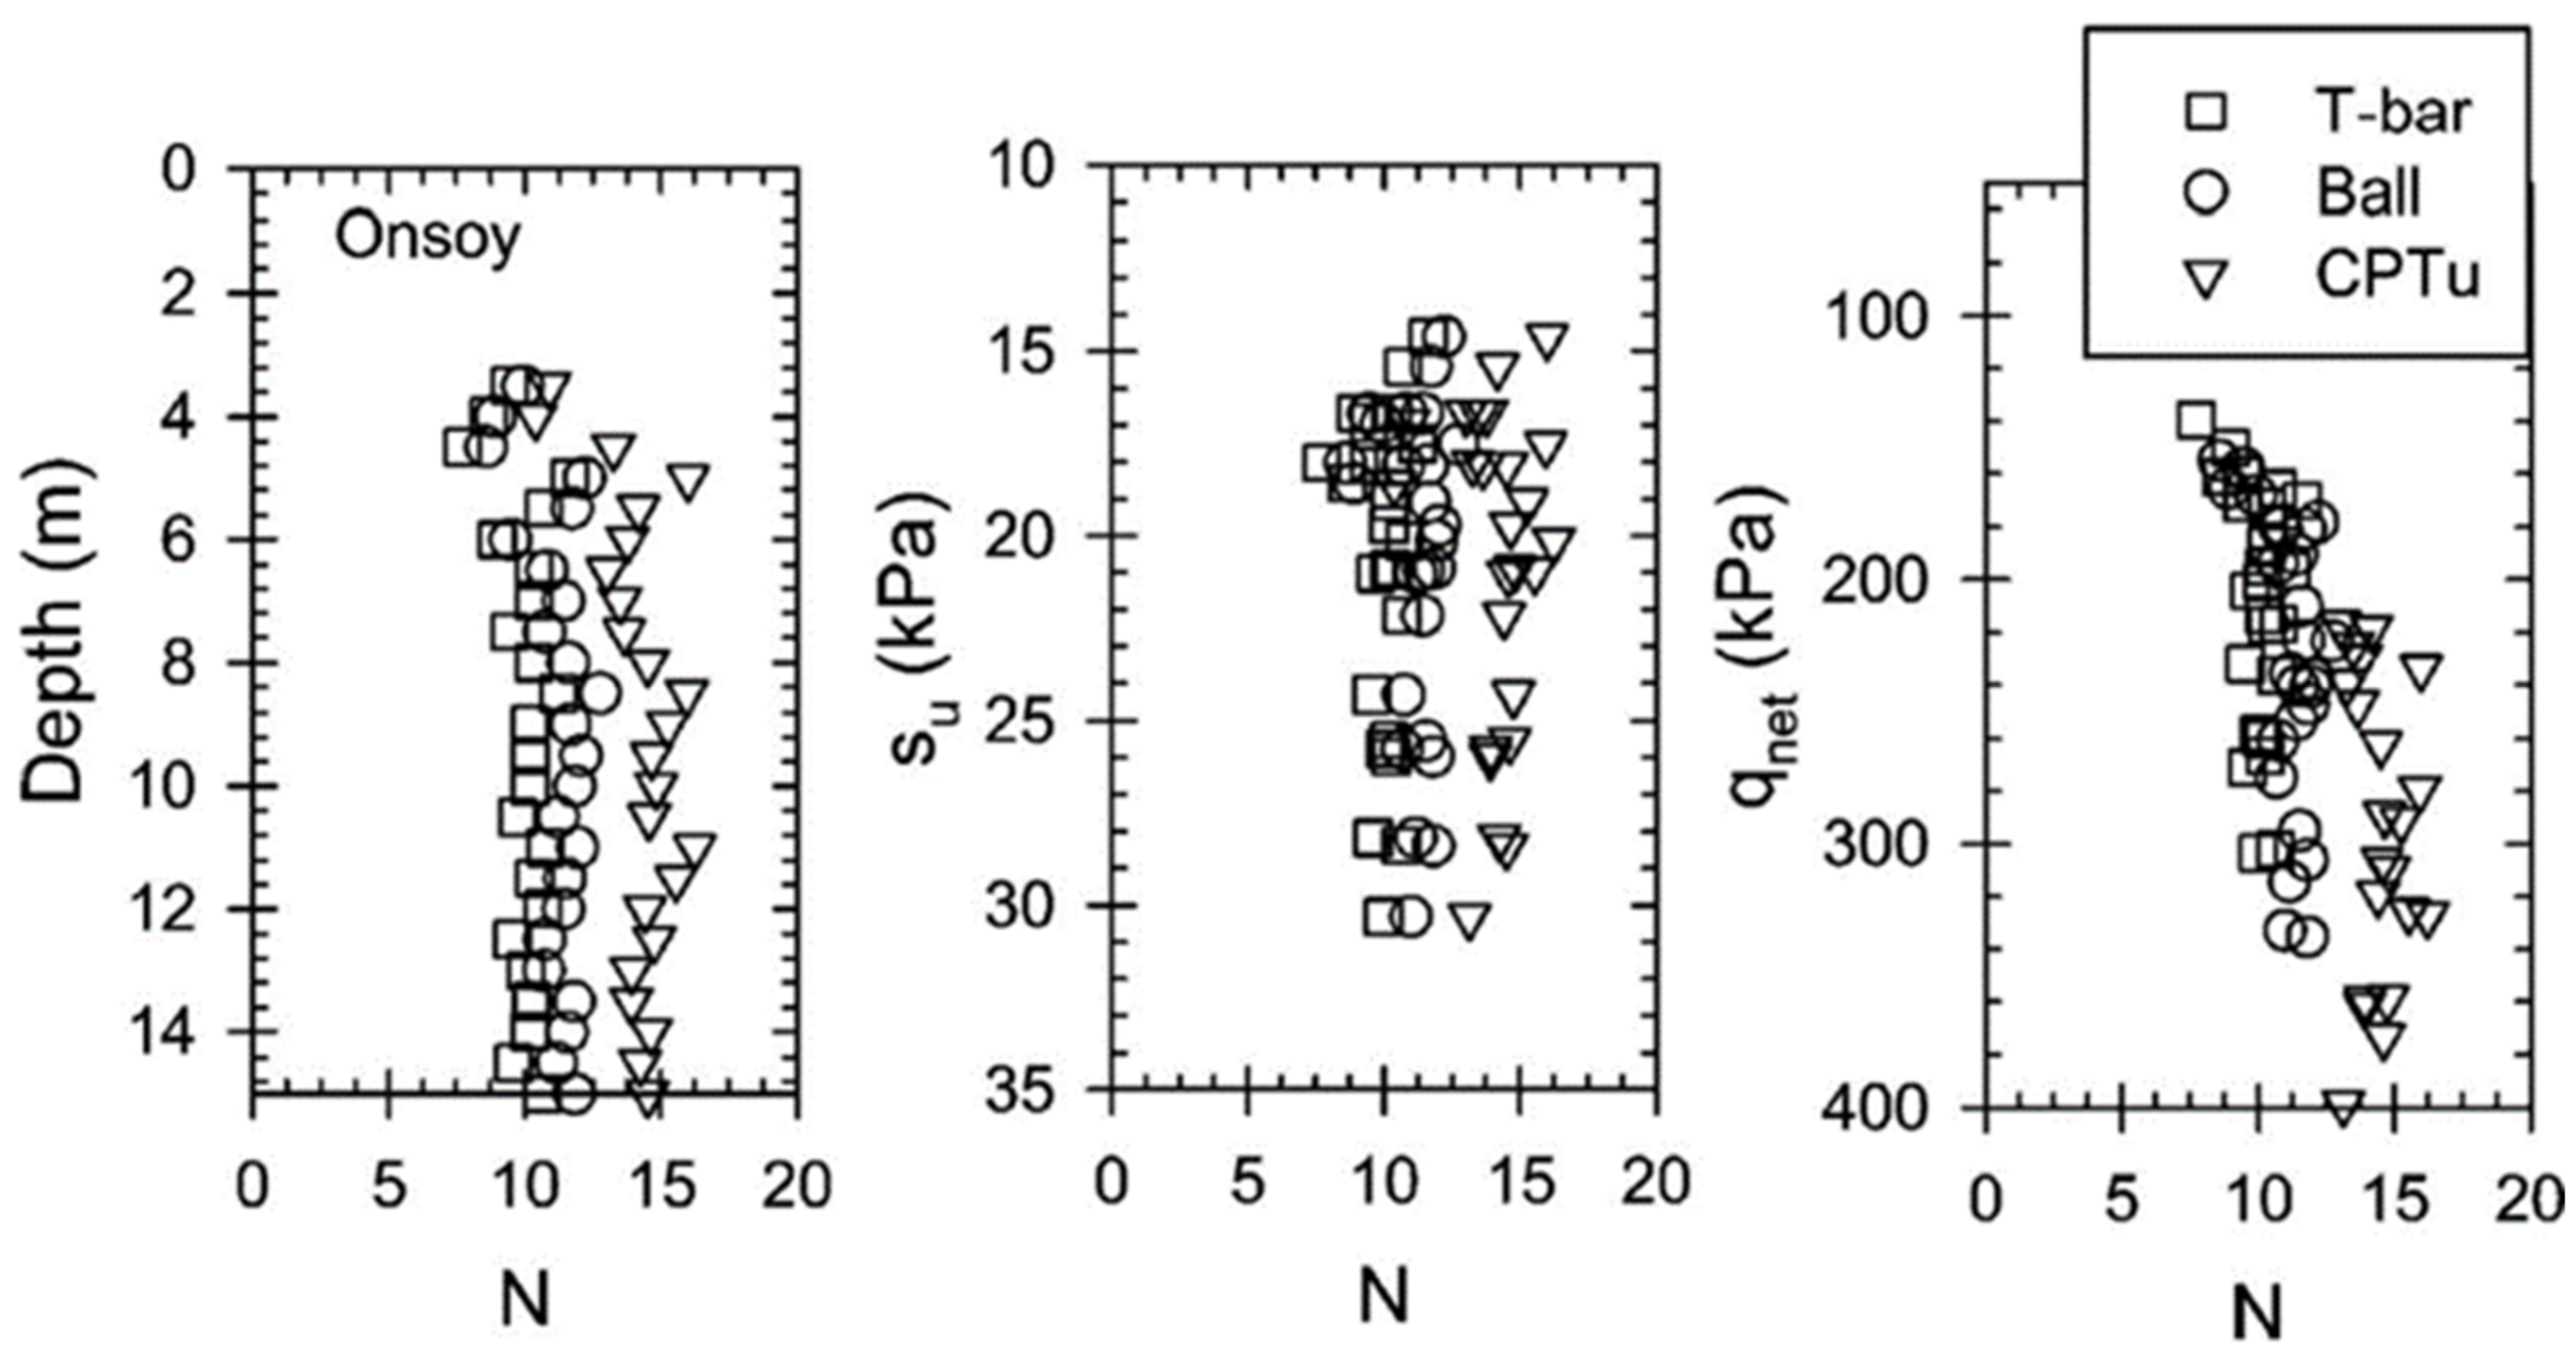
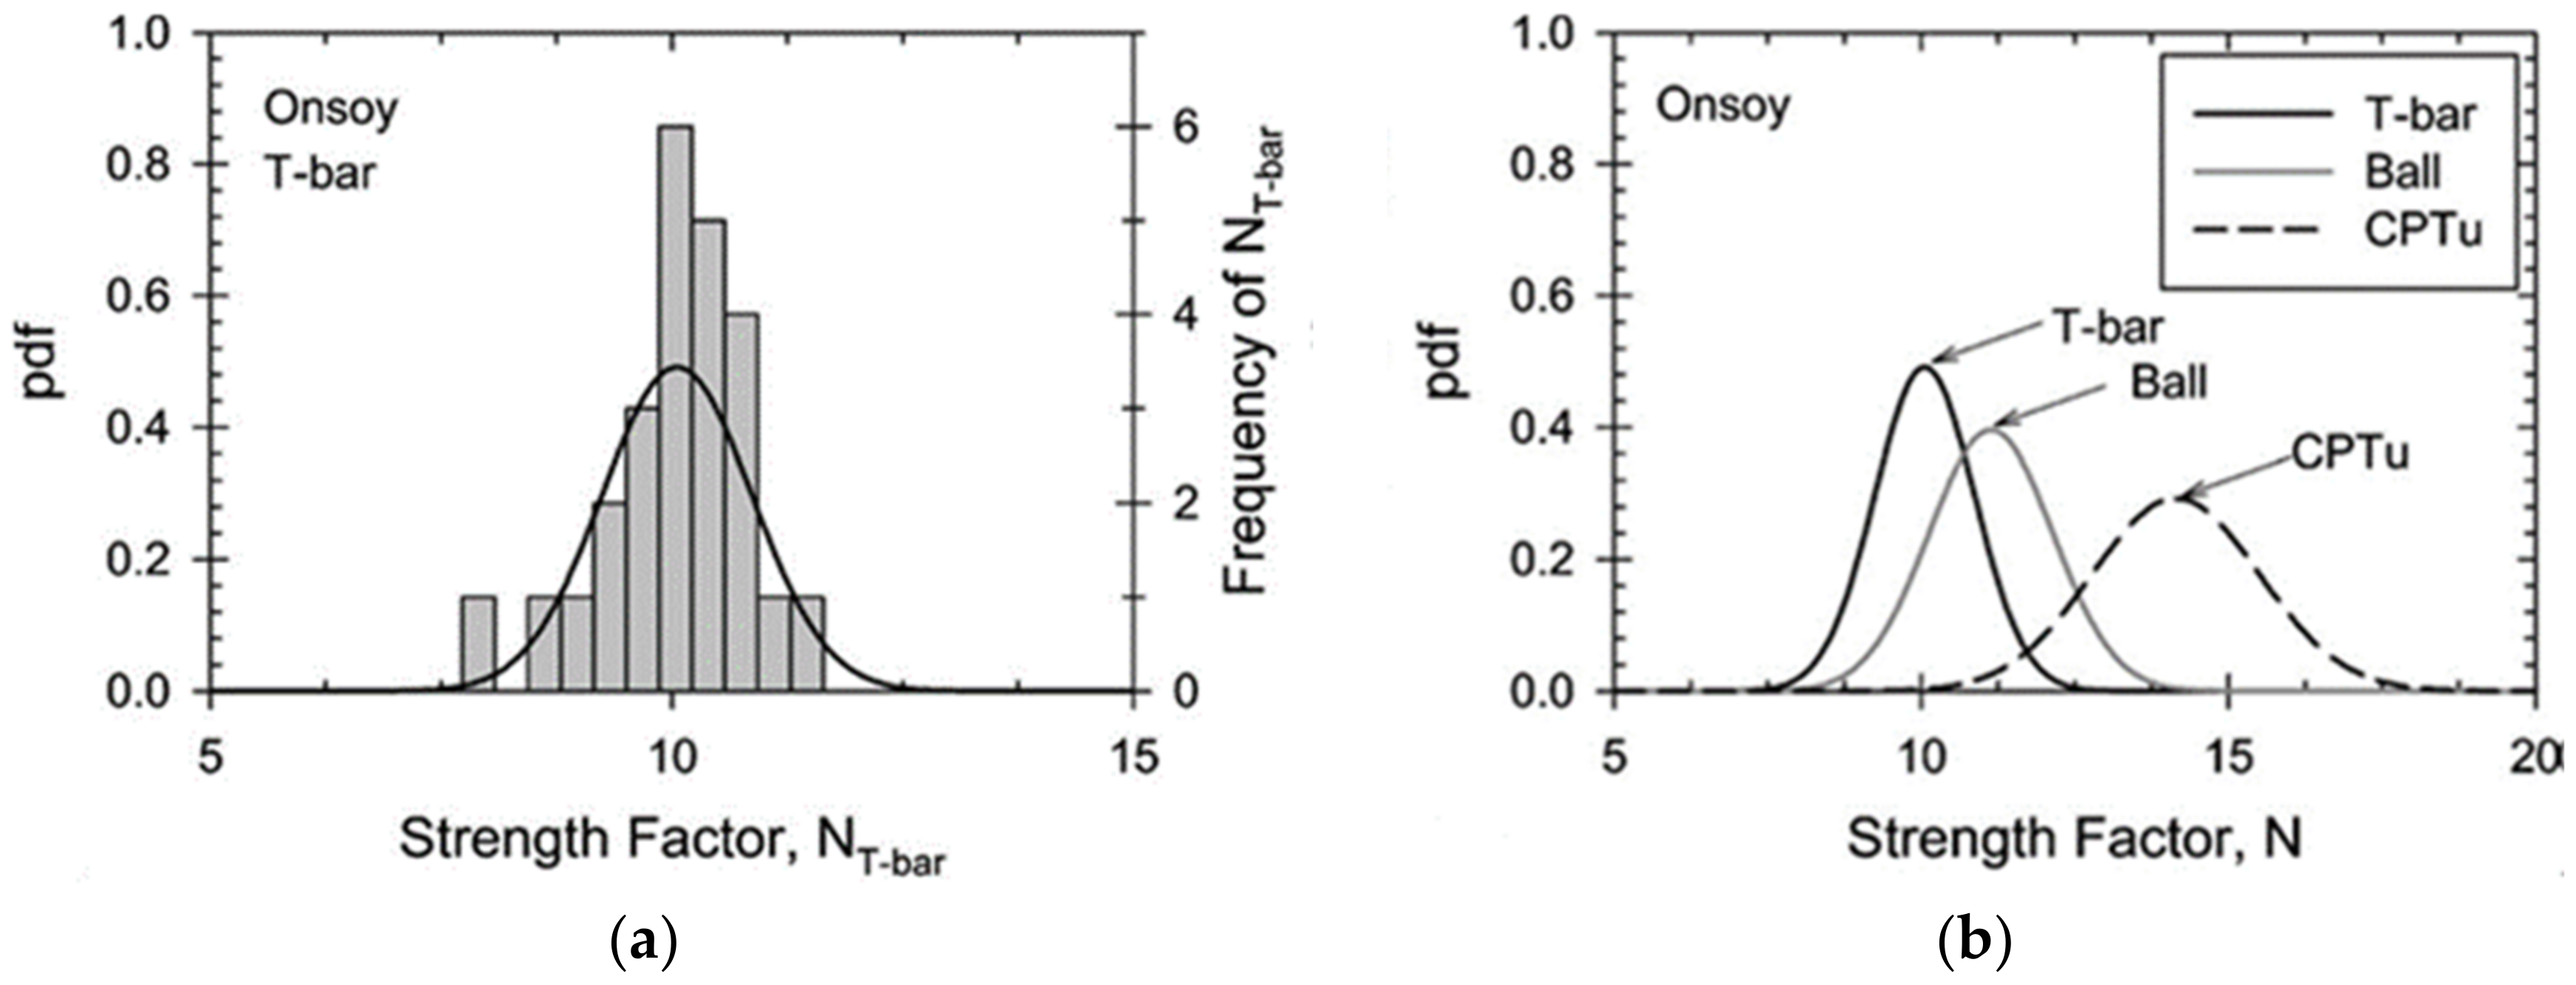
4.1. Evaluation of the Undrained Shear Strength of Soft Marine Soils

Some application tests worldwide were conducted by the University of Western Australia and Southeast University and summarized the empirical values of the T-bar penetrometer resistance factor NT-bar obtained in these tests, as shown in Table 5, where data a are from Lunne [69], data b are from Randolph [18], and data c are from the authors of this paper. The authors of this paper agree with Lunne and Randolph that the N factors derived empirically from su were found to be in the range of 7.2–14.3 for the T-bar [18,69]. To support the determination of the empirical NT-bar values in the Wenzhou, China test site, the vane shear tests (VSTs) were set at a distance of 1 m from each T-bar penetration test by the authors. A site-specific resistance factor NT-bar can be estimated from a linear-fitted slope of su versus qnet (Figure 24) for the Wenzhou test site based on the VSTs measured strengths, as the reference strengths increase linearly with depth. The calculated average for the resistance factor NT-bar of the spot determined by the VSTs data is 12.0, which is consistent with the study conducted by Lunne [69].
Jorat et al. (2014) and Tand et al. (1995) stated that the undrained shear strength of soft soils su can be derived from the ratio of the penetration resistance and the resistance factor through Equation (10) [70,71] as follows:
s u = q net N kt = q t - net N T - bar
where NT-bar and Nkt are the resistance factors for the T-bar and CPTU, respectively. The numerical solution based on the numerical analysis can be used to estimate the undrained shear strength of soft soils based on the penetration resistance, but the numerical solution cannot take into account all the factors affecting the variation of the penetration resistance under actual conditions and does not have a high degree of reliability when applied in practice. Therefore, it is necessary to correct the theoretical numerical solution to obtain the empirical equation by employing the experimental solution obtained from site-specific tests on multiple sites.
Figure 25 summarizes Jorat’s results for the three penetration resistance factors N for the T-bar, ball, and CPTU at the Onsoy site in Norway, based on the undrained shear strength results of the field vane shear test [70]. The relationship between N and depth, su, and qnet is also summarized.
Figure 26 illustrates the probability distribution of the resistance factors N for the three penetrometers T-bar, ball, and CPTU in the test, respectively. Based on this, Jorat concluded that the distribution of the resistance factors for the T-bar and ball penetrometers is more concentrated than the distribution of the cone penetrometers in super soft soils, and that the test results are more reliable.

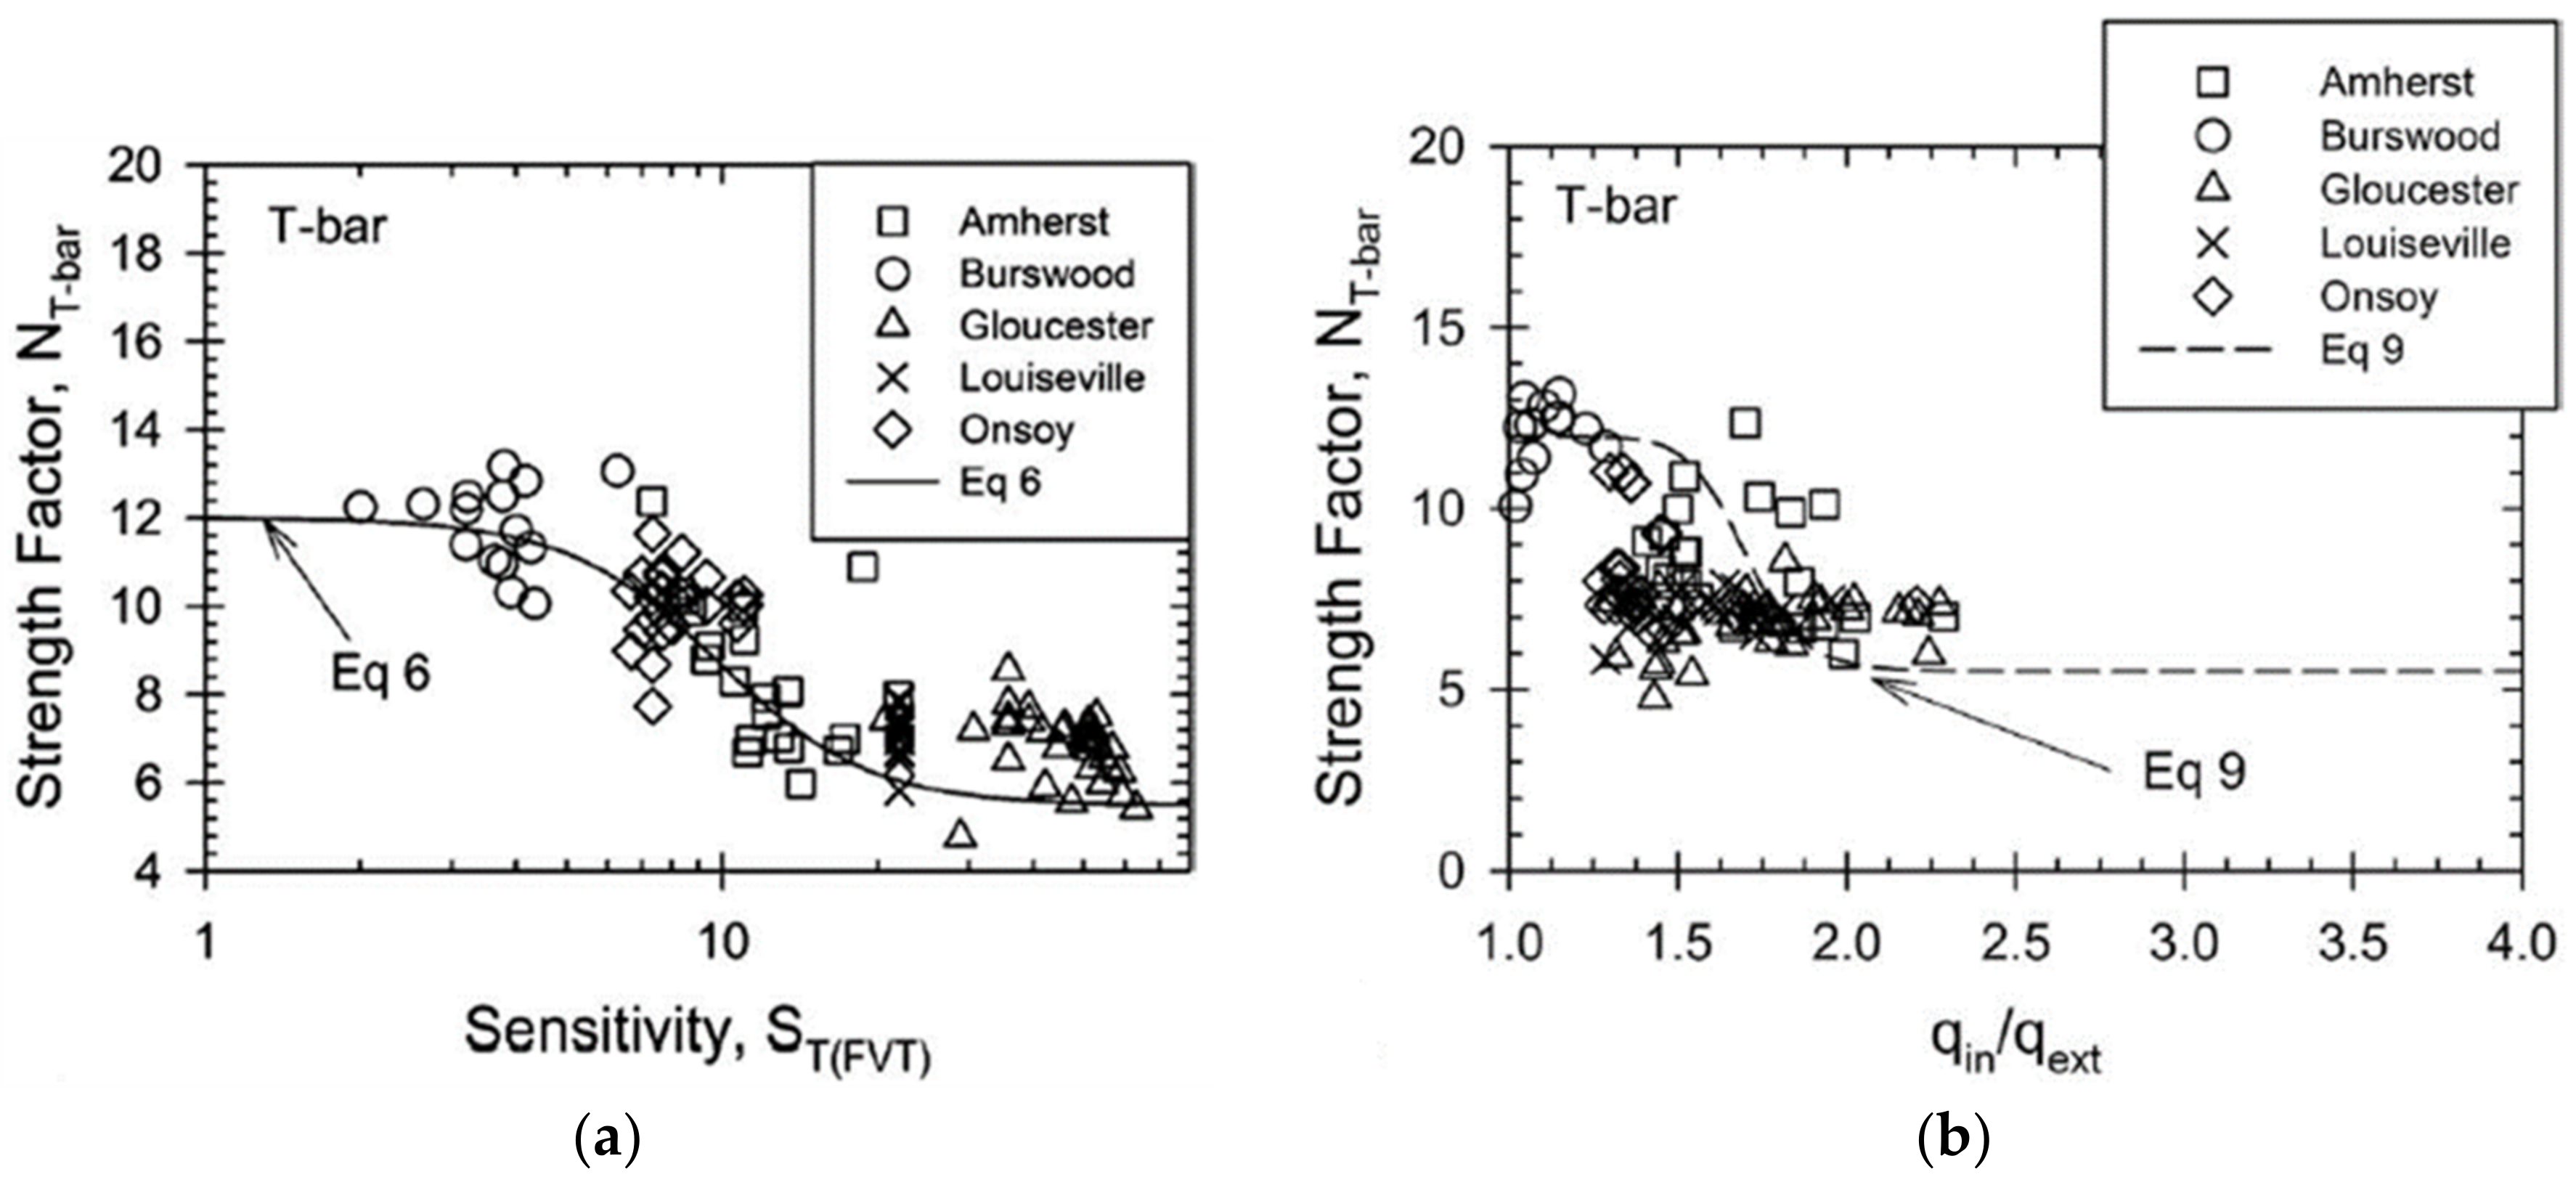
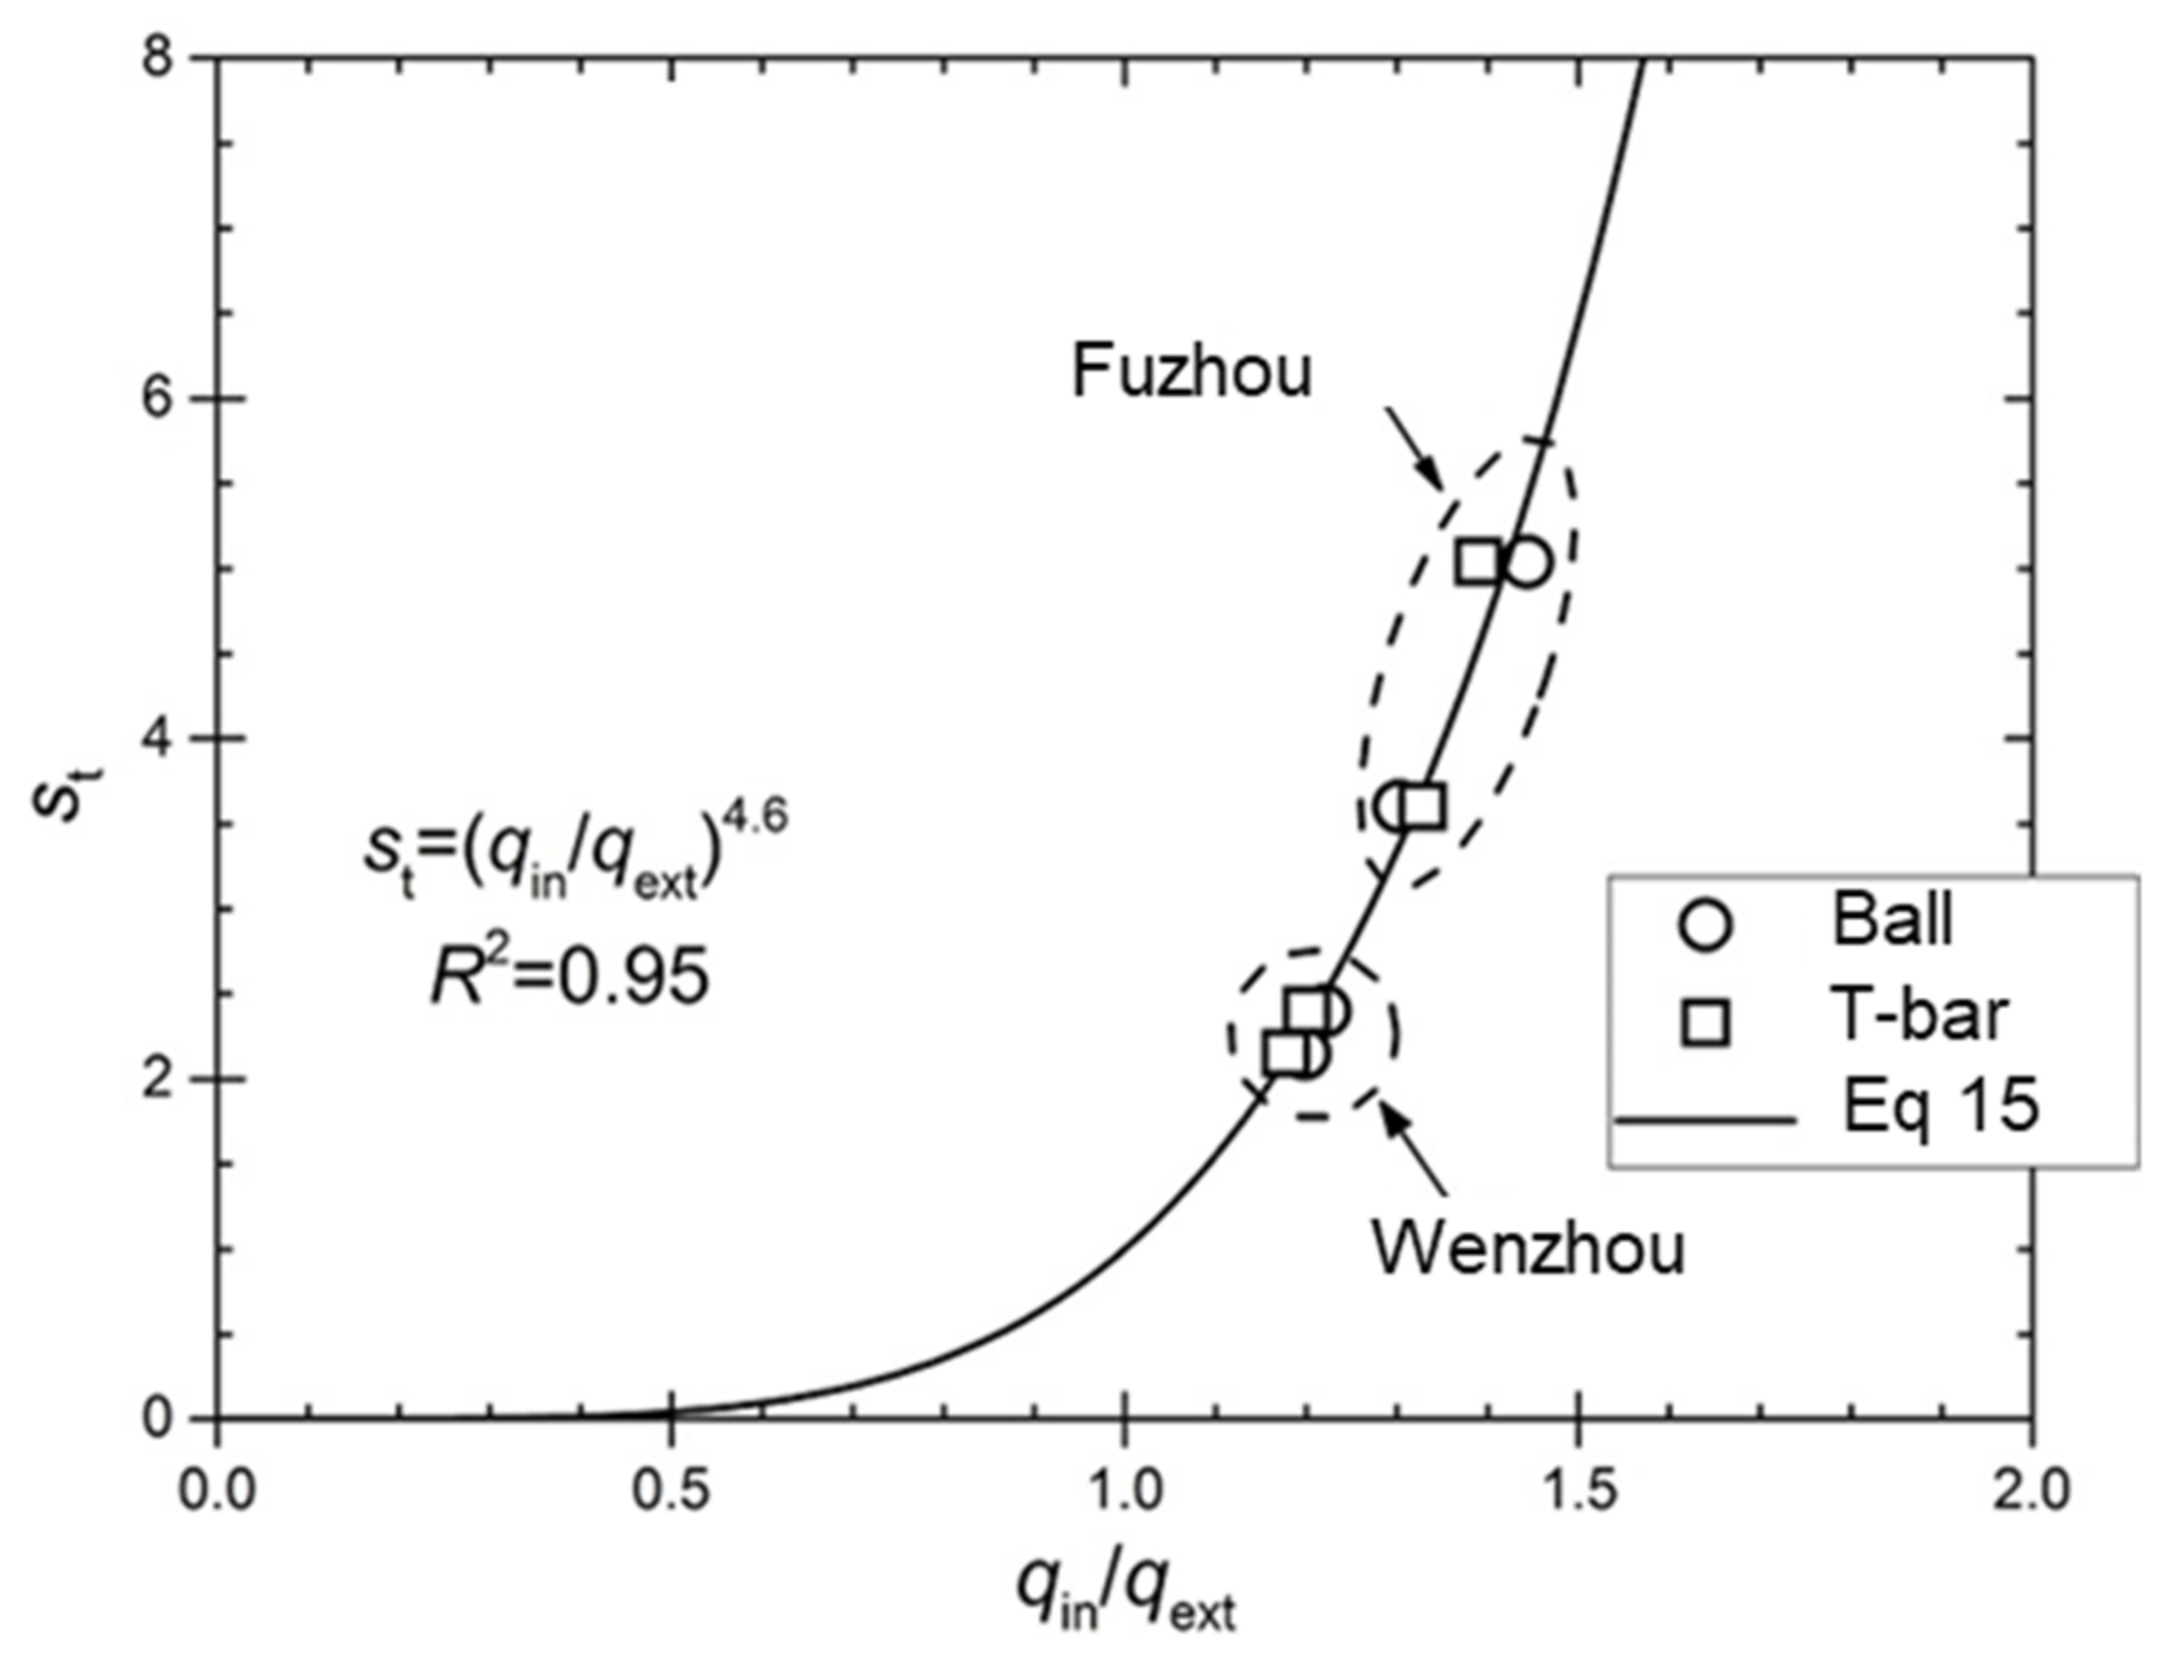
4.2. Sensitivity Evaluation of Marine Soft Soils

The sensitivity of marine soft soils St can be calculated from the in situ undrained shear strength su and the fully remodeled undrained shear strength sur measured by the full-flow cycle penetration test of the full-flow penetrometer using Equation (11).
S t = s u s ur = q in q rem
where qin is the penetration resistance at the initial penetration, and qrem is the penetration resistance at the end of the complete remodeling cycle.
In addition, soil sensitivity is one of the factors influencing the resistance factor NT-Bar, with the value of NT-bar decreasing as the sensitivity of the soil increases. Dejong et al. (2010) summarized the empirical equation for the resistance factor NT-bar with the sensitivity St from the experimental result [16].
N ( T - bar ) = 12 6.5 1 + S t 10 3
Yafrate et al. (2007) obtained a similar relationship between the remodeling resistance factor NT-bar,rem and the sensitivity of the soil [43].
Figure 27 demonstrates the relationship between the resistance factor NT-bar, the sensitivity St of the vane shear test, and the extraction factor of the T-bar penetration test. The curve of Equation (6) in Figure 27a is the fitted curve corresponding to Equation (12). Despite the large dispersion in the data, Equation (6) still fits well for soft soil sensitivities of less than 20 (Figure 27a), but there is a large error in Equation (12) for soft soils with high sensitivities.
Yafrate et al. (2007) described the relationship between the soft soil sensitivity and extraction factor as follows:
S t = q in q ext 3.7
Combining Equations (12) and (13), the resistance factor NT-bar of the penetrometer increases with the increase of qin/qext, and has the following relationship:
N T - bar = 12 6.5 1 + q in / q ext 1.8 20
Equation (14) corresponds to the curve of Equation (9) in Figure 27b, which fits well for the resistance factor NT-bar versus qin/qext.
The authors of this paper modified Equation (13) and developed into Equation (15) from eight samples at two test sites (Wenzhou and Fuzhou) as follows:
S t = q in q ext 4.6
Equation (15) has R2 values of 0.95, with a minor increase in the prediction confidence compared with Equation (13) (Figure 28). The results of soil remolding by the full-flow penetrometers were examined through cyclic testing and field vane shear tests at all test sites.
Recently, improved full-flow penetrometers were developed and pore pressure sensors were adjusted to obtain parameters in addition to penetration resistance, thereby improving the ability of full-flow penetrometers to estimate geotechnical parameters other than undrained shear strength [72]. This could provide an advantage of the piezo T-bar over the piezocone in the estimation of the in situ consolidation coefficient from the dissipation tests; the dissipation time of the piezo T-bar is usually quicker than that of the piezocone. The authors of this paper developed a set of piezo T-bar penetrometers (with one pore pressure filter at the center or one at the edge) with support from Southeast University (Figure 29). The piezo T-bar penetrometer, featuring pore pressure measurements, is a relatively novel device similar to the piezoball used in dissipation tests, which has the potential to estimate the consolidation parameters for profiling fine-grained soil.

4.3. Discussion and Conclusions

As mentioned previously, unlike the piezocone, the full-flow mechanisms of the T-bar or piezoball mean that the resistance values are largely unaffected by high overburden and hydrostatic pressures. Additionally, the larger projected area means a greater resolution in soft soils. The other major benefit of full-flow devices is that they allow for the assessment of the undrained shear strength (both intact and remolded) and the consolidation characteristics in a single test. As a result, some suggestions on future developments of the penetrometers (cone, T-bar, and ball) and associated equipment are recommended to maximize their potential in the characterization of marine soft clays. The main focus has been on lightly overconsolidated clays, with strengths of less than 100 kPa.
The selection of appropriate in situ tools (such as the piezocone or T-bar penetrometer) for a site investigation is contingent upon the project requirements, anticipated soil conditions, and specific geotechnical challenges. Table 6 provides a comprehensive overview of the geotechnical issues relevant to marine field developments, including the corresponding soil parameters that can be inferred through in situ testing and their associated reliability. Table 6 serves as a reference for determining the appropriate application of different in situ tests. Notably, the T-bar and ball penetrometers are grouped in the same category due to their closely correlated measured resistances.
In geological formations where accurate stratigraphy and material characterization are essential, the piezocone is recommended as the primary investigative tool due to its extensive usage in deducing material types based on the piezocone parameters. However, when estimating the undrained shear strength, especially in relatively soft materials, the T-bar (or ball) penetrometer should be considered as a complementary instrument. This is because the T-bar (or ball) penetrometer exhibits higher a potential reliability than the piezocone, particularly when the T-bar and ball resistances (qT-bar and qball) are correlated with the undrained shear strength values. Moreover, the inferred undrained shear strength derived from the T-bar (or ball) penetration resistance appears to provide a robust predictive basis for assessing the bearing capacity of foundation elements, as illustrated by Watson (1999) [73].
Table 6. Applicability–reliability of interpreted soil parameters [12,74].
Geotechnical ProblemDepth Below Seabed
(m)
CommentApplicability–Reliability
CPTUT-bar, ball
(Fitted with Pore Water Pressure Sensors)
Soil
Profiling
Soil Parameters
Interpreted
Soil
Profiling
Soil Parameters
Interpreted
Backfilled trenches: upheaval
buckling
0–1Extremely soft material may be encounteredSoil profile 1,2γ 2, u 2, OCR 3, K0 4,5, su 2,3, sru 5, St 2,3, c’ 3,4, φ’ 3,4, Gmax 4, E 5, G 5, M 5, k 2–4, ch 2,3Soil profile 3u 2, OCR 3, su 1,2, sru 1,2, St 1,2, k 2−4, ch 2,3
Pipeline–riser soil interaction0–3Very soft material may be encounteredSoil profile 1,2
Classification 2
γ 2, u 2, OCR 3, K0 4,5, su 2,3, sru 5, St 2,3, c’ 3,4, φ’ 3,4, Gmax 4, E 5, G 5, M 5, k 2−4, ch 2,3Soil profile 3u 2, OCR 3, su 1,2, sru 1,2, St 1,2, k 2−4, ch 2,3
Seabed templates, penetration, stability,
settlements
0–10-Soil profile 1,2
Classification 2
γ 2, u 2, OCR 3, K0 4,5, su 2,3, sru 5, St 2,3, c’ 3,4, φ’ 3,4, Gmax 4, E 5, G 5, M 5, k 2−4, ch 2,3Soil profile 3u 2, OCR 3, su 1,2, sru 1,2, St 1,2, k 2−4, ch 2,3
Geohazards; slope stability0–10/100Use of
T-bar, ball, and vane may be
limited to 40 m depth
Soil profile 1,2
Classification 2
γ 2, u 2, OCR 3, K0 4,5, su 2,3, sru 5, St 2,3, c’ 3,4, φ’ 3,4, Gmax 4, E 5, G 5, M 5, k 2−4, ch 2,3Soil profile 3u 2, OCR 3, su 1,2, sru 1,2, St 1,2, k 2−4, ch 2,3
Note: 1: high reliability; 2: high-moderate reliability; 3: moderate reliability; 4: moderate-low reliability; 5: low reliability; γ: soil unit weight; u: in situ pore pressure; OCR: overconsolidalion ratio; K0: coefficient of earth pressure at rest; su: undrained shear strength; sur: remolded undrained shear strength; St: sensitivity; c’, φ’: effective stress shear strength parameters; E, G: Young’s and shear modulus; M: constrained modulus; Gmax: small strain shear modulus; k: coefficient of permeability; and ch: coefficient of consolidation.
The estimation of the undrained shear strength through a piezocone penetration test exhibits a reduced reliability when applied to backfilled materials compared to the original seabed soil. This discrepancy arises due to the expectedly low cone resistance and pore pressure observed in such materials. To characterize soft clay at shallow depths, the T-bar (or ball) penetrometer test can provide reasonably accurate estimations of the undrained shear strength if executed with meticulous care. Therefore, it is recommended to prioritize the T-bar (or ball) penetrometer as the primary tool, with the vane test serving as a supplementary measuring tool to enhance the reliability of the estimated undrained shear strength. Additionally, the T-bar and ball penetration tests should be performed on box core samples to assess the shear strength profile in the uppermost 0.5 m of the seabed.
The consolidation characteristics are usually assessed in situ using piezocone dissipation test data. Meanwhile, the full-flow penetrometers fitted with pore water pressure sensors were developed for determining the consolidation parameters. Recently, piezoball dissipation tests were reported, and theoretical interpretation methods of piezoball were developed that were also found to estimate the coefficient of consolidation to a similar degree of accuracy as the piezocone dissipation tests [12,74]. In addition, the available data suggest that the dissipation around the ball is quicker than the dissipation around the cone. Offshore, where vessel costs are high, this testing efficiency can lead to significant cost savings. The T-bar may be viewed as a model pipeline element, and thus provides direct information for pipeline and riser design, which shows the potential of T-bar penetrometers.

5. Summary and Outlook

This study reviewed the penetration mechanism and development of the T-bar penetrometer, and the state of its applications in marine soft soil engineering. Then, the numerical simulations and various laboratory experiments of the T-bar penetrometer and in situ testing methods were summarized. After that, the principles for parameter evaluation by applying the T-bar penetrometer in marine soft soil engineering investigations were also described. Due to the complexity of the topic in the present work, there are still many limitations and challenges with the T-bar penetrometer testing technology. The main aspects that need to be investigated are summed up as follows:
1.
An analysis of the theoretical solution of the T-bar penetrometer data. In practical applications, the interpretation of the T-bar penetrometer test data to predict the undrained shear strength and sensitivity of soft soils mainly relies on empirical formulas. However, the evaluated parameters of soft soils through the empirical relationship method lack reliability due to the absence of a large amount of reliable test data. This problem can be solved by gaining a deeper understanding of the mechanism of the T-bar full-flow test evaluation system and the derivation of a more accurate theoretical analytical solution.
2.
The numerical simulation of the T-bar full-flow penetrometer. Recently, the numerical simulation of the T-bar penetrometer is proposed by researchers, which considers the effects of the strain rate, strain softening, and strength anisotropy. However, it is difficult to restore the soil material and the penetration process in the simulation process nowadays, and further development of numerical techniques is needed.
3.
The laboratory model experiment of the T-bar penetrometer. Most of the present research on laboratory model experiments is focused on the traditional CPTU testing of sandy soils, while the research on the penetration mechanism of the T-bar full-flow penetrometer of soft soil is still insufficient.
4.
The T-bar penetrometer field experimental research. The good performance of the T-bar penetrometer technology depends on the large number of accurate field test data, which are used for repeated verification and calibration. In recent years, the T-bar penetrometer technology has mainly been used in Europe and the United States, and the test results are usually available for these areas. However, in many Asian countries, such as China, the research and application of the T-bar penetrometer technology is still in its infancy. Therefore, a large number of field tests still need to be conducted to verify the applicability of the T-bar penetrometer in soft coastal soils in Asian countries.

Author Contributions

Writing—original draft preparation, H.Q. and P.P.; conceptualization, L.L.; supervision and writing—review and editing, H.H.; investigation, X.L. (Xiaoyan Liu); data curation, X.L. (Xuening Liu). All authors have read and agreed to the published version of the manuscript.

Funding

This research was funded by the Project of Jiangsu Province Transportation Engineering Construction Bureau, grant number CX-2019GC02.

Institutional Review Board Statement

Not applicable.

Informed Consent Statement

Not applicable.

Data Availability Statement

Not applicable.

Conflicts of Interest

The authors declare no conflict of interest.

References

  1. Baumert, H.Z.; Simpson, J.; Simpson, J.H.; Sündermann, J. Marine Turbulence: Theories, Observations, and Models; Cambridge University Press: Cambridge, UK, 2005. [Google Scholar]
  2. Guo, Z.; Jeng, D.-S.; Guo, W.; Wang, L. Failure mode and capacity of suction caisson under inclined short-term static and one-way cyclic loadings. Mar. Georesources Geotechnol. 2018, 36, 52–63. [Google Scholar]
  3. Guo, Z.; Zhou, W.; Zhu, C.; Yuan, F.; Rui, S. Numerical simulations of wave-induced soil erosion in silty sand seabeds. Engineering 2019, 7, 52. [Google Scholar]
  4. Lei, H.; Lu, H.; Wang, X.; Ren, Q.; Li, B. Changes in soil micro-structure for natural soft clay under accelerated creep condition. Geotechnology 2016, 34, 365–375. [Google Scholar] [CrossRef]
  5. Lei, H.; Xu, Y.; Jiang, M.; Jiang, Y. Deformation and fabric of soft marine clay at various cyclic load stages. Ocean Eng. 2020, 195, 106757. [Google Scholar] [CrossRef]
  6. Randolph, M.; Cassidy, M.; Gourvenec, S.; Erbrich, C. Challenges of offshore geotechnical engineering. In Proceedings of the 16th International Conference on Soil Mechanics and Geotechnical Engineering, Lahore, Pakistan, 7–8 December 2022; p. 123. [Google Scholar]
  7. Shan, Y.; Meng, Q.; Yu, S.; Mo, H.; Li, Y. Energy based cyclic strength for the influence of mineral composition on artificial marine clay. Eng. Geol. 2020, 274, 105713. [Google Scholar] [CrossRef]
  8. Yang, Y. Research on Penetration Mechanism and Application of Ball Penetrometer in Offshore Engineering. Master’s Thesis, Southeast University, Nanjing, China, 2018. [Google Scholar]
  9. Guo, Z.; Yu, L.; Wang, L.; Bhattacharya, S.; Nikitas, G.; Xing, Y. Model tests on the long-term dynamic performance of offshore wind turbines founded on monopiles in sand. J. Offshore Mech. Arct. Eng. 2015, 137, 041902. [Google Scholar] [CrossRef]
  10. Guo, Z.; Hong, Y.; Jeng, D.-S. Structure–Seabed Interactions in Marine Environments. J. Mar. Sci. Eng. 2021, 9, 972. [Google Scholar] [CrossRef]
  11. Jewell, R.A. The mechanics of reinforcede bankments on soft soils. Geotext. Geomembr. 1988, 7, 237–273. [Google Scholar]
  12. Lunne, T.; Andersen, K.H.; Low, H.E.; Randolph, M.F.; Sjursen, M. Guidelines for offshore in situ testing and interpretation in deepwater soft clays. Can. Geotech. J. 2011, 48, 543–556. [Google Scholar]
  13. Lei, H.; Lu, H.; Liu, J.; Zheng, G. Experimental study of the clogging of dredger fills under vacuum preloading. Int. J. Geomech. 2017, 17, 04017117. [Google Scholar] [CrossRef]
  14. Lei, H.; Liu, X.; Wang, P.; Liu, J.; Hu, Y. Experimental investigation of influence of air-boost pressure and duration on air-boost vacuum preloading consolidation. Int. J. Geomech. 2021, 21, 04021088. [Google Scholar] [CrossRef]
  15. Duan, W.; Cai, G.; Liu, S.; Puppala, A.J.; Chen, R. In-situ evaluation of undrained shear strength from seismic piezocone penetration tests for soft marine clay in Jiangsu, China. Transp. Geotech. 2019, 20, 100253. [Google Scholar] [CrossRef]
  16. Dejong, J.; Yafrate, N.; Degroot, D.; Low, H.E.; Randolph, M. Recommended practice for full-flow penetrometer testing and analysis. ASTM Geotech. Test. J. 2010, 33, 137–149. [Google Scholar]
  17. Randolph, M. Characterization of soft sediments for offshore applications. Proc. ISC-2 Geotech. Geophys. Site Charact. 2004, 2004, 10017599903. [Google Scholar]
  18. Lunne, T.; Powell, J.J.; Robertson, P.K. Cone Penetration Testing in Geotechnical Practice; CRC Press: Boca Raton, FL, USA, 2002. [Google Scholar]
  19. Duan, W.; Congress, S.S.C.; Cai, G.; Liu, S.; Dong, X.; Chen, R.; Liu, X. A hybrid GMDH neural network and logistic regression framework for state parameter–based liquefaction evaluation. Can. Geotech. J. 2021, 99, 1801–1811. [Google Scholar] [CrossRef]
  20. Duan, W.; Congress, S.S.C.; Cai, G.; Zhao, Z.; Liu, S.; Dong, X.; Chen, R.; Qiao, H. Prediction of in situ state parameter of sandy deposits from CPT measurements using optimized GMDH-type neural networks. Acta Geotech. 2022, 17, 4515–4535. [Google Scholar] [CrossRef]
  21. Cai, G.; Liu, S.; Peng, P.; Yang, Y. Theory and Engineering Application of Marine In Situ Testing Technology, 1st ed.; Science Press: Beijing, China, 2021. [Google Scholar]
  22. Liu, X.; Shen, J.; Yang, M.; Cai, G.; Liu, S. Subsurface characterization of a construction site in Nanjing, China using ERT and CPTU methods. Eng. Geol. 2022, 299, 106563. [Google Scholar] [CrossRef]
  23. Zhang, W.; Liu, K.; Wang, D.; Zheng, J. Coefficient of consolidation measured by cone penetration tests in overconsolidated cohesive soils. Ocean Eng. 2023, 276, 114301. [Google Scholar] [CrossRef]
  24. Lin, J.; Hou, X.; Cai, G.; Liu, S. Uncertainty analysis of axial pile capacity in layered soils by the piezocone penetration test. Front. Earth Sci. 2022, 10, 443. [Google Scholar] [CrossRef]
  25. Zhou, H.; Randolph, M.F. Resistance of full-flow penetrometers in rate-dependent and strain-softening clay. Géotechnique 2009, 59, 79–86. [Google Scholar] [CrossRef]
  26. Liu, K.; Wang, D.; Zheng, J. Numerical study of piezoball dissipation test with penetration under partially drained conditions. Comput. Geotech. 2023, 159, 105469. [Google Scholar] [CrossRef]
  27. Guo, X.; Nian, T.; Gu, Z. A fluid mechanics approach to evaluating marine soft clay strength by a ball full-flow penetrometer. Appl. Ocean Res. 2021, 116, 102865. [Google Scholar] [CrossRef]
  28. Li, C.; Yu, L.; Kong, X.; Zhang, H. Estimation of undrained shear strength in rate-dependent and strain-softening surficial marine clay using ball penetrometer. Comput. Geotech. 2023, 153, 105084. [Google Scholar] [CrossRef]
  29. Yu, L.; Yang, Q.; Zhang, J. Undrained bearing capacity of irregular T-bar by the lower bound method in clay. Appl. Ocean Res. 2020, 105, 102409. [Google Scholar] [CrossRef]
  30. Guo, X.; Nian, T.; Zhao, W.; Gu, Z.; Liu, C.; Liu, X.; Jia, Y. Centrifuge experiment on the penetration test for evaluating undrained strength of deep-sea surface soils. Int. J. Min. Sci. Technol. 2022, 32, 363–373. [Google Scholar] [CrossRef]
  31. Yang, Y.; Zhou, X.; Zhou, M.; Zhang, X. The behavior of ball penetrometer in soft-over-stiff soil deposits. Ocean Eng. 2023, 273, 114011. [Google Scholar] [CrossRef]
  32. Lunne, T. The CPT in offshore soil investigations-a historic perspective. Proc. CPT 2010, 10, 71–113. [Google Scholar]
  33. Cai, G.; Liu, S.; Puppala, A.J. Comparative performance of the international piezocone and China CPT in Jiangsu Quaternary clays of China. Transp. Geotech. 2015, 3, 1–14. [Google Scholar] [CrossRef]
  34. Hanzawa, H.; Tanaka, H. Normalized undrained strength of clay in the normally consolidated state and in the field. Soils Found. 1992, 32, 132–148. [Google Scholar] [CrossRef]
  35. Li, S.M. Research on the Mechanical Structures of CPT System on Seabed of Shallow Ocean Area. Ph.D. Thesis, Jilin University, Changchun, China, 2005. [Google Scholar]
  36. Shi, Y.H. Key Technology Research of the Cone Penetration Test (CPT) on Seabottom. Master’s Thesis, Ocean University of China, Qingdao, China, 2005. [Google Scholar]
  37. Chung, S.F.; Randolph, M.F.; Schneider, J.A. Effect of penetration rate on penetrometer resistance in clay. J. Geotech. Geoenviron. Eng. 2006, 132, 1188–1196. [Google Scholar] [CrossRef]
  38. Kelly, R.; O’Loughlin, C.; Bates, L.; Gourvenec, S.; Colreavy, C.; White, D.; Gaone, F.; Doherty, J.; Randolph, M.F. In situ testing at the national soft soil field testing facility, Ballina, New South Wales. Aust. Geomech. J. 2014, 49, 15–28. [Google Scholar]
  39. Randolph, M.; Hefer, P.; Geise, J.; Watson, P. Improved seabed strenght profiling using T-bar penetrometer. In Proceedings of the Offshore Site Investigation and Foundation Behaviour: New Frontiers—Proceedings of an International Conference, London, UK, 22–24 September 1998. [Google Scholar]
  40. Kelleher, P.; Randolph, M. Seabed geotechnical characterisation with a ball penetrometer deployed from the portable remotely operated drill. In Proceedings of the 1st International Symposium on Frontiers in Offshore Geotechnics, Lisse, Switzerland, 15 August 2005; pp. 365–371. [Google Scholar]
  41. Randolph, M. Analytical contributions to offshore geotechnical engineering. 2nd McClelland Lecture. In Proceedings of the 18th International Conference on Soil Mechanics and Geotechnical Engineering, Paris, France, 2–6 September 2013. [Google Scholar]
  42. Weemees, I.; Howie, J.; Woeller, D.; Sharp, J.; Cargill, E.; Greig, J. Improved techniques for the in-situ determination of undrained shear strength of soft clays. In Proceedings of the Sea to Sky Geotechnics, 59th Canadian Geotechnical Conference, Vancouver, BC, Canada, 1–4 October 2006; pp. 1–4. [Google Scholar]
  43. Yafrate, N.J.; DeJong, J.T.; DeGroot, D.J. The influence of full-flow penetrometer area ratio on penetration resistance and undrained and remoulded shear strength. In Proceedings of the Offshore Site Investigation and Geotechnics: Confronting New Challenges and Sharing Knowledge, London, UK, 11–13 September 2007. [Google Scholar]
  44. Low, H.E.; Lunne, T.; Andersen, K.H.; Sjursen, M.A.; Li, X.; Randolph, M.F. Estimation of intact and remoulded undrained shear strengths from penetration tests in soft clays. Géotechnique 2010, 60, 843–859. [Google Scholar] [CrossRef]
  45. Yafrate, N.; Dejong, J.; Degroot, D.; Randolph, M. Evaluation of Remolded Shear Strength and Sensitivity of Soft Clay Using Full-Flow Penetrometers. J. Geotech. Geoenviron. Eng. 2009, 135, 1179–1189. [Google Scholar] [CrossRef]
  46. Martin, C.M.; Randolph, M.F. Upper-bound analysis of lateral pile capacity in cohesive soil. Géotechnique 2006, 56, 141–145. [Google Scholar] [CrossRef]
  47. Randolph, M.F.; Houlsby, G.T. The limiting pressure on a circular pile loaded laterally in cohesive soil. Geotechnique 1984, 34, 613–623. [Google Scholar] [CrossRef]
  48. Randolph, M.; Martin, C.; Hu, Y.J.G. Limiting resistance of a spherical penetrometer in cohesive material. Geotechnique 2000, 50, 573–582. [Google Scholar] [CrossRef]
  49. Einav, I.; Randolph, M.F. Combining upper bound and strain path methods for evaluating penetration resistance. Int. J. Numer. Methods Eng. 2005, 63, 1991–2016. [Google Scholar] [CrossRef]
  50. Zhou, H.; Randolph, M.F. Numerical investigations into cycling of full-flow penetrometers in soft clay. Géotechnique 2009, 59, 801–812. [Google Scholar] [CrossRef]
  51. Klar, A.; Pinkert, S. Steady-state solution for cylindrical penetrometers. Int. J. Numer. Anal. Methods Geomech. 2010, 34, 645–659. [Google Scholar] [CrossRef]
  52. Zhou, H.; Randolph, M. Effect of shaft on resistance of a ball penetrometer. Géotechnique 2011, 61, 973–981. [Google Scholar] [CrossRef]
  53. Randolph, M.F.; Andersen, K.H. Numerical analysis of T-bar penetration in soft clay. Int. J. Geomech. 2006, 6, 411–420. [Google Scholar] [CrossRef]
  54. Fan, Q.; Luan, M.; Liu, Z. Numerical simulation of penetration resistance of T-bar penetrometer in soft clay. Rock Soil Mech. 2009, 30, 2850–2854. [Google Scholar]
  55. Parkin, A. The calibration of cone penetrometers. In Proceedings of the International Symposium on Penetration Testing (ISOPT-1. 1), Orlando, FL, USA, 20–24 March 1988; pp. 221–243. [Google Scholar]
  56. Ghionna, V.; Jamiolkowski, M. A critical appraisal of calibration chamber testing of sands. In Proceedings of the 1st International Symposium on Calibration Chamber Testing, New York, NY, USA, 28–29 June 1991; pp. 13–39. [Google Scholar]
  57. Holden, J. The calibration of electrical penetrometers in sand. Nor. Geotech. Inst. Intern. Rep. 1976, 55, 345–354. [Google Scholar]
  58. Tcheng, Y. Fondations profonds en milieu pulverulent a diverses compacities. Ann. De I’Institut Tech. Du Batim. Et Des Trav. Publics Sols Et Fond. 1966, 54, 219–220. [Google Scholar]
  59. Villet, W.C.; Mitchell, J.K. Cone resistance, relative density and friction angle. In Proceedings of the Cone Penetration Testing and Experience, St. Louis, MO, USA, 26–30 October 1981; pp. 178–208. [Google Scholar]
  60. Pournaghiazar, M.; Russell, A.; Khalili, N. CPT in unsaturated soils using a new calibration chamber. In Proceedings of the 2nd International Symposium on Cone Penetration Testing, Huntington Beach, CA, USA, 9–11 May 2010. [Google Scholar]
  61. Tan, N.K. Pressuremeter and Cone Penetrometer Testing in a Calibration Chamber with Unsaturated Minco Silt; The University of Oklahoma: Norman, OK, USA, 2005. [Google Scholar]
  62. Huang, A.-B.; Hsu, H.-H. Cone penetration tests under simulated field conditions. Geotechnique 2005, 55, 345–354. [Google Scholar] [CrossRef]
  63. Parkin, A.; Lunne, T. Boundary Effects in the Laboratory Calibration of a Cone Penetrometer for Sand. Presented at the 2nd (European Symposium on Penetration Testing (ESOPT II); Amsterdam, The Netherlands, 24–27 May 1982; pp. 1–7. [Google Scholar]
  64. Salgado, R.; Mitchell, J.; Jamiolkowski, M. Cavity expansion and penetration resistance in sand. J. Geotech. Geoenviron. Eng. 1997, 123, 344–354. [Google Scholar] [CrossRef]
  65. Schnaid, F.; Houlsby, G.T. An assessment of chamber size effects in the calibration of in situ tests in sand. Geotechnique 1991, 41, 437–445. [Google Scholar] [CrossRef]
  66. Wesley, L.D. Interpretation of calibration chamber tests involving cone penetrometers in sands. Geotechnique 2002, 52, 289–293. [Google Scholar] [CrossRef]
  67. House, A.; Oliveira, J.; Randolph, M.F. Evaluating the coefficient of consolidation using penetration tests. Int. J. Phys. Model. Geotech. 2001, 1, 17–26. [Google Scholar] [CrossRef]
  68. DeJong, J.T.; Yafrate, N.J.; DeGroot, D. Evaluation of undrained shear strength using full-flow penetrometers. J. Geotech. Geoenviron. Eng. 2011, 137, 14–26. [Google Scholar] [CrossRef]
  69. Lunne, T.; Randolph, M.; Chung, S.; Andersen, K.; Sjursen, M. Comparison of cone and T-bar factors in two onshore and one offshore clay sediments. In Frontiers in Offshore Geotechnics (Proc. ISFOG-1, Perth); Taylor & Francis Group: London, UK, 2005; pp. 981–989. [Google Scholar]
  70. Jorat, M.; Mörz, T.; Schunn, W.; Kreiter, S.; Moon, V.; de Lange, W. Geotechnical Offshore Seabed Tool (GOST): A new cone penetrometer. In Proceedings of the 3rd International Symposium on Cone Penetration Testing, Las Vegas, NV, USA, 12–14 May 2014; pp. 207–215. [Google Scholar]
  71. Tand, K.; Funegard, E.; Warden, P. Predicted/measured bearing capacity of shallow footings on sand. In Proceedings of the International Symposium on Cone Penetration Testing (CPT’95), Linköping, Sweden, 4–5 October 1995; pp. 589–594. [Google Scholar]
  72. Oliveira, J.; Almeida, M. Pore-pressure generation in cyclic T-bar tests on clayey soil. Int. J. Phys. Model. Geotech. 2010, 10, 19–24. [Google Scholar] [CrossRef]
  73. Watson, P. Performance of Skirted Foundations for Offshore Structures. Ph.D. Thesis, The University of Western Australia, Crawley, Australia, 1999. [Google Scholar]
  74. Colreavy, C. Use of Piezoball Penetrometers for Measuring Shear Strength and Consolidation Characteristics of Soft Soil. Ph.D. Thesis, University of Western Australia, Perth, Australia, 2017. [Google Scholar]
Figure 1. Schematic diagram of the internal structure of the CPTU [17].
Jmse 11 01160 g001
Figure 2. Full-flow penetrometers (T-bar, ball, and plate) [25].
Jmse 11 01160 g002
Figure 3. Seabed mode and down-hole mode test system. (a) Seabed mode; (b) down-hole mode [21].
Jmse 11 01160 g003
Figure 4. T-bar and ball penetrometer and full-flow of soil during penetration. (a) T-bar and ball penetrometer; (b) soil full-flow [40].
Jmse 11 01160 g004
Figure 5. Plasticity solution of resistance factor with a surface friction coefficient for three types of penetrometers [6].
Jmse 11 01160 g005
Figure 6. Stress characteristic fields for T-bar (left) and ball (right): interface friction coefficient, α = (a) 0, (b) 0.5, (c) 1 [48].
Jmse 11 01160 g006
Figure 7. Upper bound mechanism for both cylinder and sphere [49].
Jmse 11 01160 g007
Figure 8. Resistance factor NT-bar values for strain rate correlation and strain softening effects of T-bar penetrometer [41].
Jmse 11 01160 g008
Figure 9. Numerical simulation meshing of T-bar full-flow penetrometer [52].
Jmse 11 01160 g009
Figure 10. Change of shear strength due to strain softening during T-bar full-flow penetration: specific values of normalized resistance, N = (A) 8.3, (B) 8.17, (C) 7.62, (D) 8.24 [52].
Jmse 11 01160 g010
Figure 11. Effect of strength change before and after penetration via T-bar penetrometer. (a) Penetration 2.5 D; (b) penetration 3D [50].
Jmse 11 01160 g011
Figure 12. Influence of the number of cycles of penetration on the change in strain distribution [50].
Jmse 11 01160 g012
Figure 13. Distribution of the extent of remodeling soils affected by T-bar full-flow penetrometer considering the effect of strain rate correlation [50].
Jmse 11 01160 g013
Figure 14. Cloud chart of vertical stress of soil mass (a) before penetration and (b) after penetration [8].
Jmse 11 01160 g014
Figure 15. Horizontal stress nephogram of soil mass (a) before penetration and (b) after penetration [8].
Jmse 11 01160 g015
Figure 16. Specific diagram of the calibration tank. (a) CRB flexible double-walled calibration tank; (b) University of New South Wales calibration tank [58].
Jmse 11 01160 g016
Figure 18. Calibration tank test with 5 different boundary states [57].
Jmse 11 01160 g018
Figure 19. Boundary state BC5 for the 5th calibration tank test [62].
Jmse 11 01160 g019
Figure 20. Boundary condition effects of the CPT calibration tank test for two boundary conditions, BC1 and BC3 [63].
Jmse 11 01160 g020
Figure 21. The T-bar penetrometer cyclic penetration test [49].
Jmse 11 01160 g021
Figure 22. Normalized penetration resistance decays as the cyclic penetration test proceeds [49].
Jmse 11 01160 g022
Figure 23. Standard and unstable rate cone penetration test [18].
Jmse 11 01160 g023
Figure 24. Relationship between net penetration resistance and undrained shear strength at the Wenzhou test site.
Jmse 11 01160 g024
Figure 25. Variation of T-bar, ball, and CPTU resistance factors N with depth, undrained shear strength, and net penetration resistance [70].
Jmse 11 01160 g025
Figure 26. Distribution of resistance factors for various probes at the Onsoy site in Norway. (a) Histogram of N T-bar distribution with normal distribution probability density function; (b) normal distribution probability density function (PDF) for three probes with resistance factor N [70].
Jmse 11 01160 g026
Figure 27. Relationship between the resistance factor NT-bar and (a) the sensitivity of the vane shear test St and (b) the extraction factor qin/qext [43].
Jmse 11 01160 g027
Figure 28. Relationship between the sensitivity of the vane shear test St and the extraction factor qin/qext.
Jmse 11 01160 g028
Figure 29. Piezo full-flow penetrometers (in this paper).
Jmse 11 01160 g029
Table 1. Summary of the main development of marine penetrometer deployment technology [32].
Penetration Mechanism/
Main Penetration Equipment
DateEquipmentCompanyNotes
Discontinuous push
Hydraulic cylinder
1972.3Dead weight operated from platformNGI, Norway/McClelland, Houston, Texas, USAMax 4 m penetration
reached in dense sand
1972.3SeacalfFugro, The Netherlands25 m penetration
reached in 130 m water
depth
1974StingrayMcClelland, Houston, Texas, USAPush on drill pipe, not
on cone rod
1976Diving bellDelf Soil Mechanics
Laboratory (Deltares)
600 kN reaction force,
60 m penetration
achieved
1991SCOPEGeo, DenmarkSelf-leveling
Continuous push1983ROSONAPvandenBerg/
D’Appolonia
Roller wheels
1984Modified BORROS rigMcClelland, Houston, Texas, USASynopticated hydraulic
cylinders
1984Wheel drive SeacalfFugro, NetherlandsRoller wheels
2010DeepCPTGregg Drilling &
Testing Inc., California, USA
Suction anchor; 200 kN
thrust capacity, 10 and
15 cm2 cones
Coiled rod
(on full size rods)
2000PenfeldIFREMER, FranceSelf-powered by lead
batteries. Can penetrate
to 30 m
Seabed drilling
Test and sampling rigs
2001PRODBenthic, AustraliaRods stored in carousel
on sea bottom
Combined rig1997SearobinFugro, The NetherlandsCan take sample to 1 m
and perform 10 cm2 CPT to 2
m in one deployment
2001GeoceptorGeo, DenmarkCan take sample to 6 m
and perform 10 cm2 CPT to
10 m in one deployment
Minirigs1992SeascoutFugro, The NetherlandsCoiled rod, wt < 1 ton,
1 cm2 cone penetrometer
1999MiniCPTGregg Drilling &
Testing Inc., California, USA
Coiled rod; 2 cm2 cones
up to 12 m penetration
2000NeptuneDATEM, UKCoiled rod, 5 and 10 cm2
cones; up to 20 m penetration
ROV mounted1983Mini WisonFugro, The Netherlands1 m stroke, 5 cm2 cone
penetrometer
Table 2. Current international advanced deepwater CPT.
Production CompaniesType of TouchEquipment ModelMax Penetration
Reached Depth (m)
A.P. van den Berg Corp., Heerenveen, The NetherlandsDownhole CPTWison-APB downhole mode deep-sea CPT system3000
A.P. van den Berg Corp., Heerenveen, The NetherlandsSeabed CPTRoson seabed mode deep-sea CPT system for the seabed4000
Geomil Corp., Moordrecht, The NetherlandsSeabed CPTMANTA seabed mode CPT system2000
Datem Corp., Sleaford, UKSeabed CPTNeptune 5000 Standard Marine CPT3000
Fugro Corp., Leidschendam, The NetherlandsSeabed CPTSEACALF seabed mode CPT system4000
Table 3. Calibration tank system statistics [55].
Calibration Tank (Inventor or Unit)Design TimeCalibration Tank TypeSoil Sample SizeBoundary Conditions
Diameter (m)Height (m)Radial BoundariesBottomTop
National Roads Australia1969Double wall0.760.91FlexibilityBeddingRigid
University of Florida, USA1971Double wall1.201.20FlexibilityBeddingRigid
Monash University, Australia1974Double wall1.201.80FlexibilityBeddingRigid
Norwegian Institute of Geotechnical Engineering1979Double wall1.201.50FlexibilityBeddingJust
Italian Electricity Commission1982Double wall1.201.50FlexibilityBeddingRigid
1982Double wall0.601.00FlexibilityBeddingRigid
ISMES Laboratory, Italy1986Double wall1.201.50FlexibilityBeddingRigid
University of California, USA1975Single wall0.760.80FlexibilityRigidRigid
University of Texas, USA1984Single wallSquare: 2.1 × 2.1 × 2.1FlexibilityFlexibilityFlexibility
1993Single wall0.601.20FlexibilityBeddingRigid
2008Single wall1.372.13FlexibilityBeddingRigid
University of Houston, USA1991Single wall0.762.54FlexibilityBeddingBedding
North Carolina State University, USA1991Single wall0.941.00FlexibilityRigidRigid
University of Louisiana, USA1992Double wall0.550.80FlexibilityFlexibilityRigid
Gouda Group Canada1991Single wall1.401.00FlexibilityRigidBedding
Virginia Tech, USA1987Single wall1.501.50FlexibilityRigidRigid
University of Grenoble, France1991Single wall1.201.50FlexibilityBeddingBedding
University of Oxford, UK1988Single wall0.901.10FlexibilityBeddingRigid
University of Tokyo, Japan1988Single wall0.901.10FlexibilityRigidRigid
Clarkson University, USA2006Single wall0.510.76FlexibilityRigidRigid
University of Sheffield, UK1991Single wall0.791.00FlexibilityRigidFlexibility
2003Single wall0.400.42FlexibilityBeddingRigid
Cornell University, USA1991Single wall2.102.90FlexibilityRigidRigid
American Waterways Experiment Station1991Single wall0.80–3.000.6 × XFlexibilityRigidRigid
National Chiao Tung University, Taiwan1991Double wall0.510.76FlexibilityRigidRigid
1998Single wall0.791.60FlexibilityRigidBedding
1988Double wall0.200.36FlexibilityBeddingRigid
Osaka University, Japan2008Double wall1.401.45FlexibilityRigidBedding
Technical University of Gdansk, Poland2006Double wall0.531.00FlexibilityBeddingRigid
University of Oklahoma, USA2002Single wall0.610.45–1.42FlexibilityBeddingRigid
University of New South Wales, Australia2010Single wall0.460.80FlexibilityBeddingRigid
Table 4. Four boundary conditions for the calibration tank test [57].
Boundary ConditionsVerticalHorizontal
Stress/σvStrain/εvStress/σhStrain/εh
BC1Constant--Constant--
BC2--0--0
BC3Constant----0
BC4--0Constant--
Table 5. Empirical values of resistance factors NT-bar obtained by the University of Western Australia and Southeast University (in this paper) at different sites.
LocationNT-bar-DSS,
Average
NT-bar-DSS,
Rang
NT-bar-FVT,
Average
Burswood, Australia11.9 b-10.9 b
Onsoy, Norway11.9 a, 12.5 b11.0–13.4 a11.6 b
Coastal Australia12.4 b-11.3 b
West African Coastal Region12.2 b-12.7 b
Watchet Bay, Canada13.0 a--
Wenzhou, China (this paper)--12.0 c
Note: DSS is direct simple shear; FVT is field vane shear test; empirical values are calculated from the penetration resistance of the T-bar penetration test and the results of the corresponding direct test method; a Norwegian Geotechnical Institute tests: Lunne et al. (2005) [69]; b University of Western Australia tests: Randolph (2004) [18]; c Southeast University tests: The authors (in this paper).
Disclaimer/Publisher’s Note: The statements, opinions and data contained in all publications are solely those of the individual author(s) and contributor(s) and not of MDPI and/or the editor(s). MDPI and/or the editor(s) disclaim responsibility for any injury to people or property resulting from any ideas, methods, instructions or products referred to in the content.

