Article

Influence of Horizontal Loading in Changing the Ultimate Uplift Bearing Capacity of Monopile Foundation of Offshore Wind Turbine

1
Shandong Zhi Yuan Electric Power Design &Consulting Institute Co. Ltd., Jinan 250000, China
2
Zijin School of Geology and Mining, Fuzhou University, Fuzhou 350000, China
3
State Grid Shandong Electric Power Company Economic and Technological Research Institute, Jinan 250000, China
4
College of Civil Engineering, Qingdao University of Technology, Tsingtao 266000, China
*
Author to whom correspondence should be addressed.
J. Mar. Sci. Eng. 2023, 11(6), 1150; https://doi.org/10.3390/jmse11061150
Submission received: 6 May 2023 / Revised: 26 May 2023 / Accepted: 29 May 2023 / Published: 31 May 2023
(This article belongs to the Special Issue Geological Environment and Engineering in Coastal Region)

Abstract

:
Throughout their lifespan, monopile foundations supporting offshore wind turbines inevitably experience horizontal loads from waves, winds, and currents, resulting in cumulative deformation. It has been believed that deformation caused by horizontal loading weakens the interaction between the pile and the soil, leading to a reduction in the ultimate uplift bearing capacity of the pile foundation. However, there is a scarcity of literature investigating this issue, particularly regarding monopiles used in offshore wind turbine installations. Therefore, this study aims to explore the impact of horizontal cyclic loads on the ultimate uplift bearing capacity of monopile, focusing on the pile–soil interaction. To achieve this, a series of 1 g model tests were conducted on a rigid model pile embedded in silt with varying relative compaction. The test results indicate that the ultimate uplift bearing capacity of the pile is significantly diminished after experiencing horizontal cyclic loading, and the extent of reduction is closely linked to the amplitude of the horizontal deformation. A semi-empirical model is developed to predict the ultimate uplift bearing capacity of the pile foundation following horizontal cyclic loading. The key findings of this study are as follows: (1) The earth pressure in the active zone gradually decreases with an increasing number of cycles, while the earth pressure in the passive zone experiences a slight increase under horizontal cyclic loading. (2) The position of the pile rotation center under horizontal cyclic loading is approximately 0.84 times the depth at which the pile is buried, and this relationship appears to be independent of soil density and cyclic load ratio. (3) The variation of earth pressure corresponding to the horizontal deformation of the pile in the active zone can be divided into three phases: a rapid decline phase, a slow decline phase, and a stable phase. (4) The reduction in the ultimate uplift capacity is influenced by the cyclic ratio and number of cycles but does not appear to have a significant relationship with soil density.

1. Introduction

Based on market predictions, it is anticipated that the offshore wind industry will witness substantial growth, with an expected addition of 17 GW of grid-connected power by 2023, marking a 77% increase compared to 2022 [1]. During this period, China, the UK, and the Netherlands are expected to emerge as the leading growth markets. In China, the grid-connected capacity of offshore wind power had reached 10.87 GW by 2020, and it is projected to further expand to 50.14 GW by 2025 [2], as depicted in Figure 1. As of February 2023, China had already surpassed 30 GW of installed capacity for offshore wind power [3], with offshore wind power facilities established in nine provinces. This highlights the significant global growth projected for the offshore wind industry.
The monopile, depicted in Figure 2, is the most commonly used basic foundation form in established offshore wind farms worldwide. These wind farms typically have a design life of 20 years, and in order to ensure sustainable development, upgrades may be required, including the extraction and reuse of the original monopile foundation. Throughout its operational lifespan, the monopile for offshore wind turbines is inevitably subjected to horizontal loads from waves, winds, and currents, resulting in cumulative deformation. Horizontal cyclic loading leads to changes in the soil state around the pile, rendering the pile foundation more susceptible to uplift, as illustrated in Figure 3. Therefore, it is essential to investigate the ultimate uplift bearing capacity of monopiles after experiencing horizontal cyclic loading to ensure their long-term safety and stability. In the design process, the horizontal and vertical bearing capacities of monopiles are crucial factors to consider. Numerous studies have been conducted on the bearing capacity of monopile foundations.
LeBlanc et al. [4] conducted a series of horizontal cyclic loading tests on rigid piles embedded in dry sand, with relative compactness values of 4% and 38%. The authors noted that the cumulative deformation of the pile foundation continued to increase under horizontal cyclic loading, which exhibited a linear correlation with the cyclic load ratio, soil compactness, and the number of cycles. Similar studies were conducted by Cuéllar et al. [5], Nicolai and Ibsen [6], Chen et al. [7], Takahashi et al. [8], and Wang Y et al. [9]. These papers studied the development of cumulative deformation in pile foundations under horizontal cyclic load, but they did not investigate the changes in soil resistance around the pile or the variations in vertical bearing capacity.
Mu et al. [10] performed a series of centrifuge tests on a single pile with a prototype diameter of 6 m and a length of 50 m to investigate the effects of vertical loading on horizontal responses. Simultaneous vertical and lateral loads were applied, revealing that the vertical load reduced the lateral displacement of the single pile [11]. Similar experiments were conducted by Lee et al. [12], Jain et al. [13], Choo et al. [14], and Lee et al. [15,16] to examine the influence of vertical load on the horizontal behavior of piles. The findings were consistent with those of Mu et al. [10,11]. However, these studies did not address the impact of lateral load on the vertical behavior of pile.
Rao and Prasad [17] conducted a series of model tests on two model M.S. pipe piles with diameters of 13.8 mm and 18.0 mm in clayey soils to investigate the effect of lateral cyclic loading (within 500 cycles and cyclic loading levels of 30–75%) on the vertical capacity of pile anchors. The authors noted that the pullout capacity of the pile is affected by lateral cyclic loading, with the reduction in uplift capacity primarily dependent on the pile’s deflection during lateral cyclic loading. Additionally, Peng Y. et al. [18] employed numerical simulations to study the influences of horizontal load on the vertical uplift capacity of branch piles, revealing significant changes in the vertical bearing mechanism of branch piles under horizontal load. While these studies provide valuable insights, they are not directly applicable to monopile foundations, and the number of cycles examined is relatively small (around 500 cycles). Furthermore, there is currently no method available to predict the effect of horizontal load on the vertical ultimate capacity of pile.
The preceding research findings have provided a basis for the present investigation. However, there is a scarcity of studies quantifying the changes in ultimate uplift bearing capacity resulting from alterations in pile–soil interaction after horizontal cyclic loading, particularly concerning monopile. Therefore, it is imperative to examine the variations in the ultimate uplift bearing capacity of monopiles following horizontal cyclic loading in order to address these concerns.
The ultimate uplift bearing capacity of a monopile foundation primarily comprises the weight of the pile and the frictional resistance at the pile–soil interface. The side friction between the pile shaft and the soil depends on the interface’s roughness and the radial earth pressure. Among these factors, the radial earth pressure is the most influential parameter for a specific type of soil and pile. Hence, studying the interaction between the soil surrounding the piles under horizontal cyclic load is crucial for comprehending the changes in the ultimate uplift bearing capacity. In this study, from the perspective of horizontal pile–soil interaction, we aim to elucidate the mechanism by which the ultimate uplift bearing capacity weakens and establish a model for the weakening of vertical bearing capacity under horizontal cyclic load.

2. Model Tests

Currently, monopile foundations for offshore wind turbines are commonly installed at a depth of 4–6 times the pile diameter. According to Leblanc et al. [4], these can be classified as rigid pile foundations. Shallow-buried rigid monopile foundations are suitable for offshore wind farms in China, where the soils primarily consist of dense sand, silt, and hard clay. Leblanc et al. [4] highlighted that the load response of structures in sandy soil is mainly governed by the friction between sand particles, which is influenced by the isotropic stress level. Laboratory model tests yield lower shear stress compared to field tests due to lower stress levels and larger internal friction angles. This issue can be addressed by employing an appropriate scale. Building on these findings, Leblanc et al. [4] proposed a set of dimensionless parameters for rigid pile foundations embedded in non-cohesive soil. These parameters facilitate scaling the results obtained from model tests conducted under 1 g conditions, enabling the analysis of the horizontal load response of monopile foundations for offshore wind turbines in real field situations.
To conduct model tests on a monopile for an offshore wind turbine with a 5 m diameter, 30 m installed depth, and 60 m pile length, a scale of 1:30.3 was selected based on the dimensionless parameters proposed by Leblanc et al. [4]. According to these parameters, the diameter of the model pile was determined to be 0.165 m, with a wall thickness of 3 mm. The model pile had a length of 1.98 m and an installed depth of 0.99 m [19]. The scaled dimensions and prototype dimensions are presented in Table 1.
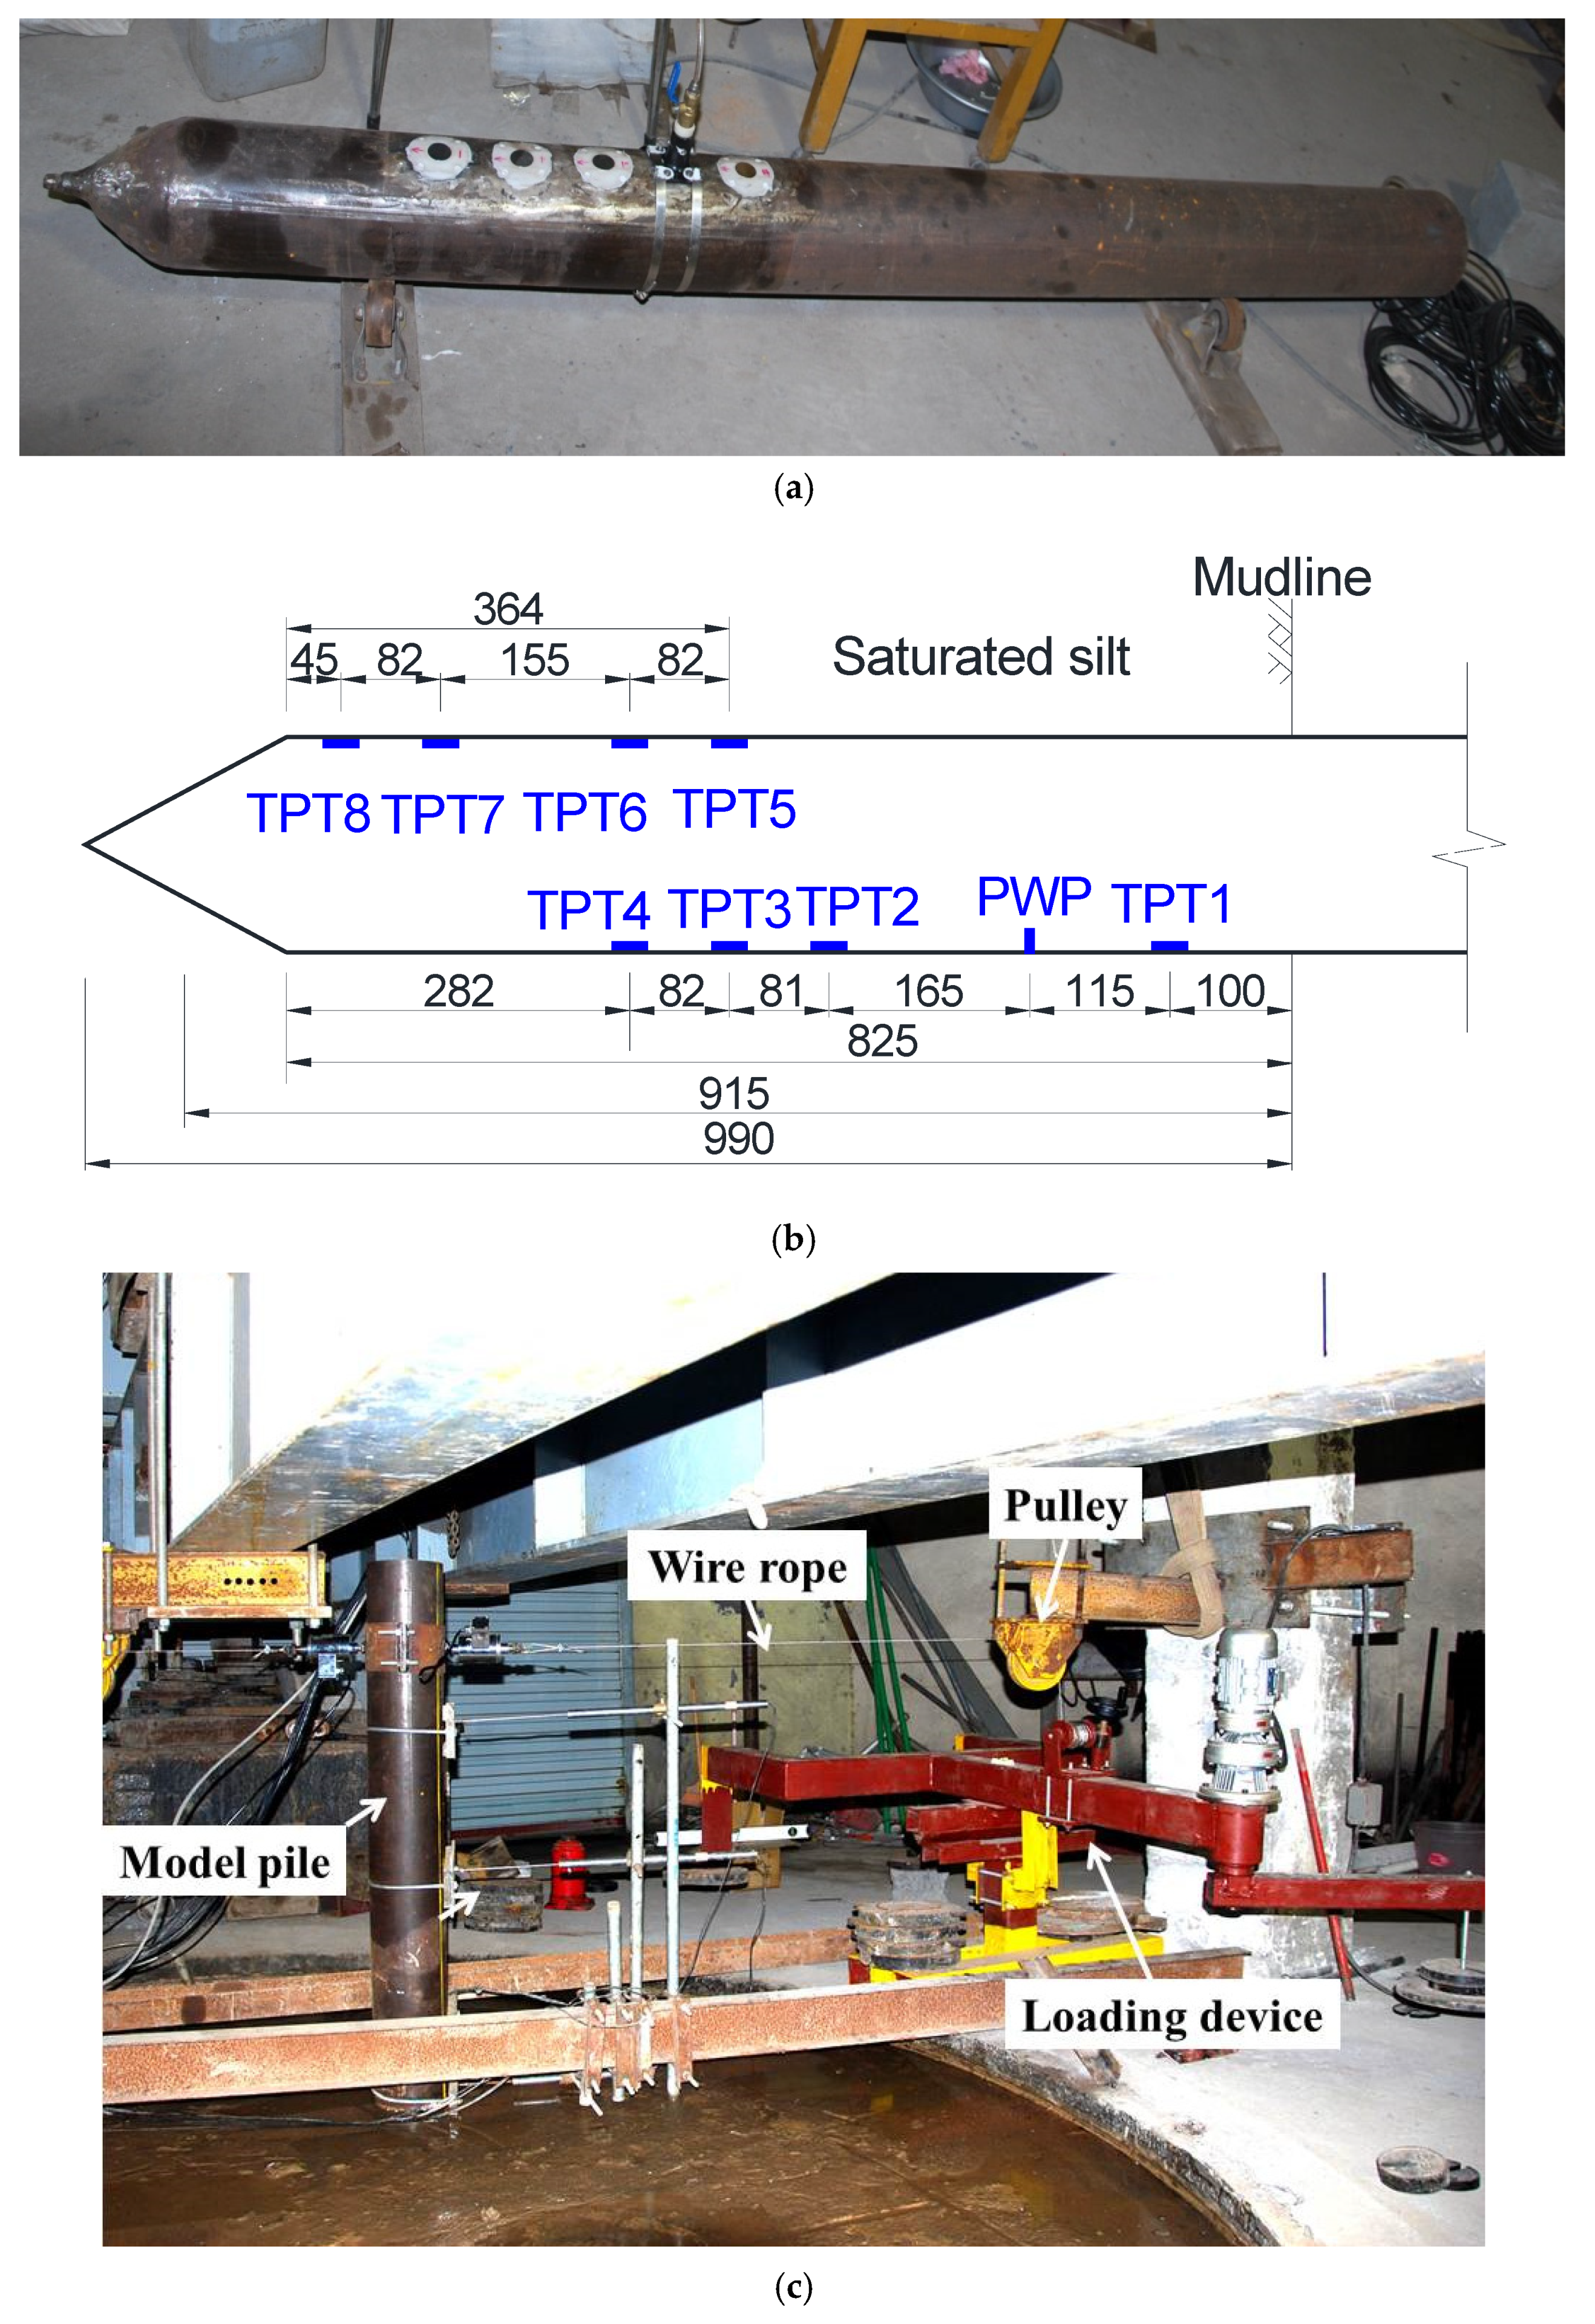
The model pile was fabricated using a closed-end slotted steel pipe. To gather data on the earth pressure, a total of eight total pressure transducers (TPTs) were installed on the model pile shaft at various depths: 100 mm, 380 mm, 460 mm, 540 mm, 695 mm, and 777 mm below the mud surface. Additionally, a pore water pressure sensor was positioned at a depth of 215 mm beneath the mud surface [19]. These installation locations are illustrated in Figure 4a,b.
In the model tests, a cylindrical trench measuring 3.7 m in diameter and 1.7 m in depth was employed. The soil mass had an overall depth of 1.35 m [20] and was constructed by sequentially filling and compacting soil layers, each with a thickness of 5 cm. The soil utilized for the foundation was sourced from Zhejiang province and identified as silt [20]. The fundamental physical parameters of the silt are presented in Table 2.
The filling process in the model tests was controlled based on dry density, using two different types of soil with varying degrees of compactness. The controlled dry densities were 1.5 g/cm³ and 1.45 g/cm³, corresponding to relative densities of 0.88 and 0.7, respectively. As an illustration, for the soil with a relative compaction of 0.88, the dry density (ρd) was maintained at 1.50 g/cm³ during the filling procedure. Prior to filling, the natural water silt content (w) was measured as 13%. The density of each soil layer after compaction was obtained using the equation ρ = ρd(1 + w). Consequently, the density of the soil after filling and compaction reached 1.73 g/cm³. The ring knife method [20] was employed to measure the soil density at three different points within each filling layer. If the average density of the three measured points met the specified requirements and the density difference between any two points was less than 5%, the soil filling for that layer was deemed satisfactory, and the subsequent layer was then filled. The essential parameters of the re-molded soil are provided in Table 3.
Once the filling process was completed, the foundation underwent saturation. An external water tank was connected to the pipe network at the bottom of the cylindrical trench. The saturation rate was controlled to be approximately 0.4 m³/day by adjusting the height of the water tank. The saturation process continued until the TDR (time domain reflectometry) testing technology [21] indicated a saturation level above 0.95. This entire saturation process took approximately 15 days. The model pile was installed in the soil using the static pressure sinking pile method. A sinusoidal cycle loading equipment [7] with a loading period of 15 s was utilized to apply the horizontal cyclic load, while vertical load was applied using jacks. The loading point was positioned 6D above the mud surface. During the loading process, displacement, total earth pressure, pore water pressure, and load were monitored by LVDT (Schaevitz sensors located at 1D, 3D, and 6D above the mud line, as shown in Figure 4c), TPT, PWP, and Load cell, respectively, as depicted in Figure 4. All sensors were calibrated to ensure the accuracy of the monitoring data. The voltage signals from all sensors were collected by the data acquisition instrument [20]. In the vertical loading experiment, the net ultimate uplift bearing capacities of the pile were predicted in advance using the method recommended by Xu and Chen [22]. The estimated ultimate uplift bearing capacity of the pile in soil with a relative compaction of 0.88 was 1638.5 N, and in soil with a relative compaction of 0.7, it was 954.77 N. Taking into account the weight of the model pile (37.8 kg), the ultimate uplift bearing capacity of the pile was calculated to be 2016.5 N and 1332.77 N, respectively. In the uplift tests, a graded load of 1/10 (approximately 200 N) of the ultimate load was applied, and the next level of load was applied when the pile top deformation was stable at the current load level.
Ten groups of model tests were conducted, as summarized in Table 4. The cyclic loading was unidirectional with a cyclic load ratio ζc (The ratio of minimum to maximum load in a cycle) of 0, as defined by Leblanc et al. [4]. The cyclic load ratio ζb, representing the ratio of the maximum load in a cycle to the horizontal ultimate bearing capacity under static load, was set at 0.4, 0.3, and 0.2 for different tests. The ultimate bearing capacity of the pile under horizontal load was determined using the failure criterion proposed by Cuéllar et al. [5], which defines the load causing the pile top deformation to reach 0.1D. Based on the results of Tests 9 and 10, the ultimate bearing capacity of the pile under monotonic load was found to be 777 N and 443 N, respectively, in silt with relative compactions of 0.88 and 0.7. Additionally, the cyclic load ratios (ζb) for Tests 1–6 were calculated as 0.38, 0.29, 0.24, 0.44, 0.33, and 0.26, respectively, based on the peak values of cyclic load monitored during the tests. After the cyclic loading test, the pile uplift test was conducted following a 24 h rest period.

3. Test Results

In Test 1, Figure 5a depicts the temporal changes in the horizontal cyclic load. It is evident that the applied horizontal load exhibits a sinusoidal variation over time, with a consistent peak value of approximately 300 N. Figure 5b illustrates several load-displacement hysteresis loops observed in Test 1. In the initial cycles, the hysteresis loops appear relatively scattered, and the rate of overlap between hysteresis loops increases with the growing number of cycles. This observation suggests that the deformation induced by cyclic load progresses relatively rapidly in the initial stages.

3.1. Accumulative Deformation

Figure 6 presents the relationship between the cumulative rotational angle θN of the pile and the cyclic load number N observed in Tests 1–6. The graph indicates that the cumulative rotational angle experiences rapid development in the initial cycles and then increases gradually as the number of cycles increases. For instance, in Test 1, the ratio of θN = 20N = 5000 is 0.51, demonstrating the significance of the first several cycles in the accumulation of rotational angle. Notably, a linear correlation exists between the cumulative rotational angle θN and the logarithm of the cyclic number N. This relationship can be mathematically expressed as follows:
θN =ɑlog(N)
The value of ɑ is obtained by linear fitting according to the results of Tests 1–6, shown in Table 5.
Figure 7 displays the relationship between the value of ɑ and the cyclic load ratio ζb as well as the relative compaction of the soil. The graph reveals the following trends: (1) The value of α exhibits a positive correlation with the cyclic load ratio ζb, with ɑ increasing as ζb increases. However, the rate of growth diminishes with higher ζb values. (2) There is no significant relationship between the value of ɑ and the relative compaction of the soil Dr. Approximate interpolation from Table 5 can be utilized to determine the ɑ values corresponding to various cyclic load ratios.

3.2. Pile–Soil Interaction

Due to their shallow foundation depth, short pile length, and high bending stiffness, offshore monopile foundations are commonly regarded as rigid piles. When subjected to horizontal loads, the pile body experiences minimal deflection deformation, and the deformation mechanism involves the rotation of the pile body around a specific point known as the rotation center on the pile axis. The forward direction of the load corresponds to the passive zone, located above the rotation center in front of the pile, while the active zone is situated below the rotation center on the opposite side.
Figure 8 illustrates the variations in monitored earth pressure with cyclic load in Test 1. To facilitate viewing, the arrangement of the TPTs monitoring data on the vertical axis aligns with their respective positions on the pile body. The figure clearly indicates that the values of TPT1–TPT4 increase with the applied load, indicating their positions above the rotation center. Conversely, the values of TPT5–TPT7 decrease with the load, indicating their location in the active zone above the rotation center. The values of TPT8 exhibit minimal changes with the load, suggesting that the rotation center is in proximity to TPT8.
TPT7 and TPT8 are positioned at depths of 0.7 m and 0.78 m below the mud surface, respectively. Figure 9 displays the variations in earth pressure measured by TPT7 and TPT8 under cyclic load. To enhance clarity, TPT7 and TPT8 are arranged on the left and right sides of the vertical axis, respectively. The horizontal axis represents the applied cyclic load, while the vertical axis represents the measured earth pressures. The figure clearly illustrates that the pressure recorded by TPT7 decreases as the cyclic load increases, indicating that the rotation center is located below TPT7. In contrast, TPT8 does not exhibit a clear trend in response to increasing or decreasing cyclic load, suggesting its proximity to the rotation center, which is approximately 0.84 times the embedded length.
Figure 10 illustrates the peak and valley values of earth pressure recorded by the earth pressure sensors during cyclic loading in Test 2. The cyclic load applied is sinusoidal, and the earth pressures exhibit similar behavior. The peak value of the earth pressure corresponds to the maximum load reached during a cycle, while the valley value corresponds to the minimum load during a cycle. The results indicate that TPT1–TPT4 are situated in the passive zone of the soil mass, as their peak values exceed their valley values. In contrast, TPT5–TPT8 are located in the active zone, as their peak values are lower than or equal to their valley values. Figure 10a demonstrates a slight increase in the peak values of earth pressure in the passive zone as the cyclic load number increases. On the other hand, Figure 10b reveals an initial sharp decrease in earth pressure followed by a gradual decrease in the rate of change. This phenomenon occurs because, as the cyclic load number increases, deformation gradually occurs, causing the pile to move away from the soil. Consequently, despite the constant maximum applied load, the maximum earth pressure gradually decreases.
In Test 9, a maximum horizontal load of 1522 N, which was twice the calculated limit horizontal bearing capacity, was applied, resulting in a maximum horizontal displacement at the mud surface of 42.6 mm. Figure 11 presents the changes in measured earth pressures during the loading and unloading process of Test 9. The figure indicates that TPT1–TPT4, located in the passive zone, experience an increase in earth pressures as the load is applied. After the unloading process is completed, the earth pressures show a slight increase compared to the initial values, ranging from 3.1% to 6.7%. This can be attributed to soil compaction in front of the pile during loading, which leads to changes in soil density and an increase in earth pressure. These findings align with the observations made during the cyclic loading test.
Figure 12 showcases the variations in earth pressures measured by TPT5 and TPT6 in Test 9 and Test 10. The results demonstrate that the changes in earth pressures with load in different tests can be categorized into three phases: Phase I corresponds to the rapid decline stage, where the earth pressure rapidly decreases as the load increases. Phase II represents the slow decline stage, characterized by a gradual decrease in earth pressure with load at a slower rate. Phase III signifies the stable stage, where the earth pressures no longer decrease significantly and approach a stable value. In Test 9, this stable value is measured at 6.12 kPa, while in Test 10, it is recorded as 6.05 kPa. TPT6 consistently exhibits slightly higher values than TPT5 in each stage. This can be attributed to its deeper burial depth, which results in less deformation and a slower development curve, as depicted in Figure 8. The interaction between the pile and soil is presumed to conclude between Phase III and Phase II, with no effective earth pressure acting on the pile. However, the measured test data is not zero, which could be attributed to the presence of water filling the gap between the pile and the soil. During the tests, the water level is maintained at approximately 0.05 m above the mud surface. The theoretical water pressure calculated for TPT5 is 5.1 kPa, while for TPT6, it is 5.93 kPa. These calculated values align with the measured results.
The earth pressures measured in the tests corresponded to total earth pressures. To determine the effective earth pressure, the theoretical water pressure was subtracted from the measured total pressure. Figure 13 presents the ratio of effective earth pressure (σ′) to initial effective earth pressure (σ0′) for TPT5 and TPT6 in Test 9 and Test 10 as a function of pile displacement (yz). The effective earth pressure approaches zero when yz exceeds 0.004 m. It is assumed that complete separation between the pile and soil occurs when the relative distance between them exceeds 0.004 m at any depth. Based on pile deformation, the earth pressure can be predicted for different deformations. The relationship between σzN′/σz0′ (where σzN′ represents the effective earth pressure at depth z after N cycles, and σz0′ is the initial effective earth pressure at depth z), and the deformation yz can be more accurately described by the following expression obtained through data fitting:
σ z N σ z 0 = 1 2 ( 1 6 7700 y z + 1 10 360 y z )

3.3. Ultimate Uplift Bearing Capacity

Figure 14 displays the Q-s curves obtained from the eight groups of uplift tests. The sharp changes observed in the Q-s curves of the pile can be attributed to the rigidity of the model pile and its shallow burial depth. According to the code for pile foundation in harbor engineering [23], the load corresponding to the initial point of the steep change in the Q-s curve is considered as the ultimate uplift bearing capacity. In Figure 10, it can be observed that the measured ultimate uplift bearing capacity of the pile in Test 7 is 1.44 times (2910.8/2016.5 = 1.44) the calculated value, while in Test 8, it is 1.75 times (2338.32/1332.78 = 1.75) the calculated value. This difference is primarily attributed to the significant soil-squeezing effect of the driven pile, resulting in a higher measured earth pressure compared to the calculated value. Furthermore, the ultimate uplift bearing capacity of the pile subjected to cyclic load experiences a significant reduction, with the reduction becoming more pronounced as the cyclic load and number of cycles increase.
Figure 15 presents the relationship between the cyclic load ratio (ζb) and the Qun/Qu value, where Qun represents the ultimate uplift bearing capacity of the pile after N cycles of horizontal cyclic load, and Qu is the ultimate uplift bearing capacity of the pile without horizontal load. Test 1, subjected to 10,000 cycles with a cyclic load ratio of 0.38, experienced an 18.2% decrease in its ultimate uplift bearing capacity. Similarly, Test 4, with a cyclic load ratio of 0.44 and 5000 cycles, demonstrated an 18.8% reduction in its ultimate uplift bearing capacity.
From these results, it can be concluded that, for the same number of cycles, a larger cyclic load ratio leads to a greater reduction in ultimate uplift bearing capacity. Moreover, as the number of cycles increases, the ultimate uplift bearing capacity decreases further. Interestingly, there appears to be no significant relationship between the amplitude of the horizontal cyclic load and soil compaction in terms of its influence on the ultimate uplift bearing capacity. These findings differ from those of Rao and Prasad [17], which suggest that the pull-out bearing capacity does not weaken when the cyclic load ratio is below 0.4. The discrepancy may be attributed to Rao and Prasad [17] tests being conducted in clayey soil with a smaller number of cycles (less than 500).

4. Prediction Model of Ultimate Uplift Bearing Capacity of the Monopile after Horizontal Cyclic Load

Figure 16 presents a schematic diagram depicting the load, stresses, and deformation of a rigid pile under horizontal loading. Initially, in homogeneous soil, the radial effective earth pressure σ0′ is uniformly distributed along the pile diameter, as illustrated in Figure 16a. This can be estimated using the equation σ0= z, where K is the lateral earth pressure coefficient, γ′ (kN/m3) is the effective unit weight, and z (m) is the depth.
After undergoing N cycles of lateral cyclic load, the ultimate uplift bearing capacity of the pile primarily decreases due to increasing pile deformation with the number of cycles. This deformation leads to the detachment of the pile–soil interface in some areas, resulting in a reduction of side friction resistance to zero. Additionally, the interaction between the pile and soil weakens in other areas, leading to a decrease in lateral friction resistance. By combining the proposed deformation and earth pressure weakening law, a distribution model of earth pressure after horizontal deformation can be derived. This model enables the prediction of the ultimate uplift bearing capacity of the pile foundation after horizontal deformation.
As depicted in Figure 16b, when subjected to horizontal load, the pile rotates around the rotational center. On the opposite side of the loading direction, from the mud surface to the rotational center of the pile, the relative deformation between the pile and soil changes from maximum to zero. From the rotational center to the pile tip, the relative deformation gradually increases. It has been previously discussed that when the relative deformation exceeds 4 mm, pile–soil detachment occurs. However, in reality, after horizontal deformation of the pile, the soil in the active zone deforms to a certain extent (ysoil) towards the pile due to stress release. This leads to re-contact between the pile and soil, forming a soil pressure weakening region, as shown in Figure 16b. Conversely, in the passive zone, the pile moves towards the soil, resulting in soil compression. Based on the analysis of measured and observed earth pressures around the pile, the pile–soil interaction after horizontal deformation can be divided into three zones: Zone I: The detachment region located near the mud surface depth z0, where the pile–soil interface has undergone detachment, and the side friction resistance becomes zero. Zone II: The weakening region situated beneath Zone I, where the pile and soil are not completely separated, but their interaction force is weakened, leading to a reduction in lateral friction resistance. Zone III: The maintenance region, where the earth pressure in the passive zone slightly increases compared to the initial condition after unloading, but the change is not significant. For conservative considerations, the earth pressure in the passive zone is assumed to remain unchanged with deformation.
Figure 17 presents the distribution pattern of radial earth pressure in each region. In the initial state, as depicted in Figure 17a, the radial earth pressure around the pile is uniformly distributed along the circumference of the pile. However, after experiencing lateral deformation, the earth pressure decreases in the active zone and slightly increases in the passive zone. As shown in Figure 17b, in the weakening region, earth pressure decreases from σ 0 to σ z . In the detachment region, earth pressure decreases from σ 0 to 0, shown in Figure 17c.
However, in practical scenarios, the radial earth pressure around the pile in the active zone is not uniformly distributed along the pile circumference. It is observed that the radial earth pressure weakens significantly along the loading direction and gradually decreases towards both sides. This is attributed to the larger deformation occurring in the loading direction and the diminishing weakening effect as the transition is made from the active zone to the passive zone. To simplify the model, it assumes that the earth pressure in the weakened area of the active zone remains evenly distributed along the pile circumference after horizontal deflection, as depicted in Figure 17b. In the detachment region, although the earth pressure is not exactly zero during the transition from the active zone to the passive zone, for simplicity, it is assumed to be zero, as shown in Figure 17c. As discussed in Section 2, the earth pressure in the passive zone slightly increases. To ensure conservatism and simplicity, the earth pressure in the passive zone is assumed to be uniformly distributed along the pile circumference, similar to the initial state.
The calculation of the ultimate pullout capacity Tu for pile foundations in non-cohesive soil follows the guidelines provided by API [24].
T u = G + π D f d z
where G represents the pile weight (kN/m³), D is the diameter of the pile (m), z is the depth (m), and f denotes the unit lateral friction resistance (kPa). In the case of non-cohesive soil, the calculation can be performed using the following formula:
f = K p 0 tan δ
p 0 = γ z
In Equation (4), the parameter K represents the ratio of horizontal normal effective stress to vertical normal effective stress. For open-ended pipe piles, it is recommended to assign a value of 0.8 for both tensile and compressive loads. In the case of plugged or end closed piles, the value of K can be set as 1.0. This guidance is provided in the API specification [24], which offers more comprehensive information on the topic.
δ (°) is the friction angle of pile–soil interface. In this test, the earth pressure measured by TPT is the total stress σ (kPa), to obtain effective lateral earth pressure σ 0 , the calculated water pressure is subtracted. The σ 0 equal to the K p 0 in Equation (4).
Equation (2) provides a method to estimate the deformation of a pile subjected to N cycles of horizontal load, considering a loading height of 6D and a buried depth of L. The pile deformation, represented by yz at a specific depth z, can be determined using the following equation:
y z = α L z tan ( a Log ( N ) π × 180 ° )
where α L is the depth of rotation center (m), L is the buried depth of pile foundation (m), and a is the dimensionless parameter, whose values can be referred to from Table 5. N is the cyclic number.
The initial effective earth pressure at a depth of z can be computed by:
σ z 0 = K γ z
By combining Equations (2) and (7), it is possible to calculate the weakened earth pressure in the active zone of the pile at a specific depth z, considering the deformation yz. The calculation can be performed using the following equation:
σ z N = 1 2 ( 1 6 7700 y z + 1 10 360 y z ) σ z 0 = 1 2 K γ z ( 1 6 7700 y z + 1 10 360 y z )
By integrating Equations (6) and (8), it is possible to determine the earth pressure at a specific depth z in the active zone after N cycles of cyclic loading. The calculation can be expressed as follows:
σ z N = 1 2 K γ z ( 1 6 7700 ( α L z tan ( a Log ( N ) π × 180 ° ) ) + 1 10 360 ( α L z tan ( a Log ( N ) π × 180 ° ) ) )
Based on Equations (4) and (9), the friction at the pile–soil interface at a specific depth z in the active zone after N cycles can be calculated as follows:
f a N = σ z N tan δ = 1 2 K γ z tan δ ( 1 6 7700 ( α L z tan ( aLog ( N ) π × 180 ° ) ) + 1 10 360 ( α L z tan ( a Log ( N ) π × 180 ° ) ) )
After N cycles, the pile–soil interface friction at depth z in the passive zone is as follows:
f p N = K γ z tan δ
In conclusion, by combining Equation (3), the ultimate uplift bearing capacity of the pile after undergoing N cycles of horizontal cyclic load can be represented as follows:
T u = G + 1 2 π D 0 L ( f a N + f p N ) d z
In this study, the model pile used has an effective buried depth of 0.825 m and a diameter of approximately 0.165 m. The center of rotation is assumed to be at 0.84 times the buried depth (0.84 L). The effect of the conical pile end on the bearing capacity is disregarded. The value was deduced that tan δ = 0.63 for Dr = 88% and tan δ = 0.56 for Dr = 70% using Equations (3) and (4), according to the measured results of the earth pressure K γ and ultimate uplift bearing capacity Tu.
Figure 18 demonstrates a sample calculation of the ultimate uplift bearing capacity of the pile subjected to horizontal cyclic load in Test 1. The calculation is performed for various cyclic numbers (N = 0, 10, 100, 1000, and 10,000) using the proposed method, and the results are compared with the measured ultimate uplift capacities. The theoretical calculated values of earth pressure K γ and the effective measured values of earth pressure in this study were used in the calculations. The figure illustrates that the initial ultimate uplift bearing capacity estimated using theoretical earth pressure is significantly lower than the measured value. The calculated values of K, obtained through back-calculation, are 2.3 for Test 7 and 2.15 for Test 8. Conversely, calculations based on the measured earth pressure yield results that align more closely with the measured values. This disparity can be attributed to the compaction effect of soil during pile driving, which led to the measured earth pressure being twice that of the theoretically calculated value. The proposed model provides more accurate predictions of the trend in ultimate uplift bearing capacity with the number of cycles. At N = 10,000, the predicted value slightly underestimates the measured value, potentially due to the conservative assumptions incorporated in the model to facilitate the calculation process. Furthermore, as depicted in Figure 18, the reduction effect of horizontal cyclic load on the ultimate uplift capacity is most significant during the initial cycles and then progresses at a slower rate, reflecting the deformation behavior of the pile under cyclic load. This observation indicates that the reduction effect of horizontal cyclic load on the ultimate uplift capacity is closely associated with horizontal deformation.

5. Conclusions

Empirically, directly extracting a pile buried in dense soil is challenging. It is common practice to apply reciprocal horizontal pushing to induce a certain level of horizontal deformation, making the extraction process easier. This phenomenon occurs because the interaction between the pile and soil weakens due to horizontal deformation, resulting in a reduction in the pile’s ultimate uplift capacity. This study investigates the characteristics of the ultimate uplift bearing capacity of a rigid monopile in silt under horizontal cyclic load through 1 g model tests. It examines the behavior of pile–soil interaction under horizontal cyclic load and proposes a model to explain the relationship between earth pressure and pile–soil relative deformation. A distribution model of earth pressure around the pile after horizontal deformation is also proposed. Finally, a semi-empirical model is developed to predict the ultimate uplift bearing capacity of a pile under horizontal cyclic load, and its calculations demonstrate good agreement with experimental results. The main conclusions of this study are as follows:
  • The ultimate uplift bearing capacity of the pile is significantly reduced after horizontal cyclic loading, and this reduction is closely associated with the magnitude of horizontal deformation. For a cyclic ratio (ζb) of 0.38 and a cycle number of 10,000, the ultimate uplift bearing capacity is reduced by approximately 18.2%. This finding contradicts the results of Rao and Prasad [17], who suggest that the ultimate uplift bearing capacity does not weaken when the cyclic load ratio is below 0.4.
  • The larger the cyclic load ratio, the greater the reduction in the ultimate uplift bearing capacity. Additionally, the greater the number of cycles, the more the ultimate uplift bearing capacity decreases. Interestingly, there appears to be no clear relationship between the magnitude of horizontal cyclic load and soil compaction in terms of their influence on the ultimate uplift bearing capacity.
  • Under horizontal cyclic load, the earth pressure in the active zone gradually decreases with an increase in the number of cycles, while the earth pressure in the passive zone slightly increases.
  • The response of earth pressure around the pile in the active zone can be divided into three phases: rapid decline phase, slow decline phase, and stable phase.
  • After horizontal cyclic loading, the pile undergoes rotational deformation, and the interaction between the pile and soil can be divided into three regions along the pile: detachment region, weakening region, and maintaining zone.
  • The presented semi-empirical model for predicting the ultimate uplift bearing capacity of a monopile foundation under cyclic load effectively captures the variation in uplift capacity and demonstrates slight conservatism.
  • A linear relationship is observed between the cumulative rotational angle and the logarithm of the cyclic number. The position of the pile’s rotation center under horizontal cyclic load is approximately 0.84 times the buried depth. The applicability of the proposed model to field tests requires further validation due to the limitations of scale in the model tests. Moreover, future research could focus on the changes in the vertical compressive capacity of a pile after horizontal cyclic loading.

Author Contributions

Conceptualization, Y.-X.S. and Z.-P.W.; methodology, H.-Q.D. and B.-L.X.; validation, H.-Q.D. and Z.-P.W.; formal analysis, Z.-P.W.; investigation, Y.-XS.; resources, L.-Y.F.; data curation, Z.-F.Q.; writing—original draft preparation, Y.-X.S.; writing—review and editing, H.-Q.D. and Z.-P.W.; visualization, H.-Q.D.; supervision, Y.-X.S.; project administration, B.-L.X.; funding acquisition, Z.-F.Q. All authors have read and agreed to the published version of the manuscript.

Funding

This research was funded by “Natural Science Foundation of Shandong Province (ZR2021QE259)” and “Science and technology project of Shandong Zhiyuan Electric Power Design Consulting Institute Co., Ltd. (ZY-2022–01)”.

Institutional Review Board Statement

Not applicable.

Informed Consent Statement

Not applicable.

Data Availability Statement

Not applicable.

Conflicts of Interest

The authors declare no conflict of interest.

References

  1. WoodMac. Offshore Wind: Wood Mackenzie’s Predictions for 2023 Report. Available online: https://www.woodmac.com/ (accessed on 20 March 2023).
  2. Statistics on the Scale of Offshore Wind Power Development in China during the 14th Five-Year Plan. News. Available online: http://news.sohu.com/a/564655137_120407443 (accessed on 6 July 2022).
  3. Future Development Trend of China’s Offshore Wind Power Equipment. News. Available online: https://www.chinairn.com/hyzx/20230501/103620910.shtml (accessed on 1 May 2023).
  4. LeBlanc, C.; Houlsby, G.T.; Byrne, B.W. Response of stiff piles in sand to long-term cyclic lateral loading. Géotechnique 2010, 60, 79–90. [Google Scholar] [CrossRef]
  5. Cuéllar, P.; Georgi, S.; Baeßler, M.; Rücker, W. On the quasi-static granular convective flow and sand densification around pile foundations under cyclic lateral loading. Granul. Matter 2012, 14, 11–25. [Google Scholar] [CrossRef]
  6. Nicolai, G.; Ibsen, L.B. Small-Scale Testing of Cyclic Laterally Loaded Monopiles in Dense Saturated Sand. The Twenty-fourth International Ocean and Polar Engineering Conference. J. Ocean. Wind Energy 2014, 1, 240–245. [Google Scholar]
  7. Chen, R.P.; Sun, Y.X.; Zhu, B.; Guo, W.D. Lateral cyclic pile–soil interaction studies on a rigid model monopile. In Proceedings of the Institution of Civil Engineers—Geotechnical Engineering; Ice Publishing: London, UK, 2015; Volume 168, pp. 120–130. [Google Scholar]
  8. Takahashi, A.; Omura, N.; Kobayashi, T.; Kamata, Y.; Inagaki, S. Centrifuge model tests on large-diameter monopiles in dense sand subjected to two-way lateral cyclic loading in short-term. Soils Found. 2022, 62, 101148. [Google Scholar] [CrossRef]
  9. Wang, Y.; Zhu, M.X.; Gong, W.M.; Dai, G.-L.; Wu, J.-B.; Zhu, W.-B. Cyclic Lateral Responses of Monopiles Considering the Influence of PileSoil Relative Stiffness in Sand. China Ocean Eng. 2022, 36, 247–257. [Google Scholar] [CrossRef]
  10. Mu, L.; Kang, X.; Feng, K.; Huang, M.; Cao, J. Influence of vertical loads on lateral behaviour of monopoles in sand. Eur. J. Environ. Civ. Eng. 2018, 22, s286–s301. [Google Scholar] [CrossRef]
  11. Li, Q.; Prendergast, L.J.; Askarinejad, A.; Gavin, K. Influence of Vertical Loading on Behavior of Laterally Loaded Foundation Piles: A Review. J. Mar. Sci. Eng. 2020, 8, 1029. [Google Scholar] [CrossRef]
  12. Lee, J.; Prezzi, M.; Salgado, R. Experimental investigation of the combined load response of model piles driven in sand. Geotech. Test. J. 2011, 34, 103269. [Google Scholar]
  13. Jain, N.; Ranjan, G.; Ramasamy, G. Eect of vertical load on flexural behaviour of piles. Geotech. Eng. 1987, 18, 185–204. [Google Scholar]
  14. Choo, Y.W.; Kim, D.; Park, J.H.; Kwak, K.; Kim, J.H.; Kim, D.S. Lateral response of large-diameter monopoles for offshore wind turbines from centrifuge model tests. Geotech. Test. J. 2014, 37, 1–15. [Google Scholar] [CrossRef]
  15. Lee, J. Experimental Investigation of the Load Response of Model Piles in Sand. Ph.D. Thesis, Purdue University, West Lafayette, IN, USA, 2008. [Google Scholar]
  16. Lee, J.-T.; Prezzi, M.; Salgado, R. Influence of axial loads on the lateral capacity of instrumented steel model piles. Int. J. Pavement Res. Technol. 2013, 6, 80–85. [Google Scholar]
  17. Rao, S.N.; Prasad, Y. Uplift Behavior of Pile Anchors Subjected to Lateral Cyclic Loading. J. Geotech. Eng. 1993, 119, 786–790. [Google Scholar] [CrossRef]
  18. Peng, Y.; Peng, S.Q.; Zheng, W.F.; Sun, Z.M. Analysis on Influence of Horizontal Loads on Uplift Bearing Capacity of Pile. Chin. J. Undergr. Space Eng. 2018, 14, 702–709. [Google Scholar]
  19. Zhu, B.; Sun, Y.X.; Chen, R.P.; Guo, W.D. Experimental and Analytical Models of Laterally Loaded Rigid Monopiles with Hardening p–y Curves. J. Waterw. Port Coast. Ocean Eng. ASCE 2015, 141, 04015007. [Google Scholar] [CrossRef]
  20. Sun, Y.X. Experimental and Numerical Studies on a Laterally Loaded Monopile Foundation in Cohessionless Soils. Ph.D. Thesis, Zhejiang University, Hangzhou, China, 2016. [Google Scholar]
  21. Chen, R.P.; Xu, W.; Chen, Y.M. Measuring Dielectric Constant in Highly Conductive Soils Based on Surface Reflection Coefficients. J. Geotech. Geoenviron. Eng. ASCE. 2009, 135, 1883–1891. [Google Scholar] [CrossRef]
  22. Xu, H.; Chen, Z.C. Influence of sand density on axial uplift capacity for vertical piles. Spec. Struct. 1996, 13, 53–57. [Google Scholar]
  23. JTS 167-4-2012. Code for Pile Foundation of Harbor Engineering. People’s Communications Press: Beijing, China, 2012.
  24. API-RP-2A-WSD. Recommended Practice for Planning, Designing and Constructing Fixed Offshore Platforms—Working Stress Design, RP 2A-WSD, 21st ed.; American Petroleum Institute: Washington, DC, USA, 2007. [Google Scholar]
Figure 1. China’s installed offshore wind power capacity (GW). (a) Grid-connected by 2020; (b) Planned capacity from 2020 to 2025.
Jmse 11 01150 g001
Figure 2. Monopile for a 150 MW offshore (intertidal) wind farm in Longyuan, Rudong, Jiangsu.
Jmse 11 01150 g002
Figure 3. Example of the influence of horizontal load on ultimate uplift bearing capacity.
Jmse 11 01150 g003
Figure 4. Test picture. (a) Photograph of mode pile; (b) Schematic diagram of mode pile (Unit: mm); (c) Photograph of cyclic loading test.
Jmse 11 01150 g004
Figure 5. Characteristic of cyclic load (Test 1) (a) A period of time history curve of cyclic load, (b) Load-displacement curve.
Jmse 11 01150 g005
Figure 6. Relationship between cumulative rotational angle and cyclic number.
Jmse 11 01150 g006
Figure 7. Relationship between the value of α and relative compaction and cyclic ratio ζb.
Jmse 11 01150 g007
Figure 8. Relationship between earth pressure and cyclic load (Test 1).
Jmse 11 01150 g008
Figure 9. Changes of values in TPT7 and TPT8 with cyclic load (a) Test1–Test3 (b) Test4–Test6.
Jmse 11 01150 g009
Figure 10. Change of peak and valley earth pressures with the number of cycles (Test 2) (a) TPT1–TPT4, (b) TPT5–TPT8.
Jmse 11 01150 g010
Figure 11. Relation between the earth pressure and load (Test 9).
Jmse 11 01150 g011
Figure 12. Relation between earth pressure and load (TPT 5 and TPT 6) (a) Test 9, (b) Test 10.
Jmse 11 01150 g012
Figure 13. Relation between earth pressure and displacement.
Jmse 11 01150 g013
Figure 14. The Q-s curve of the pile.
Jmse 11 01150 g014
Figure 15. Relationship between cyclic load ratio and Qun/Qu.
Jmse 11 01150 g015
Figure 16. Schematic diagram of resistance distribution mode of pile–soil after horizontal deformation.
Jmse 11 01150 g016
Figure 17. Schematic diagram of radial earth pressure distribution mode.
Jmse 11 01150 g017
Figure 18. Comparison between measured ultimate uplift capacities and calculated values.
Jmse 11 01150 g018
Table 1. The scaled dimensions vs. prototype dimensions.
ItemsScale (m)Prototype (m)
Diameter (D)0.1655
Buried depth (Ld)0.9930
Length (L)1.9860
Wall thickness (t)0.0030.09
Loading height (e)0.9930
Table 2. Basic physical parameters of the silt [20].
Physical ParametersValue
Specific gravity d2.69
Permeability coefficient k (m/s) (native state)4.3 × 10⁻⁶
Optimal water content wop0.18
Plastic limit wP0.23
Liquid limit wL0.32
Maximum dry density (g/cm³)1.54
Minimum dry density (g/cm³)1.24
Table 3. Tested soil parameters.
No.Relative Compaction
Dr
Saturated Unit
Weight (kN/m3)
Effective Internal Friction Angle (°)Effective Cohesion (kPa)
10.8819.041.40
20.718.737.30
Table 4. Experimental projects.
No.Relative
Compaction of Soil Dr
Cyclic Ratio ζbCyclic Number NVertical Load
Test 188%0.3810,000Pull-out
Test 288%0.295000Pull-out
Test 388%0.245000Pull-out
Test 470%0.445000Pull-out
Test 570%0.335000Pull-out
Test 670%0.265000Pull-out
Test 788%Pull-out
Test 870%Pull-out
Test 988%Monotonic
Test 1070%Monotonic
Table 5. Values of ɑ.
Dr = 0.88Dr = 0.7
ζbɑζbɑ
0.380.004850.440.00493
0.290.004150.330.00392
0.240.00150.260.00159
Disclaimer/Publisher’s Note: The statements, opinions and data contained in all publications are solely those of the individual author(s) and contributor(s) and not of MDPI and/or the editor(s). MDPI and/or the editor(s) disclaim responsibility for any injury to people or property resulting from any ideas, methods, instructions or products referred to in the content.

