1. Introduction
The increase in the oil price is normally related to increased consumption or reduced production. The reduced consumption in 2019, caused by the pandemic, caused the reduction in production in 2020. However, in 2021, global economic activities returned predominantly to their normal cycle, although some sectors (tourism, transport, automobile, Energy Equipment and Services, art) remain uncertain [
1]. The instabilities in the oil market included some unique situations, such as negative crude oil prices and the offshore storage usage of oil tankers (a so-called contango play) [
2]. According to BIMCO, the COVID-19 pandemic had a global impact, causing delays or cancellations of orders in the shipbuilding industry and the postponement of deliveries of new buildings. Contract activity in shipbuilding decreased by 55%. In both tanker segments, deliveries fell by half compared to 2019: 49% for crude oil tankers and 43% for product tankers [
3,
4].
Companies have planned to enter into a forward contract to sell crude oil at a higher price than the lower current price, and if, after deducting the cost of storing the crude oil during that period, they could introduce such as charter rent for the tanker and other expenses, it would be a good business model. According to the analysis, more than 100 of the world’s approximately 800 very large crude oil carriers (VLCCs) have been used for offshore oil storage [
5]. Oil exporting countries have found a storage formula to take advantage of this period following the historic decline in oil prices. Refineries, filling their tanks to the brim with cheap oil, sought more rental tankers. While tanker rental prices were rising, the value of the companies was increasing rapidly. The coronavirus pandemic, the most disruptive factor in centuries, changed the balances in the oil sector.
Business changes, new opportunities and challenges could redirect the shipping company’s policies, even for a short time, to be more orientated toward maintaining financial stability and profits, rather than maintaining the high safety status of the ships. However, maritime safety is governed by maritime safety policy instruments, which aim to maintain the risk level within an acceptable range. On the other hand, the mean of the risk acceptable range is still under intense discussion.
The individual risk criteria are based on the existing national standards and guidelines, as presented by Trbojević [
6,
7] and Cornwell [
8,
9]. The report states that a cost of 2 million GBP per avoided fatality is often used as a guide through which the risk reduction measures are “reasonably practicable” [
10]. The value of maritime fatalities avoided (VPF) in Norway has been calculated to be approximately 4 million USD; the generally accepted values range between 1 million and 15 million USD; the offshore industry reports a VPF of 3–15 million USD [
11].
EMSA reports that the number of fatalities among the crew on cargo ships is around 150 in the last five years. Oil tankers contribute less compared to other ship types, with an approximately 8% share [
12]. The earlier paper on safety assessment for crude oil tankers [
13] already presented that the individual risk for crews is below the limit levels in the maritime sector.
The results [
13] show that the risk of transporting oil tankers is particularly high from an environmental point of view, as there is a loss of containment, especially in coastal areas. The overall collective risk for the PLC (Potential Loss of Containment) exceeds the calculated high acceptable limit. The acceptable limit was calculated based on the large period spillage statistics and the economic value of oil transport. Considering the fact that the IMO regulations on oil tanker have significantly improved the safety over the last 20 years, the risk acceptance criteria should be based on recent period statistics or even on yearly statistics. The issue of the potential loss of containment is also the issue of most public awareness and concern; therefore, it should be presented with the most recent data.
The third is the risk that companies face from the economical point of view. This is the risk of loss of property (PLP), including the cost of the ship and the lost cargo, as well as the cost of penalties, damages and other direct and indirect costs. The findings from the earlier paper [
13] indicate that the PLP does not significantly threaten the fleet (company) activity. However, when a ship accident includes an oil spill, the loss of containment risk overcomes the loss of property risk. A formal safety assessment by the MSC [
14] considers that for serious collision, the cost of ship damage is 5% of the ship’s value.
The Formal Safety Assessment [
14] is based on risk analysis procedures and is complemented by a cost-benefit assessment for potential risk mitigation Risk Control Options (RCOs). Hazard identification and the analysis of historical accident frequency are important for identifying the kind of events that have led to accidental events and have influenced the risk acceptance framework. The IMO revised the guidelines for the Formal Safety Assessment [
15]; they define life-safety risk based on the expected number of equivalent fatalities and injuries. The relationship between injuries and fatalities is based more on expert opinion than on the evaluation criteria. Nevertheless, if the relation is commonly accepted, it could be presented as the acceptance criteria. In the previous paper [
13], the ALARP region for fatalities were calculated based on the statistical data between 2007 and 2017 and was between F
upper = 1.6 × 10
−3, and the lower limit was F
lower = 1.6 × 10
−5. The fixation of the lower bound on 10
−6 fat/year, as in the IMO revised document [
15], looks promising, but the wide range of the ALARP requires continuous RCOs that, until now, have never lowered the F-N curve below the lower bound. The discussion on this topic continues in
Section 2.3.
The consequence severity approach is used for the loss of containment in [
15], where the lowest severity is for spills below one tonne and the highest severity is defined for spills over 10,000 tonnes. The document proposes a risk criteria evaluation approach based on the societal oil spill costs, but leaves them to use other approaches. Important contributions in the evaluation of the Cost of Averting one Tonne of Spilled oil (CATS) are provided by [
16,
17], and further elaborated by [
18].
The analysis of the historical data provides important information on the development of the risk in recent years, as well as on the current situation. In addition, the forecast data on global fleet growth, as well as oil production and consumption, can provide indications of future risk developments, but above all, of the calculated risk tolerance. Multi-year forecasting of change and risk acceptance is important for RCO planning because, in the maritime industry, the time period of RCOs taking effect are years. Annual periods are associated with inspections or class renewals. An important period is also the delivery period of new buildings, which is usually between two and three years. When the market and economic conditions are good, the risk can be reduced by owning a new vessel built to the latest construction standards, with state-of-the-art navigation equipment and reliable machinery.
The world fleet level of tankers is taken from the statistical publication of the Institute of Shipping Economics and Logistics [
19] between 2007 and 2020. The fleet statistics and ship losses up to 2007 have already been analysed and used in the report MSC FSA [
14] to extend the statistical period from 1980 and determine a more representative result. The data regarding the accidents and fatalities are obtained from the EMSA yearly reports [
20].
1.1. Fleet Review
The global pandemic, closely followed by the international armed conflict in Ukraine, have changed the fundamentals of oil and gas supply and demand, with record high prices. China, with its zero covid policies, has contributed to the global logistic blockages and fueling inflation that has slowed the post-covid economic recovery [
3]. The size of the order for new tanker construction and the uncertain short- and medium-term demand for crude oil and products has prognosed a pessimistic outlook. According to the 2022 data from [
21], the confirmed orders for tankers are a total of 515 vessels, or 55.6 M dwt. Due to the uncertainty about the International Maritime Organisation’s (IMO) decarbonisation targets and their impact on investment, orders for new ships are declining. Future zero-carbon fuels are not yet commercially available, and fossil fuels such as LNG have been considered as a transitional fuel. The tanker fleet is strongly related with the global demand of oil.
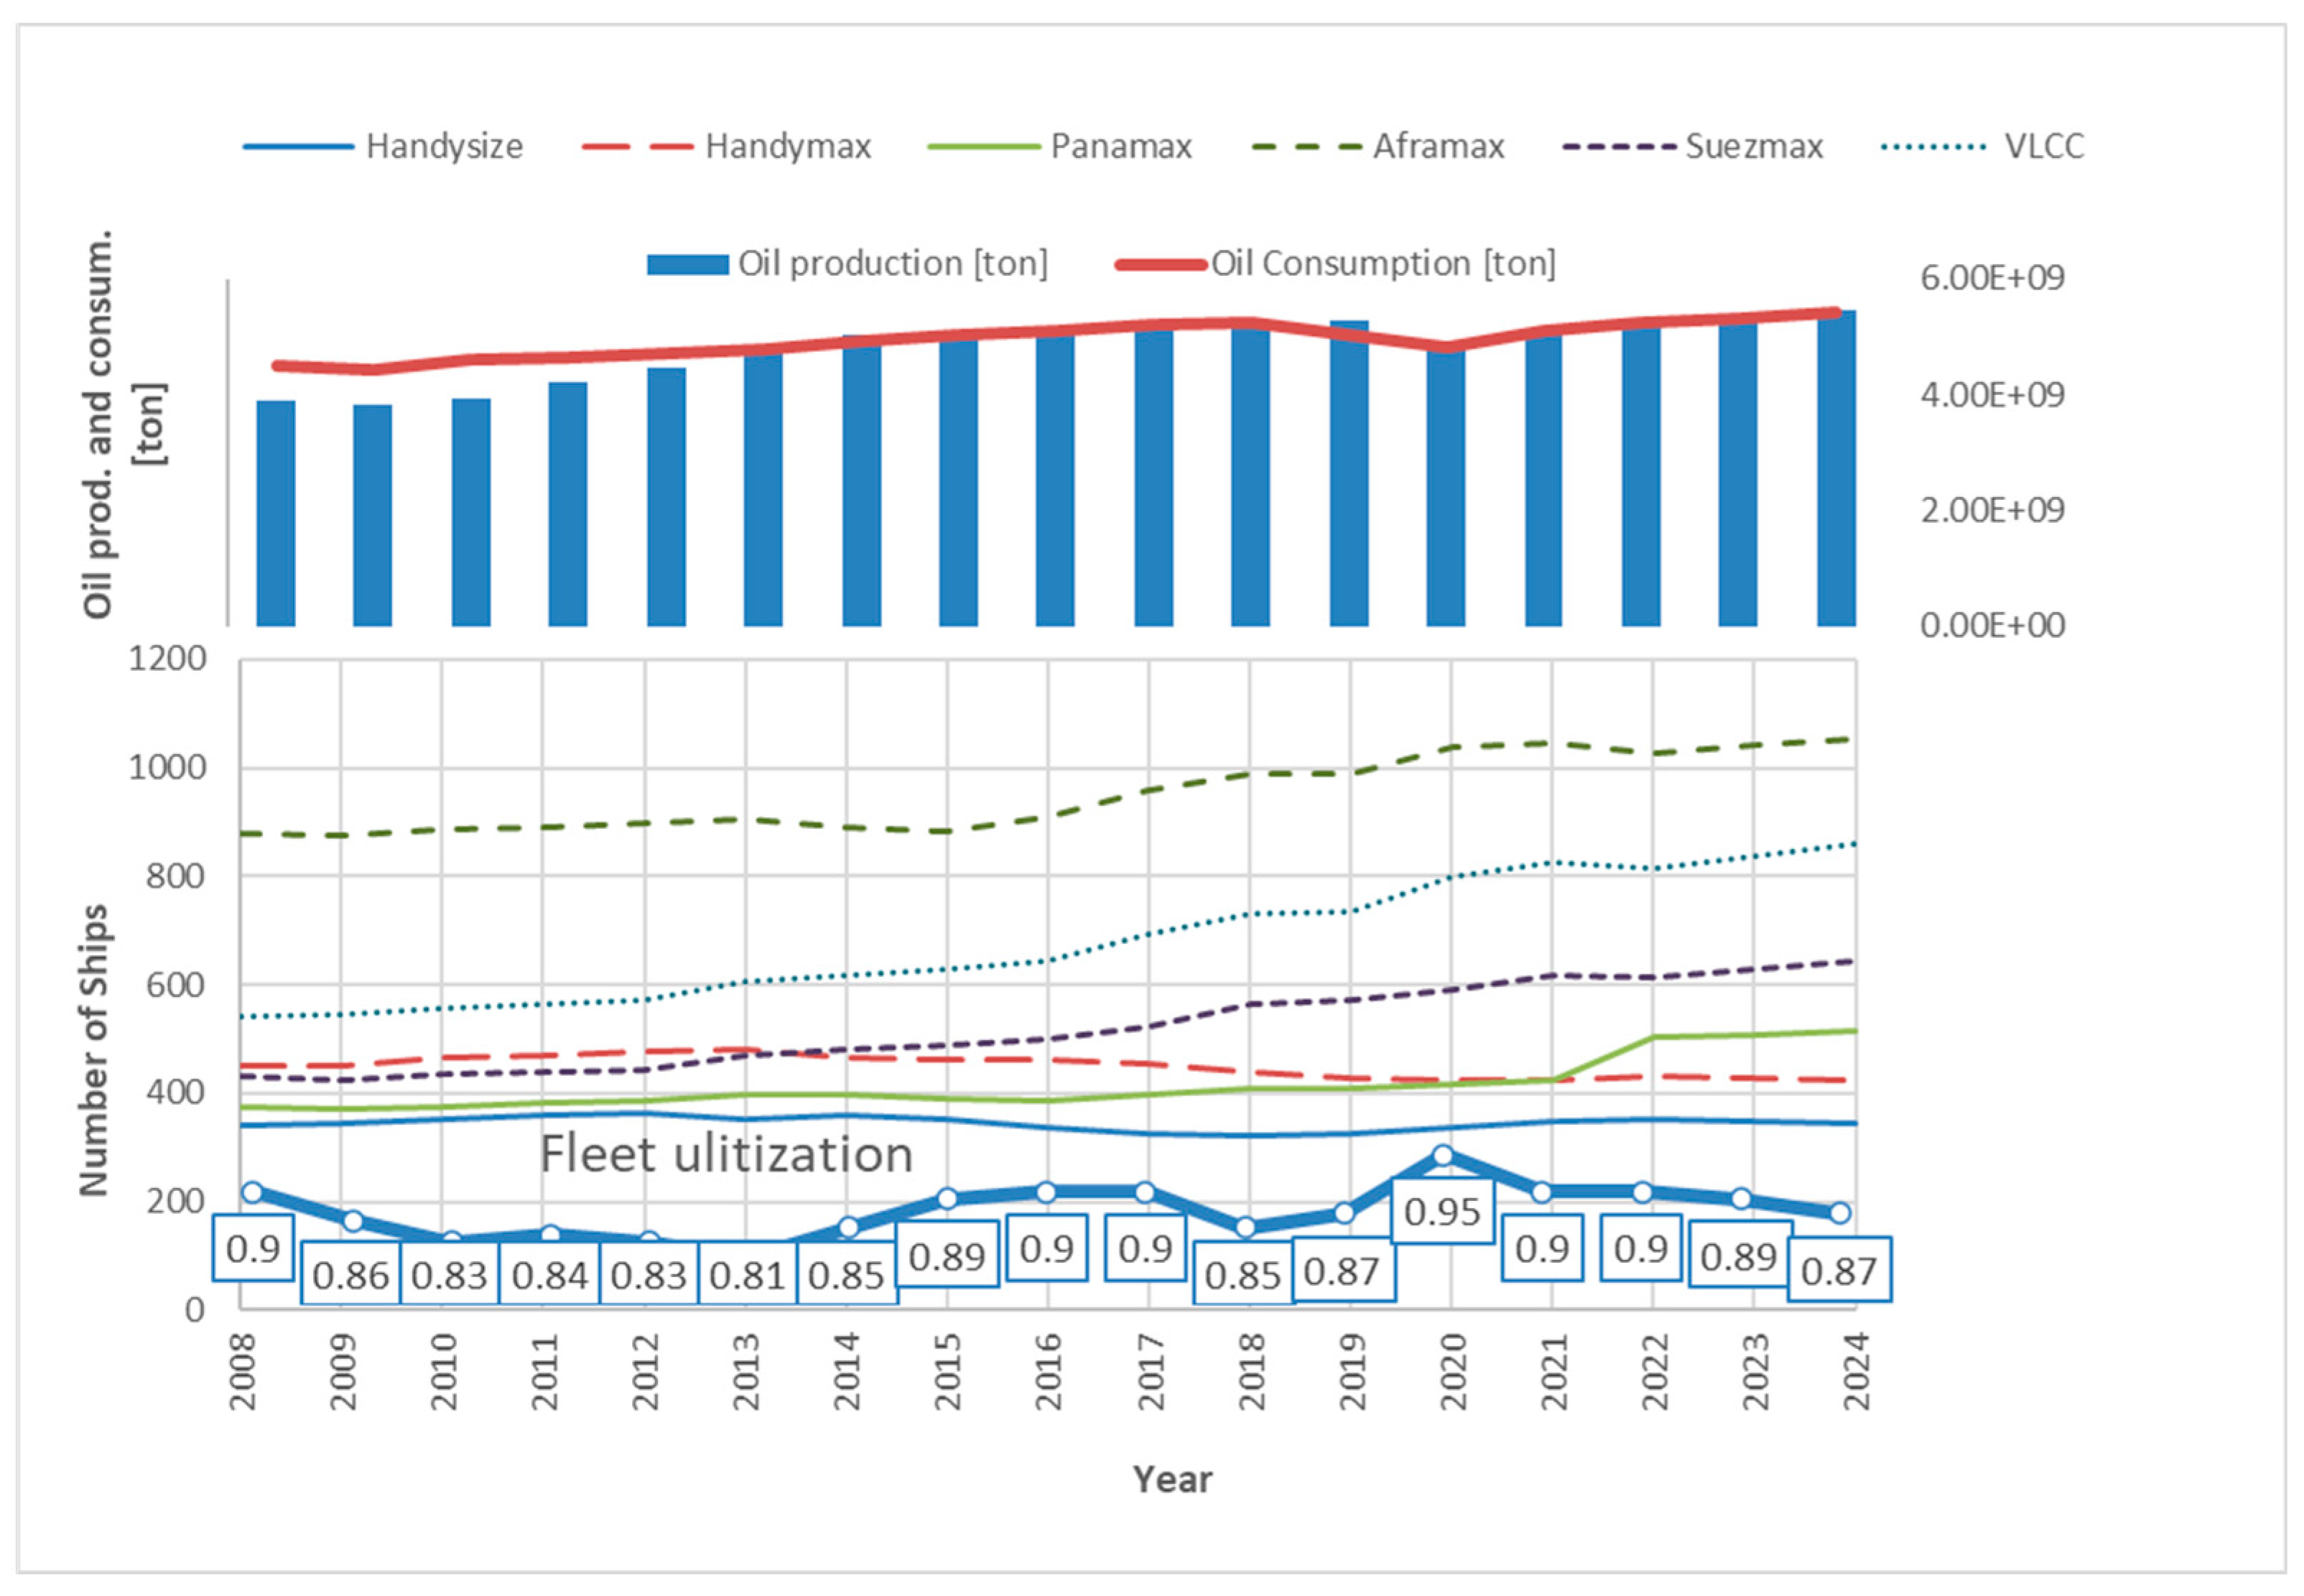
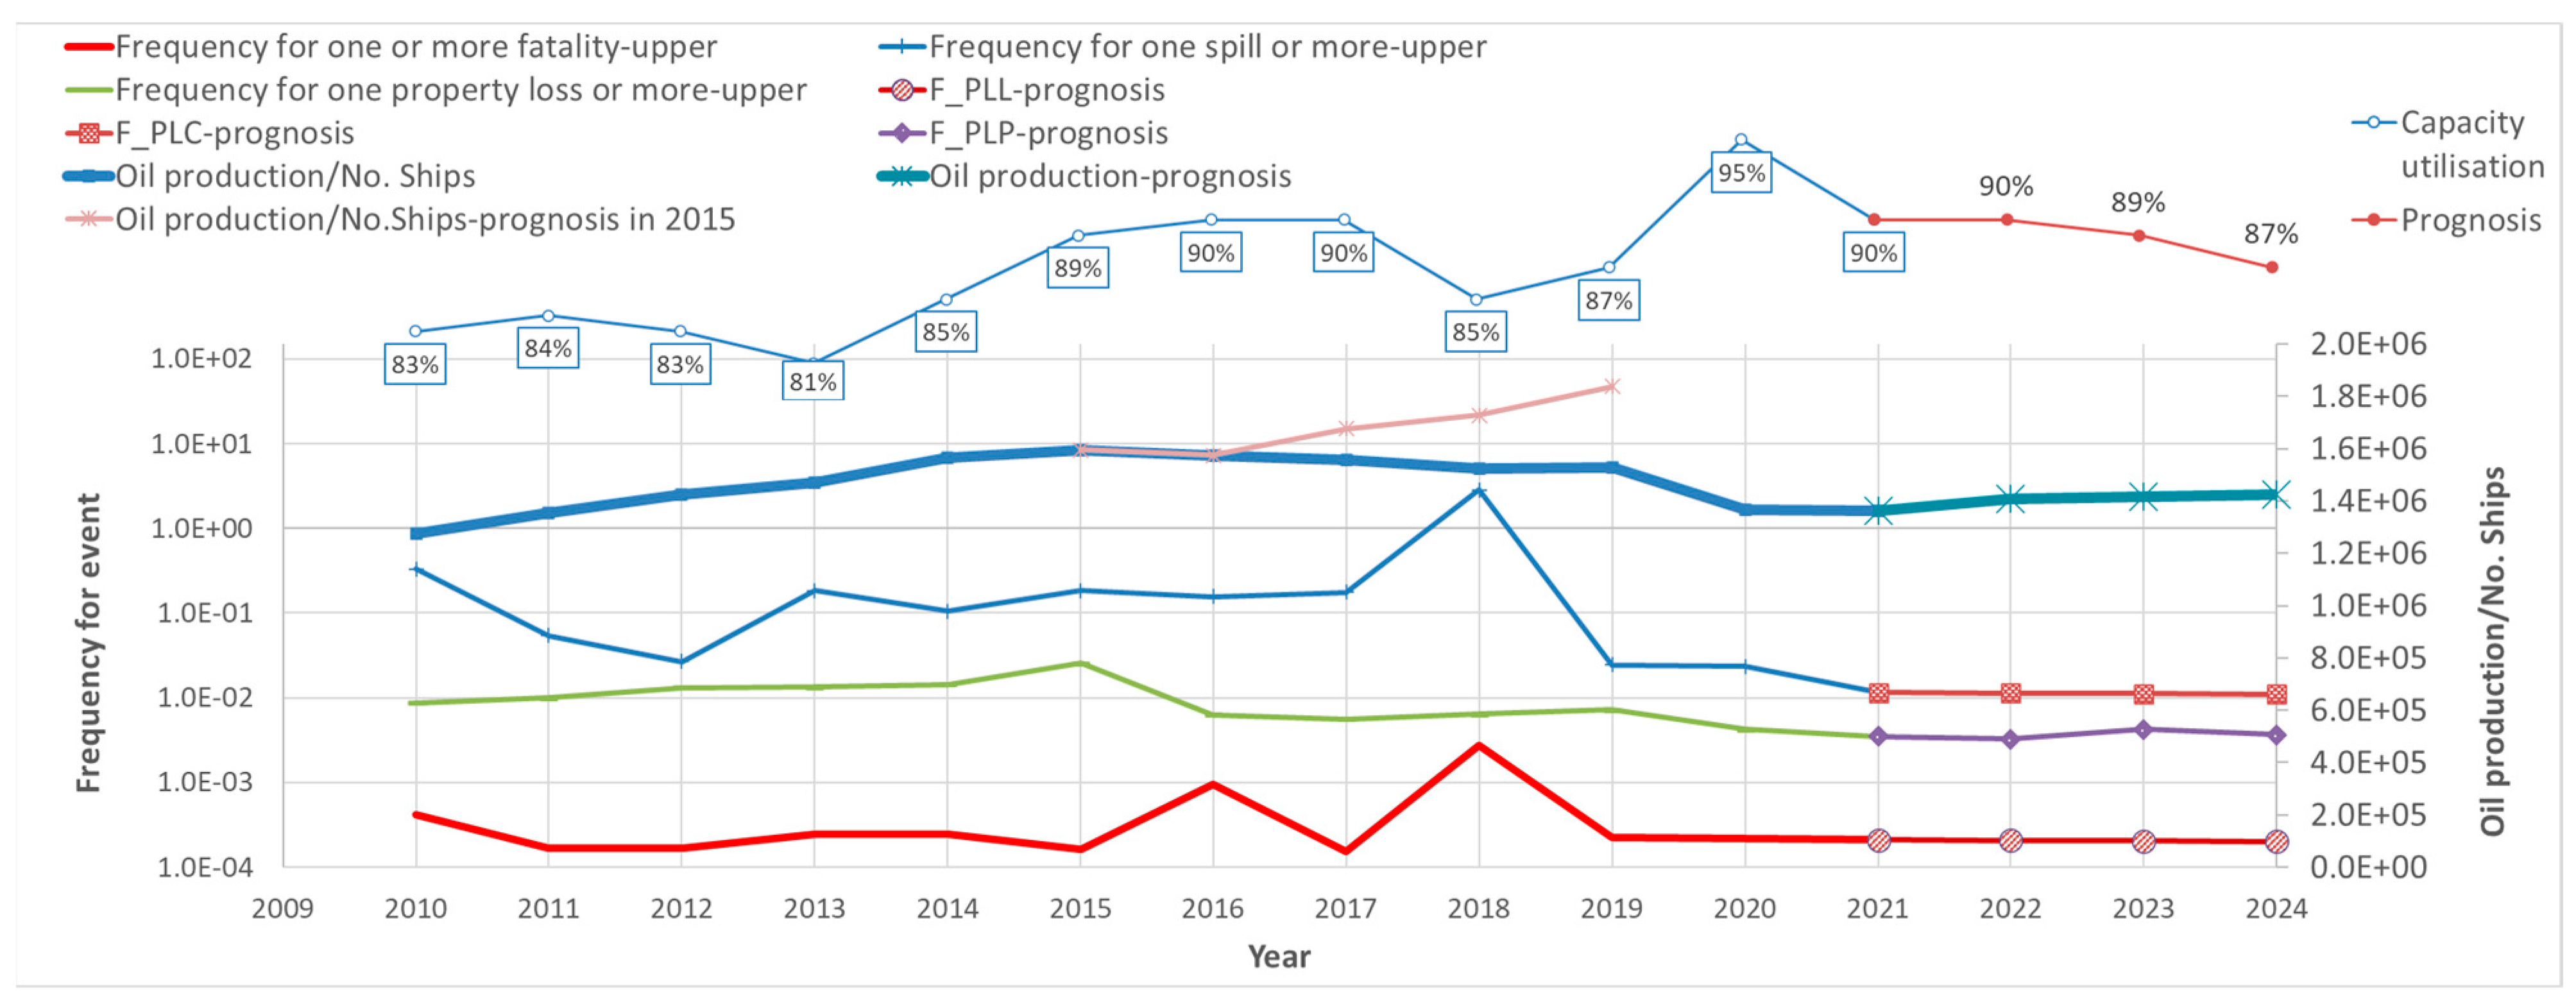
Figure 1 shows the relationships between world oil production and consumption related to the number of tanker fleets. The graph shows that world oil production has increased by about 19% over the past decade, while oil consumption has increased by about 10%. Taking the difference between oil production in 2021 and that in 2011, and assuming that oil accounted for 45% of maritime traffic in 2011 and 40% in 2021, we obtain the additional growth in vessel capacity.
The statistics show the growth of larger tankers, especially VLCCs, the constant number of Handymax and Panamax ships and the reduction in small tankers. The forecast of the tanker fleet change shows the growth of the tanker fleet [
19]. The fleet utilisation factor is calculated from the fleet growth and oil production prognosis. It has mainly been constant in the last decade, at around 90%, with the exception of in 2020, when, due to COVID-19, the consumption fell and many larger tankers were used for floating storage.
Orders for new ships are down due to the uncertainty about the International Maritime Organisation’s (IMO) decarbonisation plans and their impact on investment. Future zero-carbon fuels are not yet commercially available, and fossil fuels such as LNG have been questioned as a transitional fuel. In the current new buildings, about 16% of tankers have some form of dual-fuel or alternative propulsion. As a result, the order-to-fleet ratio for tankers is the lowest it has been in 20 years. New buildings of tankers represent approximately 6.5% of the merchant fleet, which represents about 8700 tankers.
The oil tanker shipping industry has a good safety record, although some serious accidents can and do occur. In addition to the reduction in the frequency of oil spills, the amount of oil spilled has also decreased significantly over the last few decades [
22]. Over the last half-century, the statistics on the frequency of spills from tankers of more than seven tonnes have shown a marked downward trend. In the 1970s, the average number of spills per year was 79; this number declined by over 90%, to six, in the 2010s. So far, in this decade, the annual average is five. Although the increased tanker movements may pose an increased risk, it is encouraging to see that the downward trend in oil spills continues despite an overall increase in oil trade. In addition to the decrease in the frequency of oil spills, the amount of oil spilled has also decreased significantly over the last few decades. In terms of the amount of oil spilled, the numbers for a given year can be greatly skewed by a single major incident. The recent oil tanker collision in Sanchi in 2018 is an exception in the oil spill records for the past 12 years.
In the period 2014–2020, a total of 10,981 cargo ships were involved in an accident or incident at sea, representing 44% of all ships involved in an incident. Since 2015, the number of cargo ships involved has decreased from 1801 to 1386 in 2020, with an average of 1568 during this period. The percentage of very serious accidents is 2.6%, while the percentage of serious accidents is 22.4%. In both cases, the severity of accidents in cargo vessels is slightly lower than in the total fleet, where the proportion of very serious accidents is 3% and the proportion of serious accidents is 25%. More than half of the accidents involving a vessel (51.4%) were related to problems of a navigational nature, such as contact, grounding/stranding and collisions [
20].
1.2. Risk Assessments Approach
Safety assessment is necessary to understand the suitability of certain (RCOs). This improves the investments in safety, which also renders them effective. The sinking of the tanker Erika in 1999 led to a new, accelerated schedule for phasing out single-hull tankers. The investigations of the Erika disaster conducted by the French government and the Maltese Maritime Authority found that age, corrosion, inadequate maintenance and inadequate surveys significantly contributed to the ship’s structural failure. There was broad consensus that the Erika accident and other recent oil tanker accidents suggest the requirement of additional international action to eradicate substandard ships, particularly substandard oil tankers, because such ships can have catastrophic effects on the marine environment when an accident occurs. The Prestige accident in November 2002 led to further calls for a change in the timetable for phasing out single-hull oil tankers.
The Formal Safety Assessment (FSA) was originally developed as a response to the Piper Alpha disaster of 1988, when an offshore platform exploded in the North Sea and 167 died as a result of the accident [
22]. The FSA for oil tankers is published by IMO [
14]. The previous paper presented by the authors [
13] presented the FSA for the world tanker fleet, where the focus was on the evaluation of the risk acceptance criteria for the three main risks: potential loss of life (PLL), potential loss of containment (PLC) and potential loss of property (PLP). A recent study by [
23] proposes a framework to rate for total consequence severity, by [
23], evaluates the risk according to the ecological, socio-economic and life-safety consequences.
The following sections present the evaluation of the new risk criteria, improved by the latest data from between 2018 and 2021. The risk criteria are here calculated based on the yearly criteria and combined with the yearly risk curves. This new approach provides a better representation of the year-by-year risk and the risk acceptance dynamics. It also allows the observation of the influence of the pandemic on the decline in oil consumption and the “contango play” of the oil producers.
2. Evaluation of the Risk
The risk evaluation process in the recent IMO (MSC) report is used to evaluate the acceptability/tolerability of risk. The evaluation is mainly based on the accident statistics, the Risk Control Options (RCOs) and the Cost-Benefit Assessment. In the maritime sector, the ALARP risk criteria are widely accepted. The risk categories used are: unacceptable, tolerable and largely acceptable. The risks within the ALARP range are tolerable as long as the risk reduction is not disproportionate to the cost of the RCOs implemented.
Depending on the country or company policy regarding risk acceptance, risks should be continuously monitored. Regardless of the results of the risk assessment or the current cost-benefit balance, risk management is a long-term process. The investments in RCOs should be based on risk prevention rather than on mitigation. The zero-accident policy has been applied by several companies and widely discussed for 15 years. Introducing new technologies, developing better protective equipment for personnel, improving procedures and training/qualifying personnel are specific examples of these efforts [
24,
25].
In addition to the prevention policy, the mitigation of consequences, when spills occur, provides significant improvements to the risk level. Similarly to the RCOs invested in prevention, the RCOs invested in oil spill mitigation also reduce the overall pollution risk. The consequences occur as a misleading in the prevention of the same occurrence. In an open system, as the maritime transport is, there is a limited number of RCOs that could be implemented in prevention. Consequently, the zero-accident policy is not implementable, even it is promoted by companies. The RCOs in consequence mitigation are therefore mandatory and are predominantly financed by the governments. In contrast, the cost of RCOs for prevention are mostly borne from the shipowners [
26].
Three risks are observed in the paper: potential loss of life (PLL), potential loss of property (PLP) and potential loss of containment (PLC). The risks are related to the accident events and the economic value of the crude oil shipping business. Additionally, the risk criteria include the influence of the variation in shipping costs and tanker rates. This assumption shows the influence of the discrepancy between oil production in consumption and the influence this has on a tanker fleet.
2.1. Statistic for Oil Tanker Accidents
Between 2010 and 2020, 28.198 ships were involved in 29.469 marine casualties and incidents; 1815 of these were oil tankers [
20,
27]. Among the large number of reported accidents, about 54 are classified as very serious involving oil tankers during this ten-year period. The systematic collection of the accident data is available from EMSA from 2005. The reliability of the reported data from IMO member states increased year by year and became consistent after 2012.
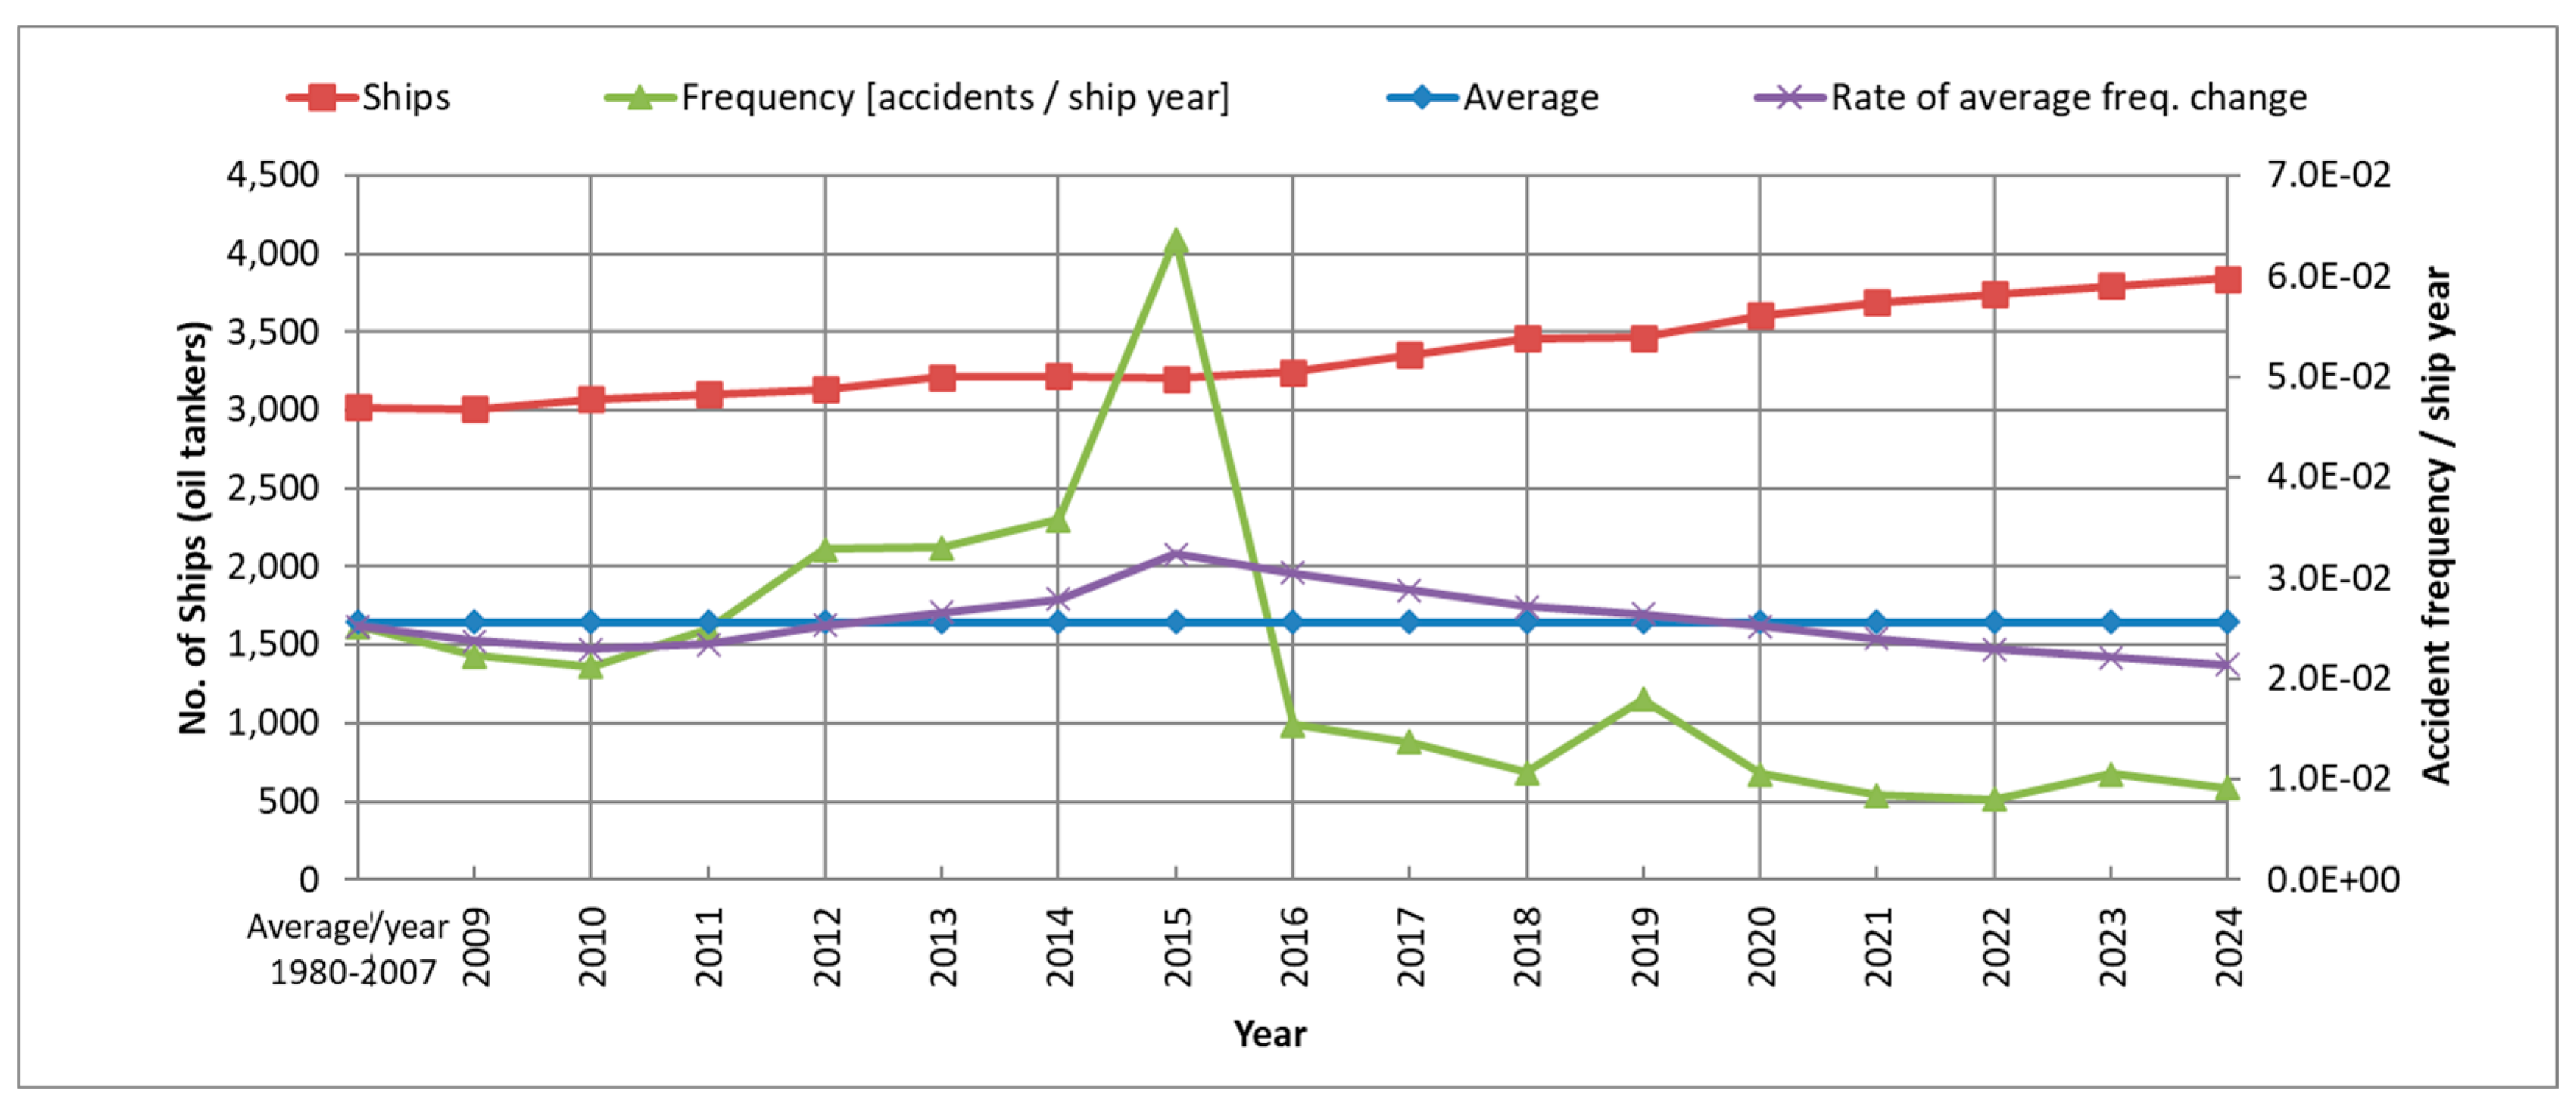
Figure 2 shows the significant decrease in the accident frequency, which is related to the improvements IMO have made in the shipping industry. Based on the current trend of accident mitigation and fleet growth, the prognosis for the next two years is also presented.
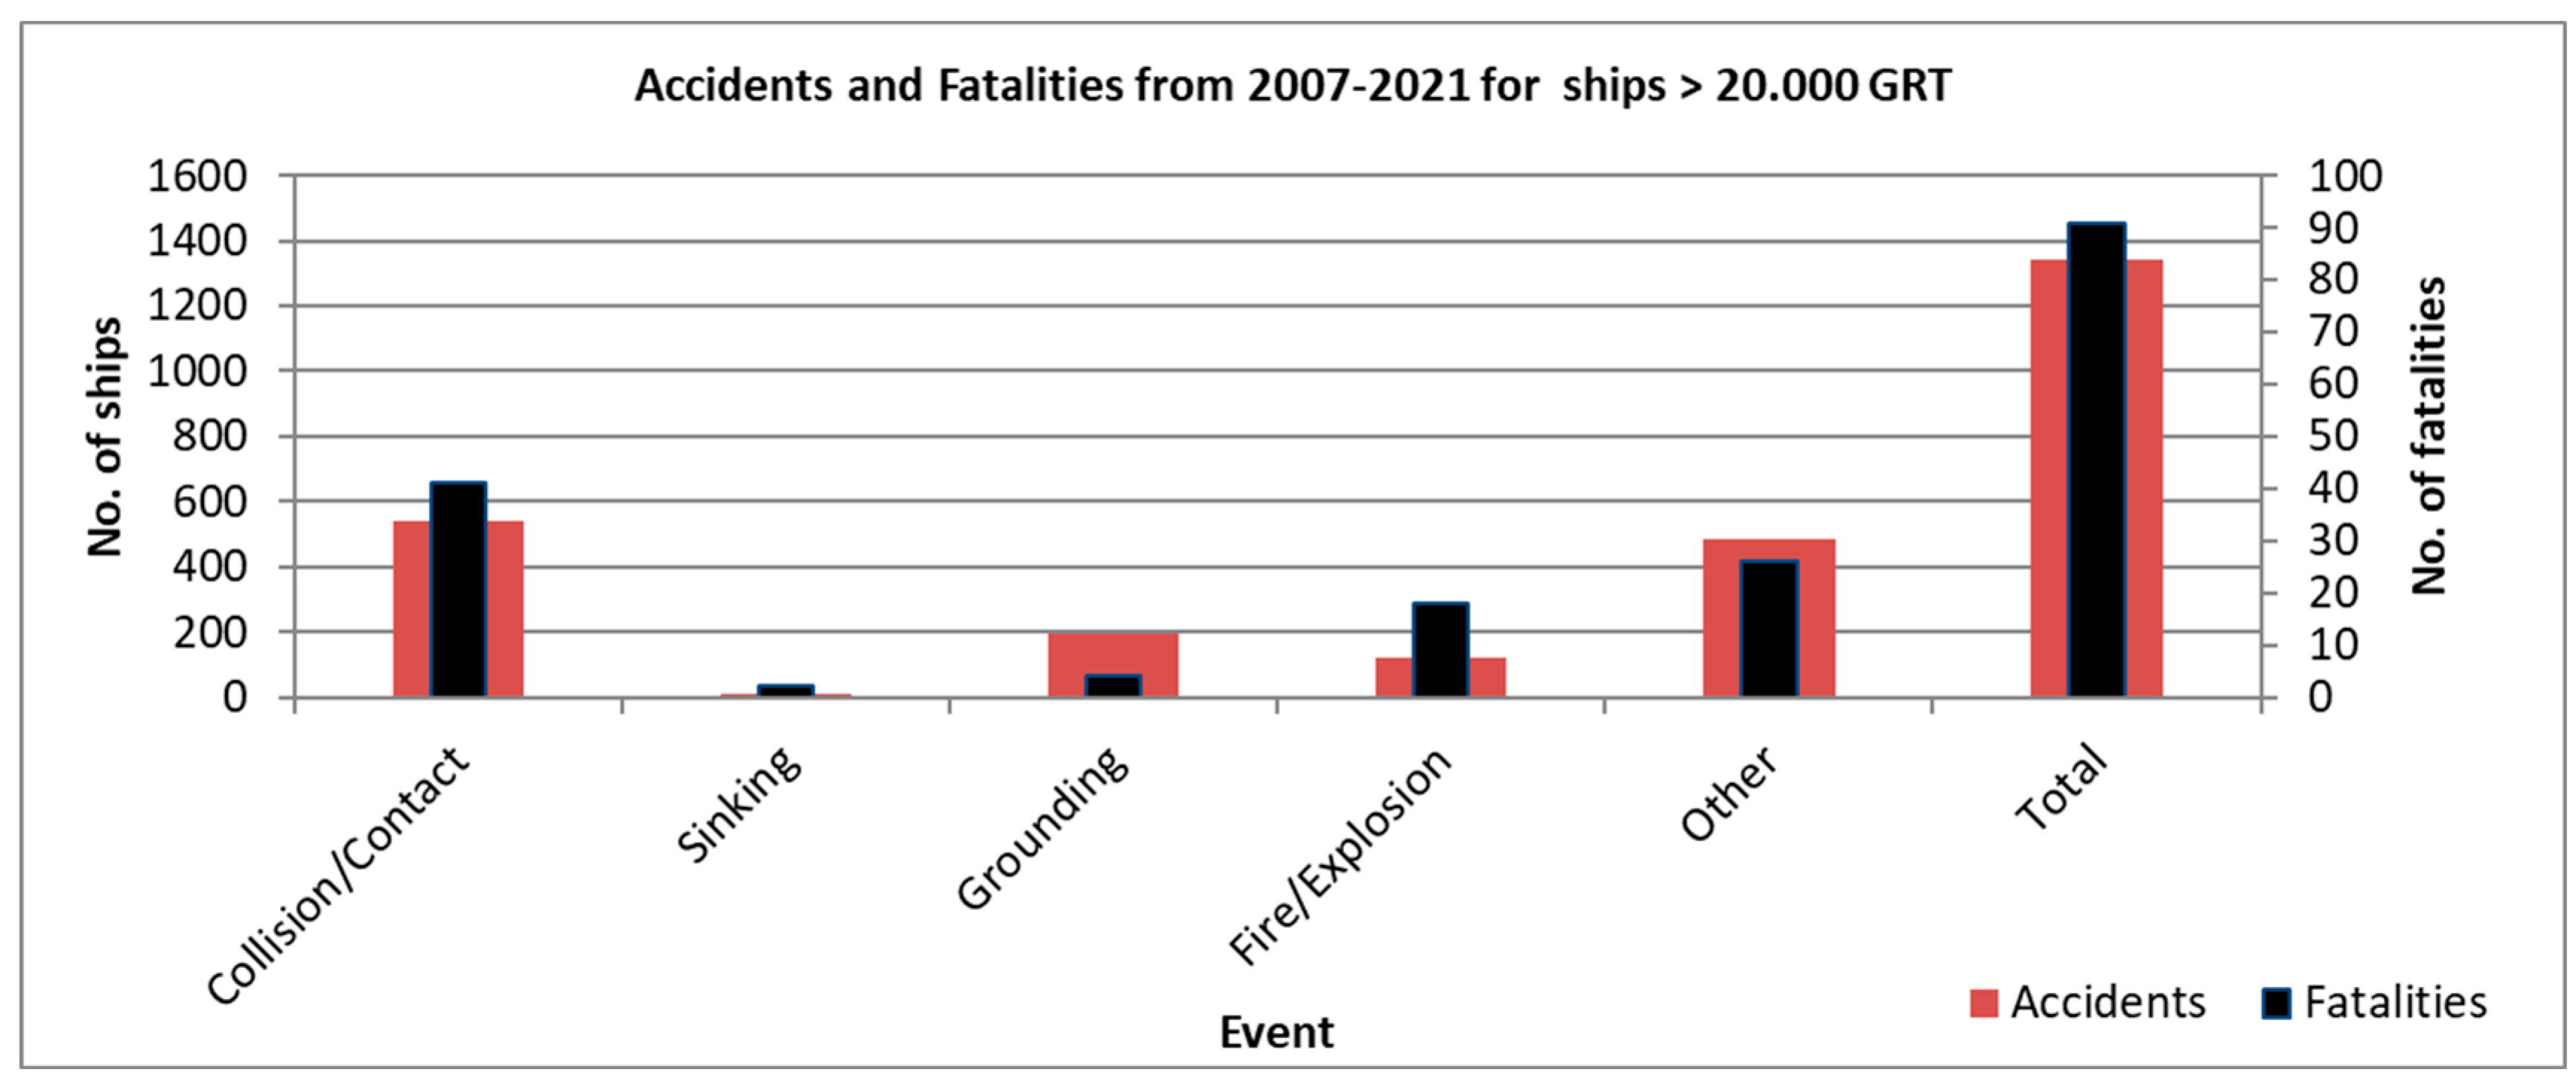
The accident type primarily affects the crew. The most relevant accident types and the ships involved are presented in
Figure 3. “Other” accidents are mostly related to machinery and hull failures, which have low consequences in terms of fatalities. “Fire/Explosion” and “Collision/Contact” are evidenced as the most serious events.
A relevant navigational safety indicator is the number of incidents and near misses. The importance of these two factors has increased over the last few years as a consequence of the decrees of the number of severe accidents. Incidents represent about 14% of all unlikely events at sea [
20]. On the other hand, the near misses in navigation are not yet systematically reported by EMSA or other bodies. The challenge for IMO is still to address a common AIS-based model to automatically identify near misses. Several studies [
28,
29,
30] conducted in the last decade address solutions for near miss observation in the assessment. The studies indicate that there is an approximately 15% occurrence of serious encounters for large ships, where most of the events occur in port waters, where traffic complicity is relatively high and multi-vessel encounters frequently occur. Most of the near misses in port waters are inevitable, according to the ship “safety zone” concept, but the transition to the incident is here controlled by the VTS and ship piloting. The further step shift from the ship-side strategic to the shore-side operational level means that the reliability level of the VTS infrastructure, operators and pilots should be addressed through training and coordination. This will lead to the concept of shore ship control that is the first step to the management of the autonomous ships in the future.
2.2. Frequency Calculation
Table 1 shows the calculations of the accident frequency per accident type in the observed time period. The accident frequency has decreased over the years; where the average frequency between 1980 and 2021 was 3.88 × 10
−2/year, there were only 8.4 × 10
−3/year in 2021.
The consequences of these accidents have decreased over the past decade.
Table 2 shows that the average frequency of oil spills has decreased by a factor of ten over the last ten years, compared to the period between 1980 and 2007. The table shows the number of oil spills detected and the corresponding frequencies for the different types of spills. The last row indicates the average amount of oil spilled per ship per year, and the sum of this amount shows that each tanker spilled an average of 38 tonnes of oil per year as a result of accidents.
2.3. Individual Risk
Individual risk is the frequency of an individual fatality per year, i.e., the probability that the crew member most at risk will die because of an accident or event on board a ship. Only events related to vessel operations are considered in this report. Accidents resulting from intentional acts and occupational risks do not fall within our scope.
Crew members are aware of the risks and have been trained to perform their duties safely and effectively. Ship safety rules are mandatory under the SOLAS Convention, which requires risk prevention and mitigation through the Safety Management System (SMS). Most companies assess their safety management systems against key performance indicators, providing the expected minimum standards. Additional levels for increasing standards or performance are applicable by companies where self-assessment approaches are performed to improve the plans that support their ship management systems [
31].
According to the methodology described in the FSA [
32], which is still referenced by the latest IMO documents for the risk acceptance criteria (RCA) evaluation [
15], the individual risk is delimited by the maximum value of 10
−3 fat/year, for crew members. This value was proposed by the Health and Safety Executive [
33]. The value does not have a specific evaluation procedure; it is primarily derived from several aspects of a modern living and working environment. The developed world social concept places the individual person in focus and most of the working and living activities are constantly improving to keep the individual person feeling safe and secure. On the other hand, the reality of the everyday activities causes unlikely situations and accidents, with injuries and fatalities. The causes vary between technical errors, human errors and even intentional events. However, the safety policy in every activity considers most of the unlikely events and the activity of their prevention and the further prevention of occurrence through the RCOs. In this working and living environment, the analysis of risk events gives us the distribution of risks and likelihood values for specific activities. Different methods are applied, including IR profile calculation, the average IR for the activity, the Fatal Accident Rate (FAR), Individual Risk Per Annum (IRPA) and some others described in [
34].
Although there is some logic to the amount and the way it was arrived at, the idea is basically wrong. It means the individual risk could be acceptable because the society accepts it, or it could be based on the societal interest of the activity. This can be expressed in the wealth of the activity or, in other words, based on the economic value of the business. The value of two million per fatality is equivalent to an earning of a person over 40 years of employment. The quantification of the cost of human life could not be socially acceptable, because it sets a price for human life. Basically, this could only be the standard for a low acceptance criterion. The upper limit should always be based on the economic value of the company. As proposed by IMO the PLL is calculated:
where:
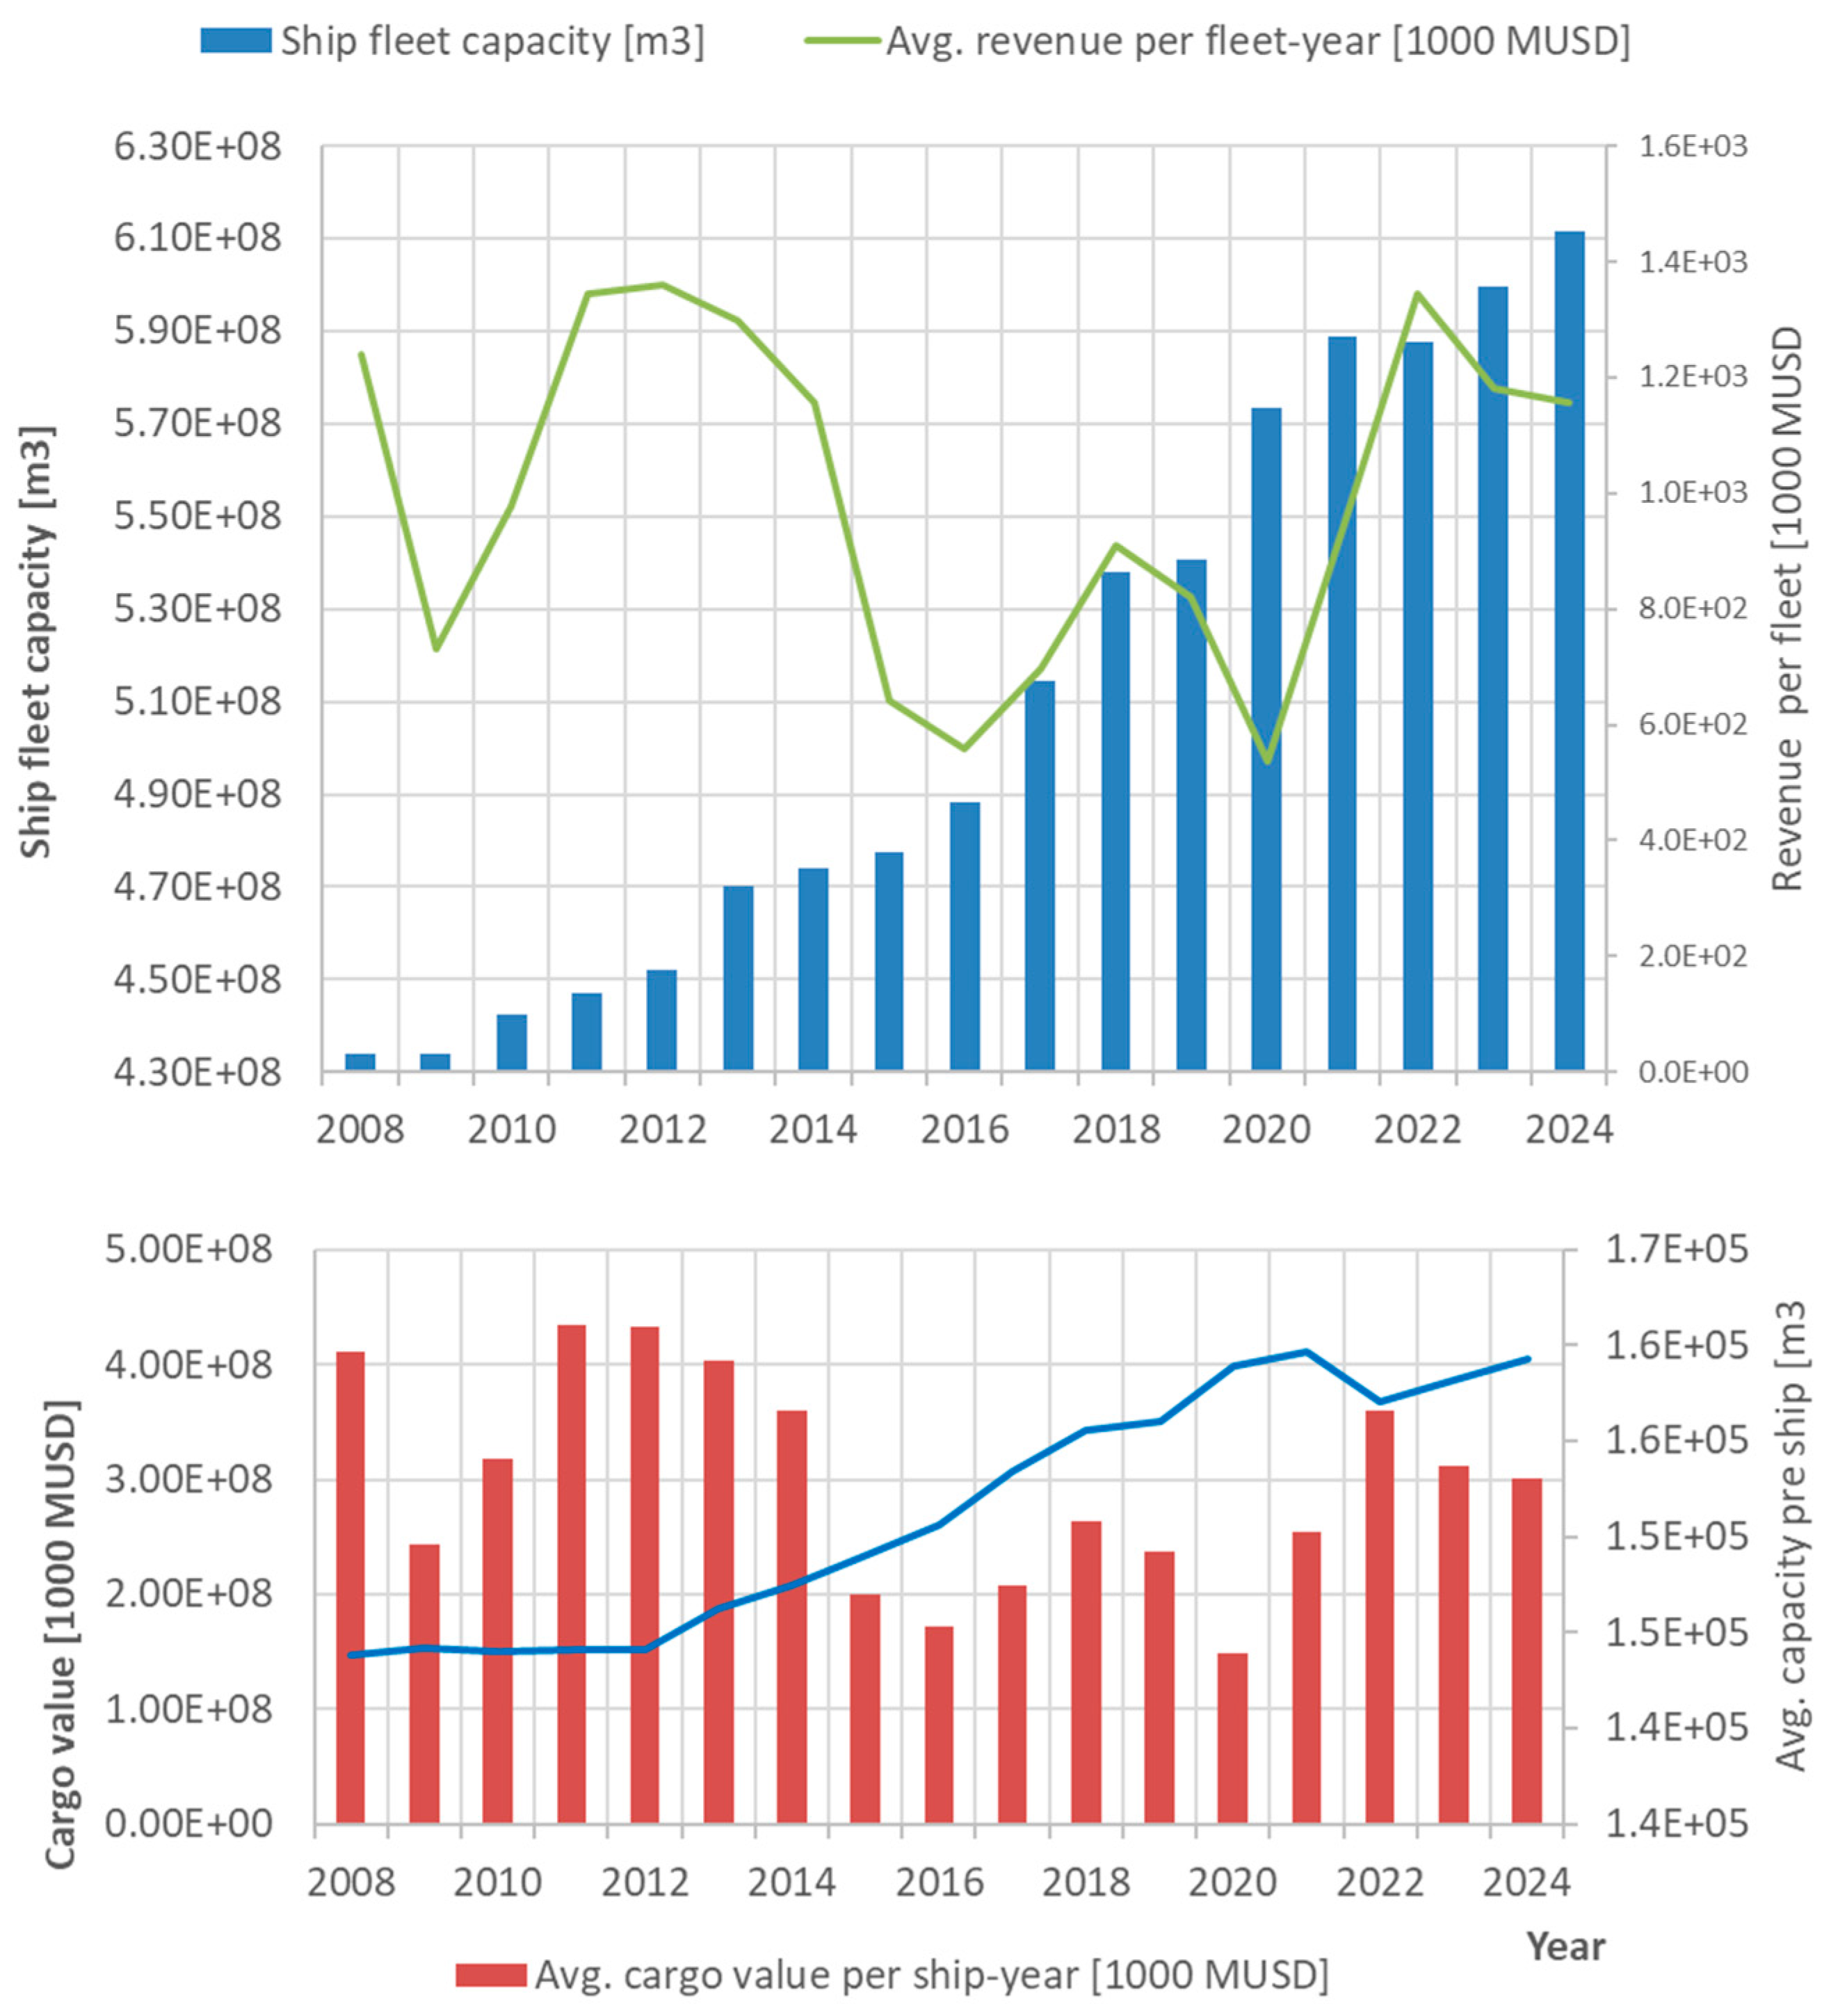
r is the number of fatalities due to the activity divided by the financial contribution of the activity and EV represents a reference vessel and is derived from the revenue of a ship per year. The PLL depends on the yearly changes of the values that are presented in
Figure 4.
The calculated risk criteria for a crew member are very high compared to other transport processes. In 2020,
r was calculated as 0.0055 fat/1 B
$, and from here, the risk acceptable cost per fatality yields 178.6 1 B
$/fat. Here, 1 B
$ means 1000 M
$. Compared to cruise shipping, the acceptance criteria for the risk level for passengers is 1.5 fat/1000 M
$ or 666 M
$/fat, for road transport 1 M
$/fat, etc., [
27]. The risk criteria are set very high, but they are not the only criteria that determine the risk policy and control measures. The PLL is calculated using equation 1 and results in 0.00835 fat/ship-year in 2020.
2.4. Societal Risk
Societal risk is used to assess the risk of a large number of people, because the individual risk is not sufficient for the same purpose. Expressions for societal risk can be created for any type of events. For example, societal risk is here determined for a type of vessel and year by combining all accidents (e.g., collision, grounding, fire). Society in general has a strong aversion to accidents with multiple victims. The calculation of the societal risk criteria is here based on MSC-MEPC.2/Circ.12/Rev.2 [
15], including the risk acceptance criteria from the EMAS report [
9].
where:
F1 is the accidents frequency,
Nu represents the upper limit of fatalities,
r is the number of fatalities in the transportation sector divided with the share from transport to GNP,
EV is the economic value of the shipping and
N is the crew number pre ship.
According to this, the tolerable risk for 2020 is 1.44 × 10⁻⁴ fat/ship-year. The number of fatalities is obtained from the EMSA reports. The ALARP upper limit is obtained by multiplying the calculated value by a factor of 10, yielding Fupper = 1.44 × 10⁻³ and the lower ALARP limit by dividing the result with a factor of 10, yielding Flower = 1.44 × 10⁻⁵. The range between the limits is debatable, but we can see that the upper limit is, per factor, 10 lower than that proposed by the IMO.
Looking only at the best documented period between 2010 and 2021, we see that the frequency of accidents with one or more fatalities, spills and property damage varies by the type of accident. A trend forecast is presented through to 2024 to see the trend in risk acceptance.
Figure 5 shows the calculated tolerable frequency of fatal accidents per year (
F1). Similarly, the tolerable frequency of spills (
F2) and tolerable property damage (
F3) are shown. The graph shows the current risk acceptability state regarding the three risks. The continuously high number of unlikely events influences the higher acceptance of the risk. The loss of containment itself provides only a first response to the acceptability of oil spills; the second is the amount of oil spilt, directly related to the loss of property. The incidence of both the loss of containment and the loss of property increases with oil production and maritime traffic. The more oil is produced and traded, the higher the acceptance of casualty events related to oil spills. Fortunately, the trend in accident frequency acceptance is much slower than in seaborne oil trade. This may indicate that the regulations issued by the IMO have had a positive impact on tanker safety, as mentioned in the introduction. In addition to the IMO, there are other non-governmental organisations that provide strategic and technical consultancy to the regulatory bodies, such as OCIMF, INTERTANKO, ISGTTO, ITOPF and many others. These collective efforts of organisations maintain the equilibrium between the stochasticity of uncontrolled events and predicable activities to ensure safe oil transport and distribution.
2.5. Oil Pollution Risk
Similarly, the pollution risk criteria are calculated as a fraction of the total spill quantity and the economic contribution of the shipping in a year. Here, the economic value EV is again limited to the fleet revenue of the oil shipping. The spill quantity is obtained from the ITOPF statistics [
35] and varies between 1000 and 8000 tonnes per year. The exception was the spillage of the oil tanker Sanchi in 2018, when 118,000 tonnes of natural-gas condensate was spilled.
This results in a potential loss of containment of 0.277 tonnes/ship-year for 2020. This value represents a spill rate of an average ship in a tanker fleet. The average size of a ship is about 65,000 DWT, which represents a Panamax ship. Further, the frequency of accidents is obtained according to the type of accident. The result shows that the frequency of spill accidents of one tonne or more is 2.34 × 10
−3 spills/ship-year for 2020.
F2—is the accident frequency with one or more tonnes spilt,
Nu—is the upper limit of the spill quantity per accident,
PLCA—is the potential loss of containment per year.
2.6. Risk of Property Loss
Losing part or all of the cargo and the cost of damage or a total loss of the vessel is a high risk that shipping companies can hardly afford. The world tanker statistics show that the number of accidents is decreasing and the consequences are less severe thanks to the continuous improvement in the maritime sector. Similarly to the previous risk evaluation, the property loss risk is calculated as:
where:
EV represents the ship revenue and
;
represents a loss of property per ship revenue.
—is the accident number in a year,
—is a new ship value, depending on the ship type,
—is the damage factor and is assumed to be 4% in this study,
—is the oil spill quantity in the year,
—is the oil price in the studied year,
—is the ship revenue for the observed ship and year.
The property loss frequency (
F3) is calculated. Here,
Nu is the total loss cost per ship type.
In 2020, the tolerable cost from damages was 3.5 × 10⁻³ M$/ship-year.
3. Consequences
European Union [
3] waters contribute approximately 80% of all marine causalities and incidents. Most of the causalities occur in congested waters. North Europe is the most affected location, where the largest ports, such as Antwerp, Rotterdam, Hamburg and the British ports, contribute to the dense traffic from the English Channel to the Wadden Sea. In this area, some of the most known oil spills in history have occurred. The Torrey Canyon, Amoco Cadiz and Sea Empress oil spill accidents are on the list of the 20 biggest oil spills from tankers [
20,
35,
36]. The international cooperation on spill response is of vital importance. The awareness of this concept encouraged the North EU countries to embrace the Bonn Agreement in 1969, the mechanism by which ten governments, together with the EU, cooperate in dealing with the pollution of the North Sea by oil and other harmful substances. In the Mediterranean, the “Regional Oil Response Centre” (ROCC) was established in 1976, and renamed the “Regional Emergency Response Centre for Marine Pollution in the Mediterranean” (REMPEC) in 1989. REMPEC is managed by the International Maritime Organisation in cooperation with the United Nations Environment Programme Mediterranean Action Plan (UNEP/MAP).
The consequences of an oil spill are primarily related to pollution, but the first concern is saving lives and mitigating the impact of pollution on people’s lives. The consequences are here divided in three categories. First is the number of fatalities, the quantity of oil spilled and the ship damage extent. As suggested by the [
14], the fatality categories are ranked in 13 fatality bands to cover the different types of accidents. Depending on the ship size, each band covers a different number of crew members. Although for the crew members on different ship sizes, the difference is not relevant, it is much more relevant for spill quantities and damage extent. The average characteristic of the vessel is presented in
Table 3. Further the second,
Table 4 shows the categories for the Panamax vessels, but any other ship size has its own distribution depending on its capacity, new building value and crew members. In the second table, the value of the oil is calculated based on the current price and is observed per each year. The change in the oil price influences the evaluation of the risk curves as the evaluation of the risk acceptance criteria.
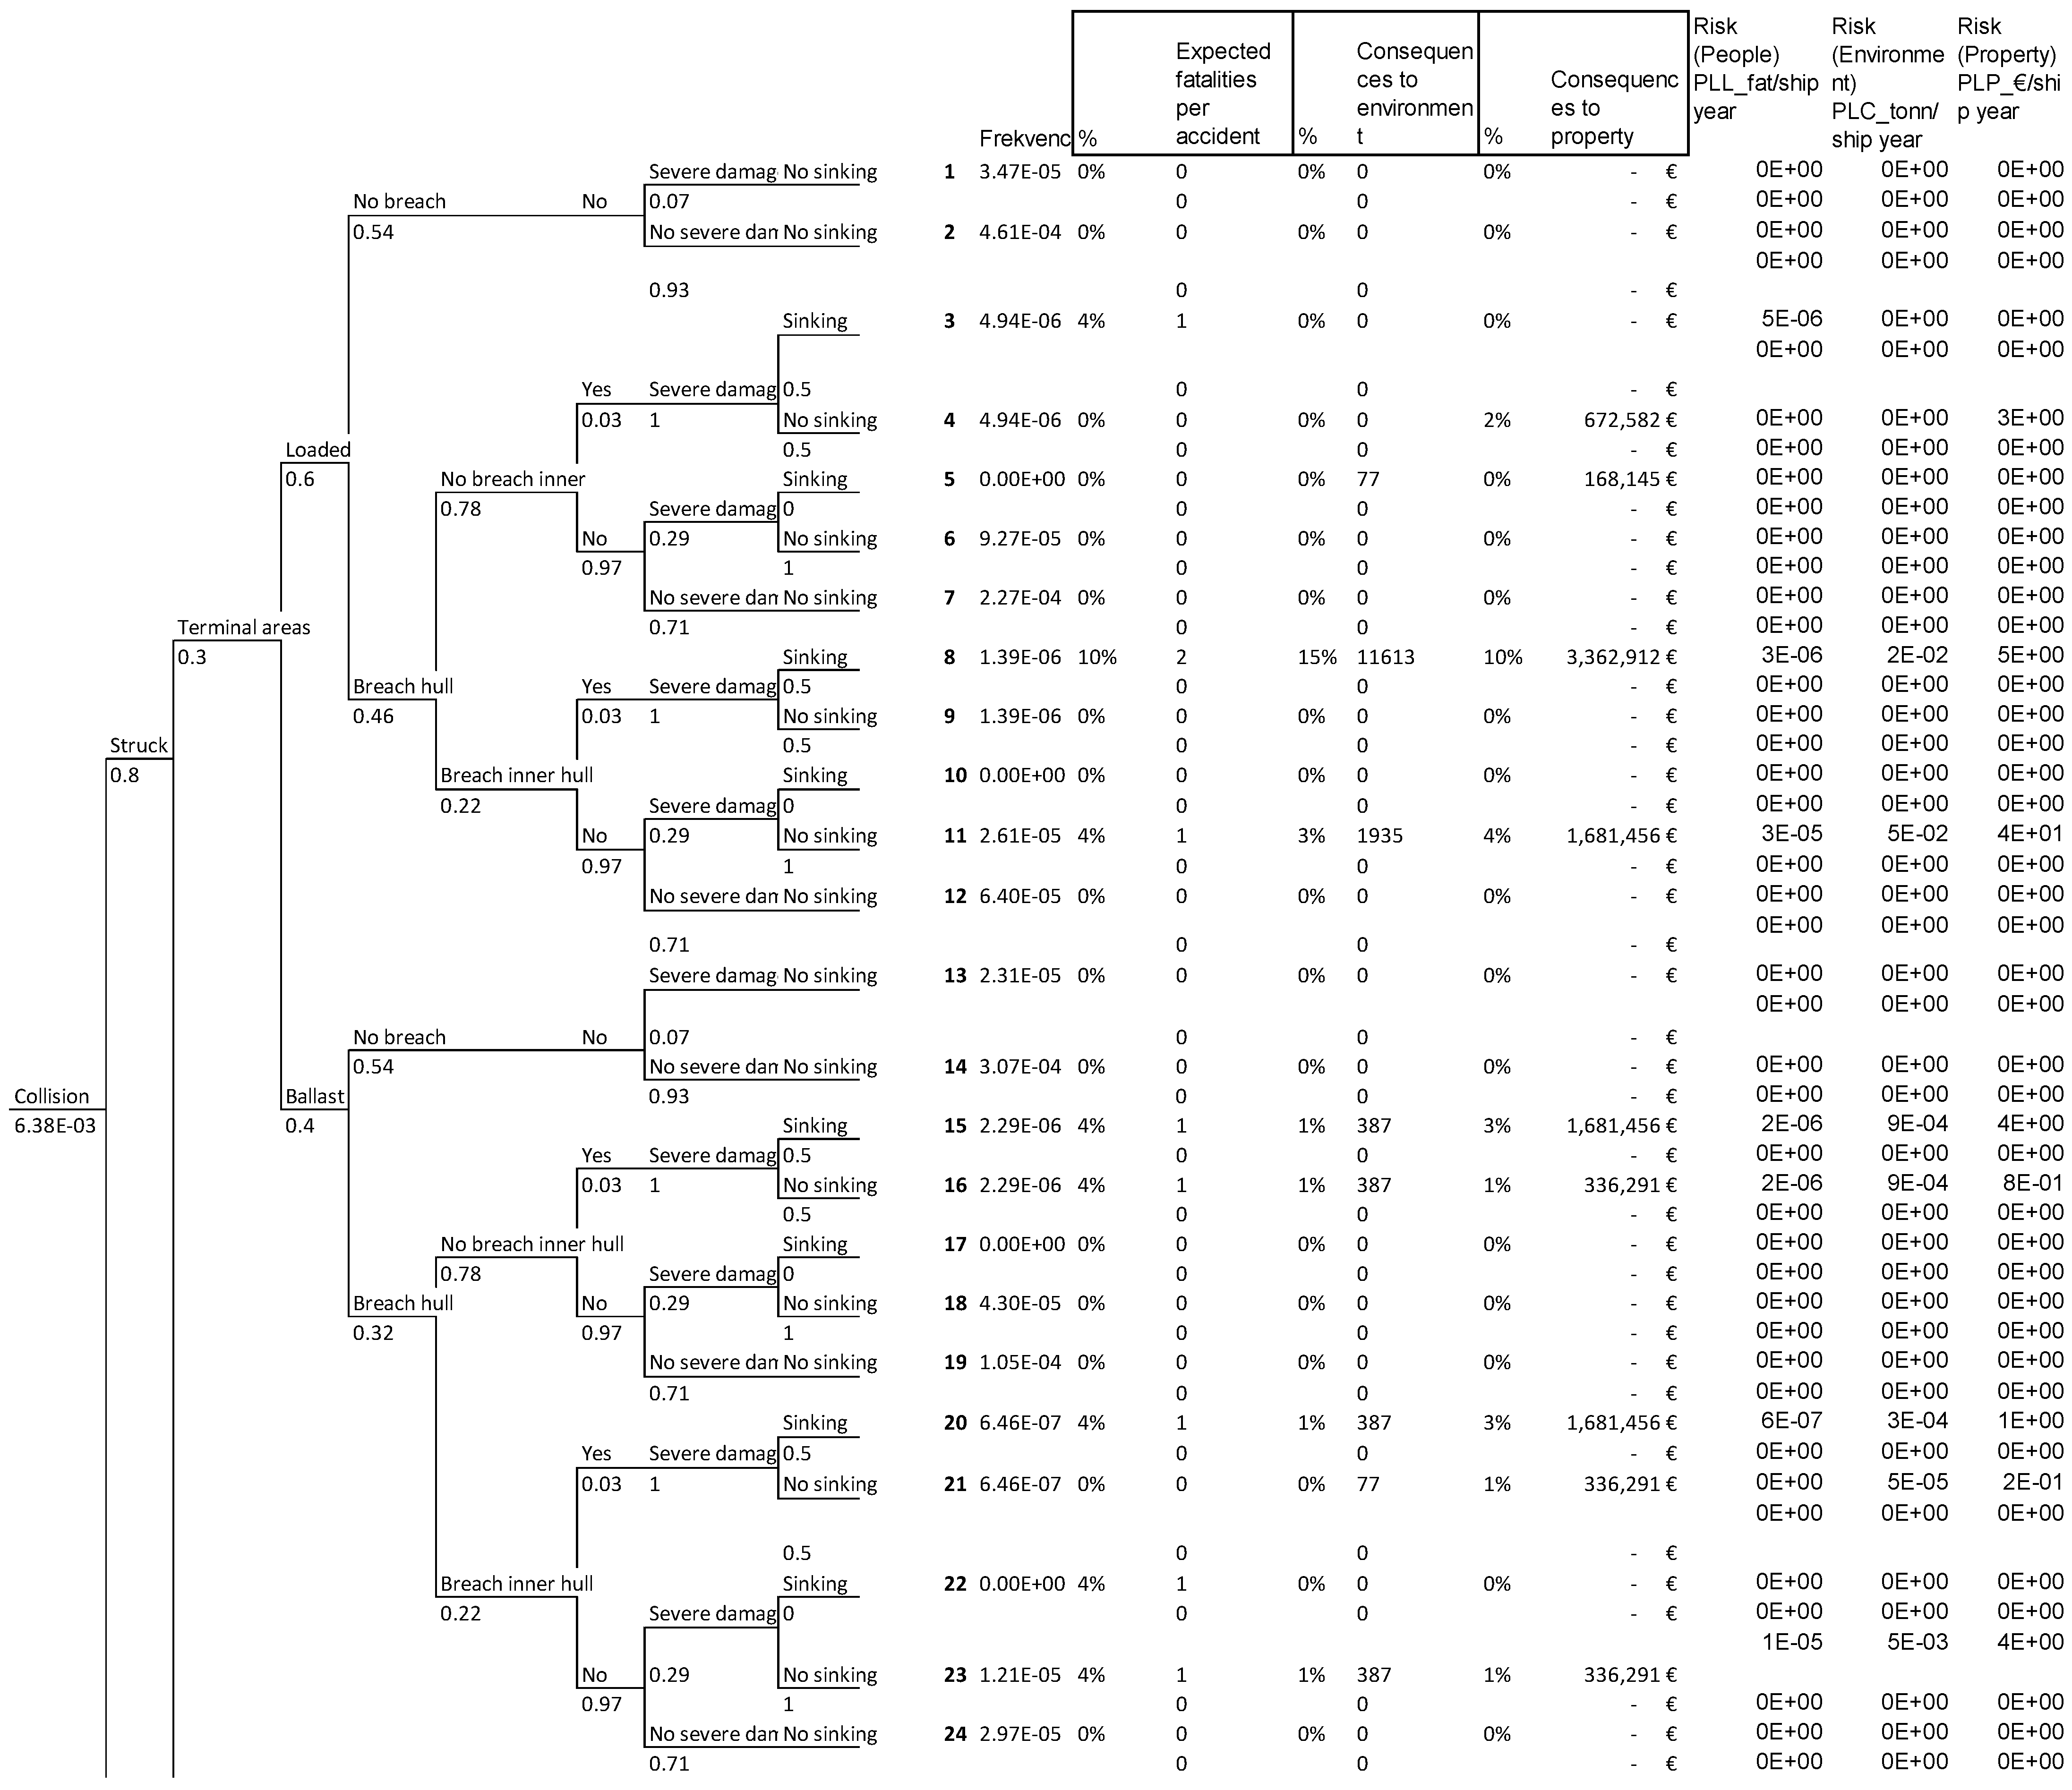
The consequences in the event tree are selected from the table above to make the make the F-N function discreet. The number of deaths expected in an accident is selected from one of thirteen bands. The event tree and the probabilities for each event were developed in collaboration with the group of marine experts that contributed the hazard identification process. The same event tree and calculated frequencies for each branch are used to calculate the PLL, PLC and PLP. The upper-part of the event tree for collisions is shown in
Figure 6 and includes the data for the year 2020.
The percentage value indicates the proportion of the total number of crew in the ship’s track under study. The same concept is used for the percentage of spillage in the second column and the percentage of cargo loss in the third column. The initial frequency of the accident used on the event tree is obtained from the calculated frequency for each observed year. The year-based accident frequency observation is also an upgrade to the risk model presented in [
13]. The intermediate probabilities of the tree branches are used, as in the [
14] report, but can be further improved by a more comprehensive HAZOP assessment. The MEPC report mainly uses statistical data, so several branches of the event tree are zero due to the lack of data. These values could further be improved with new statistical data and a deeper analysis of the reports available from EMSA and the ITOPF database.
The event trees are built for collision, contact, fire, explosion and grounding events. The results of the event trees’ processing are the F-N curves for every tanker ship size and every year between 2008 and 2022. The event trees and F-N curves are presented in the
Supplementary Material.
4. Levels of Risk
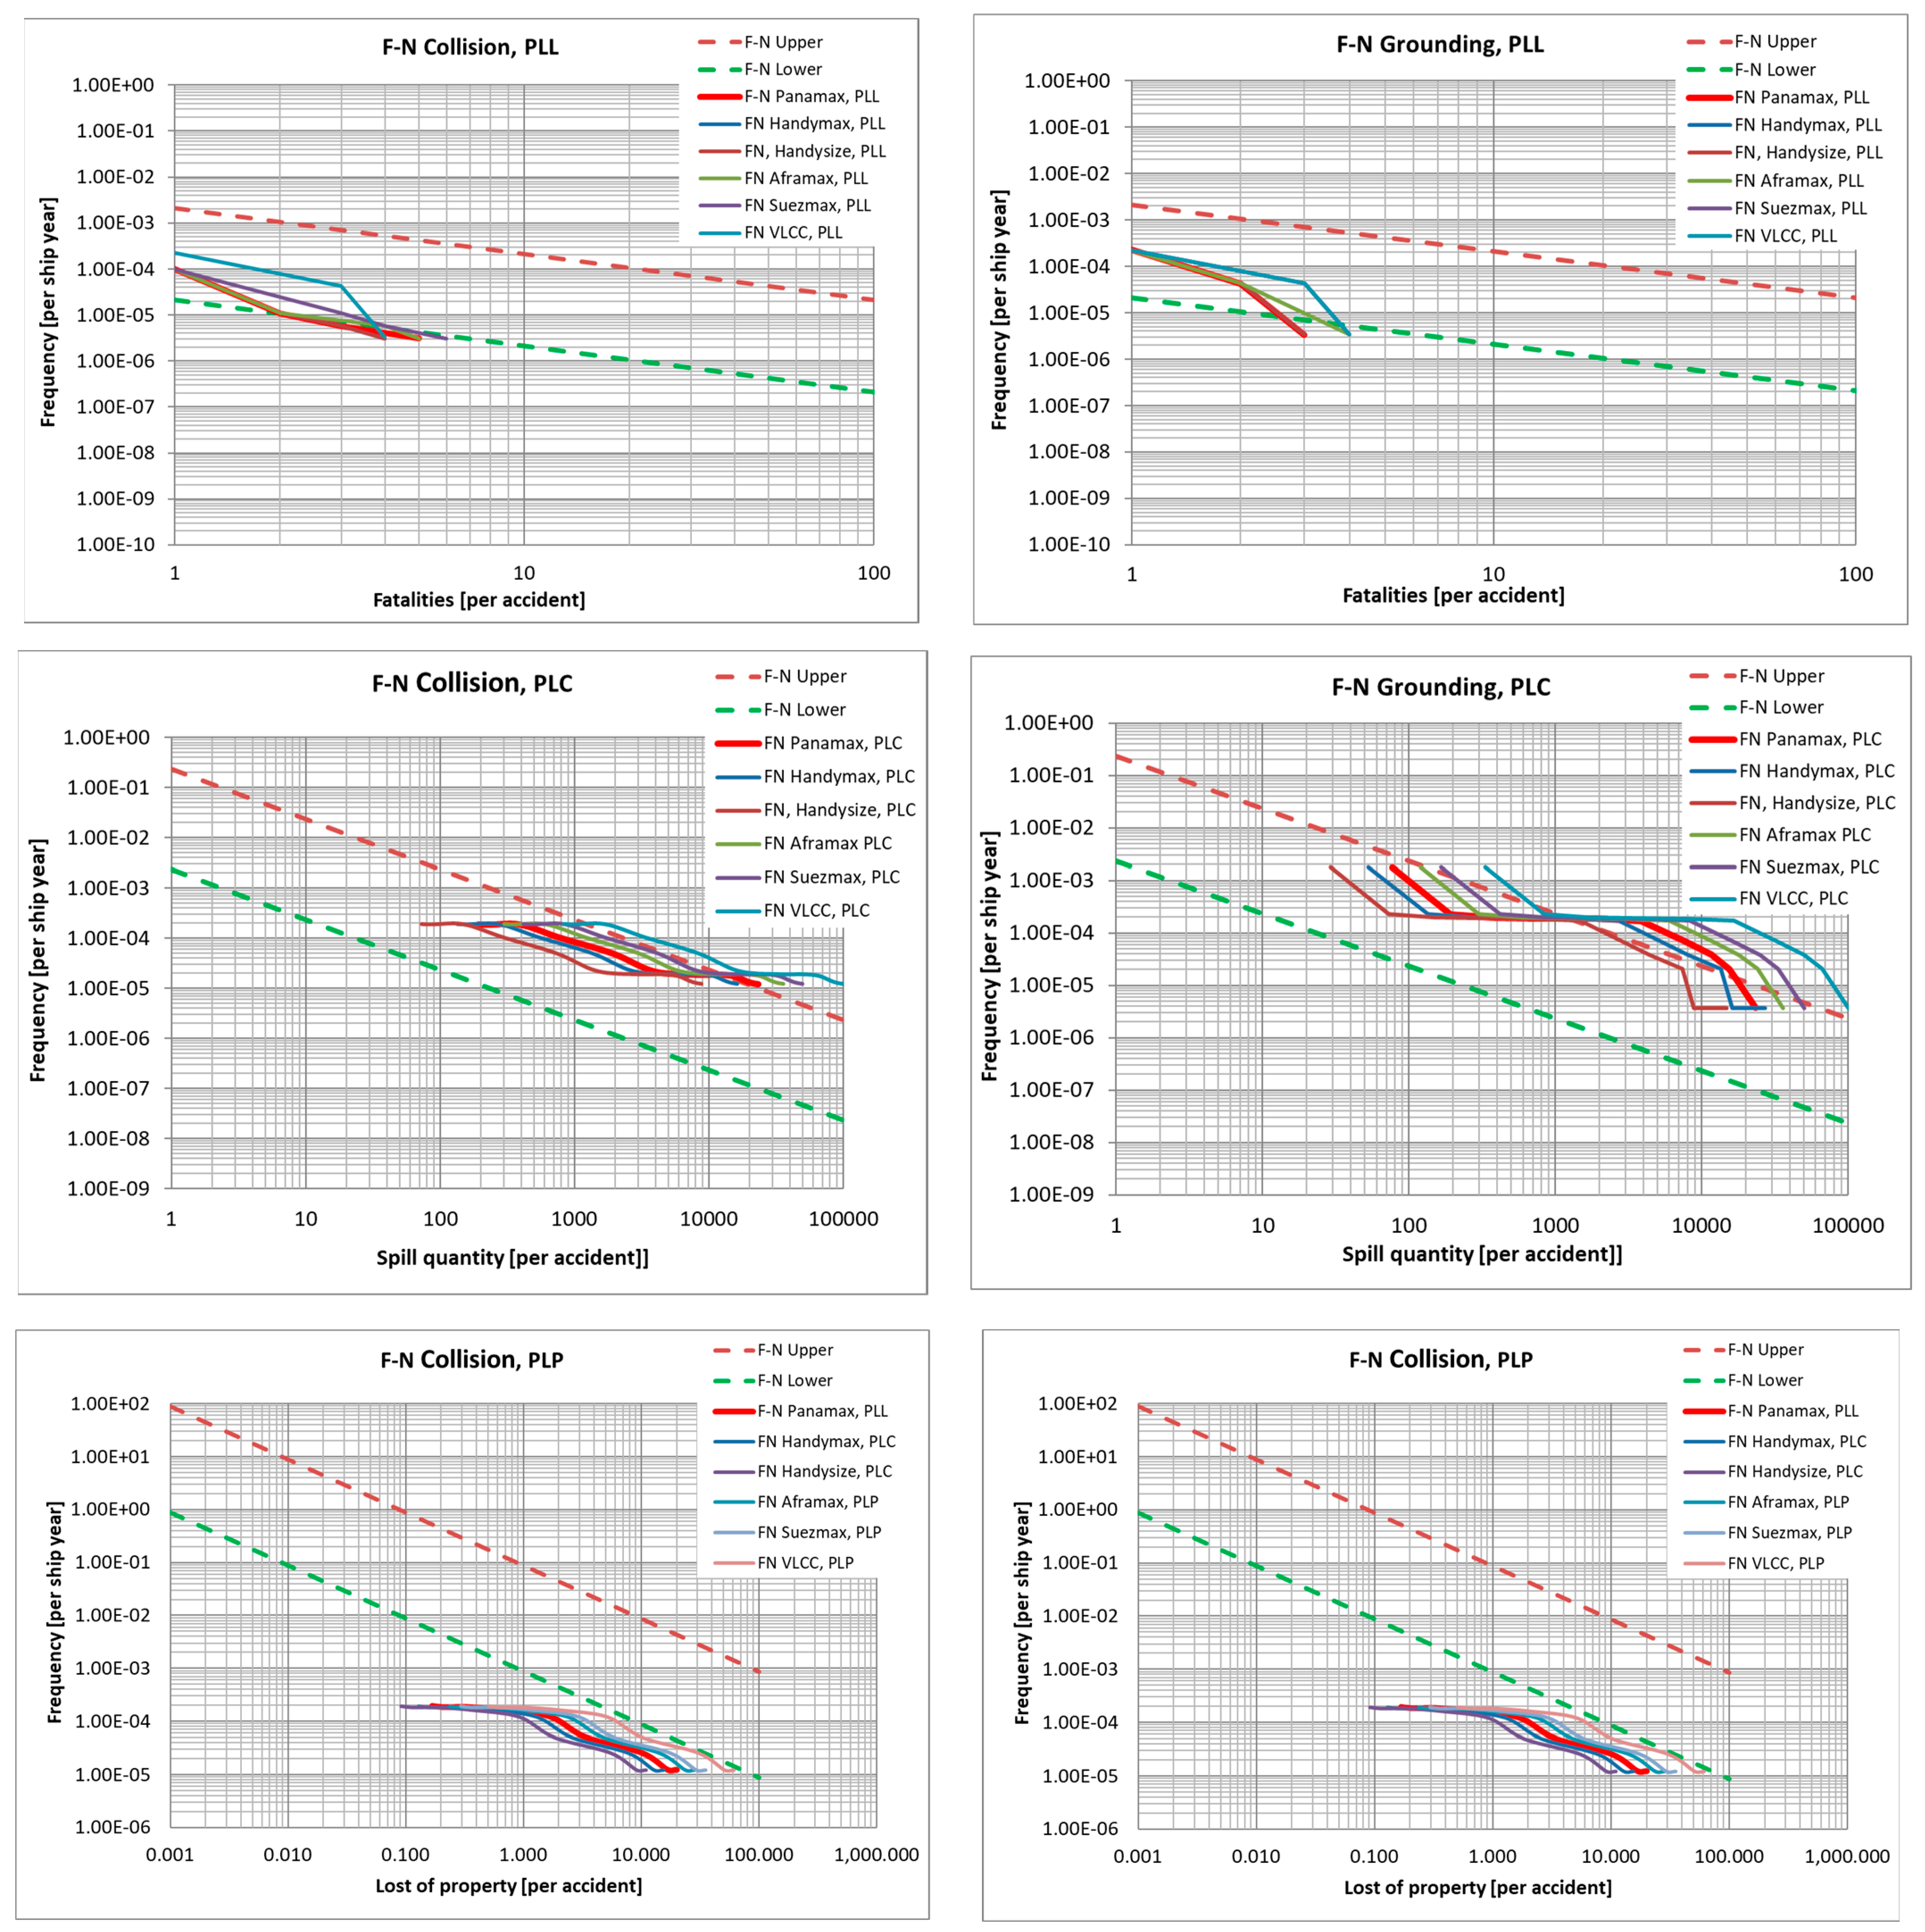
The societal (collective) risk is further computed from the individual risk frequencies by summing the probabilities of fatalities for each event over the considered population. The same approach is used for the collective pollution risk and collective loss of property risk. The results can now be presented with the F-N curves for each accident, each tanker size and each year. Considering the three risks, PLL, PLC and PLP,
Figure 7 shows the modelled risk level for tankers in the year 2020 for all three risk and accident types. Independently, for the accident, the most critical is a loss of containment, especially for collision and grounding. The calculated risk curves for other types of accidents are included in the
Supplementary Material.
We can see that the PLC risk for larger vessels is above the tolerable limit, mainly because large spills are rare compared to small spills. In the present study, it is assumed that the same percentage of spill quantity for the same accident in the tree is independent of the ship size. In reality, this is different as the probability of occurrence also depends on the ship size. In the
Supplementary Material, the collection of the risk curves can be observed for the last six years.
According to the risk curves above, the risk of an oil spill remains relevant and critical compared to other risks. Oil spills are the result of random events. In most cases, small and medium oil spills are problematic and pose a risk. The F-N curves for the PLC show that large oil spills have been systematically addressed in recent decades, with the introduction of modern navigation systems, control of navigation in restricted areas and new regulations for tanker construction. The accident of the oil tanker Sanchi in 2018 confirms the probability of the occurrence of larger spills. The return period is now approximately 8–10 years and is improved compared to the five years from the 1970s to 2007. The risk of oil spills remains and requires further consideration.
The risk to crew members is considered acceptable for large accidents. All of the diagrams show that the risk exceeds the acceptable limit at one fatality in some years. However, we should keep in mind that the assessment approach for small numbers is not reliable.
Lastly, the F-N curves for the PLP show that the consequences of property damage due to accidents are less relevant than the economic risk. Grounding and contact accidents are calculated within the ALARP and the maintenance of risk control is enough to keep the risk acceptable. The other observed accidents are below the lower risk criteria and do not require special precautions from an economic point of view.
Overall Risk of the Oil Tanker Fleet
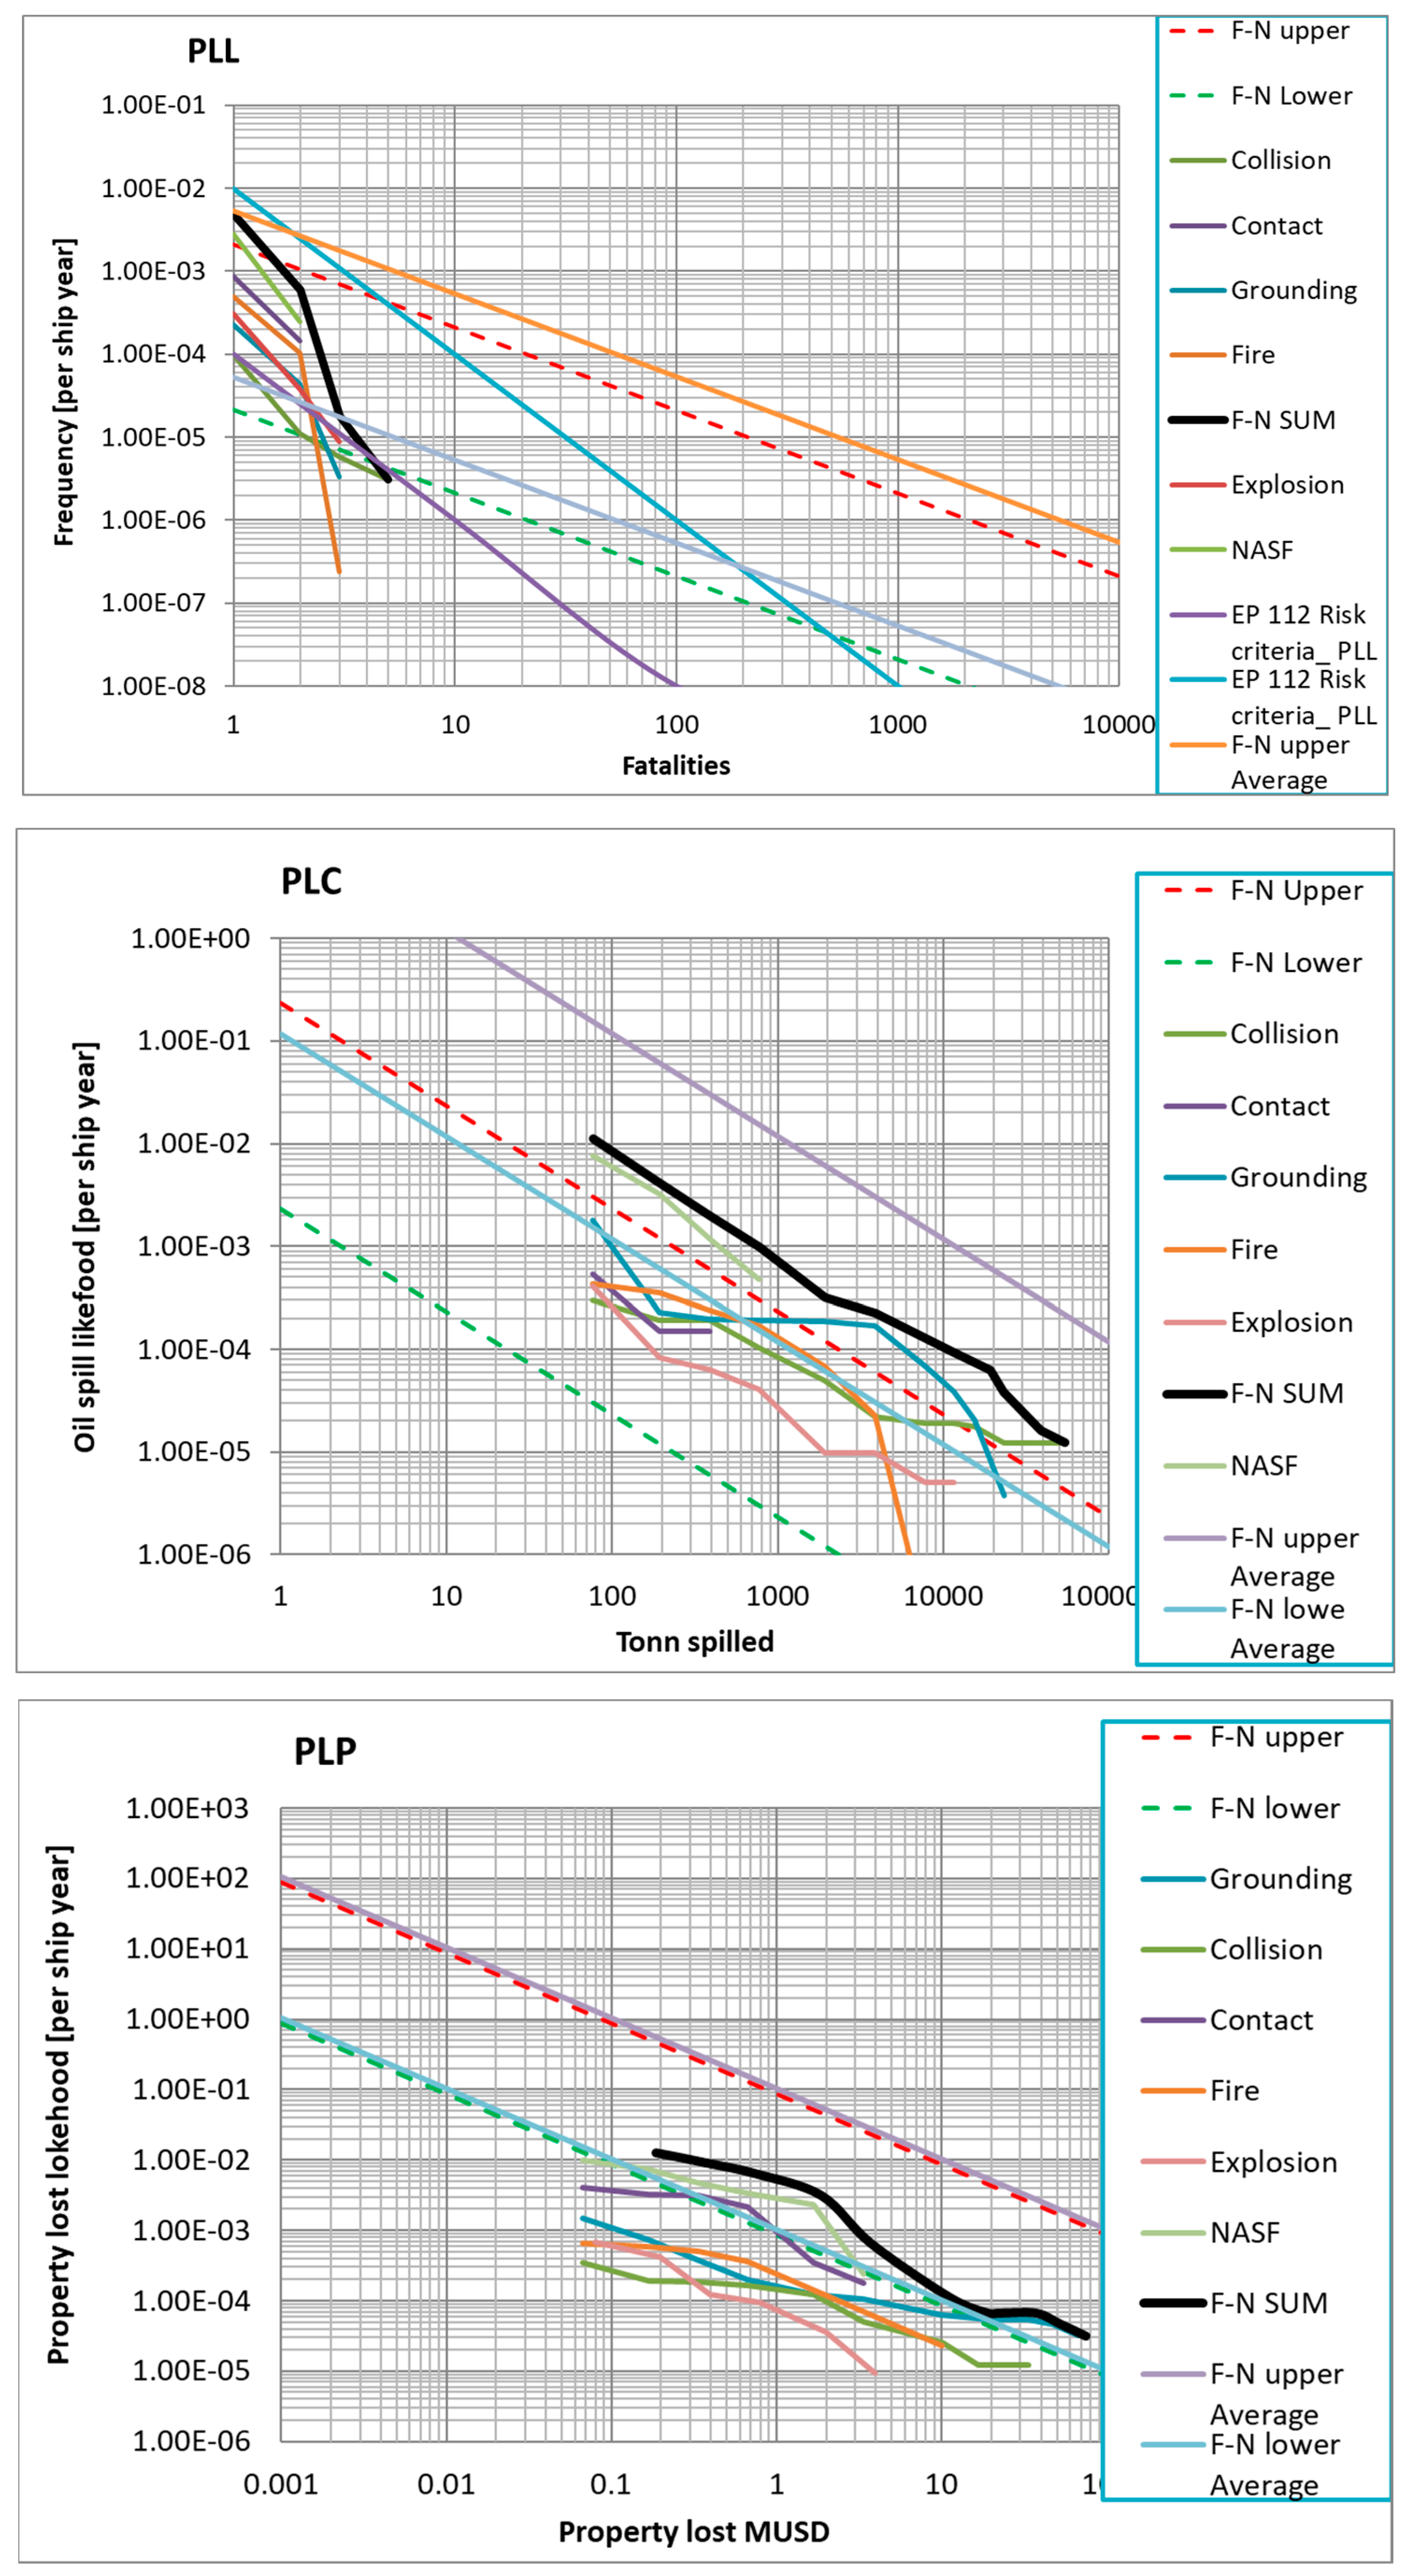
The overall risk is the sum of all individual risks for accidents. Risk monitoring is a continuous process that shows the “health state” of the shipping industry. There is no doubt that the black gold carried by oil tankers is one of the most precious goods at present. At the same time, the ecological threat of an oil spill is one of the most serious, with potential long-term consequences. The FSA evaluates a wide range of factors that define the risk of oil tanker transport; however, the risk criteria are limited to individual risks, derived from FAR or ARPA. Similarly, the environmental risk criteria are limited by the cost of cleaning and the consequent sanitation. However, the acceptability of the risk is more than a balance of costs; it is also a measure of a social development. It means a way of life, a way of work in a larger community. Observing the behaviour in a matter of oil tanker shipping over time shows the acceptability to the community for the three observed risks.
The risk curves in
Figure 8 are considered for the Panamax tanker size because it was the average size in a fleet in 2020. The F-N graphs for the period between 2016 and 2021 are included in the
Supplementary Material. The ALARP is delimitated by the upper and lower limit calculated for each year (dotted lines) and compared to the average limits calculated for the ten years period (2010 to 2020). Observing the situation in 2020, the average PLC limits are located high and the reason for this is mainly the accident of the tanker Sanchi in 2018.
Observing the F-N curves, we can see that the risk for grounding is unacceptable for spills between 2000 and 20,000 tonnes and for collision spills of 20,000 tonnes and more. The other accidents are within the ALARP or below. Summing together all of the F-N curves, the overall F-N curve is obtained and is above the upper limit. This result indicates that the PLC risks require the implementation of risk control activities with a particular focus on reducing collisions and grounding accidents. The backtracking on the event tree presents the possibility to understand which accidents are critical and contribute the most to the overall risk.
5. Conclusions
The continuous development of the world industry is based on the undisturbed trade of goods between countries. In addition to this development is the increased consumption of energy that is still mostly obtained through the combustion of hydrocarbons, and crude oil is the most highly demanded raw material. It has been presented that almost 40% of crude oil is transported by ships. Although over the last ten years, the overall share of oil seaborne trade dopped by 10%, due to the increase in the pipeline transfer, the quantities transported by ships remain almost the same. Observing the current disturbances in the oil supply through the pipeline to the EU due to the conflict in Ukraine, the seaborne trade remains the most reliable means of transport. Reliability, in this case, is focused on the purpose of transportation, i.e., the delivery of oil to the destination, even if some risks, especially PLC, are increased. Reliability and safety are usually analysed and tested separately, and the priority of the two depends on the area. According to the assessment made in the paper, in oil transportation, reliability is prioritised over environmental safety, even if the exceeding of the risk limit values is not very high and changes from year to year. Instabilities in society, such as the conflict in Ukraine, further upset the balance between reliability and safety.
Tanker shipping is particularly sensitive to safety issues, especially because of potential ecological risks in coastal areas that can greatly affect the life and economy of any place in question. The presented paper therefore continues the investigation of the paper Safety assessment of crude oil tankers [
13], with the update of the statistics and the improvement of the risk assessment models. The risk criteria for the three main risks, PLL, PLC and PLP, are evaluated yearly through the F-N risk curves. The risks for different kinds of accidents, such as collision, contact, grounding, fire, explosion and structural failures, are analysed statistically on a global scale to obtain an overview of the changes in the risk over the last fifteen years. The key finding is that the risk of the loss of containment is still above an acceptable level and, therefore, control measures are required to reduce small and medium accidental and operational releases. In the mean of the model, but also in practice, the solution is to reduce the number of accidents and/or improve the vessel reliability to reduce the likelihood of spills following an accident.
The relationship between the risk assessment for the loss of containment and the loss of property is significant because the strong economic impact of the oil trade outweighs the environmental concerns. While the economic aspect is more related to oil trading companies, the environmental aspect is more related to regulatory bodies. The common approach to delegate the acceptability of pollution risk to the costs of cleaning is direct and does not cover the indirect impacts to the environment. The correct term would be to base the acceptability on the cost of environment recovery. It is believed that this method would only be implemented with difficulty. The proposed approach to relate the oil spill acceptability with the spill quantity and ship revenue limits the acceptability to the ALARP region, even if small quantities are spilled and the chances in the transported quantities and oil prices do not influence the risk criteria. The key to obtaining an acceptable risk is therefore the reduction in spill quantities and the reduction in the number of accidents. The main findings were outlined above; however, at the system level, the control measures mean the mandatory VTS control of maritime traffic, the requirement for updated nautical charts, mandatory ECDIS with updated online charts and trained officers at the helm of vessels.


