Article

S-DETR: A Transformer Model for Real-Time Detection of Marine Ships

1
School of Information and Communication Engineering, Hainan University, Haikou 570228, China
2
Network Information Management Center, Shandong University of Art & Design, Jinan 250399, China
3
32033 Troops of the Chinese People’s Liberation Army, Haikou 570228, China
*
Author to whom correspondence should be addressed.
J. Mar. Sci. Eng. 2023, 11(4), 696; https://doi.org/10.3390/jmse11040696
Submission received: 14 February 2023 / Revised: 22 March 2023 / Accepted: 23 March 2023 / Published: 24 March 2023
(This article belongs to the Section Ocean Engineering)

Abstract

:
Due to the ever-changing shape and scale of ships, as well as the complex sea background, accurately detecting multi-scale ships on the sea while considering real-time requirements remains a challenge. To address this problem, we propose a model called S-DETR based on the DETR framework for end-to-end detection of ships on the sea. A scale attention module is designed to effectively learn the weights of different scale information by utilizing the global information brought by global average pooling. We analyzed the potential reasons for the performance degradation of the end-to-end detector and proposed a decoder based on Dense Query. Although the computational complexity and convergence of the entire S-DETR model have not been rigorously proven mathematically, Dense Query can reduce the computational complexity of multi-head self-attention from O ( N q 2 ) into O ( N q ) . To evaluate the performance of S-DETR, we conducted experiments on the Singapore Maritime Dataset and Marine Image Dataset. The experimental results show that the proposed method can effectively solve the problem of multi-scale ship detection in complex marine environments and achieve state-of-the-art performance. The model inference speed of S-DETR is comparable to that of single-stage target detection models and meets the real-time requirements of shoreside ship detection.

1. Introduction

Maritime target detection is of great significance to the establishment of a maritime intelligent traffic monitoring, management and service system. Maritime target detection refers to target detection for specific maritime targets such as ships and buoys. As the traditional shipping industry is gradually advancing from digitization and informatization to intelligence, accurate maritime target detection can be applied to maritime driving, obstacle avoidance and detection, and military detection. Maritime target detection can be roughly divided into onshore images such as SeaShips [1], aerial images such as DOTA [2], and satellite images such as the SAR ship detection dataset [3] according to image sources. Aerial images and satellite images are from a top-down perspective. The acquisition and preprocessing of these two types of images require a lot of time and are difficult to use in real time. At the same time, these two types of images are greatly affected by weather such as fog, and cannot meet the needs of all-weather detection. The onshore image is a side-view perspective, easy to use in real time, and a single sea target occupies more pixels and higher resolution, so it has higher practical value. This paper mainly focuses on the detection of ship targets at sea based on onshore images.
Figure 1 shows the typical scene of ship target detection in onshore images. The typical feature of these images is that the proportion of ships in the whole image is small, which is a typical small target detection problem. However, unlike traditional small target detection tasks, ship detection based on onshore images has some special difficulties:(1) A large number of small targets such as buoys in the image will reduce the accuracy of target detection, as shown in Figure 1a. (2) Due to the difference in the size of the ship itself or the distance from the shore, the size of the ship in the image varies greatly, as shown in Figure 1b. (3) There is serious occlusion between ships. It can be seen that accurate marine ship detection is very challenging.
According to the characteristics of ship target detection tasks in onshore images, many scholars have proposed different detection methods. Krüger [4] detected the features of the sea level based on color segmentation and edge detection, and then separated the ship from the water by image registration and subtraction. Prasad [5] studied background subtraction methods systematically, which was suitable for scenes with features such as water, sharp dynamics of water, ghost effects, and multiple detections. This kind of maritime target detection based on manual features often needs to be specially designed for specific scenarios, and the generalization of the method is weak. In recent years, marine ship target detection based on deep learning has received more attention. The representative work is the ship target detection models based on the Faster R-CNN [6] and Mask R-CNN [7] proposed by Moosbauer [8]. Soloviev [9] compared the application of three state-of-the-art (SOTA) CNN-based algorithms in ship target detection.
Existing CNN-based models must manually design spatial anchor or non-maximum suppression (NMS), which brings a lot of inconvenience to model deployment. Moreover, the CNN-based models are characterized by focusing on the extraction of local area features and lacking the ability to model long-term dependencies. This characteristic makes such models unable to make full use of the surrounding environment information to assist ship detection. The DETR model [10], which has achieved excellent performance in other vision fields, has the potential to replace CNN and achieve better performance in ship target detection. However, some inherent defects of the DETR model make it impossible to be directly applied to the field of ship detection, such as poor detection performance for small targets. According to the characteristics of the ship detection scene, this paper presents a design for a ship detection model (S-DETR). The main contributions are as follows:
(1)
A ship detection transformer model design based on shore images for the first time. Taking advantage of the global modeling capability of the transformer architecture, the model achieved the best performance on the public dataset, the Singapore Maritime Dataset. The proposed S-DETR model can be used as a baseline model to study transformer-based methods for ship detection.
(2)
A scale attention module that fuses multi-scale information is designed in the backbone network, which is better than simply using convolution to fuse different scale branch information in the past. The detection performance can be improved in the scene where the ship scale changes significantly.
(3)
We propose a new decoder for DETR, i.e., DQ-decoder, which significantly improves DETR on crowd ship detection. The DQ module can greatly improve the detection performance in dense ship scenes without increasing the computational complexity. The decoder has the potential to serve as a plug-and-play module for other intensive detection tasks.

2. Related Works

2.1. Ship Detection Method Based on Deep Learning

For a long time, CNN-based models have been widely used in ship detection. Shao et al. [11] proposed a saliency detection method based on YOLOv3 considering coastline information. Kim et al. detected ships based on Faster RCNN [12], and then recovered missed maritime targets from a series of images through the IoU of frames between consecutive frames [13]. Based on the YOLOv3 model, Li replaced the maximum pooling layer with a convolutional layer and expanded the channel of the prediction network. In addition, he introduced an attention mechanism CBAM [14] to improve the detection performance [15]. Kim et al. applied YOLOV5 to the Singapore Maritime Dataset (SMD), and achieved a score of 0.304 on the mAP@0.5 index [16].
In recent years, the DETR model with the transformer architecture as the core has been applied in many target detection tasks [17,18]. Bar et al. proposed the DTTReg model, applied the DETR model to the field of ship detection, and proposed a self-supervised method for preprocessing the entire object detection network, establishing many SOTA results [19]. However, this study is only applicable to SAR images. To the best of our knowledge, there is currently no DETR model for ship detection based on onshore images. This may be due to the fact that the DETR model is not suitable for small target detection tasks with occlusions.

2.2. DETR and Deformable DETR

The DETR model combines the transformer and CNN architectures. It uses the powerful global feature learning capabilities of the transformer model to predict the category, location, and border information of multiple objects including targets and backgrounds in parallel. Compared with the one-stage and two-stage target detection methods, this method has more advantages in prediction accuracy and inference speed, and can meet the needs of ship target detection tasks.
The core of the DETR model is to model target detection as a set prediction problem, and use the transformer’s self-attention mechanism to reason about the relationship between the target and the global image context, thereby improving the detection accuracy of the model. The DETR model consists of four parts: backbone for extracting features, transformer-based encoder, decoder and, prediction heads.
Since transformer-based detection models have achieved excellent performance on standard datasets, researchers have tried to apply it to various practical scenarios. OW-DETR [20] has proved the effectiveness and feasibility of introducing the transformer framework into the open world target detection task. PTSEFormar [21] uses the idea of progressive feature aggregation to improve the detection performance of DETR and this has been applied in the field of video surveillance. As far as we know, there is no transformer model for ship detection based on onshore images. In this scenario, the scale of the target changes greatly and the real-time requirement of detection is strict, so the existing detection model based on transformer cannot be applied. The S-DETR model proposed below not only improves the accuracy of target detection under large-scale distribution, but also meets the requirements of real-time detection.

3. Methods

3.1. Overall Framework

We designed a model as shown in Figure 2, which we call Ship DEtection TRanformer (S-DETR). The S-DETR model consists of four parts: backbone, encoder, decoder, and prediction heads. The encoder and prediction heads use the same design as the original DETR. Our improvement to the DETR model is mainly aimed at the backbone and the decoder.
The image is first input into the CNN-based backbone network, and the final feature map is obtained after passing through the multi-scale network and scale attention (SA) module in turn. The obtained feature map is expanded into one dimension and position encoding information is added to be input into the encoder, and the encoder outputs N fixed-length embedding vectors. In order to preserve the position information in the sequence data, it is necessary to add position encoding to the embedding vector. We use sine and cosine functions to encode the odd and even dimensions of each position without learning additional parameters. After being processed by the encoder, a series of candidate features embedded in the positional coding are obtained. The Decoder module takes as input a small number of learned positional embeddings (object queries). Finally, through a weight-shared feed-forward network, each embedded candidate feature is decoded in parallel into a target category (class) and a bounding box (box) or no target class (no object).
The main modules of the DETR are described below.
Backbone. The two-dimensional representation of the input image is learned through Resnet50 or Resnet101. Before passing it to the encoder, 1 × 1 convolution is used to flatten the image features, and it is then sent to the transformer-based encoder together with the positional encoding of the image. Assuming the size of the original input image is C × H × W (C represents the number of image channels), the image becomes a low-resolution feature map after being sampled 32 times by ResNet, and the number of channels increases to 2048.
Positional Encoding. The feature map of the original image extracted by ResNet needs to be divided into several blocks. Each block is similar to the sequence vector in the natural language processing task, and these blocks are input into the encoder part of the transformer module in parallel. However, for the encoder, the input sequence of each block does affect the final prediction result, which is contrary to the principle of position sensitivity of the target detection task. To solve this problem, a spatial position encoder is introduced. The positional encoding formula is as follows:
P E ( p o s , 2 i ) = sin ( p o s / 10,000 2 i / d k )
P E ( p o s , 2 i + 1 ) = cos ( p o s / 10,000 2 i / d k )
PE is a two-dimensional matrix, the size of which is the same as that of the feature map. dk represents the dimension size of the block vector. In this paper, the dimension of the block vector is consistent with the number of channel C of the feature map after down-sampling. pos represents the position of the current feature vector in the entire input sequence. The above formula means adding the sine vector at the even number position of each block vector and the cosine vector at the odd number position to fill the whole PE matrix, and then adding the matrix and the prediction feature map to realize position coding.
Encoder. Essentially, the self-attention module computes pairwise interactions between elements in the input. In the DETR, self-attention is set to be all pairwise interactions while the deformable DETR [22] only computes a sparse set of interactions. The input of the encoder of the DETR and deformable DETR are the features extracted from the backbone. The encoder module mainly includes a multi-head self-attention layer, layer normalization and feedforward neural network. Encoder modules stack N layers, and a residual structure similar to ResNet is adopted in a single encoder module. The shallow input x is added with the encoded vector, and finally transferred to the next layer of the network structure through the layer normalization method.
The attention mechanism can map the feature vectors output by the convolution network into query vectors, key vectors and value vectors. Given the query vector of the target element, the weight coefficient of the value corresponding to each key is obtained by calculating the similarity between the query and each key. The value vector is weighted and summed through the weight coefficient to obtain the final attention value:
Attention ( Q , K , V ) = s o f t max ( Q K T d k ) V
where Q, K, and V represent query vector, key vector, and value vector, respectively.
The above calculation process can be abstracted into two stages.
In the first stage, the vector dot product, cosine similarity, and neural network are usually used to calculate the similarity between the query vector and key vector. The calculation formula is as follows:
S i m ( Q , K ) = Q K Q K
where represents the norm of the matrix.
In the second stage, the Softmax function is used to numerically convert the similarity value in the first stage, highlight the weight of important elements, and obtain the weight coefficient ai of Vi. The calculation formula is as follows:
a i = softmax ( Sim i ) = e S i m i j 1 L x S i m j
where L x represents the length of the sequence.
The multi-head attention mechanism integrates the attention layer represented by multiple subspaces on the basis of the conventional attention mechanism, so that the model can focus on different dimensions of information. After the parallel calculation is completed, the model splices the output of each sub-layer to get the final attention value:
M u l t i H e a d ( Q , K , V ) = C o n c a t ( h e a d 1 , , h e a d h ) W O
h e a d i = A t t e n t i o n ( Q W i Q , K W i K , V W i V )
where h e a d m in the formula represents the m-th attention head, the multi-head self-attention mechanism combines the representation vectors of multiple subspaces at different positions, and W is a linear projection matrix.
The decoder module is the basic component of the transformer module, and is also the key module for the S-DETR model to complete ship detection. The decoder is stacked with M layers, and the input of the decoder part is the object query vector during network initialization. The decoder module of the original DETR needs to predefine the number of target queries, which determines the final detection performance, so we have to face the contradiction between detection efficiency and detection accuracy. This paper proposes a new decoder based on dense queries to solve the above problem, which will be described in detail in Section 3.3.

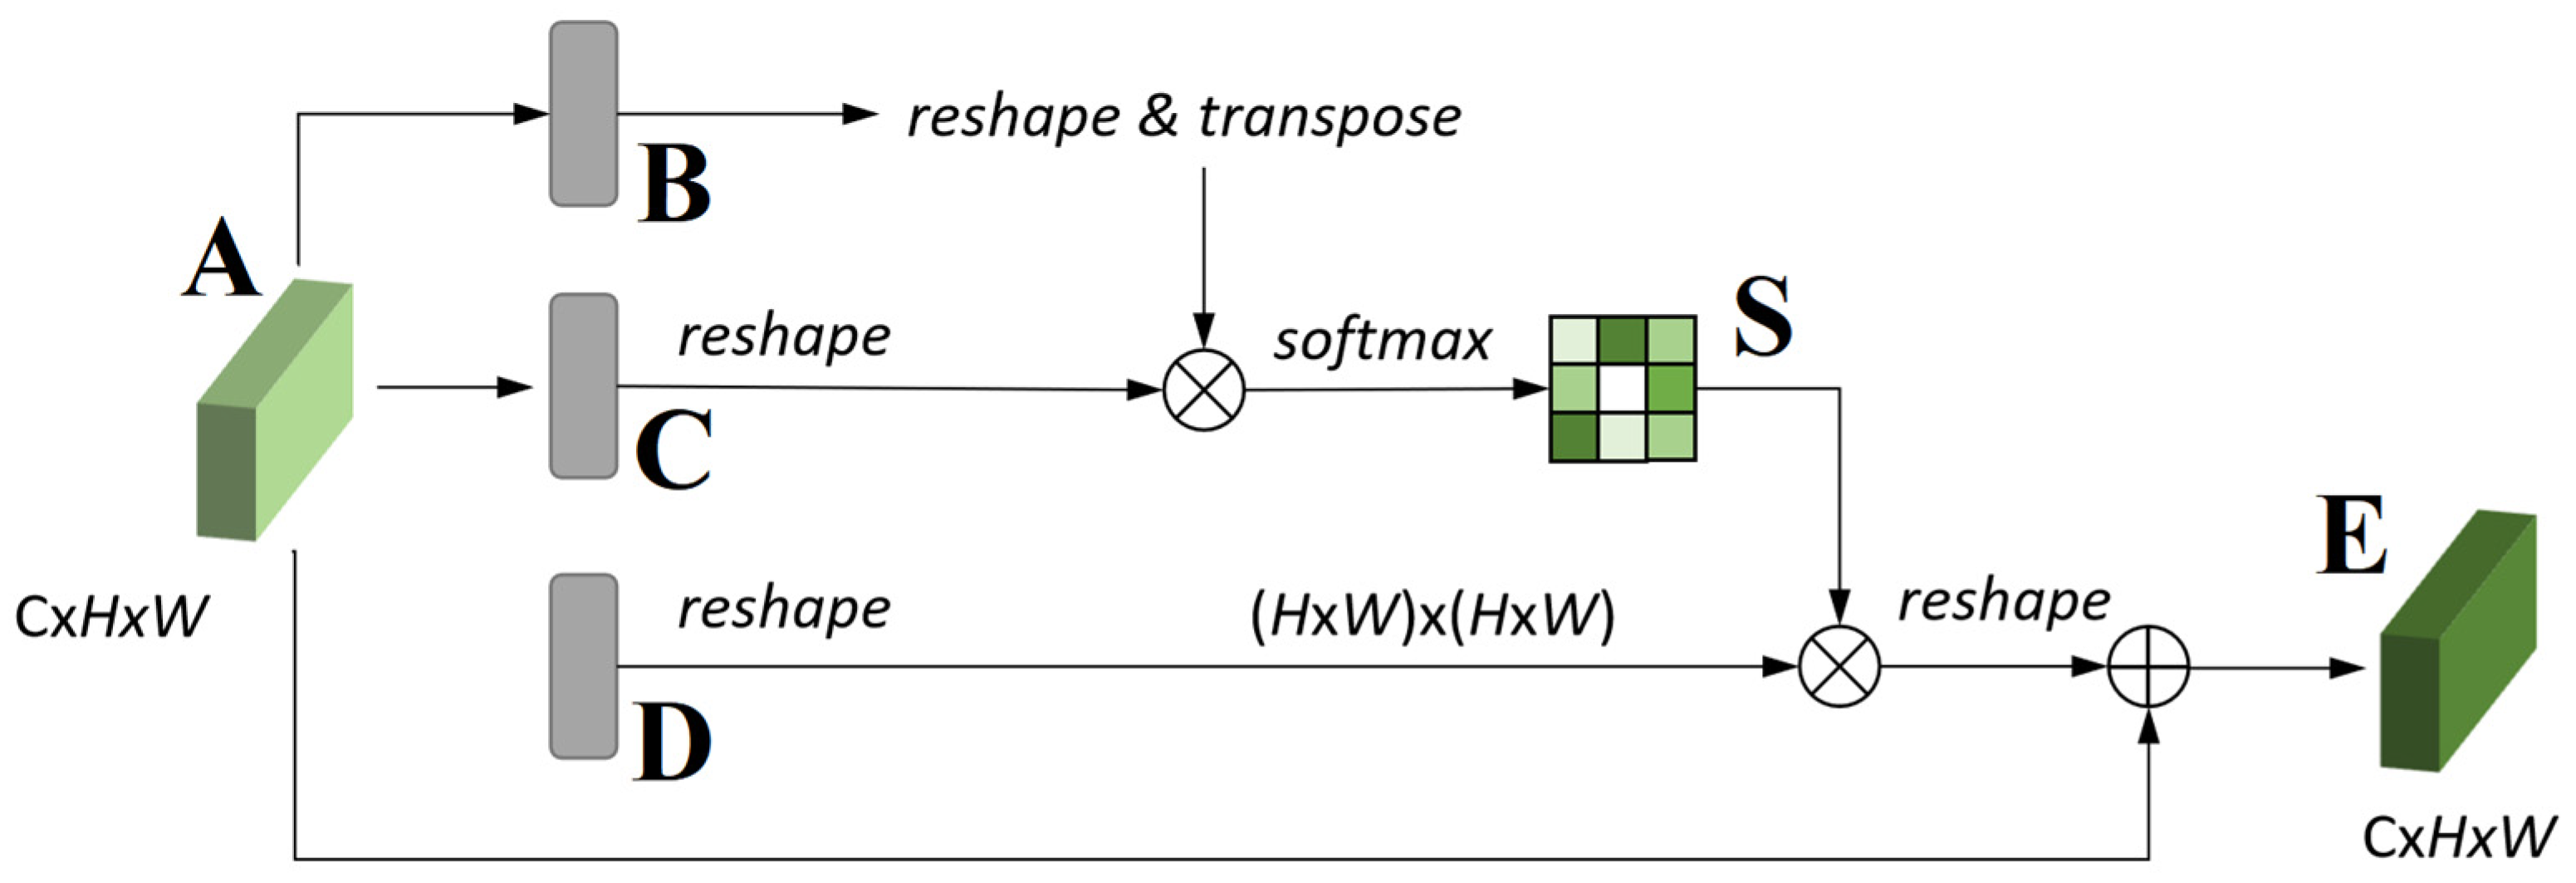
3.2. Scale Attention Module

Accurate ship detection is very difficult due to the complexity of the environment of ship images and the huge differences in target scales. In order to enable the detection model to deal with the problem of large changes in the target scale, we designed the backbone of the S-DETR model to be in the form of a series connection of ResNet50, PSPNet, and the fusion module. Among them, ResNet50 is used to extract low-level features of images, and PSPNet [23] is a typical multi-scale feature extraction network. The fusion module is critical to the performance of this backbone structure. Most of the existing methods for fusing multi-scale branches use convolution kernels or fully connected layers. These fusion methods have a large information loss during the fusion process. Moreover, these fusion methods rely on manual experience and are weak in generalization. We employ an attention mechanism to fuse multi-scale information. However, the existing attention mechanism has a coupling effect in the fusion of multi-scale information, which makes it difficult for the model to converge. This phenomenon will be described below through the derivation of mathematical formulas.
Taking the location relational attention mechanism [24] as an example, given a local feature A R C × H × W , its calculation formula is as follows:
s j i = exp ( B i C j ) i = 1 N exp ( B i C j )
where s j i represents the influence of the i-th position on the j-th position; the more similar the feature expressions of the two positions are, the stronger their correlation is. In the self-attention mechanism, it generally includes query, key, and value vectors, which are represented by B , C , and D in turn. See Figure 3 for the meaning of B , C , and D .
In order to obtain the relationship between x i and x j , the query can be expressed as q u e r y i = W q x i , and the key can be expressed as k e y j = W k x j . Its calculation formula can be expressed as follows:
w ( x i , x j ) = σ ( q u e r y i T k e y j ) = exp ( q u e r y i T k e y j ) t = 1 N p exp ( q u e r y i T k e y t )
where exp(·) stands for exponential function formula. q u e r y i T k e y j refers to the dot product of the query vector and key vector.
Since B , C , and D are all obtained by reducing the number of channels of A through 1 × 1 convolution, the reference [25] proves that the attention calculation can be divided into two parts: The first part is the whitened pair item representing the relationship between two position pixels. The second part is a unary term representing the salient features of the respective positions. First, the query and key vectors are whitened, as shown in the following Formula:
μ q u e r y = 1 N p i = 1 N p q u e r y i μ k e y = 1 N p i = 1 N p k e y i
q u e r y i T k e y j can be split as follows:
q u e r y i T k e y j = ( q u e r y i μ q u e r y ) T ( k e y j μ k e y ) + μ q u e r y T k e y j + q u e r y i T μ k e y + μ q u e r y T μ k e y
After the softmax layer, the last two items are eliminated, and the first item of the remaining items is a pair item, representing the relationship between two position pixels; the second item is a single item, which only depends on the position of the key vector. Since these two items are learned and updated at the same time during the training process, there is inevitably a coupling problem. In the same way, there are also such problems in the channel attention module. Because the essential principles of the channel attention module and the position attention module are the same, only the objects are different.
In order to solve the coupling problem and add global information to guide target detection at the same time, a feasible idea is to separate the paired items from the unary single items. On the basis of the original channel attention module, we perform a zero-centralization process before performing matrix multiplication to obtain the attention map. The second item in formula (11) is removed, keeping only the paired items, and the relationship between pixels at different positions is learned separately. A branch is added to the original channel attention module to obtain global information through global average pooling. The network structure diagram design based on this idea is shown in Figure 4.
The network contains two submodules: The first one is depicted by the blue dotted line. Before the channel attention module obtains the attention image by multiplying the matrix, it first goes through the centralization process and only keeps the paired items without internal interference. The second is the green dotted box, where the channel correction module obtains the weights on each channel through a global average pooling operation, and uses this global information to guide the scale attention network. The reason why the scale attention module is suitable for the ship detection task is that it has stronger fusion of different scale information and can introduce the guidance of global information. Therefore, the model can more accurately determine which scale or channel is the most important, and then adaptively allocate appropriate weights.

3.3. Dense Queries

We find a conflict between the locally dense distribution of GTs and the uniformly sparse distribution of query set q . Specifically, after training, the initial cross attention fields Ω c , 0 of different queries are uniformly distributed on the feature map, as shown in Figure 4 (left), due to the uniform appearance of ships. The queries are also sparse due to the limit of computation resources. However, in a single image, ships tend to be distributed densely in some local regions naturally, while the number of queries q 0 whose attention field Ω c , 0 locates initially in such local dense regions is not always enough to match all ships lying in them, as in Figure 5. This means the decoder layers F t learns to shrink the attention fields Ω c , t 1 of the uniformly distributed sparse queries progressively from the whole image to compact dense object clusters, we observe this shrinking process in Figure 4, e.g., the initial positions of queries are uniformly distributed and at the last decoder layer queries must adapt their position to a densely clustered distribution.
Figure 4 shows visual comparisons between the central positions of the attention fields Ω c of the queries in the first decoder layer (left) and the last decoder layer (right). We can observe that object queries need to learn how to shrink a sparse uniform distribution to a dense cluster of ships. The size of each circle is representative of the predicted area of each box predicted by the corresponding query.
This process has two requirements: (1) a vast perception range of objects and (2) mapping from a vast range of initial positions to local dense GTs. Two conflicts stand in the way of the two requirements. On one hand, the vast perception range suggests a strict requirement on the CNN’s reception field. On the other hand, the mapping is highly ambiguous because there are few prior geometry cues for queries to decide how GTs are assigned among them; indeed, although queries are supervised by strict bipartite matching, there is still an imbalance between the number of queries lying on different GTs in the dense object clusters.
The discussions above imply that dense queries will help. When queries are dense enough, the bipartite matching result of each GT is roughly its nearest unique query and the requirement of the query’s reception field is much lower. However, the time complexity of the MSA (multi-head self-attention) module is quadratic of the query number and hardly bears a dense query setting. We designed a Dense Query (DQ) module to support a dense setting via reducing the complexity of the MSA from O ( N q 2 ) into O ( N q ) of the query number N q .
In the transformer, queries have a one-to-one correspondence to the token positions, and locality can be naturally designed by restricting Ω i s to some near positions { , i 1 , i , i + 1 , } . To develop a distance measure for queries in the DETR [15], we first review what queries should be in Ω i s for a certain query q i . In the MSA, q i receives information from queries in Ω i s to determine whether itself or another query in Ω i s is matched to a GT. This reasonable assumption suggests that the distance should be measured by the possibility that two queries will match the same GT. Considering that each decoder layer predicts its box set b i t sequentially, we use the overlaps between q i t 1 ’s box prediction b i t 1 and q j t 1 ’s b j t 1 in the former decoder layer, to measure the distance of q i t 1 and q j t 1 , because the higher the overlap, the more possible that q i t 1 and q j t 1 predict the same GT. Hence, we define the distance measure d i j t 1 and Ω i s , t 1 as:
d i j t 1 = 1 G I O U ( b i t 1 , b j t 1 )
Ω i s , t 1 = { τ i 1 t 1 , τ i 2 t 1 , , τ i K t 1 }
where τ i t 1 is the ascending order of d i t 1 and we select the nearest K neighbors of q i t 1 based on the defined d i t 1 . As shown in ablation studies, our DQ algorithm supports twice as many queries without calculation cost increase and achieves even better performance than simply adding twice the queries without changing Ω i s via forcing queries to focus only on nearby queries. The original self-attention’s complexity is O ( N q d 2 + d N q 2 ) , where d is the feature dimension and our DQ’s complexity is O ( N q d 2 + d N q K ) , where K represents the number of keys a query is allowed to attend.
Through self-attention a query can attend any other query on the image, allowing a query to refine its position to any other query’s position; our DQ module only allows a query to attend its nearest K queries based on the GIOU distance, preventing our query from refining its position too far from its original position. This can help further reduce the optimization difficulty on dense prediction tasks. The GIOU distance is defined as follows:
G I O U ( b i t 1 , b j t 1 ) = | b i t 1 b j t 1 | | b i t 1 b j t 1 | | C \ ( b i t 1 b j t 1 ) | | C |
where C is the minimum convex set of b i t 1 and b j t 1 .

4. Experiments and Results

4.1. Data and Experimental Preparation

Dataset. We choose the Singapore Maritime Dataset (SMD) and Marine Image Dataset (MID) to verify the proposed method. The target images in these two datasets often occlude each other, and the target sizes vary greatly, which is close to the real maritime surveillance scene. In addition, these two data sets also include image problems such as water surface reflection, visual blurring caused by adverse weather conditions, and low illumination. The detection targets of SMD can be divided into 8 categories, including: Ferry, Buoy, Ship, Speed Boat, Boat, Kayak, Sail Boat, and Other. The MID divides obstacles into large obstacles (those crossing the water edge) and small obstacles (those completely surrounded by water). The SMD contains 36 shore-based videos and 4 ship-borne videos manually labeled. The SMD contains a total of 17,967 tagged images, with an image size of 1920 × 1080. The MID contains eight video sequences for marine obstacle detection, with 2655 labeled images in the dataset. We resized the images from these two datasets to 640 × 640 and input them into the model. It should be pointed out here that if the S-DETR model is deployed to the actual scene, it may be necessary to increase the noise filtering operation, because the actual collected image will have noise information. However, in the public datasets selected in this paper, the labelled data are carefully selected, so no additional noise filtering is required. We divided the datasets according to the ratio of 7:3 for the training set and the test set. In order to deal with the imbalance of the amount of data in each category in the data set and to avoid the problem that the data distribution in the training set is different from that in the test set, we first divided the sample set into k mutually exclusive subsets of similar size, and each subset kept the consistency of the data distribution as much as possible, that is, they were obtained from the sample set through stratified sampling. On this basis, the number of samples among different categories was balanced through data augmentation.
Evaluation Metrics. The detection performance of the model was evaluated by the index mAP@.5. mAP@.5 means the average value of the average precision of each category when the intersection over union (IoU) is set to 0.5. The number of transmission frames per second (FPS) was used as the evaluation index of the detection speed, and the detection result was affected by the hardware.
Detailed Parameter Settings. ResNet50 was used as the backbone. Except for the SA module and DQ module, other model parameters were consistent with the DETR. The experimental equipment was NVIDIA V100 for training and NVIDIA 1080TI for inference. In other words, we first trained the model on the high-performance GPU and evaluated its prediction accuracy. After that, the inference speed of the model was evaluated on the low performance GPU. During the training process, the optimizer chose SGD, and the learning rate adjustment strategy adopted the poly strategy, where the power was set to 0.9 and the minimum learning rate was set to 1 × 10⁻⁴. The batch size in training was set to 2 images for a single card, and the total batch size was 16. Data augmentation methods used in data processing included scaling, random cropping, random horizontal flipping, and normalization. The normalization method here used the synchronous batch normalization (syncbn) that comes with pytorch.

4.2. Experimental Results

We conducted performance comparisons with the standard YOLO-V5 [16] baseline along with other SOTA methods on the SMD. We report the results on the SMD using the following two metrics: mAP@.5 and FPS. Table 1 shows our final results on the SMD. Our proposed S-DETR improves by a large margin on ship detection compared with current SOTA methods. Compared with the SOTA model CenterNet, the S-DETR increased by 5.99% in the mAP@.5 index, and the FPS increased by 14.15%. It is worth noting that although the performance of the DETR and Deformable DETR on the SMD is better than the baseline, there is still a big gap with other SOTA models. This gap is mainly reflected in the significant degree of missed detection in long-distance detection. Compared with the SMD, the performance of each model on the MID is better, which is mainly related to the smaller number of categories in this dataset. Whether it is the mAP@5 or FPS index, S-DETR also achieved superior performance. Experiments on the MID verify the robustness of S-DETR detection performance.
In addition to achieving SOTA performance in accuracy and model inference speed, the S-DETR has a potential advantage in that it does not need NMS post-processing and anchor, which makes it possible to train the detection model without prior human knowledge using large-scale data.
An example of object detection results based on the S-DETR is shown in Figure 6. It can be seen that the S-DETR has superior detection performance for dense small targets at the sea-sky boundary, and even detects incomplete targets, achieving ideal detection results.

4.3. Ablation Study

We performed ablation studies and report the highest accuracy during training for the proposed methods on the SMD dataset. At the latter layers, the predicted bounding boxes are less likely to fluctuate, hence we always start by replacing the latter layers.

4.3.1. Ablation Study on Scale Attention Module

In order to verify the effectiveness of the SA module, an ablation experiment was carried out on the backbone of the S-DETR. The experimental results are shown in Table 2.
It can be seen that after introducing the multi-scale feature extraction network PSPNet, the mAP@.5 index increased by 9.9%. In ship recognition tasks, multi-scale information helps to improve detection accuracy. However, compared with “ResNet50+PSPNet” and “ResNet50+PSPNet+Scale Attention”, it can be seen that the performance can be further improved by 16.5% by using the scale attention module. When only using channel attention or channel correction for multi-scale feature fusion, the improvement compared to “ResNet50+PSPNet” is less than 1%. Therefore, the scale attention module does offer a great improvement for multi-scale information fusion, and the effect of using the channel attention sub-module alone is not as good as using the channel correction sub-module alone. This also shows that the channel attention does not use centralization to remove the coupling between paired items and single items, and its performance improvement effect is very limited.

4.3.2. Ablation Study on Dense Queries

Table 3 shows improvements from the DQ module. Our baseline with 1000 queries significantly improves on the baseline with 400 queries, supporting our assumption that a dense query approach is needed. We varied the number of layers with DQ to reduce the computational cost and observed that applying six DQ layers on the baseline with 1000 queries improves even further as it forces queries to only attend to nearby queries, rather than irrelevant ones or the background.
Our DQ module is designed to force the detector to not refine the original positions of object queries too far from their original position, avoiding clustered and ambiguous distribution of queries. This helps queries attending relevant queries. As such, we should expect our module to impact the classification loss and not bounding box loss, as self-attention is mainly designed to help queries decide how GTs are assigned among them.

5. Conclusions

Ship target detection based on onshore images will make ship scheduling, motion planning and other downstream tasks possible [29]. In the past, scholars have carried out a lot of research work on ship target detection based on SAR images [30,31,32]; however, the research on onshore images is not sufficiently considered. In this paper, we present a design for the S-DETR, which to our knowledge is the first model to use transformers to detect ship targets in onshore images. We have studied in depth the problem that the non-local attention mechanism is not suitable for extracting multi-scale information in the backbone, and for the first time proposed a scale attention module for channel correction that combines channel attention and global channel information. This module is used to fuse information of different scales, which improves the detection effect of small target ships. In addition, we design a new decoder to enable the DETR model to achieve better performance in the ship detection task. Compared with the SOTA model CenterNet, our S-DETR has increased by 5.99% in the mAP@.5 and 14.15% in FPS on the SMD. Our model also achieved SOTA performance on the MID, which shows strong robustness. The model meets the performance requirements of ship detection on the sea surface, and also makes the model deployment more convenient.
In the future, we will focus on improving the detection robustness of the S-DETR in occluded scenes and aim to provide mathematical proofs related to the convergence of the model. Moreover, due to the scarcity of labeled onshore images, we plan to explore domain adaptive methods [33], semi-supervised learning [34], or self-supervised learning [35] to train the model more efficiently and improve its detection performance.

Author Contributions

Conceptualization, Z.X. and J.R.; methodology, Z.X. and X.F.; software, Z.X. and Y.Z.; writing—original draft preparation, Z.X. and J.R.; writing—review and editing, Z.X. and J.R.; visualization, Z.X. and J.R.; supervision, Z.X.; project administration, Y.Z.; funding acquisition, Y.Z. All authors have read and agreed to the published version of the manuscript.

Funding

This research was funded by Hainan Provincial Natural Science Foundation of China, grant number 620MS024.

Institutional Review Board Statement

Not applicable.

Informed Consent Statement

Not applicable.

Data Availability Statement

SMD: https://sites.google.com/site/dilipprasad/home/singapore-maritime-dataset (accessed on 12 February 2023); MID: github.com/aluckyi/MID (accessed on 2 March 2023). The source code of the S-DETR can be downloaded at: https://github.com/cleverboyXZJ/code (accessed on 12 February 2023).

Conflicts of Interest

The authors declare no conflict of interest.

References

  1. Shao, Z.; Wu, W.; Wang, Z.; Du, W.; Li, C. SeaShips: A large-scale precisely annotated dataset for ship detection. IEEE Trans. Multimed. 2018, 20, 2593–2604. [Google Scholar] [CrossRef]
  2. Xia, G.-S.; Bai, X.; Ding, J.; Zhu, Z.; Belongie, S.; Luo, J.; Datcu, M.; Pelillo, M.; Zhang, L. DOTA: A large-scale dataset for object detection in aerial images. In Proceedings of the IEEE Conference on Computer Vision and Pattern Recognition, Salt Lake City, UT, USA, 18–23 June 2018; pp. 3974–3983. [Google Scholar]
  3. Zhang, T.; Zhang, X.; Li, J.; Xu, X.; Wang, B.; Zhan, X.; Xu, Y.; Ke, X.; Zeng, T.; Su, H.; et al. SAR Ship Detection Dataset (SSDD): Official Release and Comprehensive Data Analysis. Remote Sens. 2021, 13, 3690. [Google Scholar] [CrossRef]
  4. Krüger, W.; Orlov, Z. Robust layer-based boat detection and multi-target-tracking in maritime environments. In Proceedings of the 2010 International WaterSide Security Conference, Carrara, Italy, 3–5 November 2010; pp. 1–7. [Google Scholar]
  5. Prasad, D.K.; Prasath, C.K.; Rajan, D.; Rachmawati, L.; Rajabally, E.; Quek, C. Object Detection in A Maritime Environment: Performance Evaluation of Background Subtraction Methods. IEEE Trans. Intell. Transp. Syst. 2019, 20, 1787–1802. [Google Scholar] [CrossRef]
  6. Girshick, R. Fast R-CNN. In Proceedings of the IEEE International Conference on Computer Vision, Washington, DC, USA, 7–13 December 2015; pp. 1440–1448. [Google Scholar]
  7. He, K.; Gkioxari, G.; Dollár, P.; Girshick, R. Mask R-CNN. In Proceedings of the IEEE International Conference on Computer Vision, Venice, Italy, 22–29 October 2017; pp. 2961–2969. [Google Scholar]
  8. Moosbauer, S.; Konig, D.; Jakel, J.; Teutsch, M. A benchmark for deep learning based object detection in maritime environments. In Proceedings of the IEEE Conference on Computer Vision and Pattern Recognition Workshops (CVPRW), Long Beach, CA, USA, 16–17 June 2019; pp. 916–925. [Google Scholar]
  9. Soloviev, V.; Farahnakian, F.; Zelioli, L.; Iancu, B.; Lilius, J.; Heikkonen, J. Comparing CNN-Based Object Detectors on Two Novel Maritime Datasets. In Proceedings of the IEEE International Conference on Multimedia & Expo Workshops (ICMEW), London, UK, 6–10 July 2020; pp. 1–6. [Google Scholar]
  10. Carion, N.; Massa, F.; Synnaeve, G.; Usunier, N.; Kirillov, A.; Zagoruyko, S. End-to-End Object Detection with Transformers. In Computer Vision—ECCV 2020; Vedaldi, A., Bischof, H., Brox, T., Frahm, J.M., Eds.; Springer International Publishing: Cham, Switzerland, 2020; pp. 213–229. [Google Scholar]
  11. Shao, Z.; Wang, L.; Wang, Z.; Du, W.; Wu, W. Saliency-Aware Convolution Neural Network for Ship Detection in Surveillance Video. IEEE Trans. Circuits Syst. Video Technol. 2020, 30, 781–794. [Google Scholar] [CrossRef]
  12. Ren, S.; He, K.; Girshick, R.; Sun, J. Faster R-CNN: Towards real-time object detection with region proposal networks. IEEE Trans. Pattern Anal. Mach. Intell. 2017, 39, 1137–1149. [Google Scholar] [CrossRef] [PubMed] [Green Version]
  13. Kim, K.; Hong, S.; Choi, B.; Kim, E. Probabilistic Ship Detection and Classification Using Deep Learning. Appl. Sci. 2018, 8, 936. [Google Scholar] [CrossRef] [Green Version]
  14. Sanghyun, W.; Jongchan, P.; Joon-Young, L.; Kweon, I.S. CBAM: Convolutional Block Attention Module. In Proceedings of the European Conference on Computer Vision(ECCV), Munich, Germany, 8–14 September 2018; pp. 3–19. [Google Scholar]
  15. Li, H.; Deng, L.; Yang, C.; Liu, J.; Gu, Z. Enhanced YOLO v3 Tiny Network for Real-Time Ship Detection from Visual Image. IEEE Access 2021, 9, 16692–16706. [Google Scholar] [CrossRef]
  16. Kim, J.H.; Kim, N.; Park, Y.W.; Won, C.S. Object Detection and Classification Based on YOLO-V5 with Improved Maritime Dataset. J. Mar. Sci. Eng. 2022, 10, 377. [Google Scholar] [CrossRef]
  17. Huang, K.C.; Wu, T.H.; Su, H.T.; Hsu, W.H. MonoDTR: Monocular 3D Object Detection with Depth-Aware Transformer. In Proceedings of the IEEE/CVF Conference on Computer Vision and Pattern Recognition, New Orleans, LA, USA, 19–24 June 2022; pp. 4012–4021. [Google Scholar]
  18. Dang, L.M.; Wang, H.; Li, Y.; Nguyen, T.N.; Moon, H. DefectTR: End-to-end defect detection for sewage networks using a transformer. Constr. Build. Mater. 2022, 325, 126584. [Google Scholar] [CrossRef]
  19. Bar, A.; Wang, X.; Kantorov, V.; Reed, C.J.; Herzig, R.; Chechik, G.; Globerson, A. Detreg: Unsupervised pretraining with region priors for object detection. In Proceedings of the IEEE/CVF Conference on Computer Vision and Pattern Recognition, New Orleans, LA, USA, 19–24 June 2022; pp. 14605–14615. [Google Scholar]
  20. Gupta, A.; Narayan, S.; Joseph, K.J.; Khan, S.; Khan, F.S.; Shah, M. OW-DETR: Open-world Detection Transformer. In Proceedings of the 2022 IEEE/CVF Conference on Computer Vision and Pattern Recognition (CVPR), New Orleans, LA, USA, 19–24 June 2022. [Google Scholar]
  21. Wang, H.; Tang, J.; Liu, X. PTSEFormer: Progressive Temporal-Spatial Enhanced TransFormer Towards Video Object Detection. In Proceedings of the 2022 European Conference on Computer Vision, Cham, Switzerland, 24–28 October 2022; pp. 732–747. [Google Scholar]
  22. Zhu, X.; Su, W.; Lu, L.; Li, B.; Wang, X.; Dai, J. Deformable DETR: Deformable Transformers for End-to-End Object Detection. arXiv 2020, arXiv:2010.04159. [Google Scholar]
  23. Yin, Y.; Guo, Y.; Deng, L.; Chai, B. Improved PSPNet-based water shoreline detection in complex inland river scenarios. Complex Intell. Syst. 2022, 9, 233–245. [Google Scholar] [CrossRef]
  24. Fu, J.; Liu, J.; Tian, H.; Li, Y.; Bao, Y.; Fang, Z.; Lu, H. Dual Attention Network for Scene Segmentation. In Proceedings of the 2019 IEEE/CVF Conference on Computer Vision and Pattern Recognition (CVPR), Long Beach, CA, USA, 15–20 July 2020. [Google Scholar]
  25. Yin, M.; Yao, Z.; Cao, Y.; Li, X.; Zhang, Z.; Lin, S.; Hu, H. Disentangled non-local neural networks. In European Conference on Computer Vision; Springer: Berlin/Heidelberg, Germany, 2020; pp. 191–207. [Google Scholar]
  26. Zou, H.; He, S.; Wang, Y.; Li, R.; Cheng, F.; Cao, X. Ship detection based on medium-low resolution remote sensing data and super-resolved feature representation. Remote Sens. Lett. 2022, 13, 323–333. [Google Scholar] [CrossRef]
  27. Chen, Z.; Chen, D.; Zhang, Y.; Cheng, X.; Zhang, M.; Wu, C. Deep learning for autonomous ship-oriented small ship detection. Saf. Sci. 2020, 130, 104812. [Google Scholar] [CrossRef]
  28. Zhou, W.; Liu, L. Multilayer attention receptive fusion network for multiscale ship detection with complex background. J. Electron. Imaging 2022, 31, 043029. [Google Scholar] [CrossRef]
  29. Zhang, J.; Cui, Y.; Ren, J. Dynamic Mission Planning Algorithm for UAV Formation in Battlefield Environment. IEEE Trans. Aerosp. Electron. Syst. 2022, 55, 1004–1020. [Google Scholar] [CrossRef]
  30. Gong, M.; Cao, Y.; Wu, Q. A neighborhood-based ratio approach for change detection in SAR images. IEEE Geosci. Remote Sens. Lett. 2012, 9, 307–311. [Google Scholar] [CrossRef]
  31. Hakim, W.L.; Achmad, A.R.; Eom, J.; Lee, C.-W. Land Subsidence Measurement of Jakarta Coastal Area Using Time Series Interferometry with Sentinel-1 SAR Data. J. Coast. Res. 2020, 102, 75–81. [Google Scholar] [CrossRef]
  32. Kang, M.S.; Baek, J.M. SAR Image Reconstruction via Incremental Imaging with Compressive Sensing. IEEE Trans. Aerosp. Electron. Syst. 2023, 1–14. [Google Scholar] [CrossRef]
  33. Thota, M.; Leontidis, G. Contrastive domain adaptation. In Proceedings of the IEEE/CVF Conference on Computer Vision and Pattern Recognition, Nashville, TN, USA, 19–25 June 2021; pp. 2209–2218. [Google Scholar]
  34. Yoon, J.; Kang, D.; Cho, M. Semi-Supervised Domain Adaptation via Sample-to-Sample Self-Distillation. In Proceedings of the IEEE/CVF Winter Conference on Applications of Computer Vision, Waikoloa, HI, USA, 4–8 January 2022; pp. 1978–1987. [Google Scholar]
  35. Durrant, A.; Leontidis, G. Hyperspherically regularized networks for self-supervision. Image Vision Comput. 2022, 124, 104494. [Google Scholar] [CrossRef]
Figure 1. Typical onshore images: (a) Presence of buoy scenes; (b) Large differences in ship scale; (c) Ships obstructing each other.
Jmse 11 00696 g001
Figure 2. The architecture of S-DETR.
Jmse 11 00696 g002
Figure 3. The architecture of location relational attention mechanism.
Jmse 11 00696 g003
Figure 4. Structure of the Scale Attention module.
Jmse 11 00696 g004
Figure 5. Visual comparisons between the central positions of the attention fields of the queries in the first decoder layer (left) and the last decoder layer (right). The method of generating dots is as follows: first, the two-dimensional matrix corresponding to the transformer’s self-attention layer is normalized to obtain the heat map, then the pixels with the largest value of 10% are visualized, and the diameter of the red dots is set according to the normalized value.
Jmse 11 00696 g005
Figure 6. Example of detection results of S-DETR on SMD.
Jmse 11 00696 g006
Table 1. Results on the SMD and MID.
MethodSMDMID
mAP@.5FPSmAP@.5FPS
YOLO-V5 [18]0.30436.340.60237.42
Faster-Rcnn [26]0.71218.930.87418.84
SSD [27]0.69325.740.84525.85
CenterNet [28]0.73424.510.89124.28
DETR0.57827.850.71327.72
Deformable DETR0.59626.380.78026.65
S-DETR0.77827.980.91427.41
Table 2. Ablation experiment of SA module on SMD.
BackboneFerryBuoyShipSpeed BoatBoatKayakSail BoatOthermAP@.5
ResNet500.8870.7380.8260.6410.3920.4930.4430.5620.608
ResNet50+PSPNet0.8910.7690.8190.6630.4750.5490.5770.6040.668
ResNet50+PSPNet+Channel Attention0.8850.7920.8240.6510.4820.5720.5260.6840.677
ResNet50+PSPNet+Channel Correction0.8870.7840.8120.6680.4680.5850.5140.6910.676
ResNet50+PSPNet+Scale Attention0.8920.8230.8140.7350.8130.6890.7050.7530.778
Table 3. Improvements with respect to the number of layers with our DQ module. Note the first column is equivalent to the baseline with 400 queries and the latter columns are applying a different number of layers of DQ on the 1000 queries baseline.
DQ Layers0 (without DQ)0236
mAP@.50.7420.7670.7780.7760.775
Disclaimer/Publisher’s Note: The statements, opinions and data contained in all publications are solely those of the individual author(s) and contributor(s) and not of MDPI and/or the editor(s). MDPI and/or the editor(s) disclaim responsibility for any injury to people or property resulting from any ideas, methods, instructions or products referred to in the content.

