
Dynamic Response Analysis of Offshore Converter Station Based on Vector Form Intrinsic Finite Element (VFIFE) Method

Abstract
:1. Introduction
2. Numerical Model and Simulation Scheme
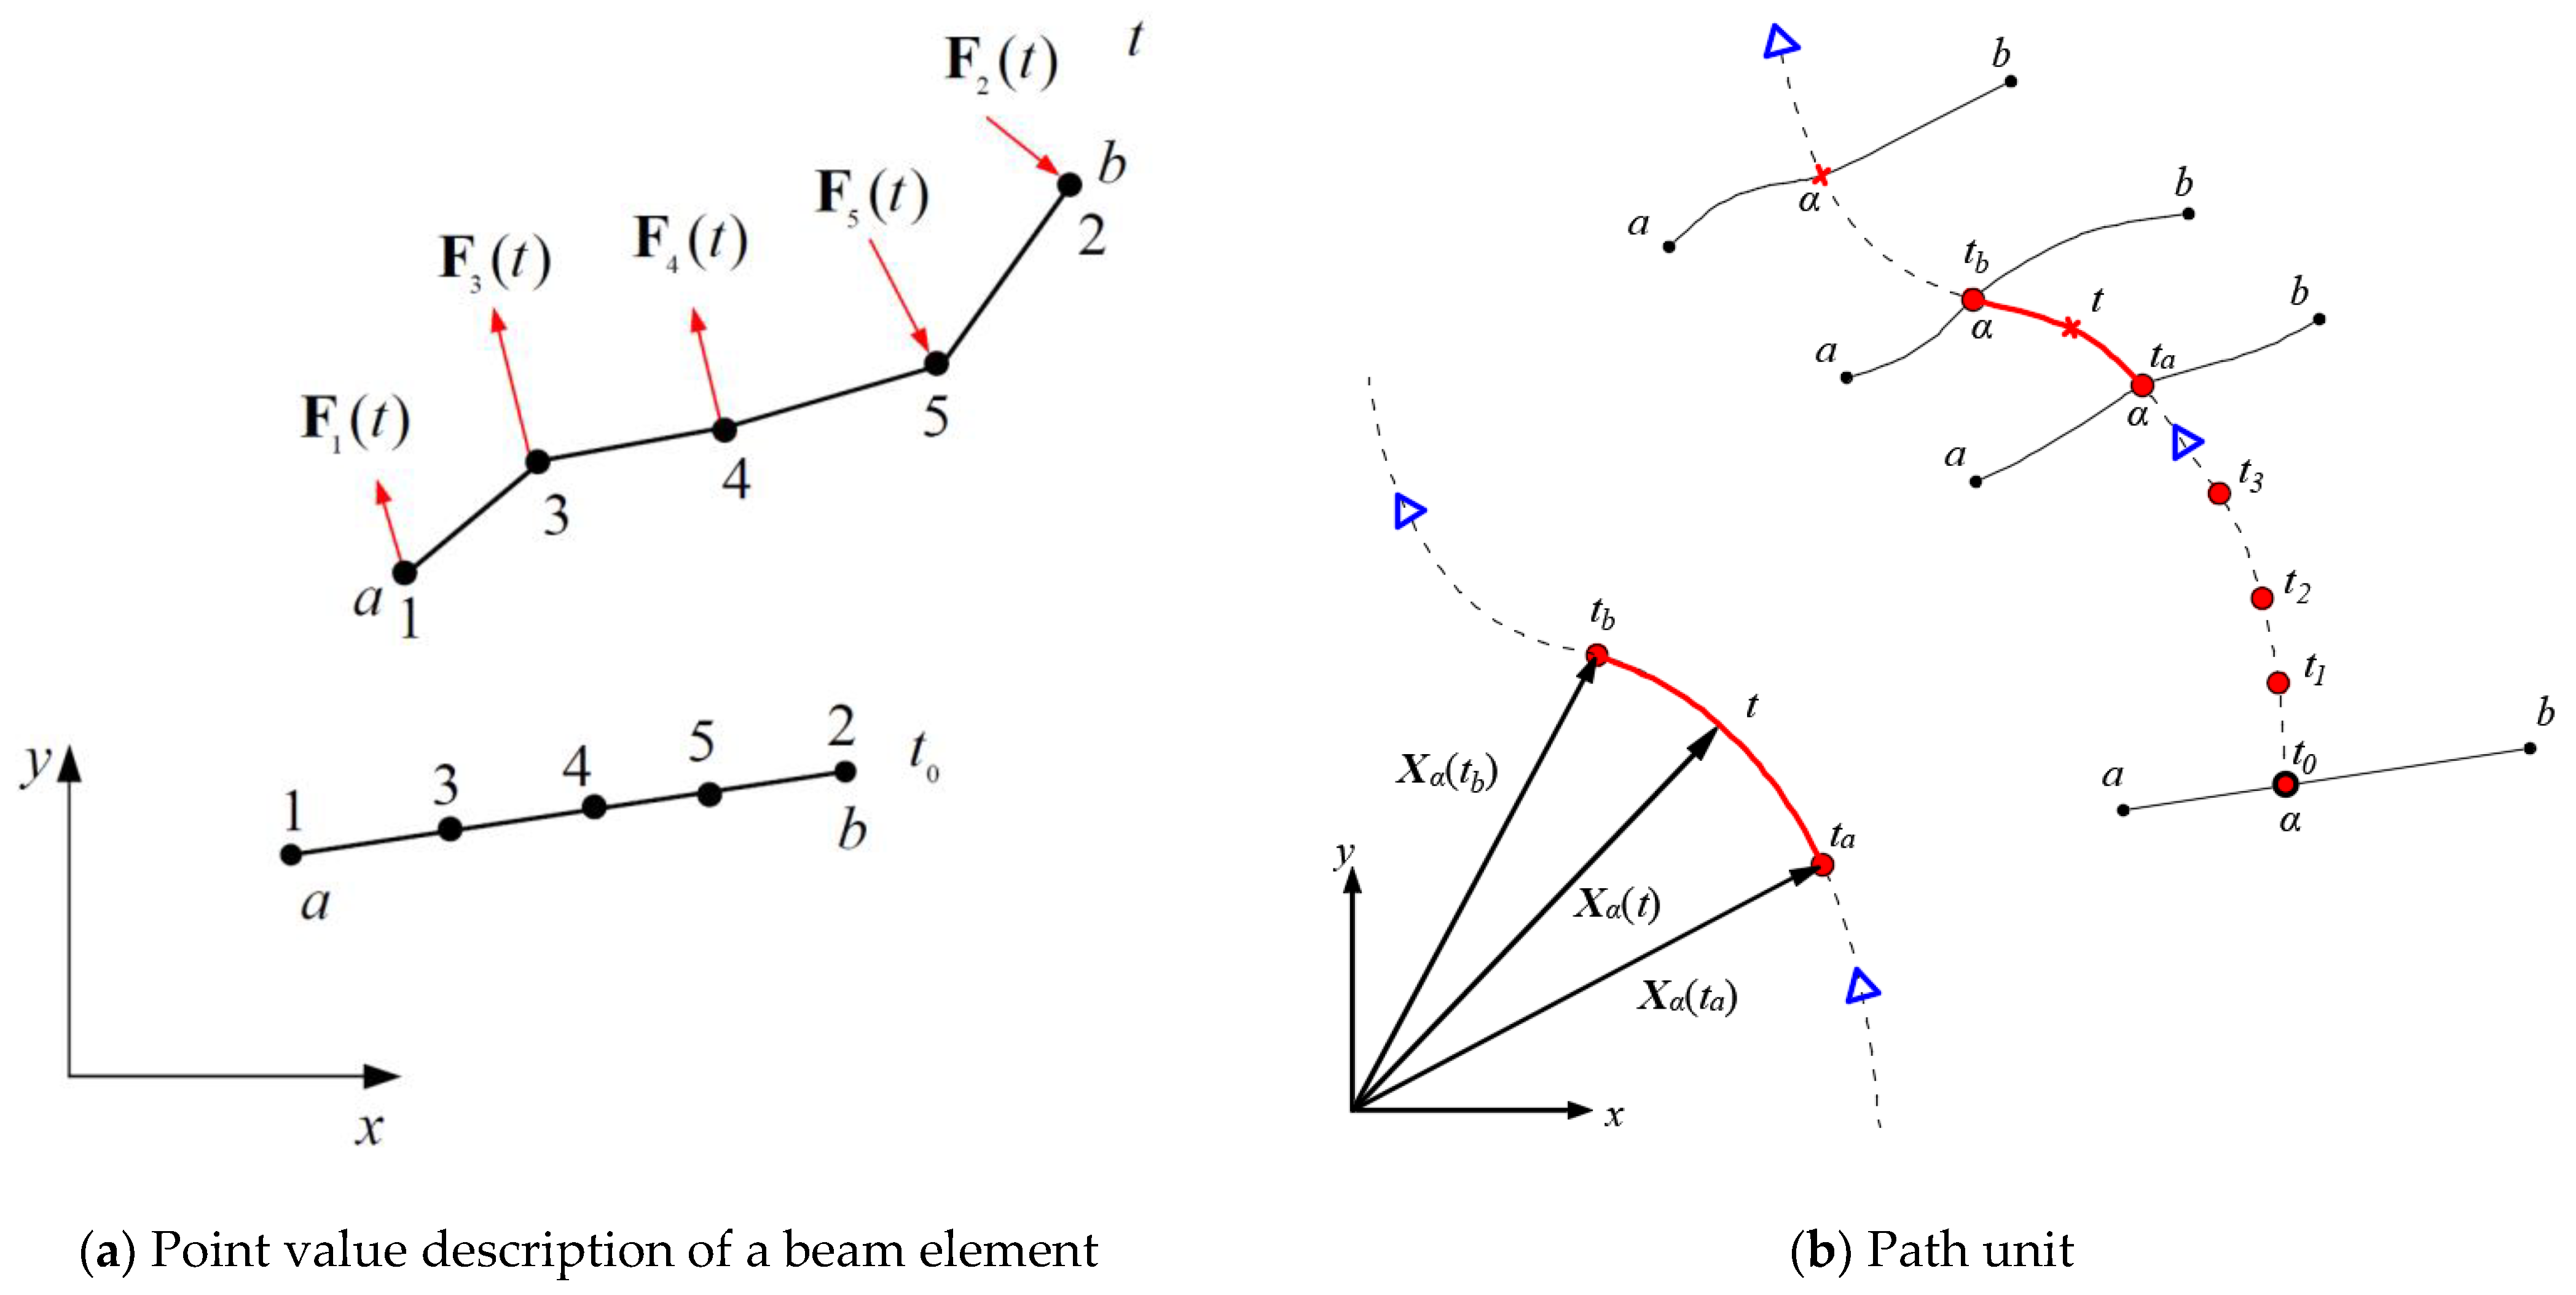
2.1. Governing Equation
2.2. External Force
2.2.1. Gravity and Buoyancy
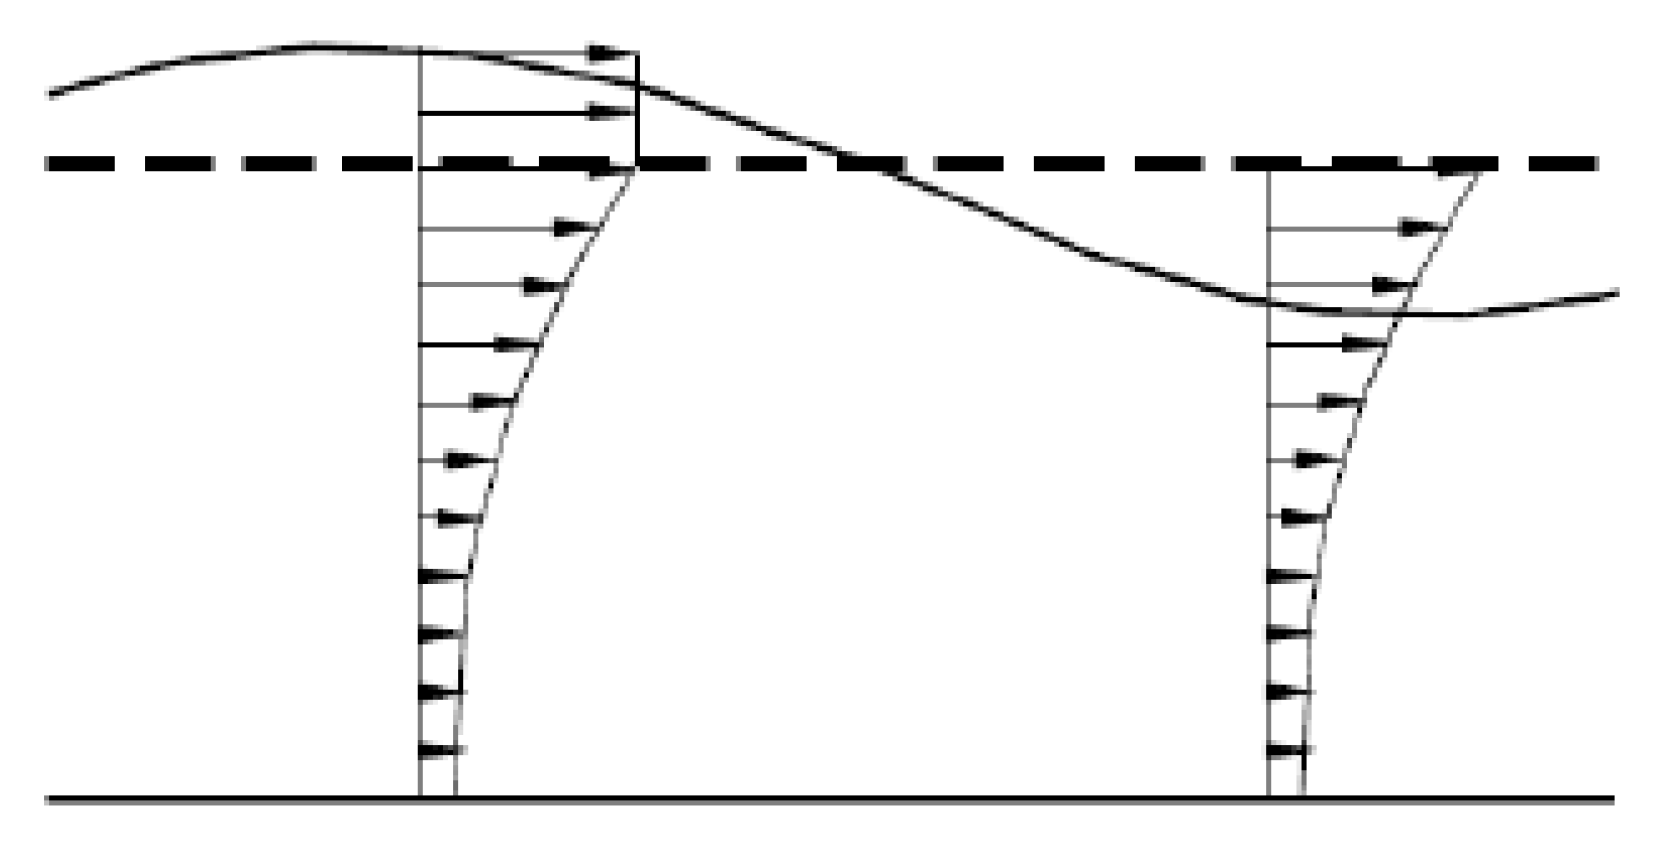
2.2.2. Hydrodynamic Load
2.2.3. Wind Load
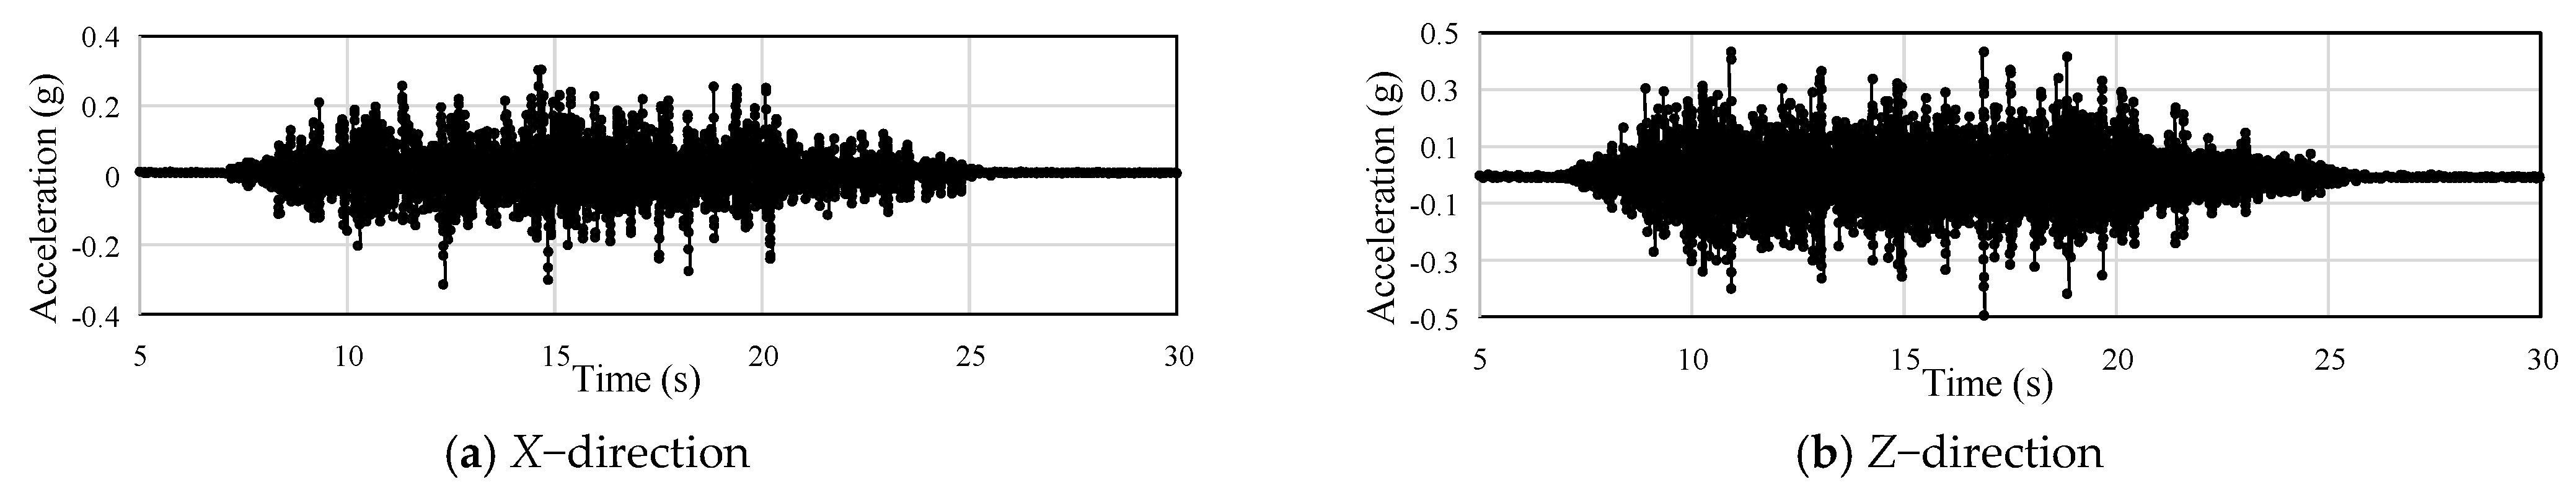
2.2.4. Seismic Load
2.3. Internal Force
3. Model Validation
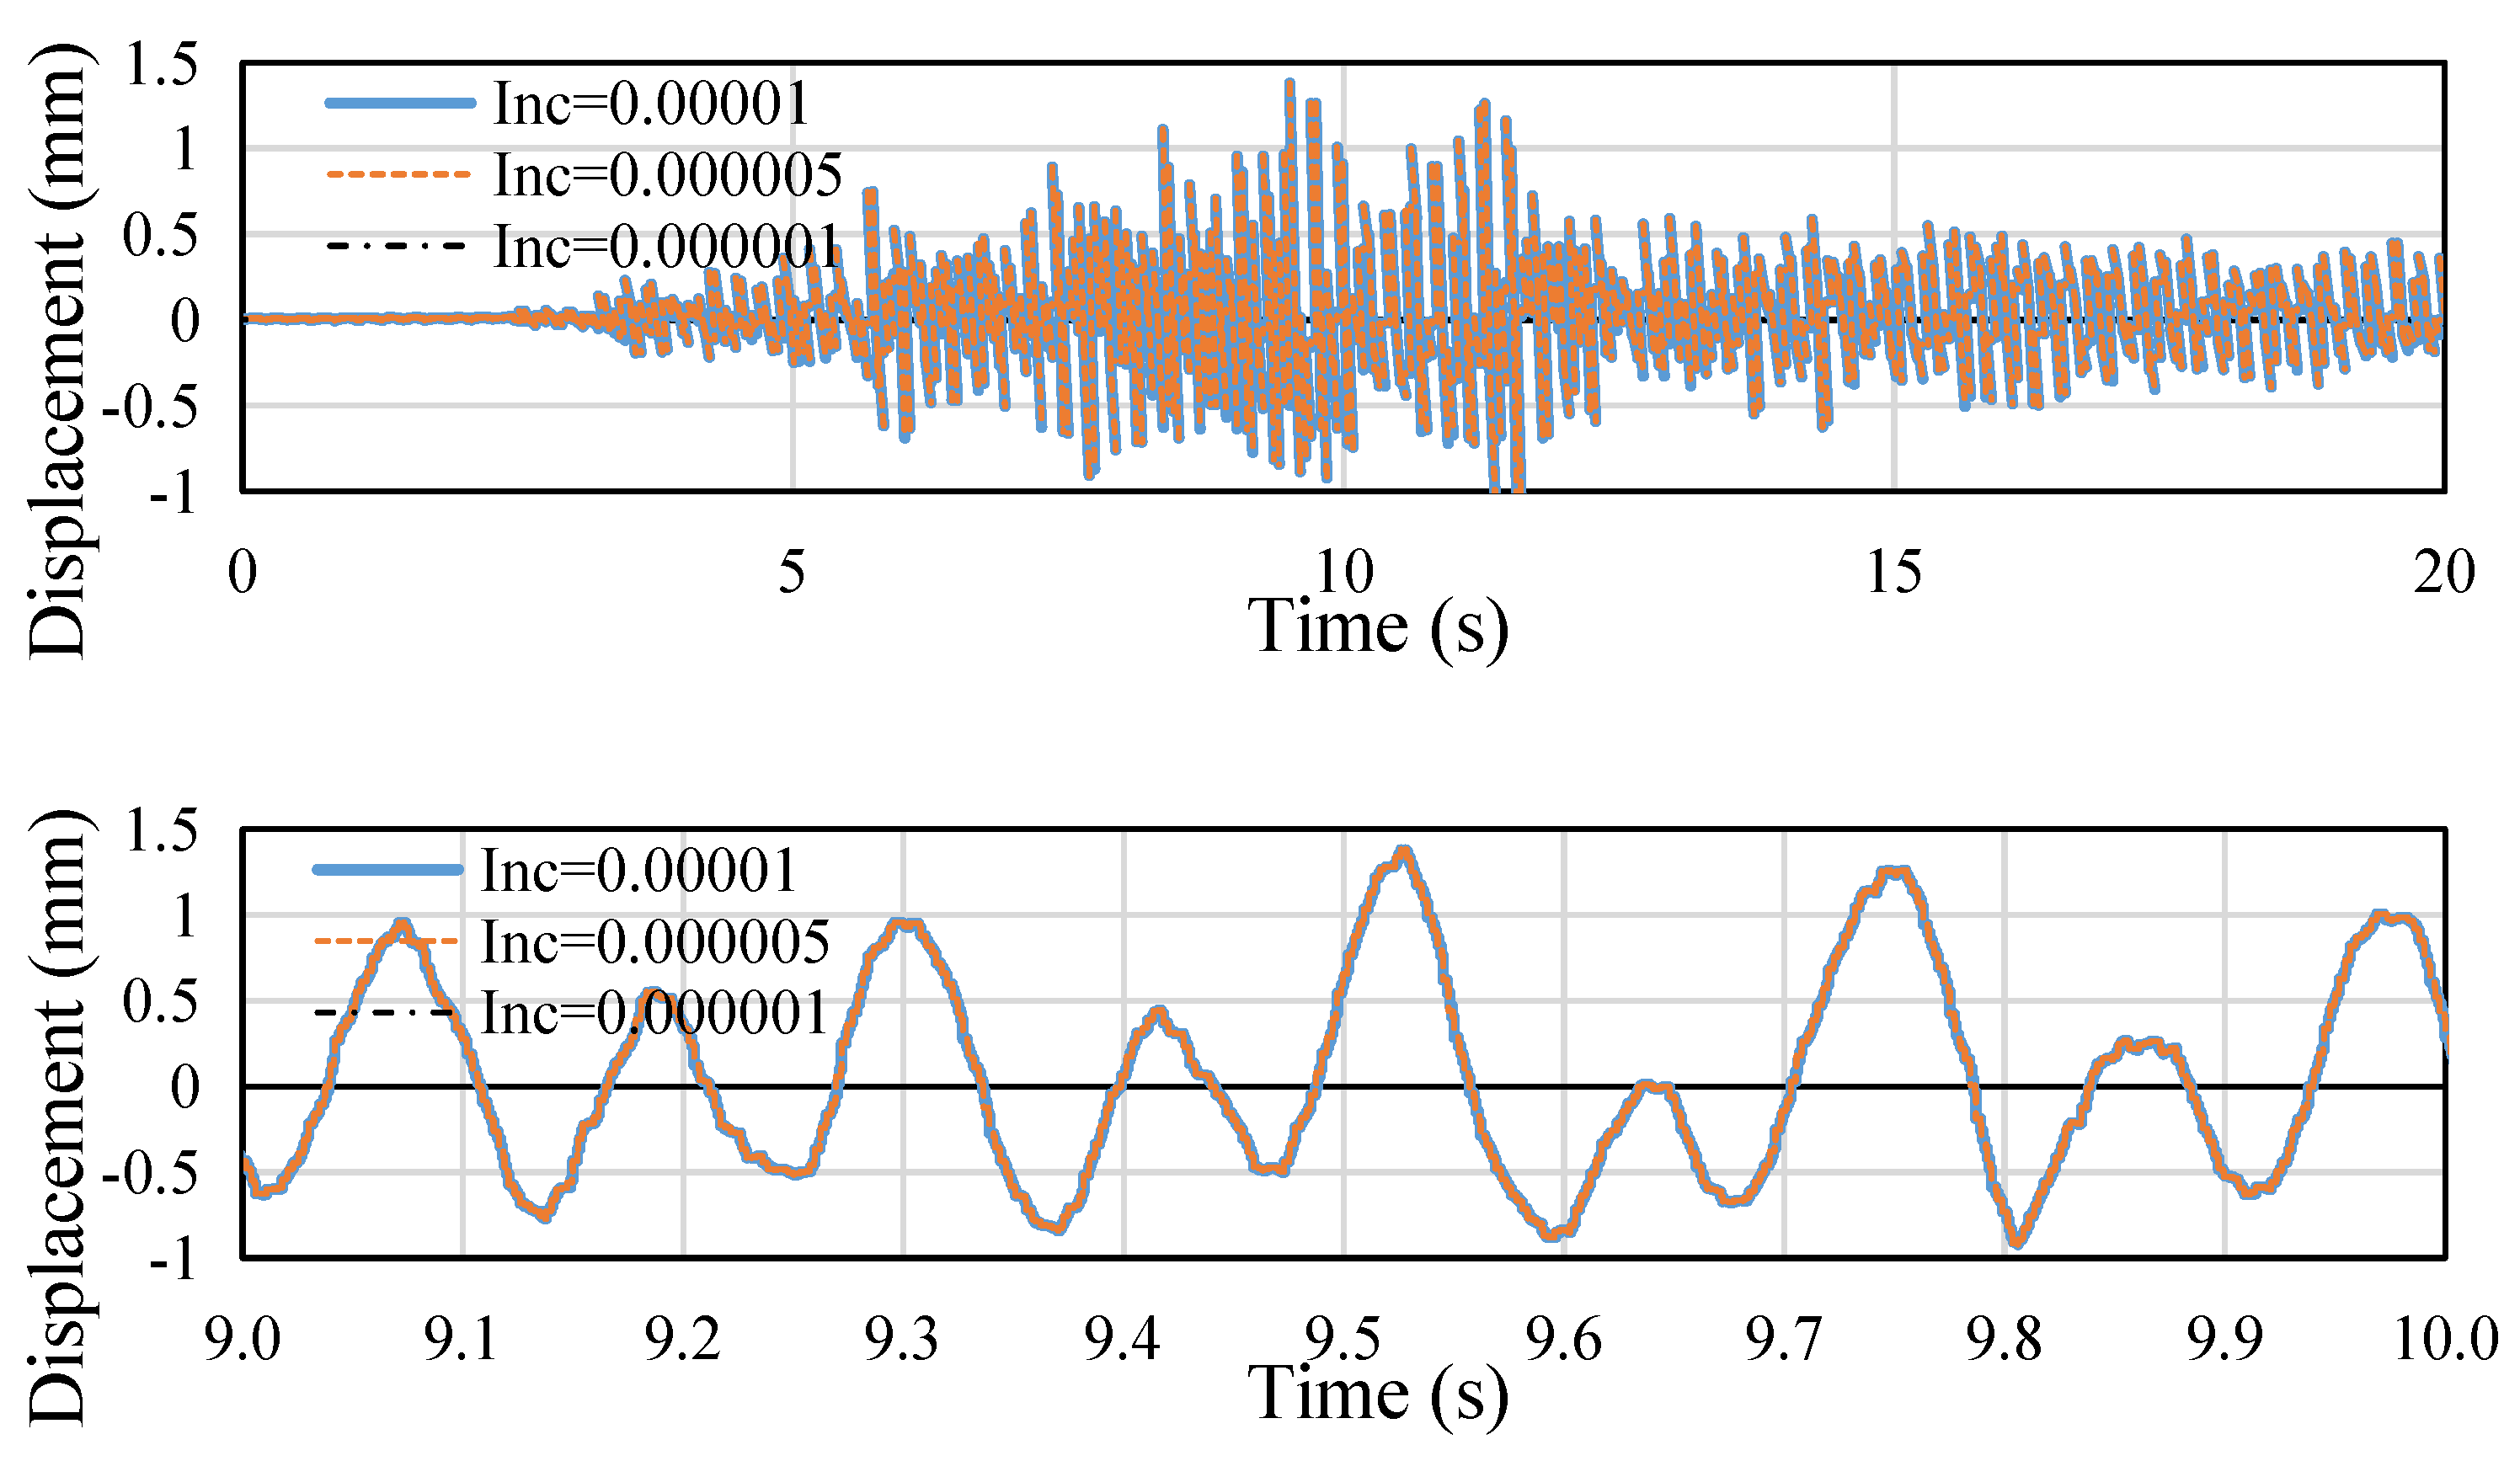
3.1. Convergence Study of the Incremental Size
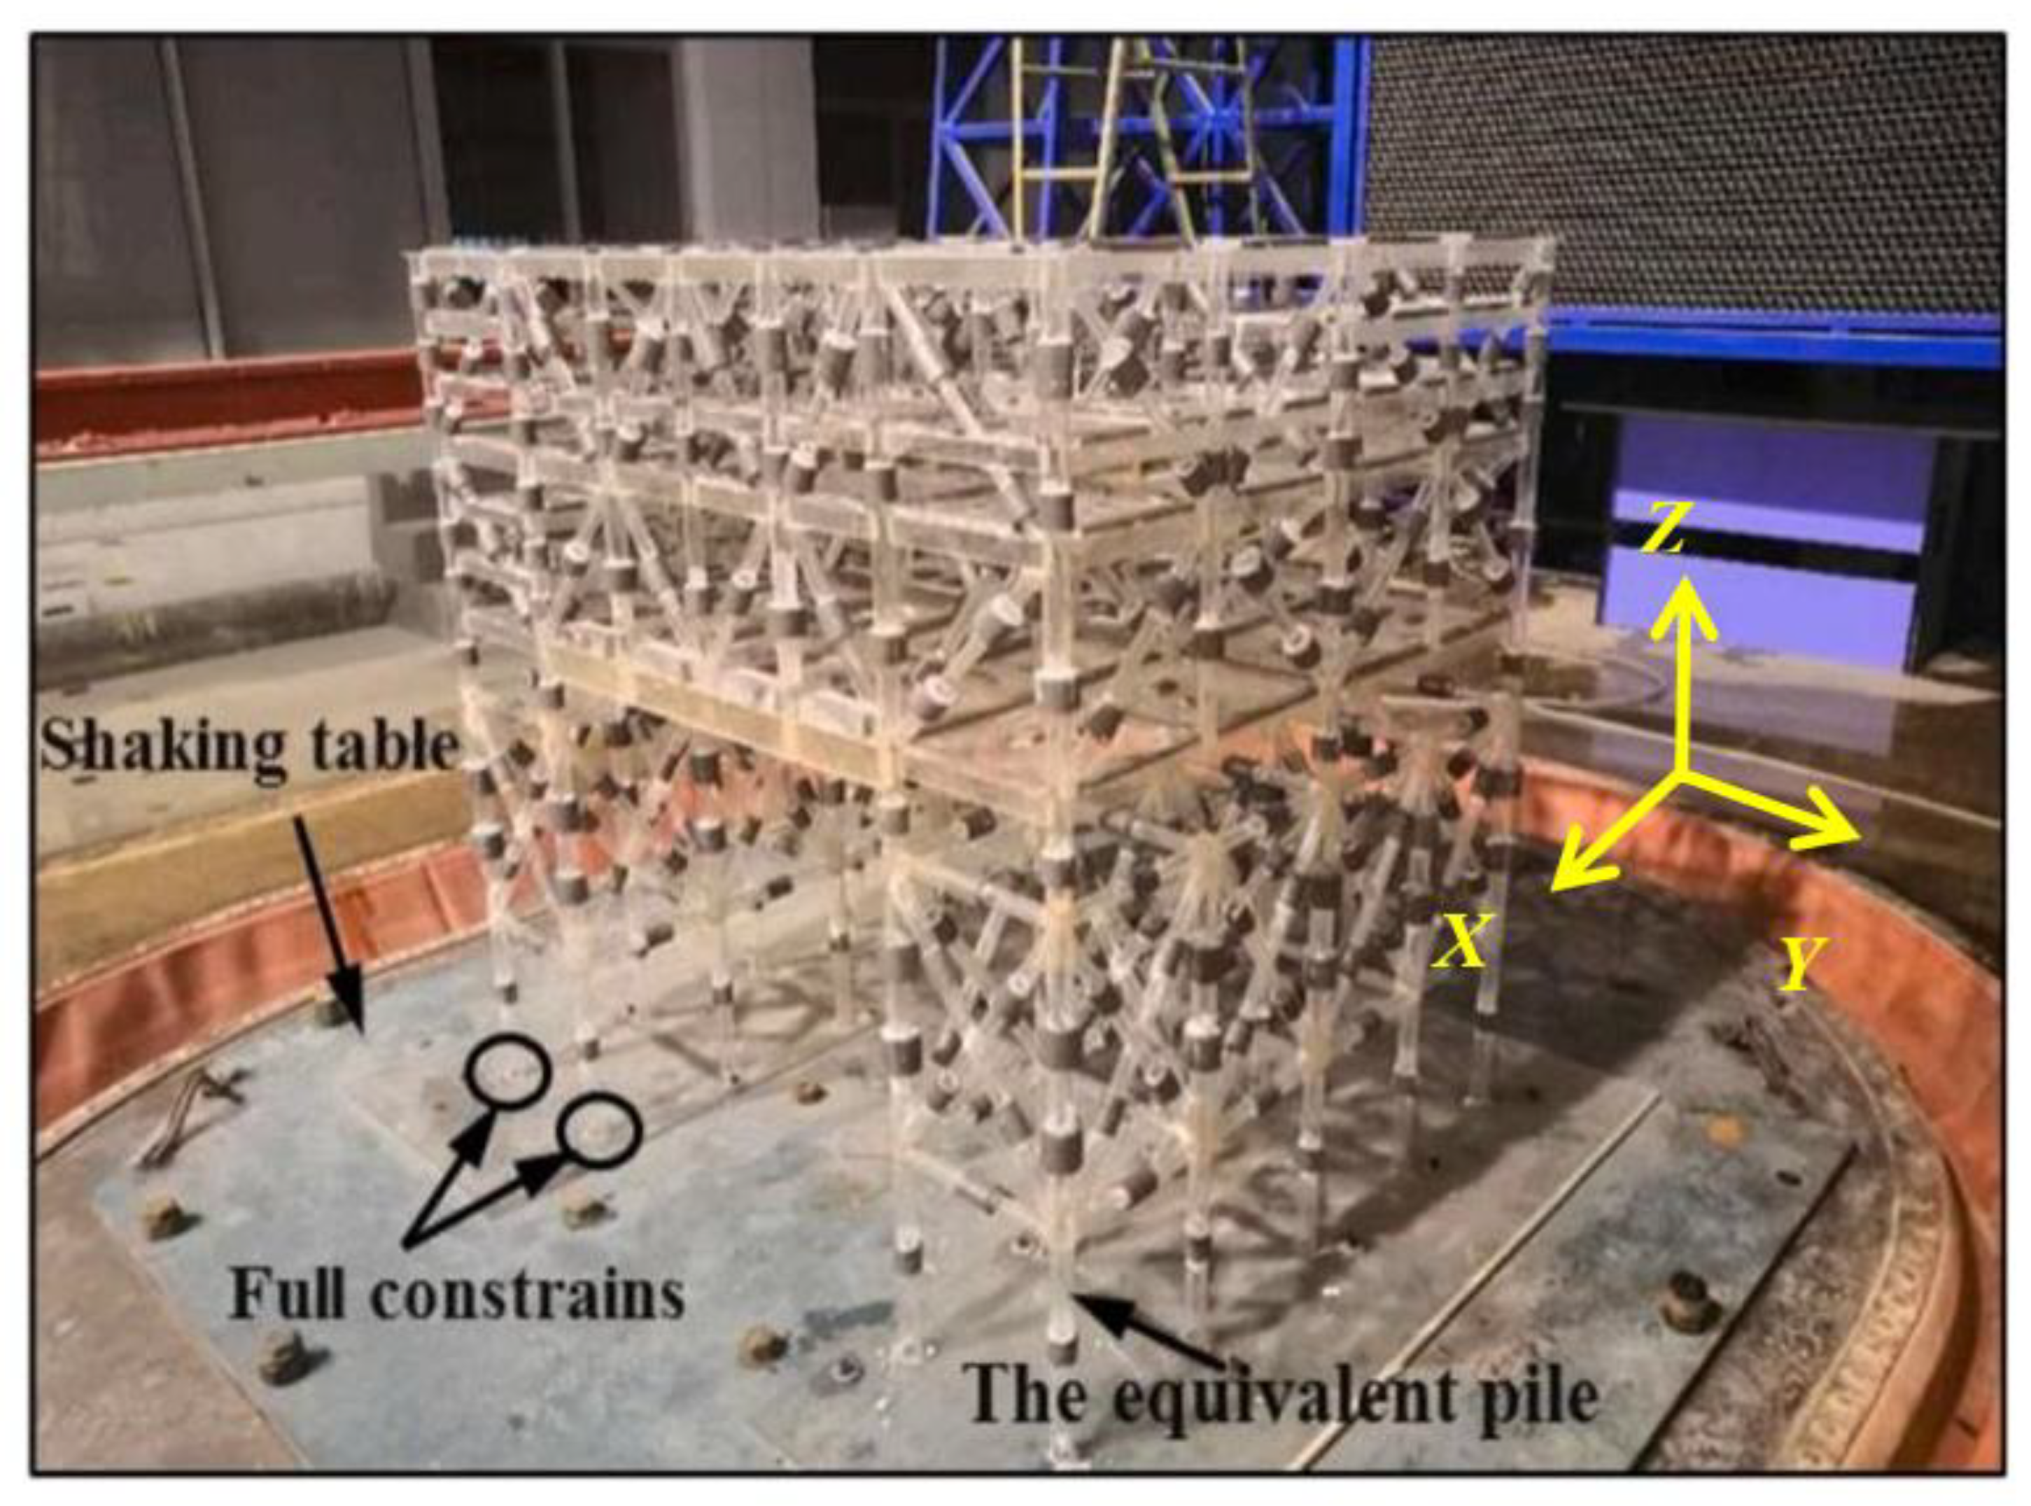
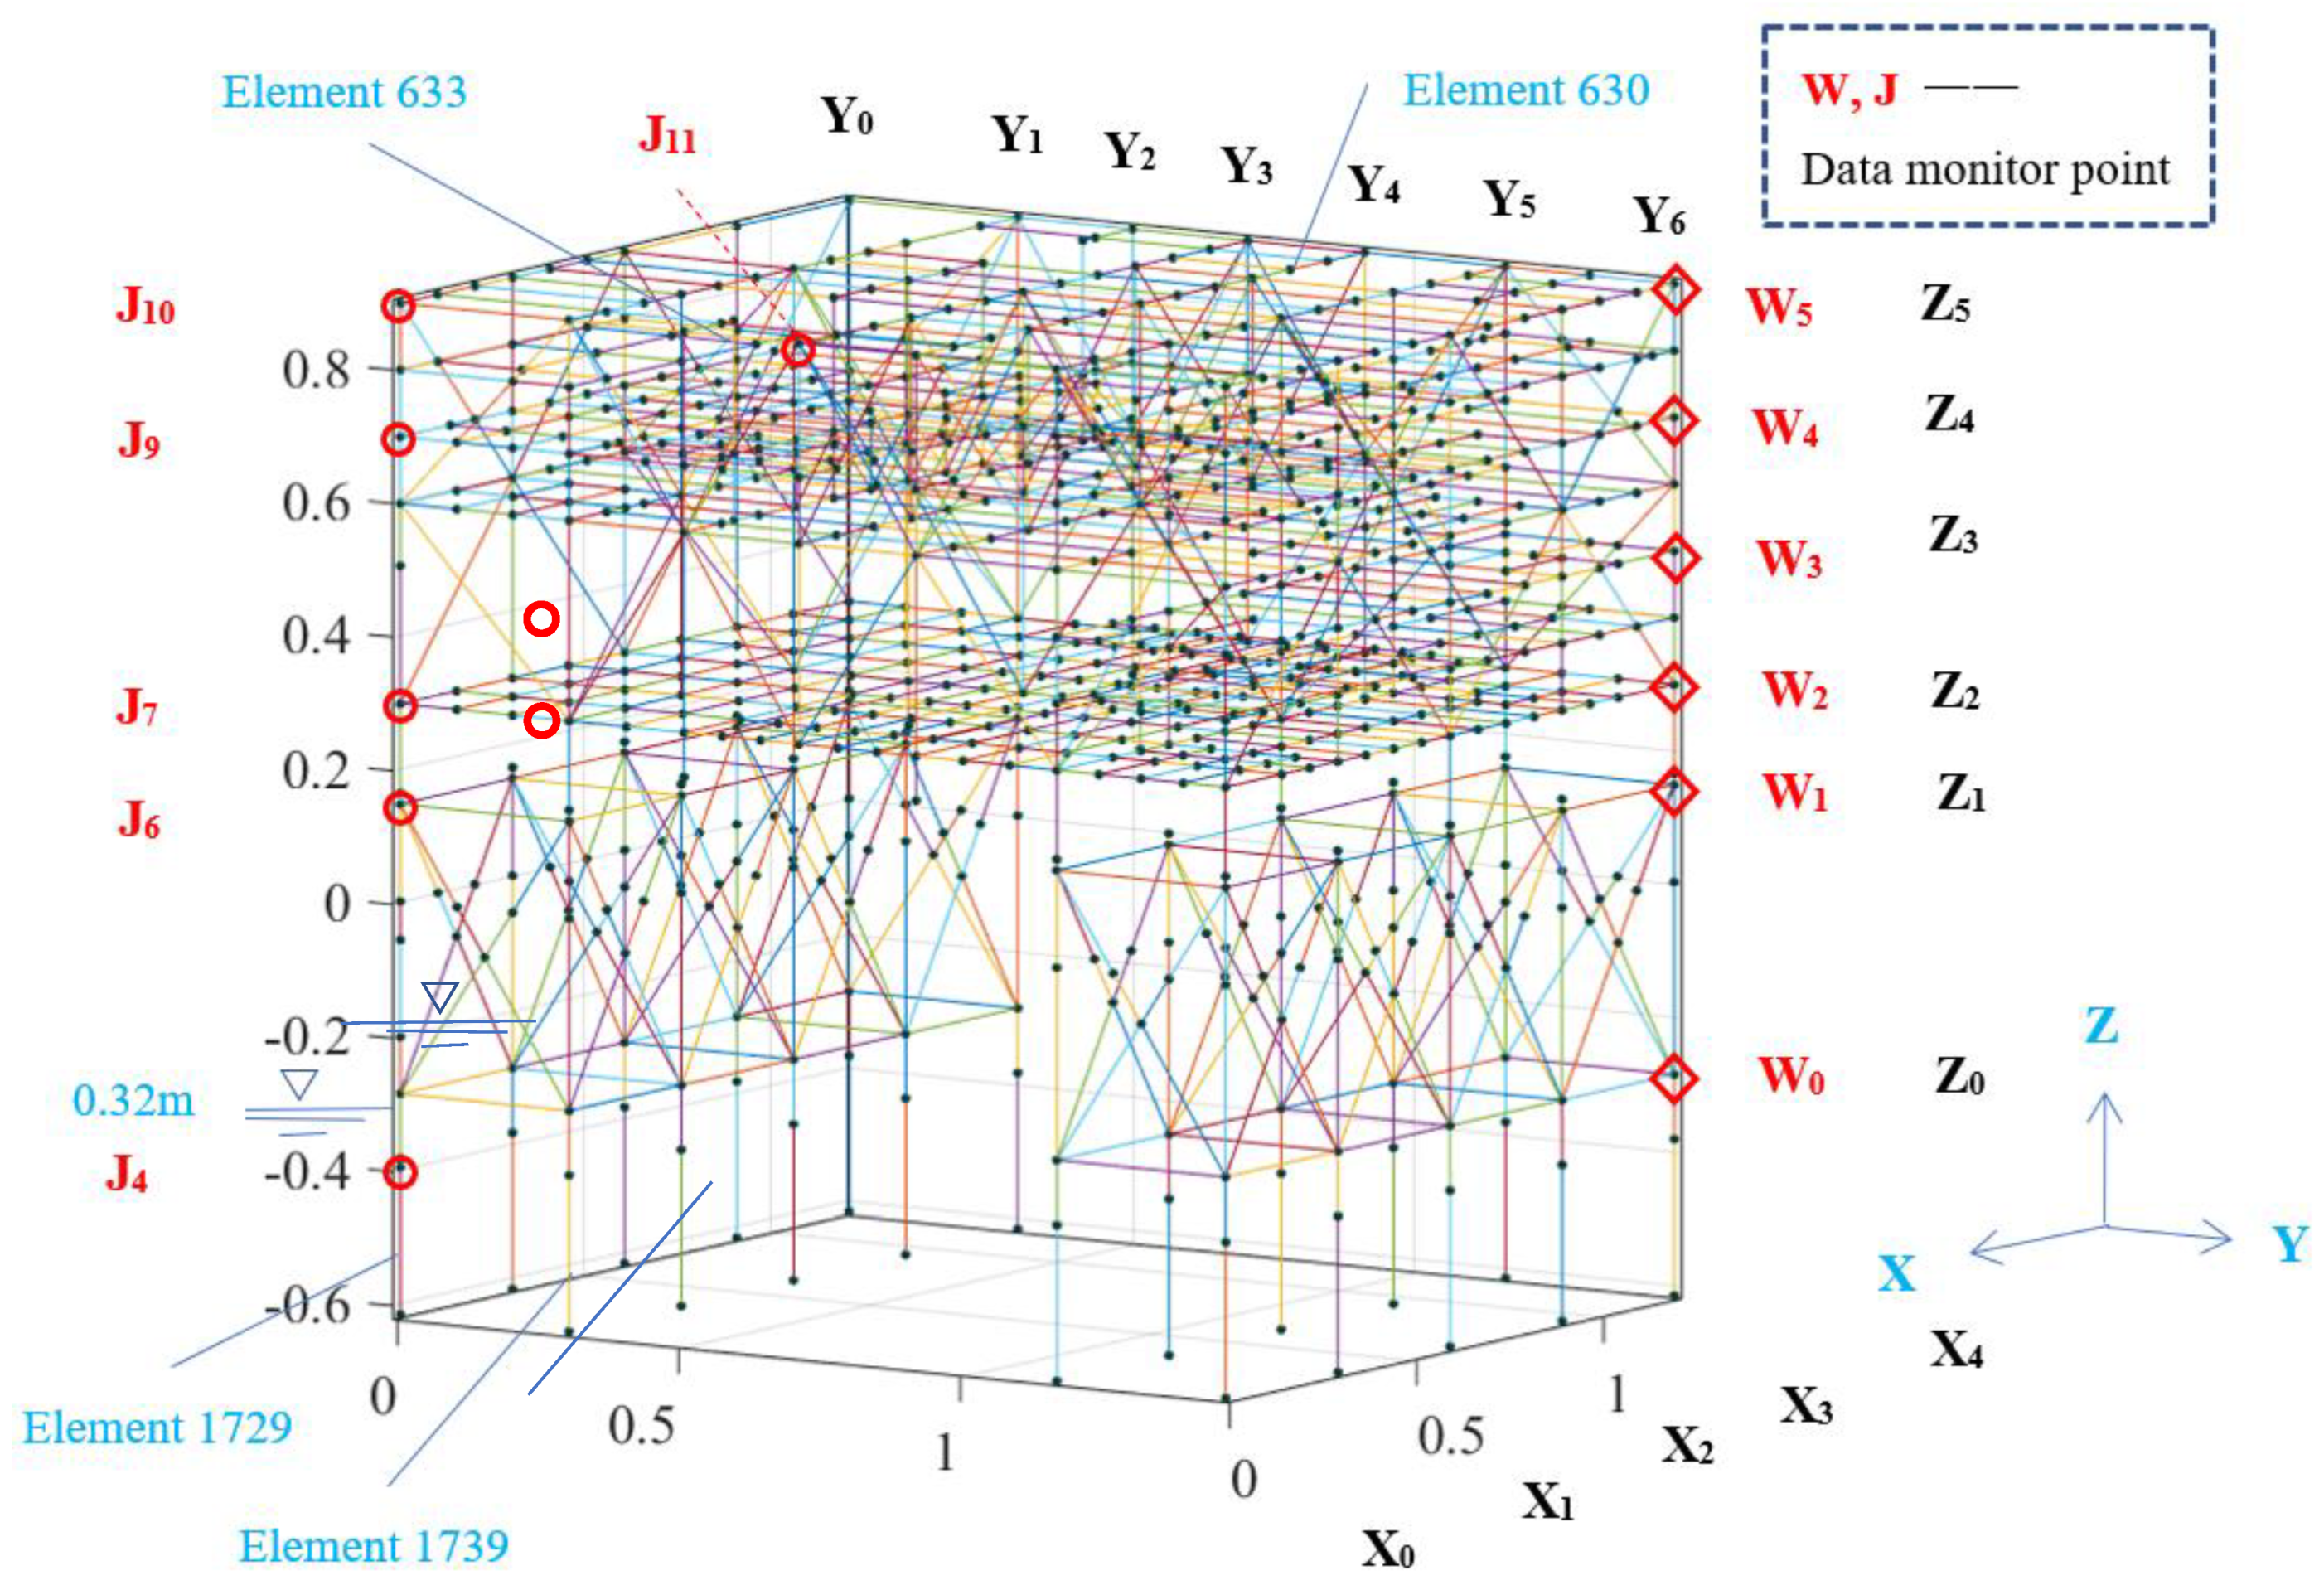
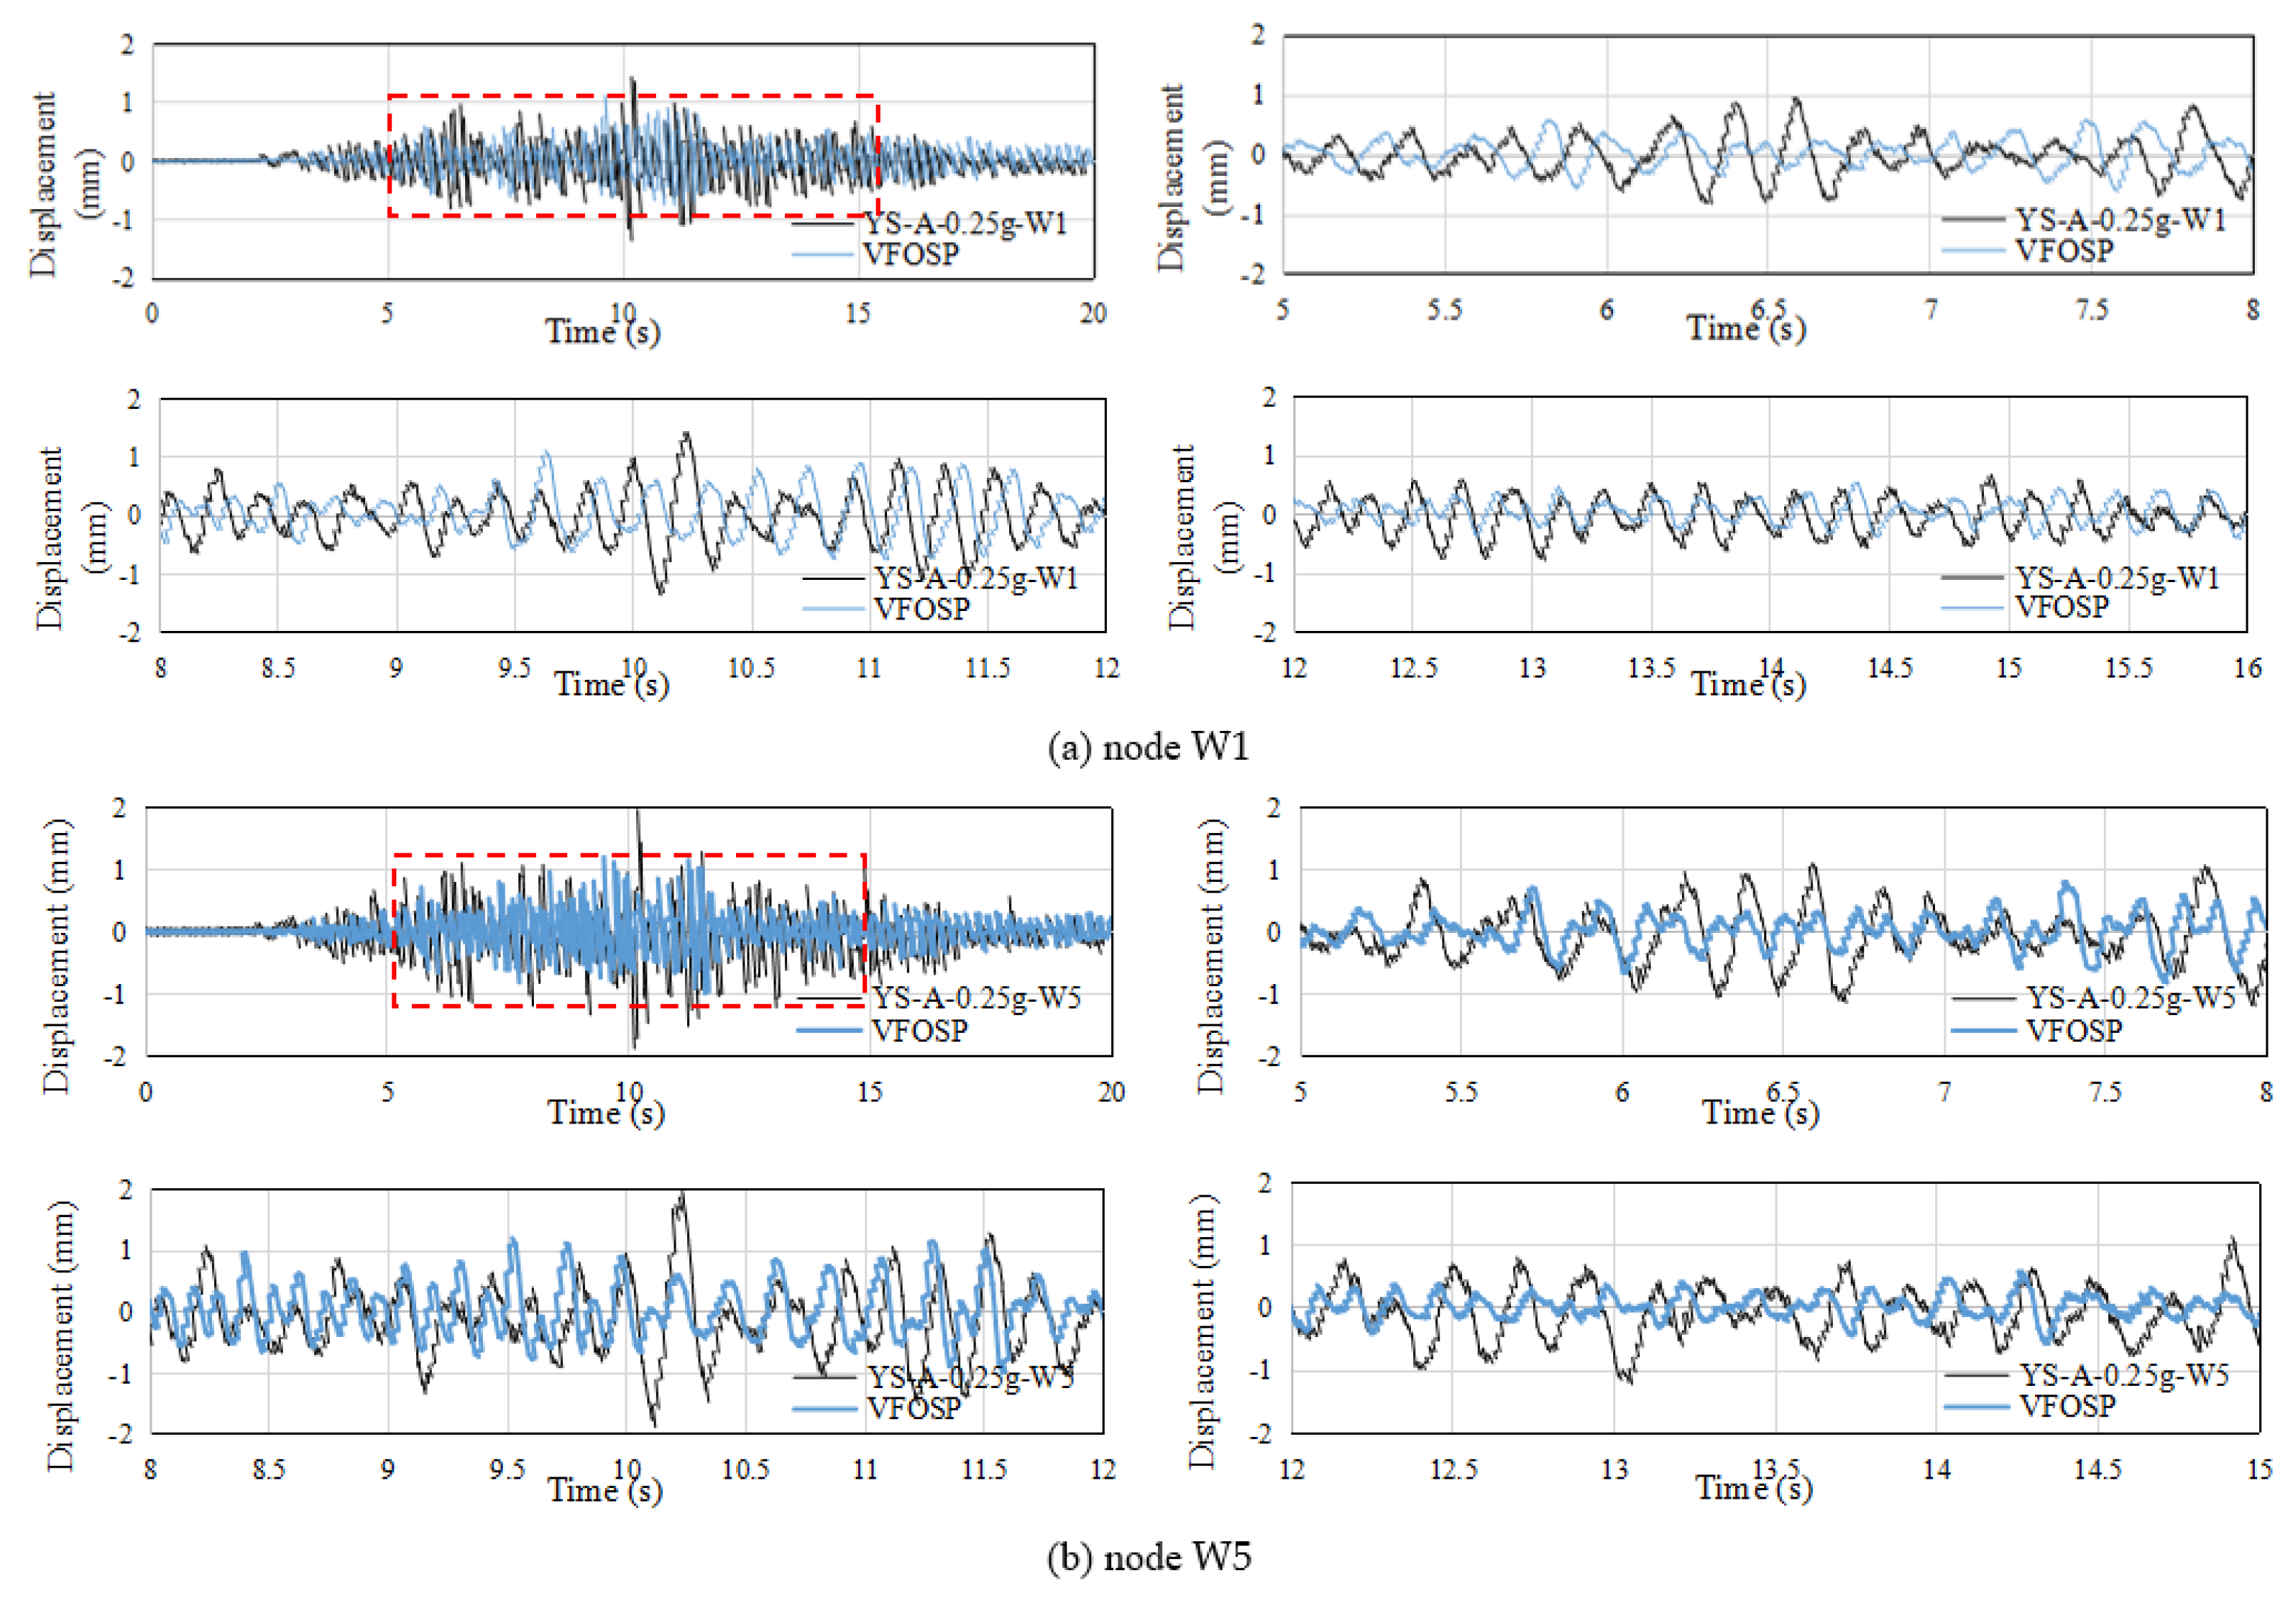
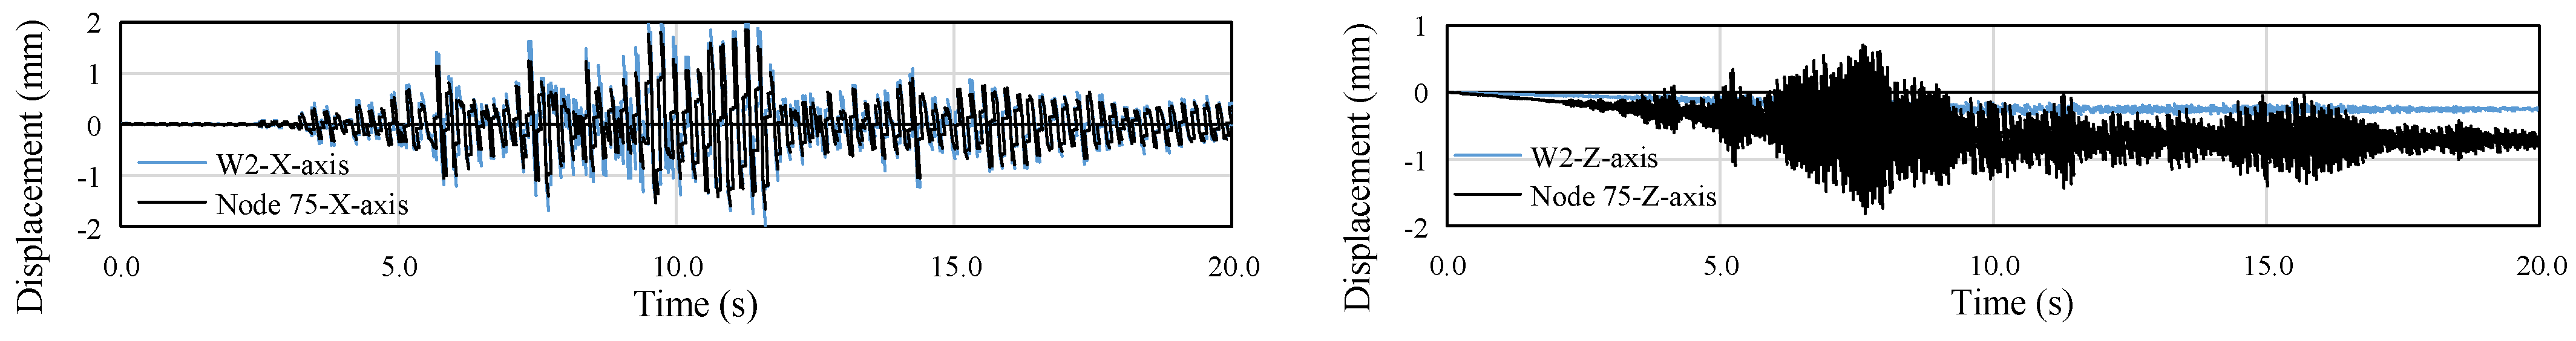
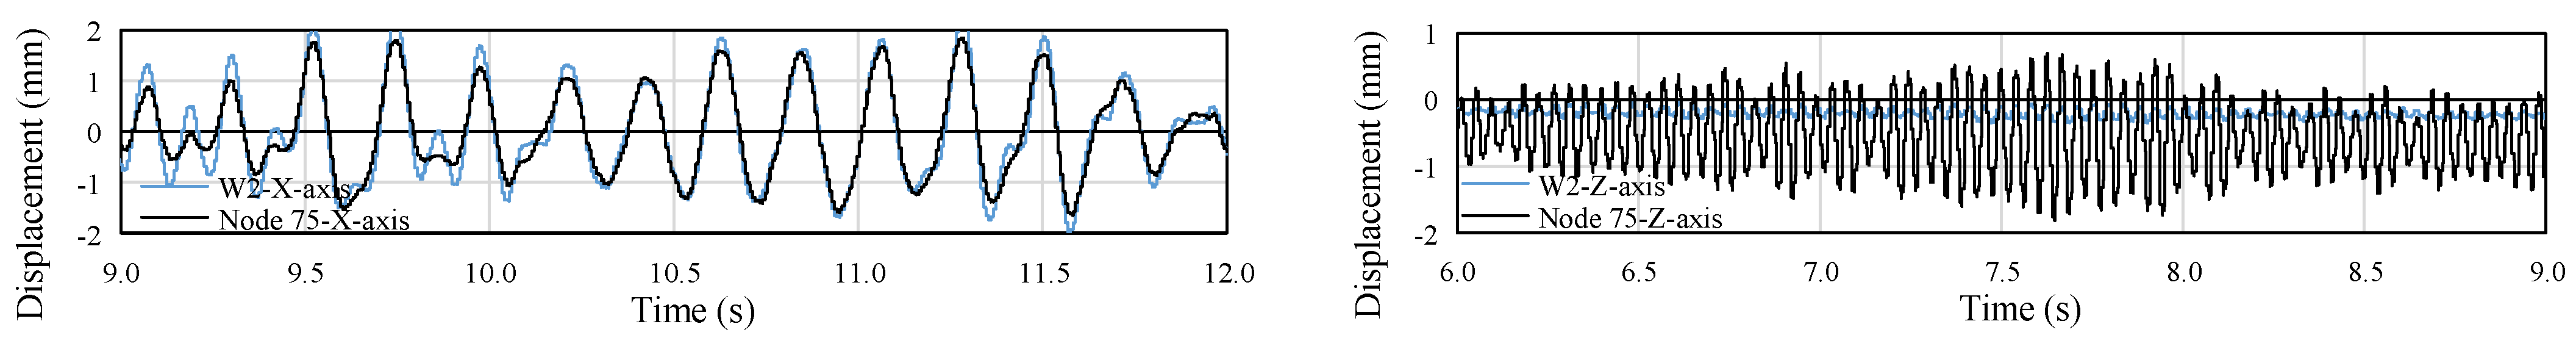
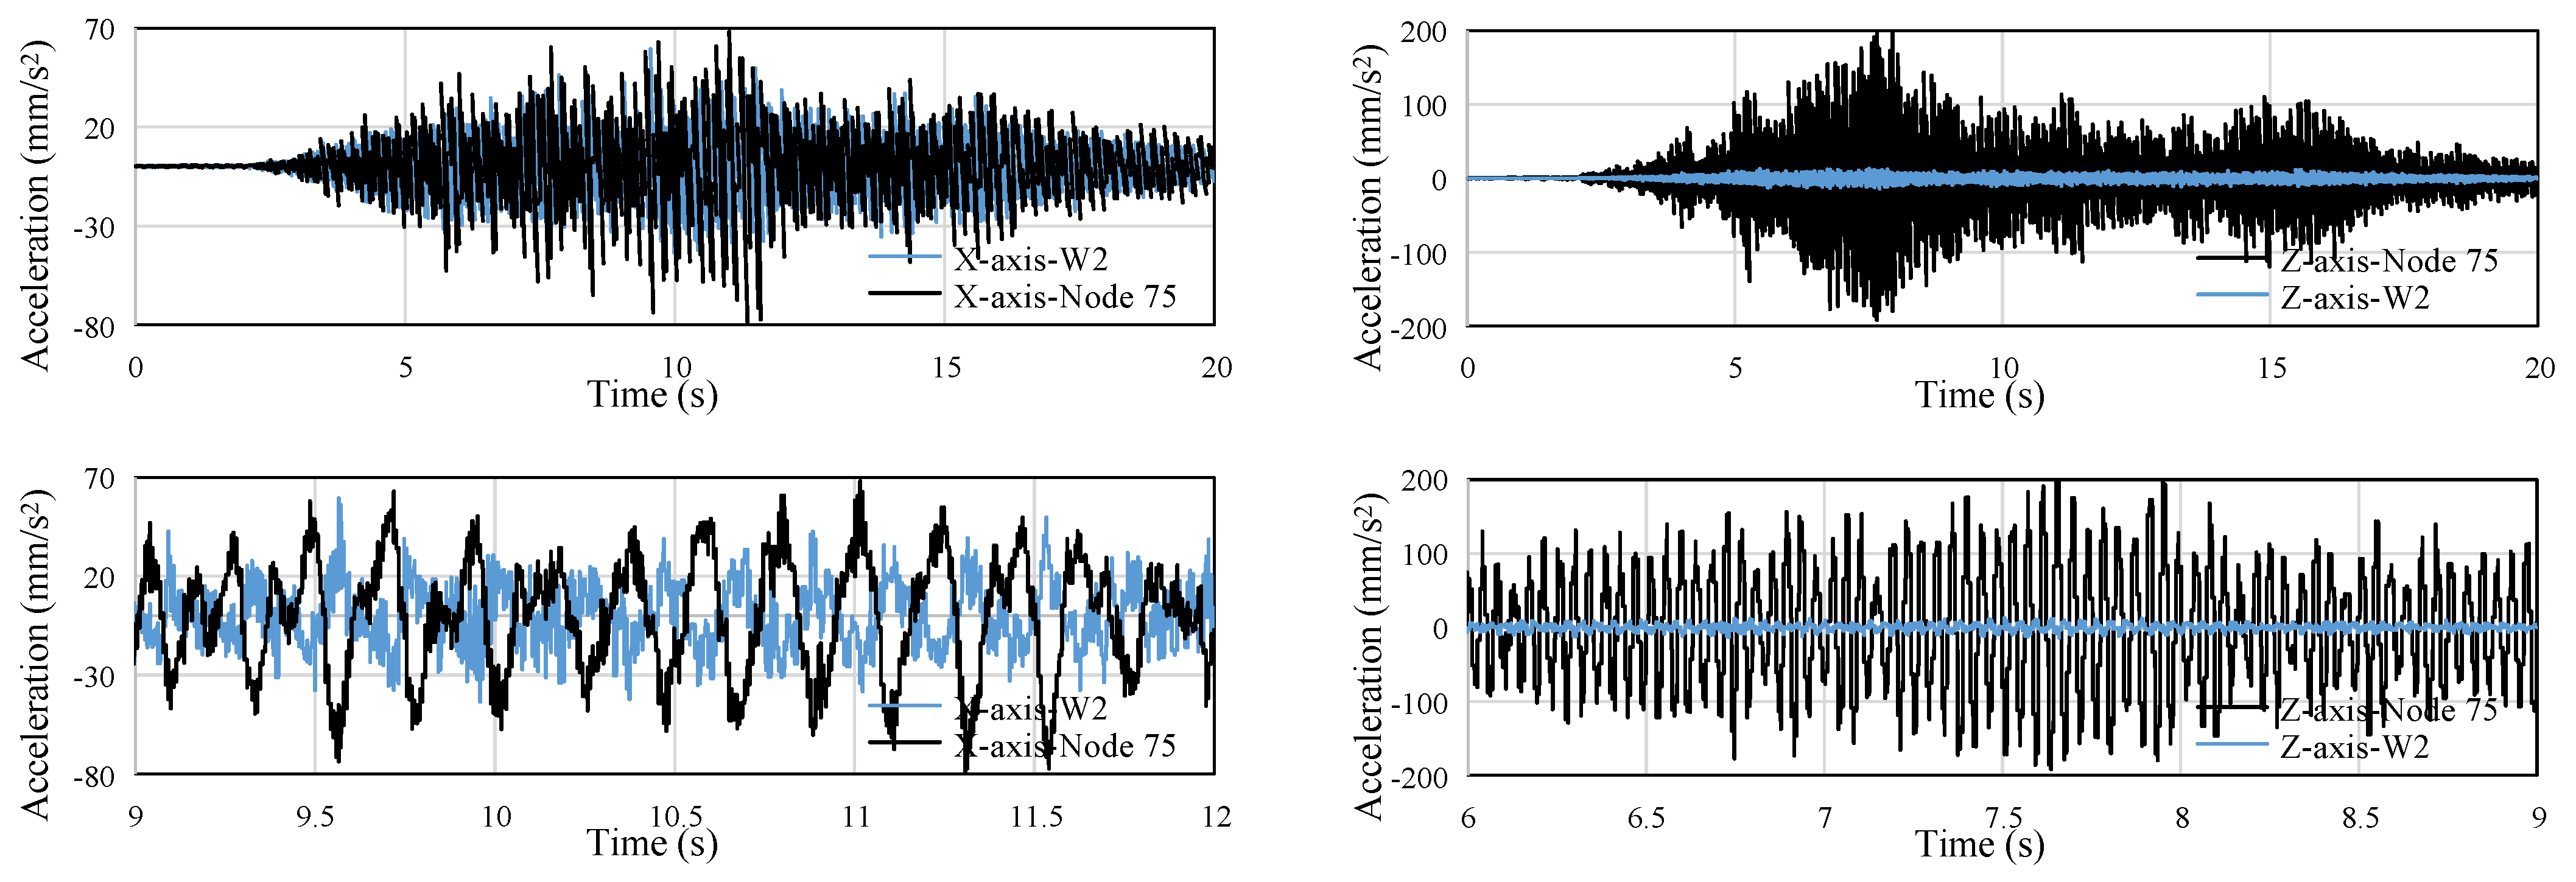
3.2. Model Validation
4. Results and Discussion
4.1. Effect of Water Damping and Hydrodynamic
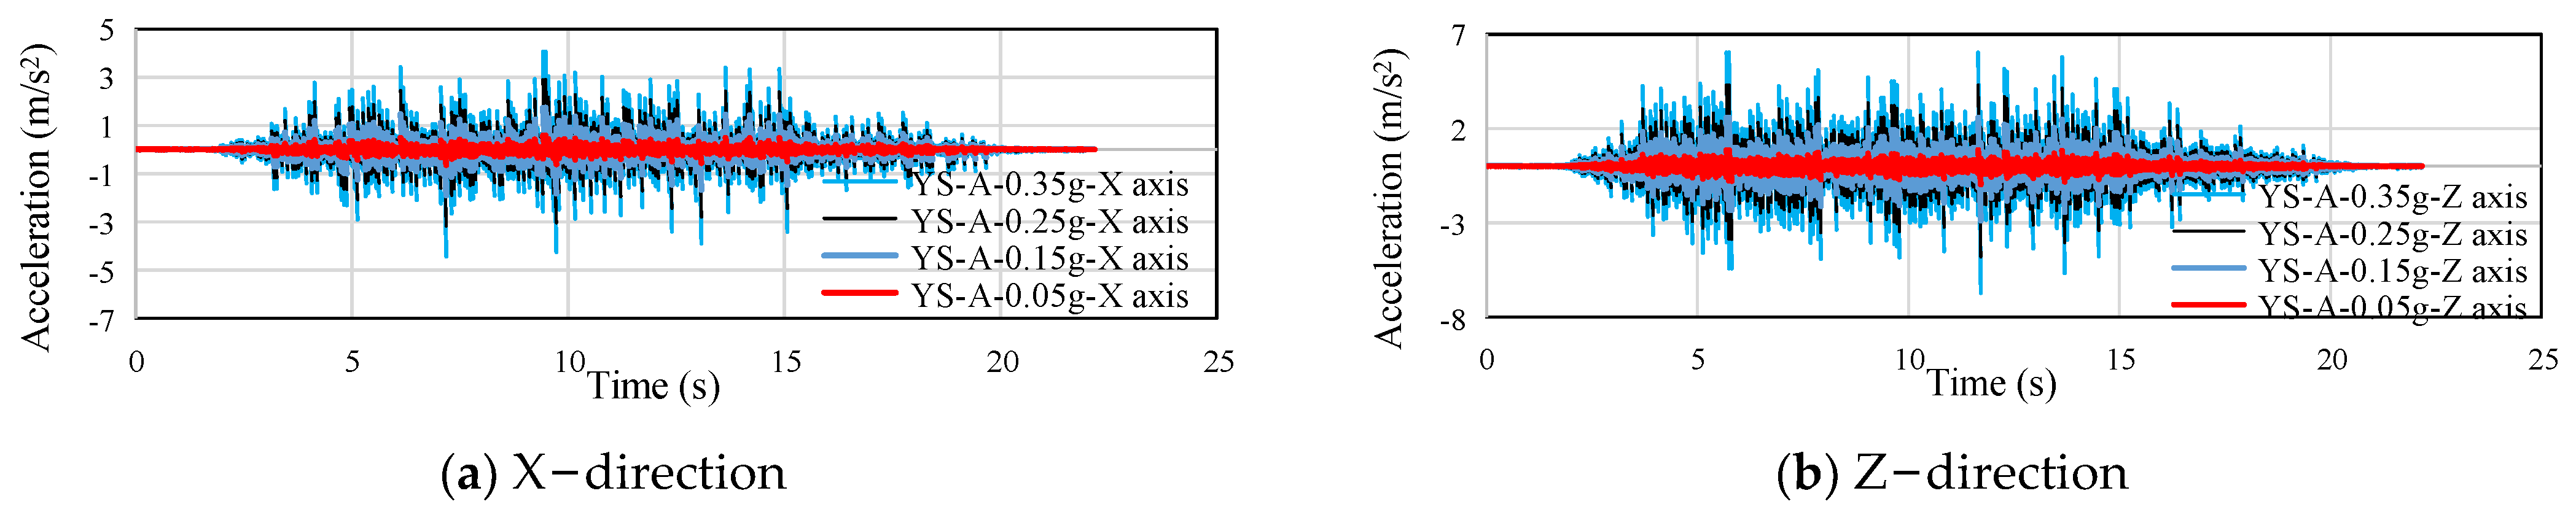
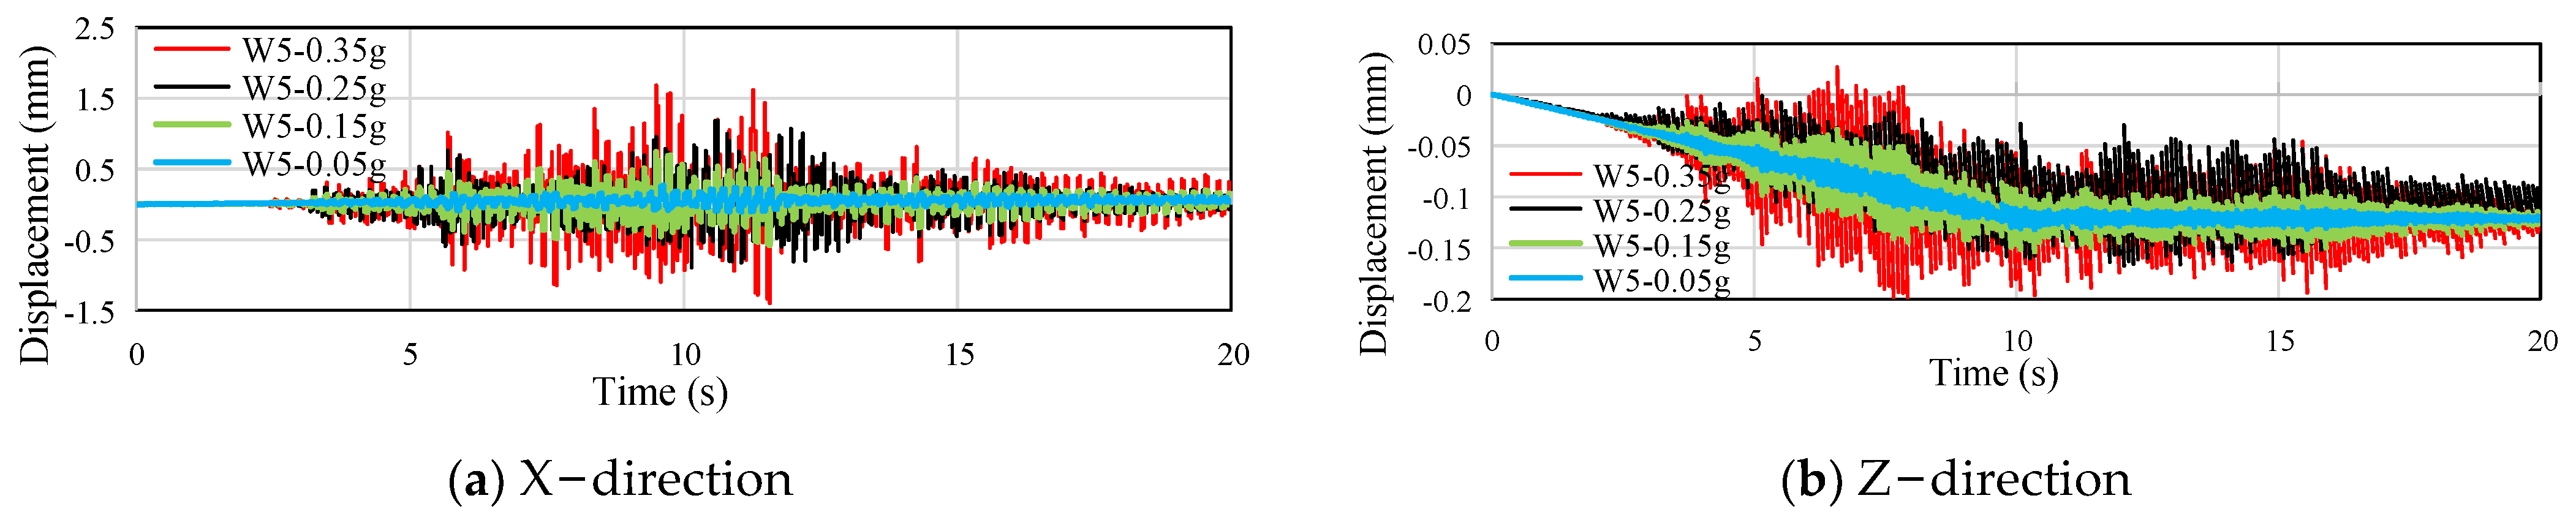
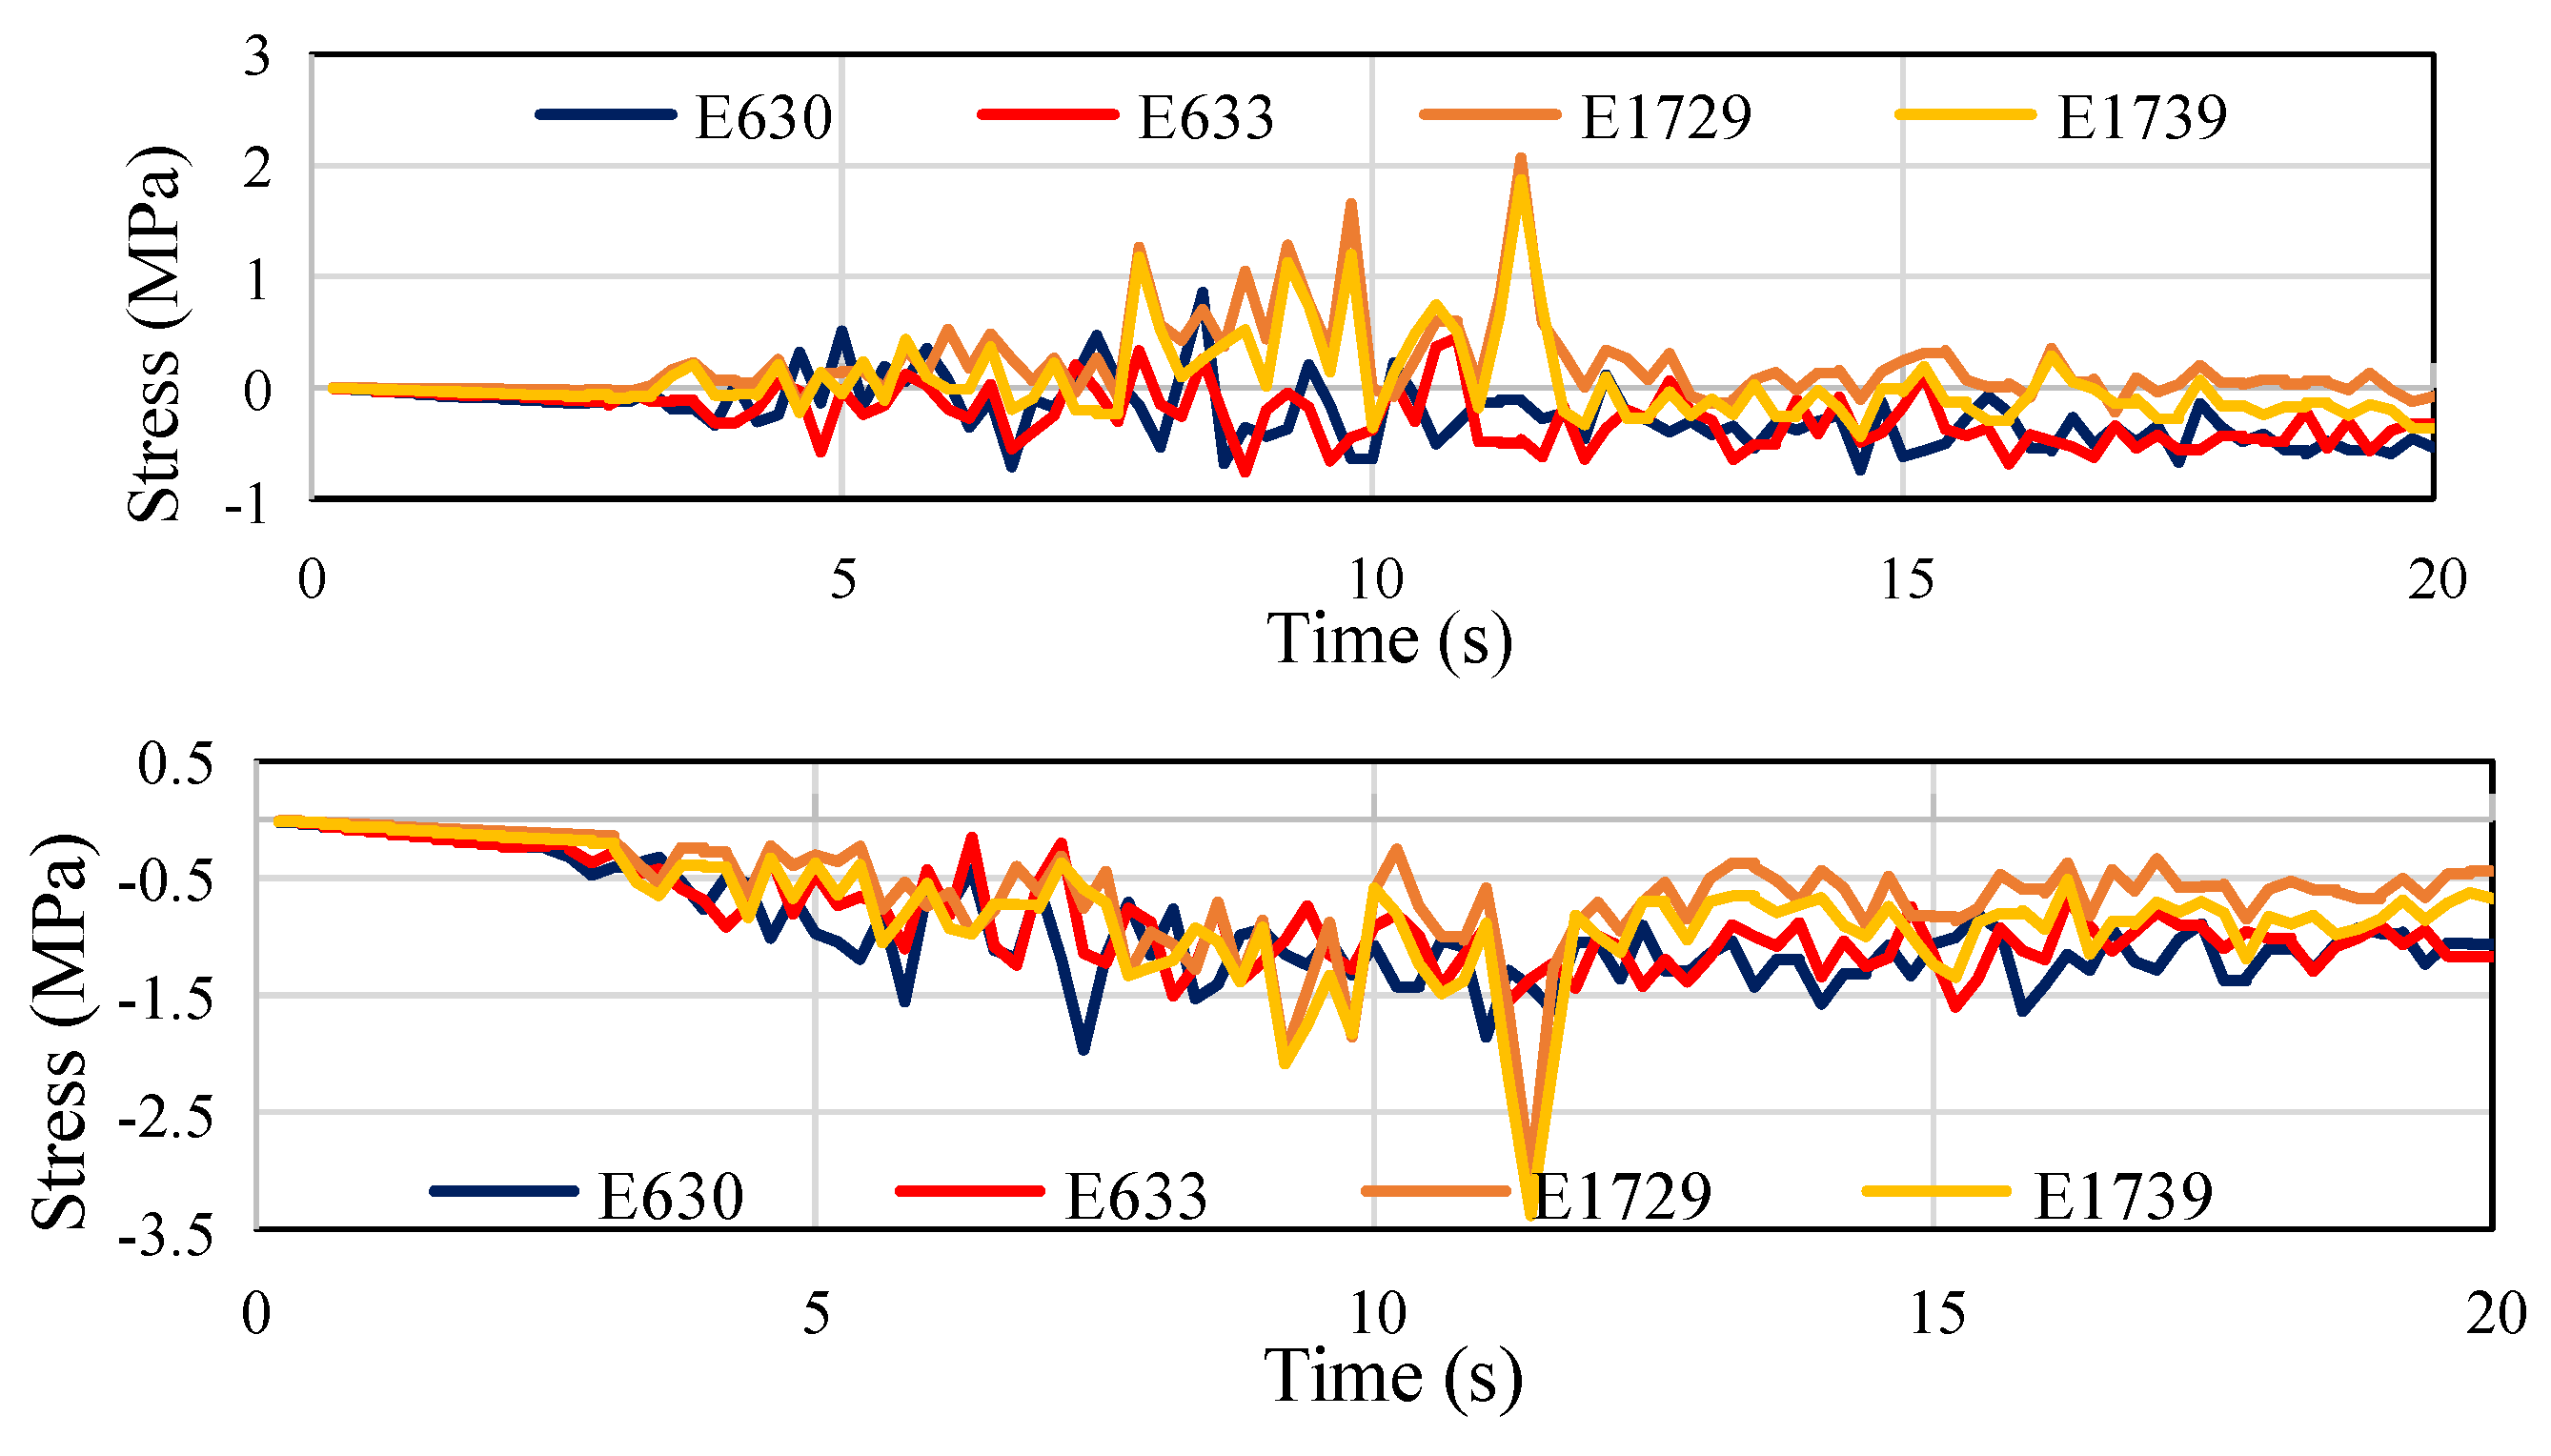
4.2. Effect of Seismic Load
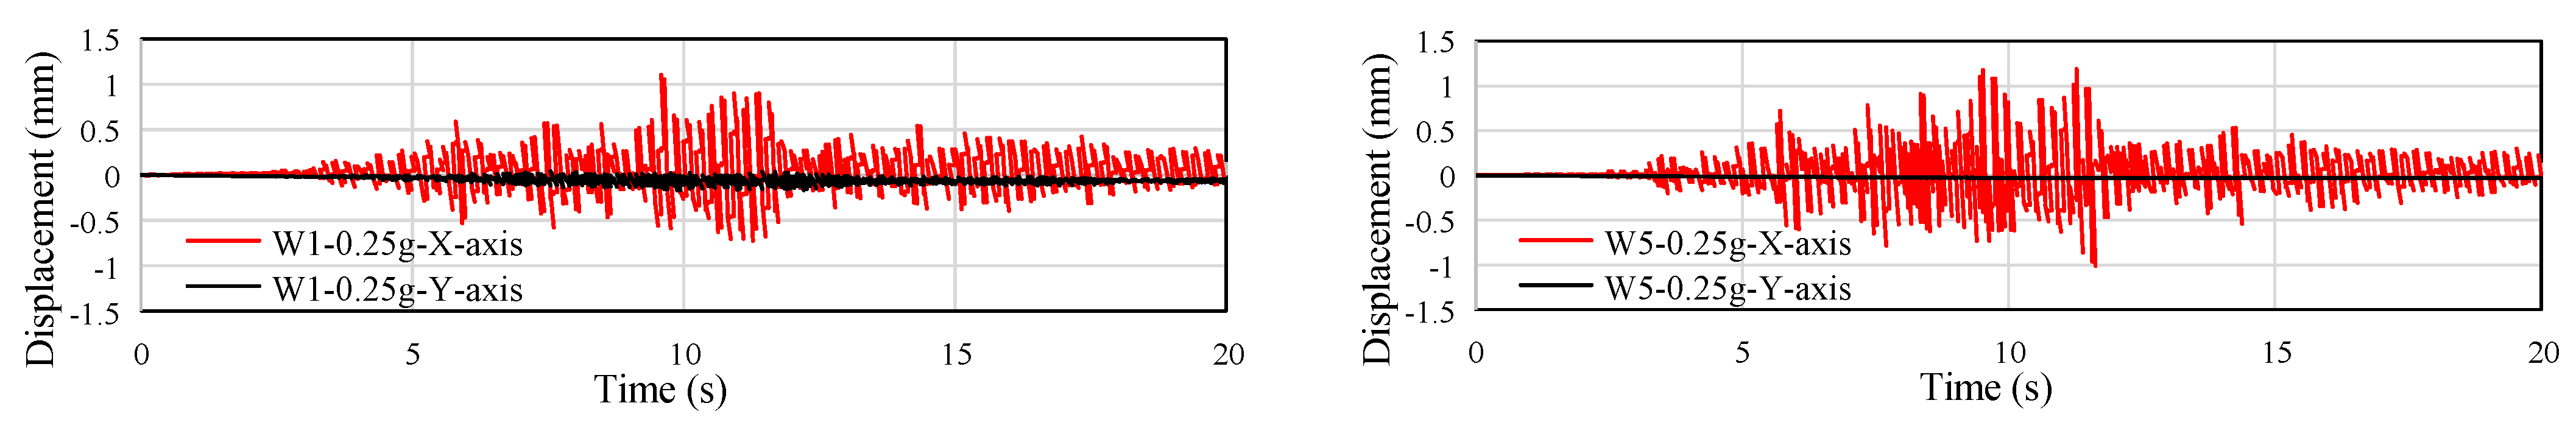
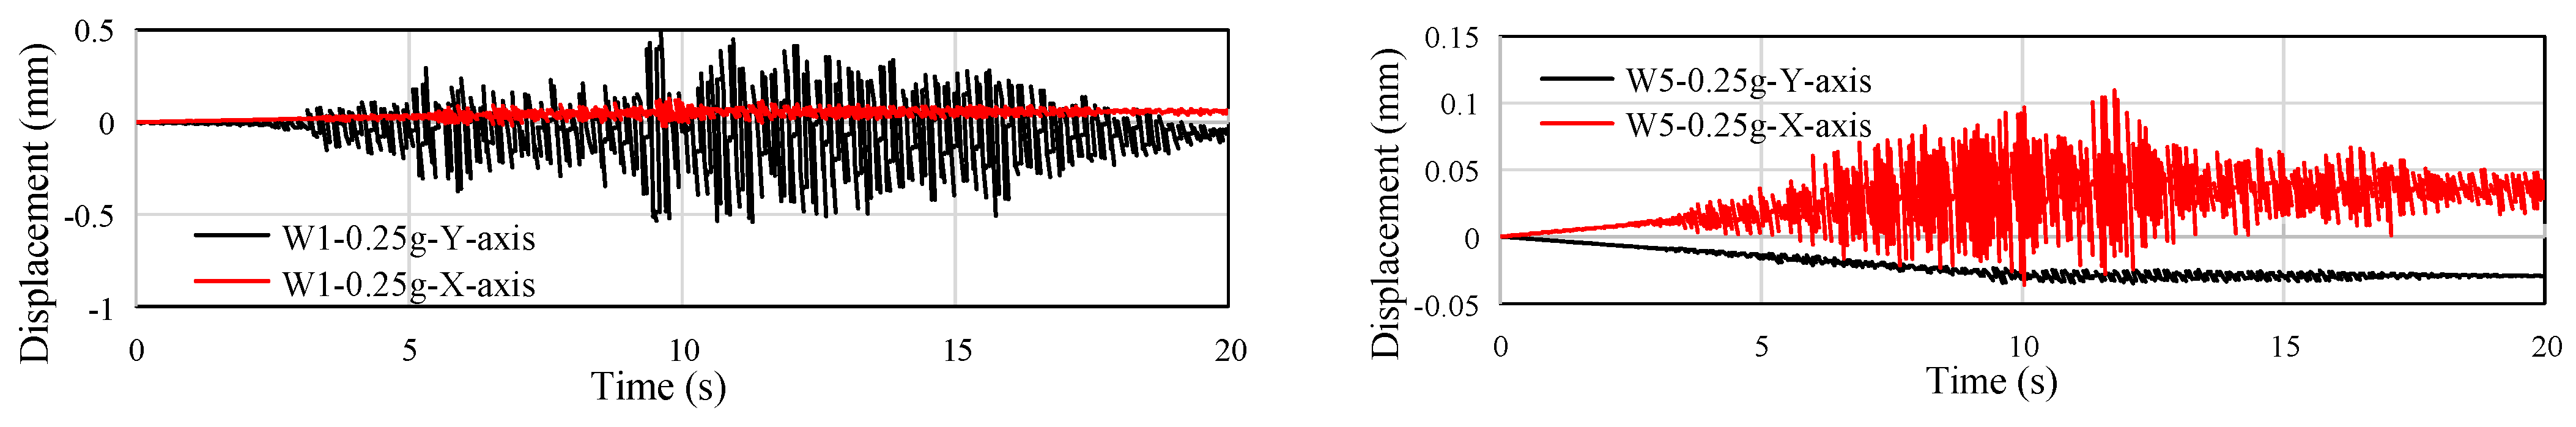
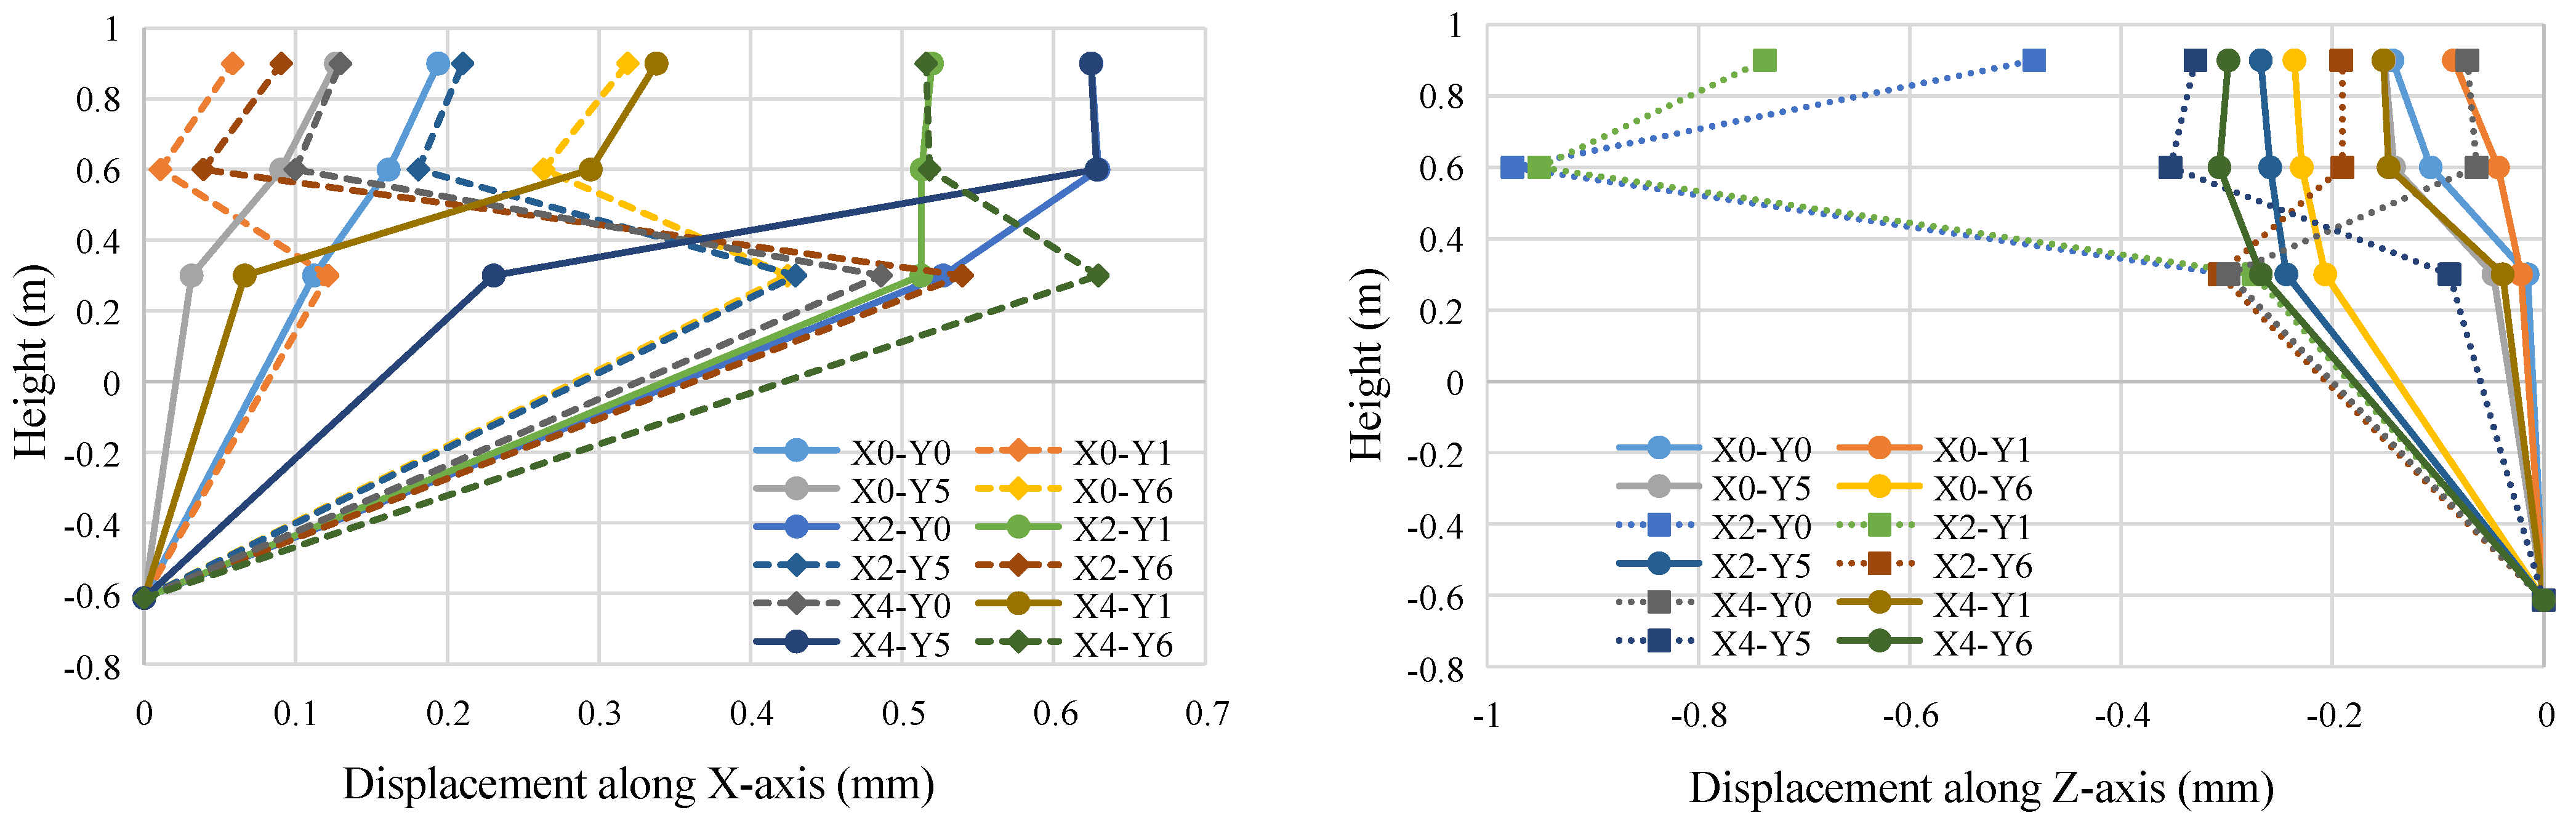
4.3. Effect of Seismic Excitation Mode
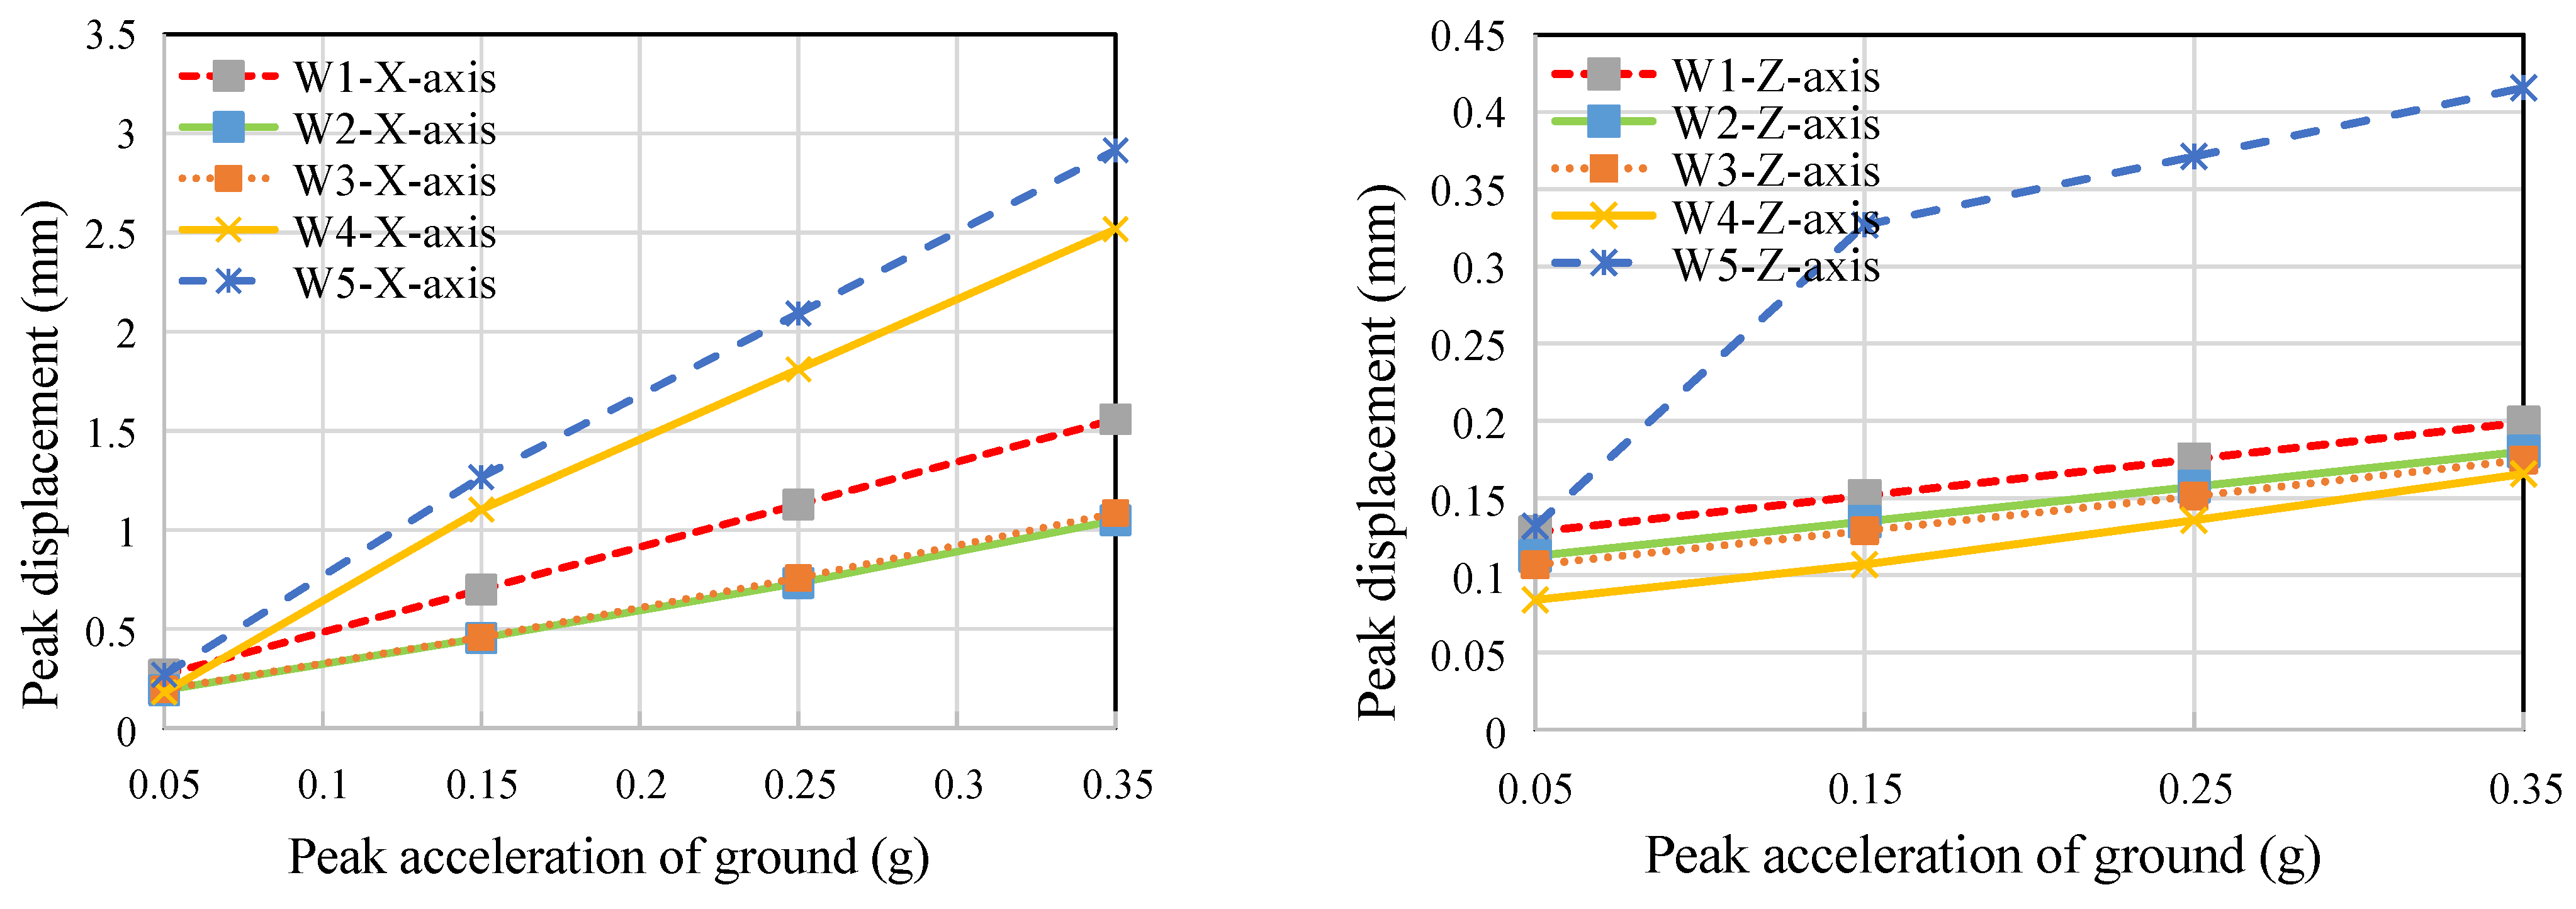
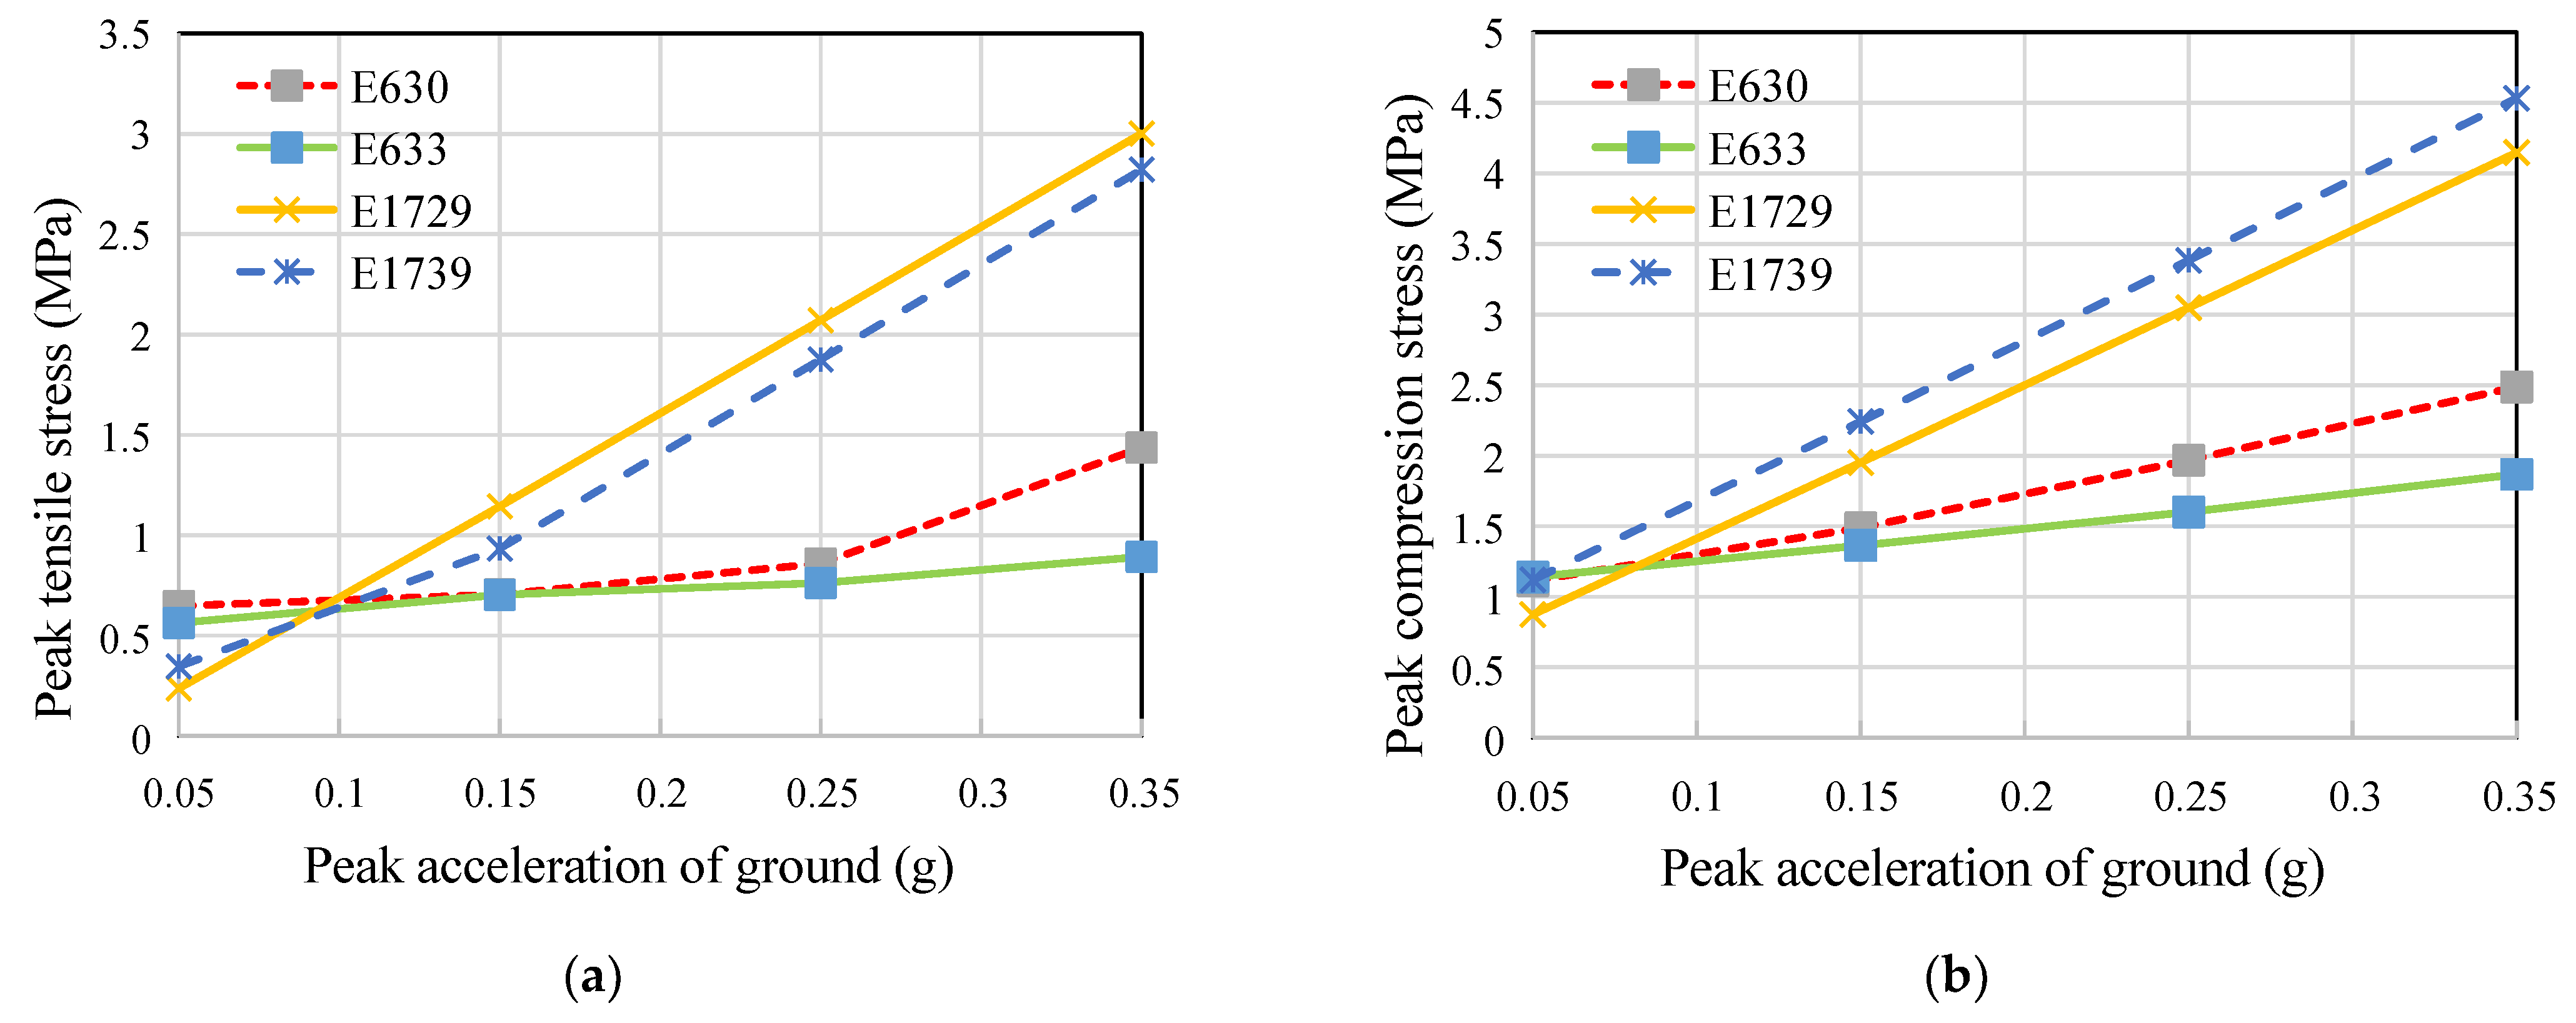
4.4. Peak Response of the Major Nodes
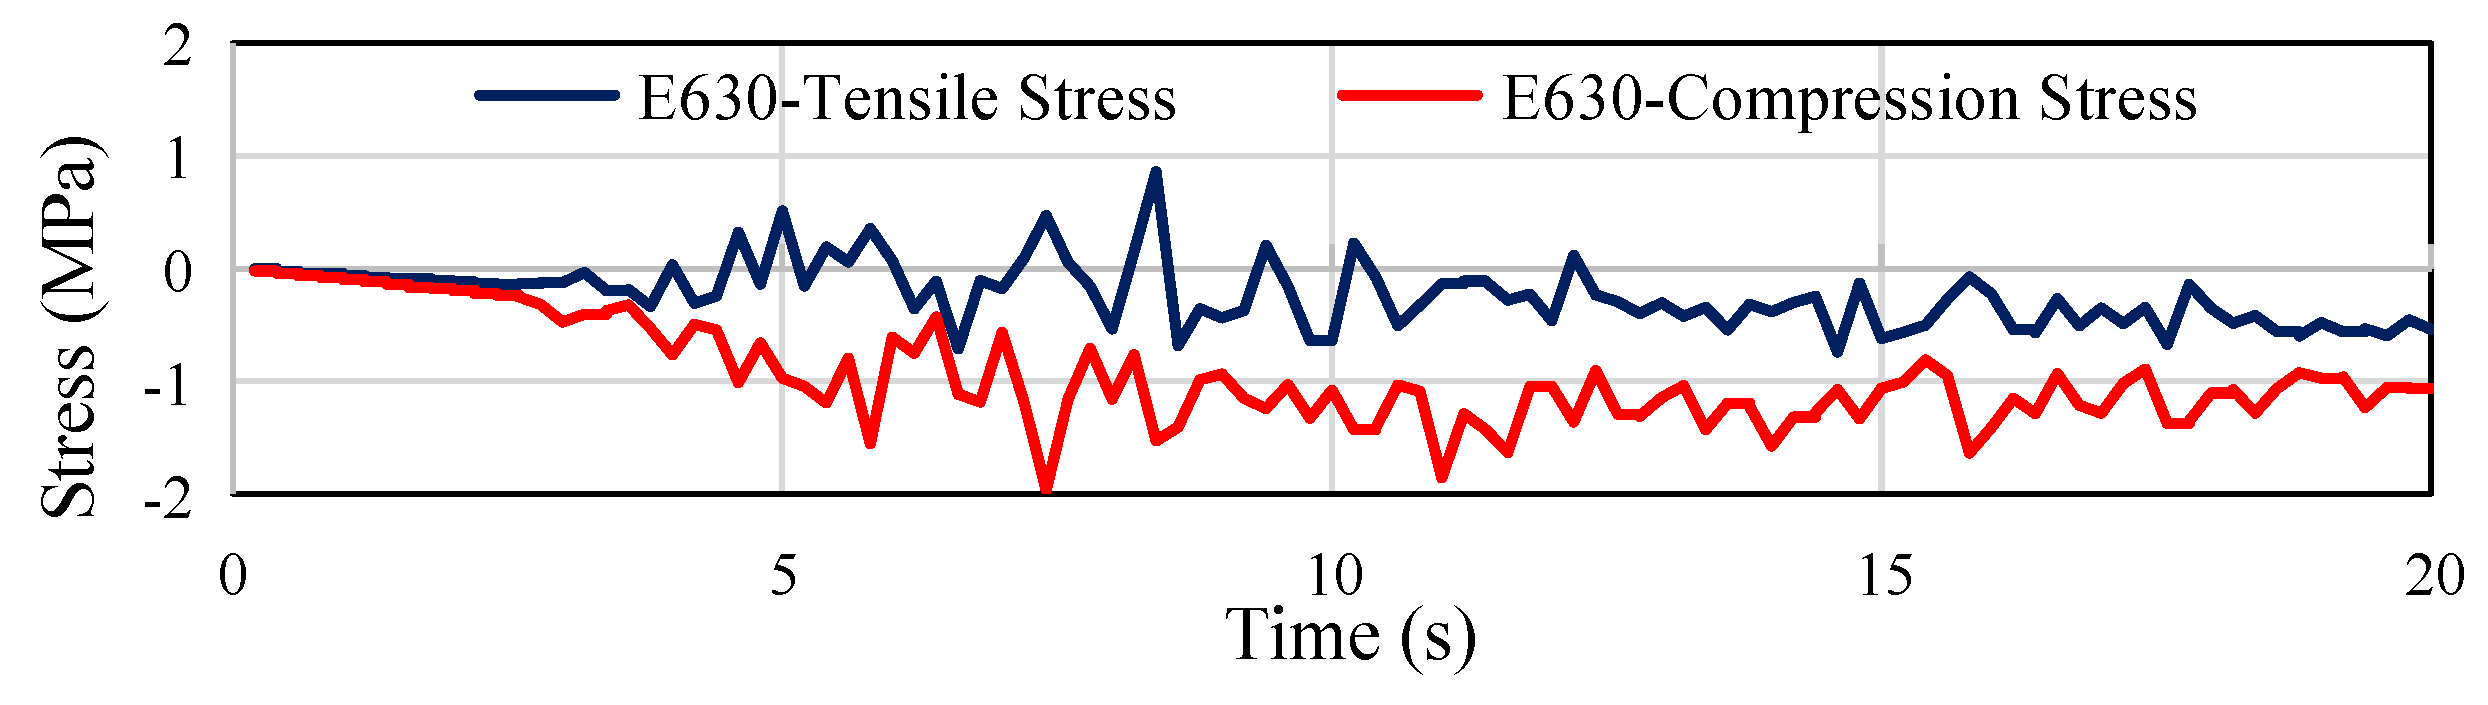
4.5. Discussion
5. Conclusions
- (1)
- The proposed numerical simulation method is reliable.
- (2)
- The presence of water accelerates the energy dissipation process, thus reducing the peak displacement; however, the wave load and the drag force caused by current and wind have little effect on the dynamic behavior of OCS when the seismic load is high.
- (3)
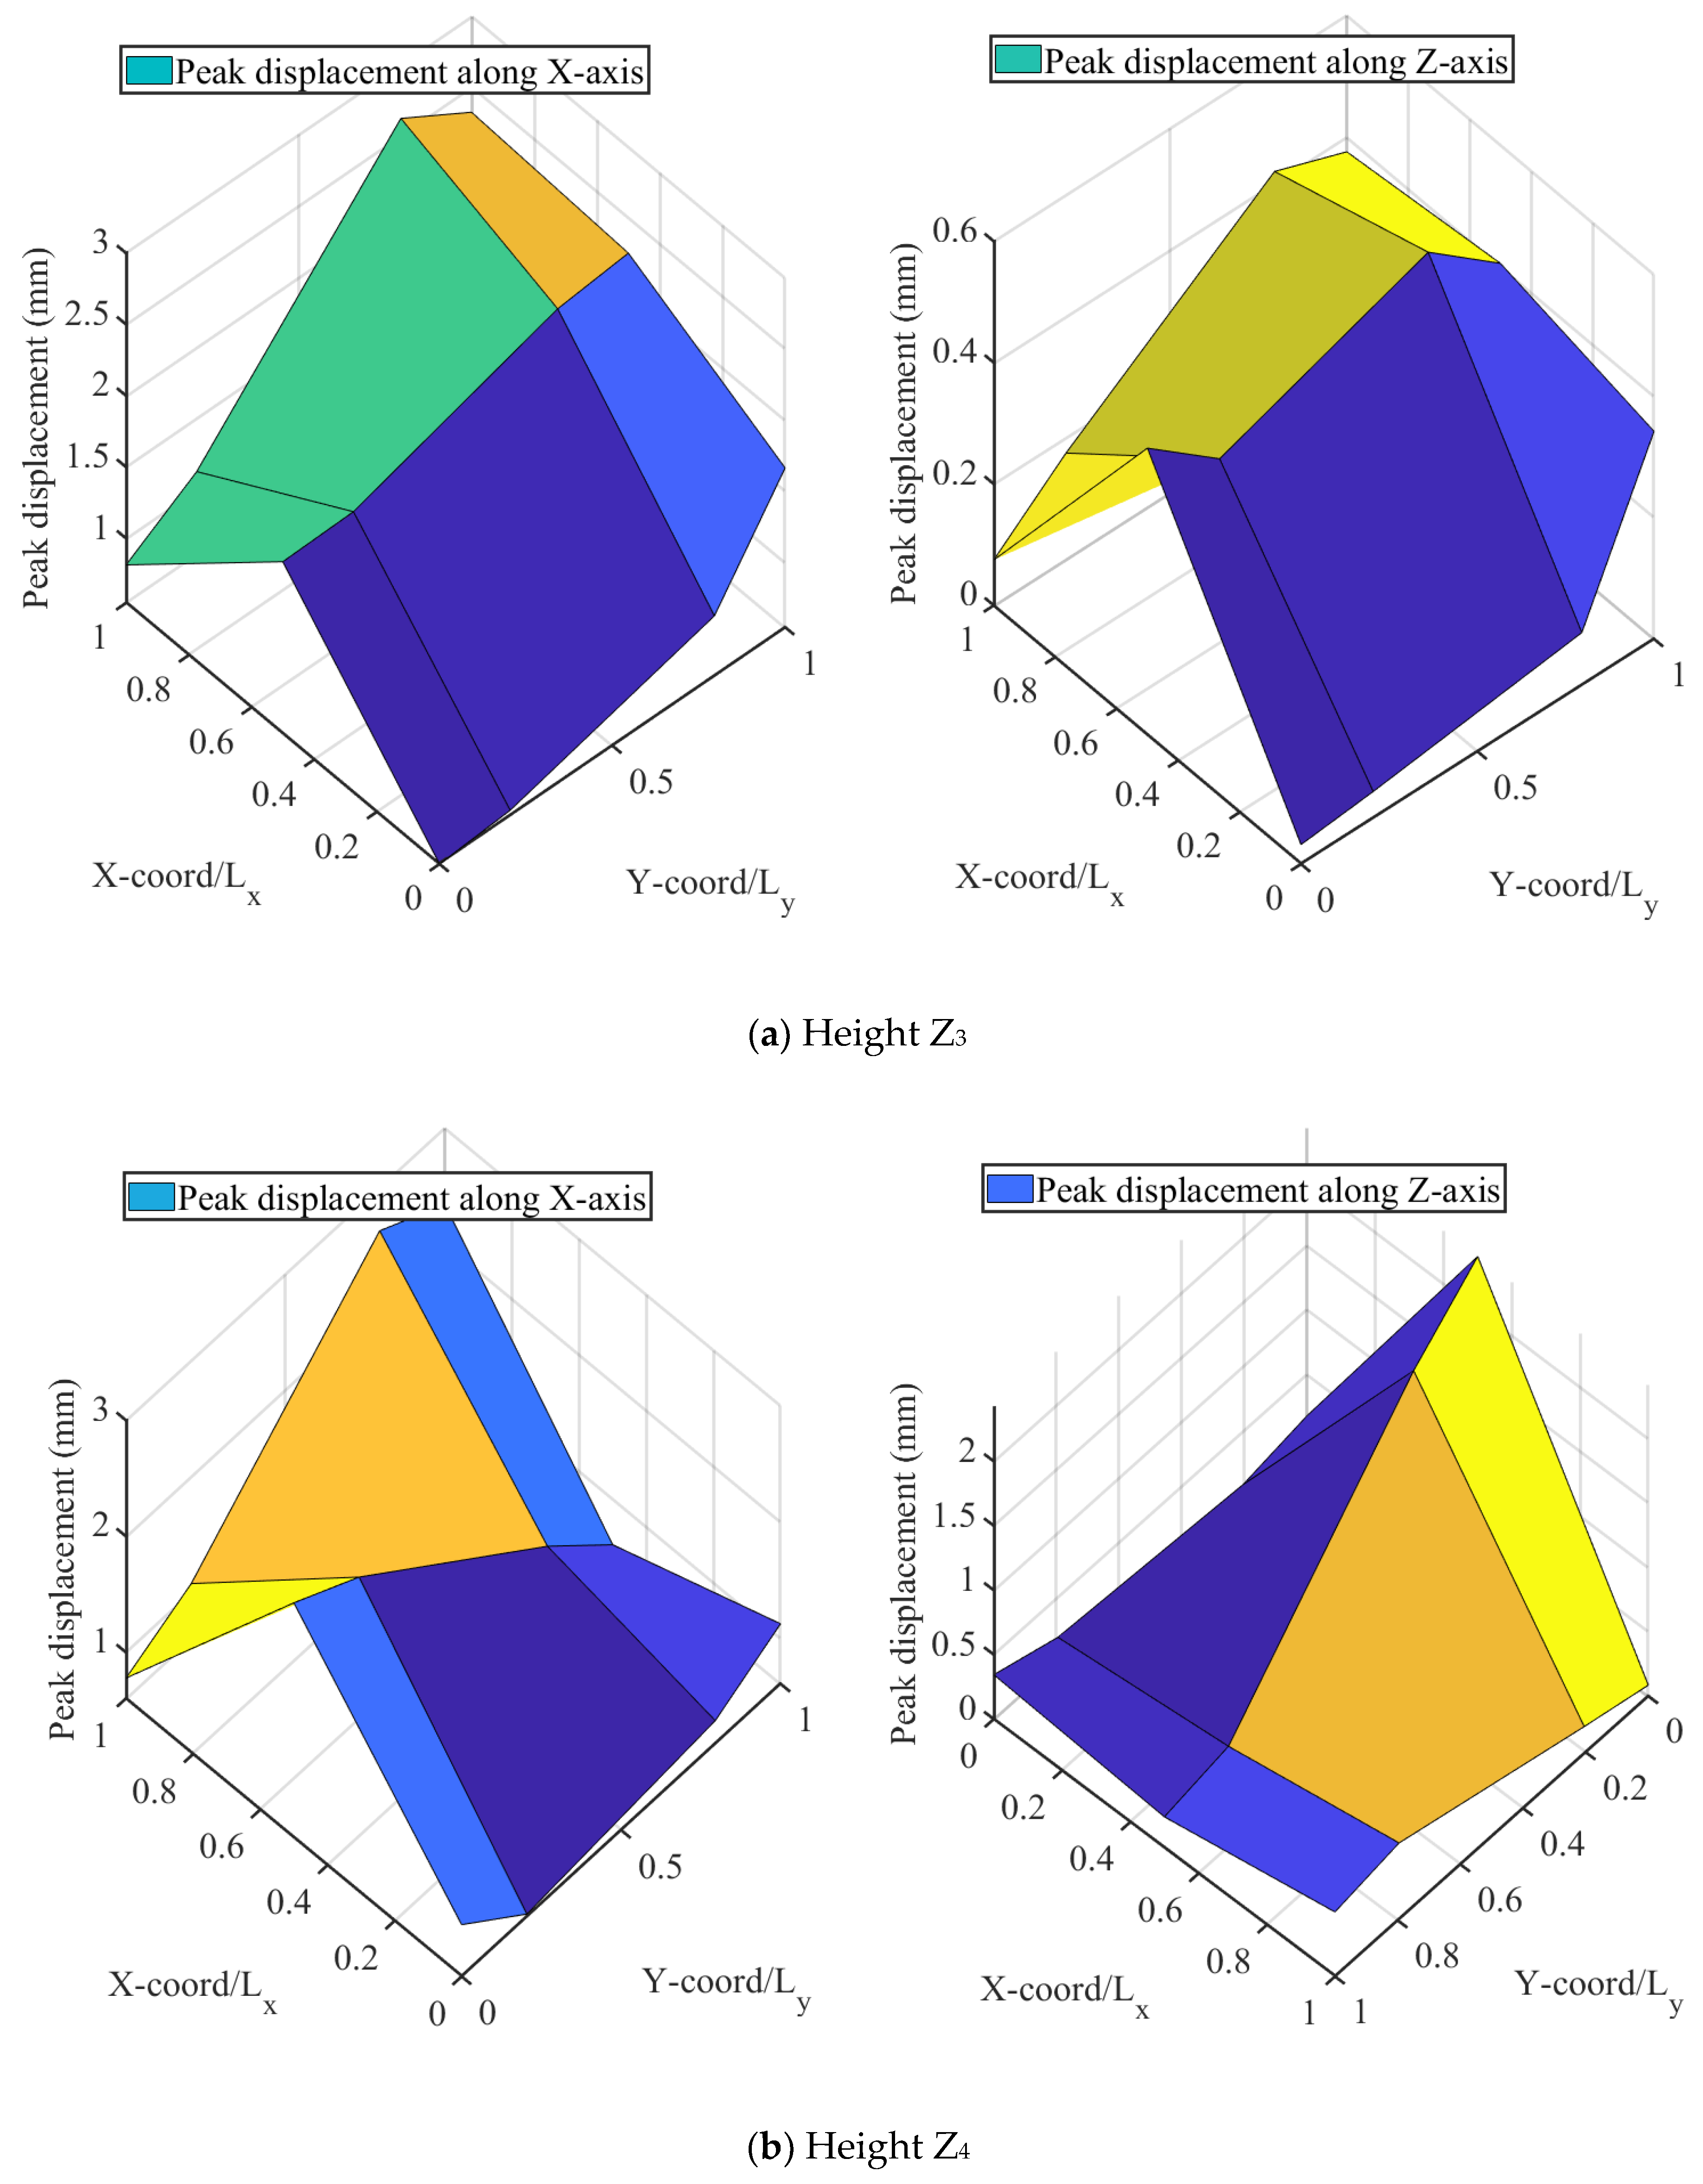
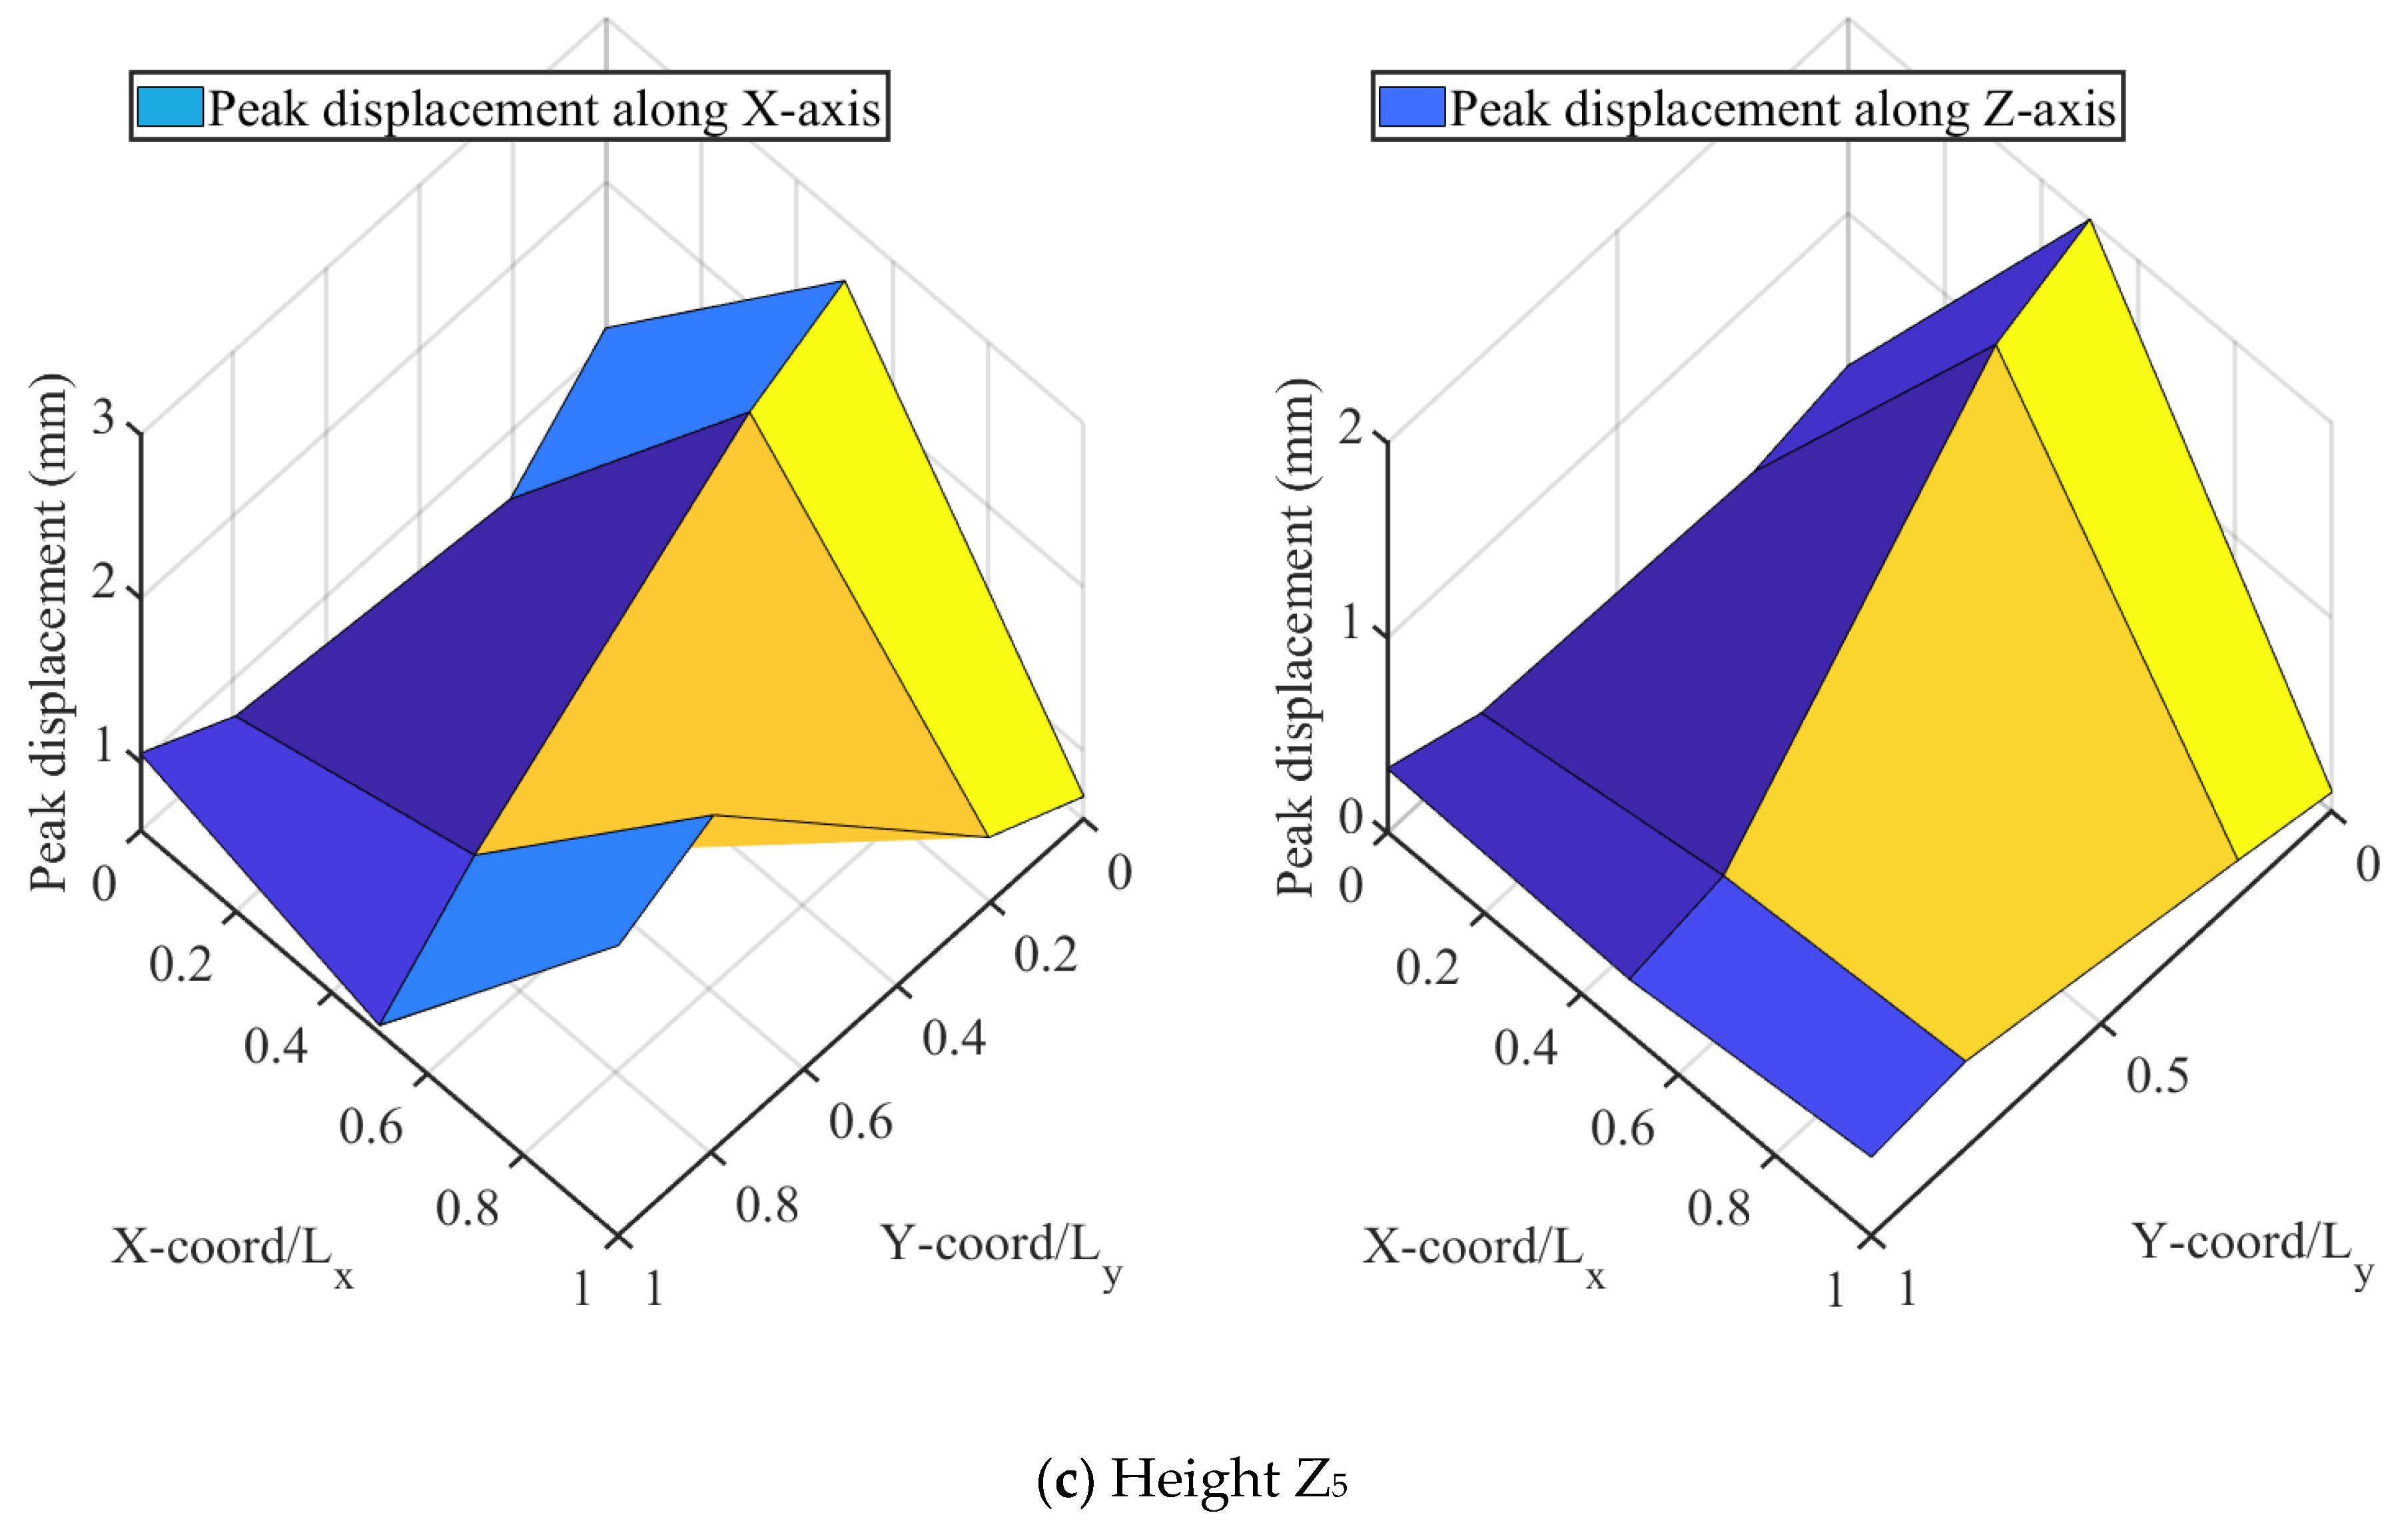
- The peak displacement and stress increase almost linearly with the increase in peak acceleration of the ground; and the seismic direction has a great impact on the dynamic behavior of the OCS, which is caused by the asymmetry of the structure.
- (4)
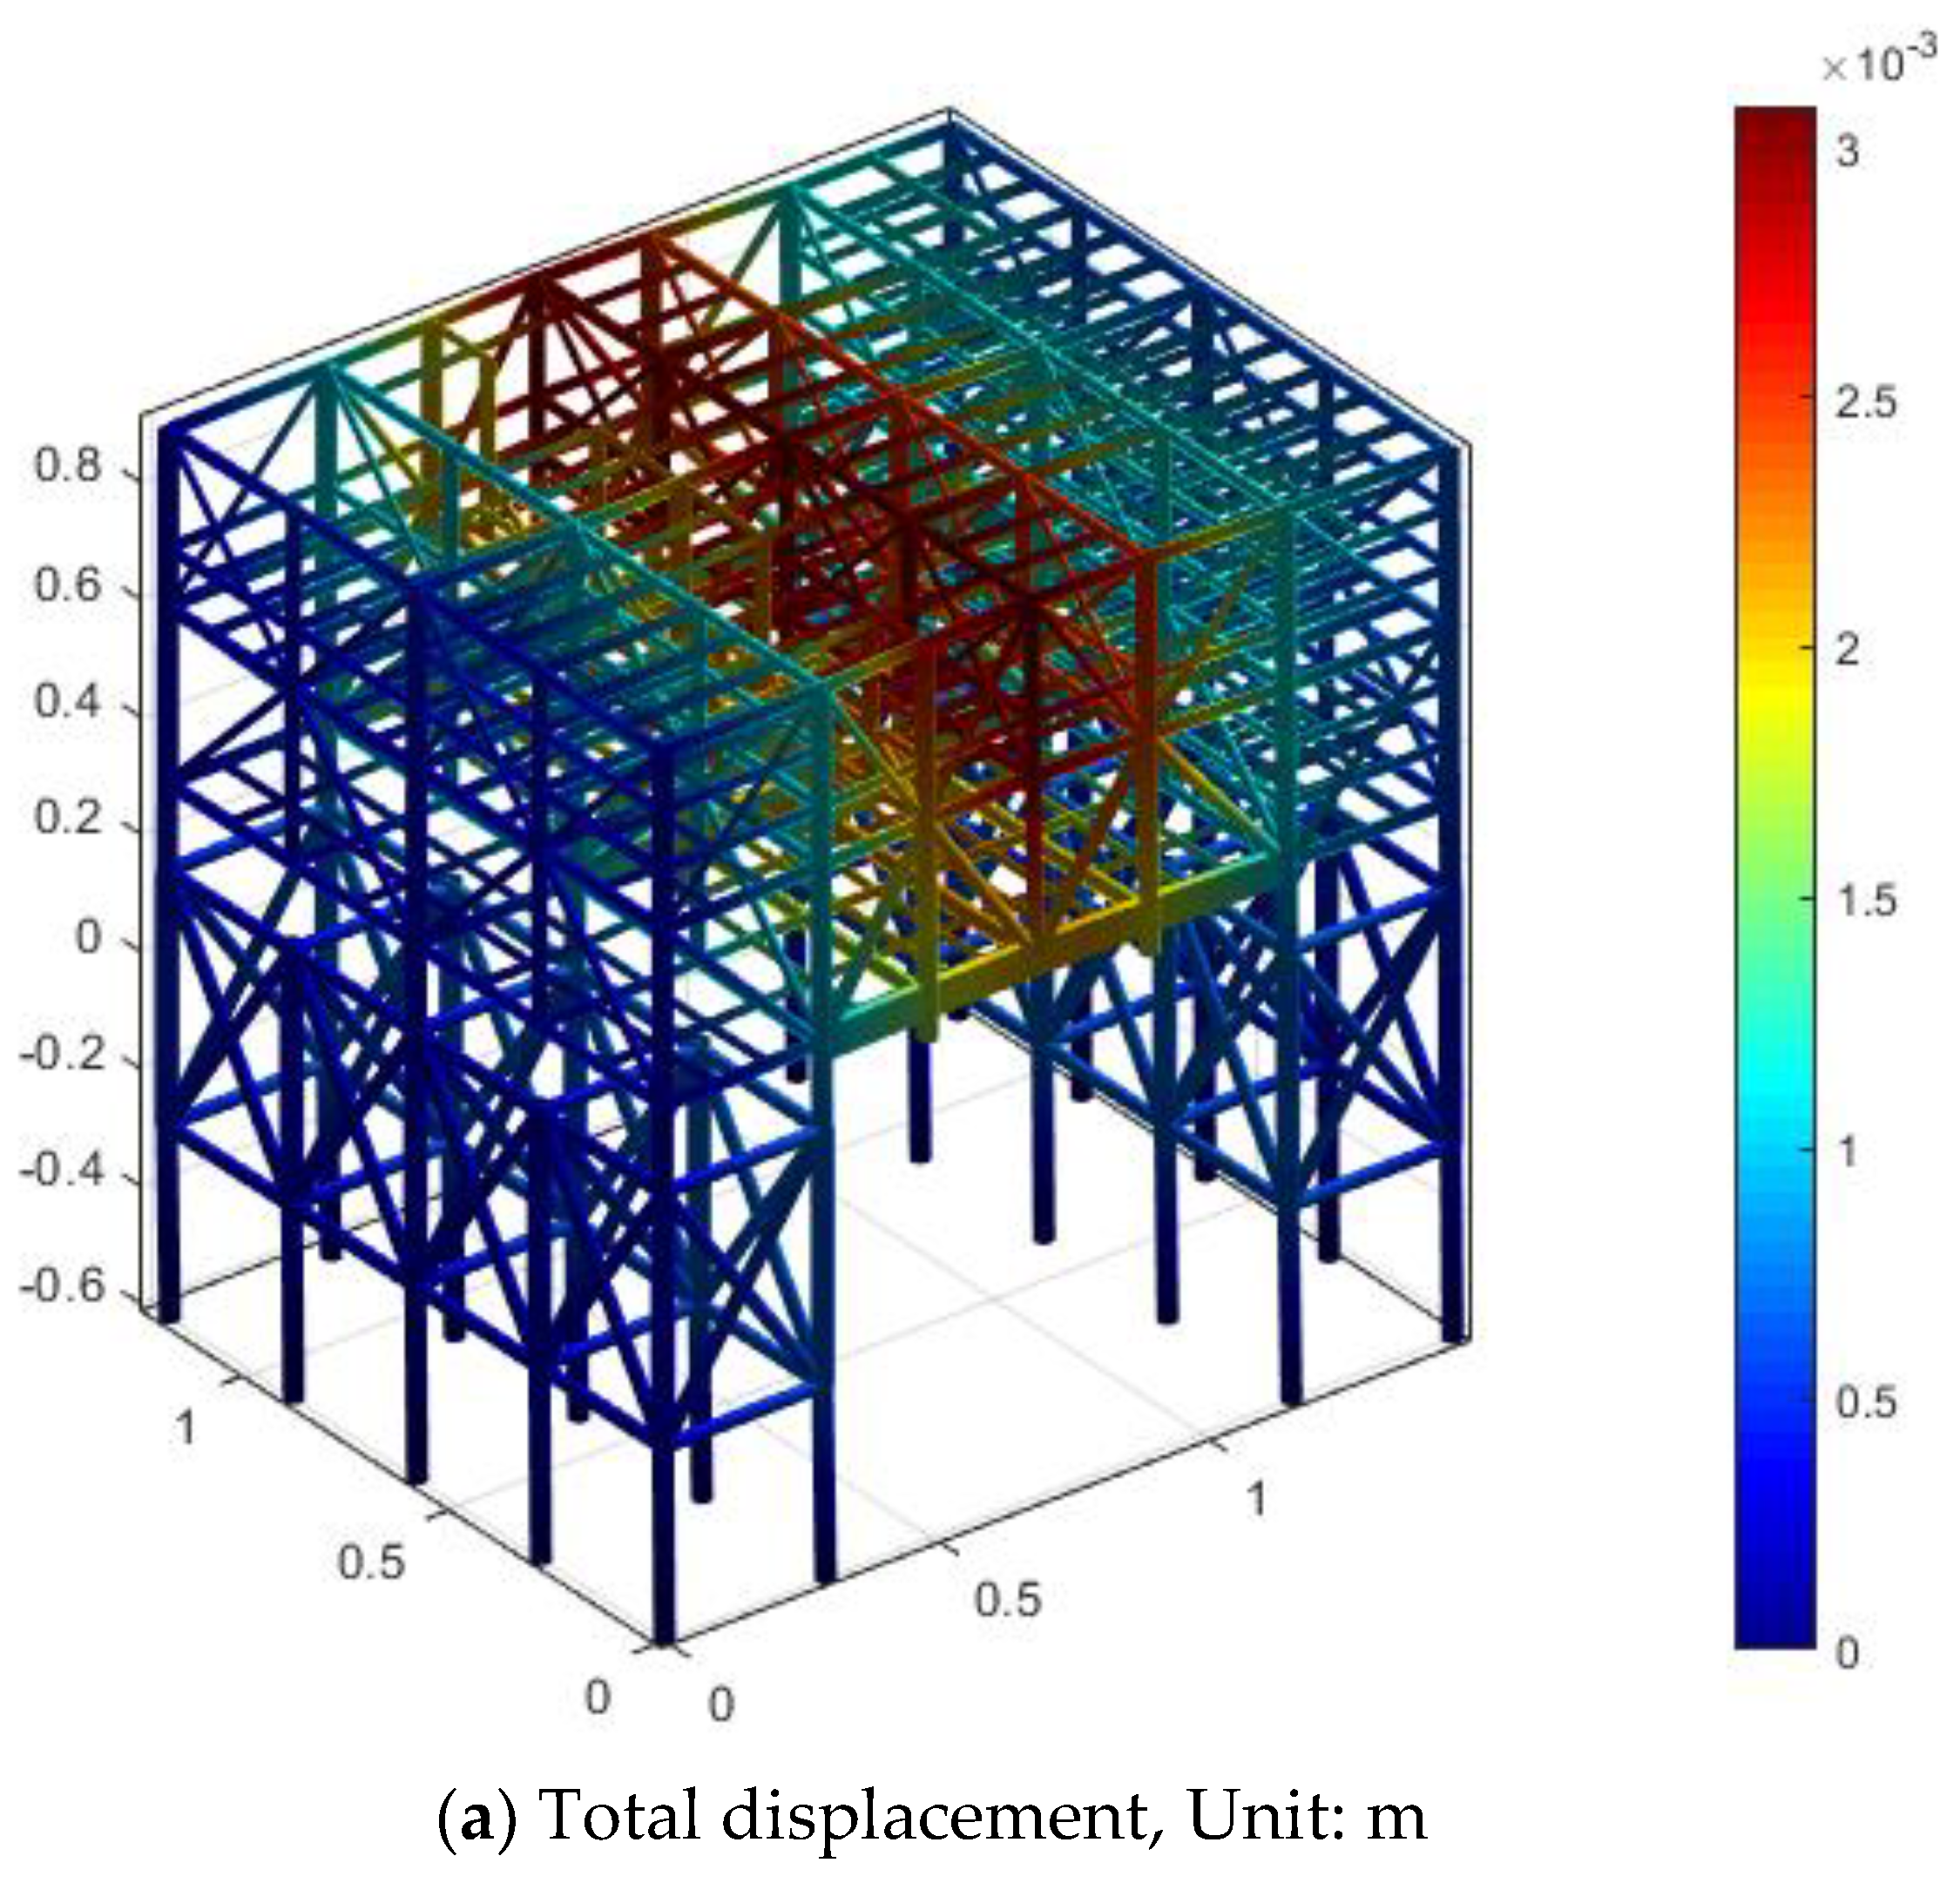
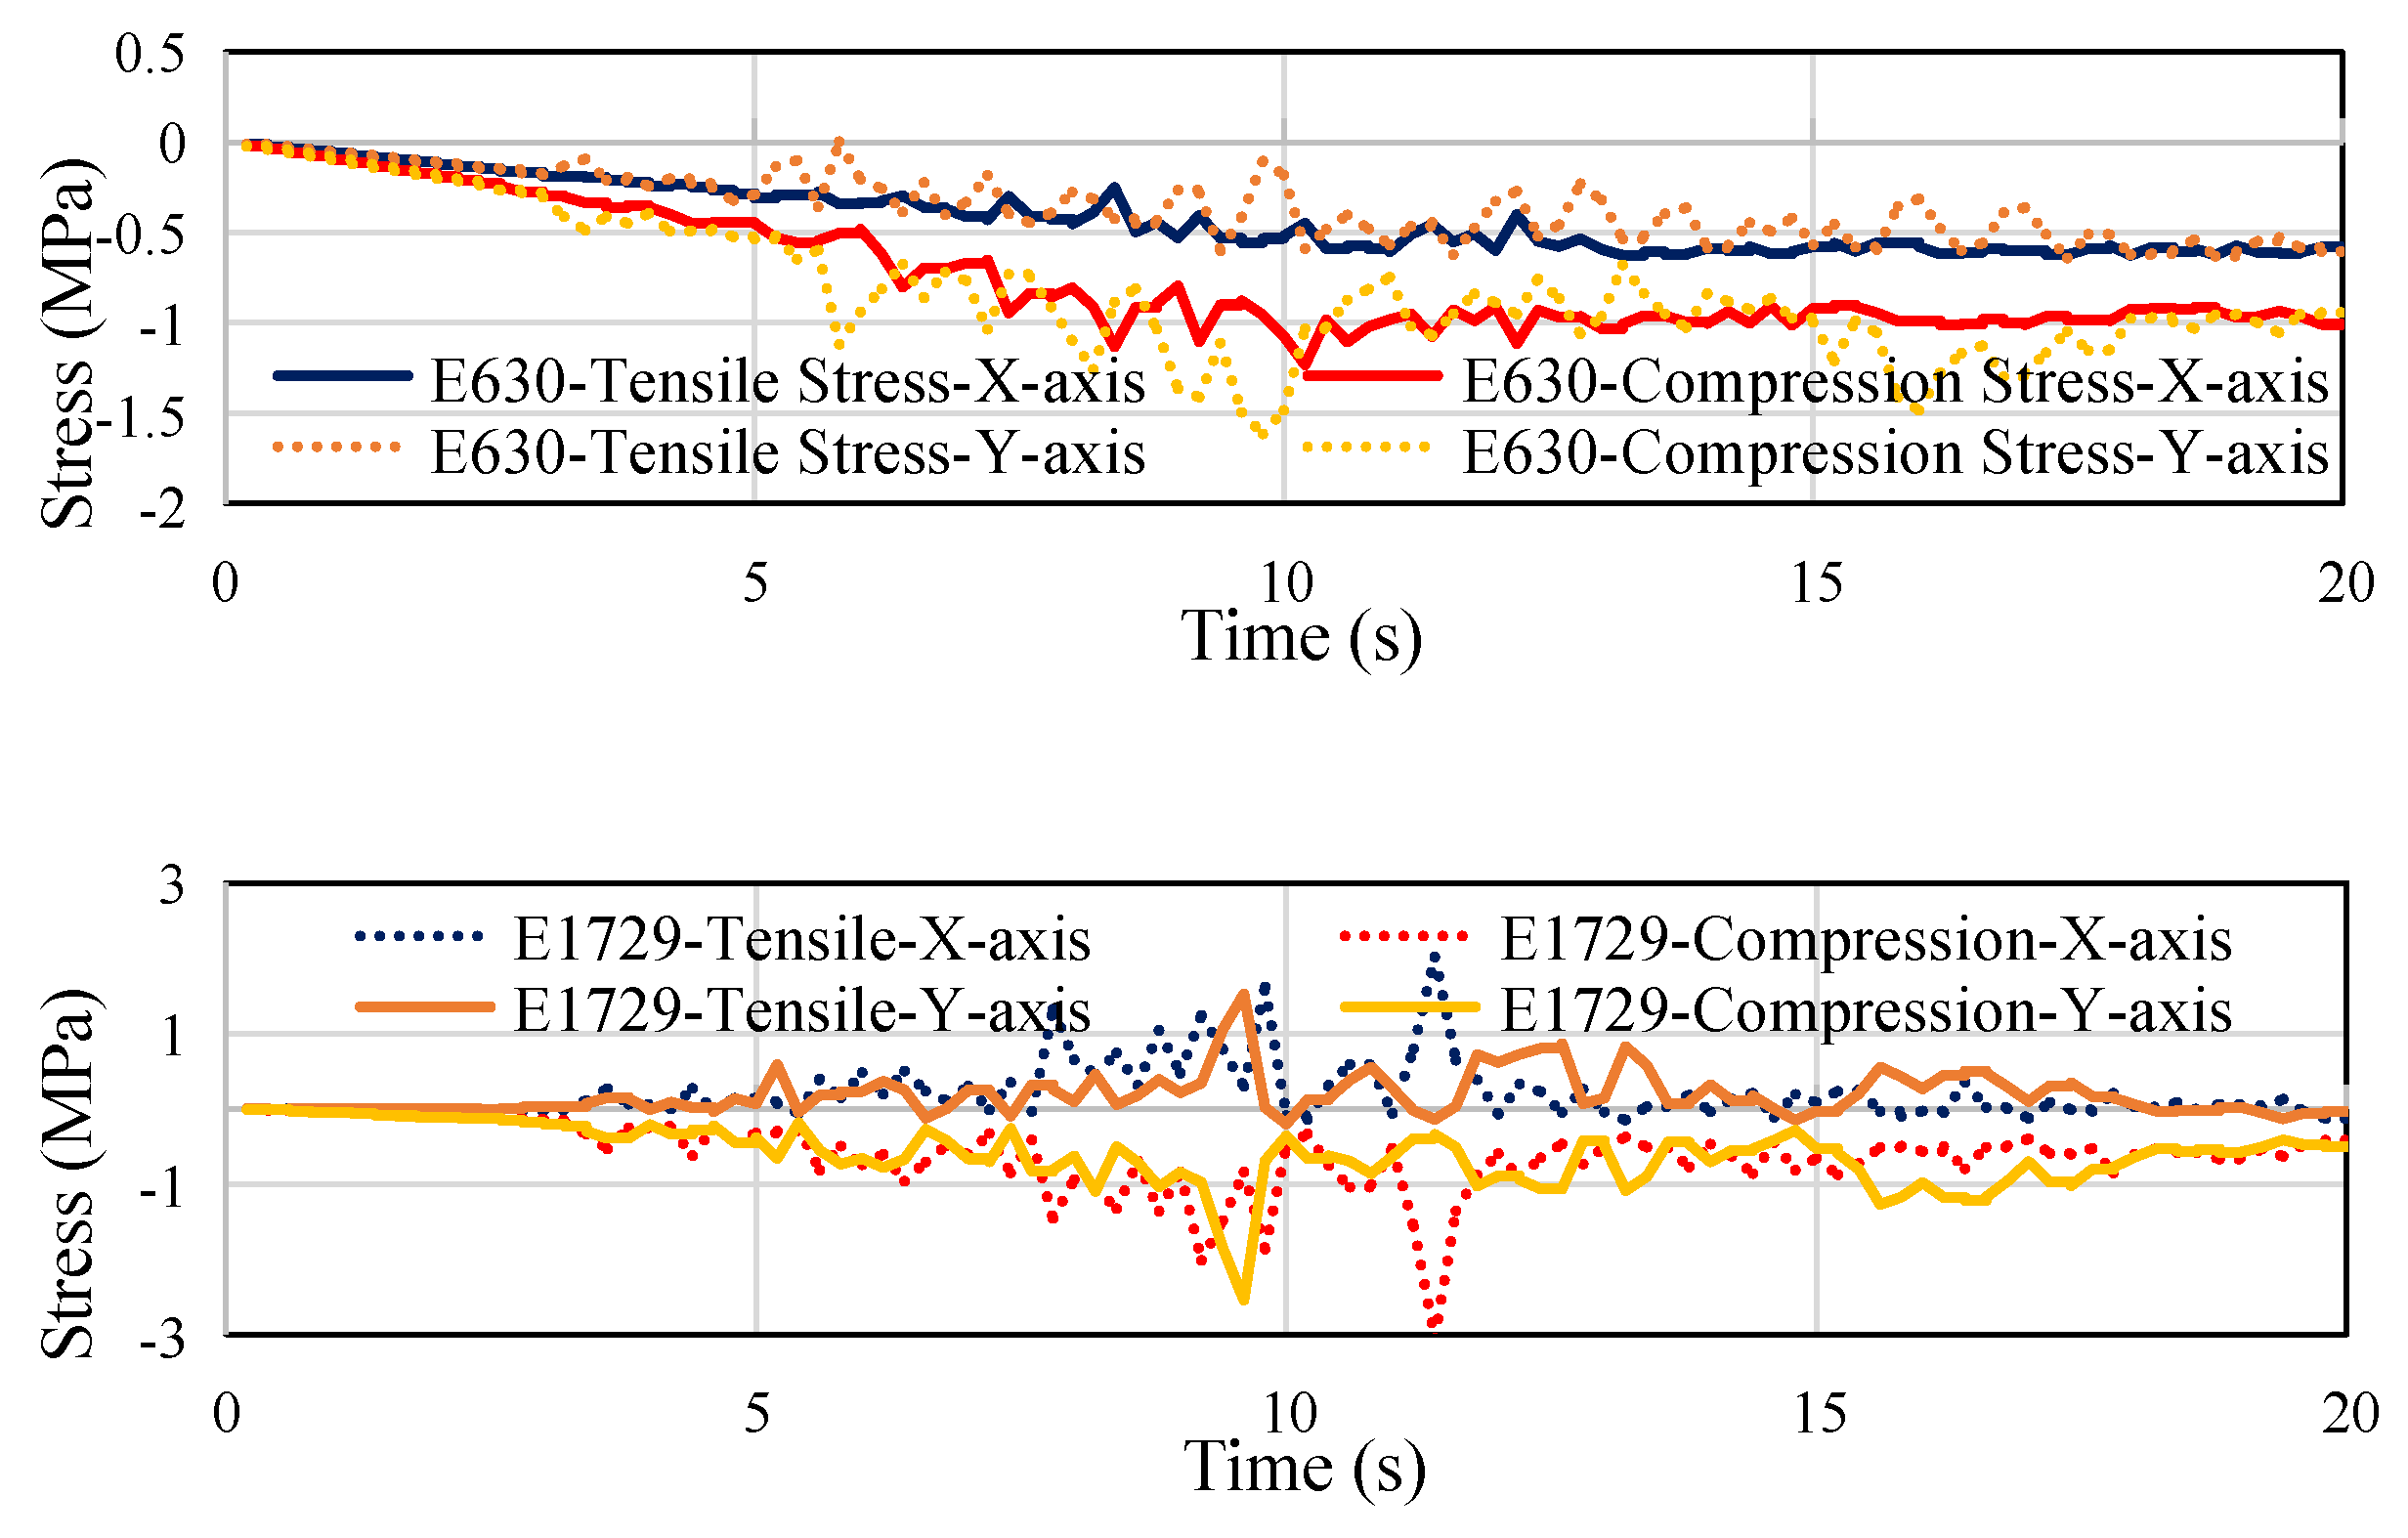
- Both a “whipping effect” and “stretching-squeezing effect” were observed during the earthquake, and the vertical acceleration response of the valve hall deck was much higher than other structures; local reinforcement should be made to protect the electrical equipment.
Author Contributions
Funding
Institutional Review Board Statement
Informed Consent Statement
Data Availability Statement
Conflicts of Interest
References
- Zhao, S.X.; Bi, C.W.; Sun, Z.Z. Engineering analysis of the dynamic characteristics of an electrical jacket platform of an offshore wind farm under seismic loads. Appl. Ocean Res. 2021, 112, 102692. [Google Scholar] [CrossRef]
- Sun, Z.Z.; Bi, C.W.; Zhao, S.X.; Dong, G.H.; Yu, H.F. Experimental analysis on dynamic responses of an electrical platform for an offshore wind farm under earthquake load. J. Mar. Sci. Eng 2019, 7, 279. [Google Scholar] [CrossRef] [Green Version]
- Bea, R.G.; Akky, M.R.; Audibert, J.M.E. Earthquake response of offshore platforms. J. Struct. Div. 1979, 105, 377–400. [Google Scholar] [CrossRef]
- Chandrasekaran, S.; Gaurav, G. Offshore triangular tension leg platform earthquake motion analysis under distinctly high sea waves. Ships Offshore Struct. 2008, 3, 173–184. [Google Scholar] [CrossRef]
- Huang, Z.; Foutch, D.A. Effect of hysteresis type on drift limit for global collapse of moment frame structures under seismic loads. J. Earthq. Eng. 2009, 13, 939–964. [Google Scholar] [CrossRef]
- Salem, Y.S.; Wang, L.; Aziz, G. Assessment of response modification factor of open steel platform structures subjected to seismic loads. In Facing the Challenges in Structural Engineering; Rodrigues, H., Elnashai, A., Calvi, G., Eds.; Springer: Cham, Switzerland, 2017; pp. 131–143. [Google Scholar]
- Failla, G.; Santangelo, F.; Foti, G.; Scali, F.; Arena, F. Response-spectrum uncoupled analyses for seismic assessment of offshore wind turbines. J. Mar. Sci. Eng. 2018, 6, 85. [Google Scholar] [CrossRef] [Green Version]
- Prowell, I.; Elgamal, A.; Uang, C.M.; Luco, E.J.; Romanowitz, H.; Duggan, E. Shake table testing and numerical simulation of a utility scale wind turbine including operational effects. Wind Energy 2014, 17, 997–1016. [Google Scholar] [CrossRef]
- Zheng, X.Y.; Li, H.; Rong, W.; Li, W. Joint earthquake and wave action on the monopile wind turbine foundation: An experimental study. Mar. Struct. 2015, 44, 125–141. [Google Scholar] [CrossRef] [Green Version]
- Wang, W.H.; Gao, Z.; Moan, T.; Li, X. Model Test and Numerical Analysis of a Multi-Pile Offshore Wind Turbine under Seismic, Wind, Wave and Current Loads. J. Offshore Mech. Arct. Eng. 2016, 139, 031901. [Google Scholar] [CrossRef]
- Sadowski, A.J.; Camara, A.; Málaga-Chuquitaype, C.; Dai, K. Seismic analysis of a tall metal wind turbine support tower with realistic geometric imperfections. Earthq. Eng. Struct. Dyn. 2017, 46, 201–219. [Google Scholar] [CrossRef] [Green Version]
- Wang, W.H.; Li, X.; Pan, Z.; Zhao, Z.X. Motion control of pentapod offshore wind turbines under earthquakes by tuned mass damper. J. Mar. Sci. Eng. 2019, 7, 224. [Google Scholar] [CrossRef] [Green Version]
- Zaid, M.G.; Imad, S.A.; Farzad, H. Dynamic evaluation of jack-up platform structure under wave, wind, earthquake and tsunami loads. J. Ocean. Eng. Sci. 2021, 7, 41–57. [Google Scholar] [CrossRef]
- Lin, G.; Zhu, T.; Lin, B. Dynamic model test similarity criterion. J. Dalian Univ. Technol. 2000, 40, 1–8. (In Chinese) [Google Scholar]
- Jin, Q.; Li, X.; Sun, N.; Zhou, J.; Guan, J. Experimental and numerical study on tuned liquid dampers for controlling earthquake response of jacket offshore platform. Mar. Struct. 2007, 20, 238–254. [Google Scholar] [CrossRef]
- Chen, J.; Zhan, G.; Zhao, Y. Application of spherical tuned liquid damper in vibration control of wind turbine due to earthquake excitations. Struct. Des. Tall Spec. Build 2016, 25, 431–443. [Google Scholar] [CrossRef]
- Zareie, S.; Zabihollahb, A. A semi-active SMA-MRF structural stability element for seismic control in marine structures. Appl. Ocean Res. 2020, 100, 102161. [Google Scholar] [CrossRef]
- Chiang, S.; Wang, Y.K.; Ting, E.C. Fundamentals of a Vector Form Intrinsic Finite Element: Part III. Convected Material Frame and Examples. J. Mech. 2004, 20, 133–143. [Google Scholar]
- Ting, E.C.; Chiang, S.; Wang, Y.K. Fundamentals of a Vector Form Intrinsic Finite Element: Part I. Basic Procedure and a Plane Frame Element. J. Mech. 2004, 20, 113–122. [Google Scholar] [CrossRef]
- Ting, E.C.; Chiang, S.; Wang, Y.K. Fundamentals of a Vector Form Intrinsic Finite Element: Part II. Plane Solid Elements. J. Mech. 2004, 20, 123–132. [Google Scholar] [CrossRef]
- Wu, H.; Zeng, X.H.; Xiao, J.Y.; Yu, Y.; Dai, X.; Yu, J.X. Vector form intrinsic finite-element analysis of static and dynamic behavior of deep-sea flexible pipe. Int. J. Nav. Archit. Ocean Eng. 2020, 12, 376–386. [Google Scholar] [CrossRef]
- Li, X.M.; Guo, X.L.; Guo, H.Y. Vector form intrinsic finite element method for nonlinear analysis of threedimensional marine risers. Ocean Eng. 2018, 161, 257–267. [Google Scholar] [CrossRef]
- Duan, Y.F.; He, K.; Zhang, H.M.; Ting, E.C.; Wang, C.Y.; Chen, S.K.; Wang, R.Z. Entire-process simulation of earthquake-induced collapse of a mockup cablestayed bridge by vector form intrinsic finite element (VFIFE) method. Adv. Struct. Eng. 2014, 17, 347–360. [Google Scholar] [CrossRef]
- Ding, C.X.; Duan, Y.F.; Wu, D.Y. Vector Mechanics of Structural; Science Press: Beijing, China, 2012. (In Chinese) [Google Scholar]
- Wang, Z.; Zhao, Y. Vector form Intrinsic finite element method for collision-contact analysis of membrane materials. Chin. J. Comput. Mech. 2014, 31, 378–383. [Google Scholar]
- Yu, Y.; Li, Z.M.; Yu, J.X.; Xu, L.X.; Cheng, S.Y.; Wu, J.Y.; Wang, H.K.; Xu, W.P. Buckling failure analysis for buried subsea pipeline under reverse fault displacement. Thin-Walled Struct. 2021, 169, 108350. [Google Scholar] [CrossRef]
- Yu, Y.; Li, Z.M.; Yu, J.X.; Xu, L.G.; Zhao, M.R.; Cui, Y.P.; Wu, H.; Duan, Q.H. Buckling analysis of subsea pipeline with integral buckle arrestor using vector form intrinsic finite thin shell element. Thin-Walled Struct. 2021, 164, 107533. [Google Scholar] [CrossRef]
- Wang, S.Q.; Liang, B.C. Wave Mechanics in Ocean Engineering; Ocean University of China Press: Qingdao, China, 2013. [Google Scholar]
- Lubeena, R.; Gupta, V. Hydrodynamic Wave Loading on Offshore Structures. In Proceedings of the Offshore Technology Conference, Houston, TX, USA, 6–9 May 2013. [Google Scholar]
- Hao, S.; Yu, Y.; Yu, J.X.; Yuan, Z.M.; Xu, L.X.; Li, Z.M.; Cheng, S.Y.; Wu, J.Y. Structural response analysis of the hydraulic pneumatic tensioner under its local failure based on a fully coupled TLP-TTR system. Ocean Eng. 2020, 216, 107645. [Google Scholar] [CrossRef]
- Li, Y.Q.; Li, B.; Shi, H.Y.; Zhao, Q.Q.; You, Z.J. Analysis of wave characteristics in the northeastern part of the South China Sea. Trans. Oceanol. Limnol. 2019, 2, 18–23. [Google Scholar]
- Yang, Z.; Xie, Q.; Zhou, Y.; Mosalam, K.M. Seismic performance and restraint system of suspended 800 kV thyristor valve. Eng. Struct. 2018, 169, 179–187. [Google Scholar] [CrossRef]
- He, C.; Xie, Q.; Yang, Z.; Xue, S. Seismic performance evaluation and improvement of ultra-high voltage wall bushing-valve hall system. J. Constr. Steel Res. 2019, 154, 123–133. [Google Scholar] [CrossRef]
- Bang, S.; Kim, H.-S.; Koo, J.-H.; Lee, B.-W. Consideration of the insulation design method on a ±200 kV converter valve unit in an HVDC converter hall. Energies 2021, 14, 2296. [Google Scholar] [CrossRef]
- Yang, L.J.; Liu, D.W.; Guo, Z.L.; Li, J.; Dai, B.H. Engineering mechanics in whipping effect of high-rise building. Appl. Mech. Mater. 2014, 540, 173–176. [Google Scholar] [CrossRef]


| Material | E (GPa) | Dynamic Elasticity Modulus, ED (GPa) | Poisson’s Ratio, v | Density, ρs (kg/m3) | Water Depth, h (m) |
|---|---|---|---|---|---|
| Plexiglass | 2.62 | 3.91 | 0.42 | 1201.2 | 0.32 |
Publisher’s Note: MDPI stays neutral with regard to jurisdictional claims in published maps and institutional affiliations. |
© 2022 by the authors. Licensee MDPI, Basel, Switzerland. This article is an open access article distributed under the terms and conditions of the Creative Commons Attribution (CC BY) license (https://creativecommons.org/licenses/by/4.0/).
Share and Cite
Sun, Z.; Yu, Y.; Wang, H.; Huang, S.; Chen, J. Dynamic Response Analysis of Offshore Converter Station Based on Vector Form Intrinsic Finite Element (VFIFE) Method. J. Mar. Sci. Eng. 2022, 10, 749. https://doi.org/10.3390/jmse10060749
Sun Z, Yu Y, Wang H, Huang S, Chen J. Dynamic Response Analysis of Offshore Converter Station Based on Vector Form Intrinsic Finite Element (VFIFE) Method. Journal of Marine Science and Engineering. 2022; 10(6):749. https://doi.org/10.3390/jmse10060749
Chicago/Turabian StyleSun, Zhenzhou, Yang Yu, Huakun Wang, Shanshan Huang, and Jiefeng Chen. 2022. "Dynamic Response Analysis of Offshore Converter Station Based on Vector Form Intrinsic Finite Element (VFIFE) Method" Journal of Marine Science and Engineering 10, no. 6: 749. https://doi.org/10.3390/jmse10060749