Article

Mechanical Characteristics of Prestressed Concrete Curved Transition Section of Composite Bucket Foundations for Offshore Wind Turbines

1
State Key Laboratory of Hydraulic Engineering Simulation and Safety, Tianjin University, Tianjin 300350, China
2
Shanghai Investigation, Design Research Institute Co., Ltd., Shanghai 200355, China
*
Authors to whom correspondence should be addressed.
J. Mar. Sci. Eng. 2022, 10(4), 473; https://doi.org/10.3390/jmse10040473
Submission received: 14 February 2022 / Revised: 23 March 2022 / Accepted: 26 March 2022 / Published: 28 March 2022
(This article belongs to the Special Issue Offshore Wind Turbine Foundations)

Abstract

:
The composite bucket foundation (CBF) consists of a concrete curved transition section, a concrete beam-slab system, and a suction caisson and is increasingly used as the foundation for offshore wind turbines. The curved transition section transmits the upper load from the tower to the foundation, and its force and transmission characteristics are related to the safety of the entire wind turbine structure. The arced transition section has the characteristics of complex geometry, load conditions, and large curvature. It is difficult to determine its bearing characteristics and force transmission system. In this paper, the boundary conditions and loading device of the CBF model test are designed, and three 1:20 arced transition section model specimens are made. The mechanical characteristic experiments of CBF are used to analyze the failure process, failure characteristics, and seismic performance of the structure. Results show that the cracking effect of the arced transition section after prestressing is obviously better than that of a reinforced concrete arced transition section structure. The arced transition section specimens equipped with prestressed tendons can increase the structural cracking load ratio by about 35% for reinforced concrete members. The energy dissipation capacity of the specimens has been significantly improved, and the material properties can be fully utilized. The failure mode of the arced transition section structure under horizontal reciprocating load shows the characteristics of bending and shear failure.

1. Introduction

With the rapid development of economy and urbanization in various countries, the increase in energy demand and the burning zone of fossil fuels have led to energy crises and environmental problems [1,2]. The development of renewable energy is beneficial to the environment and economy [3]. Wind energy technology is mature and low in cost, and it is an effective energy solution. Compared with onshore wind power, offshore wind power has the characteristics of high energy density, low turbulence, low wind shear, and low noise [4], and it is expected to become one of the main energy sources in the future. The offshore wind turbine is a high-rise structure, and the main transmission to the top of the foundation is the large bending moment and horizontal load. The fixed foundation types currently used in offshore wind power mainly include gravity-type foundation structure, pile foundation structure, jacket foundation structure, and bucket foundation [5]. Gravity-type foundation applies to sea areas below 10 m, suitable for hard clay, sand, and rock ground. The single-pile structure is suitable for the sea area with water depth below 30 m. With the increase of water depth and larger capacity of single machine assembly, the diameter, wall thickness, and length of the single pile foundation have sharply increased, and the construction cost has increased sharply. The jacket foundation is suitable for transitional water depths of 30–60 m [5]. It requires offshore piling, hoisting the transition section and the upper wind turbine, which requires longer time for offshore operations and higher construction costs. The bucket foundation is a new type of foundation with an opening at the bottom and a seal at the top [6], which is increasingly used in offshore wind turbine foundations [7,8,9]. The bucket foundation which can be installed quickly has the advantages of low cost, easy recycling, and environmental friendliness. The first bucket foundation for offshore wind power was installed in the Frederikshavn wind farm in Denmark in 2003 [10]. In 2010, China’s first 2.5 MW CBF was installed in Qidong, in the southeast of Jiangsu province [11,12], which was proposed by Tianjin University based on China’s hydrological and geological conditions [13]. In 2017, two 3 MW CBFs were installed in Xiangshui, realizing the one-step installation of offshore wind turbines [14], as shown in Figure 1. In 2018, 11 sets of 3.3 MW and 2 sets of 6.45 MW CBFS were installed in the Dafeng Wind Farm in Jiangsu Province, marking the initial realization of large-scale application [15,16], as shown in Figure 2. Studies found that the CBFS can be towed by itself, planting wind turbines like trees, which is a low-cost and environmentally friendly foundation [17,18,19].
The marine environment and load conditions are complex. The horizontal, vertical, and bending moment loads [20,21] caused by wind, waves, and currents are coupled together to act on the foundation of the wind turbine, and the load is transferred to foundation through the transition section. From the top to the bottom of the transition section, the increased bending moment load requires a larger section, and the wind, wave, and current load increases sharply with the increase of the section of the transition section. Ding [22] proposed a prestressed concrete hyperbolic arc transition section structure after comprehensively considering the force characteristics and wind, wave, and current load at the top of the transition section. Aiming at the bearing and force characteristics of CBF, Liu [23] used Abaqus to give the yield envelope shape and failure mode of the bucket foundation in the V-H, V-M, H-M, and V-H-M spaces. Furthermore, Liu [24] gave the envelope surface of the CBF with transition section under the control condition of foundation deformation. The envelope surface only reflects the overall load-bearing characteristics of CBF but fails to reflect the force transmission characteristics of CBF. Zhang [25,26] used topological optimization and mathematical programming methods to optimize two transition sections and obtained the straight-line and arc-shaped thin-walled transition section structures. Studies found that the force transmission path of the thin-walled transition section structure is more reasonable; the arced structure has a better load-bearing performance; the stress can spread along the height and the circumferential direction, and the distribution is more uniform. Ding [27] used prestressed concrete beams and other structural stress systems for reference and designed the most economical and optimal structural system with the goal of simultaneous tensile and compression failure under the ultimate load of the arc-shaped transition section structure and used numerical simulation to study the force transmission characteristics of the arced transition section.
However, the structural force system of the hyperbolic arc transition section with large curvature is more complicated, which is quite different from conventional prestressed beams and other structures. It is necessary to conduct in-depth research on its actual failure modes. A scaled model test was carried out to study the force characteristics, force transmission characteristics, and initial tension control force of the arced transition section of the CBF on the force transmission characteristics of the transition section.

2. Test Program

2.1. Specimens

Considering the test site conditions and model types, the geometric ratio of the scale transition section model is selected as 1:20. The similarity ratio of material strength and elastic modulus is 1:1, and the similarity ratio of cross-section reinforcement ratio is 1:1. The stress similarity criterion is selected to ensure that the stress of the model is consistent with the stress of the prototype, which can truly reflect the stress state of the entire structure, and the section reinforcement ratio is consistent, reflecting the stress level of the steel bars and concrete in the specimen. The size of the model is shown in Figure 3. The specimens are equipped with vertical arc-shaped stressed steel bars, longitudinal bars, ring bars, and tie bars, which are divided into two groups: ordinary and prestressed reinforced concrete. The prestressed concrete specimens are equipped with 6 prestressed steel strands, which are constructed by the post-tensioning method, and the tension control forces are 180 kN and 300 kN, respectively. The longitudinal bars of the specimens are HRB400, and the ring bars and tie bars are HPB335. The number of the specimens are shown in Table 1, and the reinforcement of the arced transition section is shown in Figure 4.

2.2. Model Making and Maintenance

For model fabrication, the upper arced concrete transition section shall be poured first, and the secondary pouring shall be carried out with the bottom plate and base after the curing reaches the strength. After the specimen reaches the curing age, it shall be symmetrically tensioned at the top of the transition section. The prestressed reinforcement is designed as unbonded prestressed reinforcement, and the duct is arc shaped. Refer to code for design of concrete structures (GB 50010-2010) [28]. The prestress of the specimen is over tensioned by 10%.

2.3. Mechanical Properties of Materials

During the pouring process of arced transition section and concrete base, three standard cube test blocks are reserved, respectively, and the compressive strength is shown in Table 2. Before blanking, the mechanical properties of reinforcement steel be measured by standard tensile test, as shown in Table 3. The data in Table 2 and Table 3 are the average values of the test results of three specimens, respectively, and the compressive strength has been multiplied by the reduction factor of 0.95 [29].

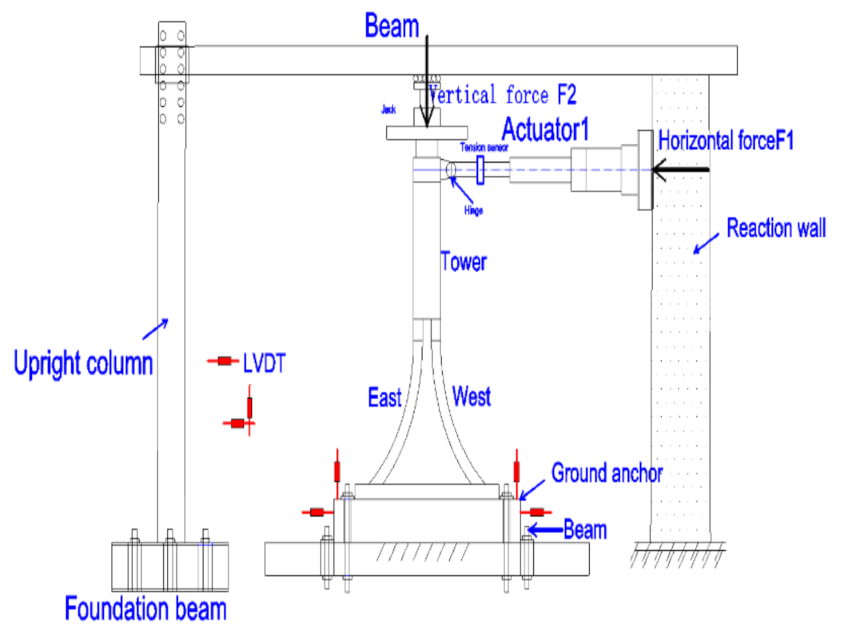
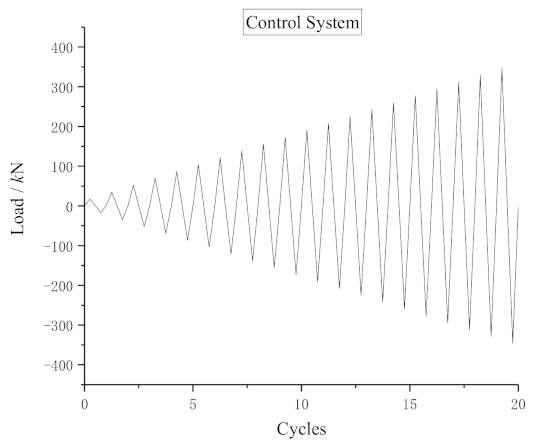
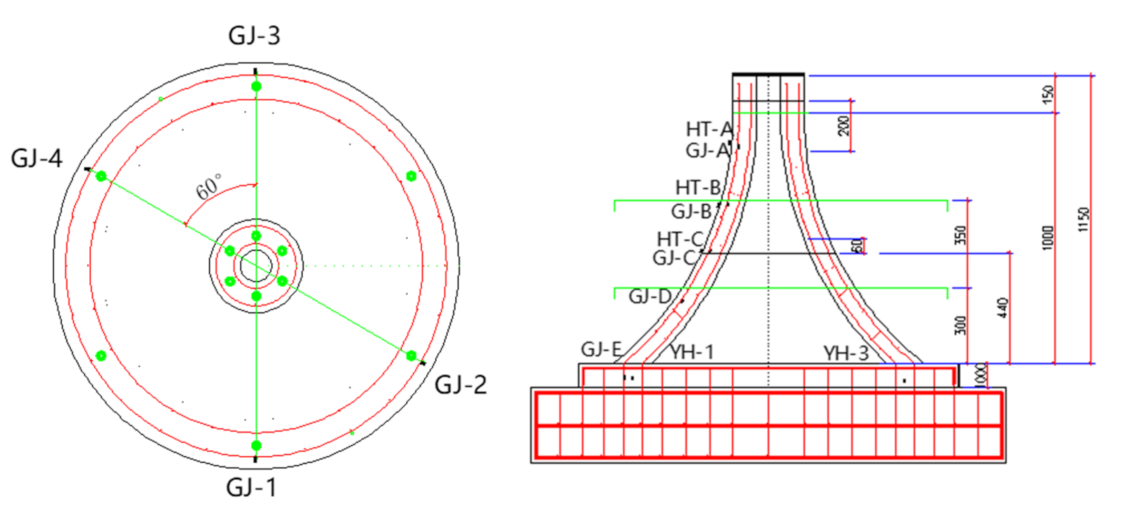
2.4. Test Setup and Measurements

The transition section model is fixed on a concrete base by two steel beam ground anchors, and a horizontal reciprocating load is provided by a loading system consisting of a 150-ton horizontal bidirectional tension and compression jack. The horizontal loading point is located at the top of the transition section, and two semi-circular hoops are connected by four steel screws to connect with the horizontal jack. A vertical jack is arranged on the top of the model and connected with a pressure sensor, as shown in Figure 5. The vertical load on the top surface of the foundation is 18 kN. The test loading system adopts load control, and the load level difference is 17.3 kN. The loading system is shown in Figure 6. At the beginning of the loading, the vertical load is applied to the required value of the test and kept stable, and the horizontal force is applied step by step until the specimen is broken. Observe the damage morphology of the specimen during the loading process and stop loading when there is obvious damage. The experiment measures horizontal load, displacement, and steel and concrete strain, and the layout of steel and concrete measuring points is shown in Figure 7.

3. Test Results

Compare the failure characteristics, energy dissipation characteristics, the stress change law of concrete and steel bars between the arced transition section structure with different tension control forces, the ordinary concrete transition section structure under the same curvature, and the number of prestressed tendons and analyze the influence of prestress on the force transmission and performance of the transition section structure.

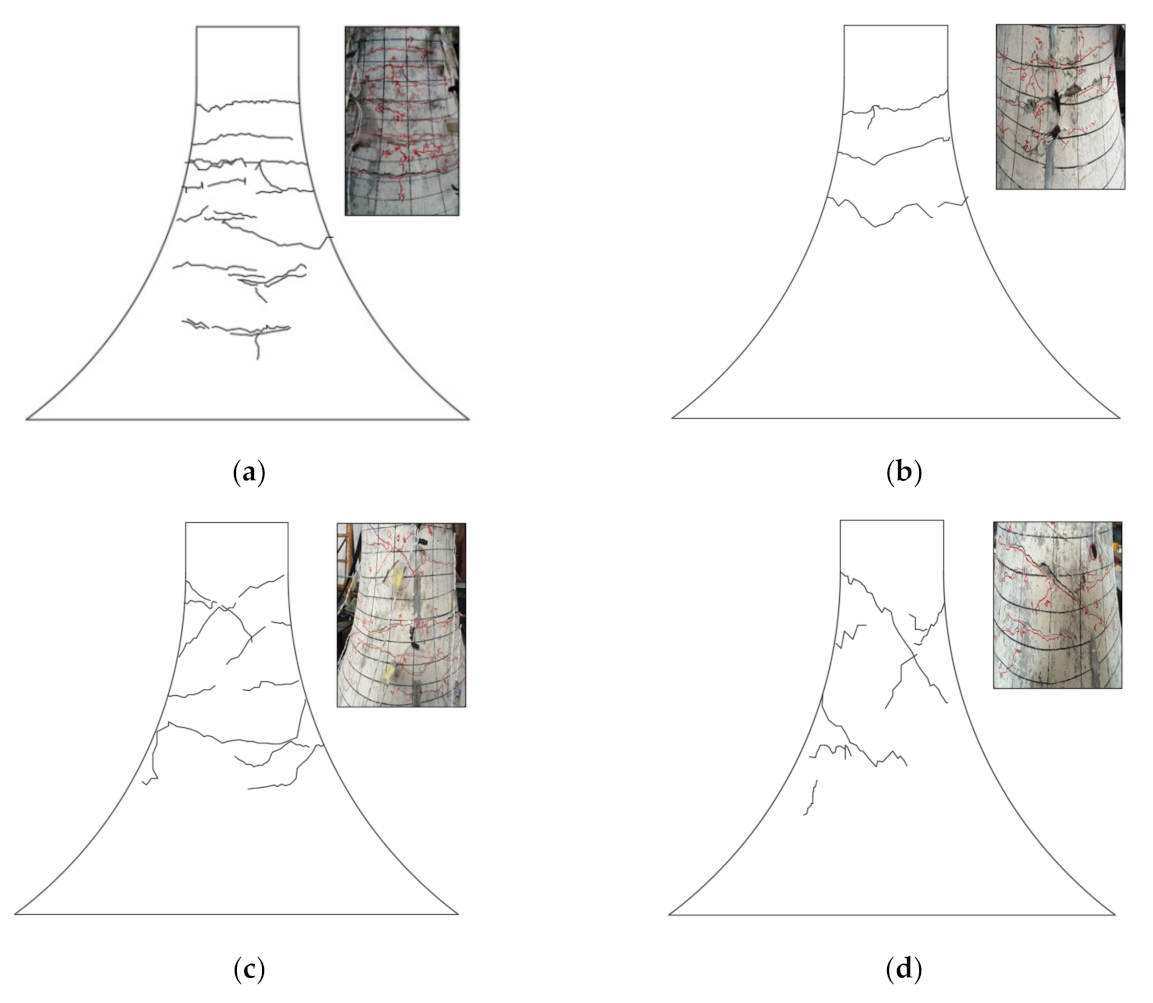
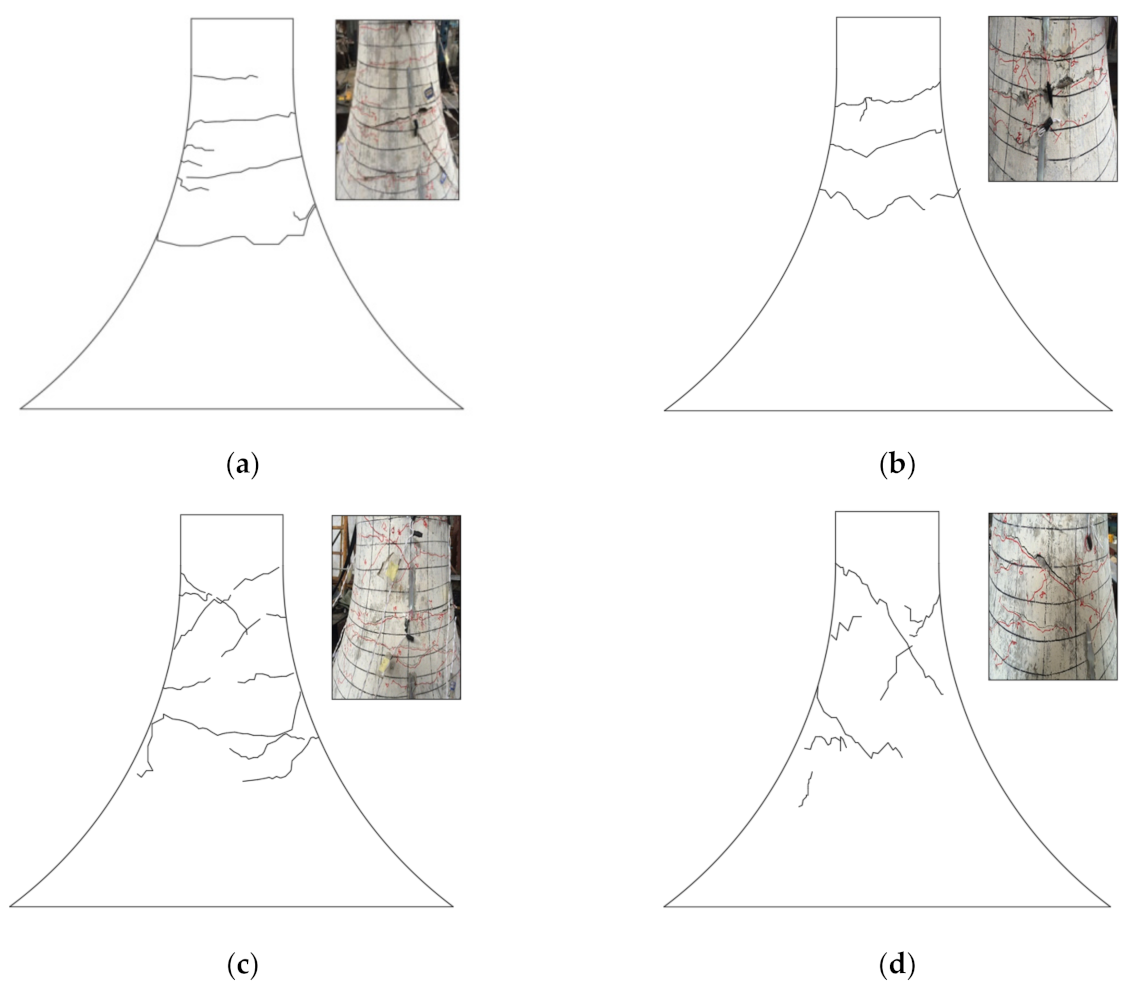
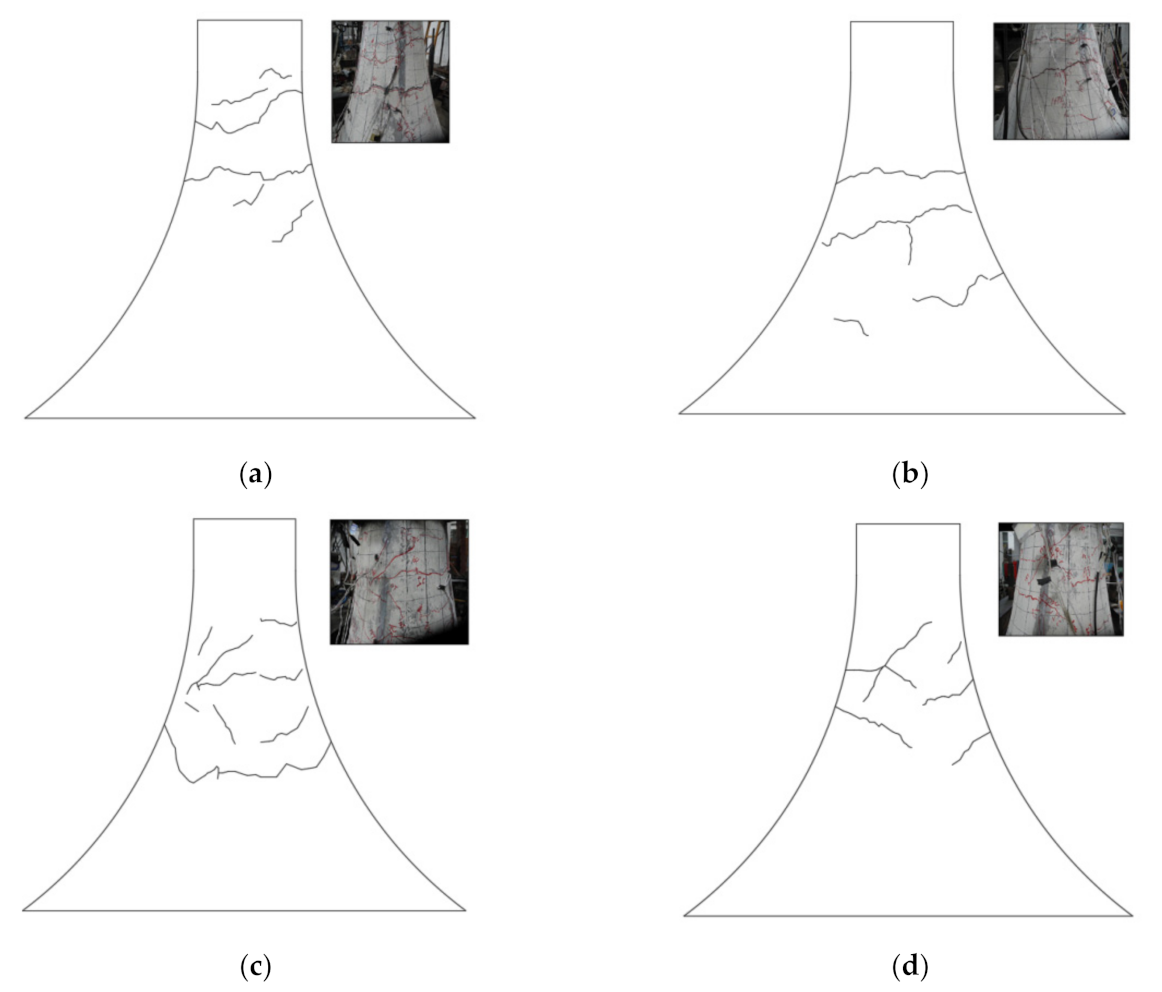
3.1. Failure Process and Characteristics

3.1.1. GD1 Specimen

The failure morphology and structural crack distribution of the GD1 specimen during the loading stage are shown in Figure 8a–d. Loaded to level 4, transverse fine cracks appeared near the positive tension side measuring points A and B. At this time, the structural cracking load was 62.98 kN; the top displacement of the member was 3.3 mm, and no concrete cracks were seen on the left and right sides of the structure. As the loading continues, the cracks gradually develop downward along the height of the transition section. Loaded to level 5–6, two circular cracks appear 40 cm from the top of the transition section and extend to both sides. As the load continued to increase, multiple parallel cracks appeared in the height range of the tension side edge, and many oblique cracks appeared on the left and right sides. The crack direction was approximately 45° with the loading direction (Figure 8c,d). As the loading continues, the cracks on the tension side continue to expand and penetrate gradually and finally the circular crack through the middle of the specimen 0.55 m from the top of the transition section. When the crack width reaches 0.4 mm, the concrete protective laminate in the compression zone collapses and peels off, and the steel bars are exposed. In order to ensure the safety of the test, it was decided to stop loading. The top displacement of the transition section reaches 19.7 mm, and the load is 228.97 kN.
Judging from the destruction process of the GD1 specimen, there are many cracks in the height range of the forward loading side of the transition section structure. The largest crack is located at a height of 60 cm from the top of the transition section. The longitudinally stressed steel bars have not yielded significantly, and the structural failure is controlled by concrete cracking. The main crack of the reinforced concrete transition section structure is located 0.7 m from the bottom, and the concrete is the weakest link in the force. During the test, large through cracks and local fall-off occurred, and the steel bars did not yield.

3.1.2. GD2 Specimen

The failure morphology and structural crack distribution of GD2 specimens are shown in Figure 9a–d. Loaded to level 5, transverse fine cracks appeared near the top 45cm of the transition section from the positive tension side (Figure 9a), and the structural cracking load was 85.47 kN. The top displacement of the component reached 4.1 mm, and no concrete cracks were seen on the north and south sides of the structure. As the loading progressed, the cracks extended to both sides. To the 8th level, cracks appeared at a position 30 cm from the top, and diagonal cracks appeared on both the north and south sides of the transition section. The initial crack width further increased as the load increased; no new cracks appeared in the height range of the positive and negative tension sides, and the cracks entered a period of stable development. Then, the cracks on the tension side expanded and went through gradually, and finally the circumferential cracks went through at the midpoint of 0.65 m from the top of the transition section, and the width reached 0.43 mm. The concrete protective layer in the compression zone peeled off, and the steel bars were exposed. Obvious oblique cracks appeared on the back of the specimen and gradually extended downward, and the load was stopped. The top displacement of the transition section reached 17.2 mm, and the load value was 247.36 kN.
From the analysis of the failure process of the GD2 specimen, the structural cracks are obviously reduced after the prestress is applied. There are three ring cracks in the positive direction of the transition section structure, and the main crack is located between the B and C measuring points. Due to the effect of prestress, the cracks will be closed after the load is stopped, the ring bars are exposed, and the longitudinally stressed steel bars have not yielded. The structural failure is based on the limit of the concrete crack width. The location of the main crack of the prestressed reinforced concrete transition section structure is 0.65 m from the top, and its cracking load and displacement are greater than that of the GD1 specimen.

3.1.3. GD3 Specimen

Figure 10 shows the phenomenon of GD3 specimen from loading to failure. When loaded to level 6, two cracks appear at 30 cm and 50 cm on the positive tension side of the transition section. The structural cracking load is 108.82 kN, and the cracking displacement is about 5.4 mm. As the load increases, the cracks gradually develop in the ring direction along the middle of the transition section structure, and no new cracks occur. No concrete cracks were seen on the north and south sides of the structure, and the initial cracks extended to both sides with loading. Loaded to the 7th level, new cracks appeared at a position 60 cm from the top, and the cracks trended in a hoop direction. The load continued to increase to level 11; micro cracks appeared at the bottom of the front of the specimen, and the circumferential cracks in the middle continued to expand. When the load reached 246.98 kN, cracks appeared in the middle of the transition section, the circumferential cracks penetrated, the width of the main cracks reached 0.5 mm, and the upper cracks extended obliquely to the side, so the structure was considered to have been destroyed. The concrete on both sides did not crush or fall off, and the steel bars did not yield. When the top displacement of the transition section reached 15.9 mm, the width of the crack in the middle of the transition section had reached 0.43 mm, and the loading is stopped.
The cracking loads, cracking displacements, failure loads and displacements of the three specimens are shown in Table 4. From the overall failure process of the structure, the GD3 and GD2 specimens are similar. The width of the cracks in the middle of the transition section is larger and the number of cracks is smaller. As the cross-section increases, the number of cracks decreases. The distribution range of cracks in the whole structure is obviously smaller than that of the GD1 specimen. A large through crack appeared in the structural concrete of the transition section, the steel bar did not yield, and the concrete on the compression side did not appear to be crushed.
In the initial cracking stage, horizontal bending cracks appeared in the tensile zone of the transition section specimens as the load continued to increase. When the failure load approached, there were oblique cracks on both sides of the arced transition section, and the angle between the oblique crack and the horizontal was 45 degrees, showing the characteristics of bending and shear failure. The cracking load of the reinforced concrete specimens without prestressing tendons was relatively small; the circumferential cracks were densely distributed in the height range, and the number is large, and the width was small. After the prestress was applied, the cracks were obviously controlled; the cracks penetrated rapidly after cracking, and the structural cracking load was about 35% higher than that of reinforced concrete members. The horizontal cracks gradually extended to the sides and developed into oblique cracks. After the specimen was destroyed, the concrete did not collapse and fall off; the number of cracks was relatively small, and the width was relatively large. The longitudinal reinforcement and ring reinforcement on the tensioned side were exposed. The distribution of the main cracks was relatively lower, and there were fine cracks below the height of the transition section 50 cm, indicating that the prestress plays an important role in improving the force transmission performance of the arced transition section.

3.2. Seismic Performance Analysis

The performance of the specimen under low cycle repeated load is mainly described by its ductility. Ductility is an important indicator of the seismic performance of a structure. A structure with higher ductility can obtain higher plastic deformation capacity under earthquake action, which is more conducive to the redistribution of plastic internal force inside the structure, so that the structure can dissipate more energy. The hysteresis curve is the relationship curve between the load and the deformation of the specimen under the action of the reciprocating load, and it is the key content of the seismic performance analysis of the structure. The hysteresis curve reflects mechanical properties such as stiffness degradation performance, energy dissipation capacity, bearing capacity, and ductility of the structure in the process of reciprocating force. In this section, the seismic performance of the structure is analyzed by studying the hysteresis curve, skeleton curve, stiffness degradation, cumulative energy dissipation, and other indicators of the three specimens.

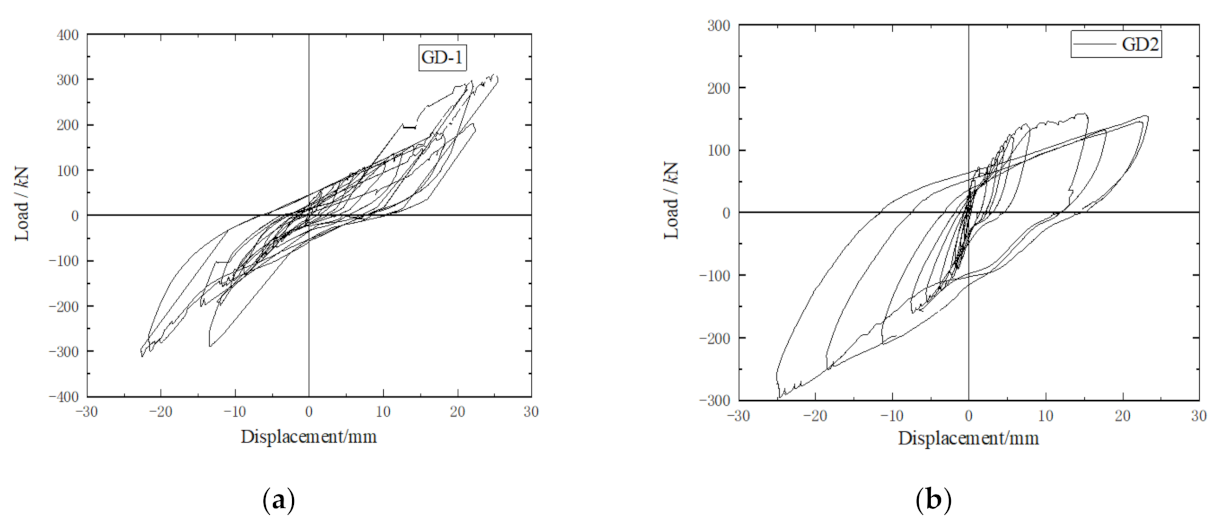
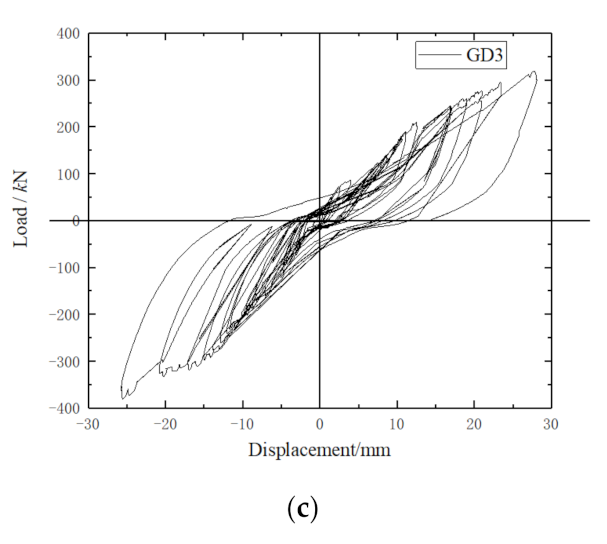
3.2.1. Load-Displacement Hysteresis Curve

The load-displacement hysteretic curves of GD1~GD3 specimens are shown in Figure 11. The hysteresis curve of the GD1 specimen is a typical inverted S shape, the area enclosed by the loading ring is small, and the energy dissipation capacity and seismic performance of the specimen are poor. During the loading process, diagonal cracks appeared in the transition section area, shear deformation occurred, and the slope of the hysteretic curve became slower. After the 10th load specimen slipped, the load rose again. The GD2 specimen showed a fusiform shape in the early stage of loading, with a full hysteresis curve, a larger enclosing area, and good energy consumption. During the loading process, it gradually transformed into a bow shape. The reason was that the steel bars in the specimen slipped as the cracks developed. The obvious asymmetry of the hysteresis curve of the specimen is caused by the cracking of the concrete during the forward loading process and the gradual inconsistency of the sections on both sides of the specimen that participate in resisting the external load. The GD3 specimen is in a typical inverted S shape during the loading process. The hysteresis loop in the load-displacement curve has good symmetry; the area enclosed by the loading loop is large, and the energy dissipation capacity of the specimen is acceptable.

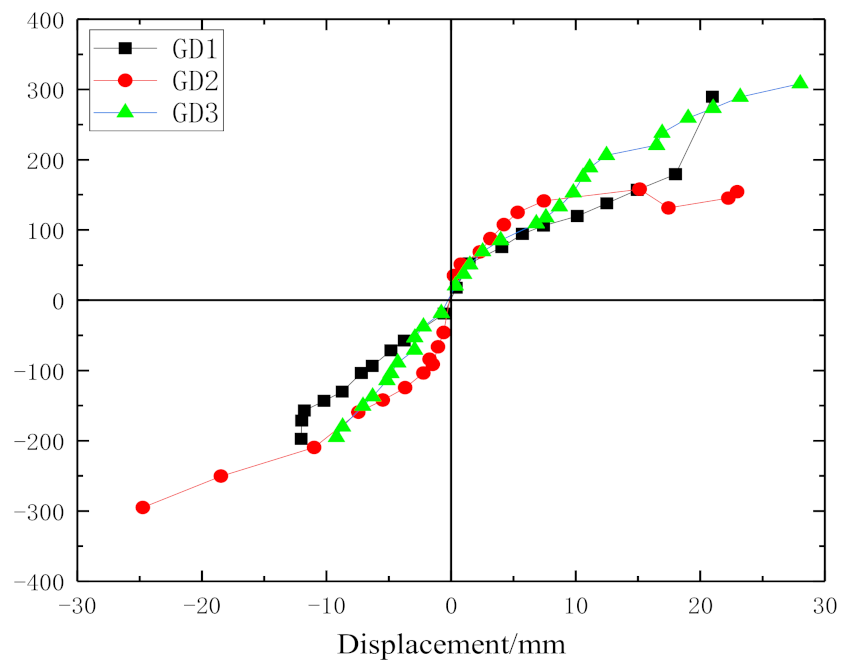
3.2.2. Skeleton Curve

The skeleton curve of the specimen is shown in Figure 12. The GD1 and GD3 specimens have only elastic sections and no obvious yield sections. The main reason the GD1 specimen has only straight sections is the excessive reinforcement of ordinary steel bars in the transition section. The forward curve of the GD2 specimen has four stages: elasticity, yield, limit, and descent. Under the standard load combination, the slope of the load-displacement curve of the GD2 specimen is the largest, and the performance of the material is fully utilized. The skeleton curve of the GD3 specimen shows obvious linear elasticity. The main reason the skeleton curve of the GD3 specimen is basically straight is that the value of the prestressed steel bar of the GD3 specimen is increased, and the yield strength of the steel bar increases. The specimen does not fully enter the yield stage because the concrete cracks and fails, and the steel strand breaks and loses its bearing capacity. The reason why the curve of GD2 specimen is different from other curves is that in the prestressed system of GD1, GD2, and GD3 specimens, there is no concrete grouting. Therefore, the displacement limit is used as the control condition to prevent the sudden damage during the loading process of the specimen from causing safety problems, so the specimens are not subjected to destructive tests.

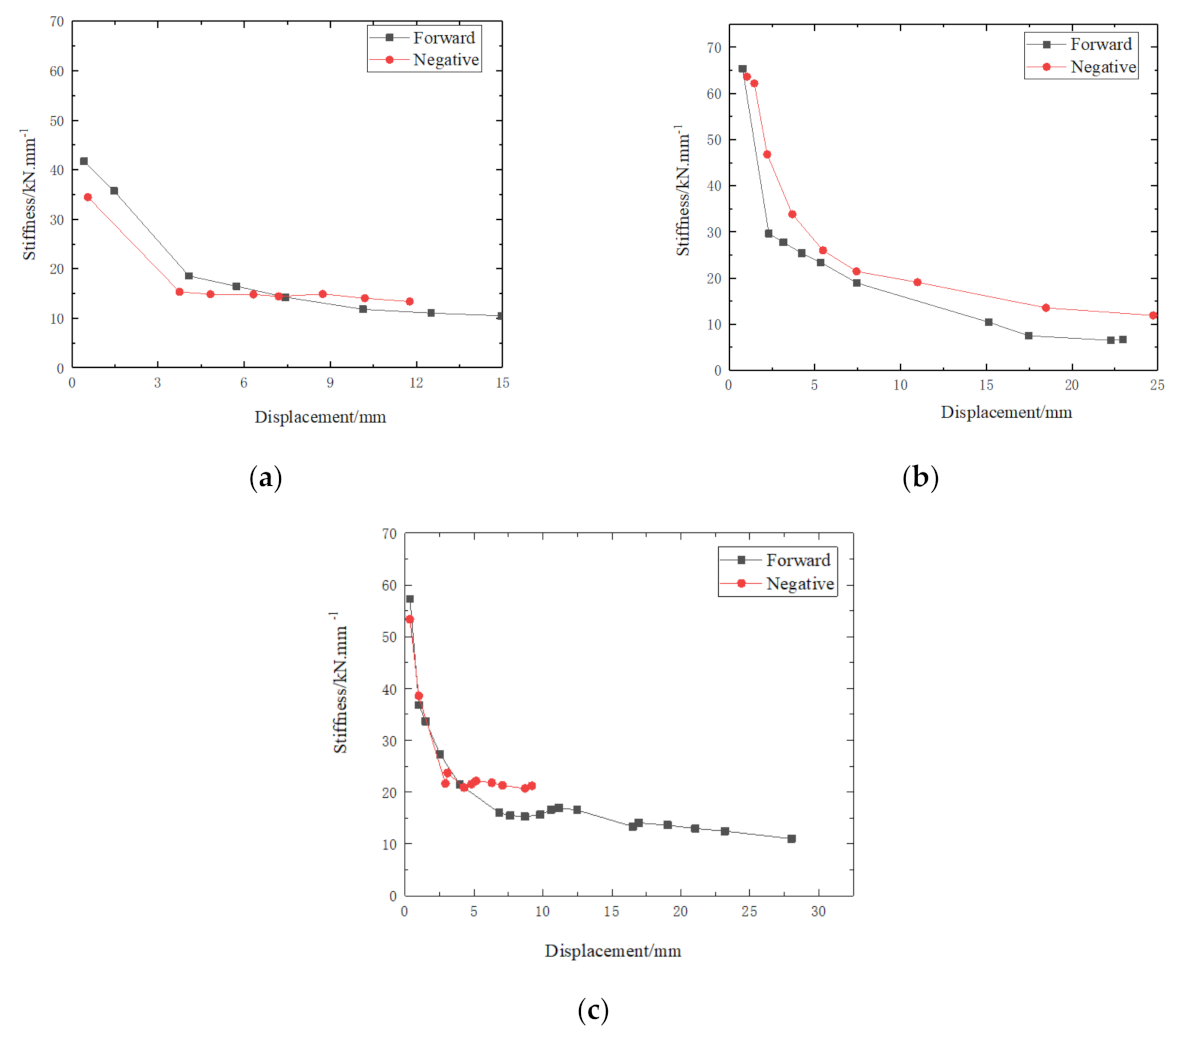
3.2.3. Stiffness Degradation

The stiffness of the structure reflects its ability to resist deformation. The stiffness degradation of the specimen is a sufficient manifestation of the development of the plastic deformation of the material. It essentially reflects the influence of the cumulative damage of the specimen under repeated loads and is an important feature of the hysteretic performance of the structure [30].
It can be seen from Figure 13 that the negative stiffness degradation rate of the GD1 specimen is close to the positive direction at the beginning of loading, mainly because the reinforcement ratio of the tension steel bar at the top of the transition section under negative loading is the same as that at the bottom under positive loading. With the increase of displacement, the degradation rate of positive stiffness is greater than the negative stiffness. After the displacement exceeds 7.5 mm, the negative stiffness becomes greater than the positive stiffness. The reason is that the concrete cracks in the later loading direction, and only the steel bars bear the external load. During the loading process, the negative stiffness value of the GD2 specimen is greater than the positive one. In the initial loading stage, the positive stiffness degenerates faster, and the negative stiffness degenerates slower. The main reason is the effect of the springback of the prestress of the steel strand under negative loading. The cracks in the transition section of the middle and late loading gradually expand to the bottom end, and the stiffness degradation in the positive and negative directions is slower. The degeneration speed of the positive and negative initial stiffness of the GD3 specimen is close, and the positive stiffness of the specimen is always at a lower level after cracking.

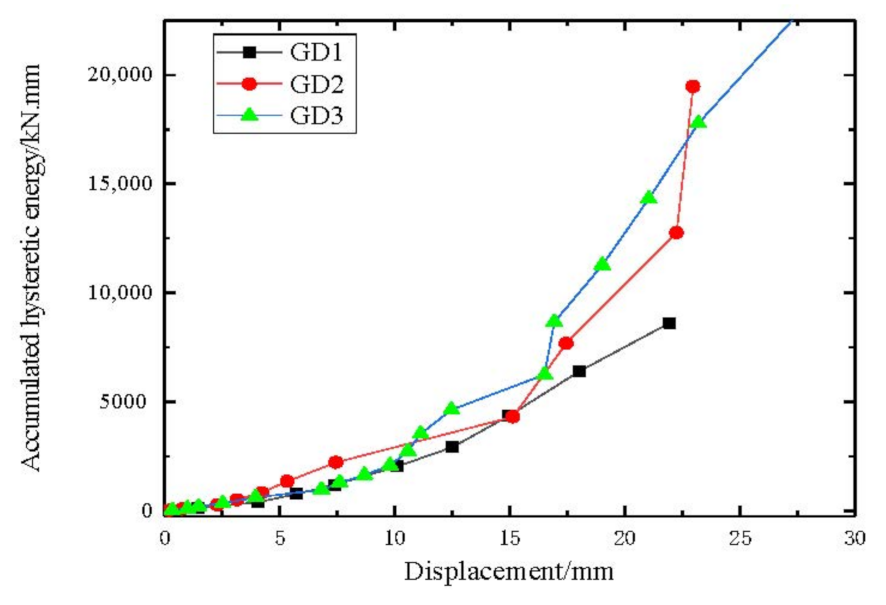
3.2.4. Energy Consumption Capacity

The seismic action process is the process of energy absorption and dissipation. The seismic performance of the structure mainly depends on the energy dissipation capacity of the components after the earthquake comes into the elastic-plastic deformation stage. In the hysteresis curve, the area enclosed by the loading curve and the coordinate axis represents the amount of energy absorbed by the component, and the area enclosed by the unloading curve and the coordinate axis represents the amount of energy released by the component. The area enclosed by the load-displacement hysteresis curve can reflect the magnitude of the seismic energy dissipated by the specimen, which is called hysteretic energy dissipation. The more energy is absorbed and dissipated under the reciprocating action of the ground motion, the less likely the structure is to collapse and other overall failures.
It can be seen from Figure 14 that the cumulative energy consumption of the three specimens is relatively small at the beginning of loading. As the loading displacement increases, the cumulative energy consumption value of each specimen increases. The cumulative energy consumption value of the prestressed GD2 and GD3 specimens is significantly greater than that of the GD1 specimen, and the prestressing is helpful to increase the seismic performance of the arced transition section. When the displacement reaches 23 mm, the energy consumption capacity of GD2 specimen exceeds that of GD3 specimen, and the energy consumption capacity of GD2 specimen is the best. The cumulative energy dissipation curve of the GD3 specimen has a slight abrupt change in the growth rate at a displacement of about 17 mm. The main reason is that the area enclosed by the hysteresis curve of the specimen is small before yielding, and as the displacement of the top of the transition section increases, the area enclosed by the hysteresis loop of the specimen also increases gradually. After reaching the peak load, the area enclosed by the hysteresis loop gradually decreases as cracks appear in the middle of the transition structure and gradually extend to the back.

3.3. Force Analysis of Steel Bar and Concrete

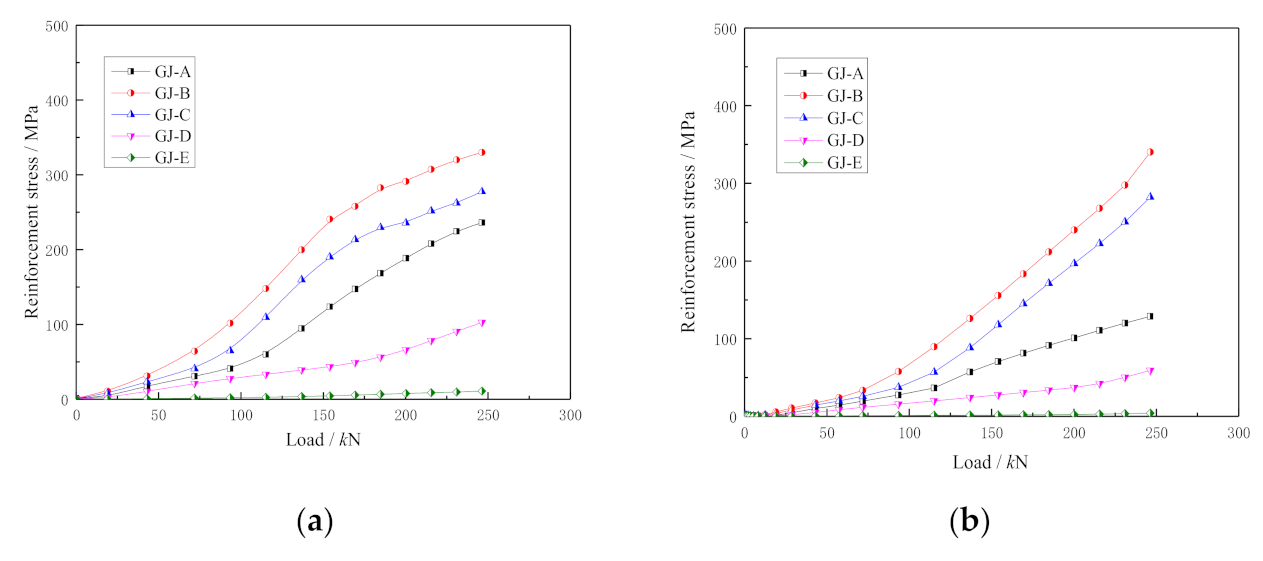
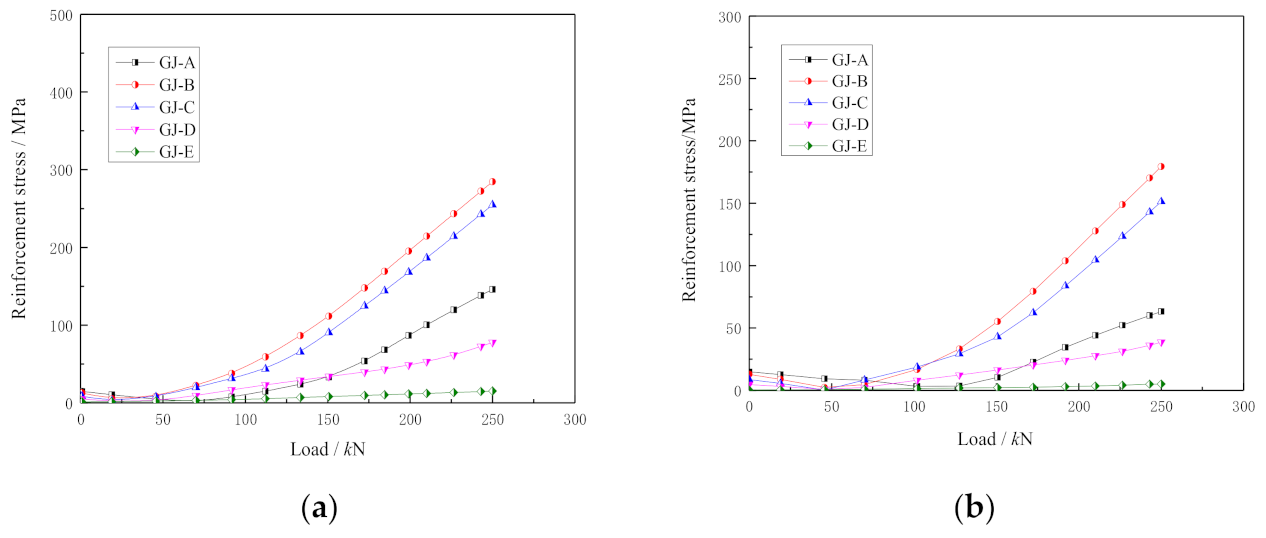
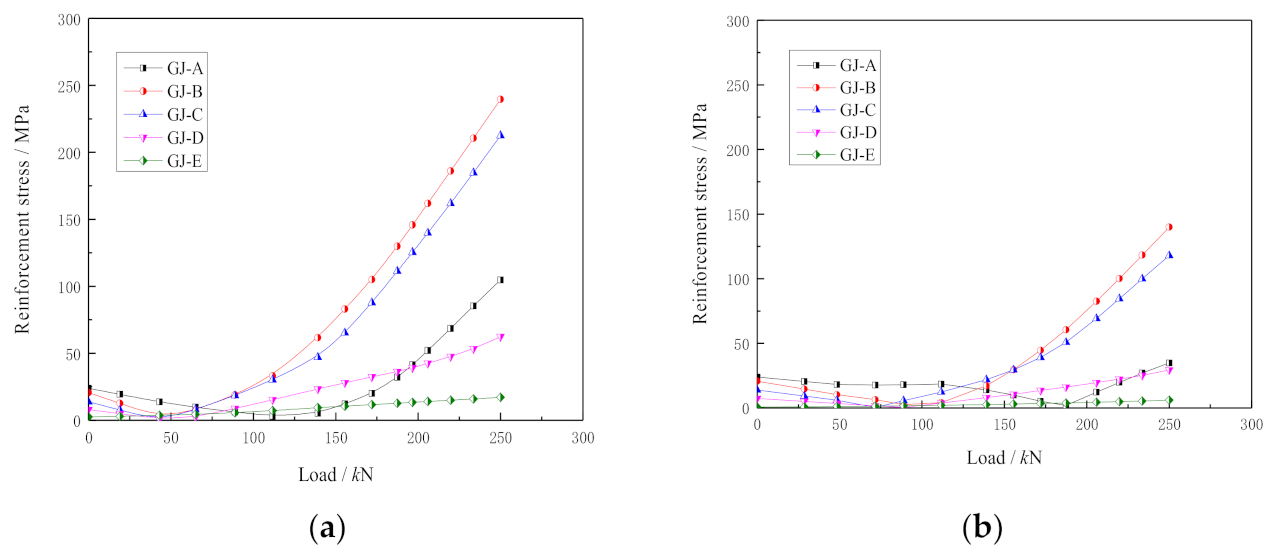
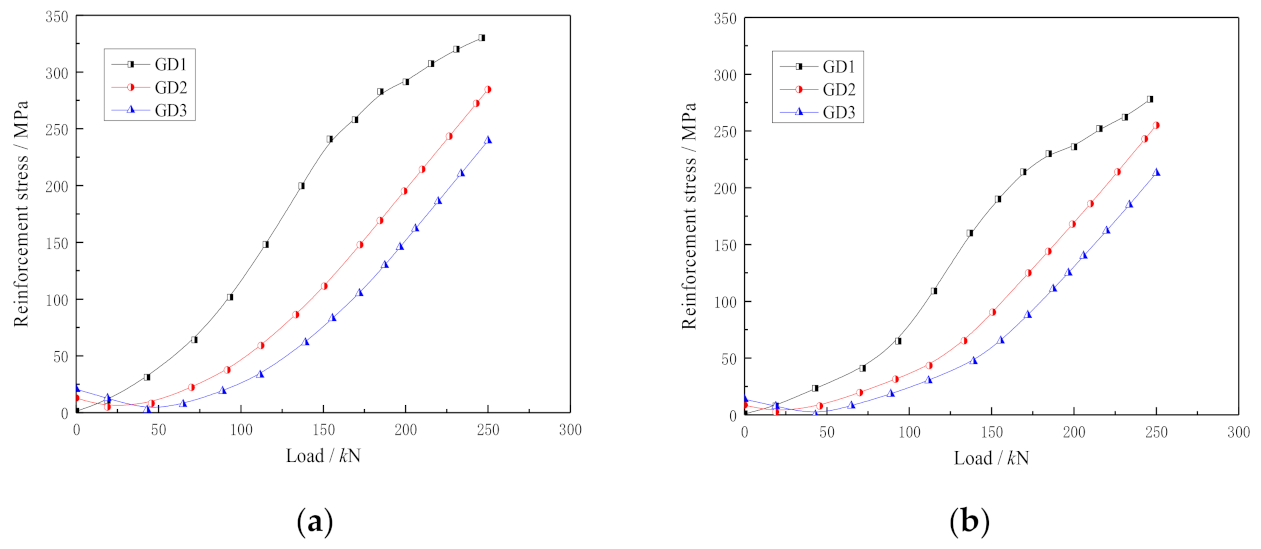
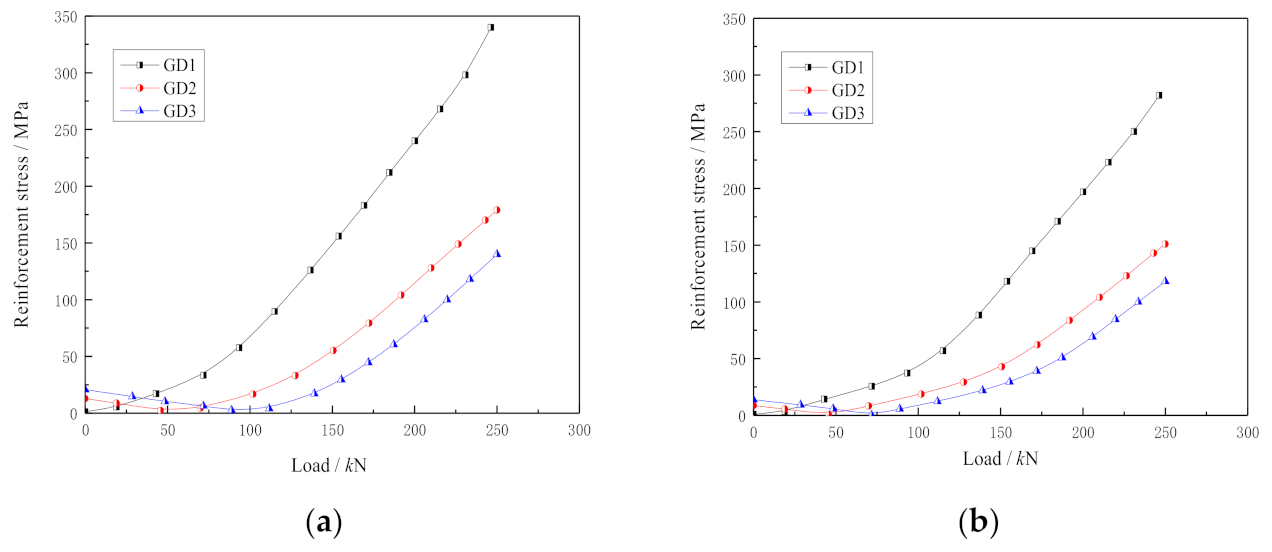
3.3.1. Stress Analysis of Reinforcement

The stress curve of the steel bar of the GD1 specimen is shown in Figure 15. Since the positions of the loading and measuring points are symmetrical, the stress changes of the steel bars at the symmetrical positions are similar. Take the stress data of each measuring point of No. 1 and No. 2 steel bars under unidirectional loading for analysis. The distribution positions of reinforcement measuring points A~E are shown in Figure 7. The stress of each measuring point within the range of the height of the longitudinal bars at the initial stage of loading increases slowly. After the concrete on the tensioned side cracked, the concrete was withdrawn from work, and the load was carried by the steel bars. The curve increased significantly, and the stress values of the steel bars at the measuring points B and C were both larger. It can be clearly seen from Figure 15b that the transition section structure transmits a relatively large force in the range of 60 along the ring direction. The distribution law in the section height range is similar to that of No. 1 steel bar, and the stress value of the steel bar at the measurement point E at the bottom of the transition section is very small. Figure 16 and Figure 17 are the curves of the stress of the steel bars of the GD2 and GD3 specimens as a function of the load, respectively. After the prestress is applied, the stress of each cross-section steel bar changes linearly with the increase of the load; the stress of each measuring point is obviously reduced, and the stress value of the measuring point B and C is the largest. When the load is less than 150 kN, the stress of the steel bar at the measurement point D of the GD2 specimen is greater than the A measurement point. Before the load reaches 200 kN, the stress at the measurement point D of the GD3 specimen is greater than that of the measurement point A, and the stress at the bottom of the measurement point E also increases significantly. It can be seen from Figure 16b and Figure 17b that the stress of the GD3 specimen is smaller than that of the GD2 specimen. Due to the special structure of the arc-shaped transition section, the stress in the lower half of the middle structure increases more than the upper half, and the force transmission path of the transition section is distributed roughly in a fan shape.

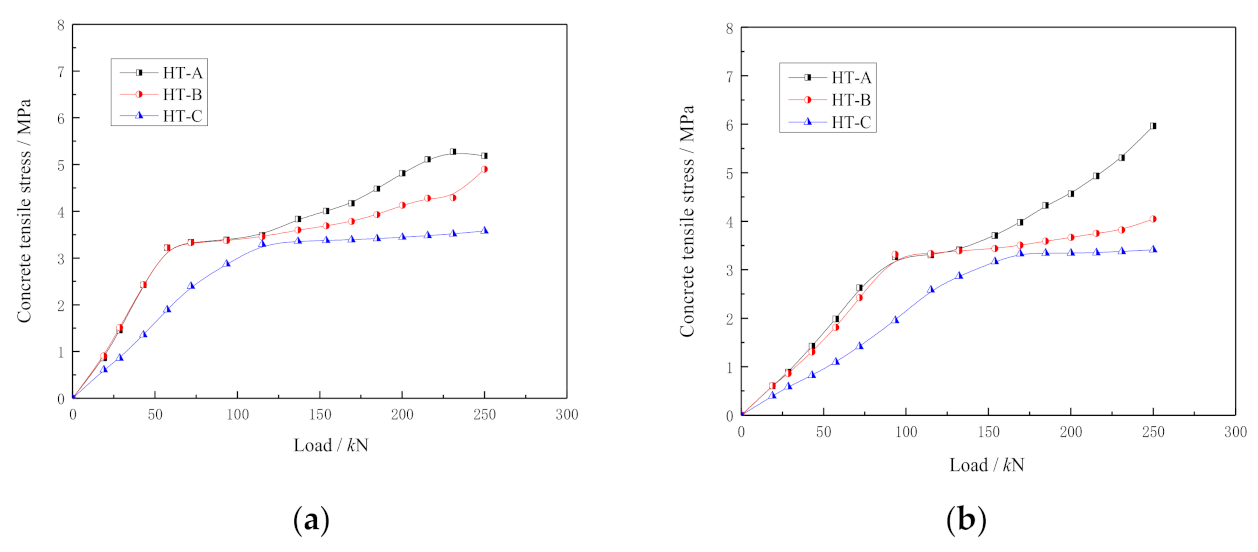
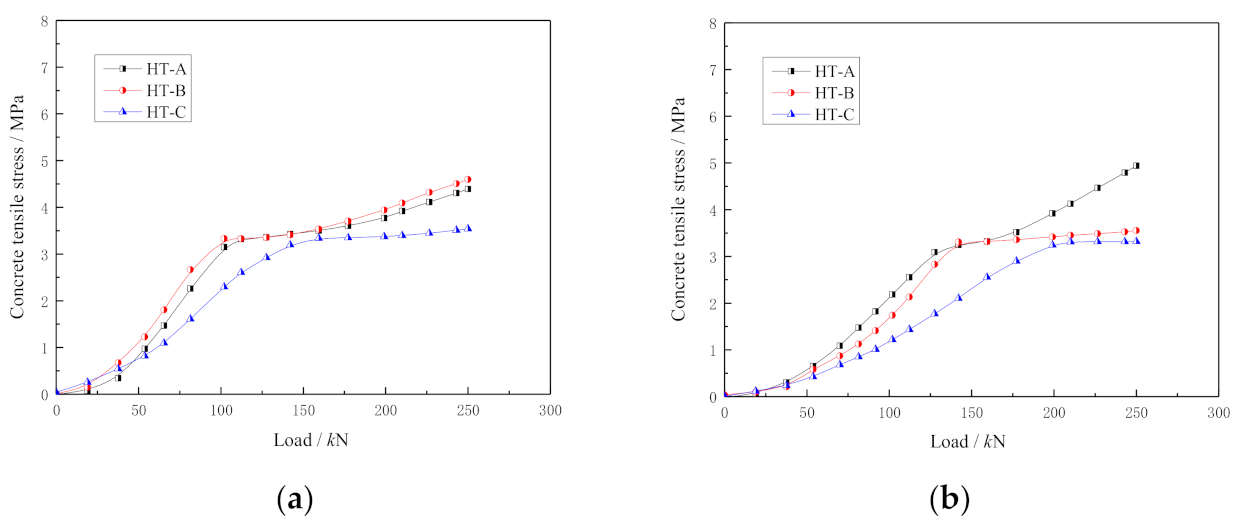
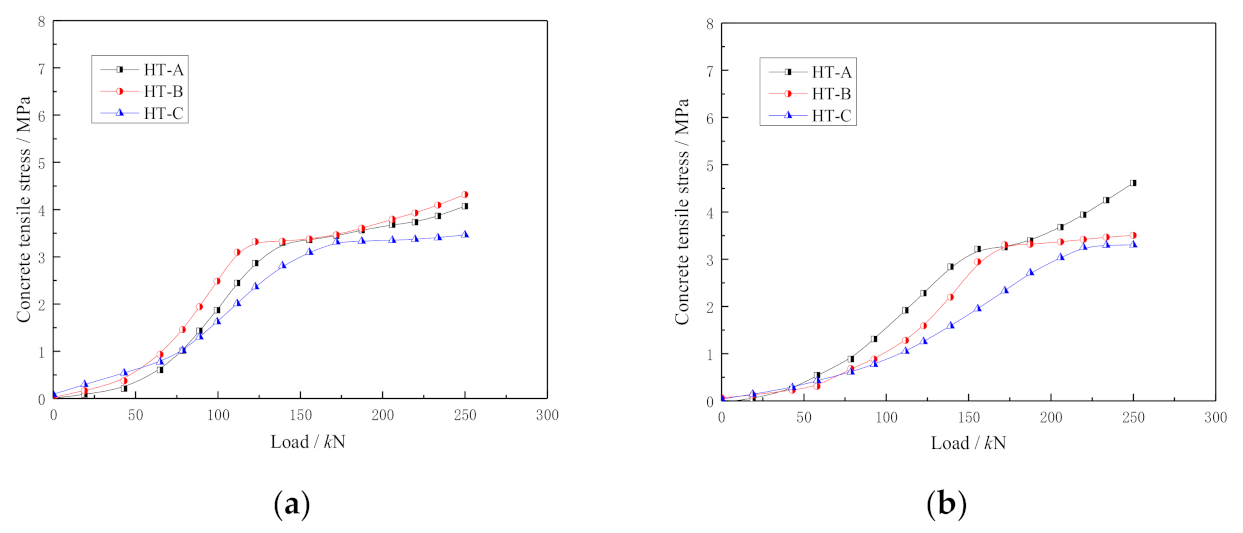
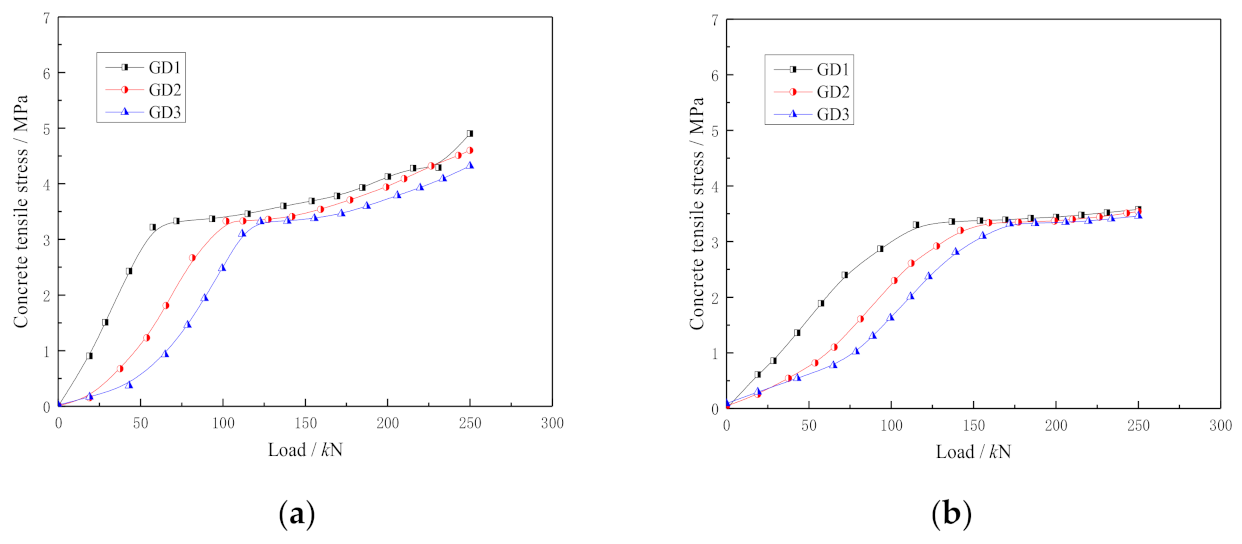
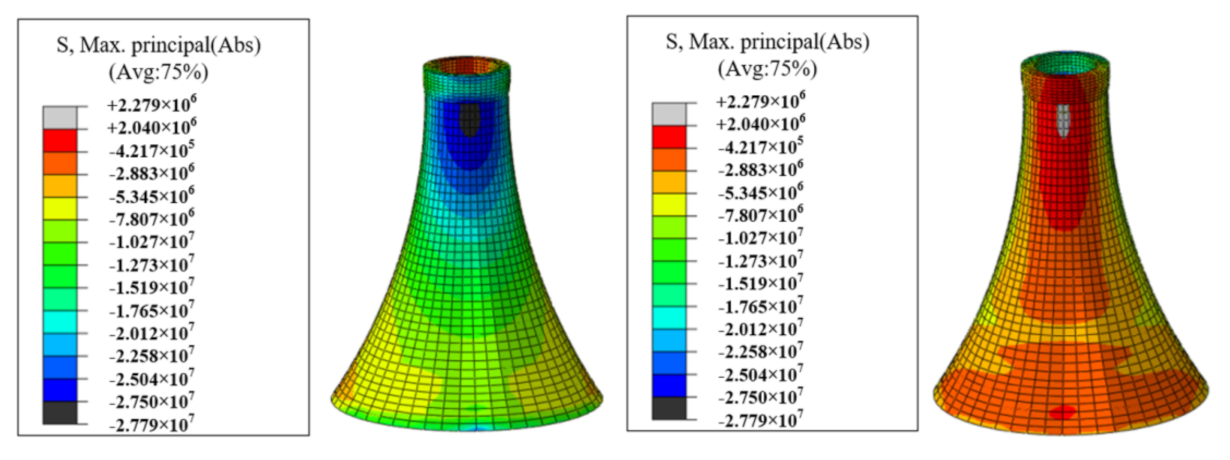
3.3.2. Stress Analysis of Concrete

Figure 18, Figure 19 and Figure 20 show the concrete stress curve of different parts of the specimen. The distribution positions of concrete measuring points A, B, and C are shown in Figure 7. At the initial stage of loading of the GD1 specimen, since no prestress was applied, the stress of each measuring point of the No. 1 concrete on the tension side increased rapidly, and the relationship between stress and load before cracking was basically linear. After the structure cracked, the stress quickly concentrated on the cracks, the force position shifts, and the curve turns. The crack did not directly pass through the strain gauges at the measuring points A, B, and C, so the stress value of each measuring point only increased slightly, and the change rule of the No. 2 measuring point in the 60-degree circular direction was similar to that of No. 1. Comparing Figure 19 and Figure 20, it can be seen that under the same number of reinforcements, the magnitude of the tension control force has a greater impact on the force transmission of the arced transition section. In the early stage of loading, the stress growth of the B and C measuring points of the GD3 is greater than that of GD2, and there is little change in the later stage. The reason is that the concrete did not crack in the early stage. Under the action of the prestressed tendons, the load is gradually transferred downwards along the curved surface, and the stress value at the lower measuring point of the GD3 specimen increases rapidly.

3.4. Comparative Analysis of Experimental Results

It can be seen from Figure 21 and Figure 22 that the stress at the measuring points of ordinary steel bars B and C is very small at the initial stage of loading. As the load increases, the stress at the measurement point of the steel bar B gradually increases. Under the first-level load, the steel bar stress of the unprestressed test piece exceeds that of the prestressed test piece. Loaded to level 3, the stress of the steel bar of the GD1 specimen is obviously greater than that of the GD2 and GD3 specimens, and the obvious increase in slope indicates that the concrete surface of the GD1 specimen is cracked at this time. Loaded to level 5, the stress of the steel bars of the GD2 and GD3 specimens increased rapidly, indicating that cracks appeared on the surface of the specimens. Under the same load level, the stress of the steel bars of the GD2 and GD3 specimens is significantly smaller, indicating that the prestress has a significant effect on reducing the stress of the steel bars, and the stresses of the steel bars of the GD2 and GD3 specimens are not very different.
The stress changes of No. 1 and No. 2 concrete measuring points are similar after loading, and No. 1 concrete is used for analysis. It can be seen from Figure 23 that the concrete tensile stress of the GD1 specimen increases faster when loaded to the first level of load, and the tensile stress of the GD2 and GD3 specimens increases rapidly when the third load is applied. After the fifth load, the concrete tensile stress of the GD1 specimen enters the horizontal section. Before cracking, the concrete tensile stress and the load maintain a linear relationship. After the cracking, the stress quickly concentrates on the crack position, the force position shifts, and the curve turns. After loading to the 9th and 10th loads, the concrete tensile stress law of the GD1, GD2, and GD3 specimens is consistent.
Through experiments, it was found that the number of prestressed steel bars was not as good as possible, and the design needed to be combined with the wall thickness: (1) Consistent with the design principles of prestressed beams, the structure cannot have tensile stress. (2) To give full play to the compressive performance of concrete, under the action of large bending moment load, the tension and compression on both sides of the transition section should reach the control limit at the same time. Through this experiment, the rationality of this design method is verified, and the improved energy consumption performance of this structural system is verified. Due to the consideration of the external tension effect of the prestressed system, the hoop stirrups can no longer be designed as structural steel bars and need to be designed as main stress steel bars. The above research results have directly guided and applied to the foundation design of many offshore wind farms such as Dafeng Xiangshui, as shown in Figure 24 [31]. In the design of the CBF, according to the simultaneous failure of the tension zone and the compression zone as the optimization objective, the structure of the arc-shaped transition section is optimized and analyzed, and the optimal prestress value is determined. Combined with the design and construction requirements, the optimal prestressed system of the arc transition section is obtained. The arc transition section is set with 48 bundles of high-strength and low-relaxation prestressed steel strands, with a tension control stress of 1270 MPa, arranged in a single row, and the anchor head of the fixed end of the prestressed tendon goes deep into the inner ring beam and is closely connected with the foundation top cover, as shown in Figure 25.
The concrete material in the finite element model is C60, the plastic damage constitutive model is adopted; the Poisson’s ratio is 0.17, and the density is 2500 kg/m3. The radial and hoop bars are HRB335 bars, and Tie contact is set between the parts in the model. The concrete is simulated by C3D8R solid elements, the prestressed steel strand and the reinforcement bars are simulated by T3D2 truss elements. More details on the setup of the finite element model of CBF are in Zhao’s paper [31].

4. Conclusions

In this paper, the structural tests of reinforced concrete and prestressed concrete arced transition section under horizontal reciprocating load were carried out. The influence of prestress on the force and failure characteristics of the arced transition structure is analyzed from the failure characteristics of the specimen, the energy dissipation characteristics, the main reinforcement of the transition section, and the stress change of the concrete, and the following conclusions are drawn:
(1)
After the prestress is applied, the cracking area of the curved transition section specimen is significantly smaller than that of the ordinary reinforced concrete curved transition section structure, the cracks are obviously controlled, and the structural cracking load is increased by about 35%. After the specimen cracked, the crack throughed rapidly, and the horizontal crack gradually extended to the side to develop into an oblique crack. When the specimen was damaged, the concrete did not appear to be crushed and peeled off obviously, the number of cracks was small but the width was large, and the ring reinforcement on the tensioned side was exposed. The distribution position of the main cracks moved downwards, and there were fine cracks below the height of the transition section 50 cm, which indicates that the prestress plays an important role in improving the force transmission performance of the arced transition section.
(2)
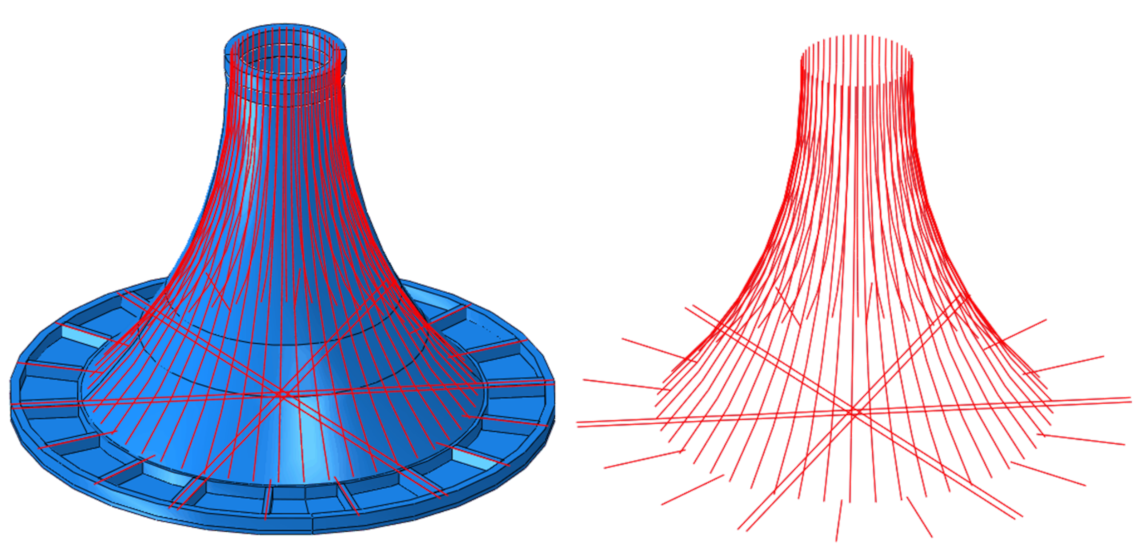
The failure mode of the special structure of the curved transition section under horizontal reciprocating load is obviously different from that of ordinary beam-column concrete members, showing the characteristics of bending and shear failure. When the structure is damaged, the cracks penetrate circumferentially, and the width reaches the limit. The position of the main crack is related to the curvature of the arced structure. By optimizing the tension control force of the arc-shaped foundation, the load can be converted into a controllable tensile and compressive stress of the structure, thereby achieving a full compression state and avoiding structural cracking.
(3)
Comparing the hysteresis curve, skeleton curve, stiffness degradation, and energy dissipation capacity of the three specimens, it can be concluded that the application of prestress helps to increase the seismic performance of the arced transition section, and the energy dissipation capacity of the GD2 specimen is better than that of the GD3 specimen. The skeleton curve of the GD2 specimen has obvious elasticity, yield, limit, and descending sections, and the material properties can be fully utilized.

Author Contributions

Conceptualization, H.D. and P.Z.; methodology, P.Z., J.X. and C.L.; validation, P.Z., C.L. and J.X.; formal analysis, Y.X. and P.Z.; writing—original draft preparation, Y.X. and P.Z.; writing—review and editing, P.Z., J.X. and C.L.; project administration, H.D. and P.Z. All authors have read and agreed to the published version of the manuscript.

Funding

This research was funded by the National Natural Science Foundation of China (Grant No. 52171274) and Tianjin Postgraduate Research and Innovation Project (Grant No.2021YJSB172).

Institutional Review Board Statement

Not applicable.

Informed Consent Statement

Not applicable.

Data Availability Statement

Not applicable.

Conflicts of Interest

The authors declare no conflict of interest.

References

  1. Ren, Y.; Vengatesan, V.; Shi, W. Dynamic Analysis of a Multi-column TLP Floating Offshore Wind Turbine with Tendon Failure Scenarios. Ocean Eng. 2022, 245, 110472. [Google Scholar] [CrossRef]
  2. Wang, X.; Zeng, X.; Li, J.; Yang, X.; Wang, H. A review on recent advancements of substructures for offshore wind turbines. Energy Convers. Manag. 2018, 158, 103–119. [Google Scholar] [CrossRef]
  3. Wang, Y.; Shi, W.; Michailides, C.; Wan, L.; Kim, H.; Li, X. WEC shape effect on the motion response and power performance of a combined wind-wave energy converter. Ocean Eng. 2022, 250, 111038. [Google Scholar] [CrossRef]
  4. Oh, K.; Nam, W.; Ryu, M.; Kim, J.-Y.; Epureanu, B.I. A review of foundations of offshore wind energy convertors: Current status and future perspectives. Renew. Sustain. Energy Rev. 2018, 88, 16–36. [Google Scholar] [CrossRef]
  5. Koteras, A.K. Jacking and Suction Installation of Bucket Foundation for Offshore Wind Turbines. Ph.D. Thesis, Aalborg University, København, Denmark, 2019. [Google Scholar]
  6. Vicent, S.; Kim, S.; Bong, T. Effect of loading rate on the pullout capacity of offshore bucket foundations in sand. Ocean Eng. 2020, 210, 107427. [Google Scholar] [CrossRef]
  7. Jeong, Y.; Kim, J.; Manandhar, S.; Ha, J.-G.; Park, H.-J.; Kim, D.-S. Centrifuge Modelling of Drained Pullout and Compression Cyclic Behaviour of Suction Bucket. Int. J. Phys. Model. Geotech. 2019, 20, 59–70. [Google Scholar] [CrossRef]
  8. Ragni, R.; Bienen, B.; Stanier, S.; O’Loughlin, C.; Cassidy, M. Observations during suction bucket installation in sand. Int. J. Phys. Model. Geotech. 2019, 20, 132–149. [Google Scholar] [CrossRef]
  9. Kim, J.; Kim, D. Soil displacement near a bucket foundation installed in sand by suction and jacking in a centrifuge. J. Geotech. Geoenviron. Eng. 2019, 145, 06019015. [Google Scholar] [CrossRef]
  10. Cho, Y.; Lee, T.; Park, J.; Kwag, D.; Chung, E.; Bang, S. Field tests on suction pile installation in sand. ASME 2002 21st International Conference on Offshore Mechanics and Arctic Engineering. Am. Soc. Mech. Eng. 2002, 36126, 765–771. [Google Scholar]
  11. Ding, H.; Lian, J.; Li, A.; Zhang, P. One-step-installation of offshore wind turbine on large-scale bucket-top-bearing bucket foundation. Trans. Tianjin Univ. 2013, 19, 188–194. [Google Scholar] [CrossRef]
  12. Zhang, P.; Hu, R.; Ding, H.; Guo, Y.; Xiong, K. Comparative analysis of seepage field characteristics in bucket foundation with and without compartments. Ocean Eng. 2017, 143, 34–49. [Google Scholar] [CrossRef]
  13. Zhang, P.; Ding, H.; Le, C. Hydrodynamic motion of a large prestressed concrete bucket foundation for offshore wind turbines. J. Renew. Sustain. Energy 2013, 5, 063126. [Google Scholar] [CrossRef]
  14. Ding, H.; Feng, Z.; Zhang, P.; Le, C.; Guo, Y. Floating Performance of a Composite Bucket Foundation with an Offshore Wind Tower during Transportation. Energies 2020, 13, 882. [Google Scholar] [CrossRef] [Green Version]
  15. Zhang, P.; Li, Y.; Lv, Y.; Ding, H.; Le, C. Bearing Capacity Characteristics of Composite Bucket Foundation Under Torque Loading. Energies 2019, 12, 2487. [Google Scholar] [CrossRef] [Green Version]
  16. Zhang, P.; Zhao, X.; Ding, H.; Le, C. The wet-towing resistance of the composite bucket foundation for offshore wind turbines. Mar. Struct. 2021, 80, 103089. [Google Scholar] [CrossRef]
  17. Jia, N.; Zhang, P.; Liu, Y.; Ding, H. Bearing capacity of composite bucket foundations for offshore wind turbines in silty sand. Ocean Eng. 2018, 151, 1–11. [Google Scholar] [CrossRef]
  18. Ding, H.; Hu, R.; Zhang, P.; Le, C. Load bearing behaviors of composite bucket foundations for offshore wind turbines on layered soil under combined loading. Ocean Eng. 2020, 198, 106997. [Google Scholar] [CrossRef]
  19. Zhang, P.; Li, J.; Le, C.; Ding, H. Seismic responses of two bucket foundations for offshore wind turbines based on shaking table tests. Renew. Energy 2022, 187, 1100–1117. [Google Scholar] [CrossRef]
  20. Houlsby, G.; Ibsen, L.; Byrne, B. Suction caissons for wind turbines. In Frontiers in Offshore Geotechnics; ISFOG: Perth, WA, Australia, 2005; pp. 75–93. [Google Scholar]
  21. Wang, X.; Zeng, X.; Yang, X.; Li, J. Feasibility study of offshore wind turbines with hybrid monopile foundation based on centrifuge modeling. Appl. Energy 2019, 209, 127–139. [Google Scholar] [CrossRef]
  22. Zhai, S. Optimal Design of Large-Scale Cylindrical Foundation Force Transmission System for Offshore Wind Power. Master’s Thesis, Tianjin University, Tianjin, China, 2012. [Google Scholar]
  23. Liu, M.; Yang, M.; Wang, H. Bearing behavior of wide-shallow bucket foundation for offshore wind turbines in drained silty sand. Ocean Eng. 2014, 82, 169–179. [Google Scholar] [CrossRef]
  24. Liu, Y.; Zhang, P.; Ding, H.Y.; Zhang, Z. Load Bearing Characteristics of Composite Bucket Foundation for Offshore Wind Turbines. J. Mar. Sci. Technol. 2016, 24, 790–797. [Google Scholar]
  25. Zhang, P.; He, S.; Liu, Y.; Ding, H. Force transfer characteristics of composite bucket foundation for offshore wind turbines. J. Renew. Sustain. Energy 2016, 8, 013307. [Google Scholar] [CrossRef]
  26. Zhang, P.; Xu, Y.; Le, C.; Ding, H.; Guo, Y. Structural optimization method for the transition section in composite bucket foundations of offshore wind turbines. Energies 2018, 11, 3230. [Google Scholar] [CrossRef] [Green Version]
  27. He, S.; Zhang, P.; Ding, H. Study on the bearing mode and force transfer path of composite bucket foundations. Energies 2017, 10, 1041. [Google Scholar] [CrossRef] [Green Version]
  28. Ministry of Housing and Urban Rural Development of the People’s Republic of China. Code for Design of Concrete Structures; China Architecture Building Press: Beijing, China, 2015.
  29. Ministry of Housing and Urban Rural Development of the People’s Republic of China. Standard for Test Method of Mechanical Properties on Ordinary Concrete; China Architecture Building Press: Beijing, China, 2019.
  30. Wu, J. Seismic Bahavior Study on a New Precast Prestressed Assembled Structural System. Ph.D. Thesis, Southest University, Nanjing, China, 2018. [Google Scholar]
  31. Zhao, B. Research on Prestress Tensioning and Lifting Technique of Composite Bucket Foundation for Offshore Wind Turbine. Master’s Thesis, Tianjin University, Tianjin, China, 2017. [Google Scholar]
Figure 1. Jiangsu xiangshui 3 MW prototype.
Jmse 10 00473 g001
Figure 2. Jiangsu Dafeng 6.45 MW prototype.
Jmse 10 00473 g002
Figure 3. Schematic diagram of model size.
Jmse 10 00473 g003
Figure 4. Reinforcement of arc transition section (units: mm).
Jmse 10 00473 g004
Figure 5. Test setup of specimen under cyclic loading.
Jmse 10 00473 g005
Figure 6. Loading system.
Jmse 10 00473 g006
Figure 7. Schematic diagram of measuring point layout (units: mm).
Jmse 10 00473 g007
Figure 8. The failure mode of GD1 specimen: (a) East (forward), (b) West (reverse), (c) South (right side), and (d) North (left side).
Jmse 10 00473 g008
Figure 9. The failure mode of GD2 specimen: (a) East (forward), (b) West (reverse), (c) South (left side), and (d) North (right side).
Jmse 10 00473 g009
Figure 10. Destruction of GD-3: (a) East (forward), (b) West (reverse), (c) South (left side), and (d) North (right side).
Jmse 10 00473 g010
Figure 11. Hysteresis curve: (a) GD1 specimen, (b) GD2 specimen, and (c) GD3 specimen.
Jmse 10 00473 g011aJmse 10 00473 g011b
Figure 12. Skeleton curve.
Jmse 10 00473 g012
Figure 13. Stiffness degradation curve: (a) GD1 specimen, (b) GD2 specimen, and (c) GD3 specimen.
Jmse 10 00473 g013
Figure 14. Comparison of energy dissipation coefficients of specimens.
Jmse 10 00473 g014
Figure 15. GD1 specimen: (a) No. 1 steel bar and (b) No. 2 steel bar.
Jmse 10 00473 g015
Figure 16. GD2 specimen: (a) No. 1 steel bar and (b) No. 2 steel bar.
Jmse 10 00473 g016
Figure 17. GD3 specimen: (a) No. 1 steel bar and (b) No. 2 steel bar.
Jmse 10 00473 g017
Figure 18. Concrete stress curve of GD-1 specimen: (a) No. 1 measuring point and (b) No.2 measuring point.
Jmse 10 00473 g018
Figure 19. Concrete stress curve of GD-2 specimen: (a) No. 1 measuring point and (b) No. 2 measuring point.
Jmse 10 00473 g019
Figure 20. Concrete stress curve of GD-3 specimen: (a) No. 1 measuring point t and (b) No. 2 measuring point.
Jmse 10 00473 g020
Figure 21. Stress-load curve of No. 1 steel bar: (a) B measuring point and (b) C measuring point.
Jmse 10 00473 g021
Figure 22. Stress-load curve of No. 2 steel bar: (a) B measuring point and (b) C measuring point.
Jmse 10 00473 g022
Figure 23. Strain-load curve of No. 1 concrete: (a) B measuring point and (b) C measuring point.
Jmse 10 00473 g023
Figure 24. Simultaneous failure area of compression and tension in the transition section of composite bucket foundation.
Jmse 10 00473 g024
Figure 25. Prestressed system of CBF.
Jmse 10 00473 g025
Table 1. Details of specimens.
NO.ScaleStructure TypePrestressed Reinforcement/PieceTension Control Force/kNReinforcement Ratio
GD11:20Ordinary concrete001.5%
GD2prestress
concrete
61801.5%
GD33001.5%
Table 2. Concrete strength test results.
NumberPouring SequenceCompressive Strength of the Cube (MPa)
GD1first49.87
second50.60
GD2first48.21
second51.16
GD3first48.87
second51.51
Table 3. Material properties of steel bars.
Steel TypeDiameter (mm)Yield Strength (MPa)Ultimate Strength (MPa)
RB40010338.41490.20
PB3358322.85452.89
PB3356315.59442.16
Table 4. Bearing capacity of prestressed transition section.
ModelCracking Load (kN)Cracking Displacement (mm)Failure Load (kN)Failure Displacement (mm)
GD162.983.3228.9719.7
GD285.474.1247.3617.2
GD3108.825.4246.9815.2
Publisher’s Note: MDPI stays neutral with regard to jurisdictional claims in published maps and institutional affiliations.

