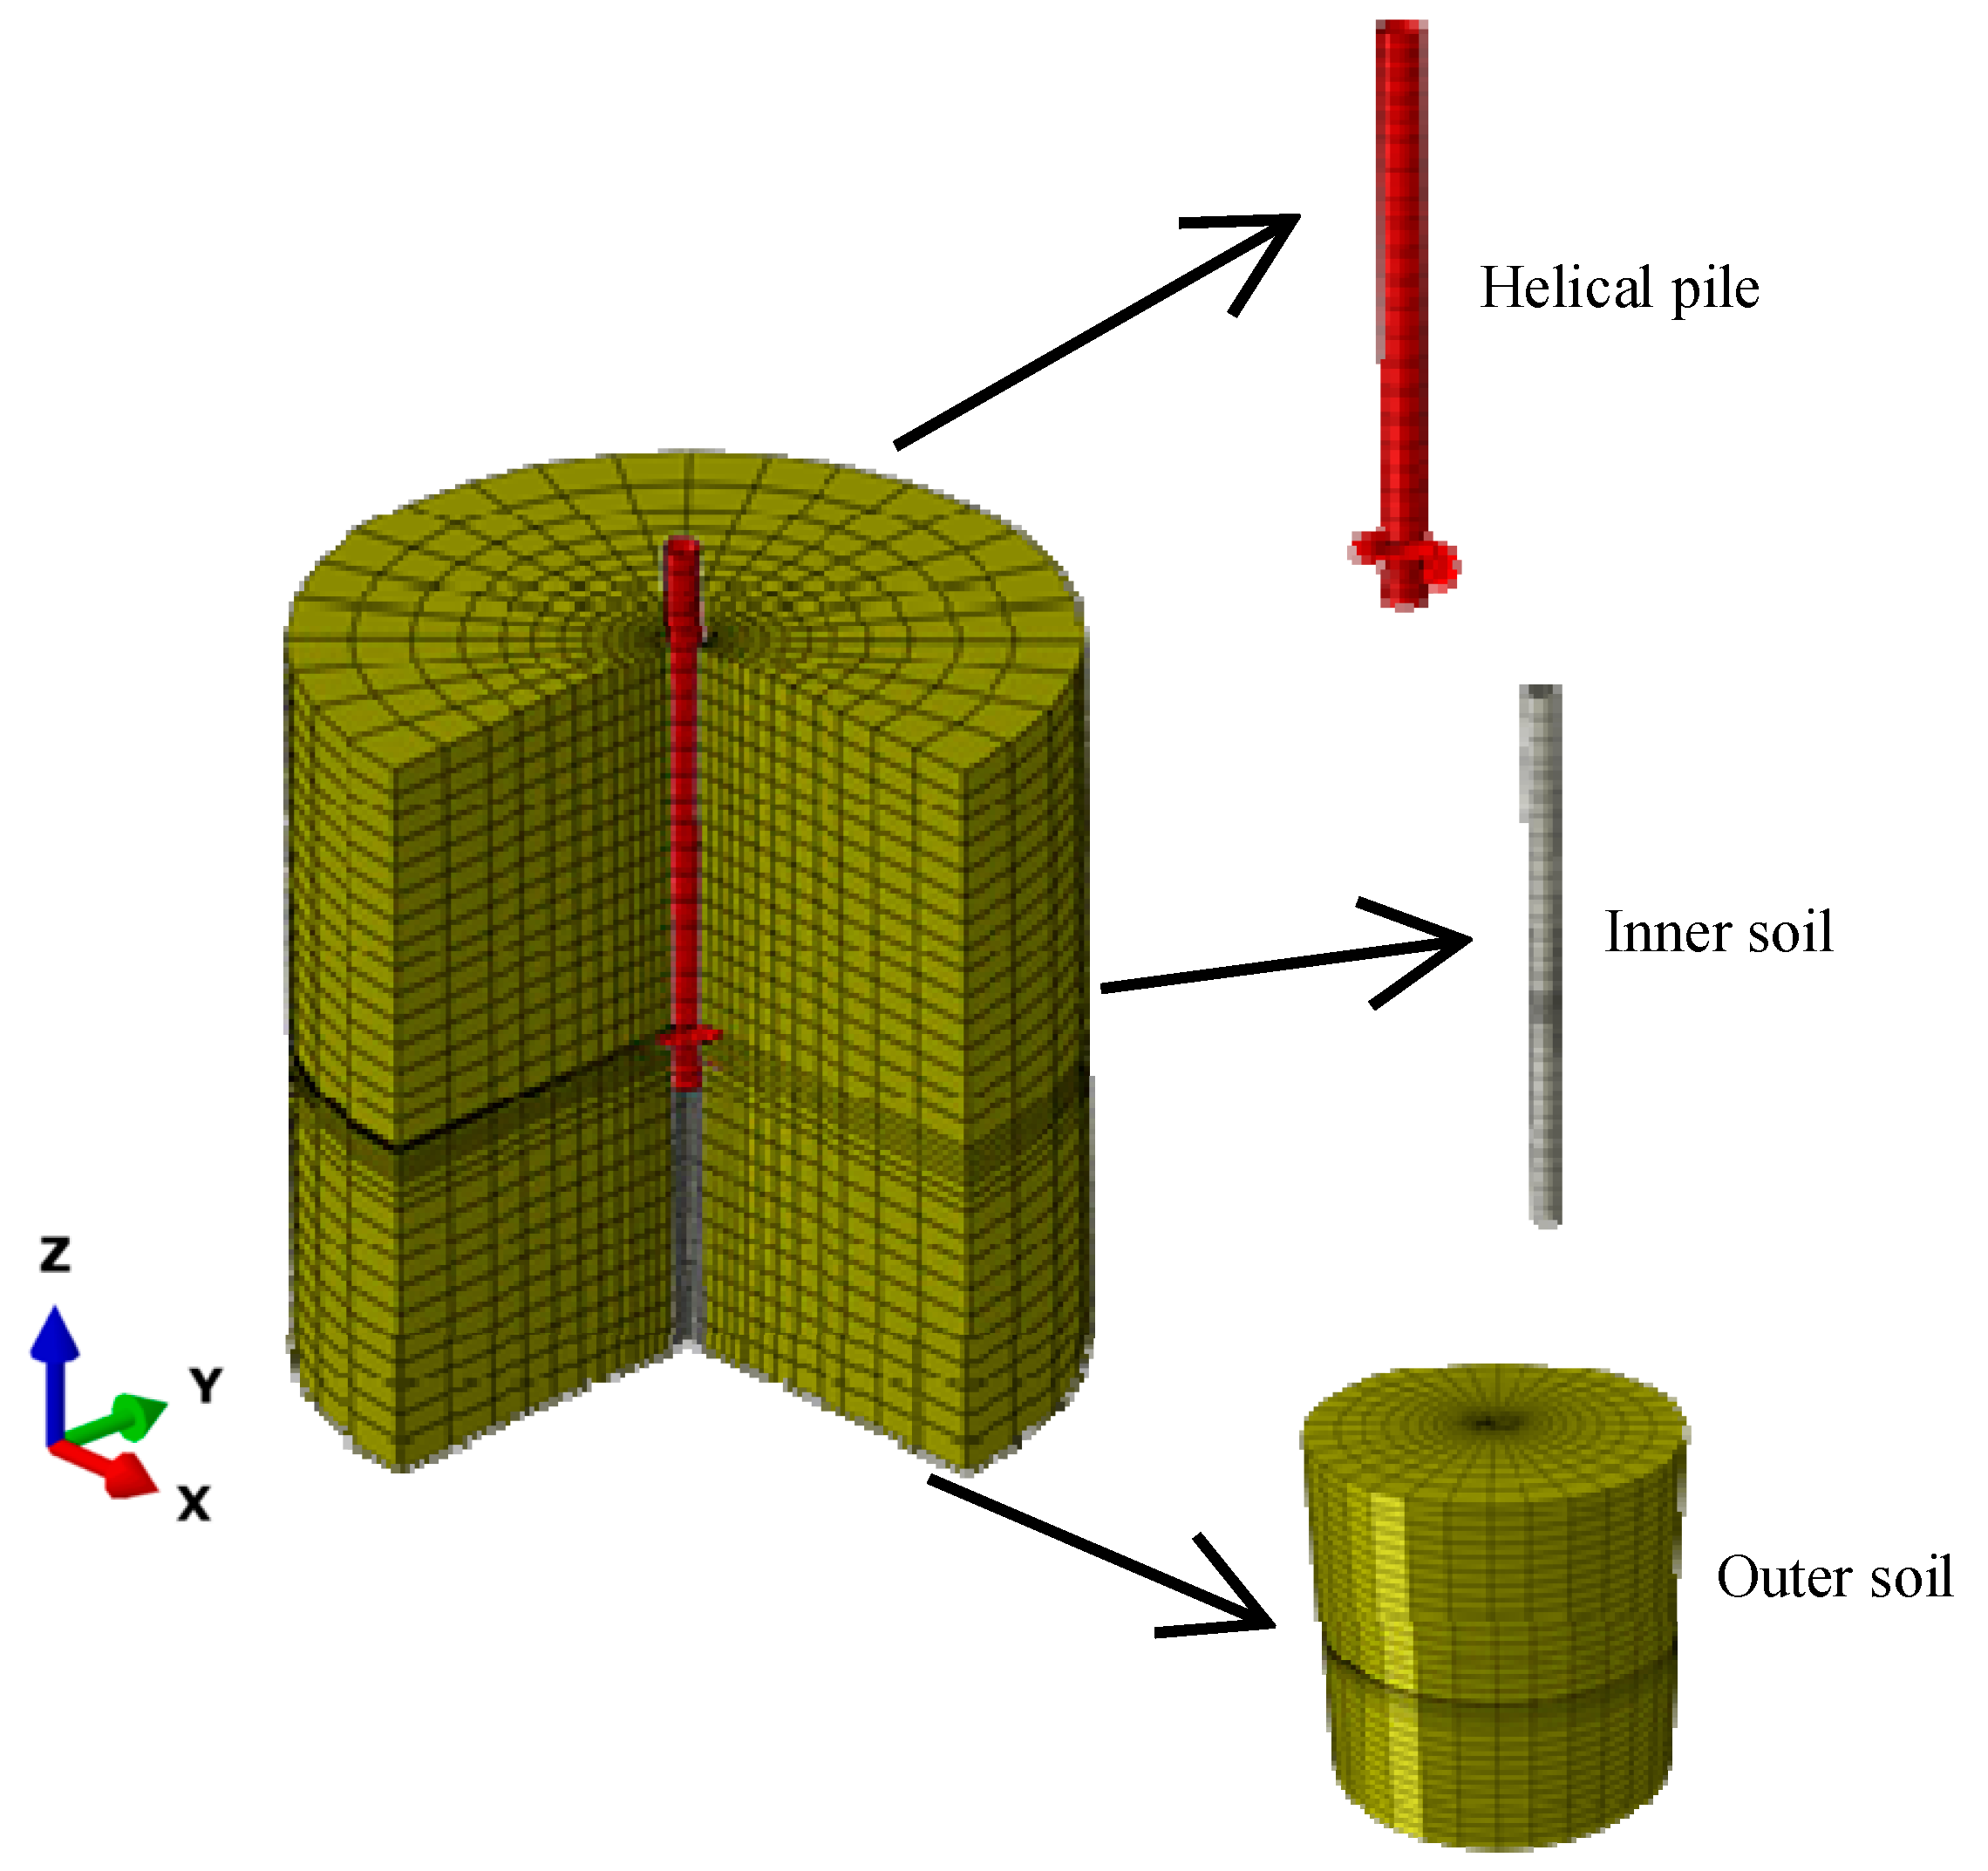
Figure 1.
Mesh division for single helical pile model.
Figure 1.
Mesh division for single helical pile model.
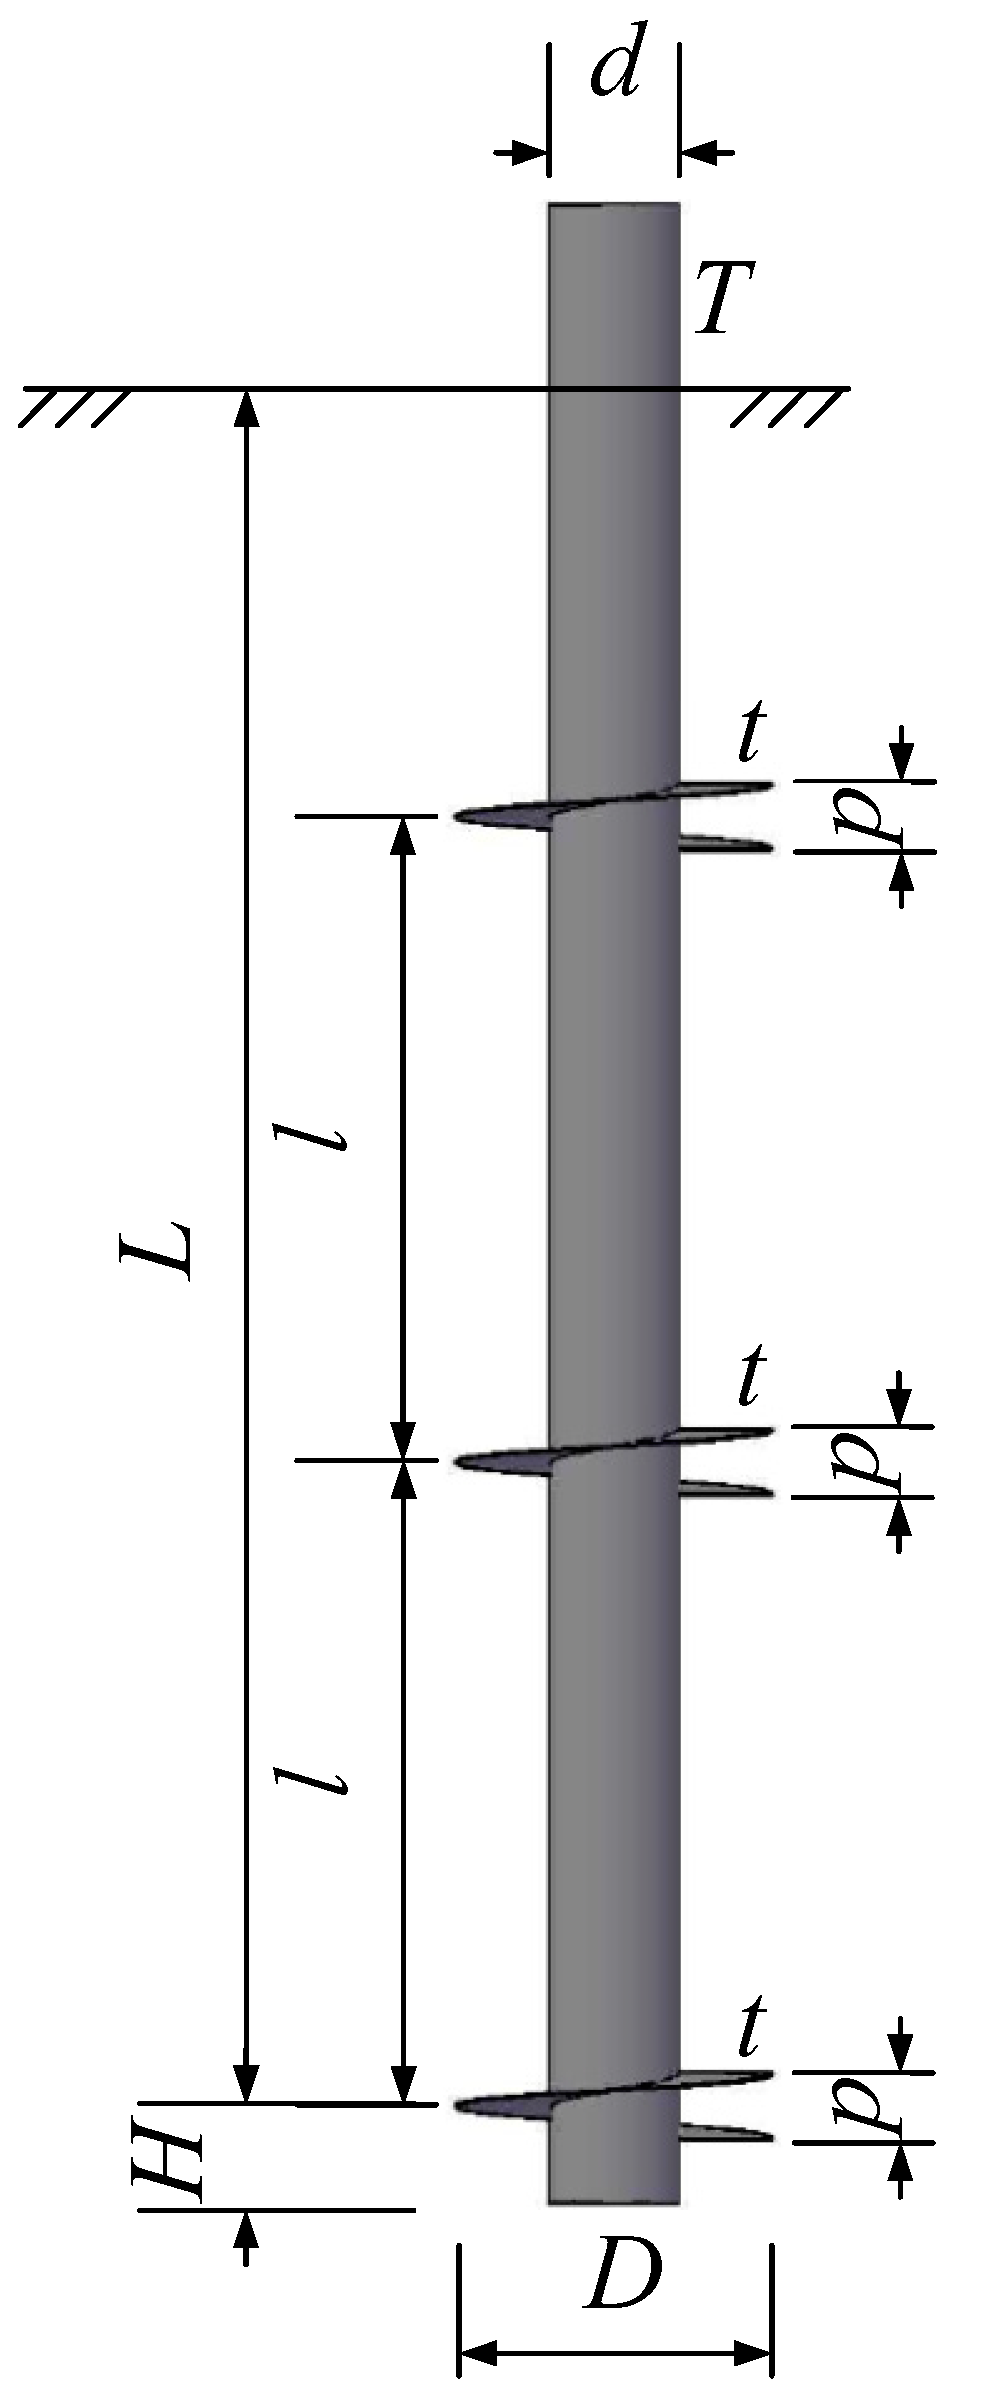
Figure 2.
Schematic diagram of helical pile.
Figure 2.
Schematic diagram of helical pile.
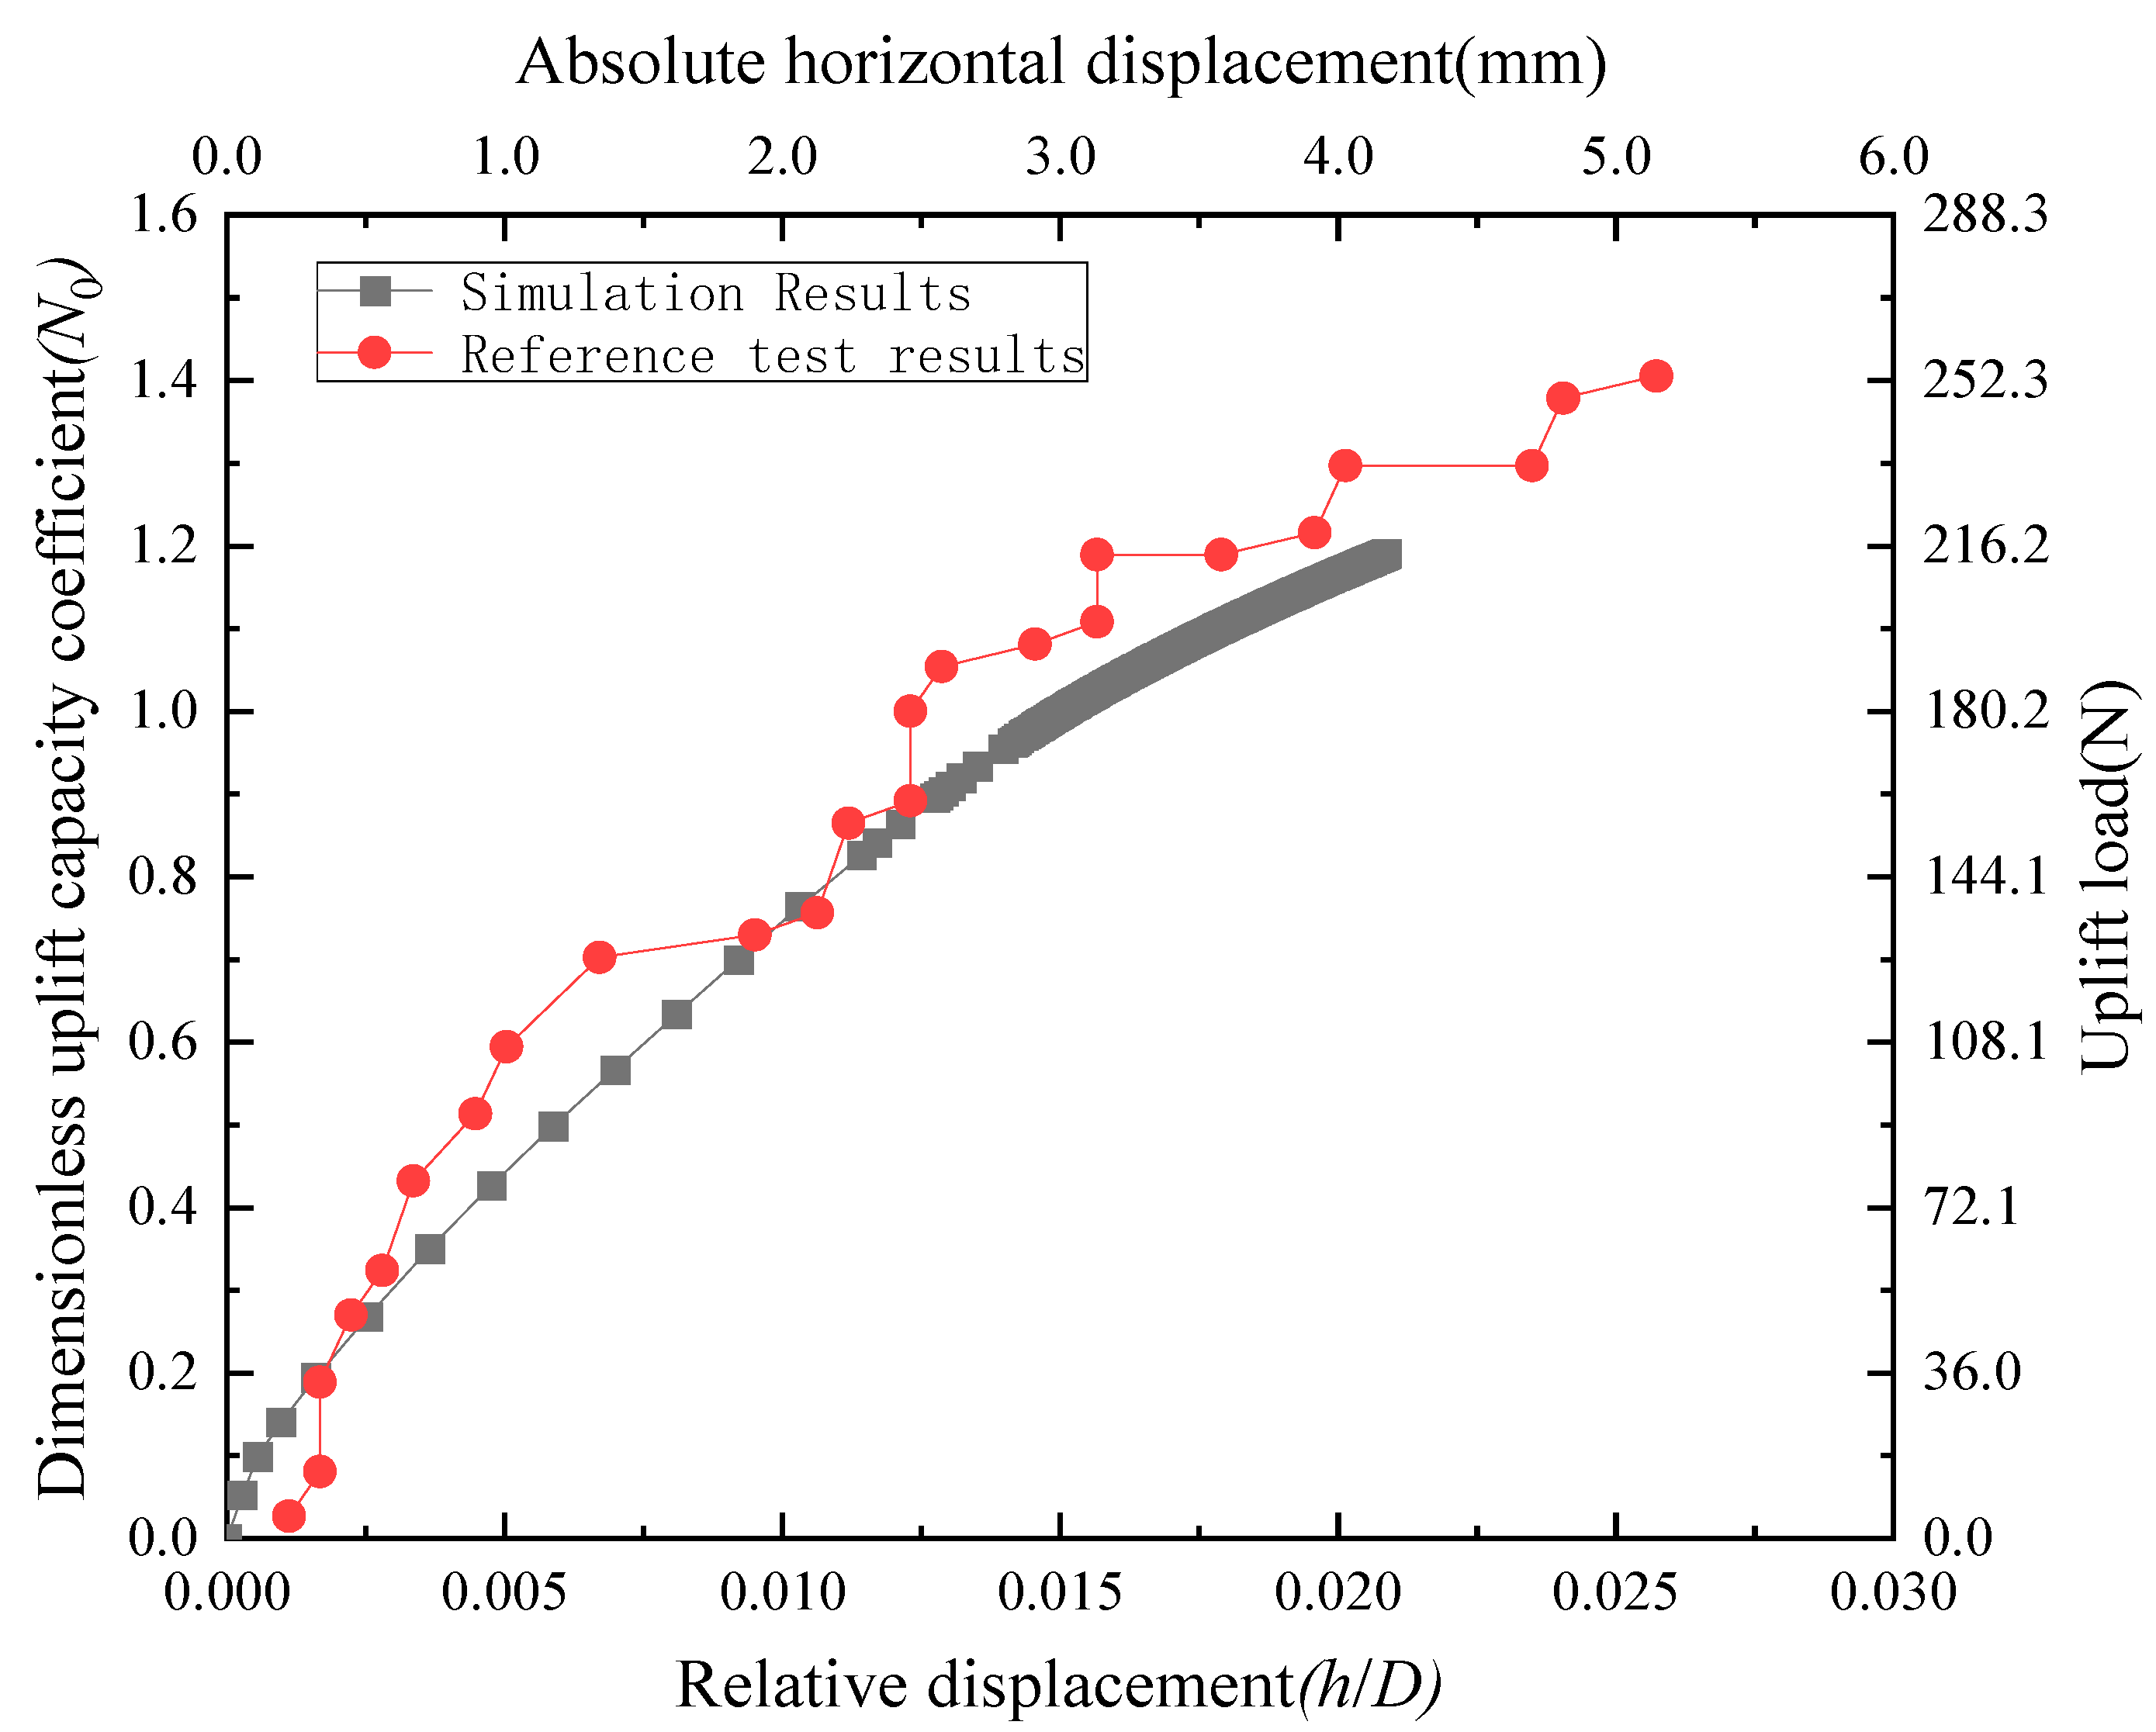
Figure 3.
Comparison of finite element simulation results and experimental data of Wang et al. [
25].
Figure 3.
Comparison of finite element simulation results and experimental data of Wang et al. [
25].
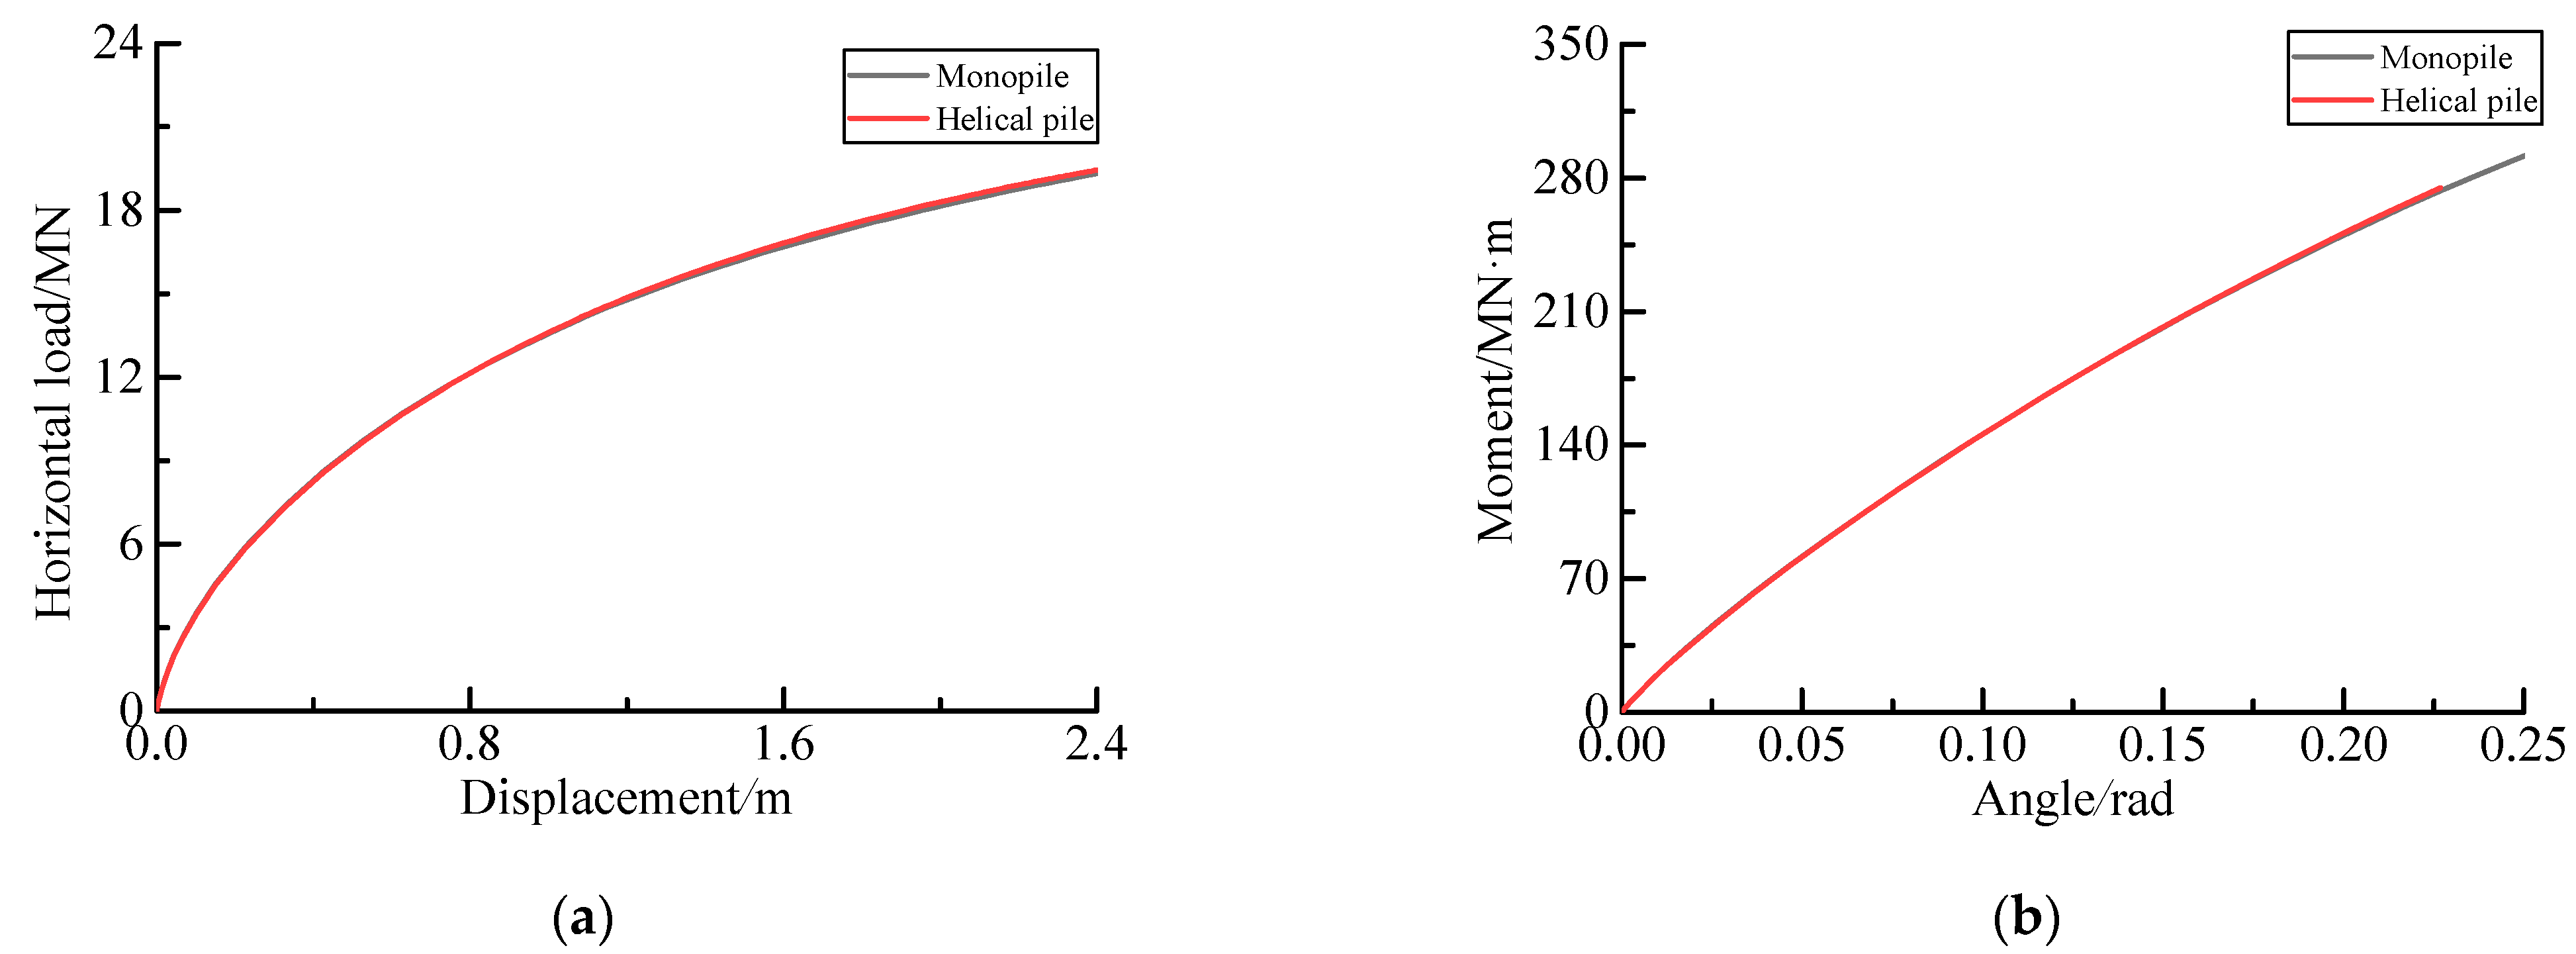
Figure 4.
Horizontal and moment capacity of helical pile and monopile. (a) Horizontal capacity; (b) Moment capacity.
Figure 4.
Horizontal and moment capacity of helical pile and monopile. (a) Horizontal capacity; (b) Moment capacity.
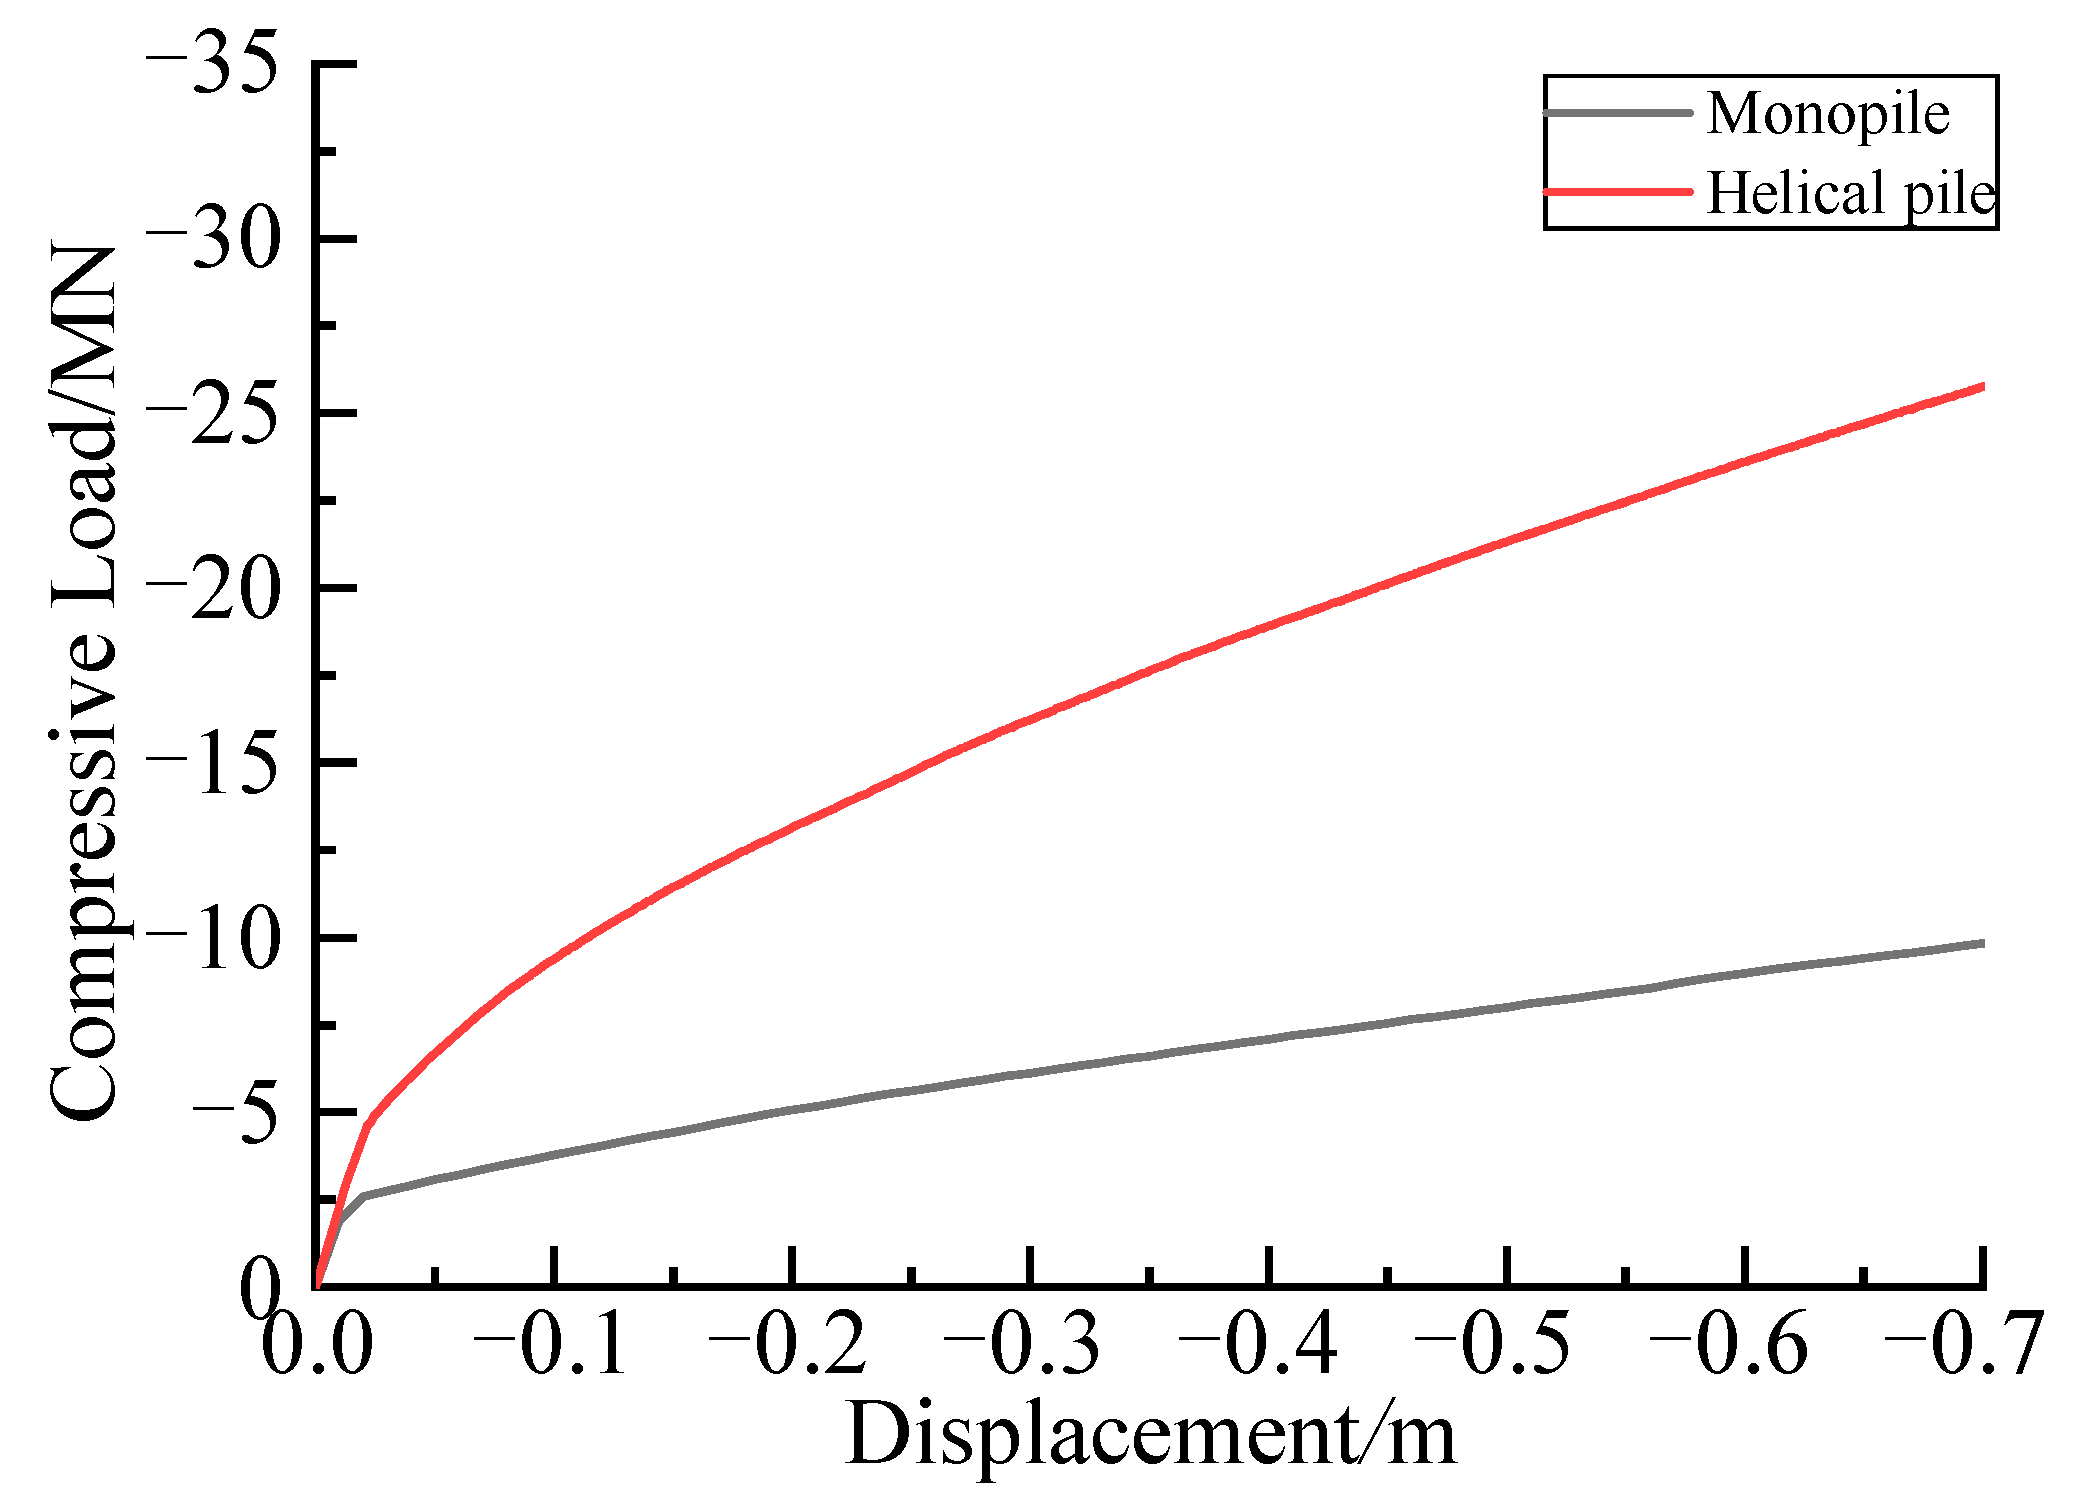
Figure 5.
Compressive load-displacement curve.
Figure 5.
Compressive load-displacement curve.
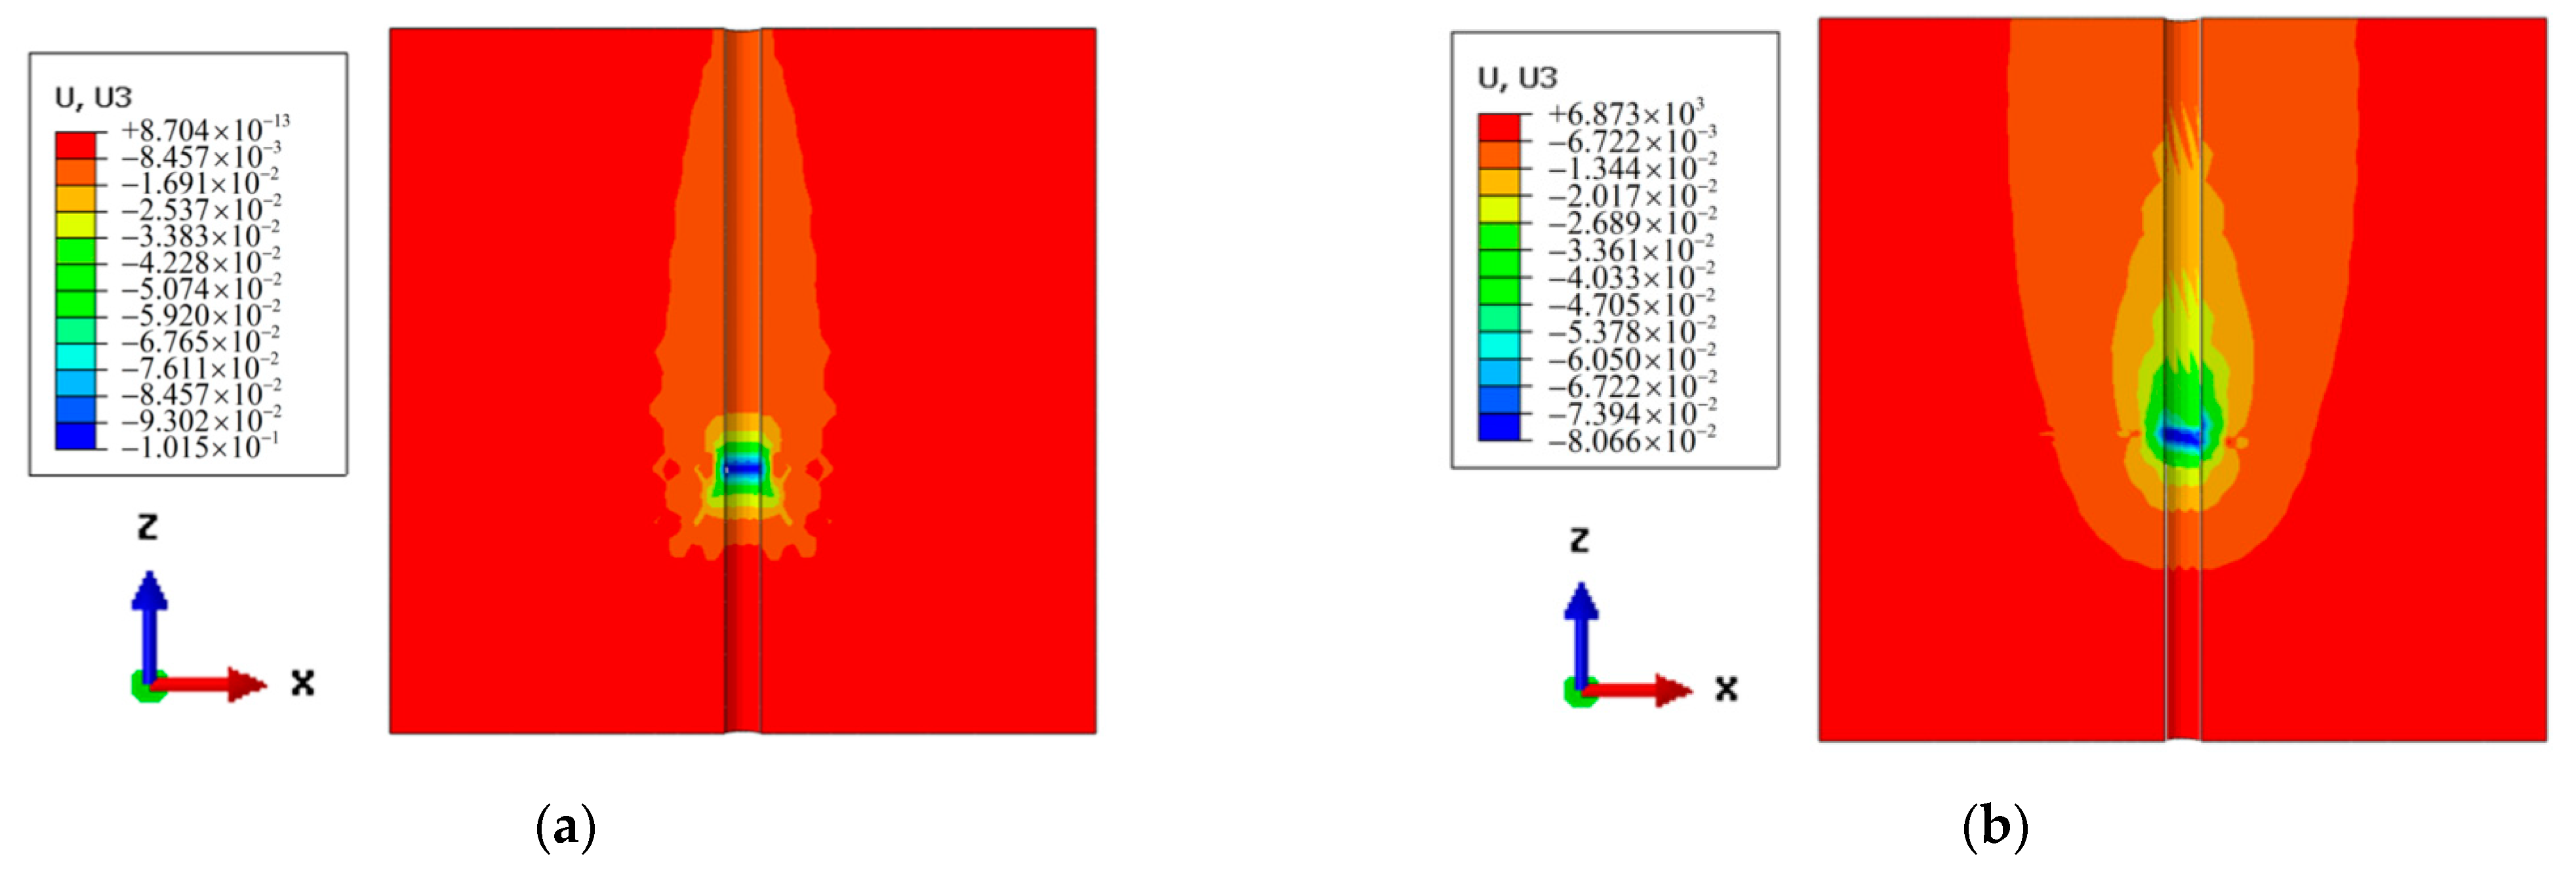
Figure 6.
Displacement nephogram of soil around the piles. (a) Monopile; (b) Helical pile.
Figure 6.
Displacement nephogram of soil around the piles. (a) Monopile; (b) Helical pile.
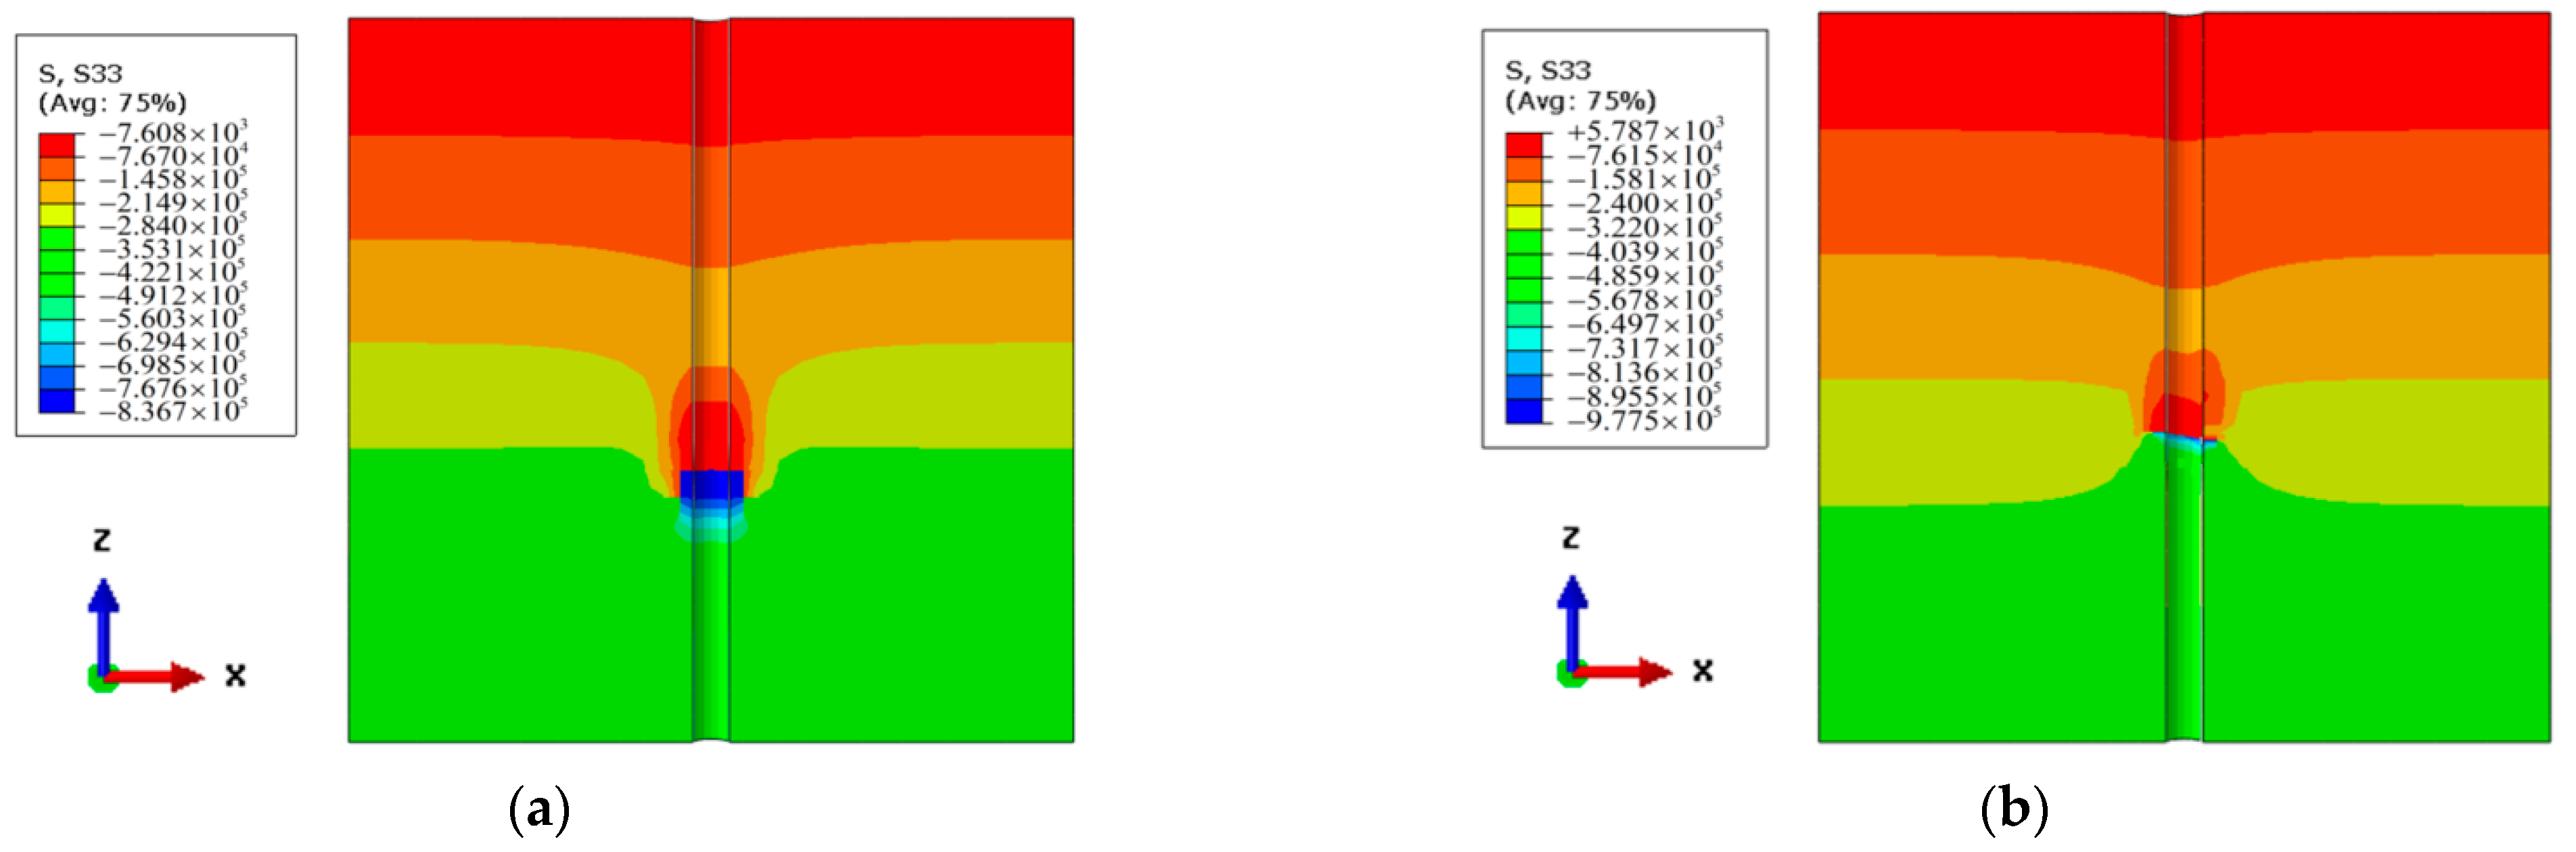
Figure 7.
Stress nephogram of soil around the piles. (a) Monopile; (b) Helical pile.
Figure 7.
Stress nephogram of soil around the piles. (a) Monopile; (b) Helical pile.
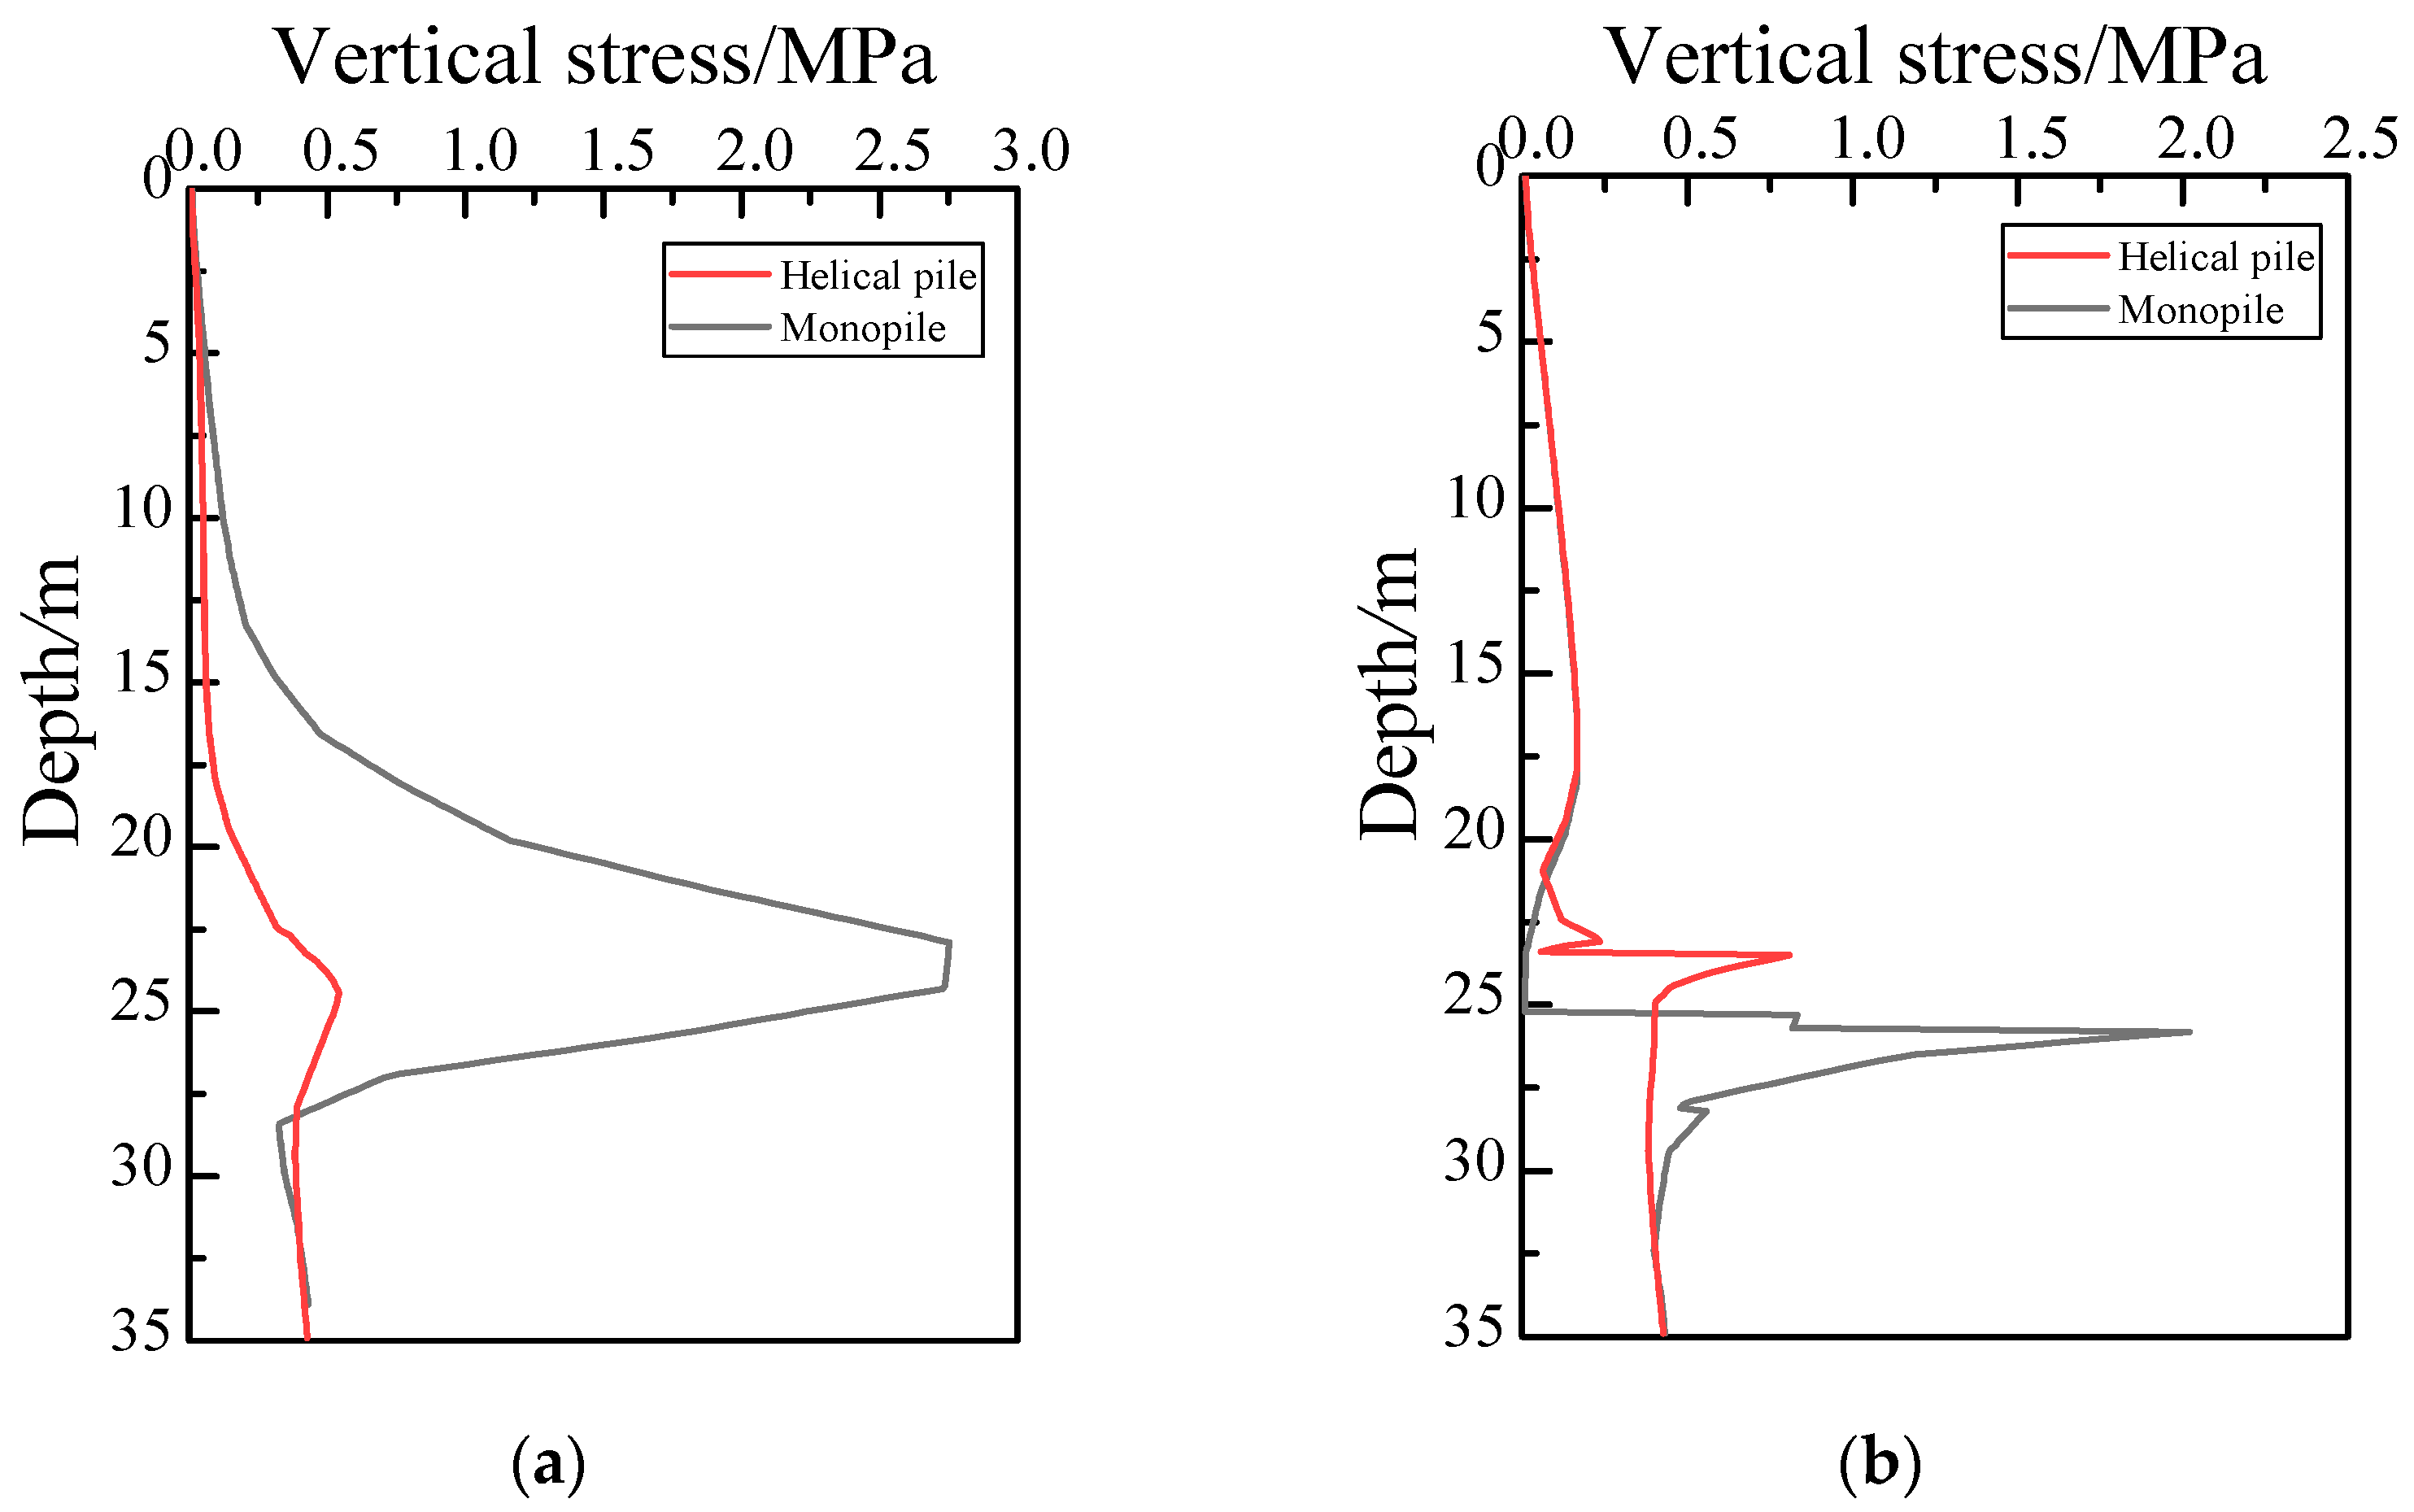
Figure 8.
Soil stress inside and outside the pile varies with depth. (a) Soil stress in pile; (b) Soil stress outside pile.
Figure 8.
Soil stress inside and outside the pile varies with depth. (a) Soil stress in pile; (b) Soil stress outside pile.
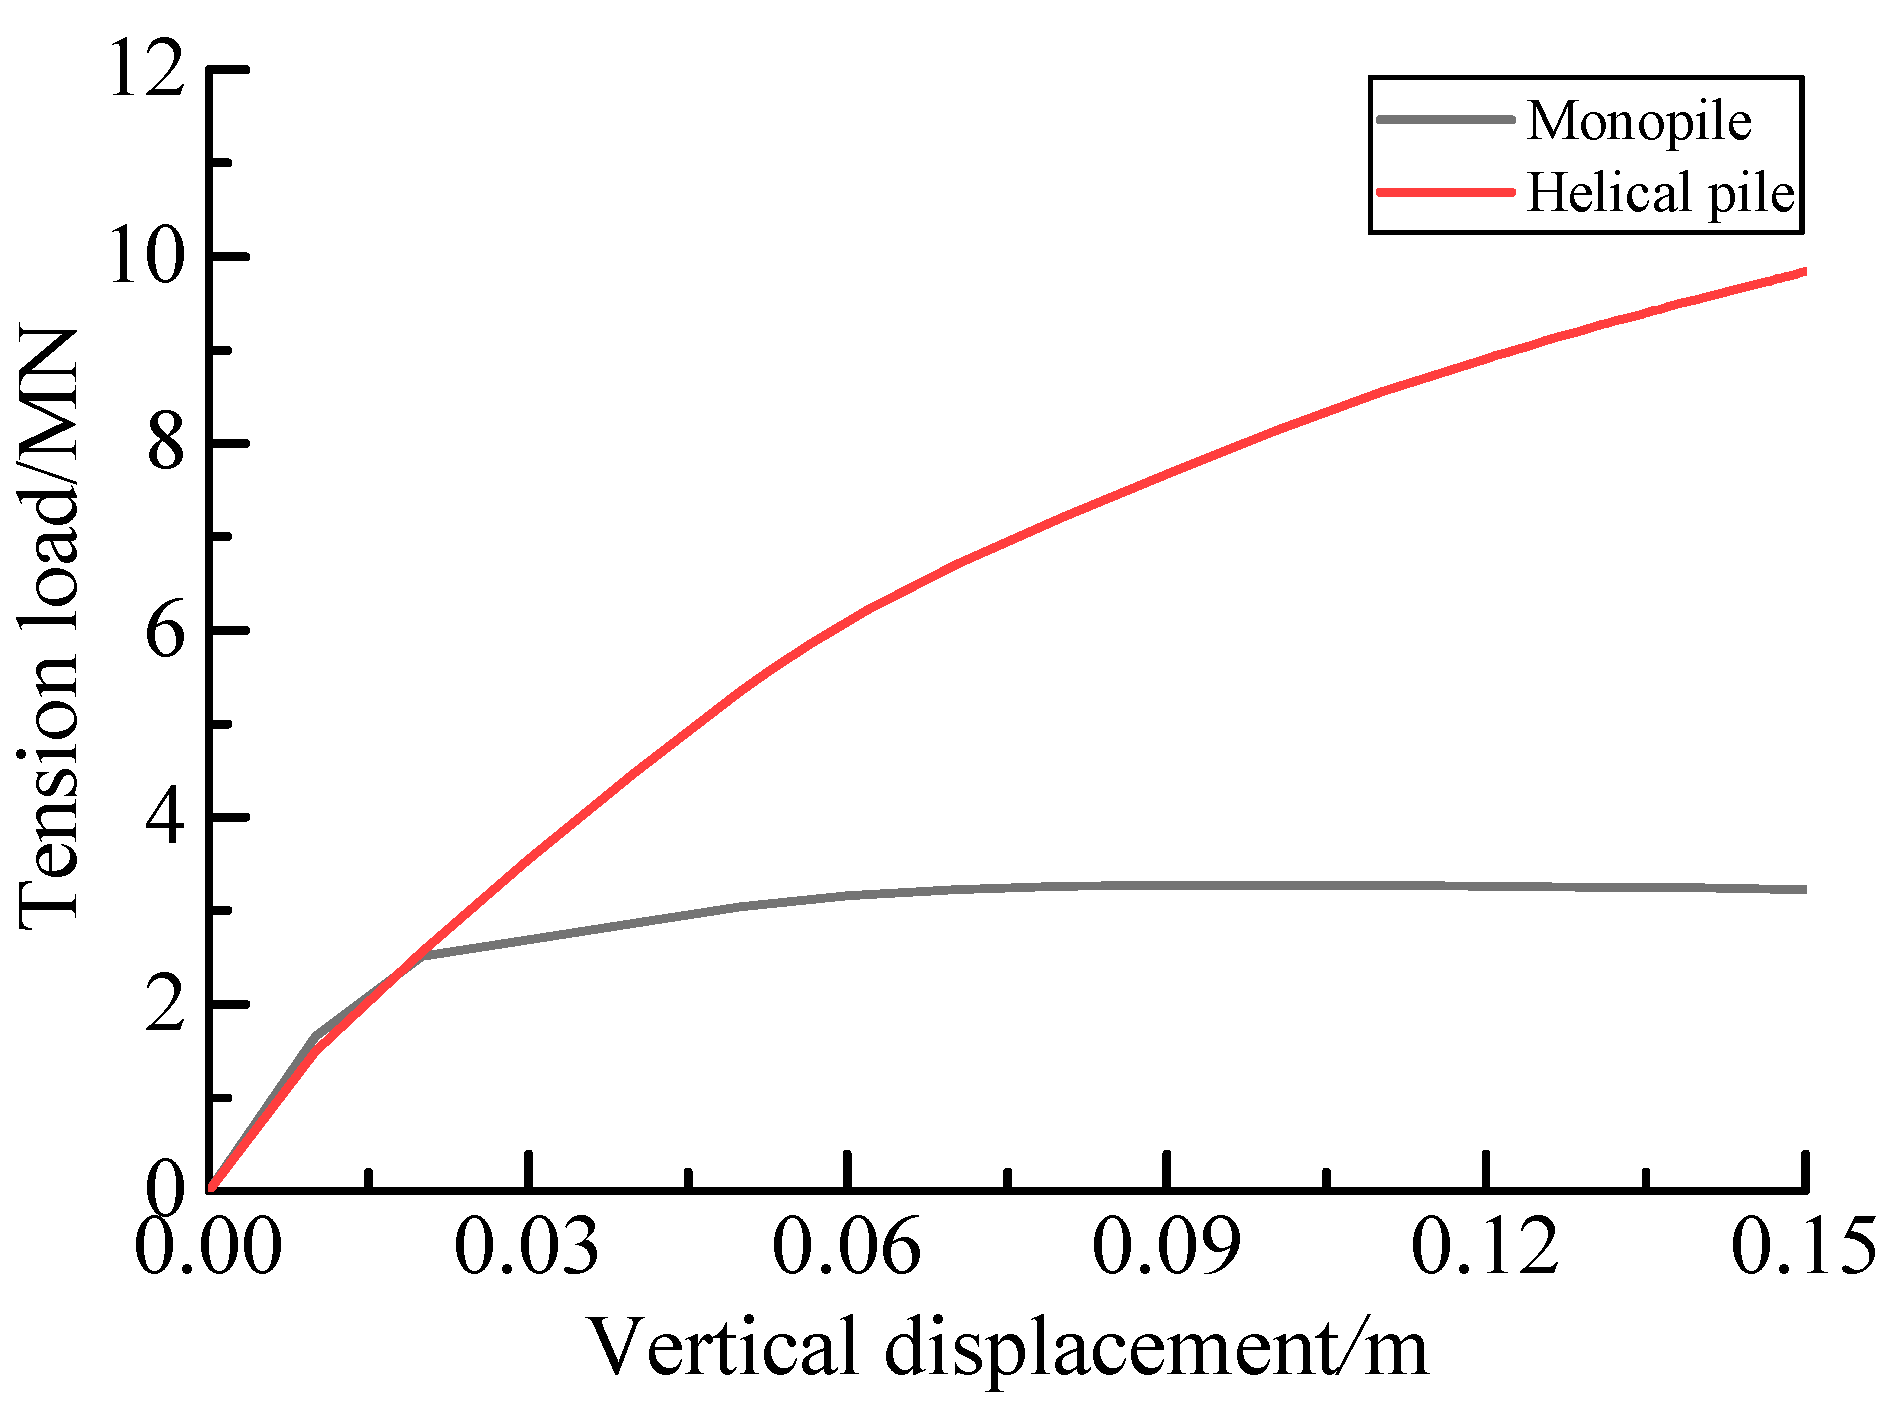
Figure 9.
Uplift load-displacement curves.
Figure 9.
Uplift load-displacement curves.
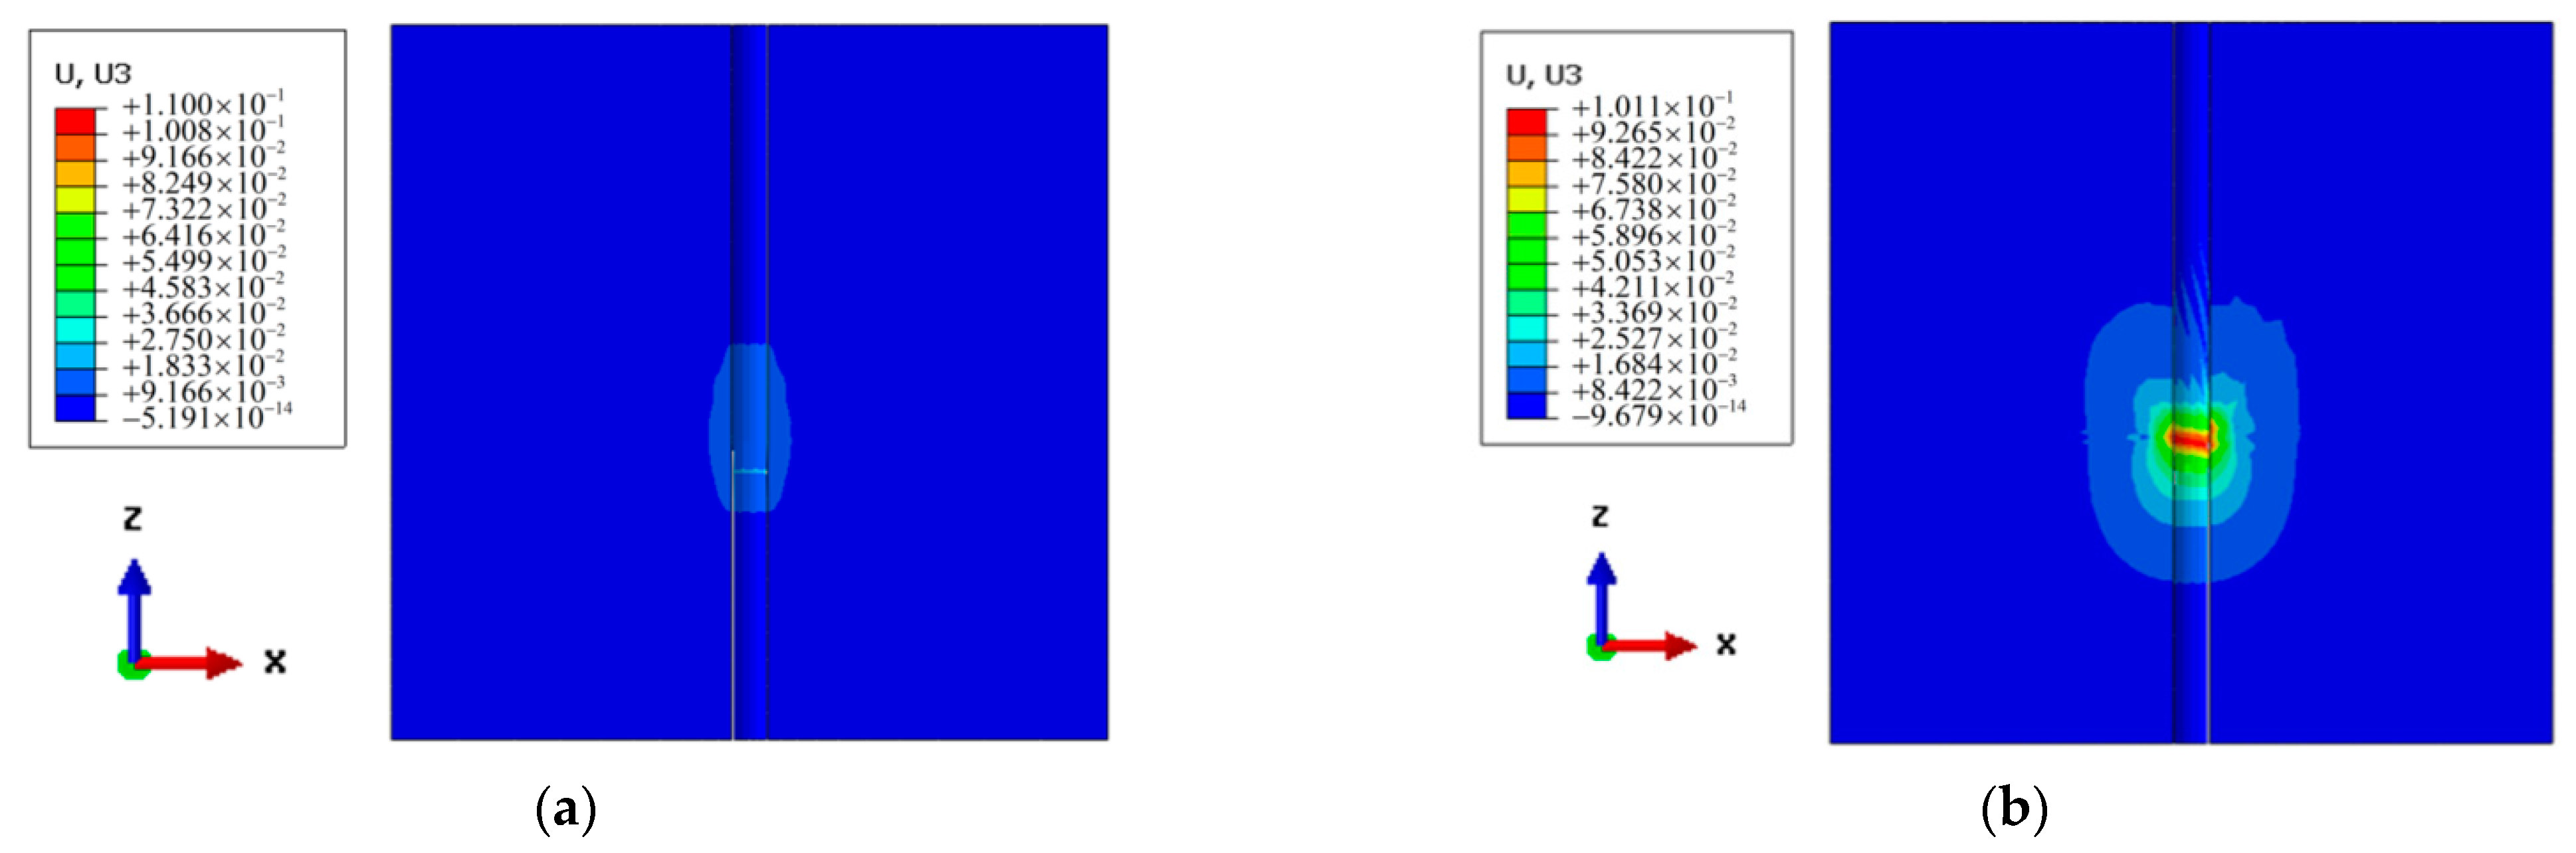
Figure 10.
Displacement nephograms of soil around the piles. (a) Monopile; (b) Helical pile.
Figure 10.
Displacement nephograms of soil around the piles. (a) Monopile; (b) Helical pile.
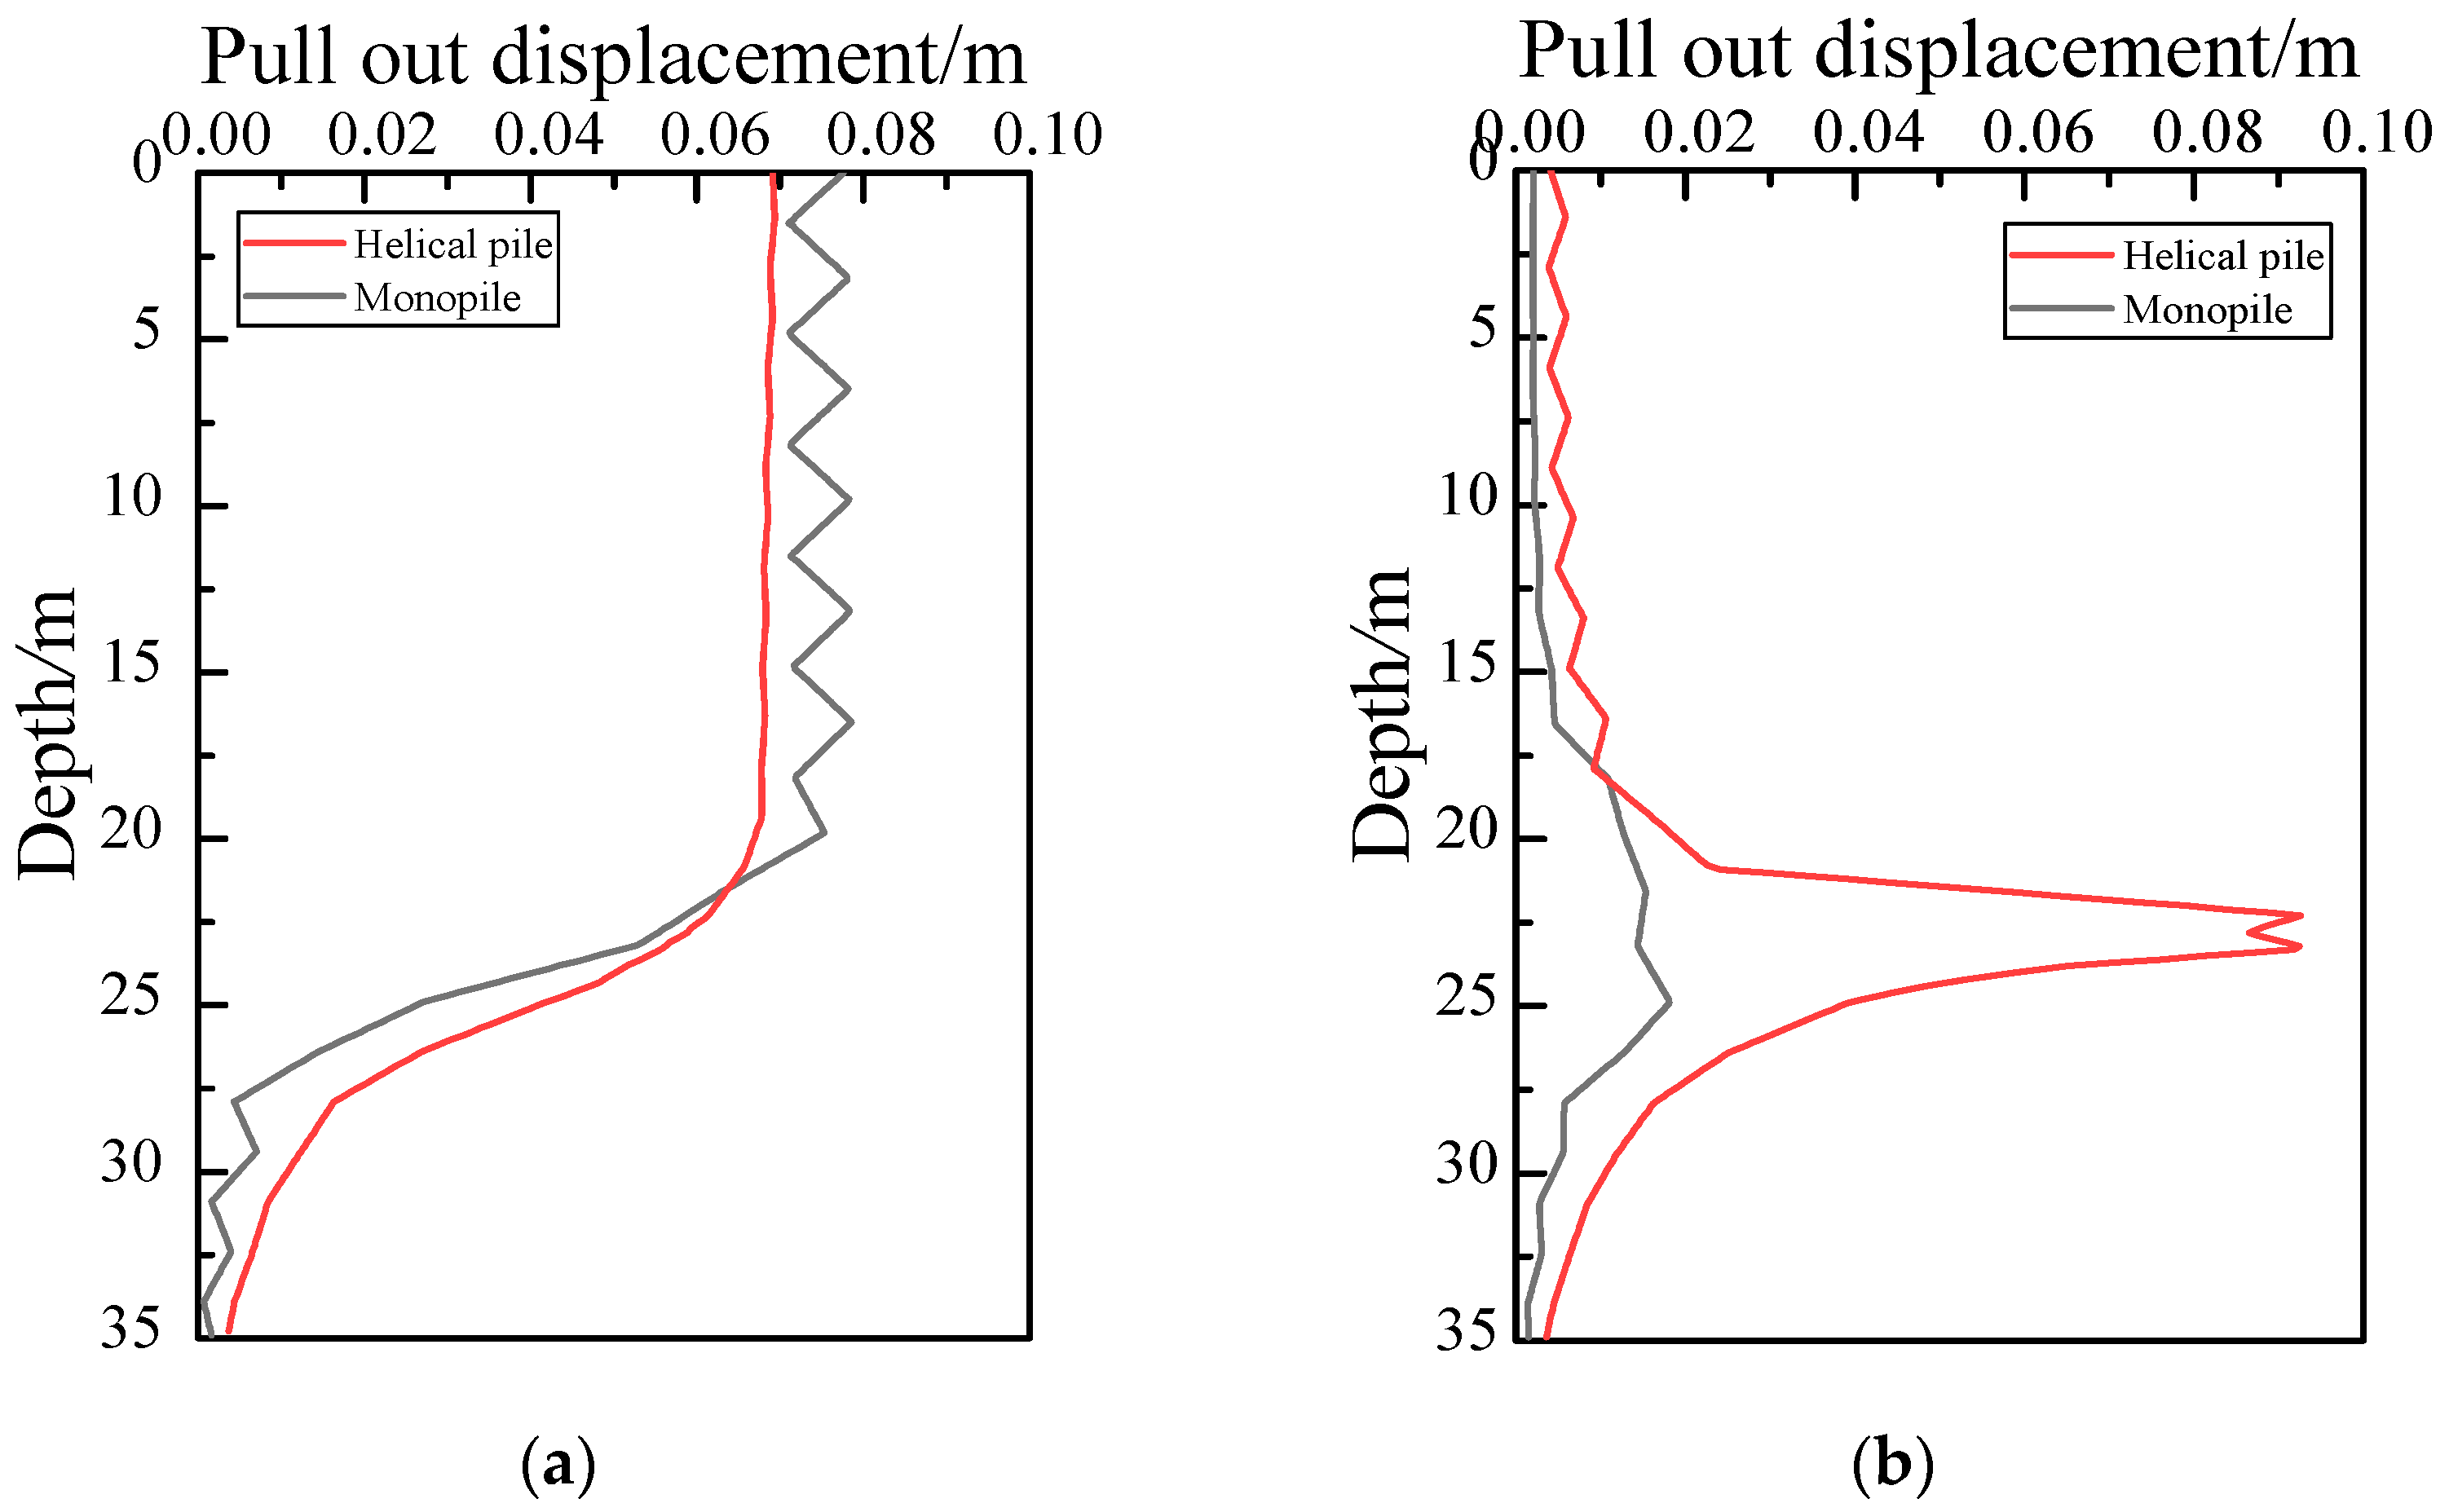
Figure 11.
Soil stress inside and outside pile varies with depth. (a) Soil stress in pile; (b) Soil stress outside pile.
Figure 11.
Soil stress inside and outside pile varies with depth. (a) Soil stress in pile; (b) Soil stress outside pile.
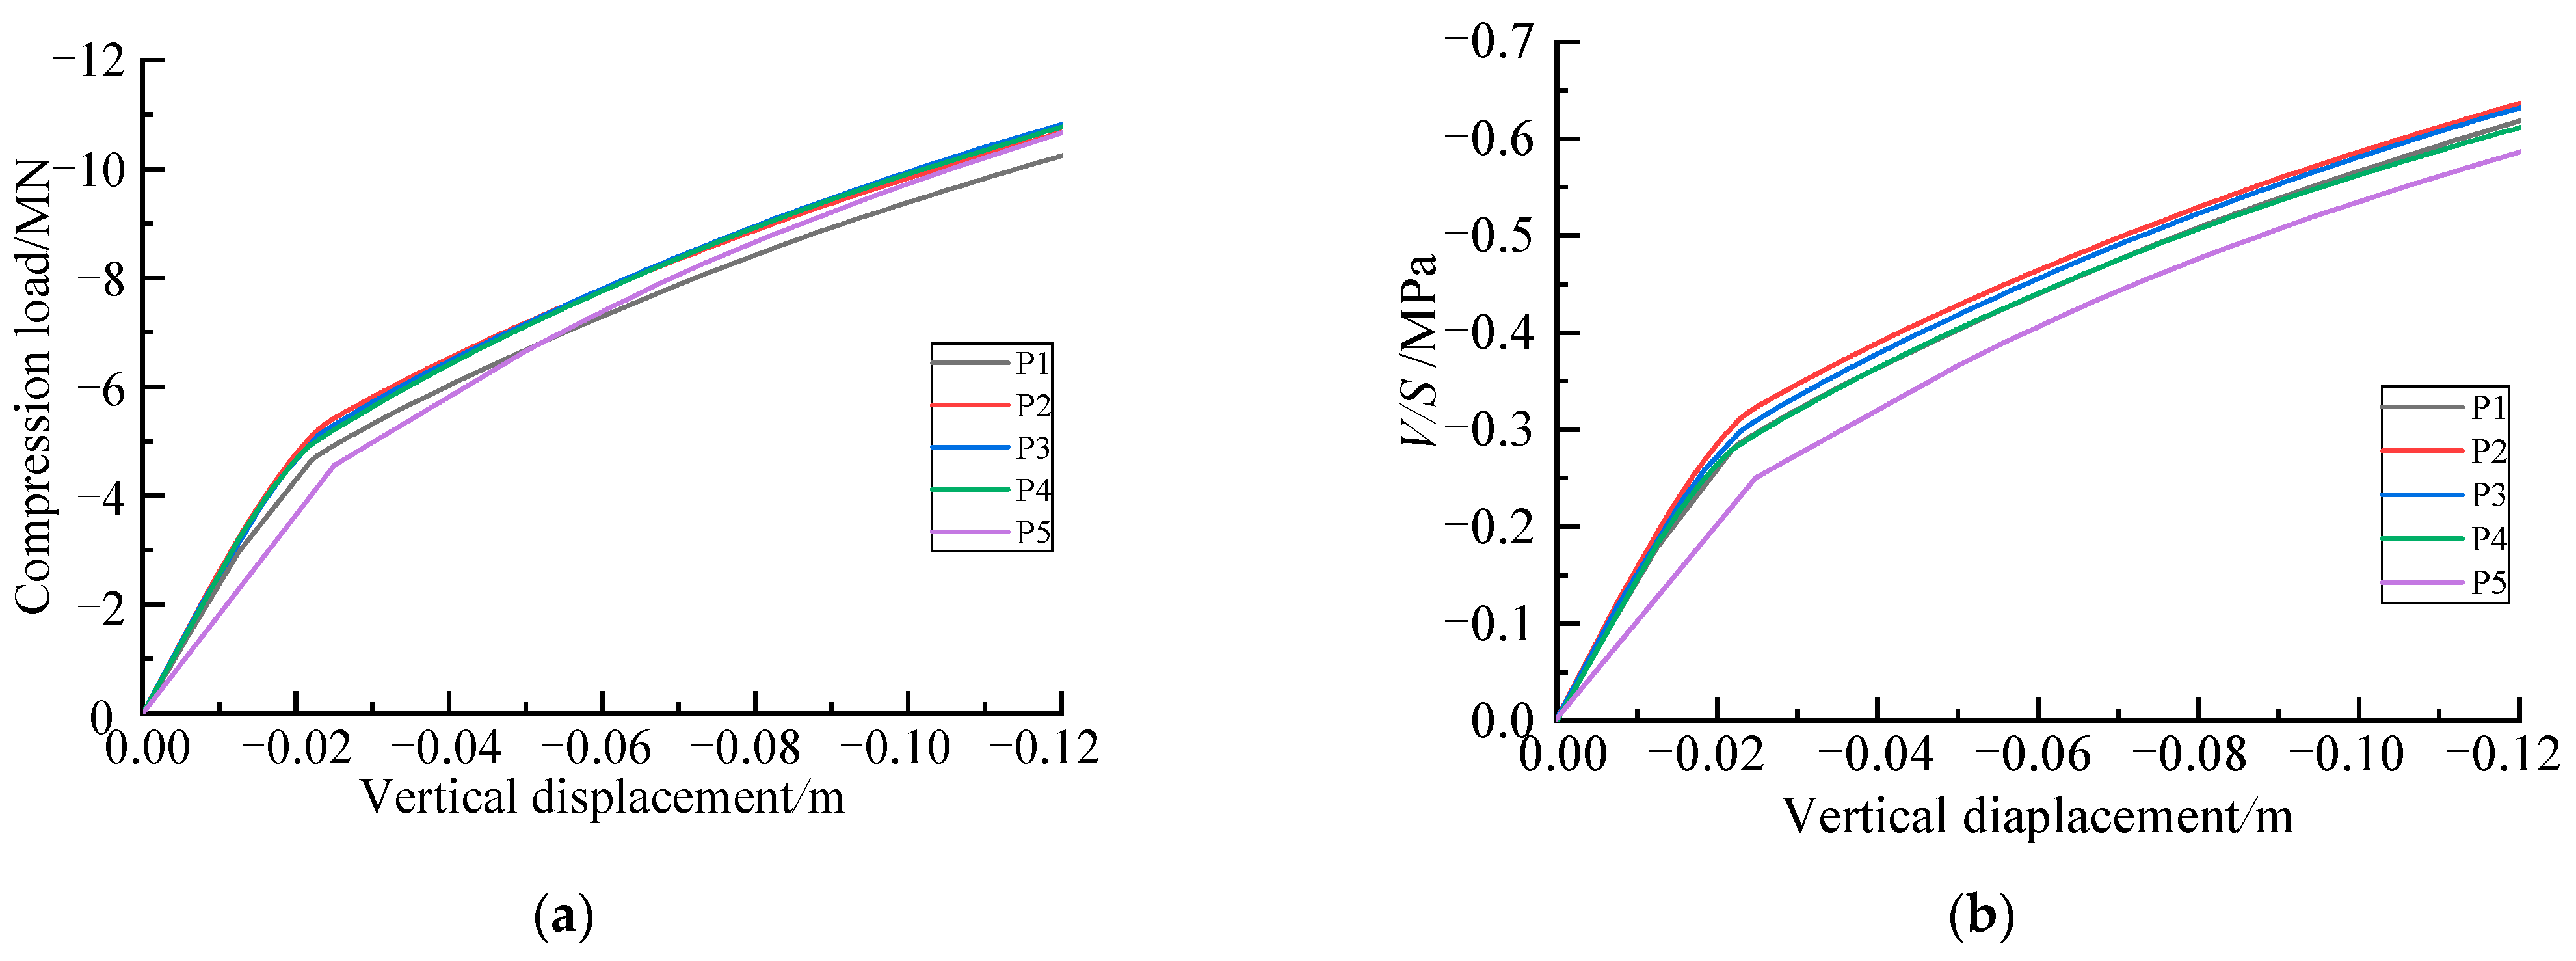
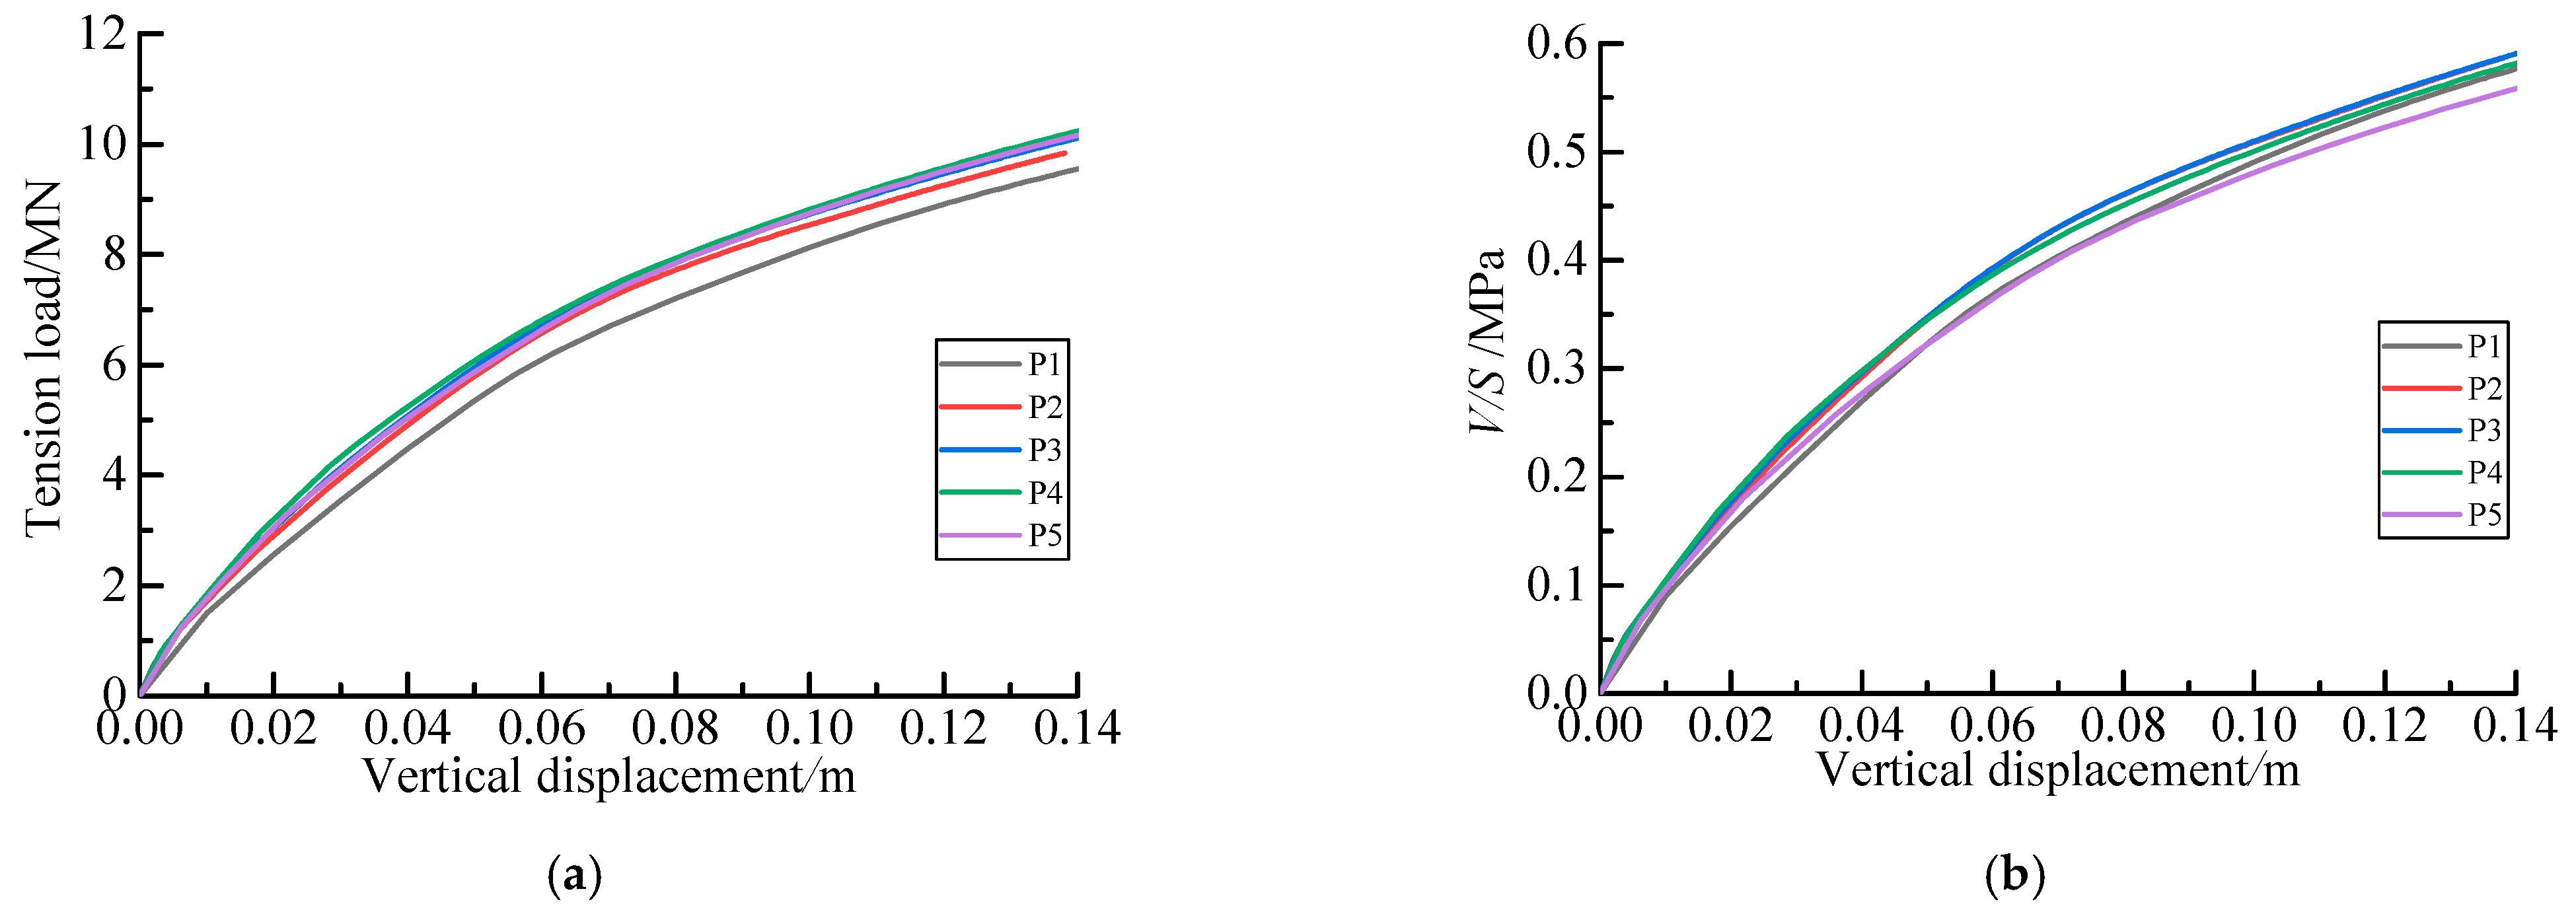
Figure 12.
Compression bearing characteristic curves of helical pile with various pitches. (a) Load-displacement curves; (b) Vertical force/blade area (V/S)-displacement curves.
Figure 12.
Compression bearing characteristic curves of helical pile with various pitches. (a) Load-displacement curves; (b) Vertical force/blade area (V/S)-displacement curves.
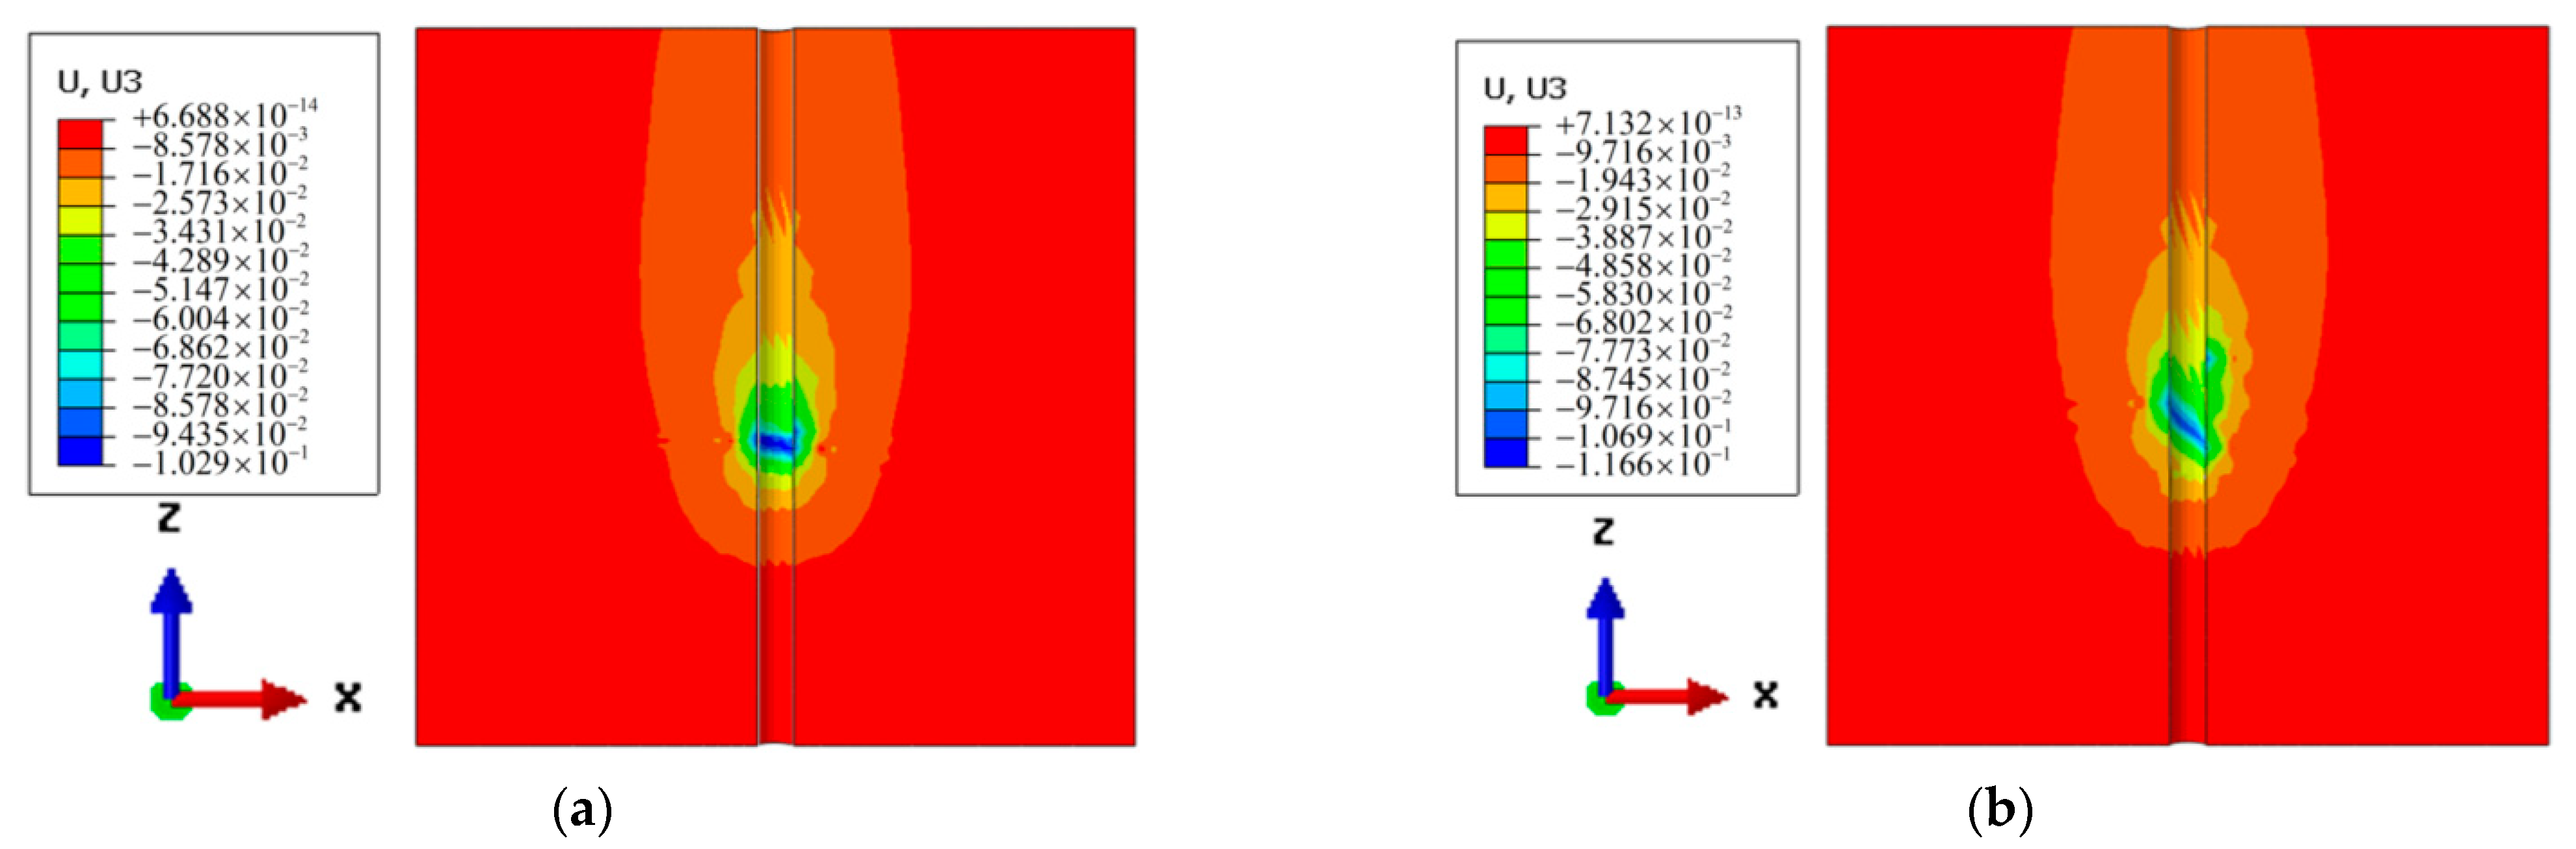
Figure 13.
Displacement nephograms of soil around a pile with displacement of 0.1 m. (a) P1; (b) P5.
Figure 13.
Displacement nephograms of soil around a pile with displacement of 0.1 m. (a) P1; (b) P5.
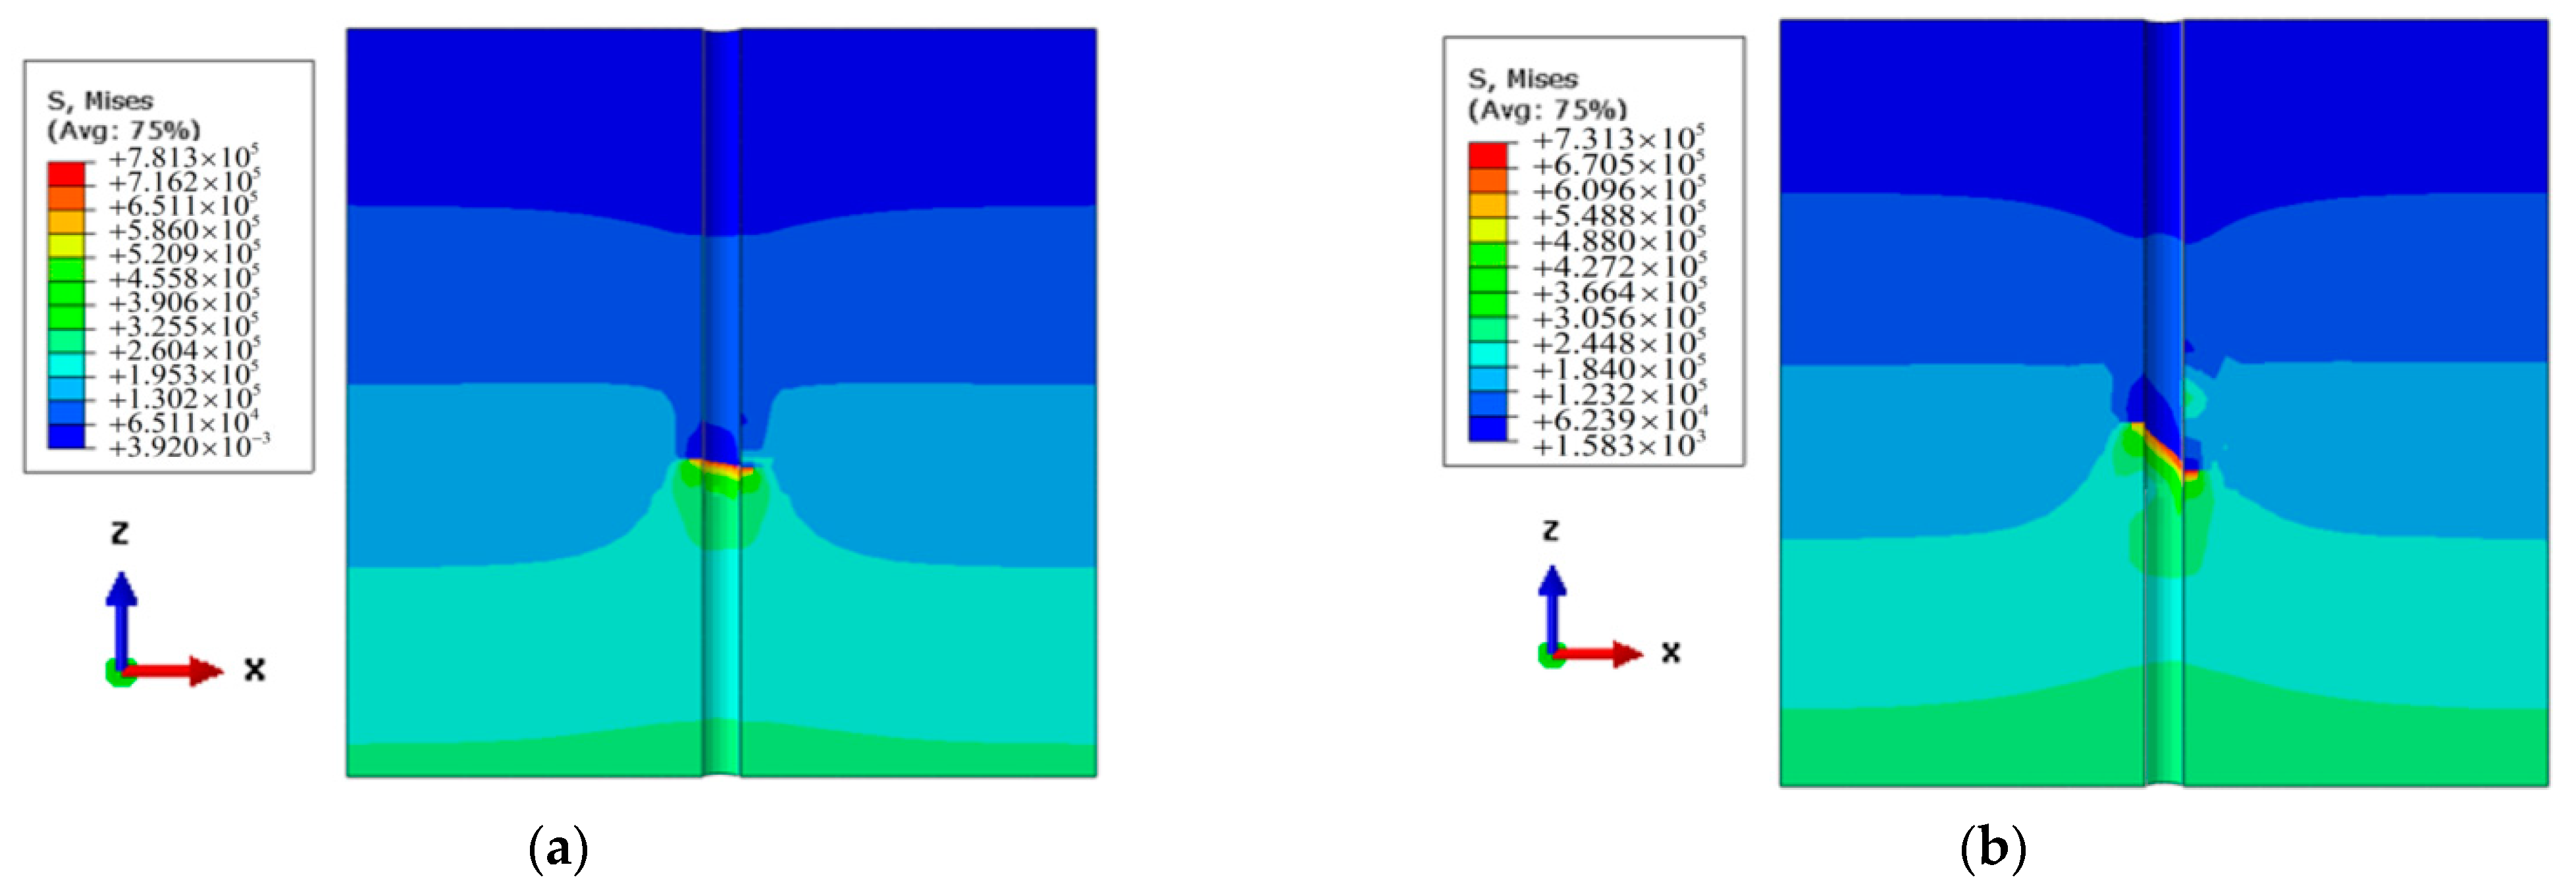
Figure 14.
Von Mises stress nephograms of P1 and P2 under the same indentation displacement. (a) P1; (b) P5.
Figure 14.
Von Mises stress nephograms of P1 and P2 under the same indentation displacement. (a) P1; (b) P5.
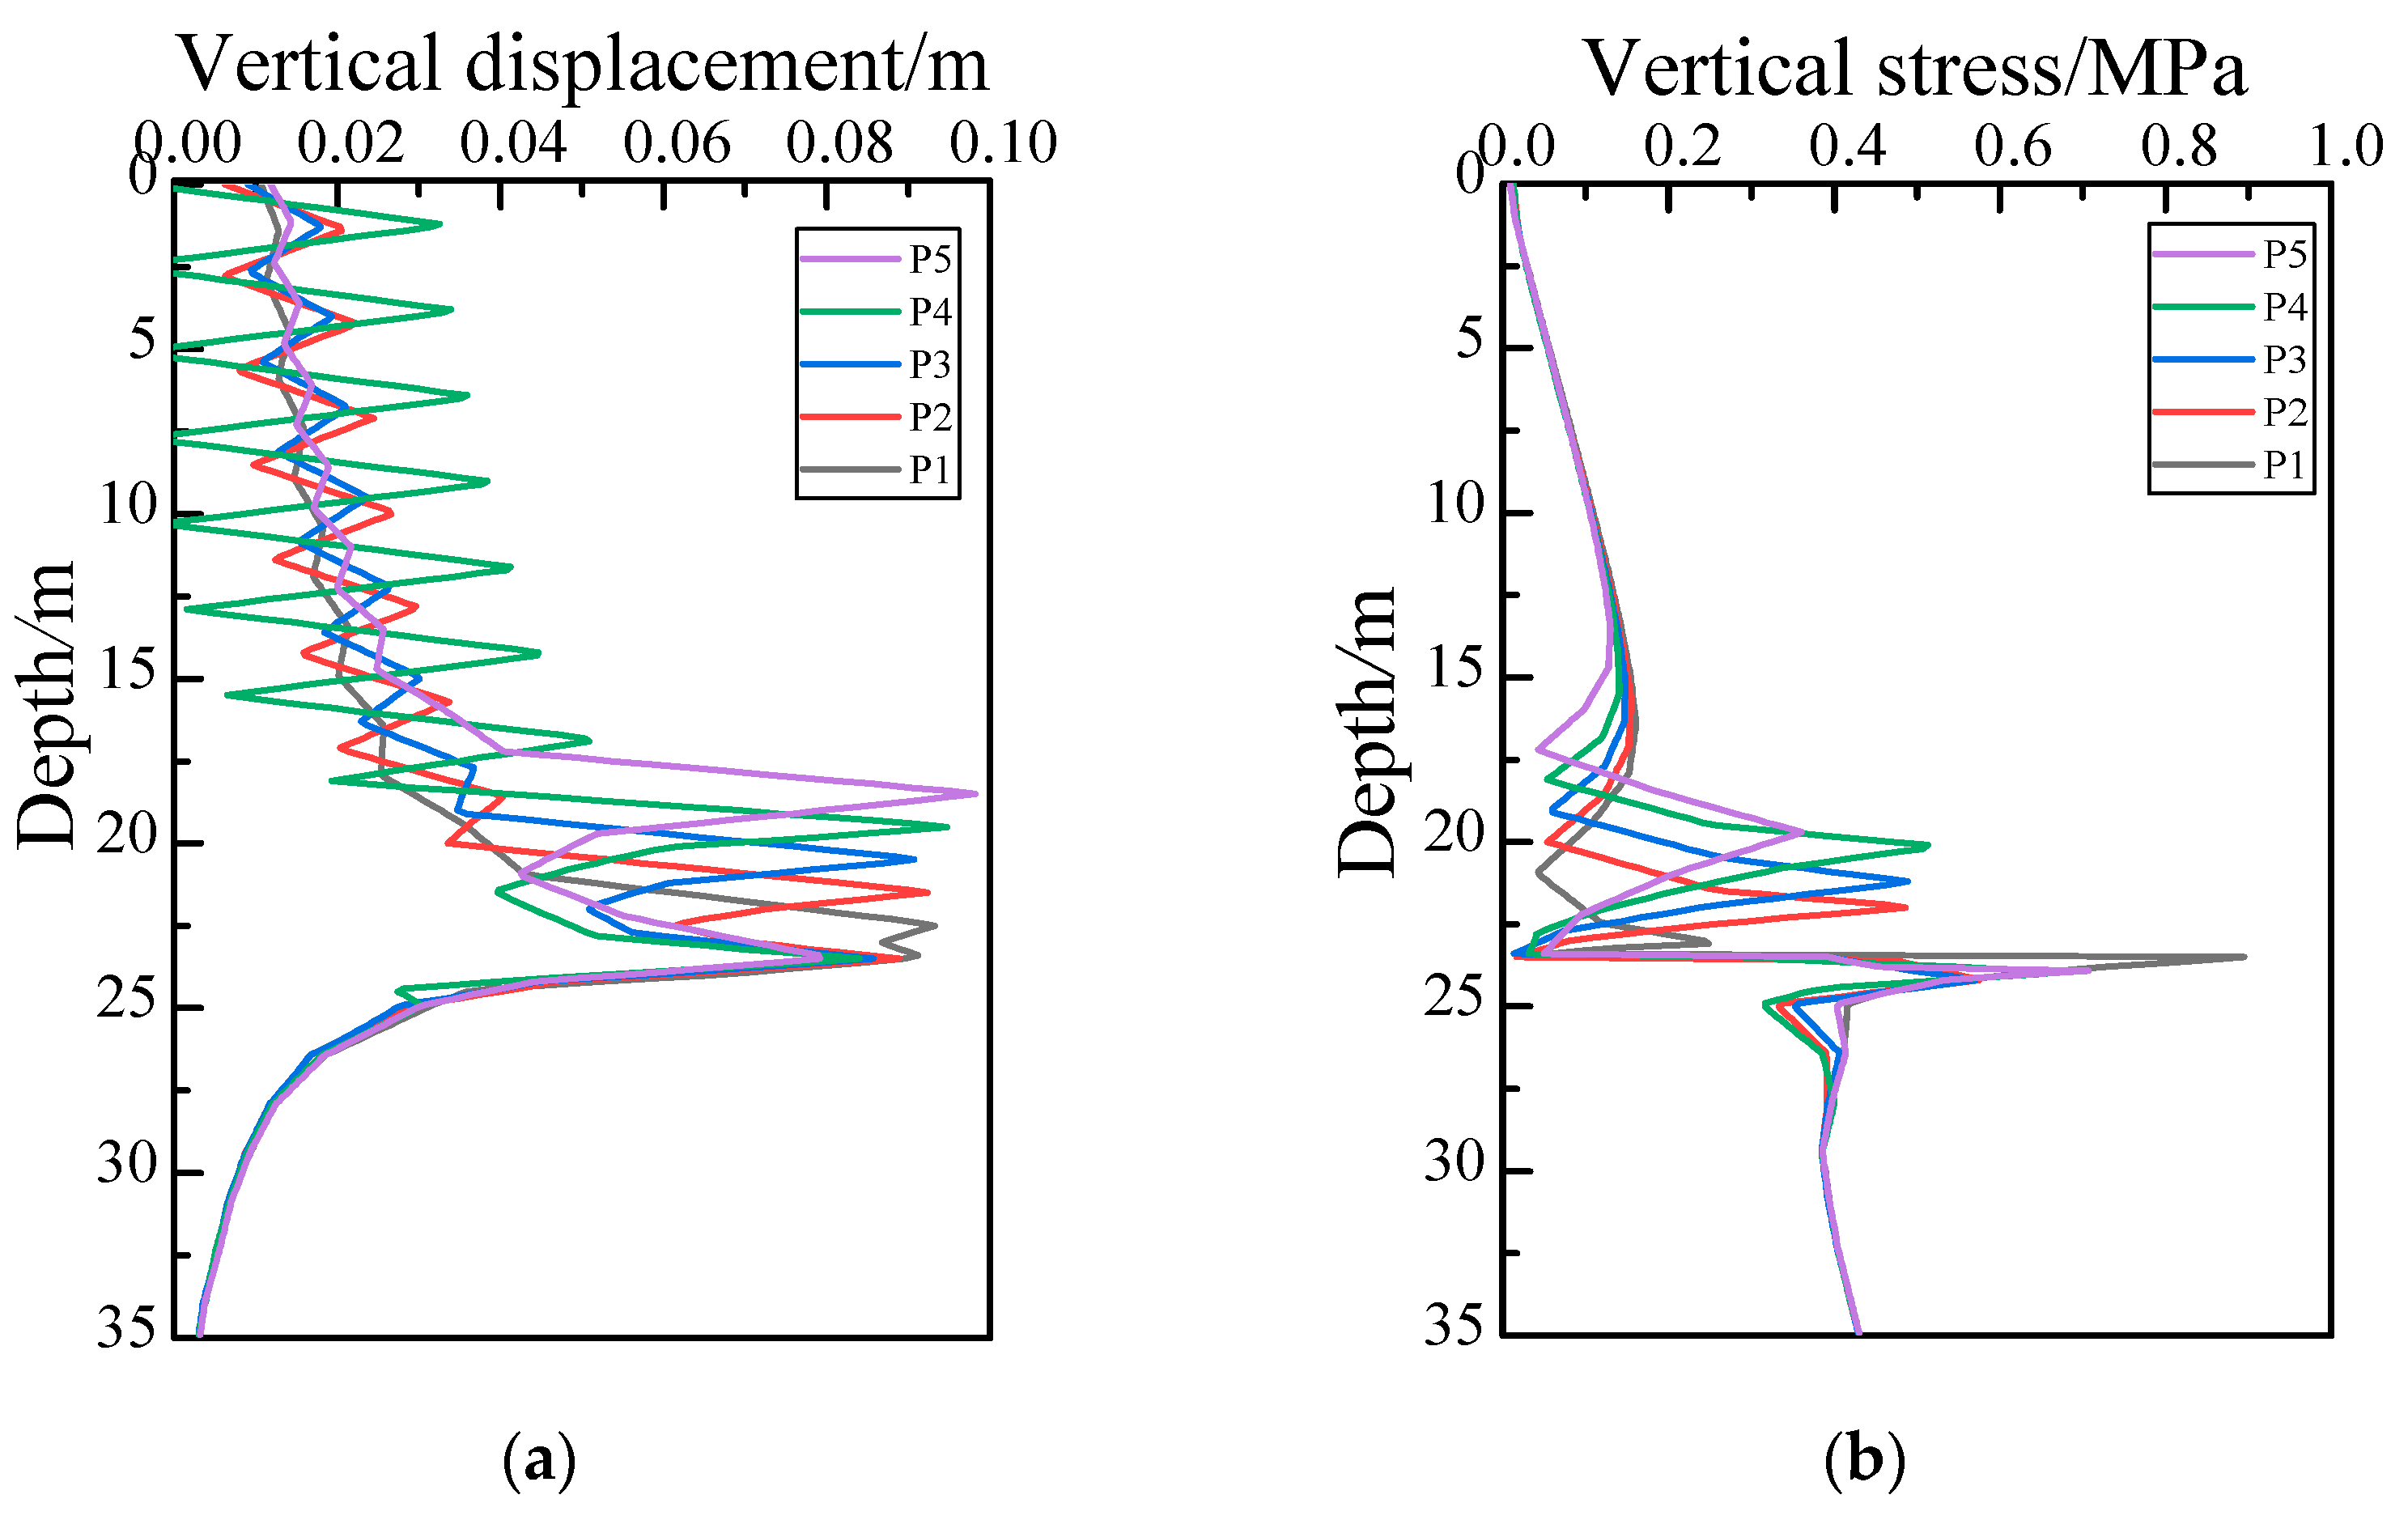
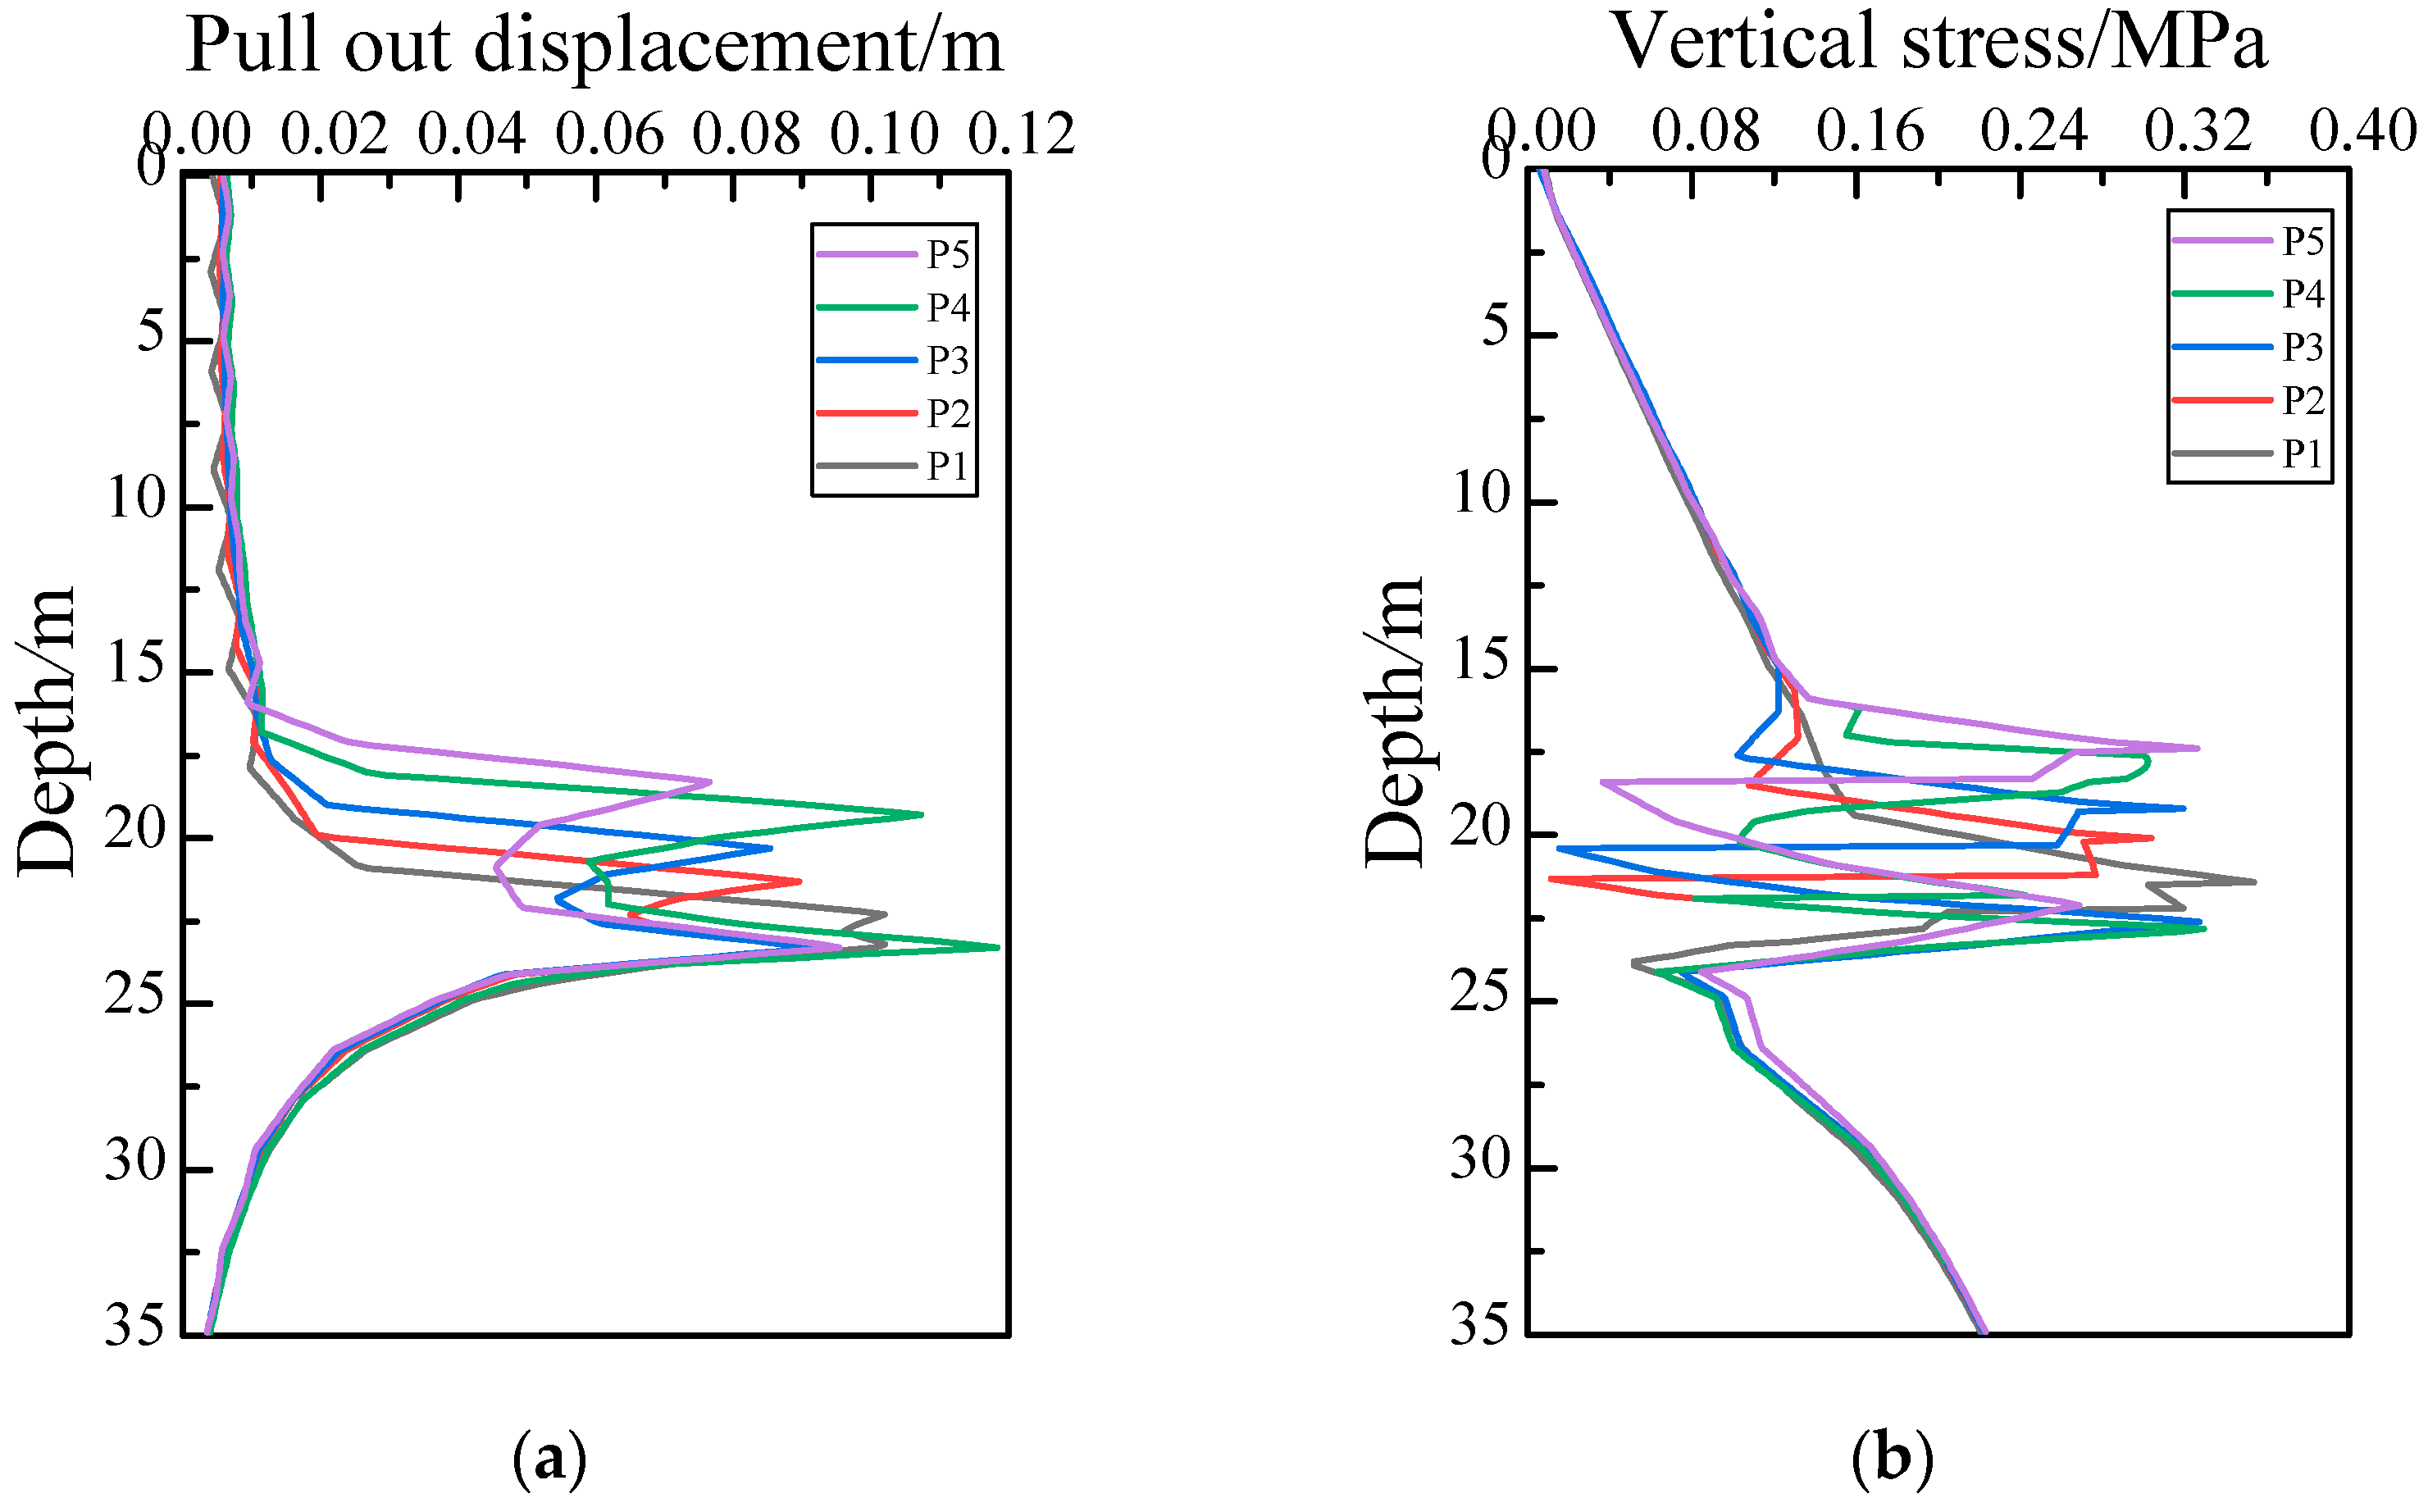
Figure 15.
Variation of displacement and stress with depth. (a) Indentation displacement–depth curves; (b) Stress–depth curves.
Figure 15.
Variation of displacement and stress with depth. (a) Indentation displacement–depth curves; (b) Stress–depth curves.
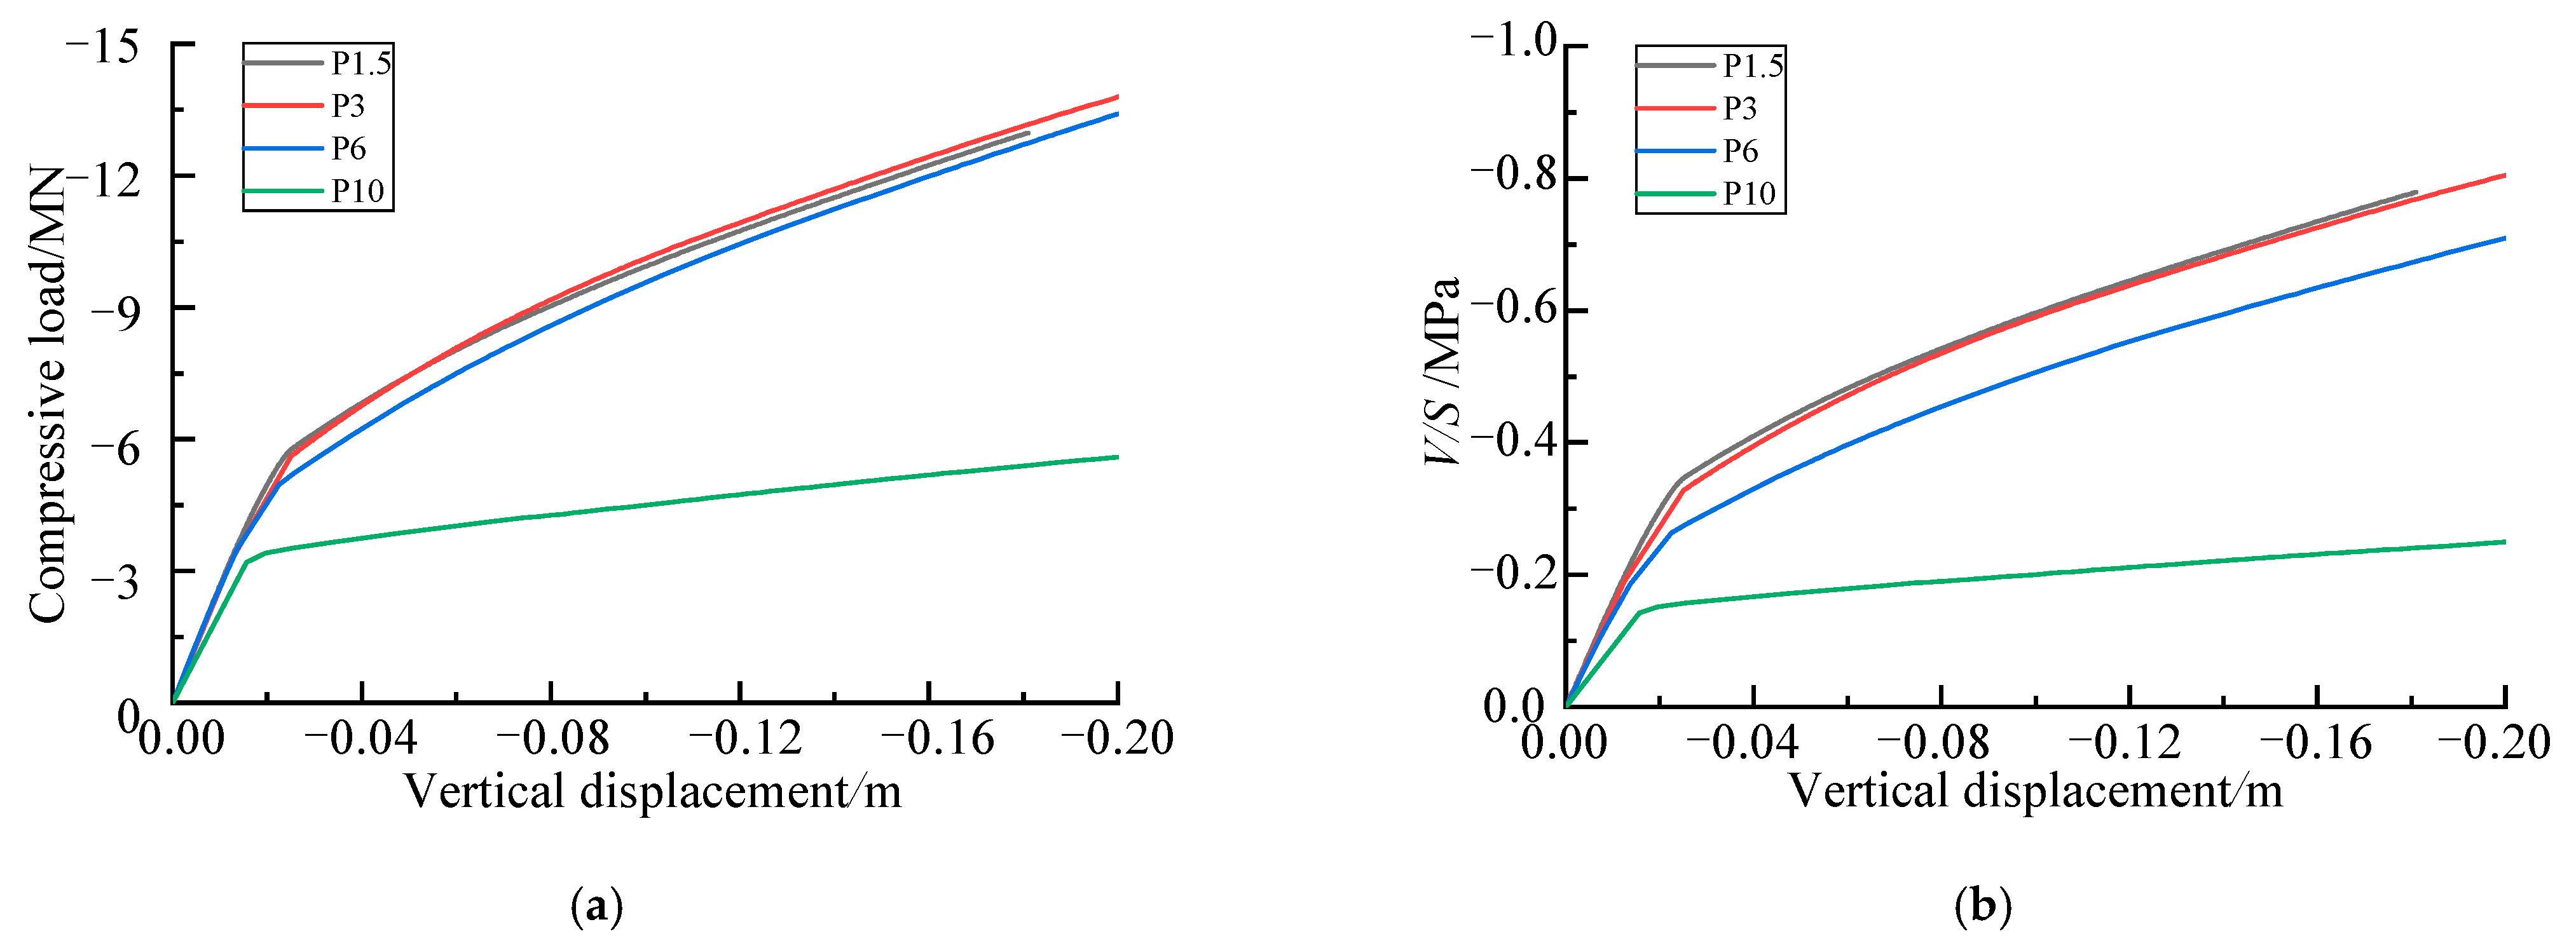
Figure 16.
Compression bearing characteristics curves. (a) Load-displacement curves; (b) V/S-displacement curves.
Figure 16.
Compression bearing characteristics curves. (a) Load-displacement curves; (b) V/S-displacement curves.
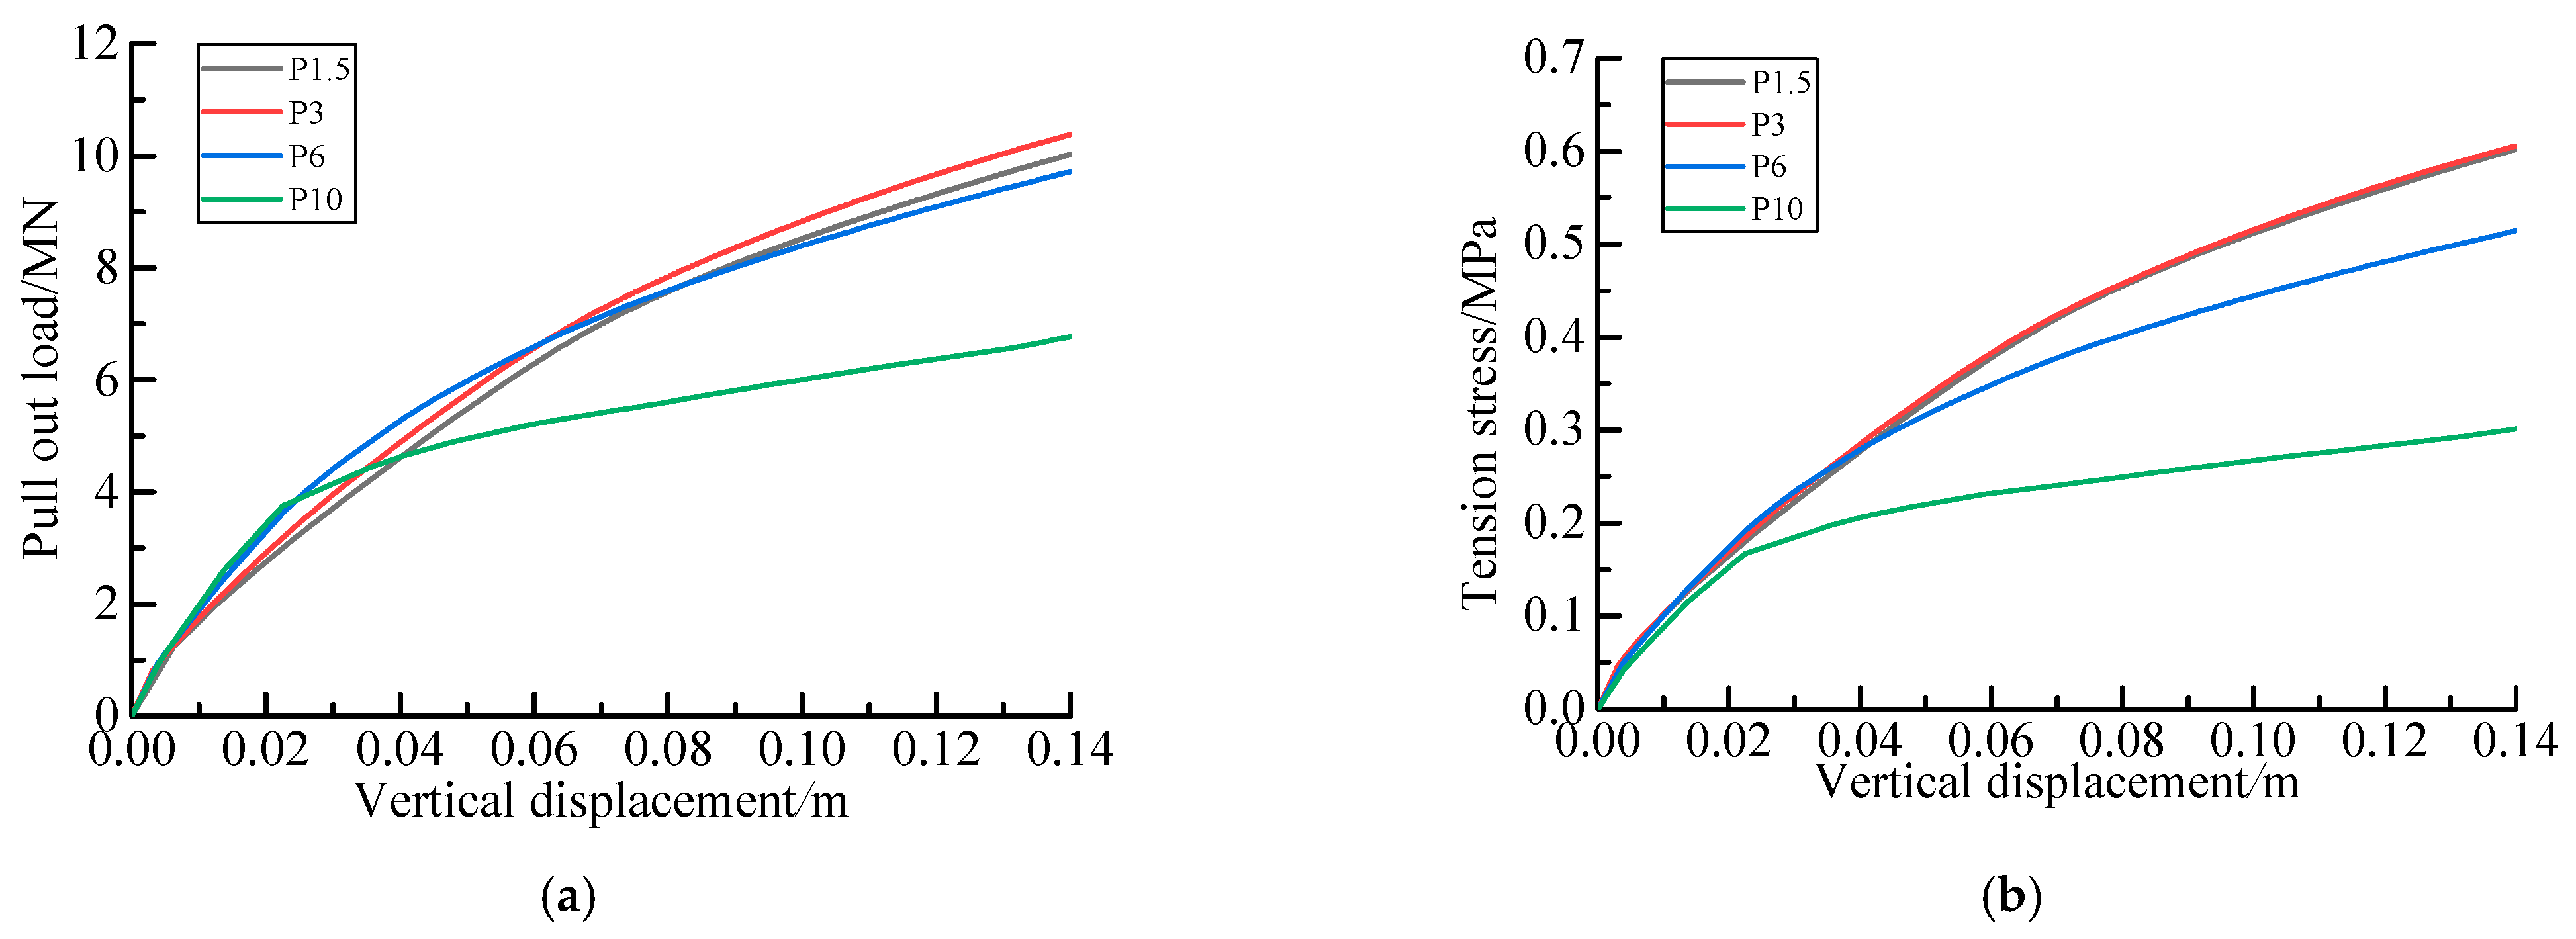
Figure 17.
Uplift bearing characteristics of helical pile with different pitches. (a) Load-displacement curves; (b) V/S-displacement curves.
Figure 17.
Uplift bearing characteristics of helical pile with different pitches. (a) Load-displacement curves; (b) V/S-displacement curves.
Figure 18.
Displacement and stress distribution of soil outside pile along the depth direction. (a) P2; (b) P3.
Figure 18.
Displacement and stress distribution of soil outside pile along the depth direction. (a) P2; (b) P3.
Figure 19.
Uplift bearing characteristics of helical pile. (a) Load-displacement curves; (b) V/S-displacement curves.
Figure 19.
Uplift bearing characteristics of helical pile. (a) Load-displacement curves; (b) V/S-displacement curves.
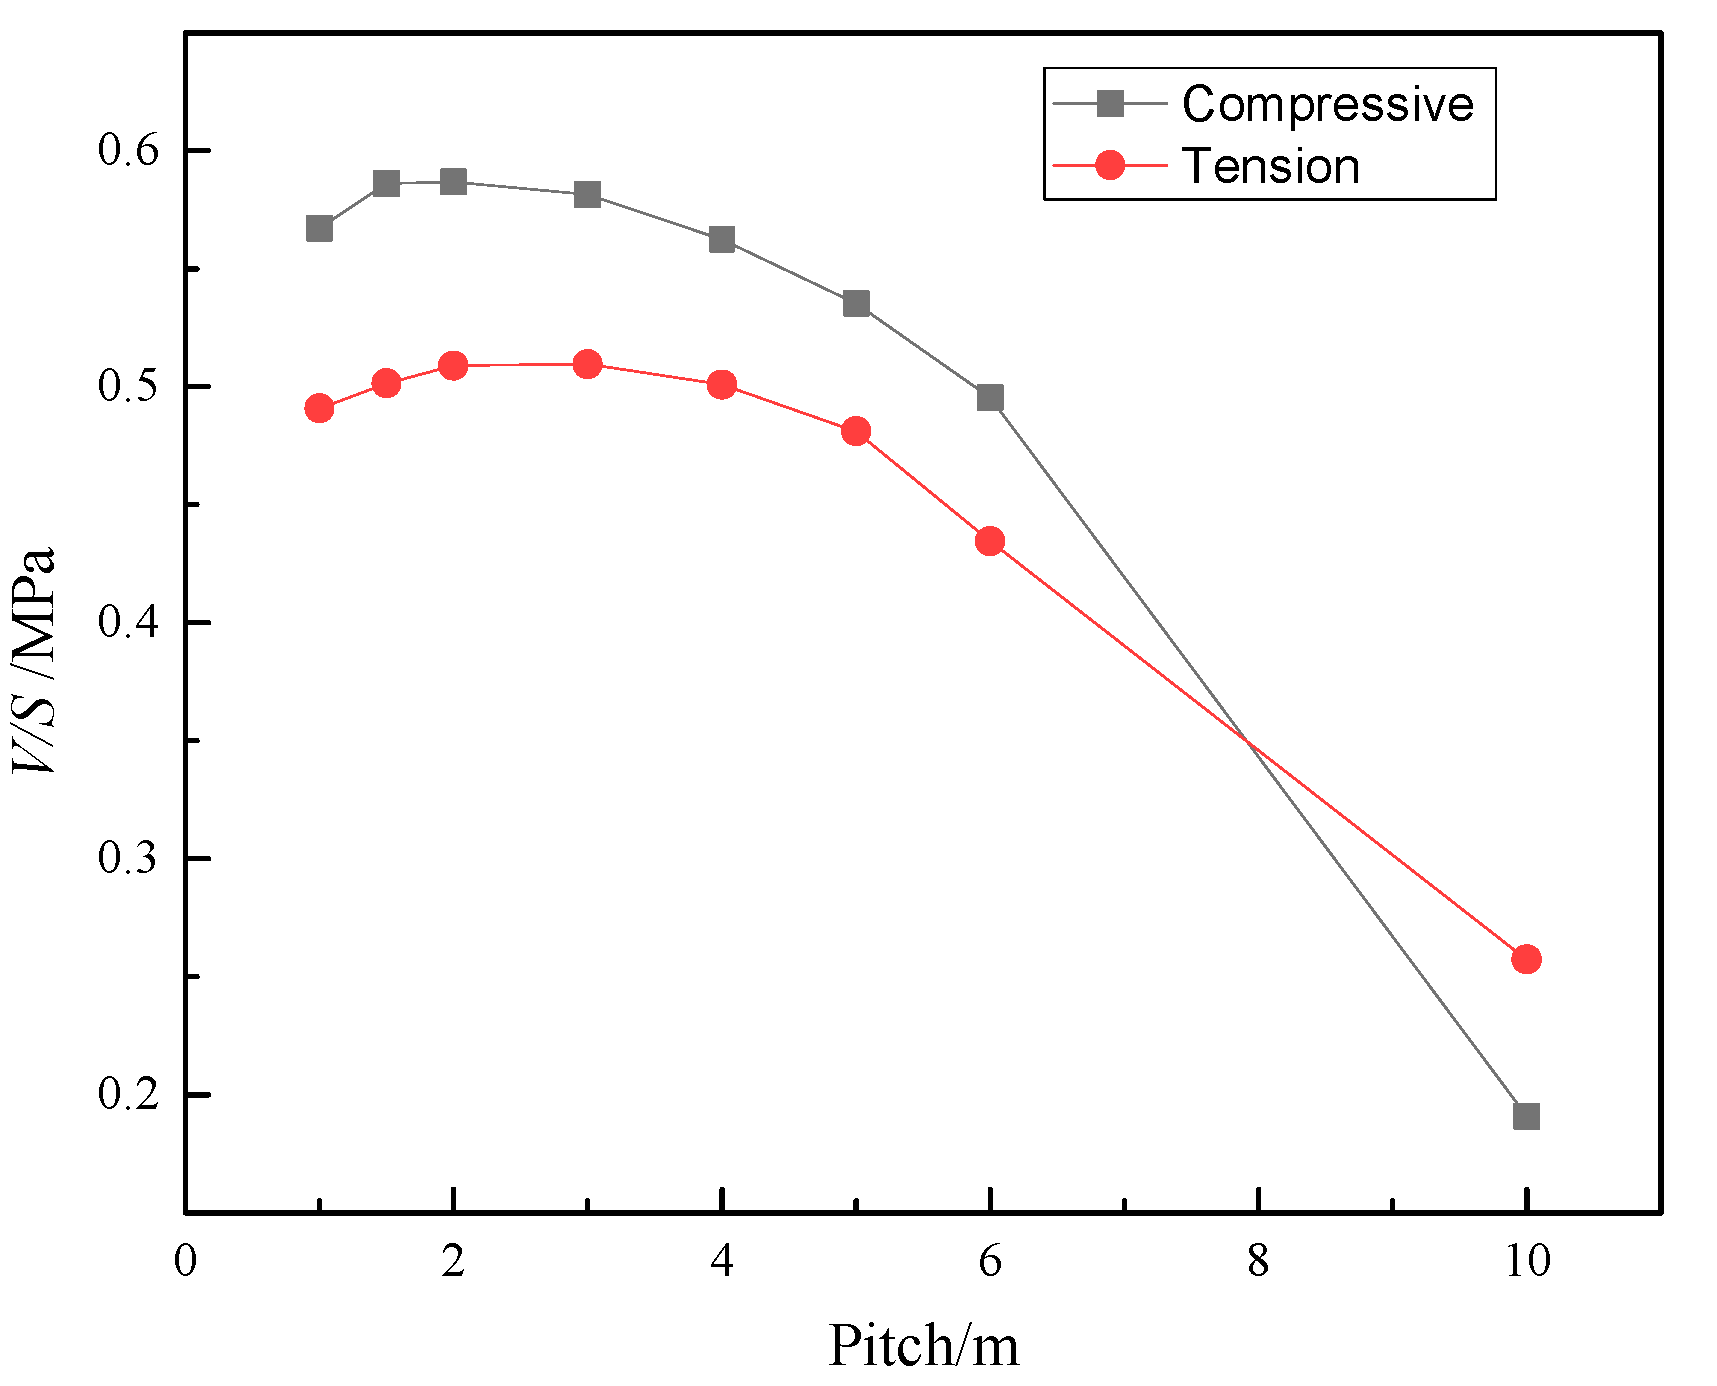
Figure 20.
V/S ratio of helical pile with different pitches at displacement of 0.1 m.
Figure 20.
V/S ratio of helical pile with different pitches at displacement of 0.1 m.
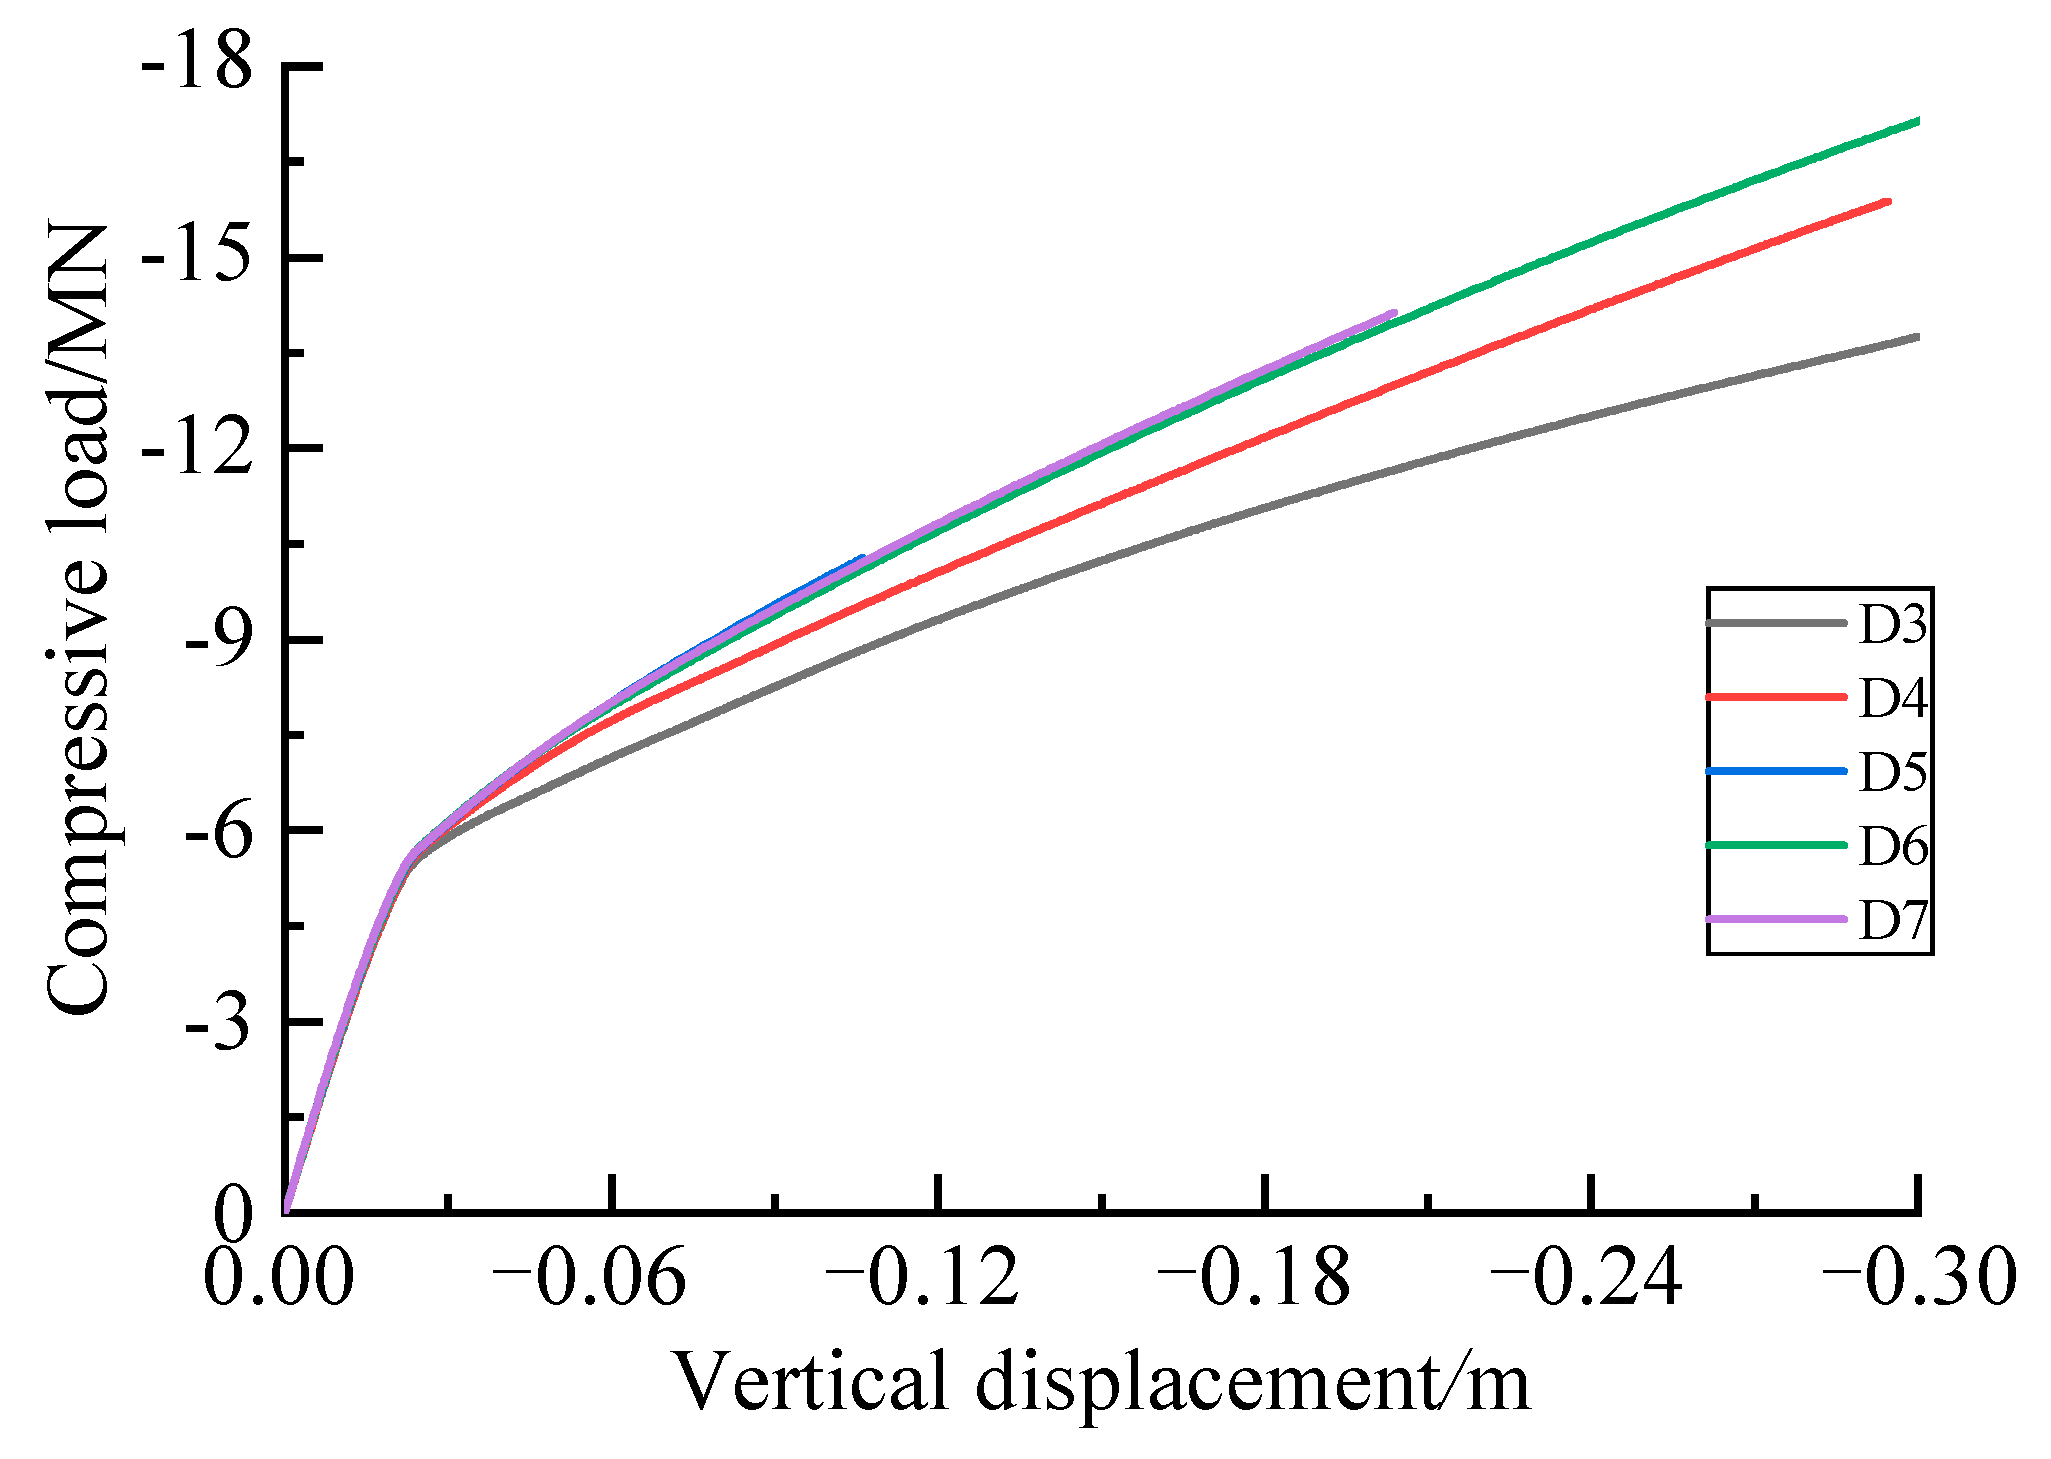
Figure 21.
Compressive load-displacement curves of helical pile with various diameters.
Figure 21.
Compressive load-displacement curves of helical pile with various diameters.
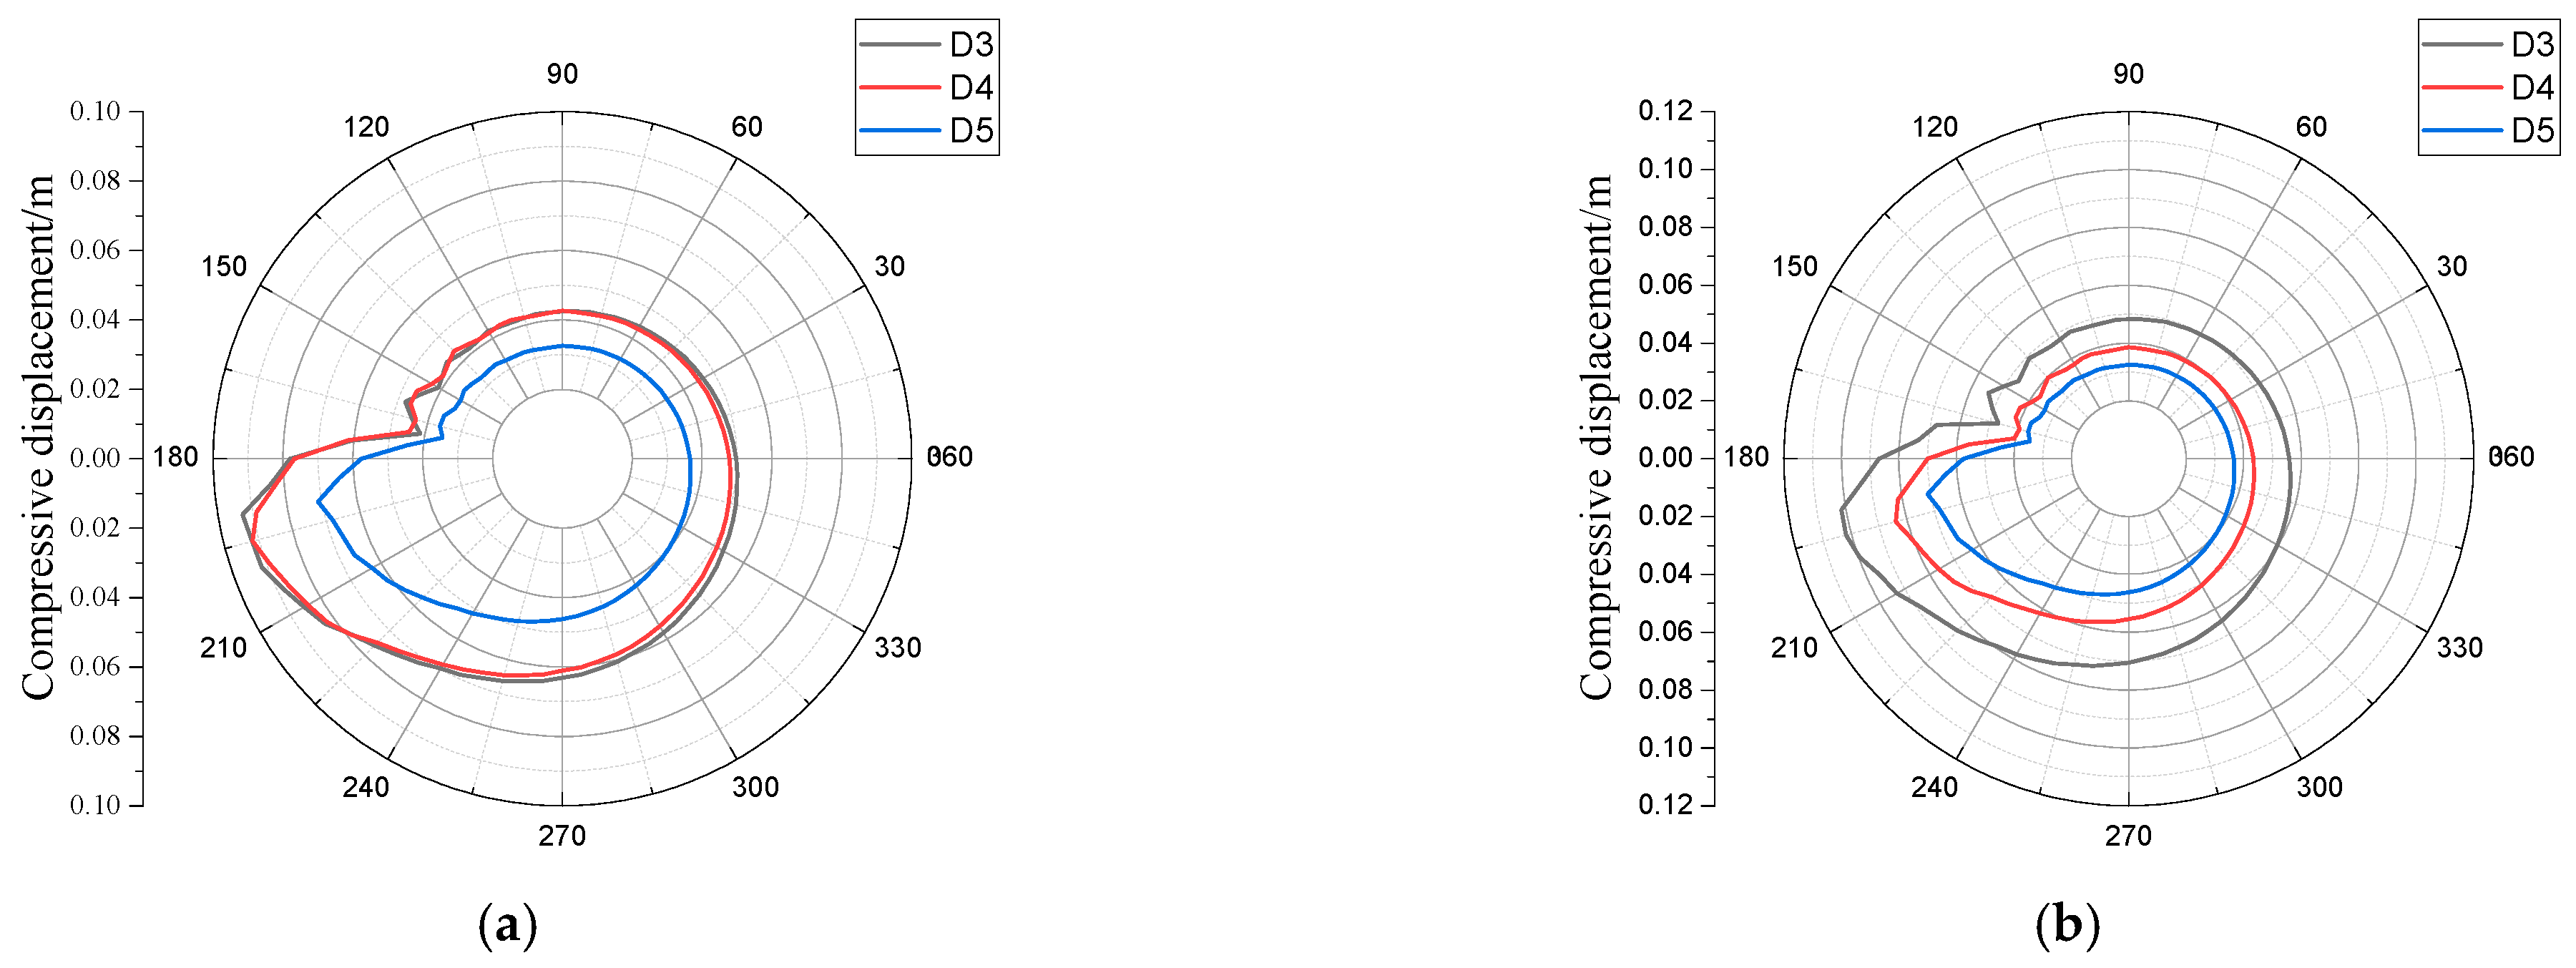
Figure 22.
Distribution of soil displacement outside pile under compression and bearing load. (a) Displacement under compression of 0.1 m; (b) 9 MN compressive load.
Figure 22.
Distribution of soil displacement outside pile under compression and bearing load. (a) Displacement under compression of 0.1 m; (b) 9 MN compressive load.
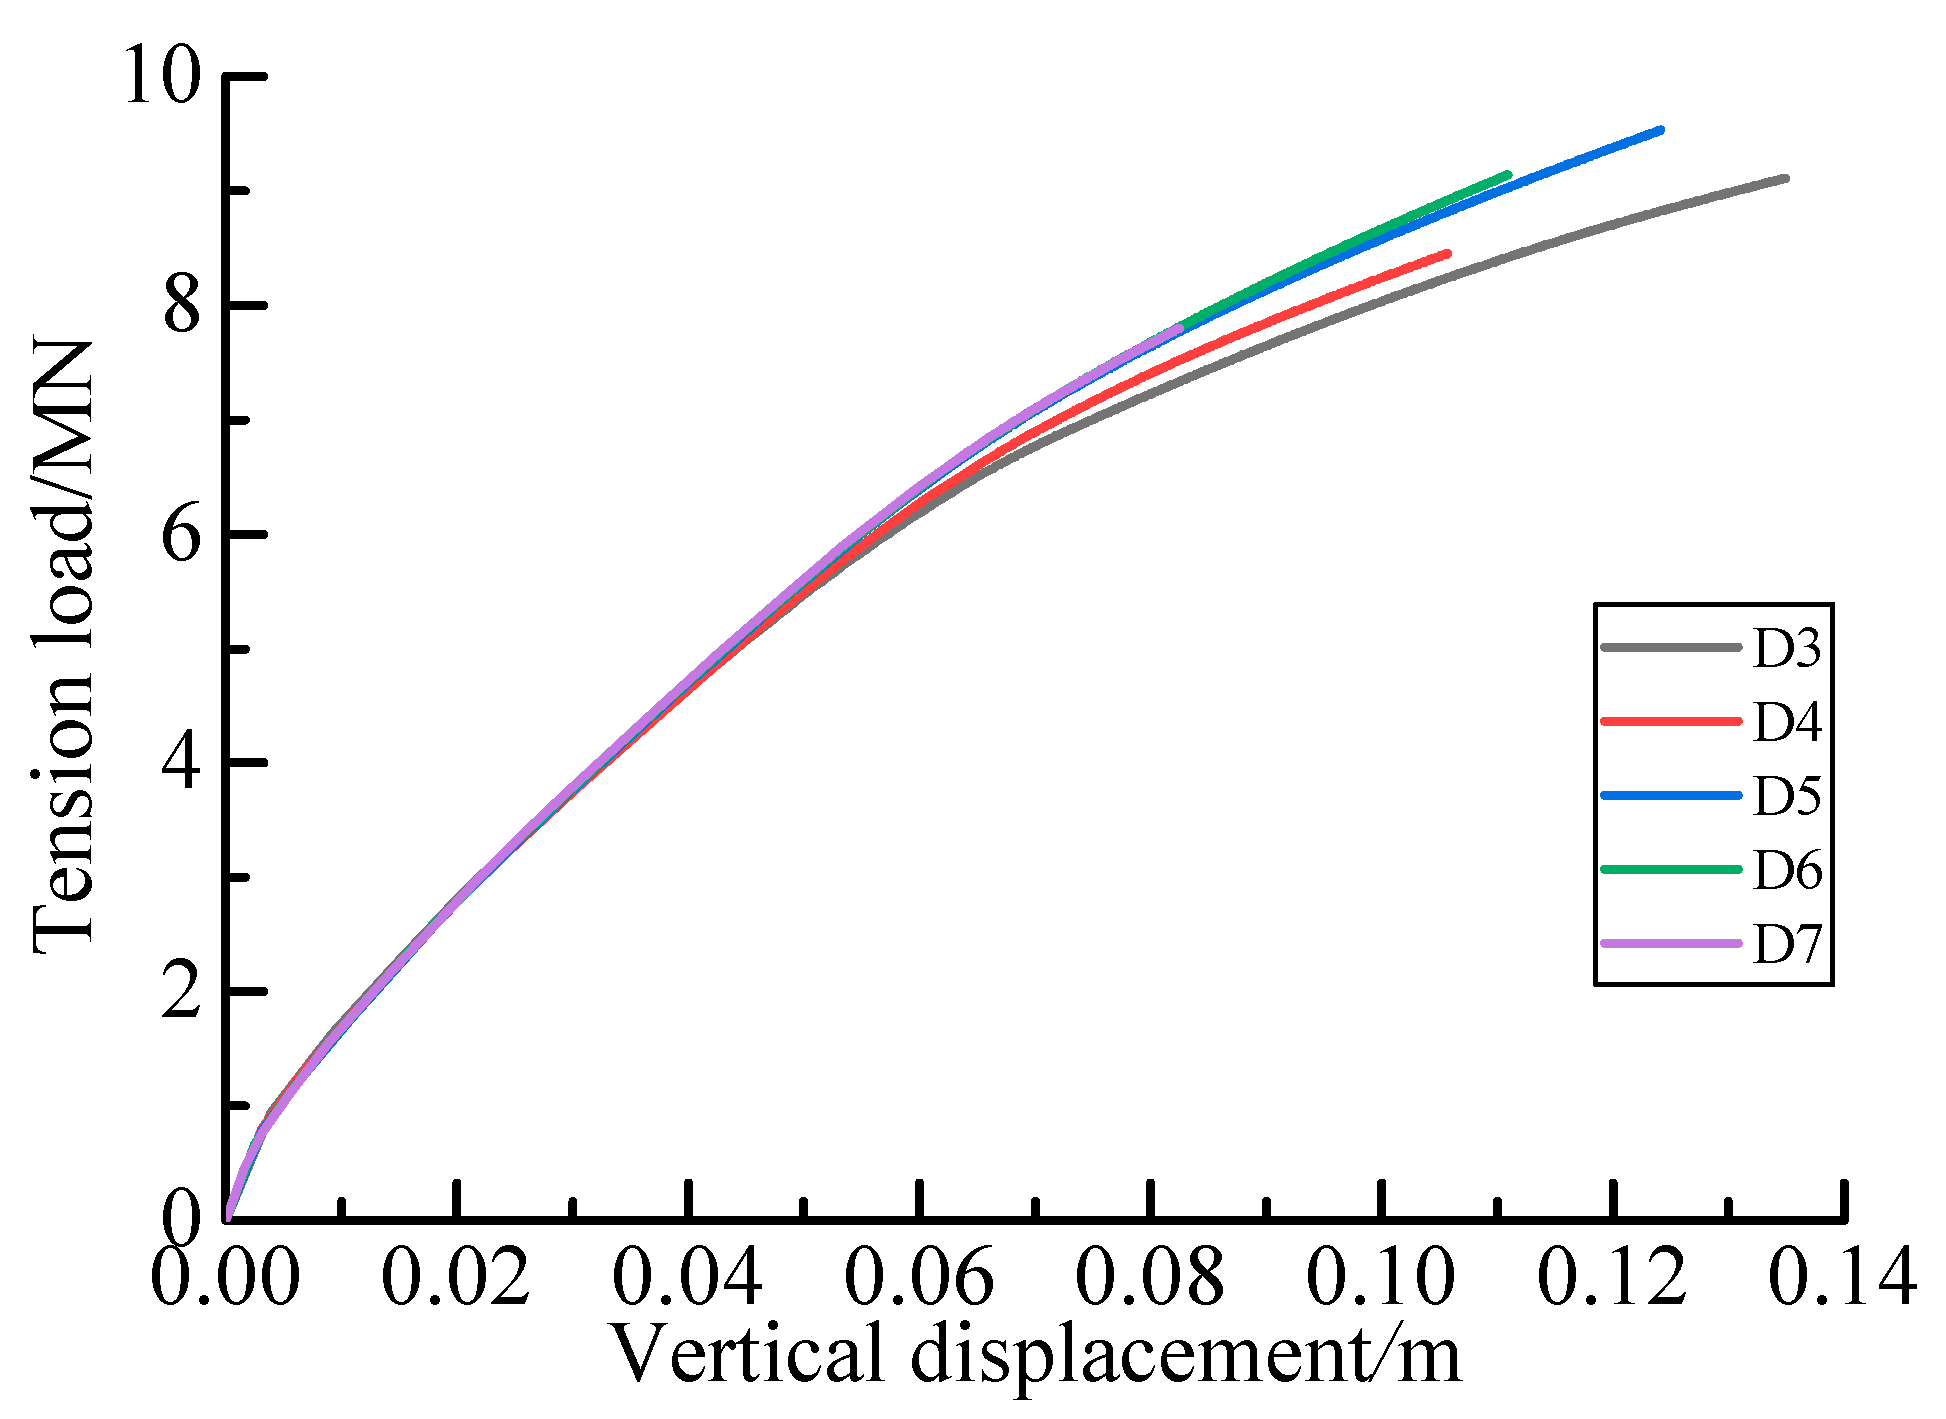
Figure 23.
Uplift load-displacement curves of screw piles with various blade diameters.
Figure 23.
Uplift load-displacement curves of screw piles with various blade diameters.
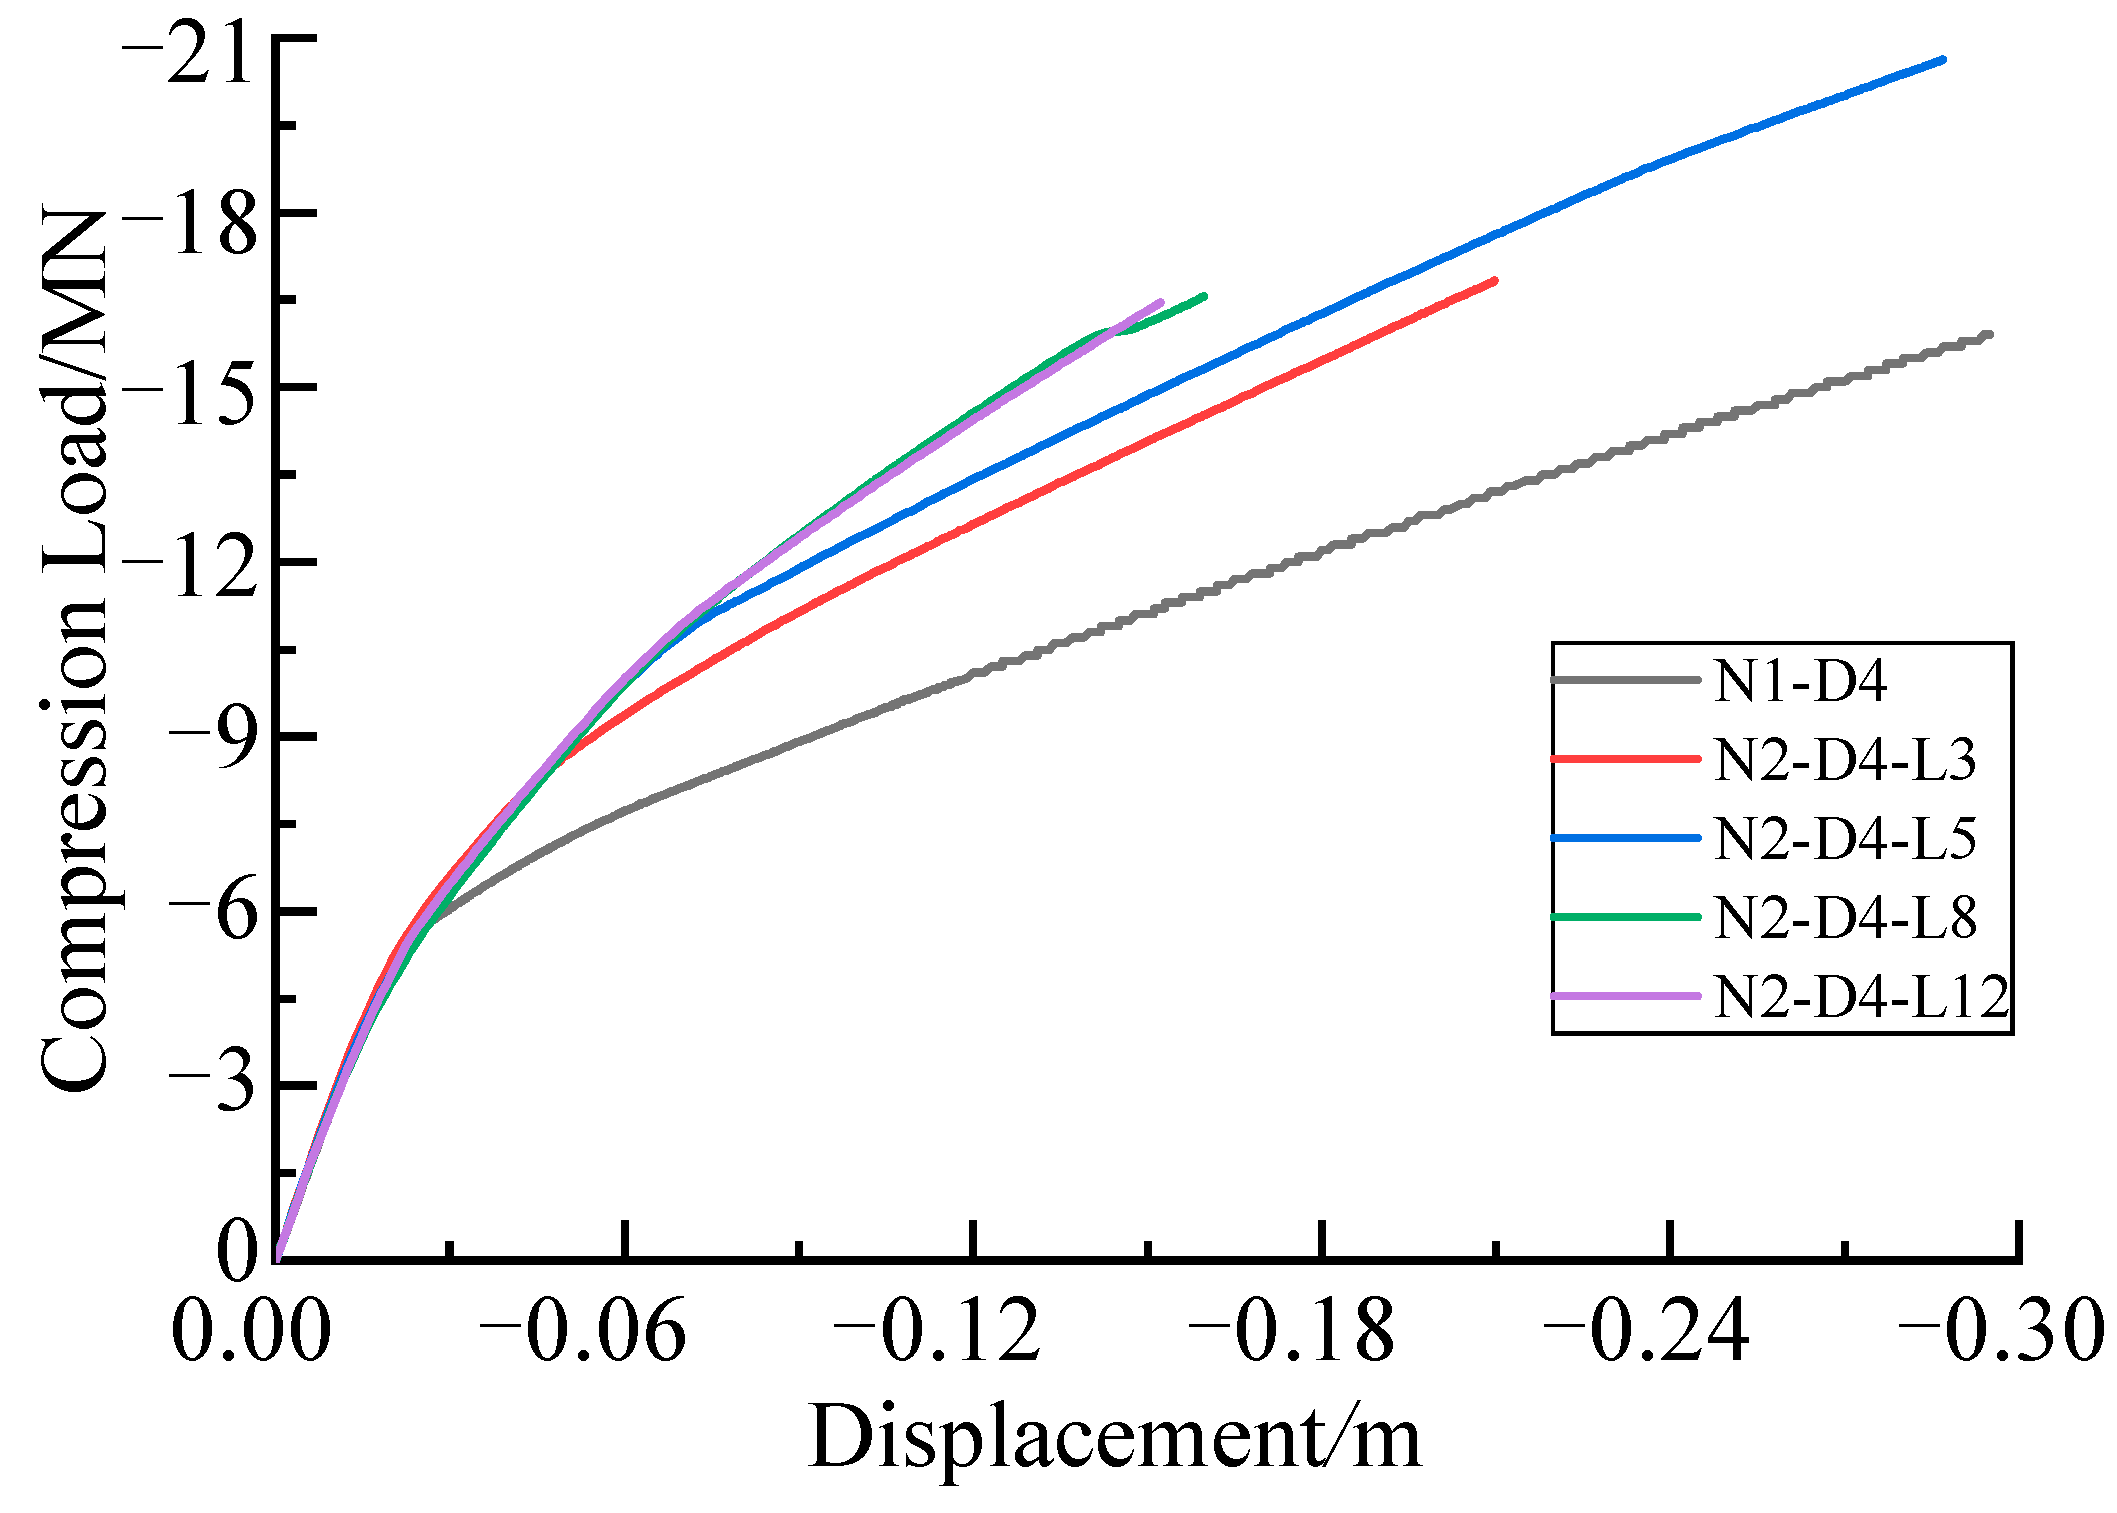
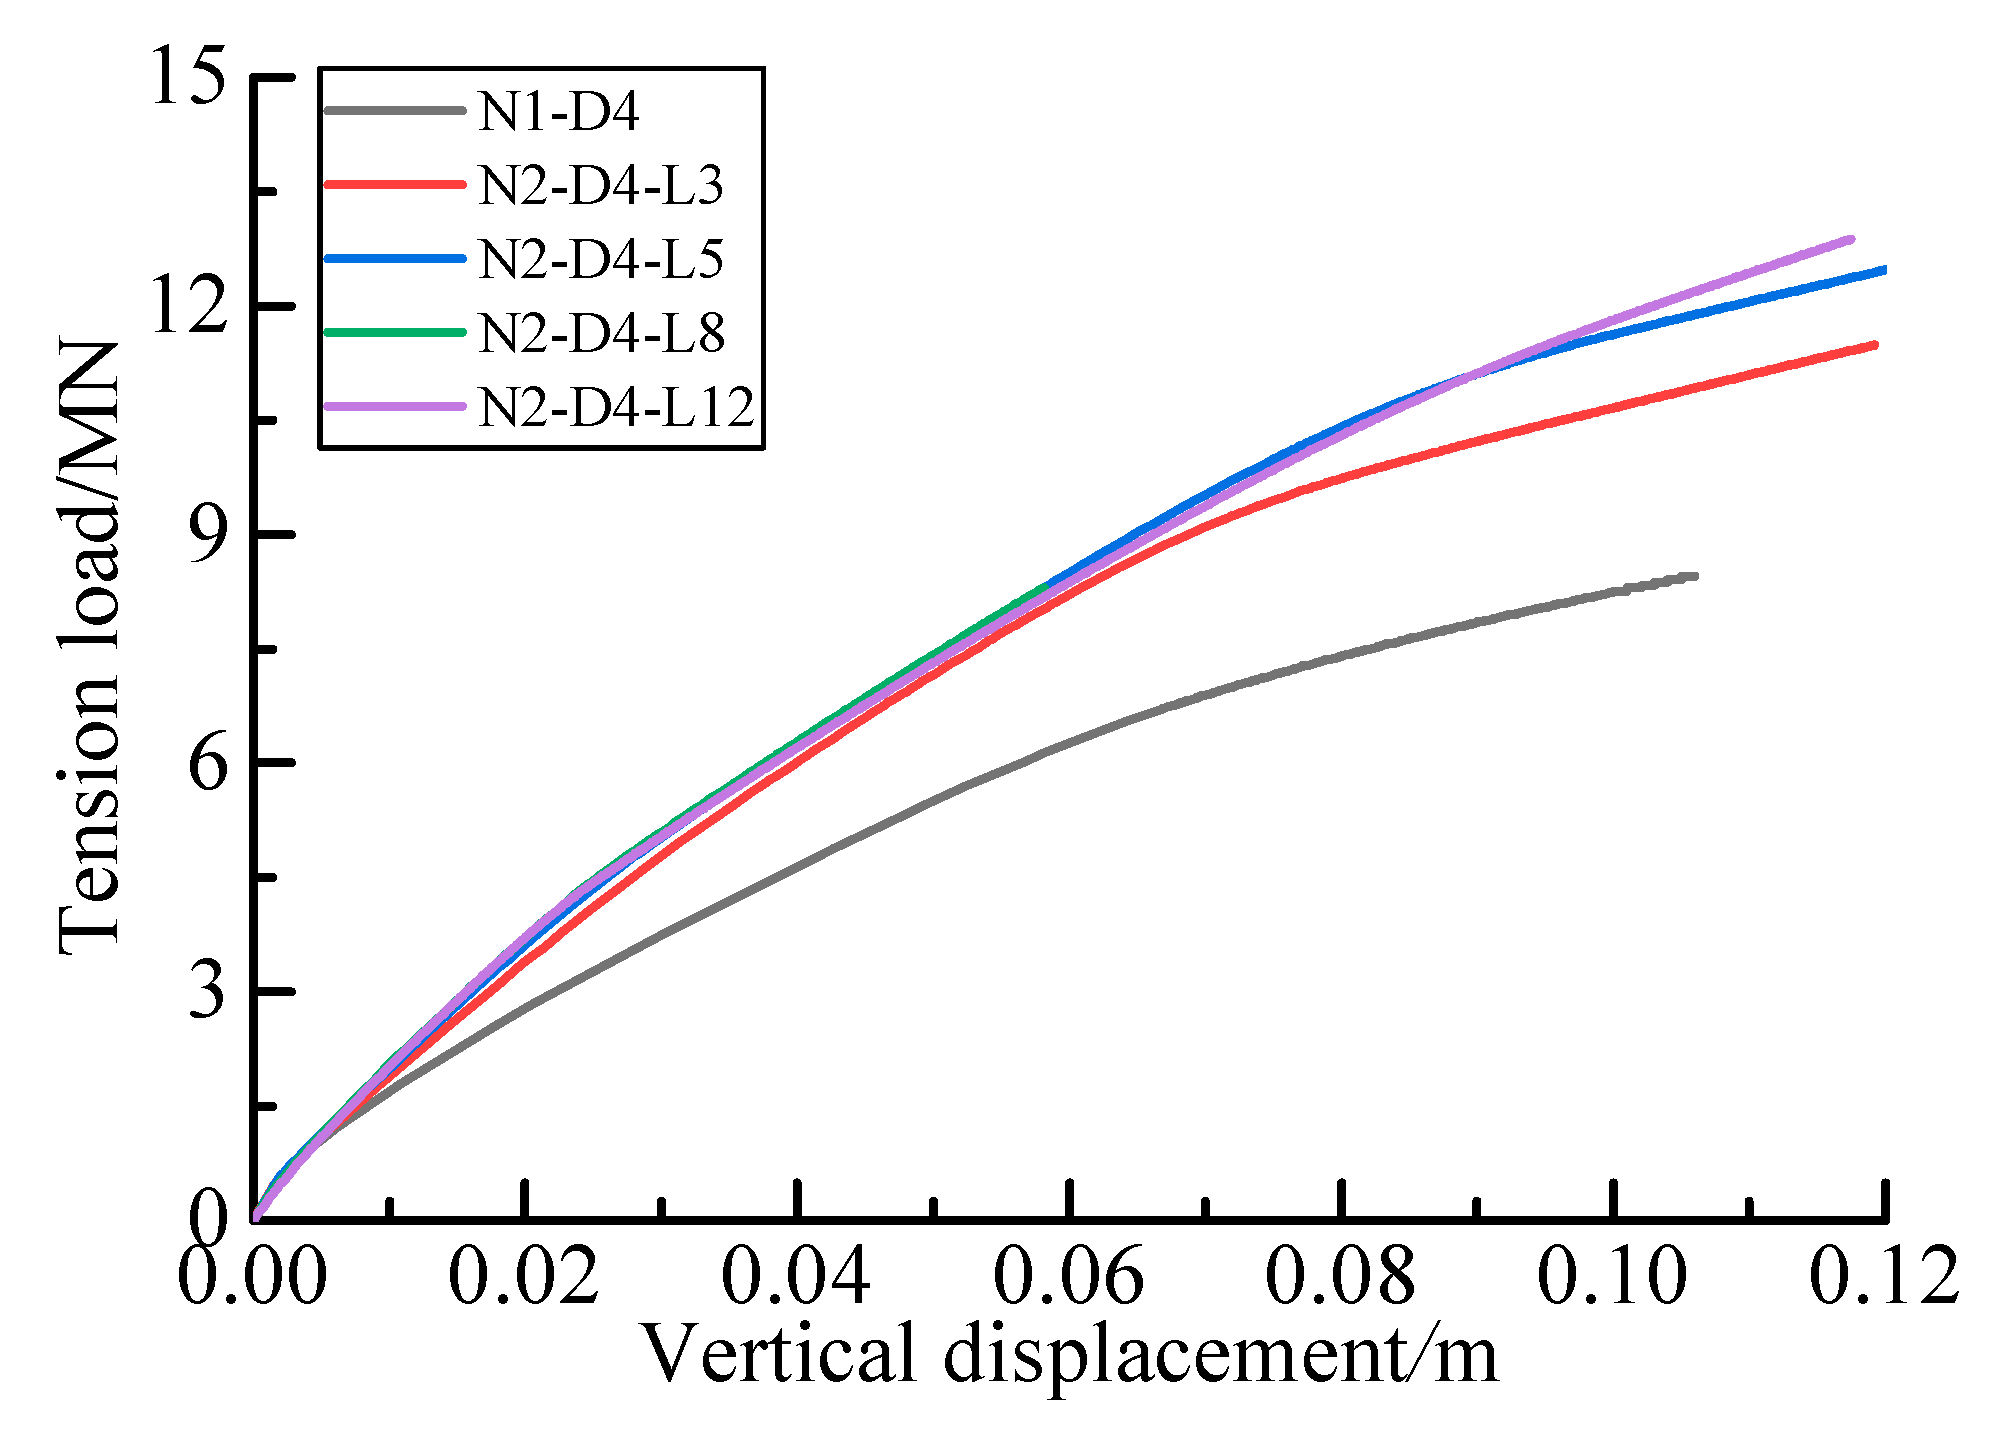
Figure 24.
Compressive load-displacement curves (D/d = 2, n = 2).
Figure 24.
Compressive load-displacement curves (D/d = 2, n = 2).
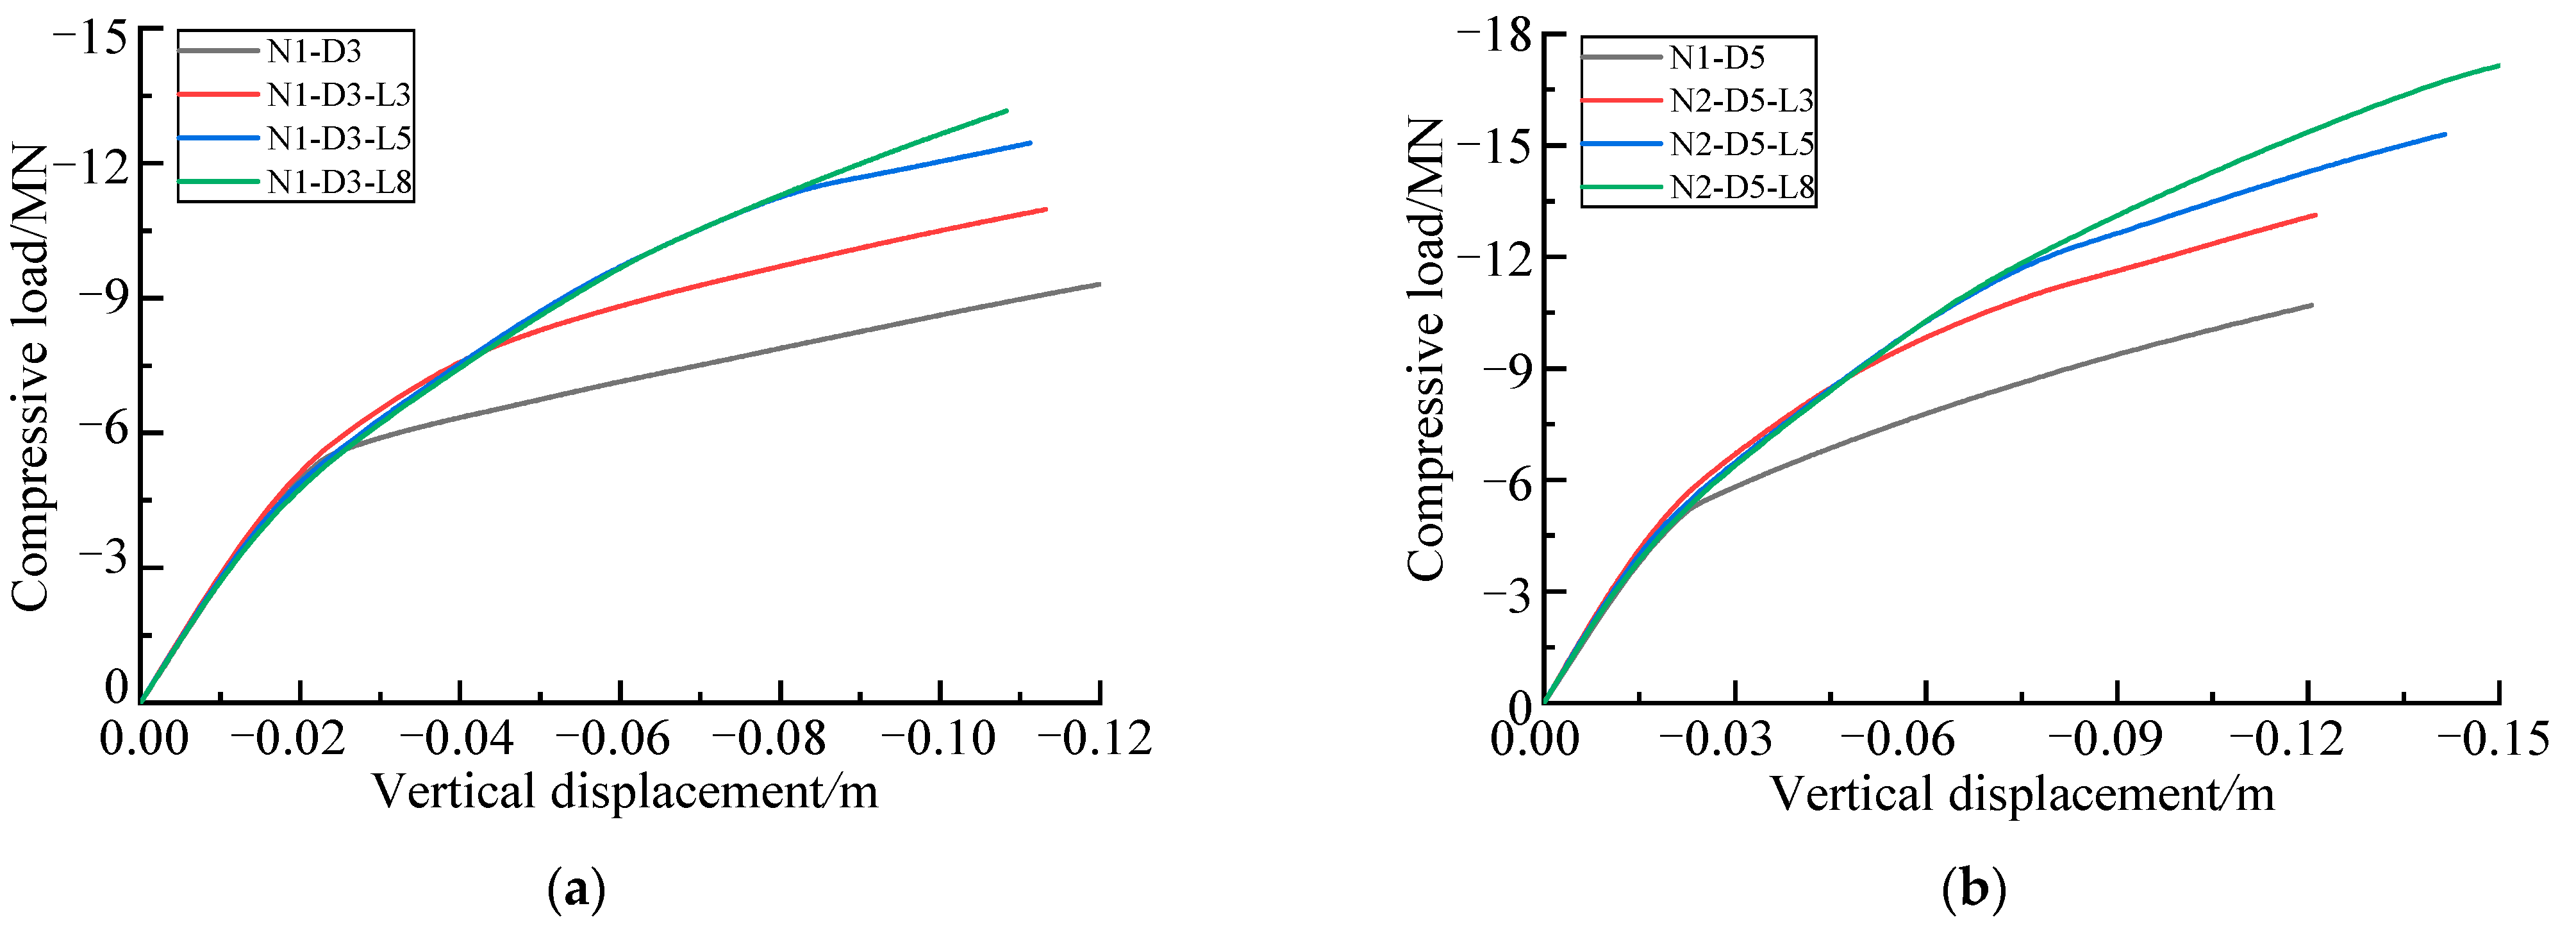
Figure 25.
Compressive load-displacement curves with various blade spacing l/D. (a) D/d = 1.5, n = 2; (b) D/d = 2.5, n = 2.
Figure 25.
Compressive load-displacement curves with various blade spacing l/D. (a) D/d = 1.5, n = 2; (b) D/d = 2.5, n = 2.
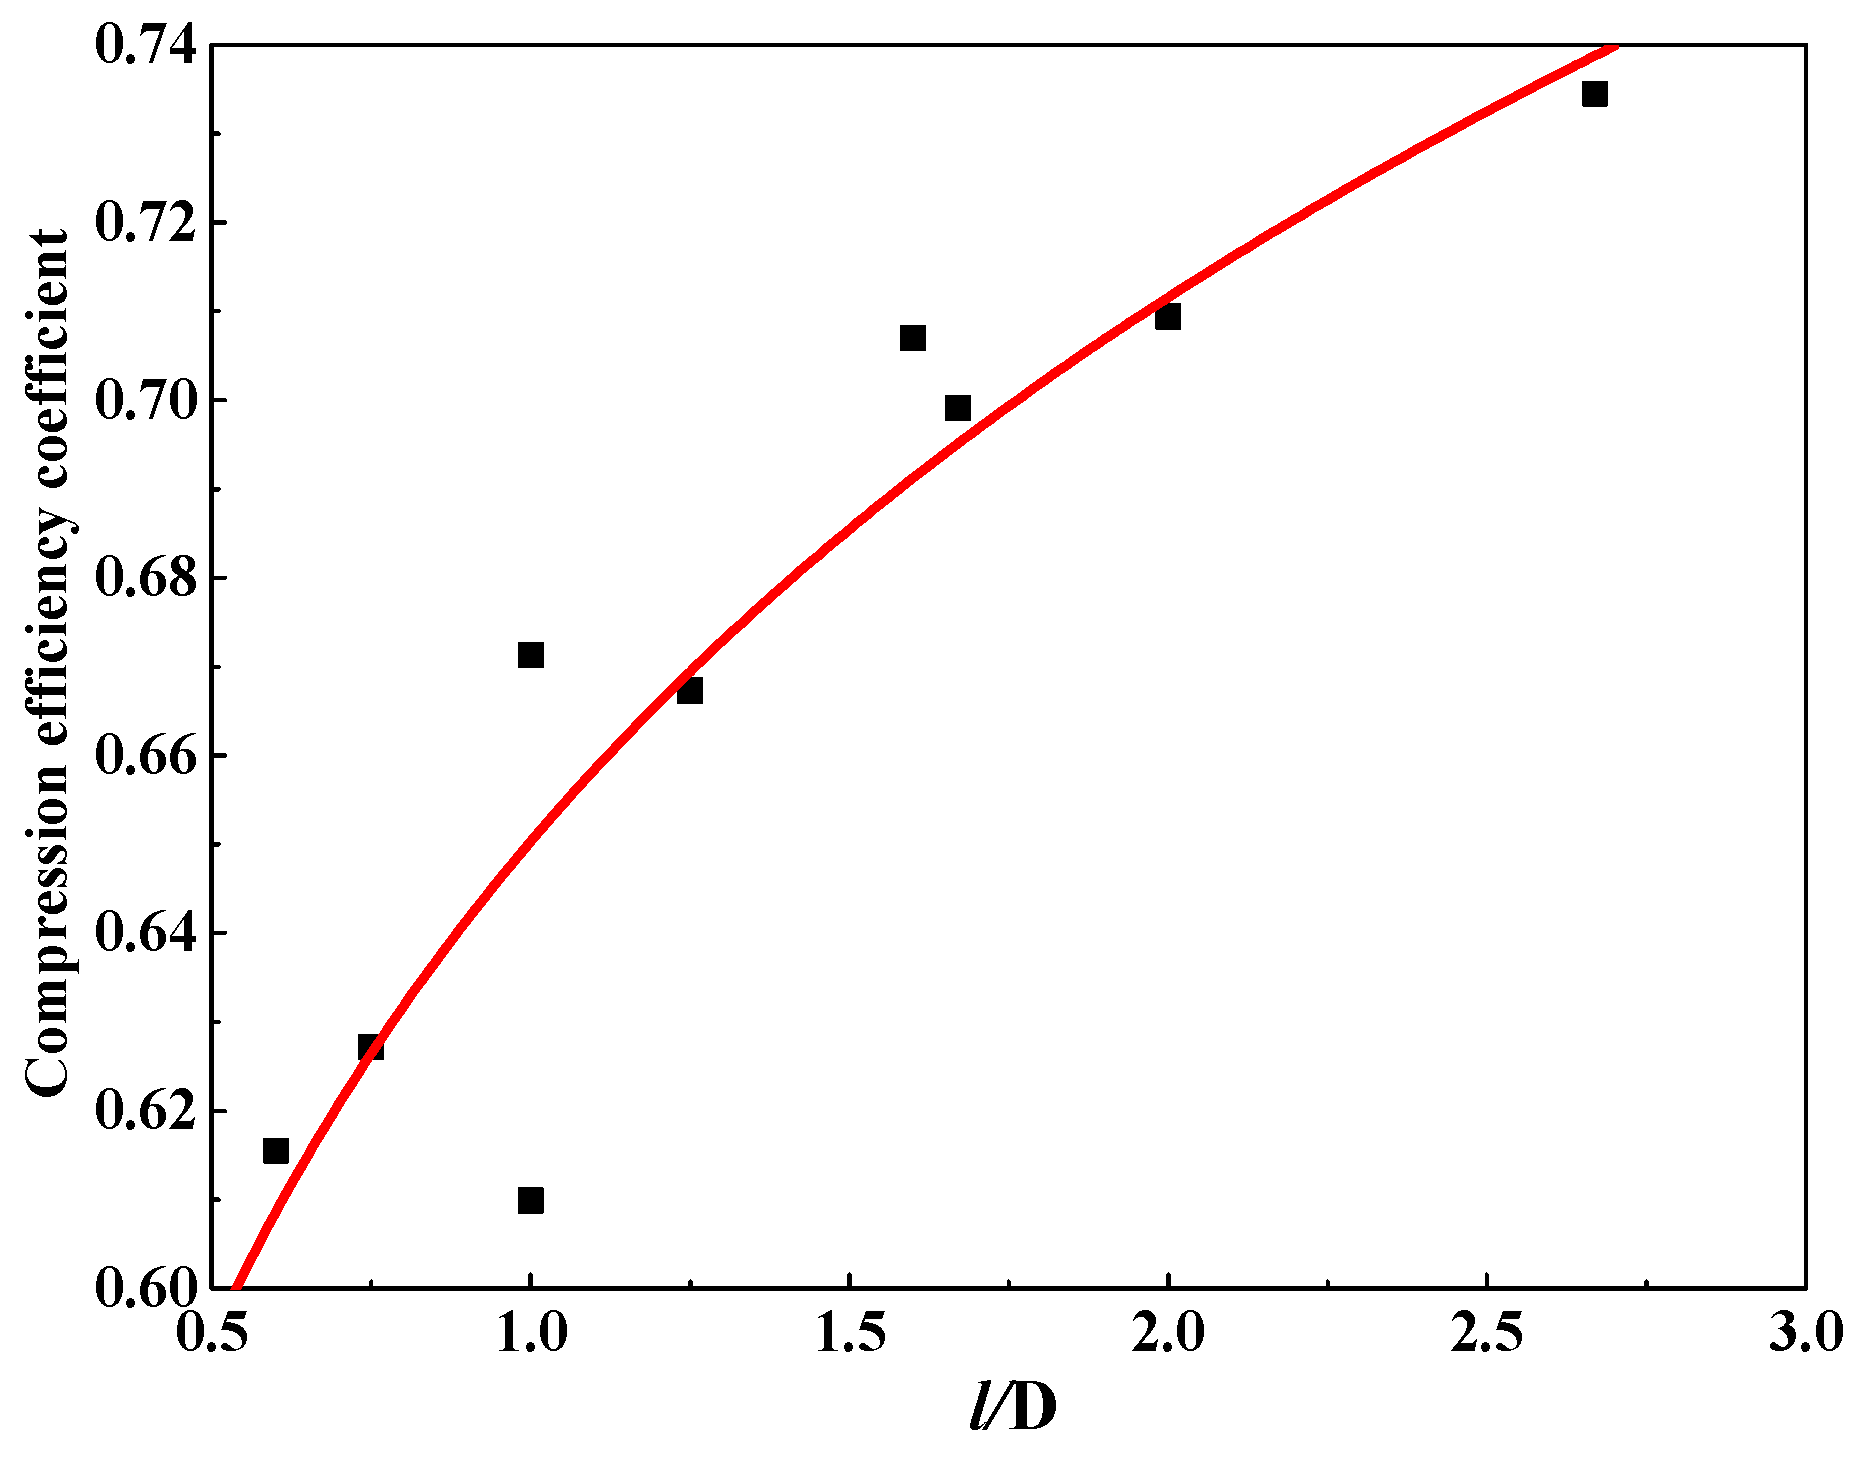
Figure 26.
Correlation between compression efficiency coefficient and blade spacing.
Figure 26.
Correlation between compression efficiency coefficient and blade spacing.
Figure 27.
Uplift load-displacement curves (D/d = 2, n = 2).
Figure 27.
Uplift load-displacement curves (D/d = 2, n = 2).
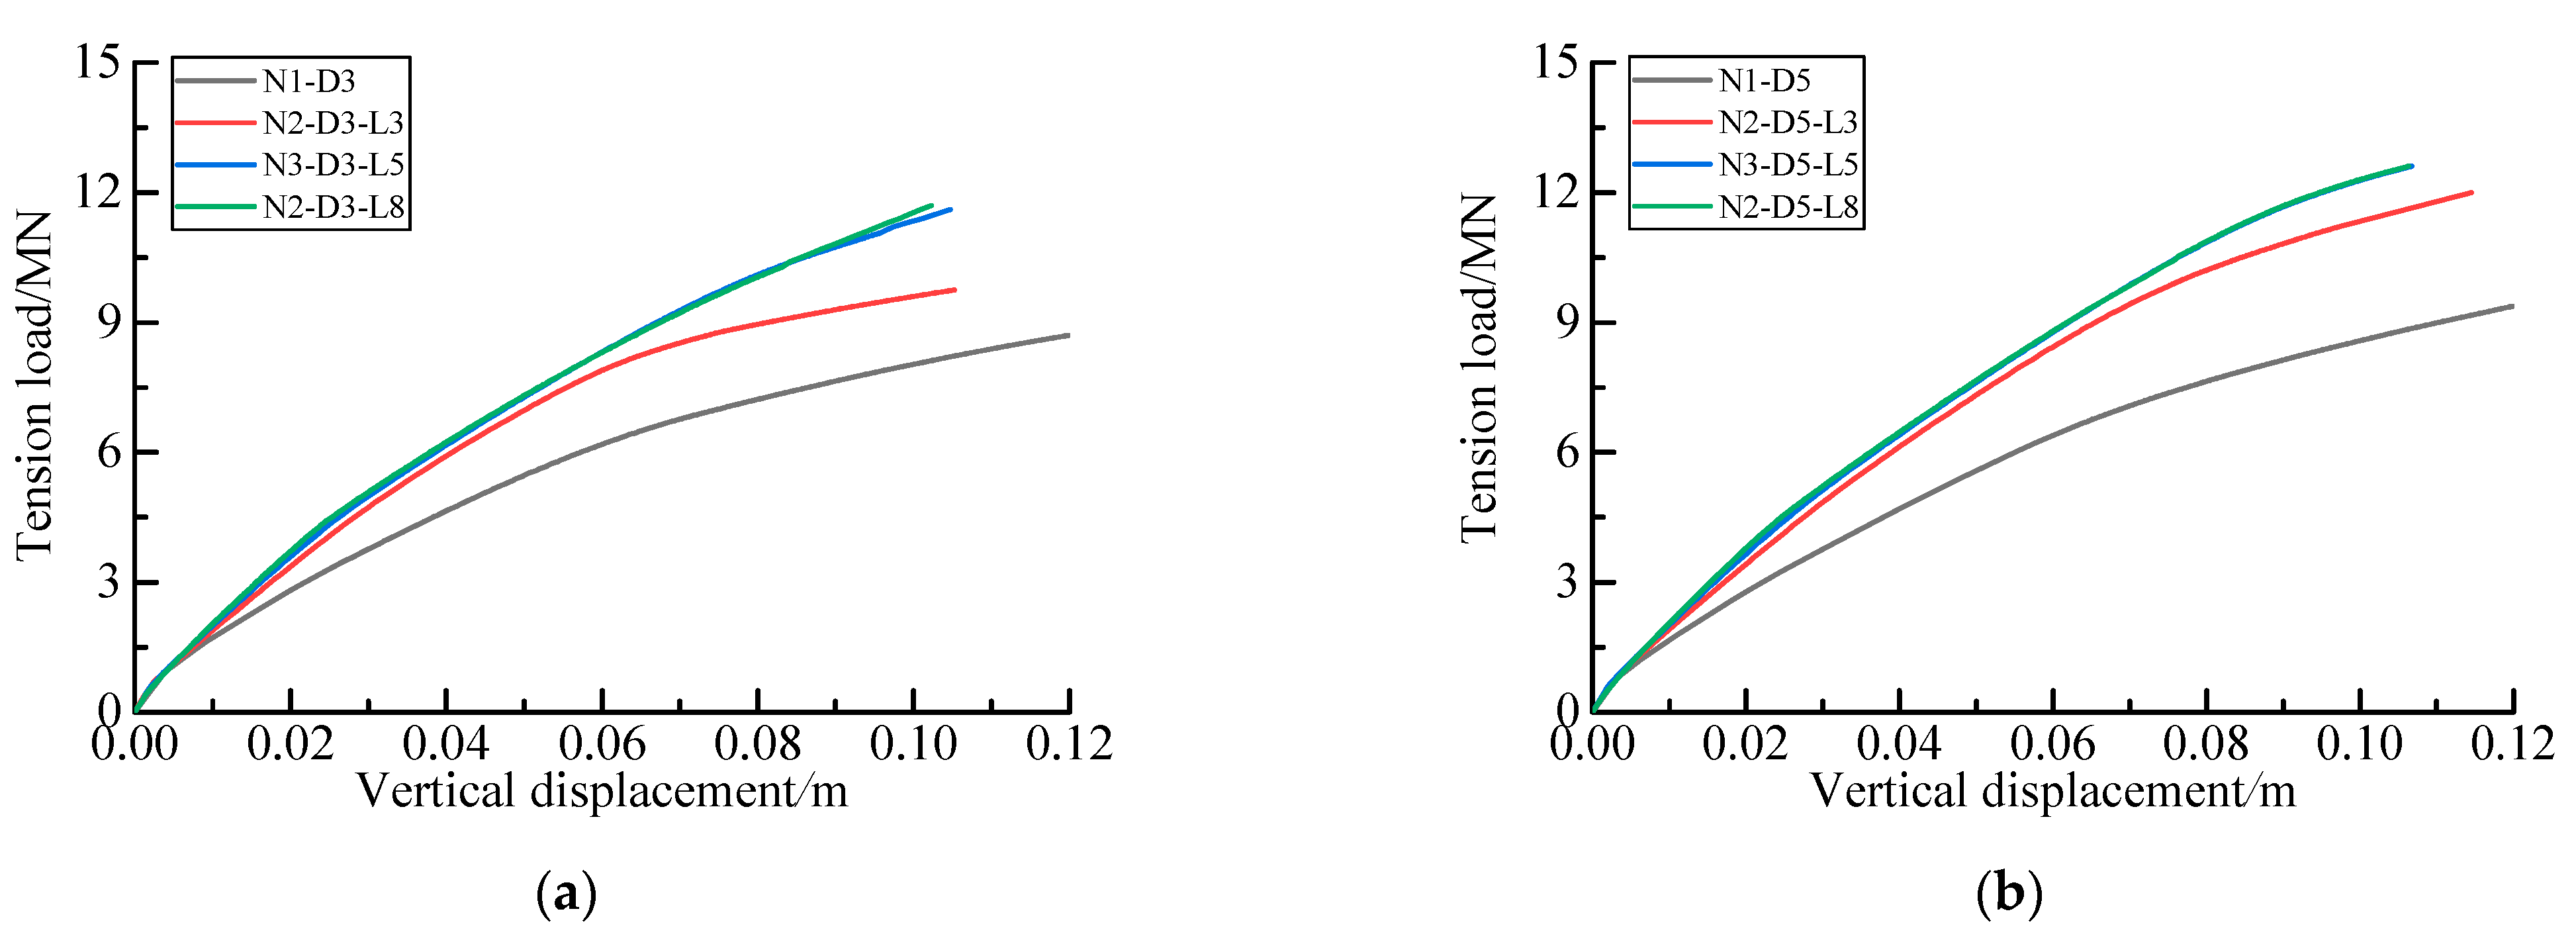
Figure 28.
Uplift load-displacement curves for various blade spacing l/D. (a) D/d = 1.5, n = 2; (b) D/d = 2.5, n = 2.
Figure 28.
Uplift load-displacement curves for various blade spacing l/D. (a) D/d = 1.5, n = 2; (b) D/d = 2.5, n = 2.
Figure 29.
Relationship between pullout efficiency coefficient and blade spacing.
Figure 29.
Relationship between pullout efficiency coefficient and blade spacing.
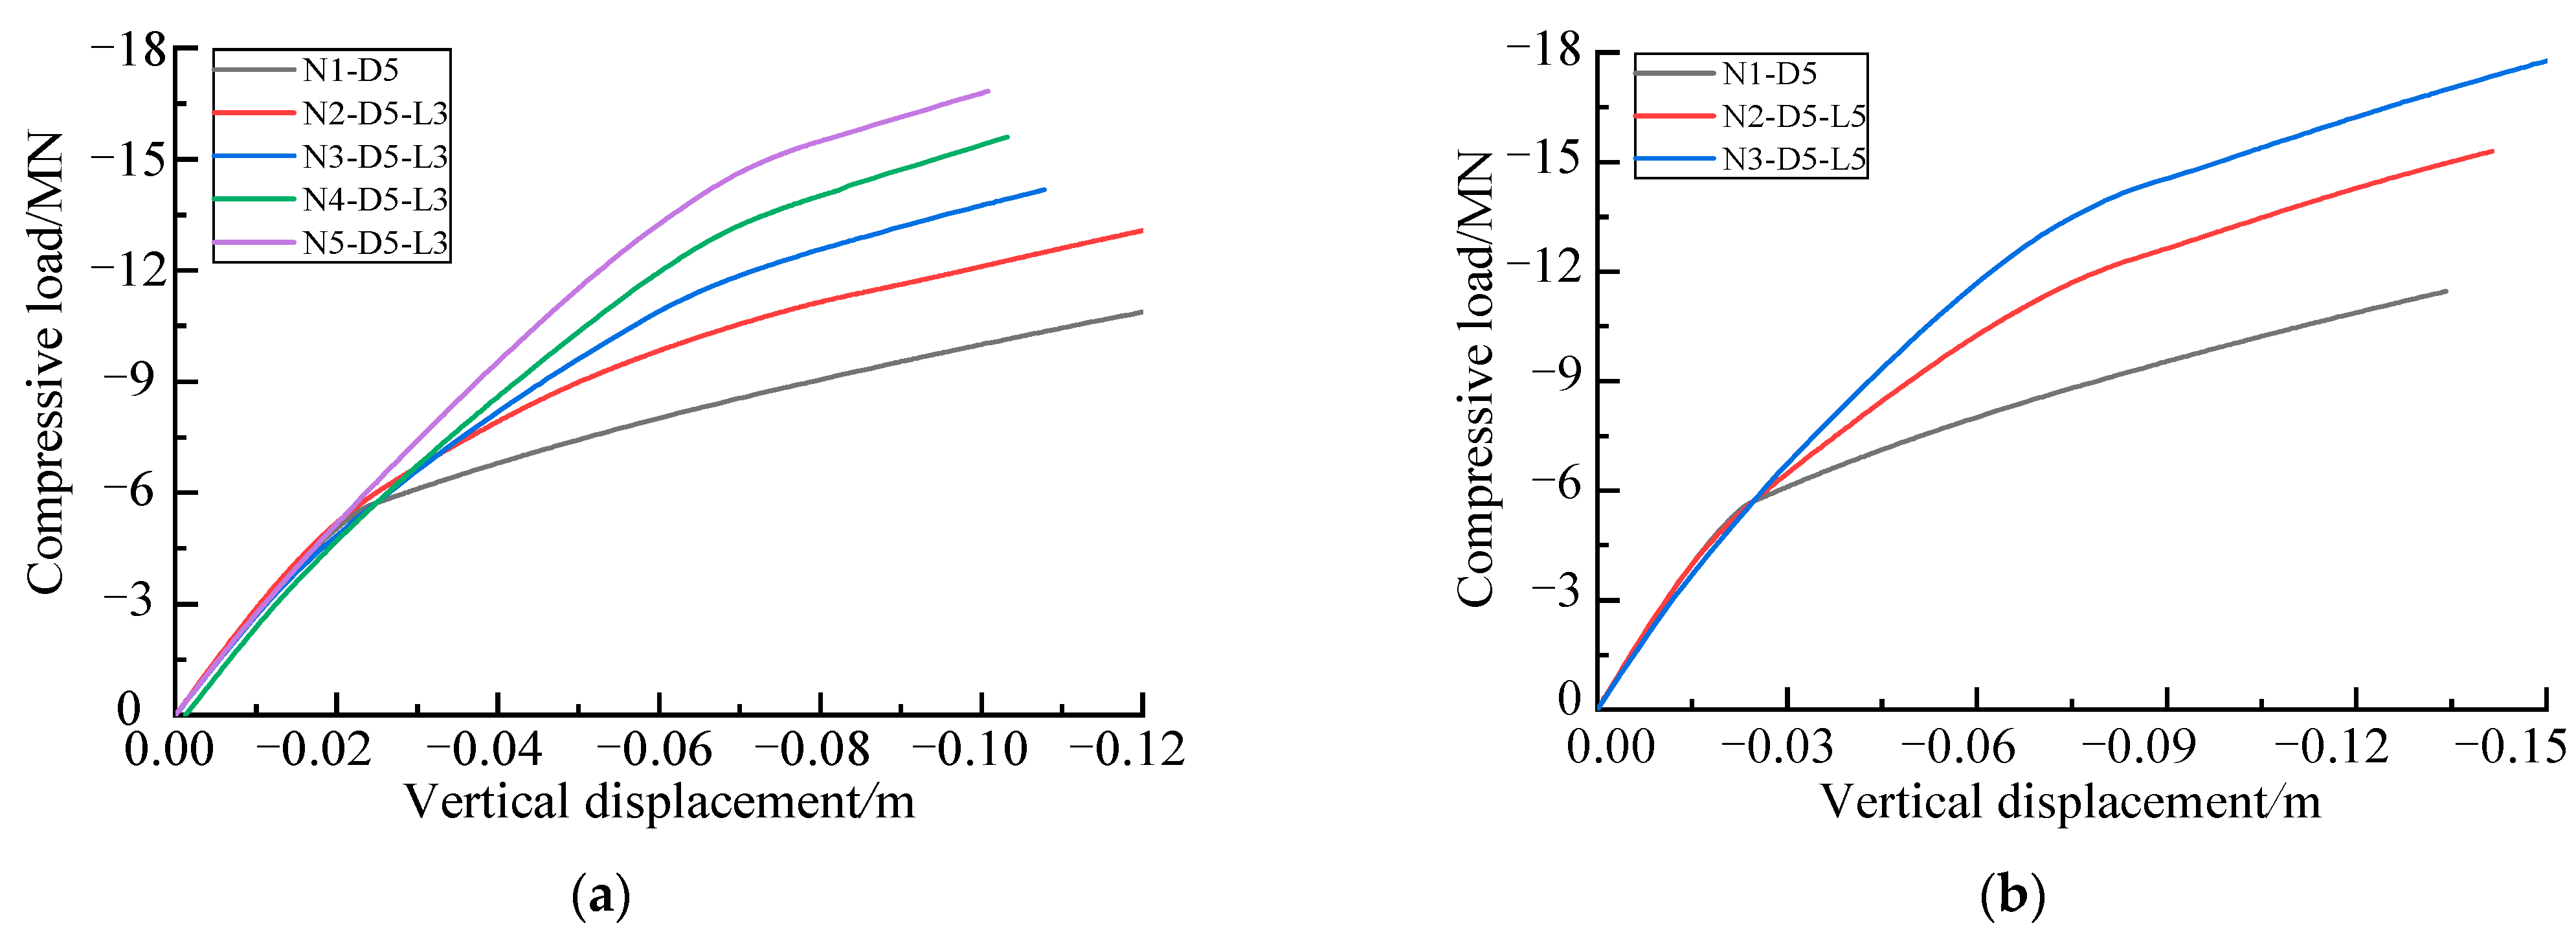
Figure 30.
Compressive load-displacement curves of multi-blade helical pile. (a) D/d = 2, l/D = 0.6, n = 1–5; (b) D/d = 2, l/D = 1, n = 1–3.
Figure 30.
Compressive load-displacement curves of multi-blade helical pile. (a) D/d = 2, l/D = 0.6, n = 1–5; (b) D/d = 2, l/D = 1, n = 1–3.
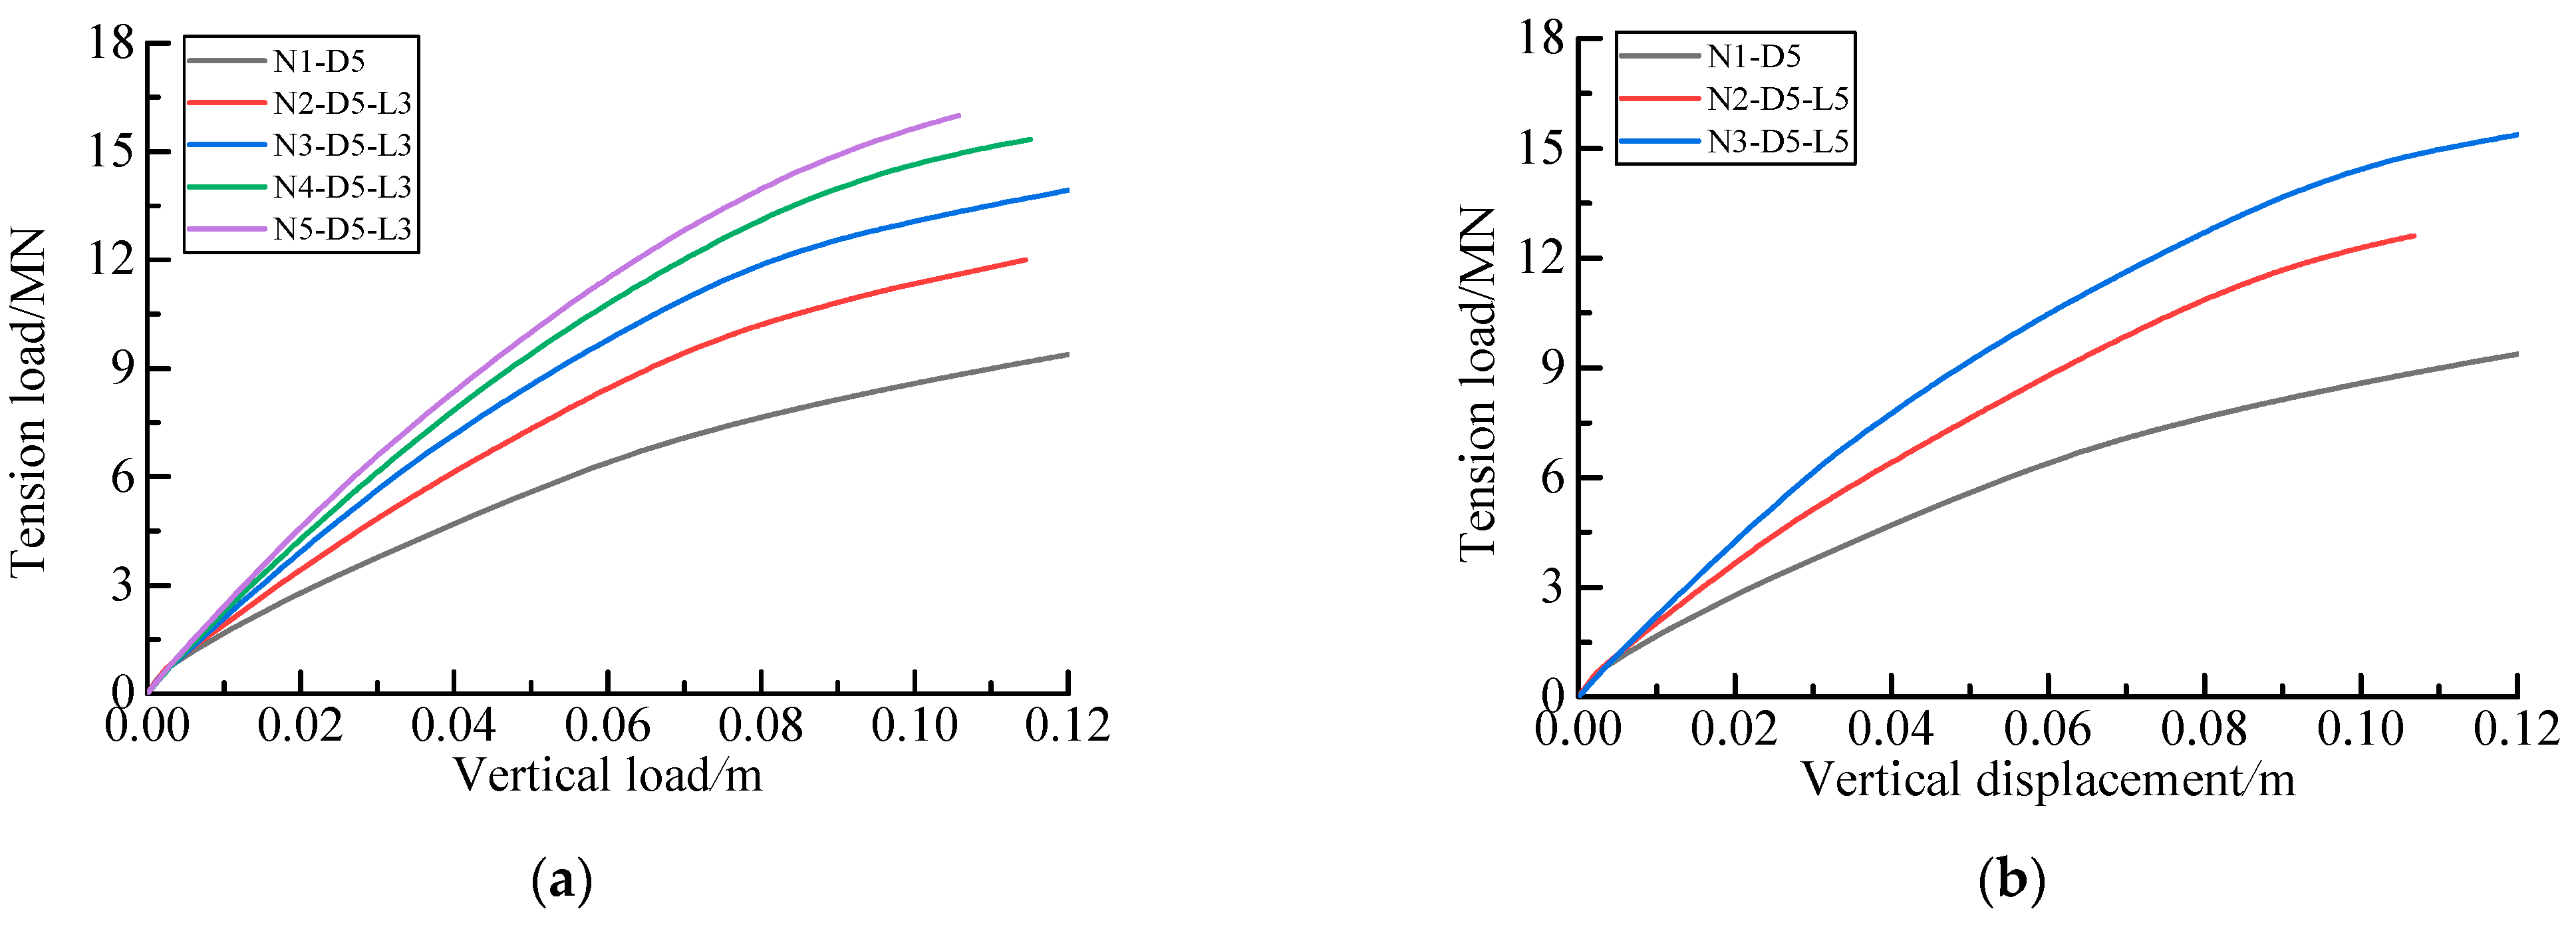
Figure 31.
Uplift load-displacement curves of multi-blade helical pile. (a) D/d = 2, l/D = 0.6, n = 1–5; (b) D/d = 2, l/D = 1, n = 1–3.
Figure 31.
Uplift load-displacement curves of multi-blade helical pile. (a) D/d = 2, l/D = 0.6, n = 1–5; (b) D/d = 2, l/D = 1, n = 1–3.
Table 1.
Geotechnical properties of tested soil.
Table 1.
Geotechnical properties of tested soil.
| Items | Properties |
|---|
| Saturated density (g/cm3) | 2.2 |
| Internal friction angle (°) | 34.4 |
| Cohesion (kPa) | 5 |
| Compression modulus (MPa) | 18 |
| Poisson’s ratio | 0.3 |
Table 2.
Dimensions of monopile and helical pile.
Table 2.
Dimensions of monopile and helical pile.
| Items | Helical Pile | Monopile |
|---|
| Diameter (m) | 2 | 2 |
| Number of blades | 1 | 0 |
| Pile length (m) | 25 | 25 |
| Blade diameter (m) | 5 | - |
| Pitch (m) | 1 | - |
| Distance between blade and pile bottom (m) | 1.5 | - |
Table 3.
Helical pile parameter for various pitch values.
Table 3.
Helical pile parameter for various pitch values.
| Items | P1 | P2 | P3 | P4 | P5 |
|---|
| Pile diameter (m) | 2 | 2 | 2 | 2 | 2 |
| Number of blades | 1 | 1 | 1 | 1 | 1 |
| Blade depth (m) | 25 | 25 | 25 | 25 | 25 |
| Blade diameter (m) | 5 | 5 | 5 | 5 | 5 |
| Pitch (m) | 1 | 2 | 3 | 4 | 5 |
| Distance between blade and pile bottom (m) | 1.5 | 1.5 | 1.5 | 1.5 | 1.5 |
Table 4.
Helical pile parameters for various spiral blade diameters.
Table 4.
Helical pile parameters for various spiral blade diameters.
| Items | D3 | D4 | D5 | D6 | D7 |
|---|
| Pile diameter (m) | 2 | 2 | 2 | 2 | 2 |
| Number of blades | 1 | 1 | 1 | 1 | 1 |
| Blade depth (m) | 25 | 25 | 25 | 25 | 25 |
| Blade diameter (m) | 3 | 4 | 5 | 6 | 7 |
| Pitch (m) | 2 | 2 | 2 | 2 | 2 |
| Distance between blade and pile bottom (m) | 1.5 | 1.5 | 1.5 | 1.5 | 1.5 |
Table 5.
Multi-blade finite element model.
Table 5.
Multi-blade finite element model.
| Condition | Number of Blades | Diameter (m) | Blade Spacing (m) |
|---|
| N1-D3 | 1 | 3 | 0 |
| N1-D4 | 1 | 4 | 0 |
| N1-D5 | 1 | 5 | 0 |
| N2-D3-L3 | 2 | 3 | 3 |
| N2-D3-L5 | 2 | 3 | 5 |
| N2-D3-L8 | 2 | 3 | 8 |
| N2-D4-L3 | 2 | 4 | 3 |
| N2-D4-L5 | 2 | 4 | 5 |
| N2-D4-L8 | 2 | 4 | 8 |
| N2-D4-L12 | 2 | 4 | 12 |
| N2-D5-L3 | 2 | 5 | 3 |
| N2-D5-L5 | 2 | 5 | 5 |
| N2-D5-L8 | 2 | 5 | 8 |
| N3-D5-L3 | 3 | 5 | 3 |
| N3-D5-L5 | 3 | 5 | 5 |
| N4-D5-L3 | 4 | 5 | 3 |
| N5-D5-L3 | 5 | 5 | 3 |
Table 6.
Compression efficiency coefficient (D/d = 2, n = 2).
Table 6.
Compression efficiency coefficient (D/d = 2, n = 2).
| Conditions | Compressive Bearing Capacity (MN) | Compression Efficiency Coefficient |
|---|
| N1-D4 | 9.2997 | — |
| N2-D4-L3 | 11.6647 | 0.6272 |
| N2-D4-L5 | 12.4115 | 0.6673 |
| N2-D4-L8 | 13.1939 | 0.7094 |
| N2-D4-L12 | 13.0872 | 0.7036 |
Table 7.
Compression efficiency coefficient with various blade spacing l/D.
Table 7.
Compression efficiency coefficient with various blade spacing l/D.
| Condition | Compressive Bearing Capacity (MN) | Compression Efficiency Coefficient | l/D |
|---|
| N1-D3 | 8.6113 | — | — |
| N2-D3-L3 | 10.5038 | 0.6099 | 1.00 |
| N2-D3-L5 | 12.0406 | 0.6991 | 1.67 |
| N2-D3-L8 | 12.6503 | 0.7345 | 2.67 |
| N1-D5 | 9.8307 | — | — |
| N2-D5-L3 | 12.1016 | 0.6155 | 0.60 |
| N2-D5-L5 | 13.1990 | 0.6713 | 1.00 |
| N2-D5-L8 | 13.9001 | 0.7070 | 1.60 |
Table 8.
Uplift efficiency coefficient (D/d = 2, n = 2).
Table 8.
Uplift efficiency coefficient (D/d = 2, n = 2).
| Condition | Uplift Bearing Capacity (MN) | Uplift Efficiency Coefficient |
|---|
| N1-D4 | 8.2430 | — |
| N2-D4-L3 | 10.6562 | 0.5729 |
| N2-D4-L5 | 11.6215 | 0.6248 |
| N2-D4-L8 | 11.7104 | 0.6296 |
| N2-D4-L12 | 11.8247 | 0.6358 |
Table 9.
Uplift efficiency coefficient for various blade spacing l/D.
Table 9.
Uplift efficiency coefficient for various blade spacing l/D.
| Condition | Uplift Bearing Capacity (MN) | Uplift Efficiency Coefficient | l/D |
|---|
| N1-D3 | 8.0271 | — | — |
| N2-D3-L3 | 9.5893 | 0.5568 | 1.00 |
| N2-D3-L5 | 11.3548 | 0.6593 | 1.67 |
| N2-D3-L8 | 11.5326 | 0.6696 | 2.67 |
| N1-D5 | 8.5732 | — | — |
| N2-D5-L3 | 11.3421 | 0.5769 | 0.60 |
| N2-D5-L5 | 12.2693 | 0.6240 | 1.00 |
| N2-D5-L8 | 12.3201 | 0.6266 | 1.60 |
Table 10.
Compression efficiency coefficient of multi-blade helical pile.
Table 10.
Compression efficiency coefficient of multi-blade helical pile.
| Conditions | Compressive Bearing Capacity (MN) | Compression Efficiency Coefficient |
|---|
| N1-D5 | 9.8307 | — |
| N2-D5-L3 | 12.1016 | 0.6155 |
| N3-D5-L3 | 13.7629 | 0.4667 |
| N4-D5-L3 | 15.3937 | 0.3915 |
| N5-D5-L3 | 16.7807 | 0.3414 |
| N2-D5-L5 | 13.1990 | 0.6713 |
| N3-D5-L5 | 15.1041 | 0.5121 |
Table 11.
Uplift efficiency coefficient of multi-blade helical pile.
Table 11.
Uplift efficiency coefficient of multi-blade helical pile.
| Condition | Uplift Bearing Capacity (MN) | Uplift Efficiency Coefficient |
|---|
| N1-D5 | 8.5732 | — |
| N2-D5-L3 | 11.3421 | 0.6615 |
| N3-D5-L3 | 13.0618 | 0.5079 |
| N4-D5-L3 | 14.6317 | 0.4267 |
| N5-D5-L3 | 15.6681 | 0.3655 |
| N2-D5-L5 | 12.2693 | 0.7156 |
| N3-D5-L5 | 14.4335 | 0.5612 |


 ,
, 


